Embed Size (px)
Citation preview

QUKA CONSULTING ECONOMIC REVIEW
“IDEAS, INSIGHT & INNOVATION”
2015 MID-YEAR ANALYSIS: H1
VOLUME 1: 1
Quka Consulting: Ideas, Insight & Innovation © 2015

CONTENTS
Global Economy
Local Economy
Forecast
Quka Consulting: Ideas, Insight & Innovation © 2015
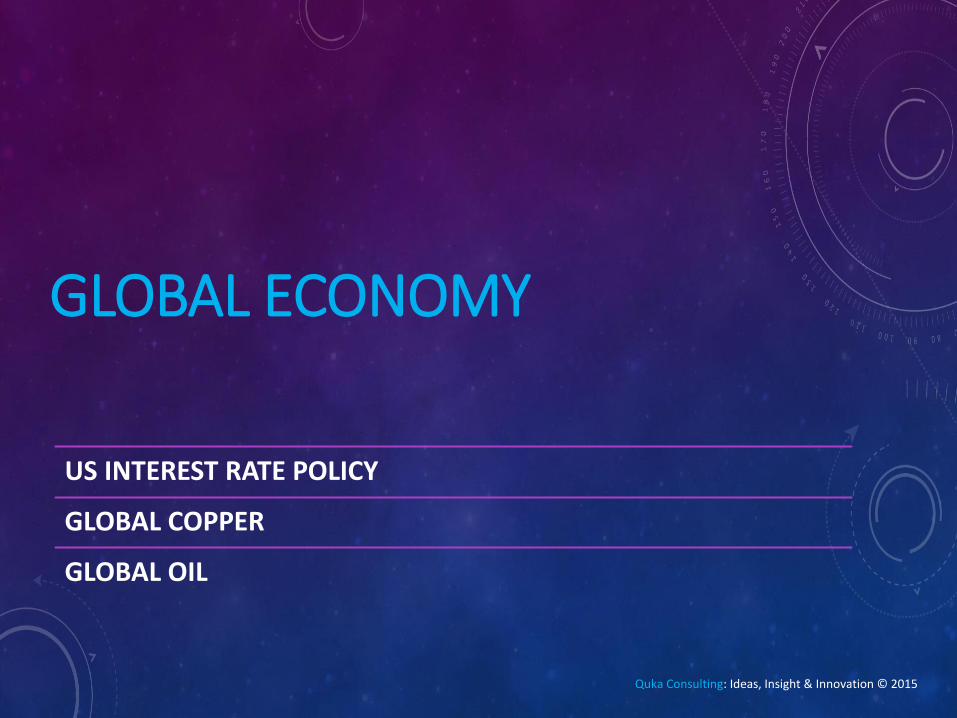
GLOBAL ECONOMY
US INTEREST RATE POLICY
GLOBAL COPPER
GLOBAL OIL
Quka Consulting: Ideas, Insight & Innovation © 2015

US INTEREST RATE HIKE: GLOBAL EFFECT
The last Fed hike was in 2004.Federal Reserve Chief Janet Yellen said in Mid July 2015 she expects to raise interest rates in 2015 after seven years of unprecedented easy money helped the economy shake the financial crisis and recession. Consensus currently estimates that this will happen in September
US Treasuries which are a safe haven for investors will become more attractive increasing US treasury demand. This will cause a stronger dollar
Most commodities are quoted in Dollars. They include, Gold, copper, Oil among many others. A rate hike will make the dollar stronger which will make these commodities more expensive on the global market which will dampen their demand.
Source: US Federal Reserve Bank
Quka Consulting: Ideas, Insight & Innovation © 2015

Brazil, Turkey and South Africa will likely have a tough time in the second half of 2015 because money will flow toward the U.S. This applies to other emerging markets; Zambia falls in this
bracket as well.
The hike in US Fed rate will make the dollar strong; hence the Kwacha will depreciate against the dollar.
Copper, which accounts for over 70% of Zambia’s forex earning will be hit by a stronger dollar which will make copper expensive and dampen global demand. This will hit Zambia’s trade
deficit hard at least in the short term.
The double whammy here also includes the effect of a weaker Kwacha in Zambia’s oil import bill, which directly affects Zambia’s inflation rate.
If September is indeed the month in which the US fed raises rates then Zambia and other emerging markets need to brace themselves for a tough time.
US INTEREST RATE HIKE: ZAMBIA EFFECT
Quka Consulting: Ideas, Insight & Innovation © 2015
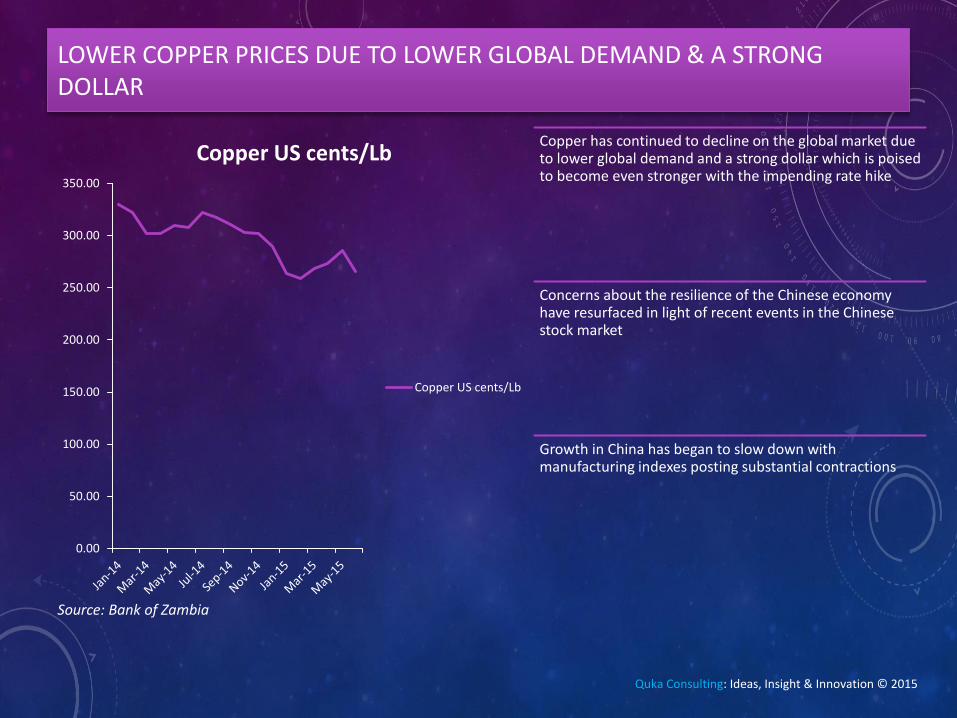
LOWER COPPER PRICES DUE TO LOWER GLOBAL DEMAND & A STRONG DOLLAR
Copper has continued to decline on the global market due to lower global demand and a strong dollar which is poised to become even stronger with the impending rate hike
Concerns about the resilience of the Chinese economy have resurfaced in light of recent events in the Chinese stock market
Growth in China has began to slow down with manufacturing indexes posting substantial contractions
0.00
50.00
100.00
150.00
200.00
250.00
300.00
350.00
Copper US cents/Lb
Copper US cents/Lb
Source: Bank of Zambia
Quka Consulting: Ideas, Insight & Innovation © 2015
CONCERNS OF DEMAND FROM CHINA, US SHALE OIL AND OPEC SUPPLY POLICY WILL KEEP OIL PRICES LOW IN SHORT TERM
0.00
20.00
40.00
60.00
80.00
100.00
120.00
Jan
-14
Feb
-14
Mar
-14
Ap
r-1
4
May
-14
Jun
-14
Jul-
14
Au
g-1
4
Sep
-14
Oct
-14
No
v-1
4
De
c-1
4
Jan
-15
Feb
-15
Mar
-15
Ap
r-1
5
May
-15
Jun
-15
Oil US$/barrel
Oil US$/barrel
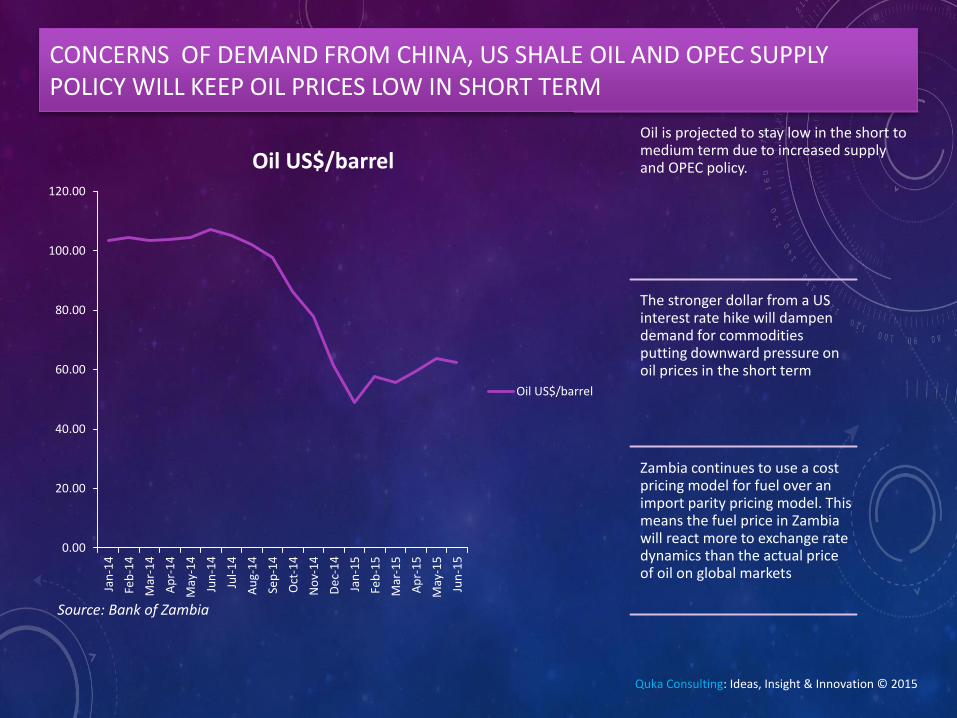
Oil is projected to stay low in the short to medium term due to increased supply and OPEC policy.
The stronger dollar from a US interest rate hike will dampen demand for commodities putting downward pressure on oil prices in the short term
Zambia continues to use a cost pricing model for fuel over an import parity pricing model. This means the fuel price in Zambia will react more to exchange rate dynamics than the actual price of oil on global markets
Source: Bank of Zambia
Quka Consulting: Ideas, Insight & Innovation © 2015
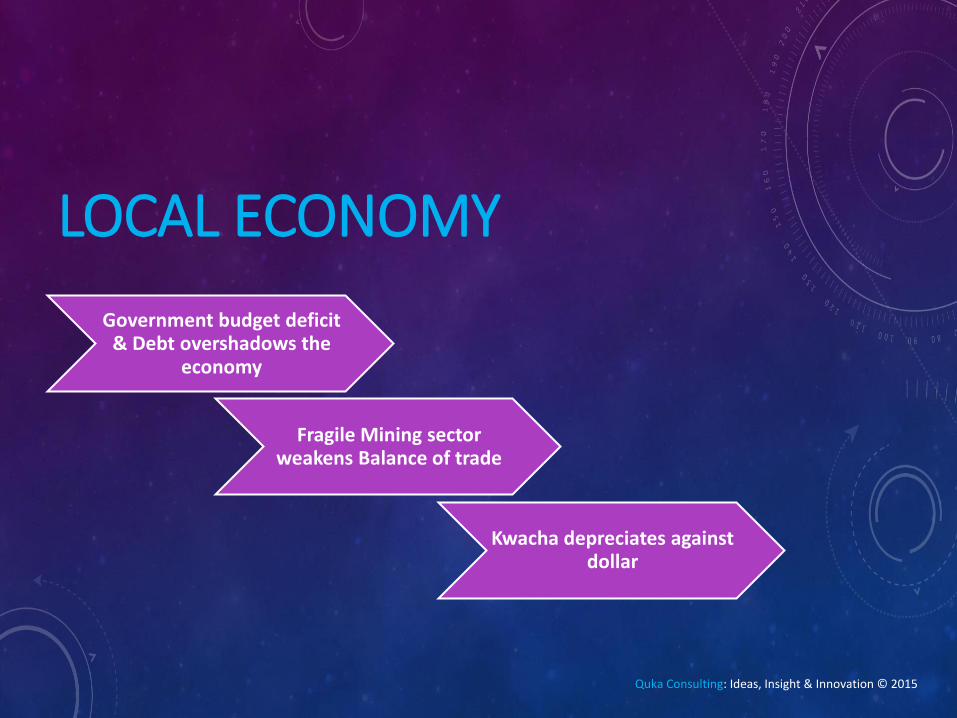
LOCAL ECONOMY
Government budget deficit & Debt overshadows the
economy
Fragile Mining sector weakens Balance of trade
Kwacha depreciates against dollar
Quka Consulting: Ideas, Insight & Innovation © 2015

6.2
6.4
6.6
6.8
7.0
7.2
7.4
7.6
7.8
8.0
8.2
%
Inflation rate
The Consumer Price Index (CPI) measures changes over time in the general level of prices of goods and services that households acquire for the purpose of consumption
The Inflation rate has been dropping over the first half of the year with substantial drops in the first quarter due to lower food prices and fuel prices
The inflation rate rose in the second quarter. This increase is mainly attributed to increases in Non-food items particularly Liquid Fuels (Diesel, Kerosene and Petrol) and House rentals.
INFLATION ON COURSE TO BE AROUND GOVERNMENT’S YEAR END TARGET OF 7%
Source: Bank of Zambia
Quka Consulting: Ideas, Insight & Innovation © 2015

The Kwacha has depreciated against its major convertibles with a very noticeable depreciation against the US Dollar
Availability of the US Dollar in Zambia has been declining
The depreciation is largely due to lower foreign exchange earnings while the dollar strengthened against major convertibles
Bank of Zambia has reiterated its position to not use too much of its reserves to halt the kwacha fall.
Commercial banks have already expressed their concerns over the increase in statutory reserves indicating its negative impact on operations.
KWACHA DEPRECIATED IN H1 DUE TO LOWER FOREIGN EXCHANGE EARNINGS WHILE DOLLAR STRENGTHENS AGAINST MAJOR CONVERTIBLES
0.00
1.00
2.00
3.00
4.00
5.00
6.00
7.00
8.00
9.00
Jan
-13
Ap
r-1
3
Jul-
13
Oct
-13
Jan
-14
Ap
r-1
4
Jul-
14
Oct
-14
Jan
-15
Ap
r-1
5
Jul-
15
USD/Kwacha Rate
USD/Kwacha Rate
Source: Bank of Zambia Quka Consulting: Ideas, Insight & Innovation © 2015

Trade Deficit is a situation where a country is importing more than it is exporting in value terms.
Zambia faced a widening trade deficit in the first half of 2015 recording consecutive trade deficits from January to May.
While there has been an increase in Non Traditional Exports in the first half of 2015, the decrease in the total value of Metal exports kept total exports flat.
The balance of trade was unfavorable due to increased imports and reduced exports
The trade deficit was driven by increased imports of consumer and capital goods
ZAMBIA RECORDED A TRADE DEFICIT IN H1
-1500 -1000 -500 0
Jan-15
Feb-15
Mar-15
Apr-15
May-15
ZMW Millions
TradeBalance
Source: CSO
Quka Consulting: Ideas, Insight & Innovation © 2015
2,750.00
2,800.00
2,850.00
2,900.00
2,950.00
3,000.00
3,050.00
3,100.00
ZMW
Mill
ion
Metal Exports
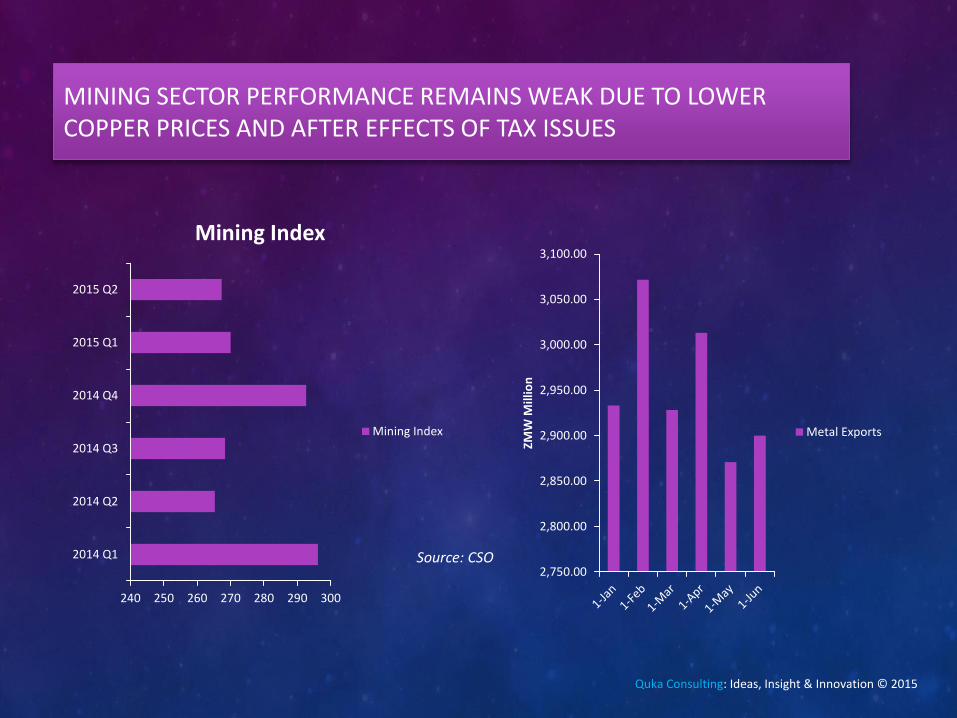
MINING SECTOR PERFORMANCE REMAINS WEAK DUE TO LOWER COPPER PRICES AND AFTER EFFECTS OF TAX ISSUES
240 250 260 270 280 290 300
2014 Q1
2014 Q2
2014 Q3
2014 Q4
2015 Q1
2015 Q2
Mining Index
Mining Index
Source: CSO
Quka Consulting: Ideas, Insight & Innovation © 2015
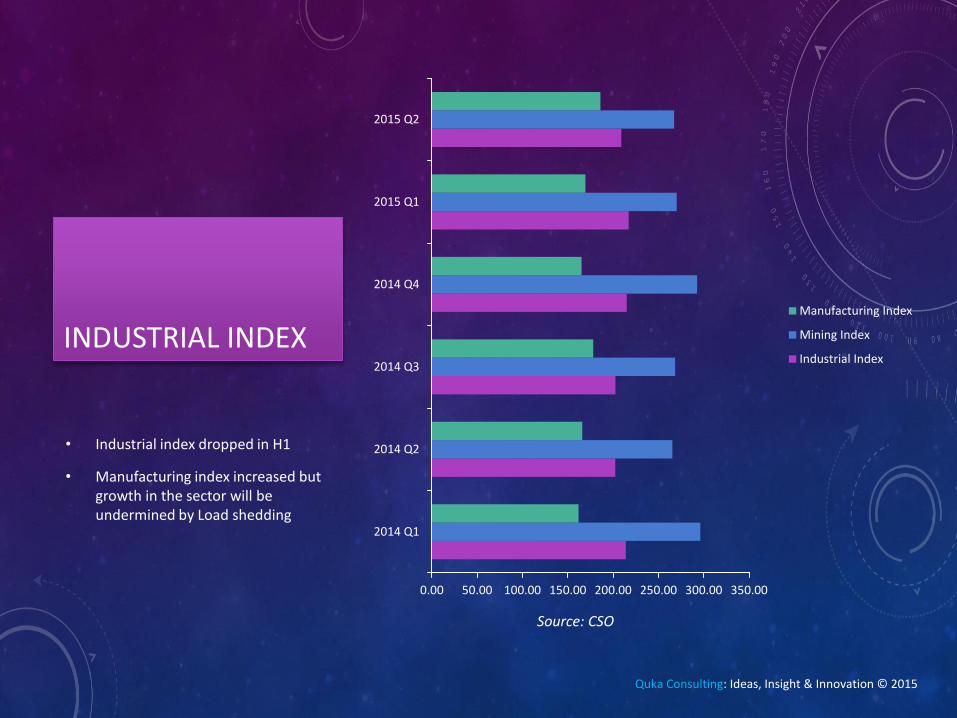
INDUSTRIAL INDEX
• Industrial index dropped in H1
• Manufacturing index increased but growth in the sector will be undermined by Load shedding
0.00 50.00 100.00 150.00 200.00 250.00 300.00 350.00
2014 Q1
2014 Q2
2014 Q3
2014 Q4
2015 Q1
2015 Q2
Manufacturing Index
Mining Index
Industrial Index
Source: CSO
Quka Consulting: Ideas, Insight & Innovation © 2015
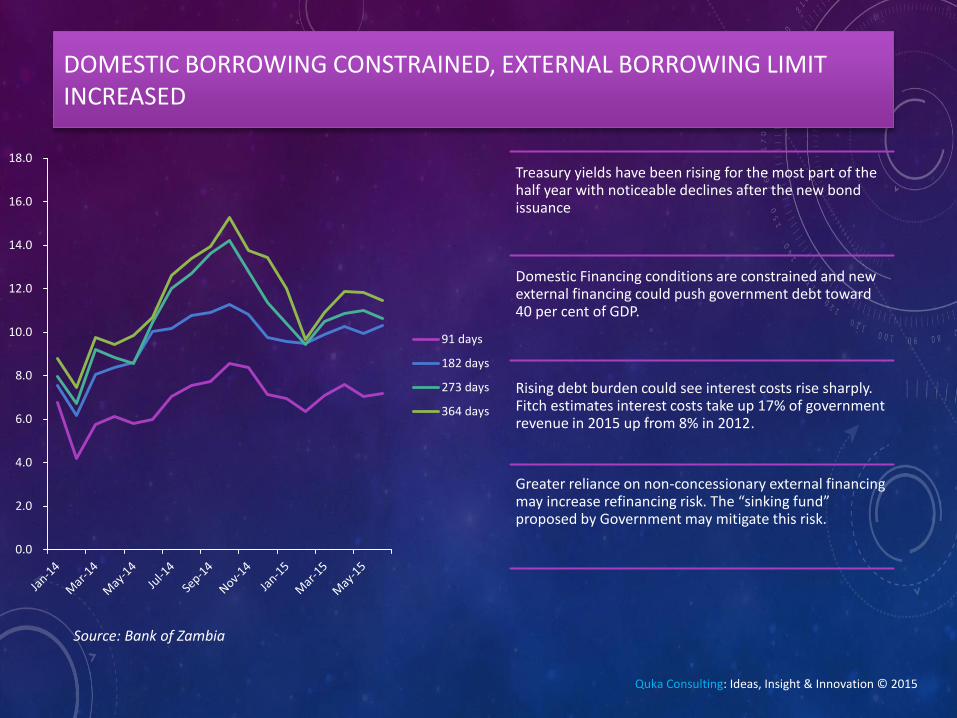
DOMESTIC BORROWING CONSTRAINED, EXTERNAL BORROWING LIMIT INCREASED
Treasury yields have been rising for the most part of the half year with noticeable declines after the new bond issuance
Domestic Financing conditions are constrained and new external financing could push government debt toward 40 per cent of GDP.
Rising debt burden could see interest costs rise sharply. Fitch estimates interest costs take up 17% of government revenue in 2015 up from 8% in 2012.
Greater reliance on non-concessionary external financing may increase refinancing risk. The “sinking fund” proposed by Government may mitigate this risk.
0.0
2.0
4.0
6.0
8.0
10.0
12.0
14.0
16.0
18.0
91 days
182 days
273 days
364 days
Source: Bank of Zambia
Quka Consulting: Ideas, Insight & Innovation © 2015

MINING & AGRICULTURE REMAINED STEADY WHILE CREDIT TO OTHER SECTORS DROPPED
0
100000
200000
300000
400000
500000
600000
700000
800000
900000
1000000
Real estate
Community, social and perconal services
Financial services
Transport, storage and communications
Wholesale and retail trade
Construction
Electricity, gas, water and energy
Manufacturing
Mining and quarying
Agriculture, forestry,Fishing and hunting
Source: Bank of Zambia
Credit to Wholesale sector increased
Credit to Real estate sector increased
Credit to most sectors dropped in the first quarter but picked up in the second quarter
Quka Consulting: Ideas, Insight & Innovation © 2015

0
2
4
6
8
10
12
2013 2014 2015
Budget Deficit (% GDP)
Budget deficit
The current account deficit widened on account of a trade deficit in H1 as well as a widening of the services and primary income deficits
According to preliminary data expenses incurred with regard to unplanned expenditures have stretched the budget deficit and have put the Government under serious strain.
The fiscal issues are further compounded with subsidies on maize, pension and road construction as highlighted by the IMF in their recent consultation report.
We project the fiscal deficit could jump to 10.5%
Budget deficit widened in H1 2015 due to lower revenues and increased
expenditure
Source: Ministry of Finance
Quka Consulting: Ideas, Insight & Innovation © 2015

Government issues $1.25bn Eurobond at 9.3% on international markets
0
5
10
15
20
25
30
35
40
2010 2011 2012 2013 2014 2015
Debt/GDP ratio % Zambia has issued a $1.25 billion Eurobond meant for infrastructure development
The Eurobond, with a coupon rate of 8.97 percent, has an eleven year average life repayments in 2025, 2026 and 2027
The funds will be used in infrastructure related projects in the area of road, energy, education, health, water and transport sectors
Despite a challenging capital markets environment arising from global economic uncertainties, Zambia’s bond issue was met with high demand from international investors
Zambia’s first Eurobond worth US$750 million was issued in 2012, while the second one worth US$1 billion was issued in 2014.
Source: Ministry of Finance
Quka Consulting: Ideas, Insight & Innovation © 2015

LUSAKA STOCK EXCHANGE: TRADES AND VOLUMES DOWN
The Market capitalization closed at K64.72 billion, up by 3.88% compared to the close of the 2nd quarter of last
Volume of shares traded in the 2nd quarter of 2015 decreased by 52.62% compared to the same period in 2014. Volumes traded in all 3 months of the 2nd quarter were less than those of the 2nd quarter of 2014.
The LASI dropped steadily over April, May and June in the 2nd Quarter of 2015, opposite to its movement in the same period in 2014.
The market turnover decreased by 8.05% compared to the same period in 2014
The number of trades on the bond market increased by 100% in the 2nd quarter of 2015 compared to the same period in 2014.
59
60
61
62
63
64
65
2014 2015
Bill
ion
s
Market Capitalisation Second Quarter
Source: Lusaka Stock Exchange
Quka Consulting: Ideas, Insight & Innovation © 2015
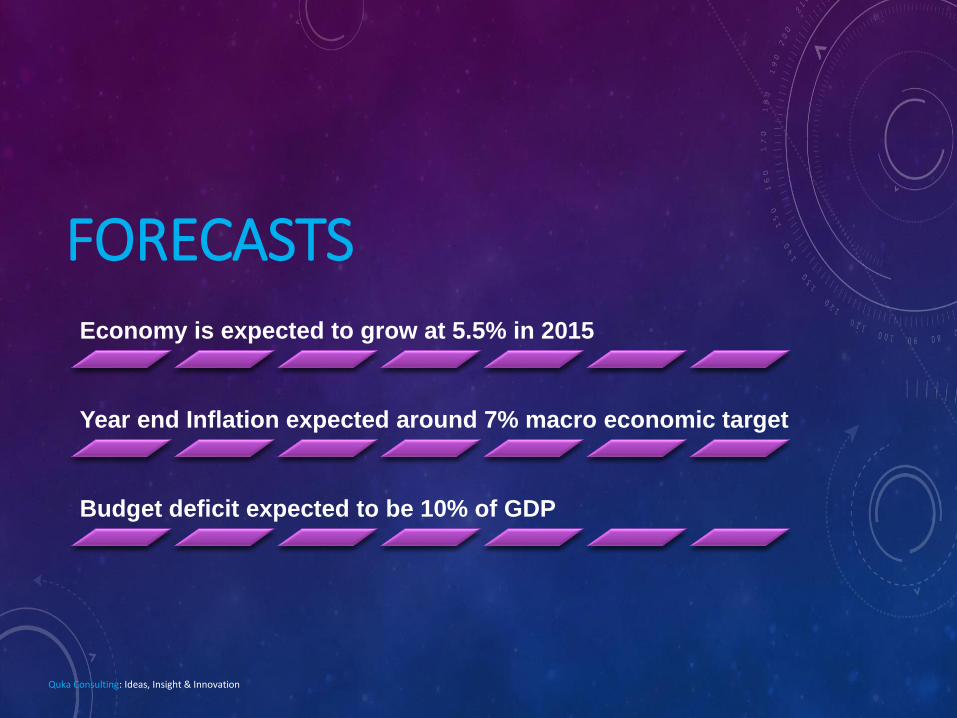
FORECASTS Economy is expected to grow at 5.5% in 2015
Year end Inflation expected around 7% macro economic target
Budget deficit expected to be 10% of GDP
Quka Consulting: Ideas, Insight & Innovation

GDP & OUTPUT GAP
ESTIMATION
Quka Consulting: Ideas, Insight & Innovation © 2015

$0
$5,000,000,000
$10,000,000,000
$15,000,000,000
$20,000,000,000
$25,000,000,000
$30,000,000,000
19
60
19
62
19
64
19
66
19
68
19
70
19
72
19
74
19
76
19
78
19
80
19
82
19
84
19
86
19
88
19
90
19
92
19
94
19
96
19
98
20
00
20
02
20
04
20
06
20
08
20
10
20
12
20
14
GDP (current US$)
GDP (current US$)
GROSS DOMESTIC PRODUCT HAS BEEN GROWING AT A FAST RATE SINCE 2004 DUE TO MINING, AGRICULTURE, WHOLESALE & RETAIL TRADE INCLUDING OTHER SECTORS
Quka Consulting: Ideas, Insight & Innovation © 2015

PHILLIPS CURVE INFLATION/OUTPUT GAP 2005-2015
The output gap, defined as the difference between the actual and potential output, relates to the state of the economy in its business cycle
y = 2,922,967.30x-0.54 R² = 0.43
0
2
4
6
8
10
12
14
16
18
0 10 20 30
Pri
ce L
eve
l
Quantity: Aggregate Demand
Billions
Inflation Output Gap
Inflation Output Gap
Power (Inflation Output Gap)
Quka Consulting: Ideas, Insight & Innovation © 2015

GDP RESIDUALS
-6
-4
-2
0
2
4
6
8
0 5E+09 1E+10 1.5E+10 2E+10 2.5E+10 3E+10
Re
sid
ual
s
Gross Domestic Product
Series1
Linear(Series1)
Quka Consulting: Ideas, Insight & Innovation © 2015
GDP Residuals measure the output gap as shown above. The output gap is the difference between actual GDP and potential GDP.
Zambia has been growing below potential output since 2014. This means the economy is in a state of contraction. In business cycle terms this can be explained as a dip.

QUADRATIC OUTPUT GAP
-25
-20
-15
-10
-5
0
5
10
15
2005 2006 2007 2008 2009 2010 2011 2012 2013 2014
Quadratic Output Gap
Quka Consulting: Ideas, Insight & Innovation © 2015
The quadratic output gap above shows that monetary policy has been effective in controlling inflation by preventing the economy from heating up too much.

GDP GROWTH OF 2.73% IN H1
The Zambian economy is estimated to have grown by 2.73% in the first half of 2015
This is driven by growth in Construction, Real estate, Transport, Wholesale and retail trade, Agriculture, Financial services among others.
The mining sector is rebounding from a recession and we hope to see some growth in the third quarter.
Zesco load shedding is expected to put contractionary pressures on year end GDP
Potential GDP growth for H1 is estimate at 3.09% which means the Zambian economic growth is below its potential
This indicates the effectiveness of monetary policy by the Bank of Zambia in containing inflation
Quka Consulting: Ideas, Insight & Innovation © 2015
FORECASTS
We forecast Zambia will grow at a rate of 5.5% in 2015 on the backdrop of growth in Financial services, Agriculture, real estate, construction, transport including wholesale and retail trade
We estimate Zesco load shedding could take as much as 0.3% of GDP growth this year pulling growth from 5.8% to 5.5%
Inflation should close around the Government year end target of 7%.However depreciation of the kwacha which has the propensity to import inflation coupled with higher fuel costs will create upward inflationary pressures. It is unlikely that such pressure will preempt an interest rate hike ahead pf the central banks monetary policy committee meeting in august
We forecast Zambia will post a net trade deficit this year owning to its unfavorable balance of trade. Pressures on the depreciating Kwacha are poised to continue in the short to medium term
We anticipate further depreciation of the Kwacha with $1=K8 our upper limit estimate and $1=K7.5 our lower limit estimate for 2015.
The budget deficit is estimated to be 10% of GDP for 2015
We anticipate a stronger second half of the year than the first backed by seasonal aggregate demand in household consumption
Quka Consulting: Ideas, Insight & Innovation © 2015

ESTIMATION DISCLAIMER
While we respect the completeness of the data used in our Phillips curve regressed estimation of GDP we recognize it is
not devoid of inaccuracy
We can include monetary policy (interest rates) as well as the real exchange rate in our model but this will come at a
price of a lower adjusted mean square
A stronger model will include monetary policy and the real economy by using the unemployment rate and capacity utilization for a dynamic
stochastic equilibrium model
Quka Consulting: Ideas, Insight & Innovation © 2015

Quka Consulting: Ideas, Insight & Innovation
Who are we? Quka Consulting is a consultancy which leverages on three core pillars of Ideas, Insight and Innovation to solve our client’s problems. Our team is well prepared to work with our clients in creating solutions that address the many challenges that arise in a dynamic economy. What we do? Quka Consulting provides professional services ranging but not limited to the following: Market Intelligence Corporate Advisory Business Solutions How can we help you? Quka Consulting is based on three core pillars namely: Ideas – We work with our clients to execute solutions based on original thought & creative thought leadership Insight – We provide research & cutting edge analysis around our client’s needs and the dynamic market environment Innovation – We tailor bespoke solutions for our clients problems Contact Us Twitter: @QukaConsulting Facebook: Quka Consulting Website: www.qukaconsulting.com Email: [email protected] Phone: +260973833383

Contact Us
Quka Consulting is a Registered Partnership with the Patents and Company registration agency in
Lusaka, Zambia (2015). It is the sole custodian of the business name “Quka Consulting” and no one can
use this name in any official capacity without the written authority or consent of “Quka Consulting” and its
“partners”.
Jacqueline Musiitwa – Lead Advisor & Partner
Kampamba Shula – Economist & Partner
P.O. Box 50722, Ridgeway
Lusaka, Zambia
Tel: +260973833383
www.qukaconsulting.com
Quka Consulting: Ideas, Insight & Innovation