Embed Size (px)
Citation preview
GREATER CHARLOTTE IN THE GLOBAL ECONOMY
BENCHMARKING THE REGION’S GLOBAL COMPETITIVENESS ASSETS
1
Brookings Metropolitan Policy ProgramMarch 23, 2016

Major forces necessitate global economic engagement
2
Intensifying Globalization
The cross-border flow of goods, capital and services has exploded in recent decades…
1980 2012
$26 trillion
$3 trillion
36% of global GDP
Significant Global Demand
…and foreign markets continue to drive global economic growth
86%of global economic growth will occur outside the United States from 2015 to 2020
Sources: James Manyika and others, “Global Flows in a Digital Age,” McKinsey Global Institute, 2014; World Economic Outlook, International Monetary Fund, 2016.

Metropolitan economies must compete globally
3
Taking part in global markets is no longer a choice for metropolitan leaders.
City and regional leaders can either seize the opportunities afforded by the global dynamics or risk falling victim to the downsides of globalization.
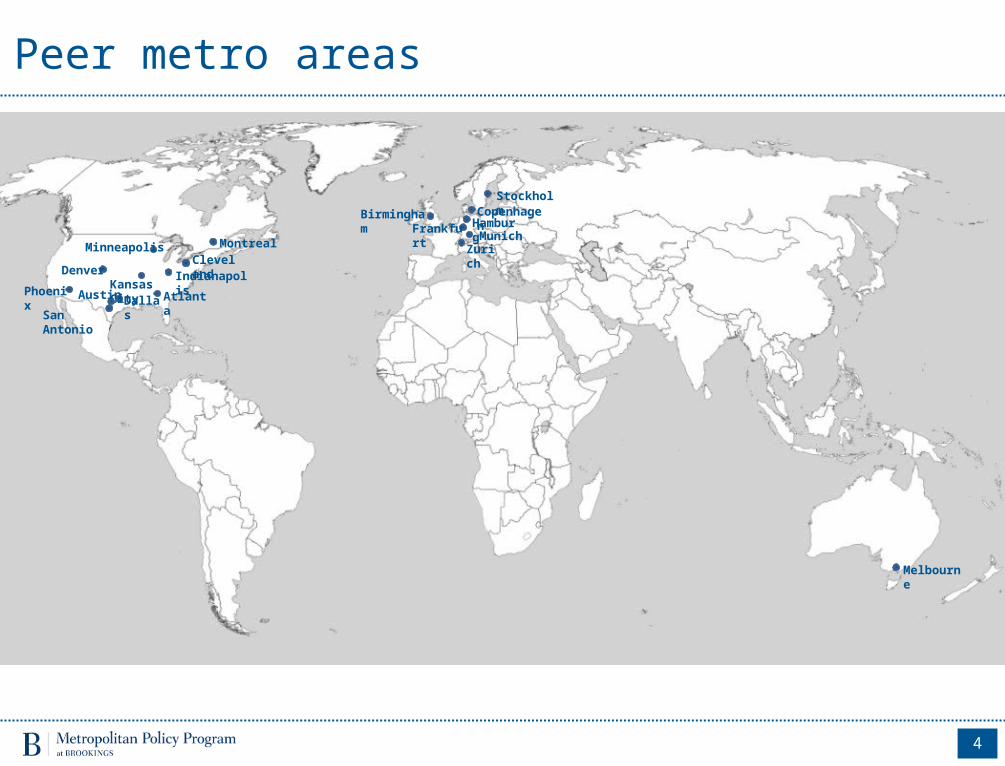
This benchmarking study analyzes Greater Charlotte’s competitive position through four factors—trade and investment, innovation, talent, and infrastructure—compared to 19 other city-regions that most closely resemble Greater Charlotte’s size, wealth, productivity, industrial structure, and competitiveness factors.
Trade Innovation Talent Infrastructure
Regional Competitiveness Framework
4
Melbourne
Peer metro areas
BirminghamFrankfurt
San Antonio
Minneapolis
DallasKansas City
IndianapolisCleveland
Atlanta
Montreal
Hamburg
StockholmCopenhagen
ZurichMunich
Denver
Phoenix Austin

Bottom Line – Charlotte’s competitive position
5
Economic performance: Overall economic growth has been robust over the past decade, but on metrics of inclusion Greater Charlotte has lagged.
Trade and Investment: Greater Charlotte is very globally-oriented. Exports and foreign direct investment account for a disproportionate share of the regional economy, led by tradable anchors like machinery, transportation equipment, and financial services.
But the region is at risk of losing ground to peer metropolitan economies unless it shores up its competitive drivers:
• Innovation: Build up very low levels of research and development, technology commercialization, and venture capital investment;
• Talent: Help employers overcome challenges in filling job vacancies, especially occupations that require STEM skills; and
• Infrastructure: Address lagging broadband speeds and disparities in broadband access by income.

1 | Economic Performance
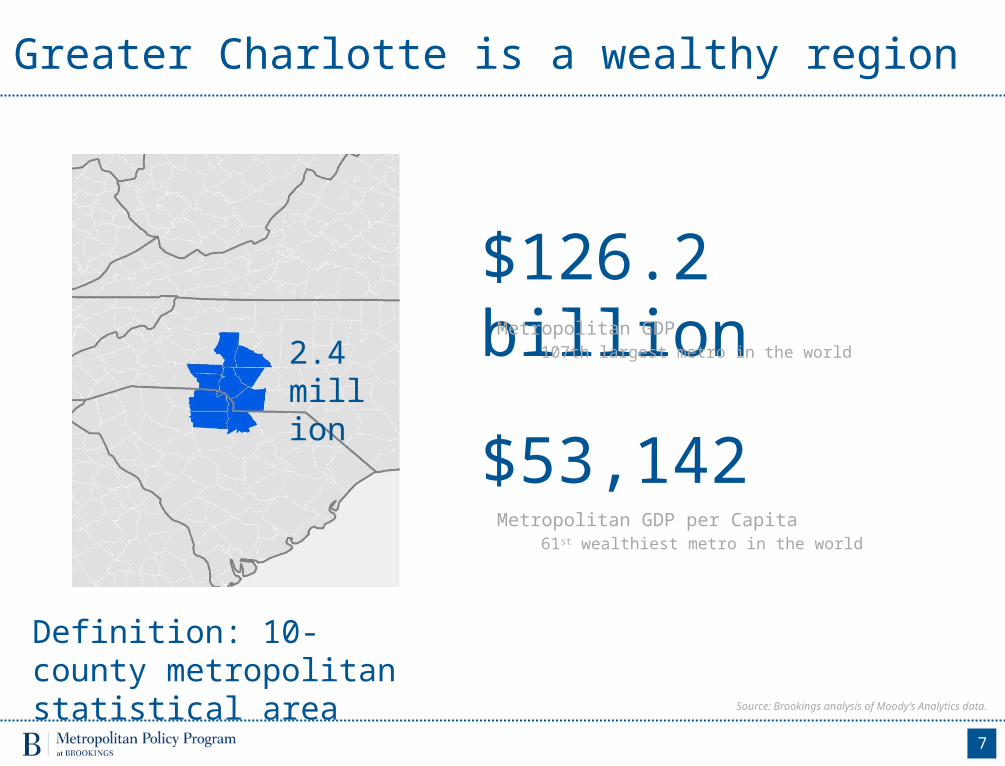
Greater Charlotte is a wealthy region
7
$126.2 billion
Metropolitan GDP per Capita61st wealthiest metro in the world
$53,142
Metropolitan GDP 107th largest metro in the world
Definition: 10-county metropolitan statistical area
2.4 million
Source: Brookings analysis of Moody’s Analytics data.
Metro Monitor: 3 elements of economic performance
8
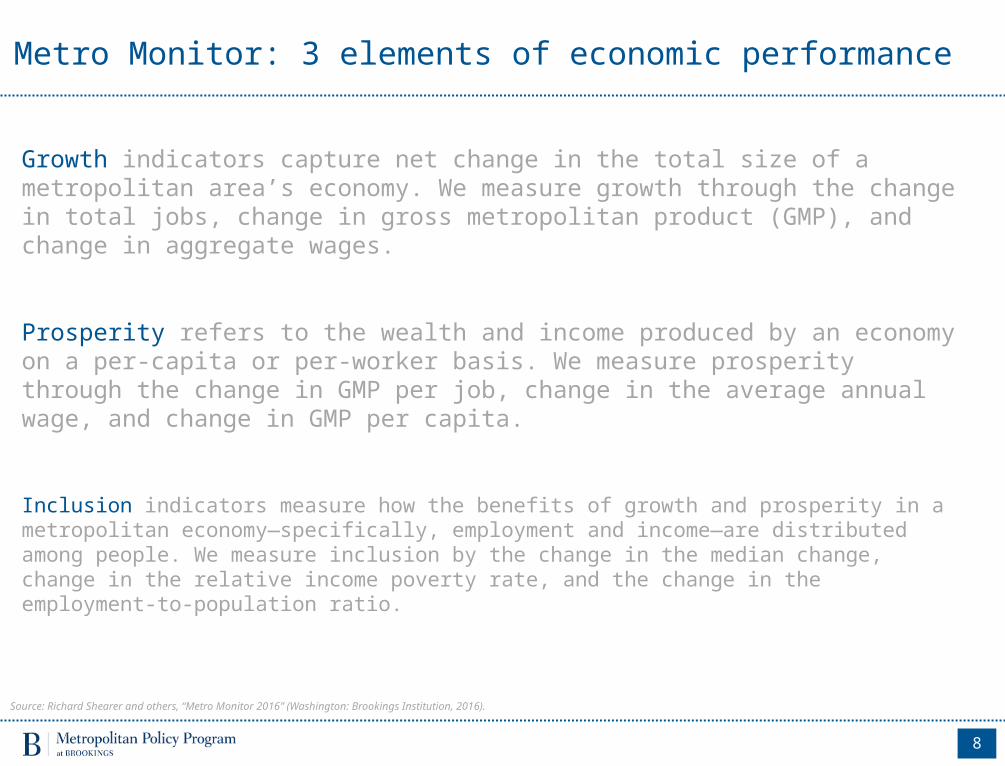
Growth indicators capture net change in the total size of a metropolitan area’s economy. We measure growth through the change in total jobs, change in gross metropolitan product (GMP), and change in aggregate wages.
Inclusion indicators measure how the benefits of growth and prosperity in a metropolitan economy—specifically, employment and income—are distributed among people. We measure inclusion by the change in the median change, change in the relative income poverty rate, and the change in the employment-to-population ratio.
Prosperity refers to the wealth and income produced by an economy on a per-capita or per-worker basis. We measure prosperity through the change in GMP per job, change in the average annual wage, and change in GMP per capita.
Source: Richard Shearer and others, “Metro Monitor 2016” (Washington: Brookings Institution, 2016).

Greater Charlotte’s economy has grown rapidly
9
1 year
Source: Brookings Metro Monitor.
5 years 10 years
Jobs (100 metro rank)
+3.6% (13th)
Gross Metro Product (GMP)
(100 metro rank)
+3.0% (22nd)
Aggregate Wages
(100 metro rank)
+5.1% (17th)
OVERALL GROWTH
(100 metro rank)
+11.3% (14th)
+15.6% (17th)
+18.1% (10th)
+15.3% (16th)
+23.5% (18th)
+23.3% (20th)
10th 17th 18th
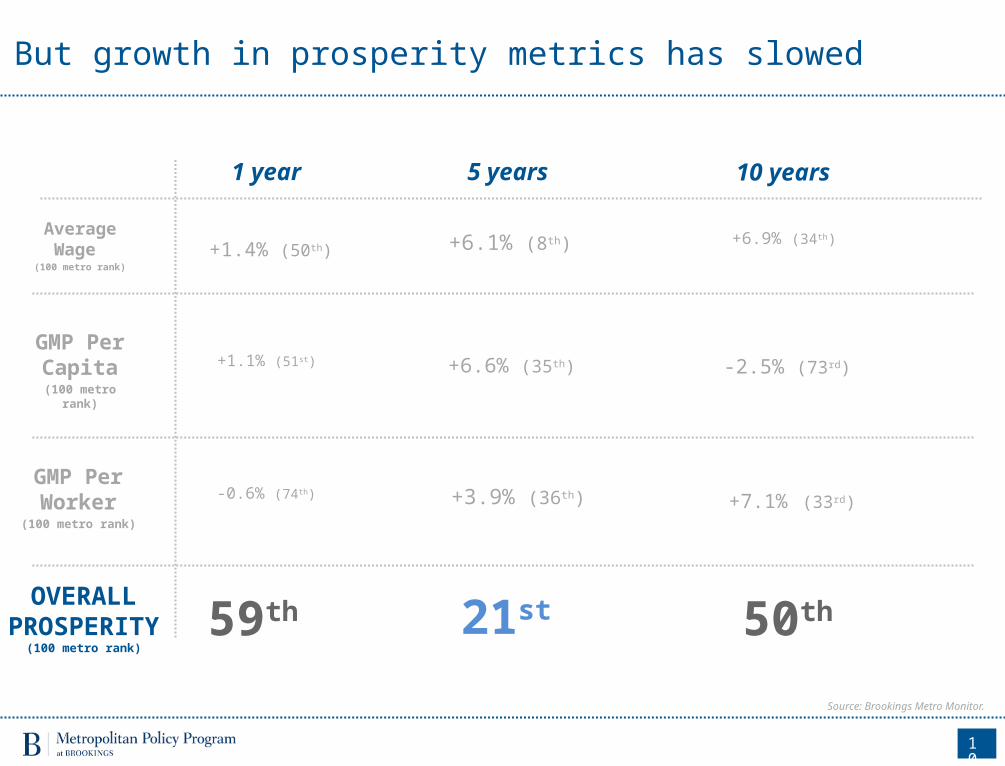
But growth in prosperity metrics has slowed
10
1 year
Source: Brookings Metro Monitor.
5 years 10 years
Average Wage
(100 metro rank)+1.4% (50th)
GMP Per Capita
(100 metro rank)+1.1% (51st)
GMP Per Worker
(100 metro rank)
-0.6% (74th)
OVERALL PROSPERITY
(100 metro rank)
+6.1% (8th)
+6.6% (35th)
+3.9% (36th)
+6.9% (34th)
-2.5% (73rd)
+7.1% (33rd)
21st 59th 50th
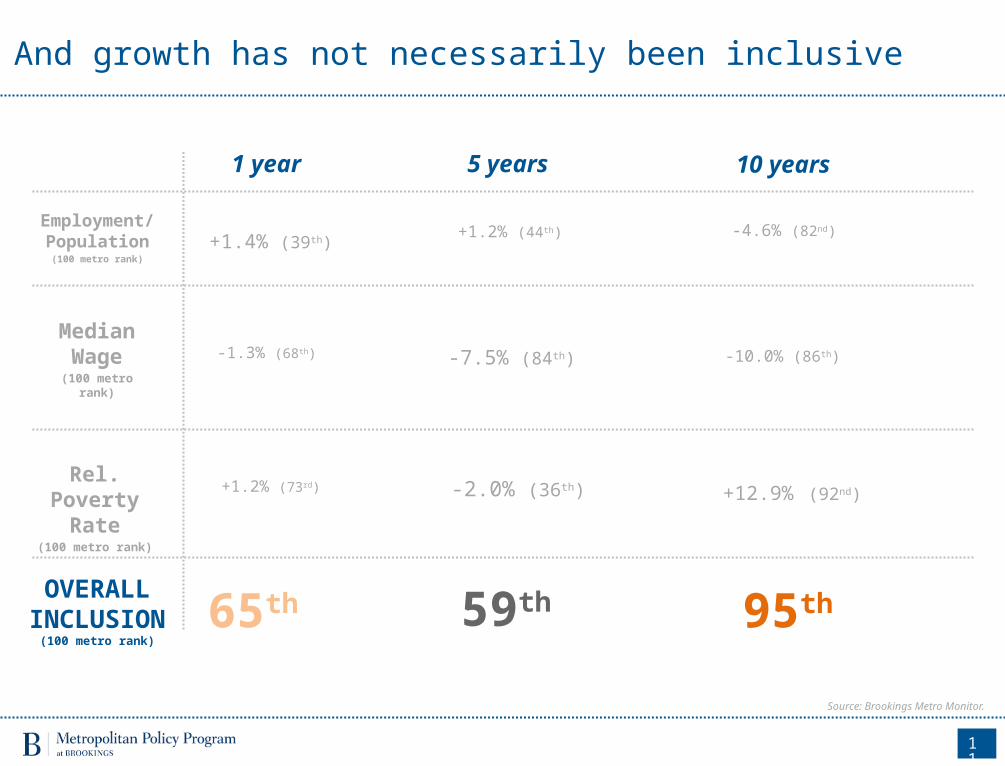
And growth has not necessarily been inclusive
11
1 year
Source: Brookings Metro Monitor.
5 years 10 years
Employment/Population
(100 metro rank)+1.4% (39th)
Median Wage
(100 metro rank)-1.3% (68th)
Rel. Poverty Rate
(100 metro rank)
+1.2% (73rd)
OVERALL INCLUSION
(100 metro rank)
+1.2% (44th)
-7.5% (84th)
-2.0% (36th)
-4.6% (82nd)
-10.0% (86th)
+12.9% (92nd)
59th 65th 95th

Bottom Line – Economic performance
12
Growth has been strong. Since 2004 and in the aftermath of the recession, overall growth in jobs, output, and aggregate wages has been among the top fifth of U.S. metropolitan areas.
Prosperity has improved as well, but not as rapidly as overall growth. Output per capita, output per worker, and average yearly wages have all expanded, but less so in the past year.
Inclusive growth remains elusive, however. Over the past ten years, the employment-to-population ratio and the median wage have both declined, and the relative income poverty rate has increased.

2 | Global Trade and Investment

Two components of global economic orientation
Exports are sales of goods and services to foreign entities (people or companies).
14
1
2 Foreign direct investment arises when a foreign entity invests in a business enterprise in the United States.
Source: Emilia Istrate and Nicholas Marchio, “Export Nation 2012: How U.S. Metropolitan Areas are Driving National Growth” (Washington: Brookings Institution, 2012).; Dwight Perkins, Steven Radelet, and David Lindauer, “Investment, Productivity, and Growth.” In Economics of Development: Sixth Edition. (New York: W.W. Norton & Company, 2006).

Why exports matter
15
Exports are driving economic growth and wage gains.
Share of Job Growth
‘09-’14
Share of GDP Growth ‘09-’14
8.1%
27.0%
Services Trade Wage
Premium
Manuf. Trade Wage
Premium
20.0%17.0%
Middle market firms benefit from exports. More likely to grow revenue (76 percent of exporters vs. 64 percent of non-
exporters)
More likely to add employees (51 percent of exporters vs. 39 percent of non-exporters).
Source: Moody’s Analytics; Brookings, “Export Nation,” 2014. J. Bradford Jensen, “Global Trade in Services,” Petersen Institute for international Economics, 2011; David Riker, “Do Jobs in Export Industries Still Pay More?”, International Trade Administration, 2010. Brookings, National Association for the Middle Market, “Accelerating Exports in the Middle Market,” 2014. The Middle Market is defined as companies with annual revenues between $10 million and $1 billion.

Greater Charlotte’s economy is export-intensiveGreater Charlotte relies upon exports for a greater share (14 percent) of its economic output than any U.S. peer metro area, as exports have grown faster than the economy as a whole since 2003. Exports supported more than 110,000 jobs in 2014.
16
Exports, GDP, and jobs, Greater Charlotte and peer regions
Metro AreaExport share of
GDP, 2014
Change in Export Share GDP, 2003-
2014
Gross exports (USD billion),
2014
Annualized Export Growth,
2003-14Annualized GDP Growth, 2003-14
Total Jobs Supported by Exports, 2014
Change Total Export Jobs,
2003-2014
Charlotte 14.0% 5.1% 17.7 5.7% 2.3% 110,043 40,973
Indianapolis 13.3% 4.0% 15.0 4.1% 1.7% 81,619 18,693
Dallas 13.2% 4.3% 54.9 7.0% 3.0% 315,544 106,507
Cleveland 11.7% 3.2% 13.6 2.6% 0.5% 81,371 9,007
Kansas City 9.6% 3.4% 10.2 4.8% 1.1% 64,588 18,235
Minneapolis 9.6% 2.5% 20.3 4.0% 1.1% 132,698 21,655
Austin 9.2% -0.7% 10.0 6.3% 4.2% 62,113 10,956
Atlanta 9.0% 3.1% 26.6 4.6% 1.3% 188,807 56,222
San Antonio 8.9% 4.1% 9.2 8.2% 2.8% 57,160 26,061
Phoenix 8.9% -1.6% 18.4 1.4% 1.7% 123,392 -18,814
Denver 8.0% 2.7% 13.6 5.6% 2.2% 94,701 29,740
Source: Brookings analysis of data from Census, BEA, Moody’s analytics, BLS, NAFSA, IRS, EIA, and Sabre.
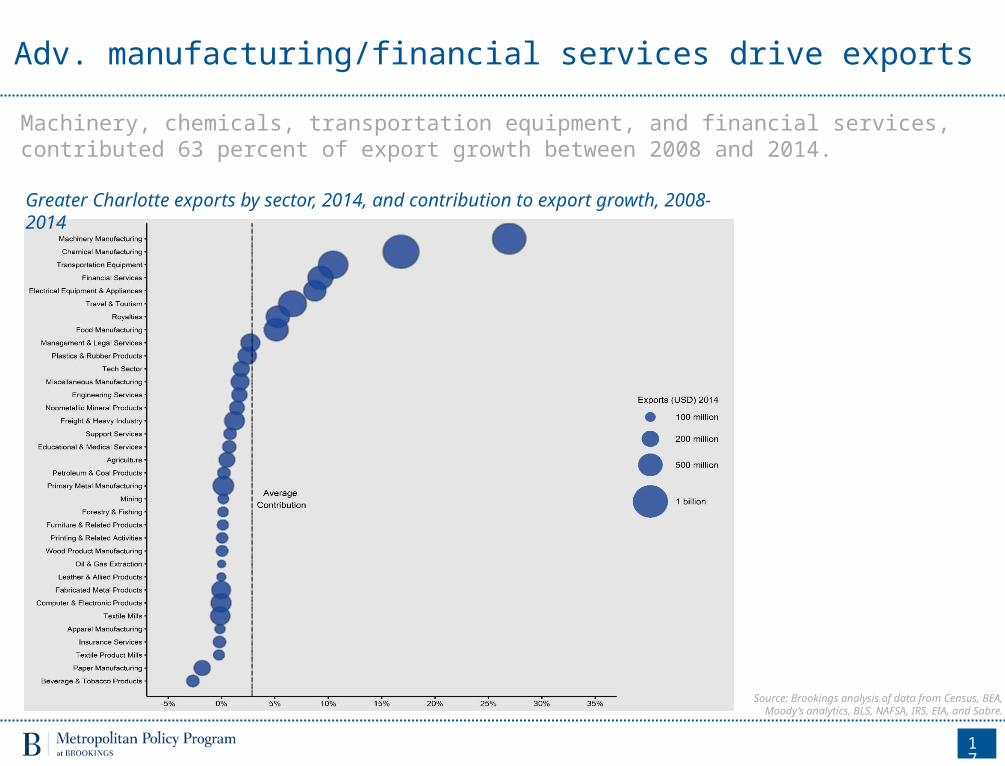
Adv. manufacturing/financial services drive exportsMachinery, chemicals, transportation equipment, and financial services, contributed 63 percent of export growth between 2008 and 2014.
17
Greater Charlotte exports by sector, 2014, and contribution to export growth, 2008-2014
Source: Brookings analysis of data from Census, BEA, Moody’s analytics, BLS, NAFSA, IRS, EIA, and
Sabre.

Why foreign direct investment matters
18
Global investment flows are growing. Worldwide foreign direct investment has increased from just over $200 billion in 1990 to $1.2 trillion in 2014.
Foreign-owned firms pay higher wages. Average wages in foreign-owned firms are $77,000 versus $60,000 in domestic firms.
U.S. workers
U.S. goods exports
5.0%
20.3%
Foreign-owned firms contribute disproportionately to export and innovation capacity by transmitting new technologies and corporate best practices.
U.S. corporate
R&D
18.9%
Foreign firms share of:
Source: Brookings analysis of UNCTAD, WTO and ITC, based on Eurostat, OECD, IMF, UNSD, and other international and national sources; Bureau of Economic Analysis.
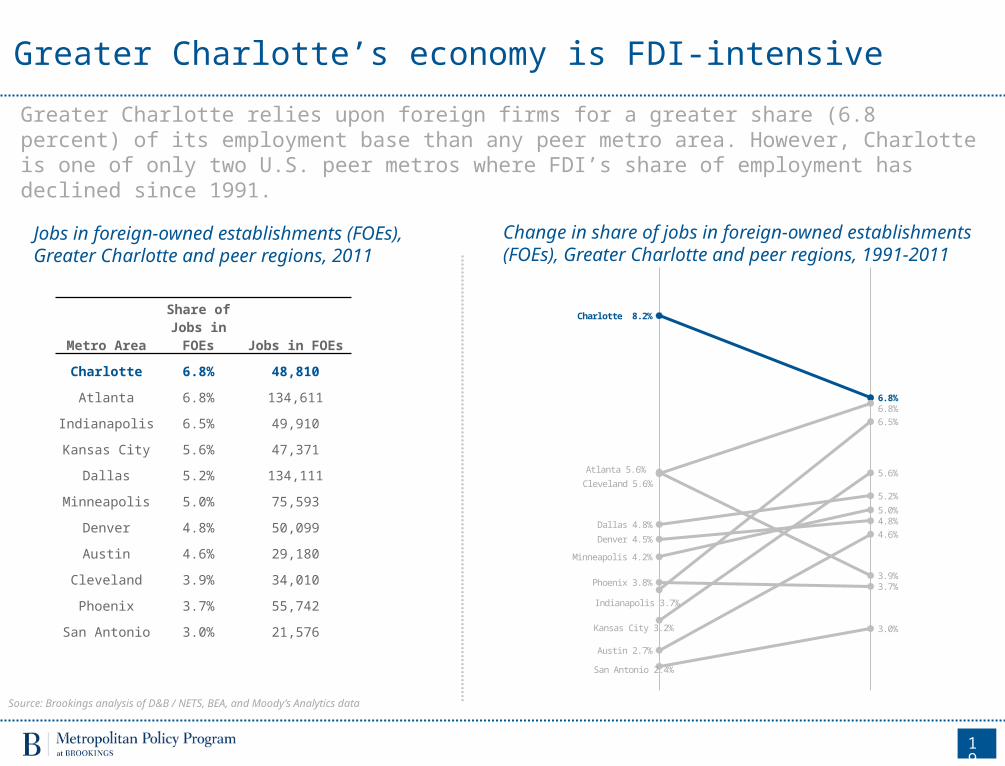
Greater Charlotte’s economy is FDI-intensiveGreater Charlotte relies upon foreign firms for a greater share (6.8 percent) of its employment base than any peer metro area. However, Charlotte is one of only two U.S. peer metros where FDI’s share of employment has declined since 1991.
19
Jobs in foreign-owned establishments (FOEs), Greater Charlotte and peer regions, 2011
Metro Area
Share of Jobs in FOEs Jobs in FOEs
Charlotte 6.8% 48,810
Atlanta 6.8% 134,611
Indianapolis 6.5% 49,910
Kansas City 5.6% 47,371
Dallas 5.2% 134,111
Minneapolis 5.0% 75,593
Denver 4.8% 50,099
Austin 4.6% 29,180
Cleveland 3.9% 34,010
Phoenix 3.7% 55,742
San Antonio 3.0% 21,576
Change in share of jobs in foreign-owned establishments (FOEs), Greater Charlotte and peer regions, 1991-2011
1991 2011
Charlotte 8.2%
6.8%
Atlanta 5.6%
6.8%
Indianapolis 3.7%
6.5%
Kansas City 3.2%
5.6%
Dallas 4.8%
5.2%
Minneapolis 4.2%
5.0%
Denver 4.5%
4.8%
Austin 2.7%
4.6%
Cleveland 5.6%
3.9%Phoenix 3.8% 3.7%
San Antonio 2.4%
3.0%
Source: Brookings analysis of D&B / NETS, BEA, and Moody’s Analytics data
FDI mainly arrives thru new establishments (Greenfield)
20
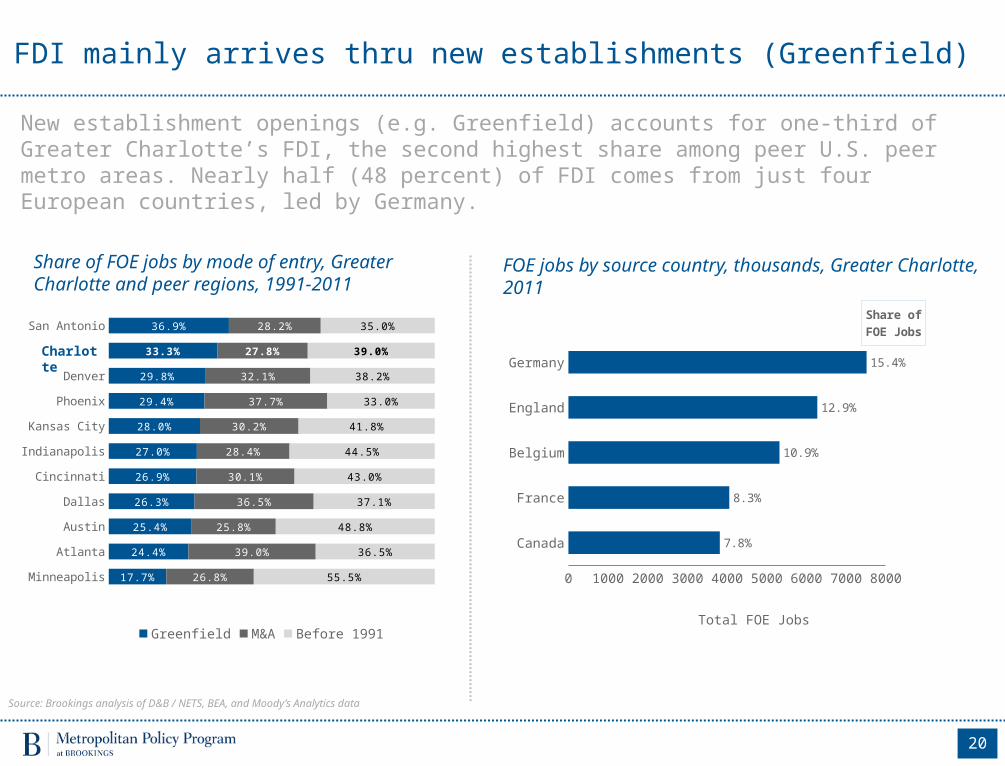
New establishment openings (e.g. Greenfield) accounts for one-third of Greater Charlotte’s FDI, the second highest share among peer U.S. peer metro areas. Nearly half (48 percent) of FDI comes from just four European countries, led by Germany.
Minneapolis
Atlanta
Austin
Dallas
Cincinnati
Indianapolis
Kansas City
Phoenix
Denver
San Antonio
17.7%
24.4%
25.4%
26.3%
26.9%
27.0%
28.0%
29.4%
29.8%
33.3%
36.9%
26.8%
39.0%
25.8%
36.5%
30.1%
28.4%
30.2%
37.7%
32.1%
27.8%
28.2%
55.5%
36.5%
48.8%
37.1%
43.0%
44.5%
41.8%
33.0%
38.2%
39.0%
35.0%
Greenfield M&A Before 1991
Share of FOE jobs by mode of entry, Greater Charlotte and peer regions, 1991-2011
FOE jobs by source country, thousands, Greater Charlotte, 2011
Charlotte
Canada
France
Belgium
England
Germany
0 1000 2000 3000 4000 5000 6000 7000 8000
7.8%
8.3%
10.9%
12.9%
15.4%
Total FOE Jobs
Share of FOE Jobs
Source: Brookings analysis of D&B / NETS, BEA, and Moody’s Analytics data

Cleveland
Denver
Kansas City
Hamburg
San Antonio
Atlanta
Frankfurt
Zurich
Birmingham (UK)
$386
$443
$567
$603
$673
$787
$882
$896
$1,065
$1,170
$1,348
$1,456
$1,662
$1,688
$1,887
$2,462
$2,614
$2,867
$3,563
$5,511
But recent FDI flows are about average
21
Since 2009, Charlotte ranks tenth of 20 global metros in total Greenfield FDI flows per capita, led by sectors such as automotive, engines/turbines, industrial machinery, renewable energy, and textiles.
Greenfield foreign direct investment per person, Greater Charlotte and peer regions, 2009-2015
Charlotte
Automotive 16%
Turbines 11%
Machinery 8%
Renewables 8%
Textiles 7%
Rest 50%
Greenfield FDI, Top Sectors, 2009-2015
Source: Brookings analysis of fDi Intelligence data.

Bottom Line – Trade and Investment
22
Exports and foreign direct investment account for a significant share of Greater Charlotte’s economy. The region is the most export-intensive and FDI-intensive metro area among its U.S. peer group.
Key traded sectors like financial services, management consulting, and advanced manufacturing anchor exports and FDI.
However, in the global competition for Greenfield FDI, Greater Charlotte is about average compared to all its global peer metro economies.
Greater Charlotte’s unique reliance on global markets demands a sharp focus on the assets that determine global competitiveness: innovation, talent, and infrastructure.
Lower Higher
Trade and Investment CLT ATL ATN BIR CLE CPN DAL DEN FRT HAM IND KC MEL MPLS MON MUN PHX SA STK ZUR
Export share of GDP, 2014 1 8 7 - 4 - 3 11 - - 2 5 - 6 - - 10 9 - -
% change in export share of GDP, 2003-2014 1 7 10 - 6 - 2 8 - - 4 5 - 9 - - 11 3 - -
Annualized export growth, 2003-2014 4 7 3 - 10 - 2 5 - - 8 6 - 9 - - 11 1 - -
Share of jobs in foreign-owned establishments (FOEs), 2011 1 2 8 - 9 - 5 7 - - 3 4 - 6 - - 10 11 - -
Change in share of jobs in FOEs, 1991-2011 10 4 3 - 11 - 7 8 - - 1 2 - 5 - - 9 6 - -
Greenfield FDI per capita, 2009-2015 10 8 1 2 20 9 15 18 6 14 13 16 3 19 5 11 17 12 7 4
Peer RankCLT = Charlotte CPN = Copenhagen IND = Indianapolis MUN = Munich
ATL = Atlanta DAL = Dallas KC = Kansas City PHX = Phoenix
ATN = Austin DEN = Denver MEL = Melbourne SA = San Antonio
BIR = Birmingham (UK) FRT = Frankfurt MPLS = Minneapolis STK = Stockholm
CLE = Cleveland HAM = Hamburg MON = Montreal ZUR = Zurich

3 | Innovation
Why innovation matters
24
Innovative capacity matters because it is the most durable economic advantage for firms and regions in advanced economies. It is a critical input to competitiveness, and an important driver of rising productivity which, in turn, generates increases in living standards.
But research suggests that a few things influence the quality of innovation ecosystems: research and development (R&D), commercialization of that R&D into new products and services (e.g. patents), the presence of entrepreneurial activities that are linked to technology development, and advanced industrial production.
Innovation takes many forms, and includes improvements in products, services, processes, and management techniques. It can be hard to measure and even harder to predict.
Source: For a full review of the role of innovation in metropolitan growth, see George Washington Institute of Public Policy and RW Ventures, “Implementing Regionalism.”

Kansas City
DallasPhoenix
San AntonioIndianapolis
DenverBirmingham (UK)
FrankfurtMunich
MinneapolisClevelandHamburg
AtlantaMelbourne
AustinStockholm
MontrealCopenhagen
$0.25
$0.28
$1.69
$1.93
$2.39
$2.63
$2.73
$3.00
$3.67
$3.68
$3.79
$4.03
$4.25
$4.93
$6.11
$6.54
$7.47
$7.86
$10.42
Charlotte
R&D expenditures significantly trail peer metros
25
A wide literature confirms that research activities help advance economic development. Greater Charlotte ranks second to last among its global peers in university R&D expenditures, both overall and business-funded.
All R&D Conducted at Universities per $1,000 of GDP, 2013 or latest year available
Business-Funded R&D Conducted at Universities per $1,000 of GDP, 2013
Kansas City
Phoenix
Dallas
Cleveland
San Antonio
Minneapolis
Indianapolis
Atlanta
Denver
Austin
$0.01
$0.01
$0.06
$0.09
$0.10
$0.12
$0.13
$0.13
$0.27
$0.30
$0.70
Charlotte
Source: NSF Higher Education Research and Development Survey data.

Charlotte lacks a major scientific research institution
26
Unlike its peer metros, Charlotte does not house a research institution ranked in the top 750 in the world by CWTS and Leiden University in terms of scientific impact. UNC-Charlotte is the region’s most significant research asset. Number of universities in CWTS/Leiden University Top 750 List, 2010-2013
Higher Education R&D Expenditures, Top Source by Metro, FY2013
5 Melbourne MontrealStockholm
4 Dallas
3Atlanta Copenhagen
Frankfurt2
Birmingham Munich San Antonio Zurich
1 Austin Cleveland Denver Hamburg Indianapolis Kansas City Minneapolis Phoenix
0 Charlotte
Rank Institution Metro Area R&D expenditures (millions USD)
15 University of Minnesota Minneapolis $858,378
23 Georgia Institute of Technology Atlanta $730,488
31 University of Texas Austin $634,132
45 University of Texas Southwestern Medical Center Dallas $440,620
50 Case Western Reserve University Cleveland $425,788
52 University of Colorado Denver $409,443
53 Arizona State University Phoenix $405,154
70 Indiana University-Purdue University Indianapolis $332,760
113 University of Texas Health Science Center San Antonio $175,983
236 University of Missouri Kansas City $28,829
246 University of North Carolina Charlotte $24,764
Source: Brookings analysis of Centre for Science and Technology Studies (CWTS) and Leiden University data and NSF Higher Education Research and Development Survey data.

San Antonio
Kansas City
Melbourne
Birmingham (UK)
Montreal
Atlanta
Phoenix
Dallas
Denver
Hamburg
Cleveland
Indianapolis
Austin
Zurich
Frankfurt
Munich
Copenhagen
Minneapolis
Stockholm
2.0
2.8
3.9
4.8
4.8
5.0
5.1
5.2
5.8
6.4
7.0
10.6
10.8
11.4
13.9
14.2
17.4
19.7
22.4
24.8
Charlotte’s patenting intensity lags peers
27
Total patenting has increased in Greater Charlotte over time, but the region still trails global peers in commercialization. In the 2008 to 2012 period, Charlotte produced 3.9 patents per 10,000 residents, third to last among peers.
Patents per 10,000 inhabitants, 2008-2012Total patents, Greater Charlotte,1977-2012
Charlotte1977-1982 1983-1987 1988-1992 1993-1997 1998-2002 2003-2007 2008-2012
20 2792
299
504
829
1,010
Source: Brookings analysis of OECD REGPAT data.

IT and manufacturing generate most patents
28
Charlotte’s largest technology families are information technology, advanced manufacturing, life sciences, and energy.
Top Patenting Technology Groups, Greater Charlotte Region, 2008-2012
Rank Tech Subgroup Tech Family Patents
1 IT methods for management Information technology 121
2 Computer technology Information technology 110
3 Medical technology Life sciences 69
4 Civil engineering Energy and infrastructure 47
5 Materials, metallurgy Advanced manufacturing 44
6 Control Precision systems 44
7 Other special machines Advanced manufacturing 41
8 Chemical engineering Advanced manufacturing 40
9 Optics Precision systems 33
10 Measurement Precision systems 33
Source: Brookings analysis of OECD REGPAT data.

Minneapolis
Cleveland
Kansas City
Indianapolis
Dallas
Phoenix
Atlanta
San Antonio
Denver
Austin
37
35
29
28
25
15
14
13
10
5
1
Startup activity trails most U.S. peer metros
29
Entrepreneurship enables innovation by translating new ideas into market-ready products and services. Charlotte ranked 25th (of 40 metros) in the Kauffman Foundation’s 2015 Startup Activity Index.
Startup Activity Rank, Kauffman Foundation, 2015
Charlotte
Components of Startup Activity Index
The Kauffman Index Startup Activity ranks forty large metro areas in 2015 based on three metrics:
• Rate of new entrepreneurs—percent of adult population that became entrepreneurs in a given month calculated as a 3-year moving average;
• Opportunity share of new entrepreneurs—percent of new entrepreneurs who were not unemployed before starting their business calculated as a 5-year moving average;
• Startup density—number of startup firms per 100,000 resident population defining a startup as firms less than one-year old employing at least one person besides the owner.
Source: The Kauffman Index: Startup Activity 2015.
Birmingham (UK)Hamburg
MelbourneFrankfurt
San AntonioMunich
PhoenixKansas City
ZurichCleveland
IndianapolisMontreal
CopenhagenDallas
AtlantaStockholm
MinneapolisDenverAustin
$42
$67
$85
$86
$174$293
$407
$474
$478
$510
$527
$583
$605
$766
$882
$919
$1,056
$1,085
$1,471
$4,084
Very few Charlotte firms attract venture capital
30
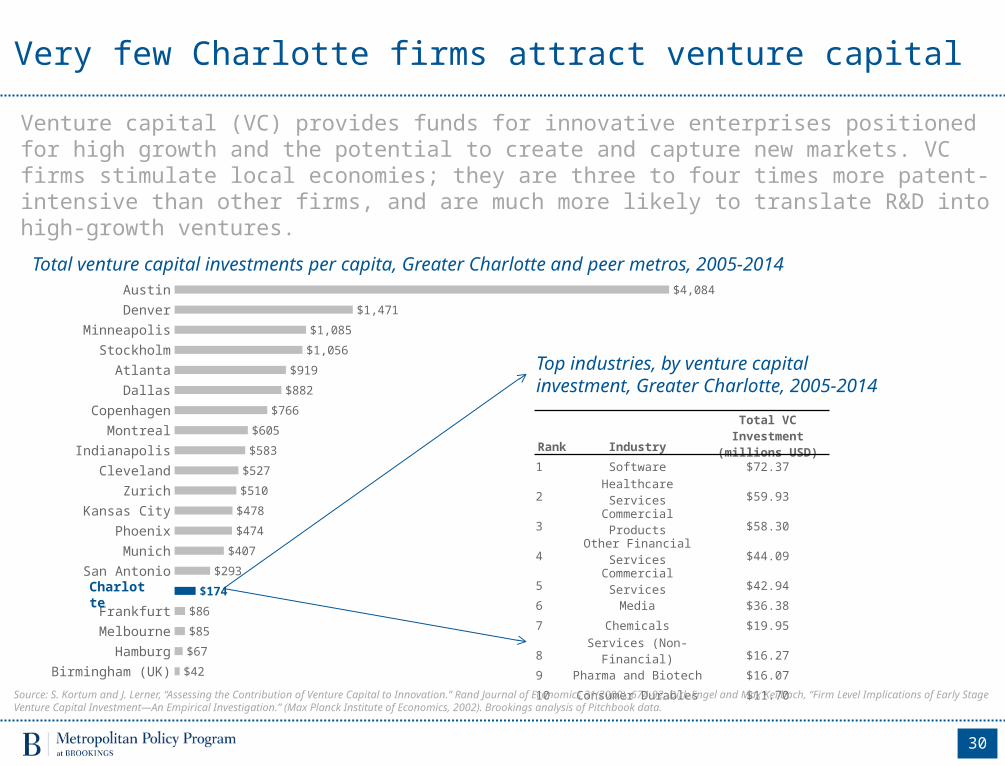
Venture capital (VC) provides funds for innovative enterprises positioned for high growth and the potential to create and capture new markets. VC firms stimulate local economies; they are three to four times more patent-intensive than other firms, and are much more likely to translate R&D into high-growth ventures.
Total venture capital investments per capita, Greater Charlotte and peer metros, 2005-2014
Charlotte
Top industries, by venture capital investment, Greater Charlotte, 2005-2014
Rank IndustryTotal VC Investment
(millions USD)1 Software $72.37
2 Healthcare Services $59.93
3 Commercial Products $58.30
4 Other Financial Services $44.09
5 Commercial Services $42.94
6 Media $36.38
7 Chemicals $19.95
8 Services (Non-Financial) $16.27
9 Pharma and Biotech $16.07
10 Consumer Durables $11.70
Source: S. Kortum and J. Lerner, “Assessing the Contribution of Venture Capital to Innovation.” Rand Journal of Economics 31(2000), 674-92; Dirk Engel and Max Keilbach, “Firm Level Implications of Early Stage Venture Capital Investment—An Empirical Investigation.” (Max Planck Institute of Economics, 2002). Brookings analysis of Pitchbook data.

Advanced industries: America’s “tech” super-sector
31
Advanced industries are technology-intensive manufacturing and services industries, and their profile and performance provide a helpful measure of the nation’s “tech” sector at its broadest.
Why Advanced Industries Matter
50 industries across manufacturing, services, and energy, account for the U.S. share of:
2.7
Jobs R&D
8.9%
90.3%
Patents
81.2%
GDP
17.9%
Exports
57.5%
Defining Advanced Industries
50 industries across manufacturing, services, and energy that meet two criteria:
$450
Minimum share of workers in industry whose occupations require a high degree of STEM knowledge
21 percent
Minimum industry R&D per worker, 80th percentile of industries
Source: Mark Muro and others, “America’s Advanced Industries” (Washington: Brookings Institution, 2015).
Charlotte has a diversity of advanced industries
32
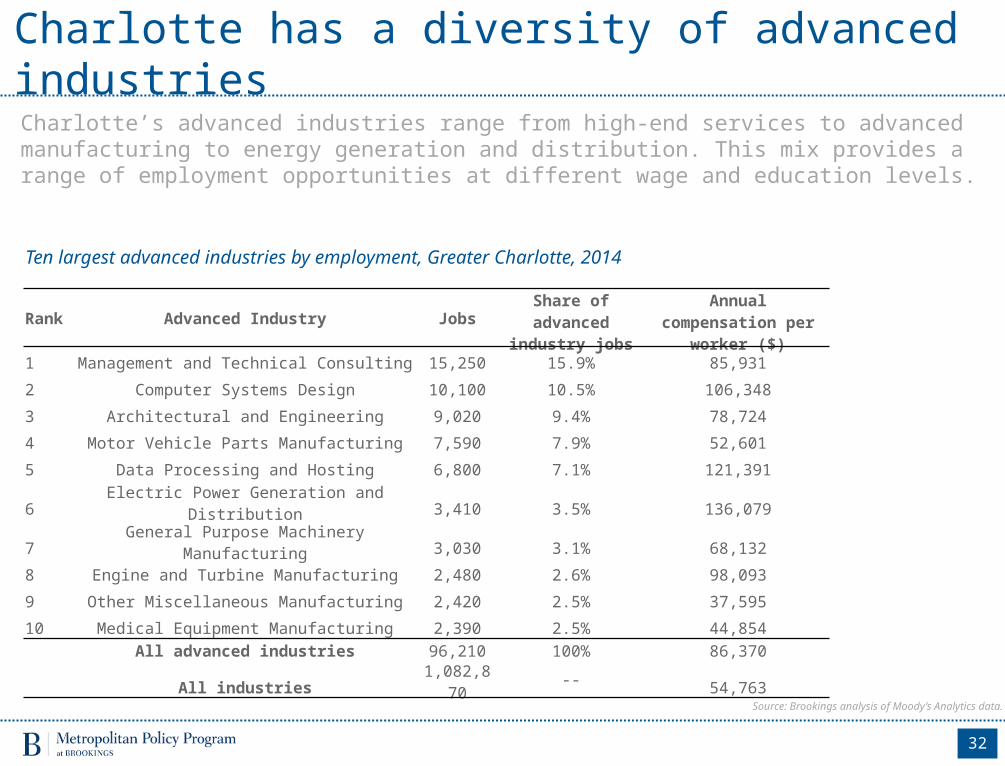
Charlotte’s advanced industries range from high-end services to advanced manufacturing to energy generation and distribution. This mix provides a range of employment opportunities at different wage and education levels.
Ten largest advanced industries by employment, Greater Charlotte, 2014
Rank Advanced Industry Jobs Share of advanced industry jobs
Annual compensation per worker ($)
1 Management and Technical Consulting 15,250 15.9% 85,931
2 Computer Systems Design 10,100 10.5% 106,348
3 Architectural and Engineering 9,020 9.4% 78,724
4 Motor Vehicle Parts Manufacturing 7,590 7.9% 52,601
5 Data Processing and Hosting 6,800 7.1% 121,391
6 Electric Power Generation and Distribution 3,410 3.5% 136,079
7 General Purpose Machinery Manufacturing 3,030 3.1% 68,132
8 Engine and Turbine Manufacturing 2,480 2.6% 98,093
9 Other Miscellaneous Manufacturing 2,420 2.5% 37,595
10 Medical Equipment Manufacturing 2,390 2.5% 44,854All advanced industries 96,210 100% 86,370
All industries 1,082,870 -- 54,763
Source: Brookings analysis of Moody’s Analytics data.
But trails peers in advanced industries intensity
33
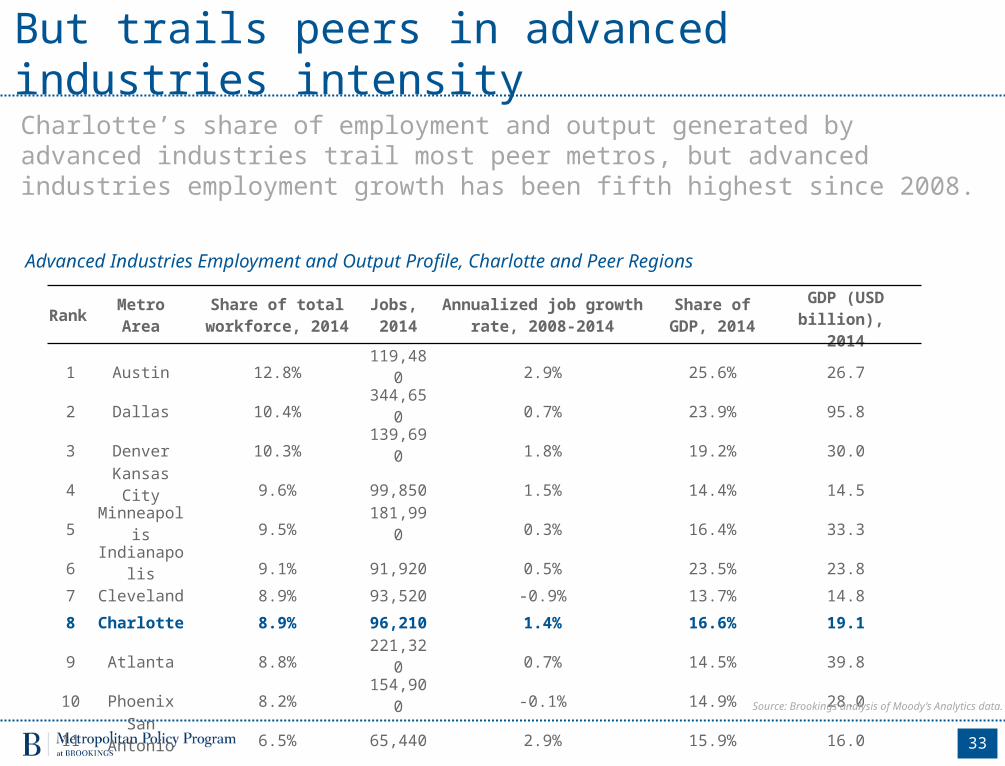
Charlotte’s share of employment and output generated by advanced industries trail most peer metros, but advanced industries employment growth has been fifth highest since 2008.
Advanced Industries Employment and Output Profile, Charlotte and Peer Regions
Rank Metro Area Share of total workforce, 2014
Jobs, 2014
Annualized job growth rate, 2008-2014
Share of GDP, 2014
GDP (USD billion), 2014
1 Austin 12.8% 119,480 2.9% 25.6% 26.7
2 Dallas 10.4% 344,650 0.7% 23.9% 95.8
3 Denver 10.3% 139,690 1.8% 19.2% 30.0
4 Kansas City 9.6% 99,850 1.5% 14.4% 14.5
5 Minneapolis 9.5% 181,990 0.3% 16.4% 33.3
6 Indianapolis 9.1% 91,920 0.5% 23.5% 23.8
7 Cleveland 8.9% 93,520 -0.9% 13.7% 14.8
8 Charlotte 8.9% 96,210 1.4% 16.6% 19.19 Atlanta 8.8% 221,320 0.7% 14.5% 39.8
10 Phoenix 8.2% 154,900 -0.1% 14.9% 28.0
11 San Antonio 6.5% 65,440 2.9% 15.9% 16.0
Source: Brookings analysis of Moody’s Analytics data.

Bottom Line – Innovation
34
Fast growth in advanced industries employment since 2008 shows that Greater Charlotte does house innovative firms in management and technical consulting, advanced manufacturing, and computer systems design.
But very low levels of research and development, technology commercialization, and venture capital reveal that Greater Charlotte’s innovation ecosystem is not yet at the same level as global peers.
Unlike its peer metro economies, Greater Charlotte does not house major research universities or medical centers, major engines of the innovation economy. UNC-Charlotte is the region’s most significant research asset, but it is not currently ranked among the top 750 universities with the greatest scientific impact. Innovation CLT ATL ATN BIR CLE CPN DAL DEN FRT HAM IND KC MEL MPLS MON MUN PHX SA STK ZURR&D conducted at universities per $1,000 of GDP, 2013 18 6 4 12 8 1 17 13 11 7 14 19 5 9 2 10 16 15 3 -Business-funded R&D conducted at universities per $1,000 GDP, 2013 10 3 1 - 7 - 8 2 - - 4 11 - 5 - - 9 6 - -Percentage of university scientific publications cited in top 10 percent, 2010-2013 20 7 4 9 5 11 8 2 15 10 13 19 12 3 18 6 16 17 14 1Percentage of university scientific publications conducted with industry, 2010-2013 20 5 6 16 7 1 10 2 8 12 3 18 19 14 17 9 15 11 4 13Patents per 10,000 inhabitants, 2008-2012 18 14 7 16 9 3 12 11 5 10 8 19 17 2 15 4 13 20 1 6Startup activity rank, Kauffman Foundation, 2015 7 4 1 - 10 - 6 2 - - 8 9 - 11 - - 5 3 - -Venture capital investments per capita, 2005-2014 16 5 1 20 10 7 6 2 17 19 9 12 18 3 8 14 13 15 4 11Share of jobs in advanced industries, 2014 8 9 1 - 7 - 2 3 - - 6 4 - 5 - - 10 11 - -% change in advanced industries employment, 2008-2014 5 7 1 - 11 - 6 3 - - 8 4 - 9 - - 10 2 - -
Lower Higher
Peer Rank CLT = Charlotte CPN = Copenhagen IND = Indianapolis MUN = MunichATL = Atlanta DAL = Dallas KC = Kansas City PHX = PhoenixATN = Austin DEN = Denver MEL = Melbourne SA = San AntonioBIR = Birmingham (UK) FRT = Frankfurt MPLS = Minneapolis STK = StockholmCLE = Cleveland HAM = Hamburg MON = Montreal ZUR = Zurich

4 | Talent
Why Talent Matters
36
Human capital—the stock of knowledge, skills, expertise, and capacities embedded in the labor force—is of critical importance to enhancing productivity, raising incomes, and driving economic growth.
As labor markets have become more global, skilled immigrants have become an increasingly important source of talent for U.S. metro economies. Foreign students studying at U.S. universities—the well-educated workers of tomorrow—are a new and growing input to metropolitan economic competitiveness and cultural diversity.
Producing, attracting, and retaining educated workers; creating jobs for those workers; and connecting those workers to employment through efficient labor markets all matter for regional competitiveness and ensuring broad-based economic opportunity.
Source: For a full review of the role of human capital in metropolitan growth, see George Washington Institute of Public Policy and RW Ventures, “Implementing Regionalism.”

Charlotte’s workforce is well-educated
37
About 35 percent of the region’s workforce has obtained a post-secondary degree, placing Charlotte in the middle of its highly educated peer group.
Percentage of population above 15 years old with tertiary education, 2013
Hamburg
San Antonio
Montreal
Frankfurt
Birmingham (UK)
Cleveland
Indianapolis
Phoenix
Dallas
Munich
Melbourne
Atlanta
Kansas City
Copenhagen
Austin
Stockholm
Zurich
Denver
Minneapolis
28.7
28.9
31.2
32.1
32.2
33.0
33.3
33.3
33.8
34.1
35.1
36.0
36.6
36.9
39.5
41.2
42.0
42.0
42.6
43.3
Charlotte
Source: Brookings analysis of U.S. Census Bureau data.

Indianapolis Austin Dallas Phoenix Kansas City San Antonio Atlanta Cleveland Denver Minneapolis
11
10
9
8 8
7 7
6
4
1 1
Yet regional employers struggle to fill job vacancies
38
Despite its educated workforce, Charlotte’s employers nevertheless face challenges in filling job vacancies. Among U.S. peers, Charlotte’s online job postings had the longest median duration (11 days) before being filled.
Median duration of job openings (days), Greater Charlotte and peer regions, 2013
Charlotte
Source: Brookings analysis of Burning Glass data.

Denver Austin Indianapolis Minneapolis Cleveland Kansas City Dallas Atlanta Phoenix San Antonio
25.4%23.9% 22.7% 22.5% 22.2% 21.9% 21.7% 21.5% 21.3% 20.8%
18.3%
Austin Denver Atlanta Dallas Kansas City Minneapolis Cleveland Phoenix San Antonio Indianapolis
48.3% 47.4%44.9%
42.9% 42.7% 42.1% 41.7% 41.5%39.3% 37.4%
35.4%
Employer demand for STEM skills is high
39
About one in five Charlotte workers work in STEM occupations. Nearly half of all job ads are in STEM occupations, the third highest share in the nation.
Share of job ads in STEM occupations, Greater Charlotte and peer regions, 2013
Charlotte
Share of workers in STEM occupations, Greater Charlotte and peer regions, 2013
Charlotte
Source: Brookings analysis of Burning Glass data.
Minneapolis
Denver
Cleveland
Atlanta
Indianapolis
Dallas
Phoenix
Kansas City
San Antonio
Austin
1
2
5
7
11
12
12
13
14
15
17
And STEM jobs are among the hardest to fill
40
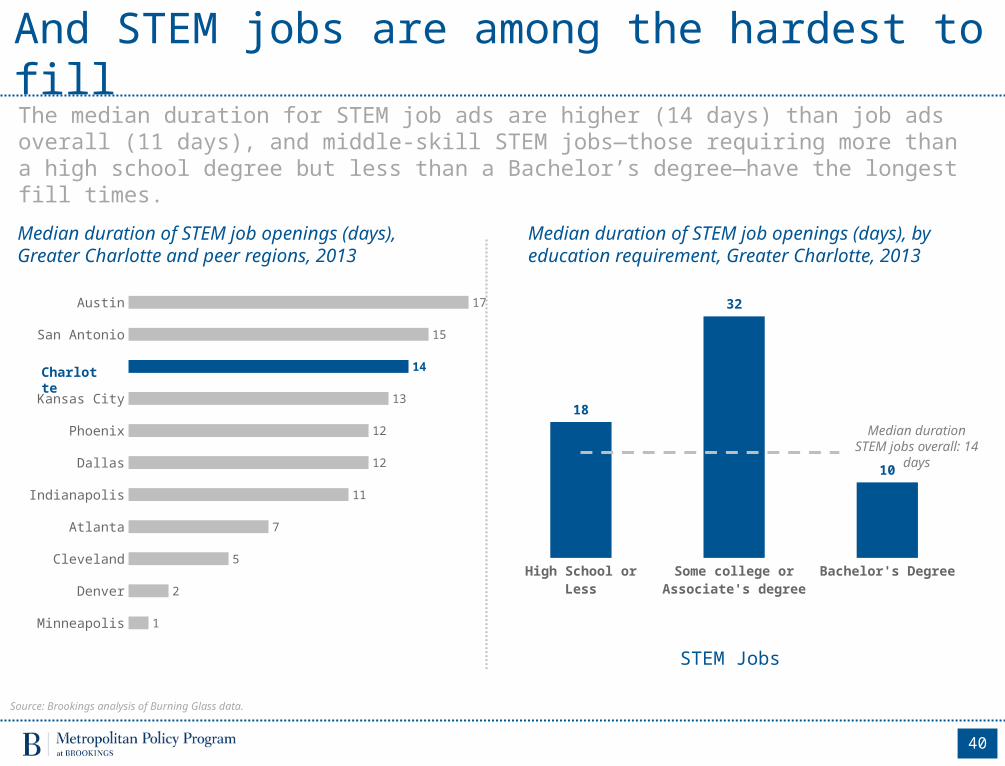
The median duration for STEM job ads are higher (14 days) than job ads overall (11 days), and middle-skill STEM jobs—those requiring more than a high school degree but less than a Bachelor’s degree—have the longest fill times.
Median duration of STEM job openings (days), by education requirement, Greater Charlotte, 2013
Median duration of STEM job openings (days), Greater Charlotte and peer regions, 2013
Charlotte
High School o
r Les
s
Some colle
ge or A
ssocia
te's d
egree
Bachelo
r's Deg
ree
18
32
10
Median duration STEM jobs overall: 14 days
STEM Jobs
Source: Brookings analysis of Burning Glass data.
StockholmFrankfurt
MunichCleveland
Atlanta
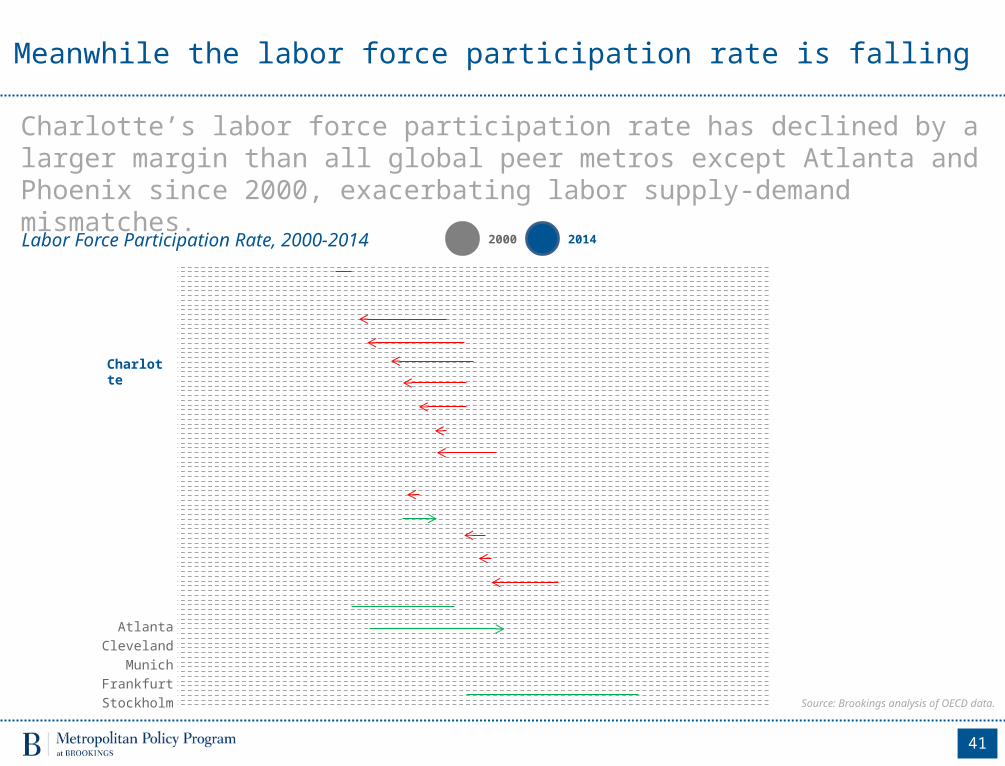
Meanwhile the labor force participation rate is falling
41
Charlotte’s labor force participation rate has declined by a larger margin than all global peer metros except Atlanta and Phoenix since 2000, exacerbating labor supply-demand mismatches.
Labor Force Participation Rate, 2000-2014
Charlotte
20142000
Source: Brookings analysis of OECD data.

ClevelandIndianapolisKansas City
MinneapolisSan Antonio
DenverAtlanta
Birmingham (UK)HamburgPhoenix
CopenhagenAustinDallas
FrankfurtStockholm
MunichMontreal
ZurichMelbourne
5.7%
6.0%
6.4%
9.4%
9.7%
11.8%
12.1%
13.2%
13.4%
14.2%
14.4%
14.5%
14.8%
17.5%
19.6%
20.0%
21.4%
25.2%
25.9%
37.4%
Immigration can help address skills demands
42
Immigrants further economic growth by matching their skills with the demands of local employers. While the share of its population born abroad is relatively low, Charlotte is an emerging immigrant gateway, passing 250,000 immigrants in 2014. And in-migrants, whether from other states or abroad, are relatively well-educated.
Educational attainment, by migration status, Greater Charlotte, 2014
Foreign-born share of total population, Greater Charlotte and peer regions, 2013
Charlotte
14.8%
8.0%
13.1%
20.8%
20.4%
25.1%
20.6%
28.6%
30.4%
43.8%
43.0%
31.4%
Less than high schoolHigh school graduateSome college or associate's degreeBachelor's degree or higher
Overall population
Migrated from:
Another U.S. state
Abroad
Source: Brookings analysis of U.S. Census Bureau data.
San Antonio
Indianapolis
Kansas City
Cleveland
Denver
Phoenix
Minneapolis
Atlanta
Dallas
Austin
1.39
1.43
1.53
1.78
1.79
1.86
2.44
2.72
3.63
3.65
3.94
And employers are demanding international talent
43
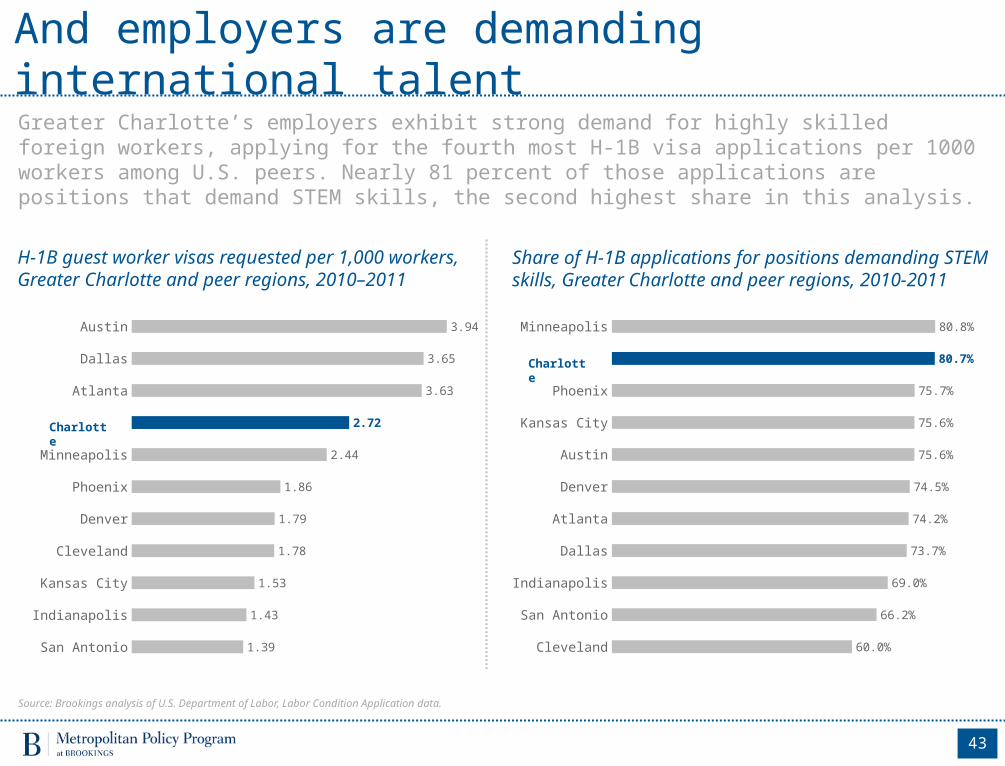
Greater Charlotte’s employers exhibit strong demand for highly skilled foreign workers, applying for the fourth most H-1B visa applications per 1000 workers among U.S. peers. Nearly 81 percent of those applications are positions that demand STEM skills, the second highest share in this analysis.
Share of H-1B applications for positions demanding STEM skills, Greater Charlotte and peer regions, 2010-2011
H-1B guest worker visas requested per 1,000 workers, Greater Charlotte and peer regions, 2010–2011
Charlotte
Cleveland
San Antonio
Indianapolis
Dallas
Atlanta
Denver
Austin
Kansas City
Phoenix
Minneapolis
60.0%
66.2%
69.0%
73.7%
74.2%
74.5%
75.6%
75.6%
75.7%
80.7%
80.8%
Charlotte
Source: Brookings analysis of U.S. Department of Labor, Labor Condition Application data.

San Antonio
Phoenix
Kansas City
Indianapolis
Cleveland
Minneapolis
Atlanta
Austin
Denver
Dallas
10.6
11.3
11.9
12.3
12.7
14.0
14.5
16.1
16.9
21.3
22.5
Foreign students are another potential talent source
44
Foreign students enhance an economy’s global engagement by injecting spending into the local economy, establishing connections with their home market, and staying to local to work upon graduation. Currently, Charlotte has fewer foreign students at its colleges and universities than many of its peer regions. F1 student visas approved per 1,000 higher education students, Greater Charlotte and peer regions, 2008–2012
Charlotte
India – 742China - 641
Saudi Arabia - 464
South Korea - 239Canada - 162
Top origin markets for F1 student visas, Greater Charlotte, 2008–2012
Source: Brookings analysis of Immigration and Customs Enforcement data.
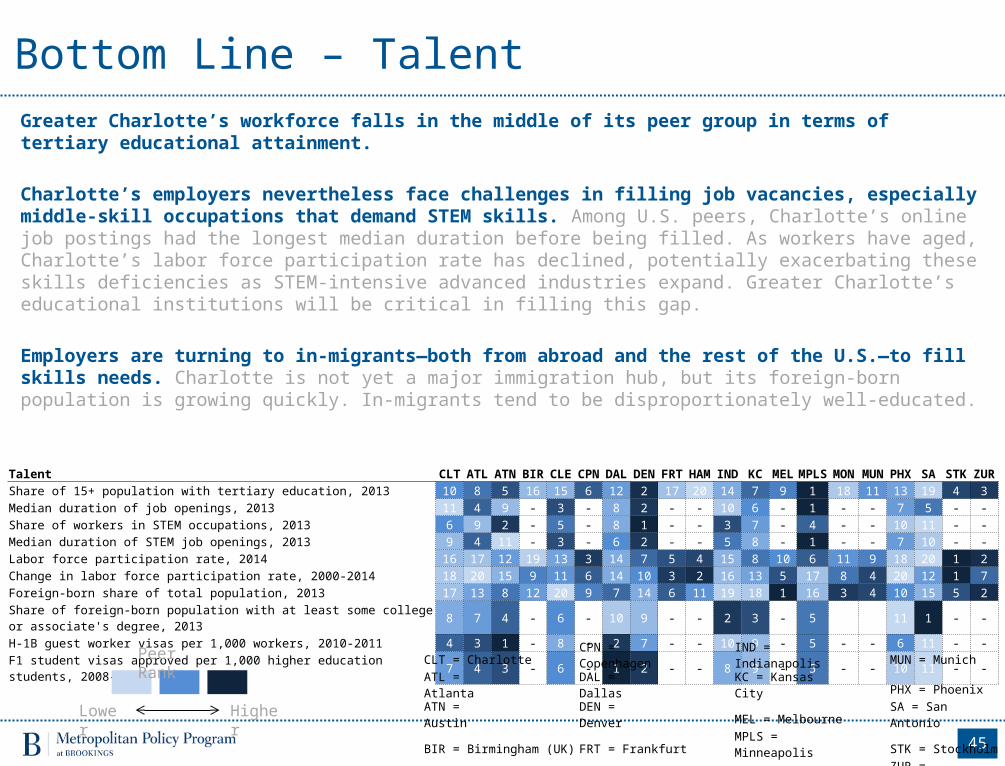
Bottom Line – Talent
45
Greater Charlotte’s workforce falls in the middle of its peer group in terms of tertiary educational attainment.
Charlotte’s employers nevertheless face challenges in filling job vacancies, especially middle-skill occupations that demand STEM skills. Among U.S. peers, Charlotte’s online job postings had the longest median duration before being filled. As workers have aged, Charlotte’s labor force participation rate has declined, potentially exacerbating these skills deficiencies as STEM-intensive advanced industries expand. Greater Charlotte’s educational institutions will be critical in filling this gap.
Employers are turning to in-migrants—both from abroad and the rest of the U.S.—to fill skills needs. Charlotte is not yet a major immigration hub, but its foreign-born population is growing quickly. In-migrants tend to be disproportionately well-educated.
Talent CLT ATL ATN BIR CLE CPN DAL DEN FRT HAM IND KC MEL MPLS MON MUN PHX SA STK ZURShare of 15+ population with tertiary education, 2013 10 8 5 16 15 6 12 2 17 20 14 7 9 1 18 11 13 19 4 3Median duration of job openings, 2013 11 4 9 - 3 - 8 2 - - 10 6 - 1 - - 7 5 - -Share of workers in STEM occupations, 2013 6 9 2 - 5 - 8 1 - - 3 7 - 4 - - 10 11 - -Median duration of STEM job openings, 2013 9 4 11 - 3 - 6 2 - - 5 8 - 1 - - 7 10 - -Labor force participation rate, 2014 16 17 12 19 13 3 14 7 5 4 15 8 10 6 11 9 18 20 1 2Change in labor force participation rate, 2000-2014 18 20 15 9 11 6 14 10 3 2 16 13 5 17 8 4 20 12 1 7Foreign-born share of total population, 2013 17 13 8 12 20 9 7 14 6 11 19 18 1 16 3 4 10 15 5 2Share of foreign-born population with at least some college or associate's degree, 2013 8 7 4 - 6 - 10 9 - - 2 3 - 5 11 1 - -H-1B guest worker visas per 1,000 workers, 2010-2011 4 3 1 - 8 - 2 7 - - 10 9 - 5 - - 6 11 - -F1 student visas approved per 1,000 higher education students, 2008-2012 7 4 3 - 6 - 1 2 - - 8 9 - 5 - - 10 11 - -
Lower Higher
Peer Rank CLT = Charlotte CPN = Copenhagen IND = Indianapolis MUN = MunichATL = Atlanta DAL = Dallas KC = Kansas City PHX = PhoenixATN = Austin DEN = Denver MEL = Melbourne SA = San AntonioBIR = Birmingham (UK) FRT = Frankfurt MPLS = Minneapolis STK = StockholmCLE = Cleveland HAM = Hamburg MON = Montreal ZUR = Zurich

5 | Infrastructure

Why infrastructure matters
47
Firms rely upon global access points like airports and ports and digital infrastructure to move their products, services, and people to markets outside the region in the most efficient manner possible.
The competitiveness of a metropolitan economy also hinges on its ability to effectively connect its people and physical assets to their best use within the region—what planners and economic developers call “spatial efficiency.”
Source: For a full review of the role of infrastructure in metropolitan growth, see George Washington Institute of Public Policy and RW Ventures, “Implementing Regionalism.”

CLT is a fast-growing, well-connected airportIn 2015, the Charlotte-Douglas International Airport moved 44.9 million passengers between Charlotte and 147 destinations, the 24th highest total in the world. Passenger growth was among the fastest in its global peer group between 2004 and 2014.
48
44.9 millionCLT’s total passengers, 2015
24th CLT’s global rank, 2015
ClevelandIndianapolisKansas CityPhoenixDallasMinneapolisAtlantaSan AntonioFrankfurtMunichMontrealDenverBirmingham (UK)HamburgAustinZurich
StockholmCopenhagenMelbourne
-20.3%-7.2%
-3.8%3.6%
10.2%12.2%
16.2%19.4%21.7%
33.1%42.0%42.5%
45.3%46.0%48.0%
55.5%59.9%
65.1%65.4%
72.7%
Origin-destination aviation passenger growth, Greater Charlotte and peer regions, 2004-2014
Charlotte
Source: Brookings analysis of Sabre aviation data.

Int’l passenger connections strongest with EuropeInternational origin-destination flows are largest with the rest of North America (Toronto, Mexico City, Montreal); Europe (London, Frankfurt, Munich, Paris); and Asia (Shanghai, Tokyo, Delhi, and Seoul). Growth has been fastest with South America, Africa, and Asia.
49
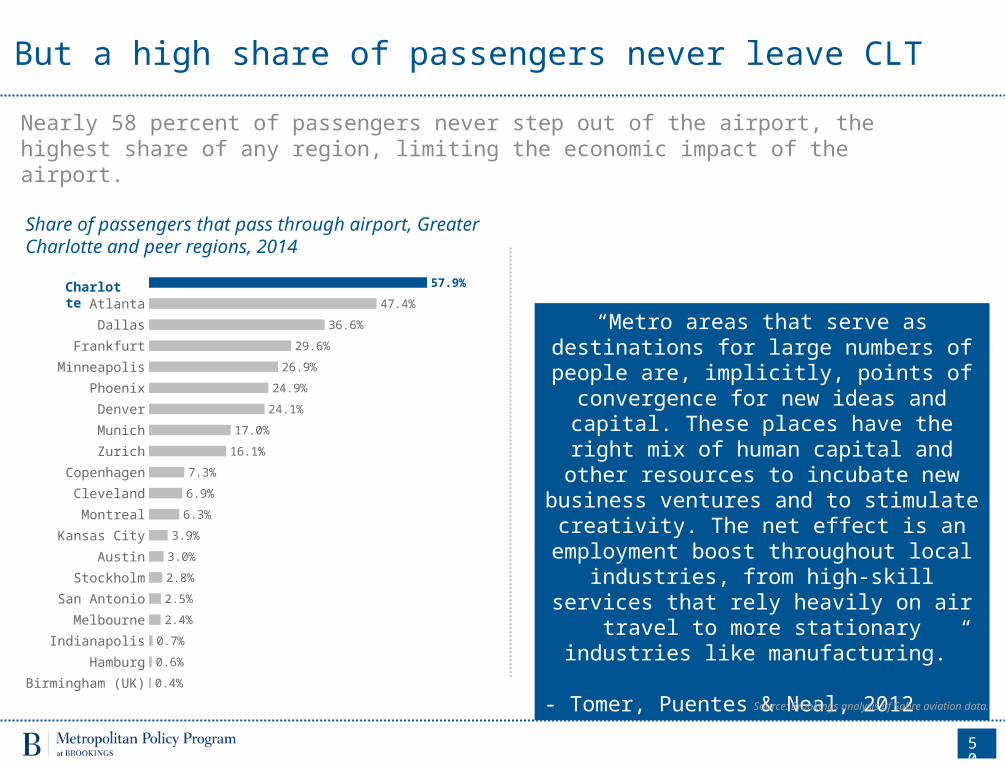
But a high share of passengers never leave CLTNearly 58 percent of passengers never step out of the airport, the highest share of any region, limiting the economic impact of the airport.
50
Birmingham (UK)Hamburg
IndianapolisMelbourne
San AntonioStockholm
AustinKansas City
MontrealCleveland
CopenhagenZurich
MunichDenver
PhoenixMinneapolis
FrankfurtDallas
Atlanta
0.4%
0.6%
0.7%
2.4%
2.5%
2.8%
3.0%
3.9%
6.3%
6.9%
7.3%
16.1%
17.0%
24.1%
24.9%
26.9%
29.6%
36.6%
47.4%
57.9%Charlotte
Share of passengers that pass through airport, Greater Charlotte and peer regions, 2014
“Metro areas that serve as destinations for large numbers of people are, implicitly, points
of convergence for new ideas and capital. These places have the right mix of human
capital and other resources to incubate new business ventures and to stimulate creativity.
The net effect is an employment boost throughout local industries, from high-skill
services that rely heavily on air travel to more stationary industries like manufacturing.”
- Tomer, Puentes & Neal, 2012
Source: Brookings analysis of Sabre aviation data.

Charlotte trades about $130 billion in goods$130 billion in goods trade (domestic + international) starts or ends in Greater Charlotte, nearly 12 percent of which flows globally. Greater Charlotte firms rely on ports in other U.S. regions to send and receive international goods.
51
Largest port complexes used for Greater Charlotte’s international goods trade, billions USD, 2010
$130 billionTotal goods trade value, 33/100 U.S. metros
11.7%International trade share, 67/100 U.S. metros
Port Complex Total Trade (billions USD)
New York 2.2
Los Angeles 1.7
Miami 1.1
Detroit 1.1
Laredo 0.7
Houston 0.7
Savannah 0.5
Anchorage 0.5
Chicago 0.5
Buffalo 0.4
Source: Brookings analysis of Economic Development Research Group data.

Greater Charlotte is not yet a major port complexThe region is not a major international port, ranking behind most U.S. peers in terms of freight flow. Of the $2.7 billion in international freight that moved through Greater Charlotte’s ports in 2010, 99.7% travels via air, mainly higher value commodities.
52
Top 5 commodities moved by Greater Charlotte’s port complex, millions USD, 2010
$833.9
$535.2
$438.8
$301.8 $293.2
San Antonio
Kansas City
Austin
Phoenix
Indianapolis
Denver
Minneapolis
Cleveland
Atlanta
Dallas
$184
$449
$569
$800
$2,669
$3,830
$4,474
$5,591
$19,404
$26,736
$33,868
Total international freight movement, Greater Charlotte and peer port complexes, millions USD, 2010
Charlotte
Source: Brookings analysis of Economic Development Research Group data.

Broadband speeds lag and access varies by incomeQuality broadband access allows students, workers, and firms to benefit from the power of the internet. Charlotte’s average download speeds trail most peers; overall broadband access is average and varies significantly by income.
53
Internet download speed, mbps, 2015 Share of households with broadband access, 2014
Broadband access, by income, 2014
Source: Brookings analysis of data from Ookla and U.S. Census Bureau.

Commuting times in Charlotte are about averageTransportation networks connect firms to global access points like airports and ports, shuttle workers to jobs, and facilitate intra-metro commerce and collaboration. Greater Charlotte’s average commuting times fall in the middle of its peer group, suggesting that the proximity between workers and jobs is not a significant weakness but could still be improved.
54
Distribution of travel time to work for all commuters*, minutes, 2014
Atlanta
Dallas
Denver
Austin
Phoenix
Minneapolis
San Antonio
Indianapolis
Cleveland
Kansas City
8%
10%
9%
11%
10%
11%
11%
11%
12%
11%
13%
10%
12%
11%
13%
13%
13%
13%
13%
13%
13%
14%
33%
36%
38%
39%
38%
39%
40%
41%
39%
40%
42%
25%
25%
26%
23%
25%
23%
23%
22%
24%
24%
21%
12%
10%
9%
8%
9%
8%
8%
7%
7%
7%
6%
12%
8%
7%
7%
6%
6%
5%
6%
5%
5%
4%
0 to 19 minutes 0 to 14 minutes 15 to 29 minutes 30 to 44 minutes 45 to 59 minutes 60+ minutes
Charlotte
Source: Brookings analysis of U.S. Census Bureau data.

Bottom Line – Infrastructure
55
The Charlotte-Douglas International Airport is a significant global asset. It is one of the fastest-growing airports among Charlotte’s peer regions. However, a high share of passengers never leave the airport, limiting its impact on the local economy.
The airport also anchors freight movement, although Greater Charlotte is not yet a significant port complex. The region tends to rely on the nation’s largest ports to send and receive goods internationally, underscoring the importance of the new intermodal facility at the airport.
Digital infrastructure quality and access could be improved. Charlotte’s average internet download speeds trail most peers, and access varies significantly by income.
Infrastructure CLT ATL ATN BIR CLE CPN DAL DEN FRT HAM IND KC MEL MPLS MON MUN PHX SA STK ZURAviation passenger growth, 2004-2014 4 14 6 8 20 2 16 9 12 7 19 18 1 15 10 11 17 13 3 5Share of passthrough aviation traffic, 2014 20 19 7 1 10 11 18 14 17 2 3 8 4 16 9 13 15 5 6 12Total international freight movement, 2010 7 2 9 - 3 - 1 5 - - 6 10 - 4 - - 8 11 - -Internet download speed, 2015 18 10 3 8 20 4 13 12 9 6 14 5 19 15 16 11 7 17 2 1Share of hosueholds with broadband access, 2014 6 4 1 - 10 - 7 2 - - 9 5 - 3 - - 8 11 - -Share of commuters traveling more than 45 minutes to work, 2014 6 11 8 - 2 - 10 9 - - 3 1 - 5 - - 7 4 - -
Lower Higher
Peer RankCLT = Charlotte CPN = Copenhagen IND = Indianapolis MUN = Munich
ATL = Atlanta DAL = Dallas KC = Kansas City PHX = Phoenix
ATN = Austin DEN = Denver MEL = Melbourne SA = San Antonio
BIR = Birmingham (UK) FRT = Frankfurt MPLS = Minneapolis STK = Stockholm
CLE = Cleveland HAM = Hamburg MON = Montreal ZUR = Zurich

Bottom Line – Charlotte’s competitive position
56
Economic performance: Overall economic growth has been robust over the past decade, but on metrics of inclusion Greater Charlotte has lagged.
Trade and Investment: Greater Charlotte is very globally-oriented. Exports and foreign direct investment account for a disproportionate share of the regional economy, led by tradable anchors like machinery, transportation equipment, and financial services.
But the region is at risk of losing ground to peer metropolitan economies unless it shores up its competitive drivers:
• Innovation: Build up very low levels of research and development, technology commercialization, and venture capital investment;
• Talent: Help employers overcome challenges in filling job vacancies, especially occupations that require STEM skills; and
• Infrastructure: Address lagging broadband speeds and disparities in broadband access by income.
Conclusion
57
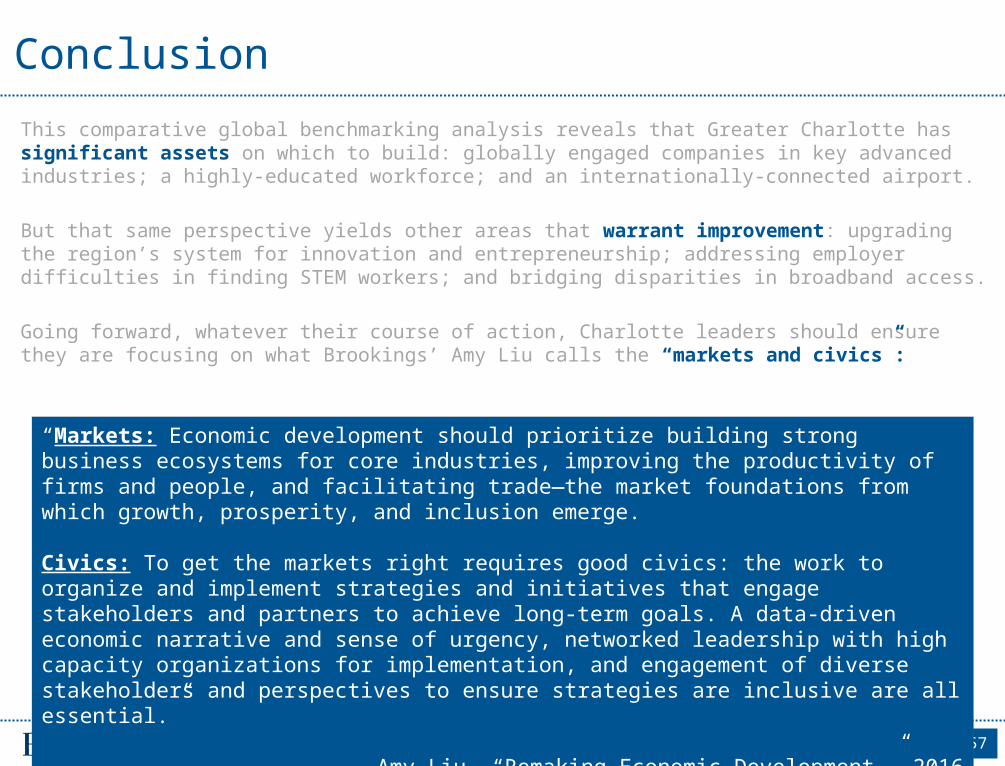
This comparative global benchmarking analysis reveals that Greater Charlotte has significant assets on which to build: globally engaged companies in key advanced industries; a highly-educated workforce; and an internationally-connected airport.
But that same perspective yields other areas that warrant improvement: upgrading the region’s system for innovation and entrepreneurship; addressing employer difficulties in finding STEM workers; and bridging disparities in broadband access.
Going forward, whatever their course of action, Charlotte leaders should ensure they are focusing on what Brookings’ Amy Liu calls the “markets and civics”:
“Markets: Economic development should prioritize building strong business ecosystems for core industries, improving the productivity of firms and people, and facilitating trade—the market foundations from which growth, prosperity, and inclusion emerge.
Civics: To get the markets right requires good civics: the work to organize and implement strategies and initiatives that engage stakeholders and partners to achieve long-term goals. A data-driven economic narrative and sense of urgency, networked leadership with high capacity organizations for implementation, and engagement of diverse stakeholders and perspectives to ensure strategies are inclusive are all essential.”
- Amy Liu, “Remaking Economic Development,” 2016
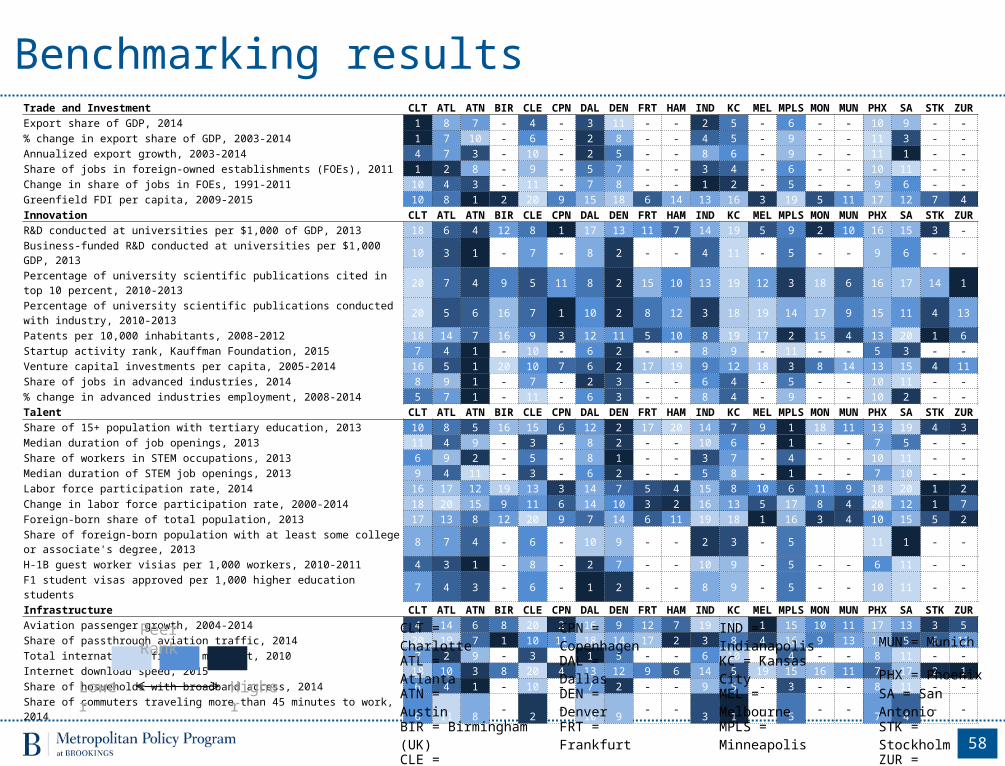
Benchmarking results
58
Trade and Investment CLT ATL ATN BIR CLE CPN DAL DEN FRT HAM IND KC MEL MPLS MON MUN PHX SA STK ZURExport share of GDP, 2014 1 8 7 - 4 - 3 11 - - 2 5 - 6 - - 10 9 - -% change in export share of GDP, 2003-2014 1 7 10 - 6 - 2 8 - - 4 5 - 9 - - 11 3 - -Annualized export growth, 2003-2014 4 7 3 - 10 - 2 5 - - 8 6 - 9 - - 11 1 - -Share of jobs in foreign-owned establishments (FOEs), 2011 1 2 8 - 9 - 5 7 - - 3 4 - 6 - - 10 11 - -Change in share of jobs in FOEs, 1991-2011 10 4 3 - 11 - 7 8 - - 1 2 - 5 - - 9 6 - -Greenfield FDI per capita, 2009-2015 10 8 1 2 20 9 15 18 6 14 13 16 3 19 5 11 17 12 7 4Innovation CLT ATL ATN BIR CLE CPN DAL DEN FRT HAM IND KC MEL MPLS MON MUN PHX SA STK ZURR&D conducted at universities per $1,000 of GDP, 2013 18 6 4 12 8 1 17 13 11 7 14 19 5 9 2 10 16 15 3 -Business-funded R&D conducted at universities per $1,000 GDP, 2013 10 3 1 - 7 - 8 2 - - 4 11 - 5 - - 9 6 - -Percentage of university scientific publications cited in top 10 percent, 2010-2013 20 7 4 9 5 11 8 2 15 10 13 19 12 3 18 6 16 17 14 1Percentage of university scientific publications conducted with industry, 2010-2013 20 5 6 16 7 1 10 2 8 12 3 18 19 14 17 9 15 11 4 13Patents per 10,000 inhabitants, 2008-2012 18 14 7 16 9 3 12 11 5 10 8 19 17 2 15 4 13 20 1 6Startup activity rank, Kauffman Foundation, 2015 7 4 1 - 10 - 6 2 - - 8 9 - 11 - - 5 3 - -Venture capital investments per capita, 2005-2014 16 5 1 20 10 7 6 2 17 19 9 12 18 3 8 14 13 15 4 11Share of jobs in advanced industries, 2014 8 9 1 - 7 - 2 3 - - 6 4 - 5 - - 10 11 - -% change in advanced industries employment, 2008-2014 5 7 1 - 11 - 6 3 - - 8 4 - 9 - - 10 2 - -Talent CLT ATL ATN BIR CLE CPN DAL DEN FRT HAM IND KC MEL MPLS MON MUN PHX SA STK ZURShare of 15+ population with tertiary education, 2013 10 8 5 16 15 6 12 2 17 20 14 7 9 1 18 11 13 19 4 3Median duration of job openings, 2013 11 4 9 - 3 - 8 2 - - 10 6 - 1 - - 7 5 - -Share of workers in STEM occupations, 2013 6 9 2 - 5 - 8 1 - - 3 7 - 4 - - 10 11 - -Median duration of STEM job openings, 2013 9 4 11 - 3 - 6 2 - - 5 8 - 1 - - 7 10 - -Labor force participation rate, 2014 16 17 12 19 13 3 14 7 5 4 15 8 10 6 11 9 18 20 1 2Change in labor force participation rate, 2000-2014 18 20 15 9 11 6 14 10 3 2 16 13 5 17 8 4 20 12 1 7Foreign-born share of total population, 2013 17 13 8 12 20 9 7 14 6 11 19 18 1 16 3 4 10 15 5 2Share of foreign-born population with at least some college or associate's degree, 2013 8 7 4 - 6 - 10 9 - - 2 3 - 5 11 1 - -H-1B guest worker visias per 1,000 workers, 2010-2011 4 3 1 - 8 - 2 7 - - 10 9 - 5 - - 6 11 - -F1 student visas approved per 1,000 higher education students 7 4 3 - 6 - 1 2 - - 8 9 - 5 - - 10 11 - -Infrastructure CLT ATL ATN BIR CLE CPN DAL DEN FRT HAM IND KC MEL MPLS MON MUN PHX SA STK ZURAviation passenger growth, 2004-2014 4 14 6 8 20 2 16 9 12 7 19 18 1 15 10 11 17 13 3 5Share of passthrough aviation traffic, 2014 20 19 7 1 10 11 18 14 17 2 3 8 4 16 9 13 15 5 6 12Total international freight movement, 2010 7 2 9 - 3 - 1 5 - - 6 10 - 4 - - 8 11 - -Internet download speed, 2015 18 10 3 8 20 4 13 12 9 6 14 5 19 15 16 11 7 17 2 1Share of hosueholds with broadband access, 2014 6 4 1 - 10 - 7 2 - - 9 5 - 3 - - 8 11 - -Share of commuters traveling more than 45 minutes to work, 2014 6 11 8 - 2 - 10 9 - - 3 1 - 5 - - 7 4 - -
Lower Higher
CLT = Charlotte CPN = Copenhagen IND = Indianapolis MUN = MunichATL = Atlanta DAL = Dallas KC = Kansas City PHX = PhoenixATN = Austin DEN = Denver MEL = Melbourne SA = San AntonioBIR = Birmingham (UK) FRT = Frankfurt MPLS = Minneapolis STK = StockholmCLE = Cleveland HAM = Hamburg MON = Montreal ZUR = Zurich
Peer Rank

Peer Methodology
59
Global peer cities were selected based on economic characteristics and competitiveness factors. Classifying and identifying peers allows policymakers and stakeholders to better understand the position of their economies in a globalized context as well as to conduct constructive benchmarking.
To select peers we utilized a combination of principal components analysis (PCA), k-means clustering, and agglomerative hierarchical clustering. These commonly used data science techniques allowed us to group metro areas with their closest peers given a set of economic and competitiveness indicators. For this report we selected 14 economic variables: population, nominal GDP, real GDP per capita, productivity (defined as output per worker), total employment, share of the population in the labor force, and industry share of total GDP (8 sectors). We included seven additional variables that measure one of the four quantitative dimensions of the competitiveness analysis framework used in this report. The variables included are: share of the population with tertiary education (talent), stock of greenfield foreign direct investment (FDI) (trade), number of international passengers in 2014 (infrastructure), number of highly cited papers between 2010 and 2013 (innovation), mean citation score between 2010 and 2013 (innovation), and average internet download speed in 2014 (infrastructure).
Our analysis proceeded in three steps. First, we applied PCA to reduce the number of dimensions of our data by filtering variables that are highly interrelated while retaining as much variance as possible. PCA generates “components” by applying a linear transformation to all the variables. To successfully perform our clustering algorithm we selected the number of components that explain 80 to 90 percent of the variance of a dataset. For this report we selected the first seven components, which accounted for 84 percent of the total variation of the data. The second stage applied a k-means algorithm to the seven components, a process which calculates the distance of every observation in our dataset to each other, then generates a cluster centroid and assigns each data point to the closest cluster. K-means repeats this procedure until a local solution is found. This algorithm provides a good segmentation of our data and under most circumstances it is a sufficient method for partitioning data. However k-means sometimes generates clusters with multiple observations, thus obscuring some of the closest economic relationships between metro areas. To improve the results of k-means we implemented a third step, hierarchical clustering, which follows a similar approach to k-means. Hierarchical clustering calculates Euclidean distances to all other observations, but generates a more granular clustering that permits clearer peer-to-peer comparison.

Data Sources
Oxford Economics: Economic indicators as well as selected indicators corresponding to talent for non-U.S. metropolitan areas were provided by Oxford Economics (OE). Economic variable such as GDP, Gross Value Added (GVA), employment, unemployment rates, educational attainment, and industry-level employment and output were collected by OE from national statistics bureaus in each country or from providers such as Haver, ISI Emerging Markets, and Eurostat. Population estimates and the share of the foreign-born population were based on official population projections produced by national statistical agencies and or organizations such as Eurostat, adjusting migration assumptions on a case-by case basis. The study uses gross value added (GVA) and Gross Domestic Product (GDP) in nominal terms at purchasing power parity rates, and in real terms at 2009 prices and expressed in U.S. dollars. All the indicators were provided at the metropolitan level.
Moody’s Analytics: Economic indicators for U.S. metro areas were provided by Moody’s Analytics. Moody’s uses data published by the Bureau of Labor Statistics (BLS) and by the Bureau of Economic Analysis (BEA) to generate their estimates of employment and GDP at the county level. We aggregated those estimates to metropolitan areas using the current Census Bureau definition. For real GDP, both total and at the industry level, Moody’s provides 2009 chained dollars. For nominal analysis they report their estimates in current dollar.
60
Data Sources
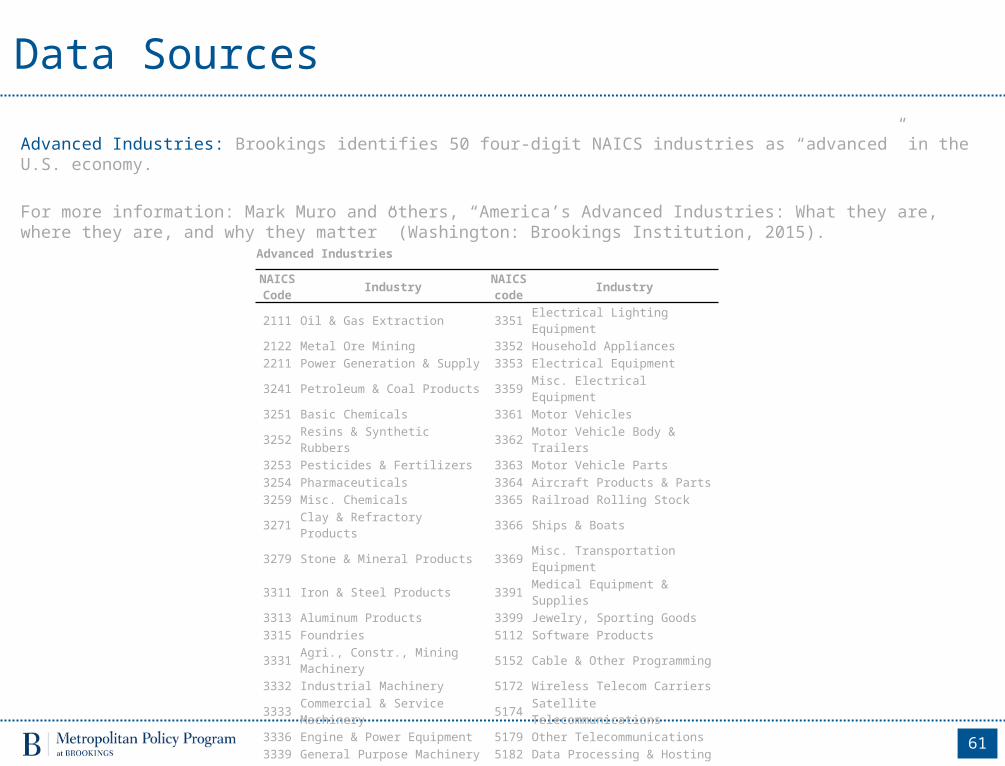
Advanced Industries: Brookings identifies 50 four-digit NAICS industries as “advanced” in the U.S. economy.
For more information: Mark Muro and others, “America’s Advanced Industries: What they are, where they are, and why they matter” (Washington: Brookings Institution, 2015).
61
Advanced Industries
NAICS Code Industry NAICS
code Industry
2111 Oil & Gas Extraction 3351 Electrical Lighting Equipment2122 Metal Ore Mining 3352 Household Appliances2211 Power Generation & Supply 3353 Electrical Equipment3241 Petroleum & Coal Products 3359 Misc. Electrical Equipment3251 Basic Chemicals 3361 Motor Vehicles3252 Resins & Synthetic Rubbers 3362 Motor Vehicle Body & Trailers3253 Pesticides & Fertilizers 3363 Motor Vehicle Parts3254 Pharmaceuticals 3364 Aircraft Products & Parts3259 Misc. Chemicals 3365 Railroad Rolling Stock3271 Clay & Refractory Products 3366 Ships & Boats3279 Stone & Mineral Products 3369 Misc. Transportation Equipment3311 Iron & Steel Products 3391 Medical Equipment & Supplies3313 Aluminum Products 3399 Jewelry, Sporting Goods3315 Foundries 5112 Software Products3331 Agri., Constr., Mining Machinery 5152 Cable & Other Programming3332 Industrial Machinery 5172 Wireless Telecom Carriers3333 Commercial & Service Machinery 5174 Satellite Telecommunications3336 Engine & Power Equipment 5179 Other Telecommunications3339 General Purpose Machinery 5182 Data Processing & Hosting3341 Computer Equipment 5191 News & Media3342 Communications Equipment 5413 Architecture & Engineering3343 Audio & Video Equipment 5415 Computer Systems Design3344 Semiconductors 5416 Management Consulting3345 Precision Instruments 5417 R&D Services3346 Magnetic & Optical Media 6215 Medical & Diagnostic Laboratories

Data SourcesExports: Export data are derived from a number of sources including: Census, BEA, Moody’s analytics, BLS, NAFSA, IRS, EIA, and Sabre. The estimates include both goods and services and are adjusted to reflect the export value-add at the point of production using the local share of national output to allocate national exports for each industry and county. For more information: Nick Marchio, “Brookings export database methodology” (Washington: Brookings Institution, 2015). www.brookings.edu/~/media/research/files/interactives/2015/export-monitor/brookingsexport-series-methodology-nm-5715.pdf
Foreign Direct Investment: Jobs in foreign-owned establishments are derived from data from Dun and Bradstreet (D&B), the National Establishment Time Series (NETS), and the Bureau of Economic Analysis (BEA). The estimates include all foreign investment activity into the United States between 1991 and 2011, excluding real estate and EB-5 investment. Brookings utilized Moody’s private-sector employment totals to calculate the shares of domestic jobs in foreign-owned establishments. For more information: Nick Marchio, “Methodological Appendix for FDI in U.S. Metro Areas: The Geography of Jobs in Foreign-Owned Establishments” (Washington: Brookings Institution, 2014). www.brookings.edu/~/media/research/files/reports/2014/06/20-fdi-us-metro-areas/method-appendix.pdf
The source of the greenfield FDI data is the Financial Times’ fDi Markets database. This database tracks all cross-border investment into new physical projects or expansions of an existing investment, otherwise known as “greenfield” investment. Company announcements form the basis for the database and each submission is manually verified before being published. In cases when the capital investment and job counts are not publicly released, analysts impute the value invested and jobs created using an econometric model. The primary sources of the data are newswires, internal sources, top business journals, industry organizations, investment agencies, and data purchased from private vendors. Brookings’ analysts assigned metro areas to the city-level information available in the database and processed the flows between different investor and recipient geographies and industry levels. The preferred metric is the cumulative stock of FDI invested and jobs created over the reference period from 2009 to 2015. All value measures were inflation-adjusted to 2014 dollars. For more information see http://www.fdimarkets.com/faqs/
62

Data SourcesPatents: Patents data are derived from the OECD’s REGPAT database. The OECD manages this database as part of the Patent Cooperation Treaty, which offers patent protection to organizations and individuals planning to do business in multiple countries. A number of research decisions went into the construction of the patent estimates. Patent locations correspond to the inventor’s place of residence or workplace. In cases when there are multiple inventors, the patent was apportioned in equal shares to each co-inventor. Patents that fall under multiple International Patent Classification (IPC) technology codes were also apportioned in equal shares to each technology class in order to account for the cross-cutting nature of technological development. To mitigate year-to-year fluctuations in invention activity, patents were summed in five-year intervals. The time dimensions represent the “priority year” when the patent was first filed. This year is closest to the actual date of invention and is the most relevant reference date when assessing an area’s technological activity at a specific point in time. Since patent filing is a costly and administratively burdensome process the analysis excludes patents submitted in 2013 and 2014 since patents filed in these years only account for a portion of patents actually invented and may bias places and organizations with better systems for shortening lag time between the date of invention and the application year.
For more information: Stephane Maraut and others, “The OECD REGPAT Database: A Presentation” (Paris:OECD, 2008). www.oecd.org/sti/inno/40794372.pdf
63

Data SourcesUniversity Research Impact: University scientific impact data come from the Centre for Science and Technology Studies (CWTS) at Leiden University. This publicly available database tracks bibliometric performance data for 750 universities with the largest publication output in internationally recognized journals. The database relies on the Thomson Reuters Web of Science citations indices which researchers cleansed, geocoded, and classified into fields of study. CWTS reports publications based on full-counting methods which gives equal weight to all publications from a university and fractional counting methods which apportion shares to each collaborator.
For more information: L. Waltman and others, “The Leiden Ranking 2011/2012: Data collection, indicators, and interpretation.” Journal of the American Society for Information Science and Technology 63(12), 2419–32. www.leidenranking.com/methodology
Venture Capital: Venture capital data are derived from PitchBook, a private financial research firm that collects and tracks global private equity activity. PitchBook analysts deploy web crawlers to perform a daily systematic scan of media reports and public filing information on deals which they then record and validate through a manual review process. In assembling their database they include address-level data for both investors and recipient companies, industry, investor details along with the deal value. Brookings took the data and then assigned the investors and recipients to metropolitan geographies. The primary statistic in the analysis is the cumulative stock of venture capital which is the sum total of year-to-year investment flows. Secondary statistics examine the number of investors and companies along with data between different geographies, deal categories, and industries. The advanced industries classification is an approximate grouping based of detailed industry categories matched to Brookings’ NAICS-based definition. All value measures were inflation-adjusted to 2014 dollars.
For more information: http://blog.pitchbook.com/wp-content/uploads/2014/06/3Q-2014-PEBreakdown-Methodology.pdf
64

Data SourcesAviation: Aviation data are derived from Sabre Aviation Solutions’ global demand dataset (GDD). The dataset includes a record for every international itinerary entering and leaving the United States or any large global metro area with output of at least $100 billion in 2014. Each record includes the origin and destination airports, plus up to three connecting airports with the number of passengers and total revenue generated from that specific itinerary for that year. The GDD is based on a variety of sources including information developed from direct business relations between Sabre and over 400 global airlines. For international itineraries not reflected in their database, Sabre imputes missing flights and passenger levels based on additional market data. The result is a complete dataset of travel into and out of major global aviation centers. Brookings assigned all airports to global metropolitan areas, obtained latitude and longitude coordinates to derive distance measures, cleaned anomalous records, and aggregated the passenger and revenue flows to better facilitate regional analysis. All value measures were inflation-adjusted to 2014 dollars.
For more information: Adie Tomer, Robert Puentes, and Zachary Neal, “Global Gateways: International Aviation in Metropolitan America” (Washington: Brookings Institution, 2012). www.brookings.edu/~/media/research/files/reports/2012/10/25-global-aviation/25-globalaviation.pdf
Freight: This analysis uses a unique database measuring goods traded among U.S. metropolitan areas, nonmetropolitan regions, and international geographies. We used the data foundation and design scheme of the publicly available Freight Analysis Framework (FAF). The database provides a comprehensive view of freight movement to, from, and within the United States. Originally based on calendar year 2007, Version 3.2 has been provisionally updated to estimate 2010 total freight volumes, or flows, by annual tonnage, value, and ton-mileage. With an interest in showing domestic and international freight flows in, out, and among all of the country’s metropolitan areas, Brookings worked with the EDR Group to estimate freight movement across combined statistical areas (CBSAs). For more information: Adie Tomer, Robert Puentes, and Joseph Kane, “Metro-to-Metro: Global and Domestic Goods Trade in Metropolitan America” (Washington: Brookings Institution, 2013). www.brookings.edu/~/media/Research/Files/Reports/2013/10/21-metro-freight/SrvyMetroToMetro.pdf?la=en
65

AcknowledgementsThis report is made possible by funding from the Central Piedmont Community College. Special thanks go to Dr. Tony Zeiss and Mary Vickers-Koch for their support and guidance.
This presentation was prepared by Joseph Parilla, Senior Research Associate, Brookings Metropolitan Policy Program. For their research support and advice, he would like to thank Alan Berube, Jesus Leal Trujillo, and Nick Marchio.
ABOUT THE METROPOLITAN POLICY PROGRAM AT BROOKINGS The Metropolitan Policy Program at Brookings delivers research and solutions to help metropolitan leaders build an advanced economy that works for all. To learn more visit www.brookings.edu/metro.
FOR MORE INFORMATION Metropolitan Policy Program at Brookings 1775 Massachusetts Avenue, NW Washington, D.C. 20036-2188 Telephone: 202.797.6000 Fax: 202.797.6004 Website: www.brookings.edu
Joseph ParillaSenior Research AssociateMetropolitan Policy Program at Brookings [email protected]
The Brookings Institution is a private non-profit organization. Its mission is to conduct high quality, independent research and, based on that research, to provide innovative, practical recommendations for policymakers and the public. The conclusions and recommendations of any Brookings publication are solely those of its author(s), and do not reflect the views of the Institution, its management, or its other scholars. Brookings recognizes that the value it provides to any supporter is in its absolute commitment to quality, independence and impact. Activities supported by its donors reflect this commitment and the analysis and recommendations are not determined by any donation.
66