Embed Size (px)
Citation preview

Food Security and Conflict in Yemen: Evidence from Recent Surveys
Dr. Olivier EckerDevelopment Strategy and Governance DivisionInternational Food Policy Research Institute
IFPRI‐IFAD Workshop on “Decreasing Vulnerability to Conflict in MENA through Rural Development”; Sanaa, Yemen; 9 April 2013

1. Conceptual framework2. Conflict Impact at the national level: Findings from the Gallup
Yemen Poll 2007‐12 and a macro‐micro simulation analysis3. Food security response to conflict: Findings
from UNICEF’s Social Protection Monitoring (SPM) survey 2011
4. Drivers of household food security and childnutrition: Preliminary findings from theResults and Impact Management System(RIMS) survey of IFAD’s Dhamar ParticipatoryRural Development Project (DPRDP) 2012
5. Conclusion and outlook
Outline
Findings from recent small‐scale surveys

Conceptual Framework

The Food Security System
Source: Ecker & Breisinger (2012) – The Food Security System (IFPRI DP 1166).
Conflict
Shock
Macro‐economic crisis
Economic & physical access
Real income
Food Health
Nutrition

Conflict Impact atthe National Level

Economic Effects of Conflict Globally, one year of civil conflict is estimated to reduce a
country’s growth rate by 2.2%.1 For Arab countries, the average GDP per capita loss may be even higher, estimated at 3.5%.2
Even before the 2011 uprising, Yemen’s economic growth was sluggish, and food insecurity and malnutrition widespread.
Source: Based on data from the Gallup World Poll.
Yemen’s economy was hit hard in 2011:3 GDP contracted by about 11%. Gov. spending fell by 12%, and
transfers to households by 23%. Remittances declined by 10%.
But, recovery appears to beon the rise!
Source: (1) Collier & Hoeffler (2007). Civil War. In: Sandler & Hartley (eds.). Handbook of Defense Economics. (2) ESCWA (2010). Food security and Conflict in the ESCWA region. (3) IMF World Economic Outlook Database.
0
10
20
30
40
50
60
2007 2009 2010 2011 2012
Perceptions on political and economic conditions%
Confidence innational government
Satisfaction with standard of living
Growth in local economy expected
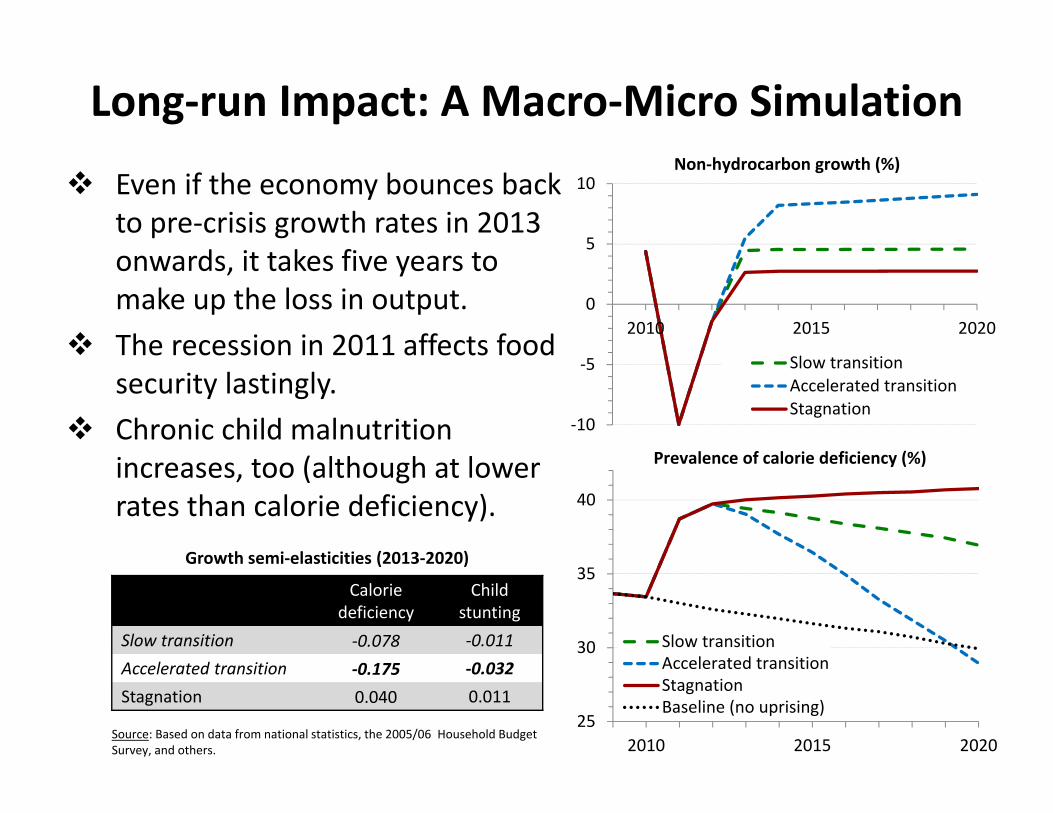
Long‐run Impact: A Macro‐Micro Simulation
Even if the economy bounces back to pre‐crisis growth rates in 2013 onwards, it takes five years to make up the loss in output.
The recession in 2011 affects food security lastingly.
Chronic child malnutrition increases, too (although at lower rates than calorie deficiency).
25
30
35
40
2010 2015 2020
Slow transitionAccelerated transitionStagnationBaseline (no uprising)
Prevalence of calorie deficiency (%)
Source: Based on data from national statistics, the 2005/06 Household Budget Survey, and others.
‐10
‐5
0
5
10
2010 2015 2020
Slow transitionAccelerated transitionStagnation
Non‐hydrocarbon growth (%)
Calorie deficiency
Child stunting
Slow transition ‐0.078 ‐0.011Accelerated transition ‐0.175 ‐0.032Stagnation 0.040 0.011
Growth semi‐elasticities (2013‐2020)

Conflict Zones

Food Security Responseto Conflict

Food Insecurity – Conflict Relationship Conflict aggravates household food insecurity immediately. Poor urban households are particularly vulnerable (likely due to
their dependence on markets for food). For food security of the individual household, the presence of
conflict in the neighborhood seems to matter more than the direct experience of conflict.
Coef. Std. Err.Exposure to conflictHousehold 1.100 0.233Neighborhood 3.399 0.484
Round ‐0.081 0.020Log likelihood ‐392.2Observations 1,303No. of HHs 95
Food insecurity—conflict fixed‐effects logit model
Source: Based on data from the UNICEF Social Protection Monitoring Survey (14‐round panel) from Sana’a (urban), Al‐Hodeidah (urban) and Amran (rural)
0
10
20
30
40
50
60
26 30 34 38 42 46 50
Households exposed to conflict (%)Household food insecurity (%)
Household food insecurity and exposure to conflict, 07 – 12, 2011
Drivers of Household Food Security and Child Nutrition
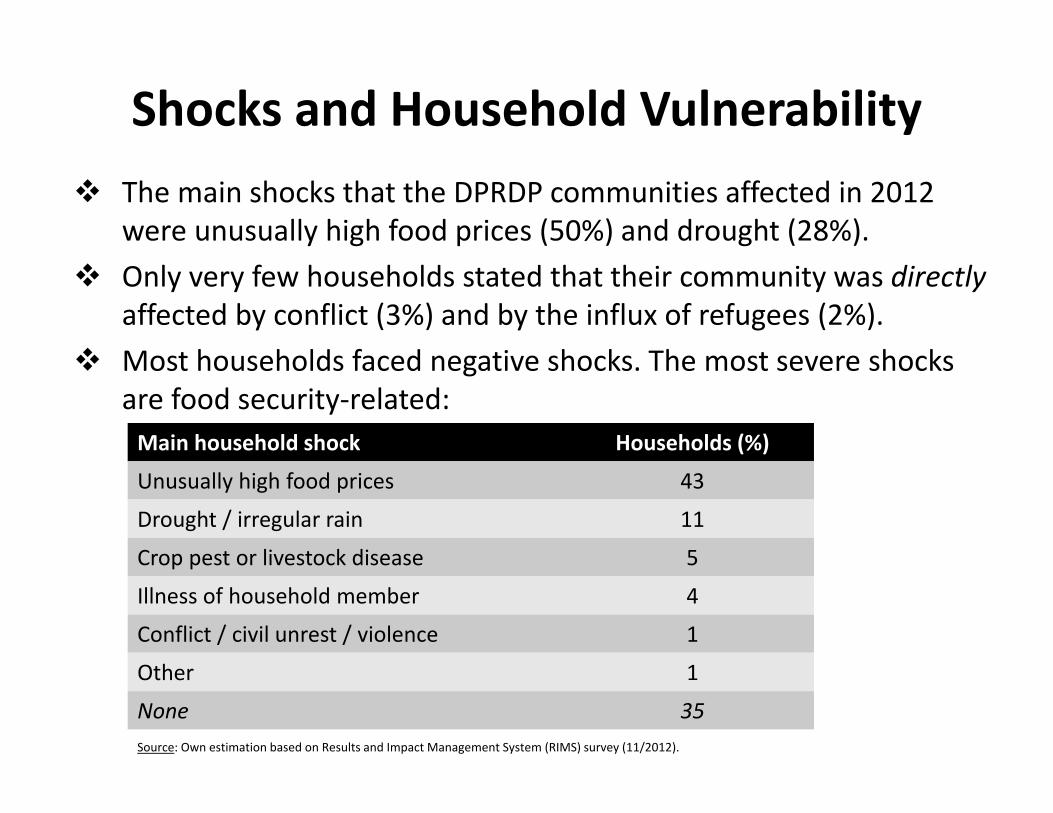
Shocks and Household Vulnerability
Source: Own estimation based on Results and Impact Management System (RIMS) survey (11/2012).
The main shocks that the DPRDP communities affected in 2012 were unusually high food prices (50%) and drought (28%).
Only very few households stated that their community was directlyaffected by conflict (3%) and by the influx of refugees (2%).
Most households faced negative shocks. The most severe shocks are food security‐related:Main household shock Households (%)
Unusually high food prices 43
Drought / irregular rain 11
Crop pest or livestock disease 5
Illness of household member 4
Conflict / civil unrest / violence 1
Other 1
None 35

Risk of Conflict and Malnutrition
Source: Own estimation based on Results and Impact Management System (RIMS) survey (11/2012).
Risk of conflict Most households (90%) consider their community and
surrounding communities as peaceful. Most households (90%) feel that violence has generally
decreased compared to one year ago.
Risk of malnutrition 11% of the households couldn’t afford to eat what they normally
eat, and, in 7% of the households, a person had to abandon a meal due to insufficient money for food purchases.
9% of the households admitted that they suffered from hunger, while seasonal hunger of an average duration of 3.6 months is most common.
Response bias (due to known project intervention goal) ?
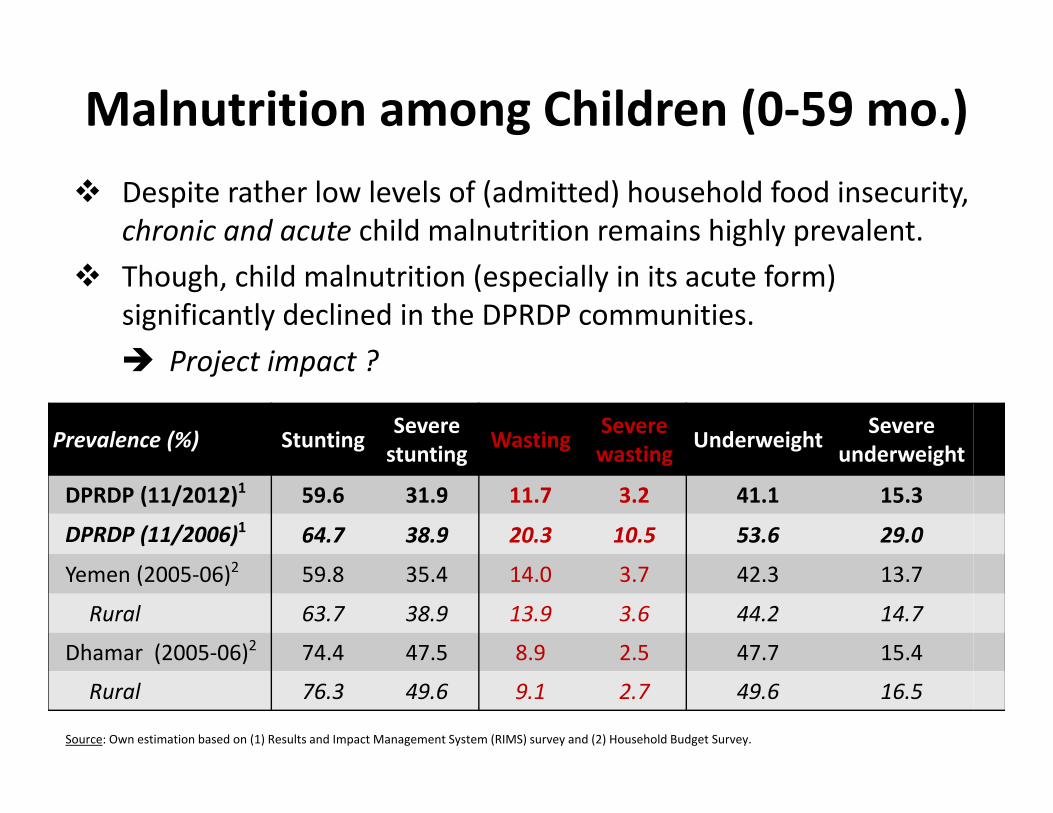
Malnutrition among Children (0‐59 mo.)
Source: Own estimation based on (1) Results and Impact Management System (RIMS) survey and (2) Household Budget Survey.
Despite rather low levels of (admitted) household food insecurity, chronic and acute child malnutrition remains highly prevalent.
Though, child malnutrition (especially in its acute form) significantly declined in the DPRDP communities. Project impact ?
Prevalence (%) Stunting Severe stunting Wasting Severe
wasting Underweight Severe underweight
DPRDP (11/2012)1 59.6 31.9 11.7 3.2 41.1 15.3
DPRDP (11/2006)1 64.7 38.9 20.3 10.5 53.6 29.0
Yemen (2005‐06)2 59.8 35.4 14.0 3.7 42.3 13.7
Rural 63.7 38.9 13.9 3.6 44.2 14.7
Dhamar (2005‐06)2 74.4 47.5 8.9 2.5 47.7 15.4
Rural 76.3 49.6 9.1 2.7 49.6 16.5

Factors of Dietary Diversity and Child Nutrition
Note: ***, **, *, † Coefficient is sta s cally significant at the 1%, 5%, 10%, and 15% level, respec vely. Source: Own estimation based on (1) Results and Impact Management System (RIMS) survey and (2) Household Budget Survey.
…DPRDP 2012 Household Dietary Diversity Score (max=12)
Child weight‐for‐heightz‐score
Household expenditure per capita (log) 1.470 *** 0.113 **
Wheat price (log) 0.210 ‐2.233 ***
Qat price (log) 0.177 0.468 ***
Household size (log) 1.134 *** ‐0.032
Household head can read (1=yes, 0=no) 0.340 *** 0.089
Farming (1=yes, 0=no) ‐1.103 *** ‐0.250 †
Cultivated area (log) 0.113 *** 0.035 *
Sex of child (1=female, 0=male) 0.085
Age of child (log) 0.090 **
Constant ‐4.817 5.966 *
Observations 900 1,040
F‐value 66.01 7.68
R‐squared 0.341 0.062

Conclusion and Outlook
Implications for Policy and Project Intervention
1. Conflict has substantial (indirect) effects on economic growth, food security, and nutrition in the short and long run.
2. Policies and interventions for improving food security strengthen households’ resilience to shocks, including conflict impacts.
3. Food security and nutrition are highly prone to income losses and food price spikes, so that farm and off‐farm income generation activities and measures to improve subsistence among poor farmers are key elements of rural development strategies and resilience‐building programs.
Implications – cont’d
4. IFAD’s DPRDP appears to have significantly contributed to reduce child malnutrition thanks to a comprehensive approach. Though to maintain high reduction rates in acute malnutrition and to reduce chronic malnutrition more rapidly, more nutrition‐specific interventions and more investments in health‐beneficial infrastructure will be increasingly needed.
5. The potential of leveraging agriculture for improving nutrition should be evaluated context‐specifically and exploited through e.g. nutrition awareness building, promotion of agricultural production diversification for improved dietary diversity, biofortification.
Next Steps1. Refine the food security and child nutrition model estimation of
the DPRDP analysis2. Expand the analysis to other IFAD projects and explore
complementary recent/forthcoming surveys Availability of additional data ?
3. Draft paper presenting final results