Embed Size (px)
Citation preview

Economic GrowthAround the World
Bhawani Nandan Prasad
MBA Marketing and Strategy

Effects of Growth
• Astounding material progress in the last 100 years
• Change reflects sustained growth of incomes per head
2

GDP or National Product
• National Income is measured by a country’s GDP or ‘Output’
• Facts about GDP and GDP growth:
3

4

5
Looking Across Two Millennia
Agreed findings:
• From the end of the Roman Empire to roughly year 1500, there was essentially no growth of output per capita in Europe.
• From about 1500 to 1700, growth of output per capita turned positive, about 0.1% per year
• On the scale of human history, the growth of output per capita is a recent phenomenon.

6
7
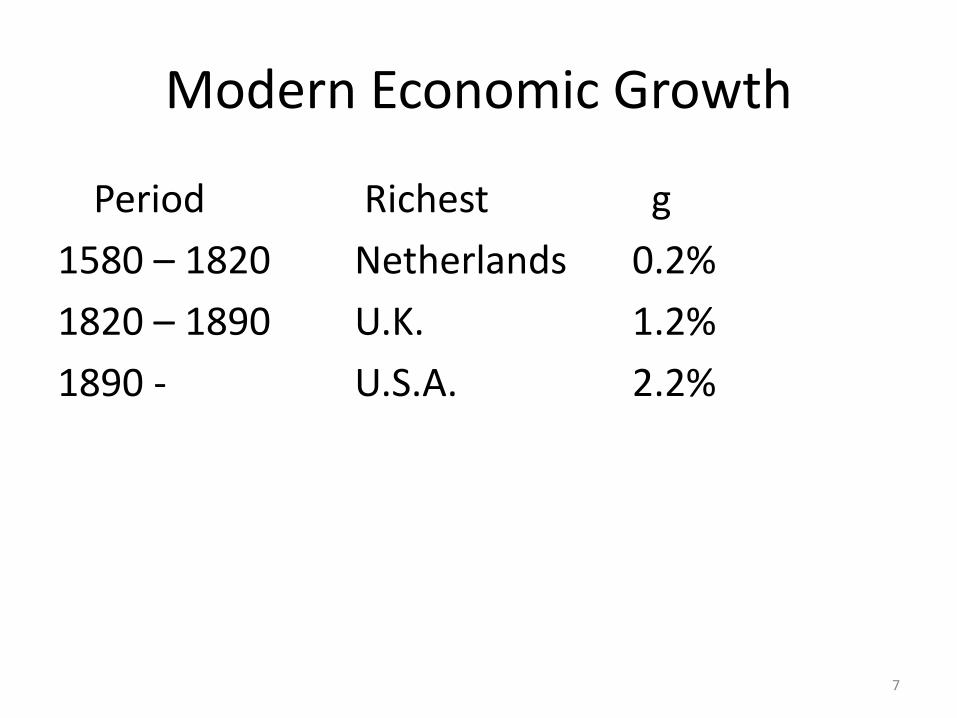
Modern Economic Growth
Period Richest g
1580 – 1820 Netherlands 0.2%
1820 – 1890 U.K. 1.2%
1890 - U.S.A. 2.2%

8
Post World War II
• 1948 -1972
Japan 8.2% Germany 5.7% U.S. 2.2%
• 1965-1990
Asian Tigers:
Japan, S. Korea, Singapore, HK, Thailand, Malaysia, Indonesia, Taiwan:
g = 5.5% for the group

9
Comparing Economies Across Time and Space

China-India comparison
10

11
Growth Arithmetic
The magic of compounding:
Even a small increase in the growth rate makes a big difference if it is sustained

Why growth matters
Anything that affects the long-run rate of economic growth – even by a tiny amount – will have huge
effects on living standards in the long run.
1,081.4%243.7%85.4%
624.5%169.2%64.0%
2.5%
2.0%
…100 years…50 years…25 years
percentage increase in
standard of living after…
annual growth rate
of income per capita
12
What is GDP, PPP?
• Use of GDP deflator to correct for nominal changes
• Use of PPP to correct for price inequalities
13

14

15

Rapidly Increasing Inequality
• Most important fact about global incomes:
• Enormous differences
• Growth rate differentials responsible for rapid increases in disparity
16

17

18

19

20

21

Table 7.1Mankiw: Macroeconomics, Sixth
22

23

24

25

Useful Links
• http://www.imf.org/external/datamapper/index.php
• http://data.worldbank.org/indicator/NY.GDP.PCAP.CD/countries/XD-XO?display=graph
26