Embed Size (px)
Citation preview

Augusto Lopez Claros, Director, Global Indicators Group
WTO, GenevaNovember 5, 2014
Global Indicators GroupDEVELOPMENT ECONOMICS
DOING BUSINESS 2015GOING BEYOND EFFICIENCY
1
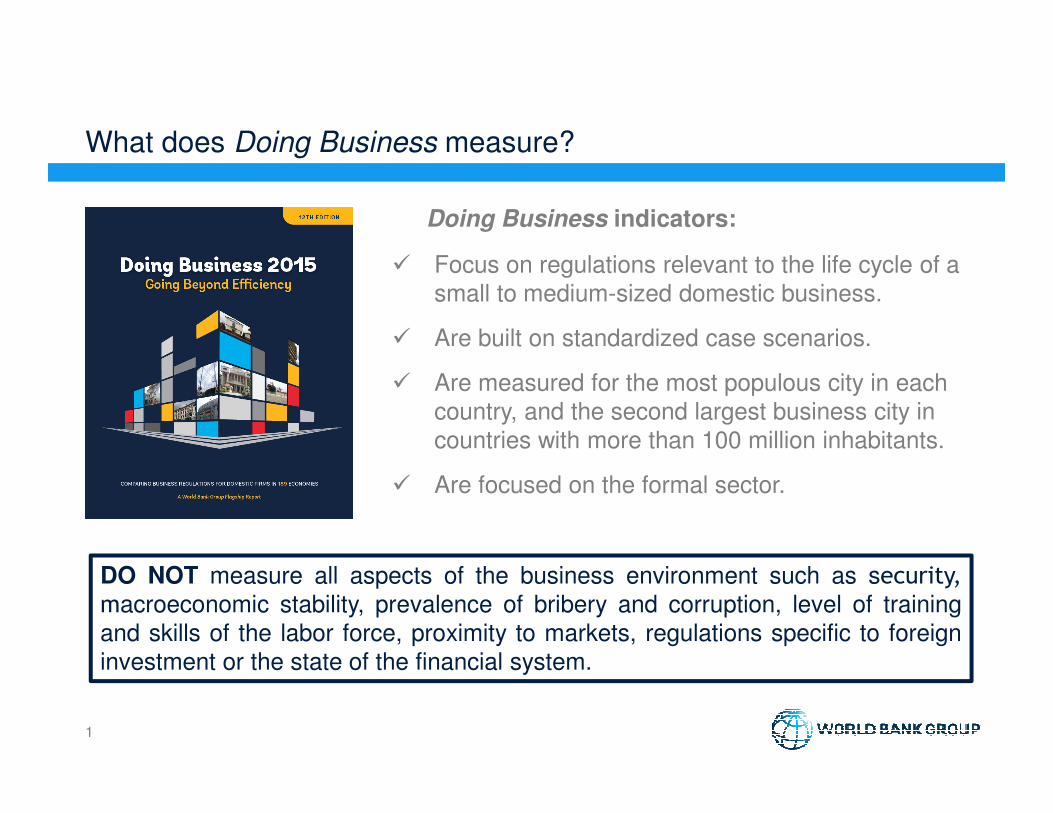
What does Doing Business measure?
Doing Business indicators:
� Focus on regulations relevant to the life cycle of a
small to medium-sized domestic business.
� Are built on standardized case scenarios.
� Are measured for the most populous city in each
country, and the second largest business city in
countries with more than 100 million inhabitants.
� Are focused on the formal sector.
DO NOT measure all aspects of the business environment such as security,
macroeconomic stability, prevalence of bribery and corruption, level of training
and skills of the labor force, proximity to markets, regulations specific to foreign
investment or the state of the financial system.

2
The 11 areas of business regulation measured by Doing Business
affect firms throughout their life cycle
At start-up• Starting a business• Labor market
regulation
In daily operations• Paying taxes• Trading across
borders
In getting financing• Getting credit• Protecting minority
investors
In getting a location• Dealing with
construction permits• Getting electricity• Registering property
When things go wrong• Enforcing contracts• Resolving
insolvency

Doing Business indicators reflect on some of the most important
obstacles firms face
3
• Based on Enterprise
Surveys in 135
countries around the
world
• Direct responses from
representative
samples of the private
sector
• Access to finance,
and tax rates are the
top obstacles across
the developing world
Source: Enterprise Surveys database
2.7%
3.5%
4.5%
6.7%
7.5%
10.0%
10.3%
12.0%
12.2%
16.7%
0% 2% 4% 6% 8% 10% 12% 14% 16% 18%
Business licensing and permits
Access to land
Crime, theft and disorder
Corruption
Inadequately educated workforce
Electricity
Political instability
Tax rates
Practices of the informal sector
Access to finance
Percent of firms identifying the problem as the main obstacle to their business activity
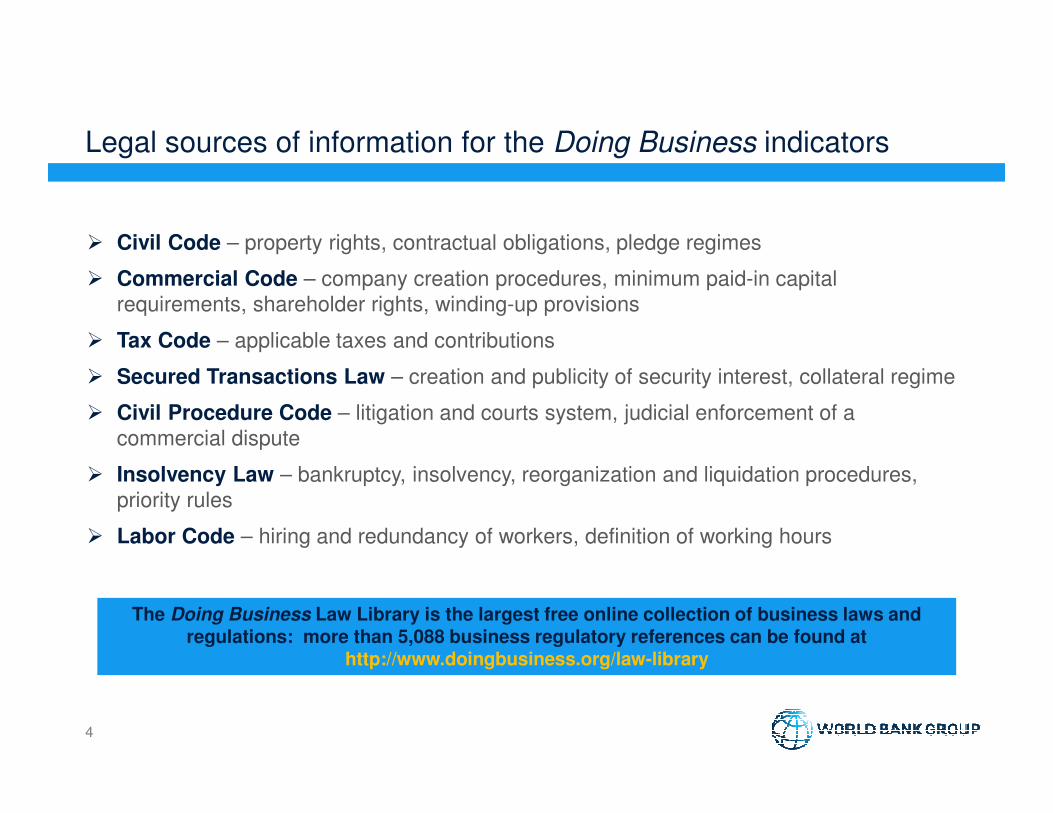
� Civil Code – property rights, contractual obligations, pledge regimes
� Commercial Code – company creation procedures, minimum paid-in capital
requirements, shareholder rights, winding-up provisions
� Tax Code – applicable taxes and contributions
� Secured Transactions Law – creation and publicity of security interest, collateral regime
� Civil Procedure Code – litigation and courts system, judicial enforcement of a
commercial dispute
� Insolvency Law – bankruptcy, insolvency, reorganization and liquidation procedures,
priority rules
� Labor Code – hiring and redundancy of workers, definition of working hours
The Doing Business Law Library is the largest free online collection of business laws and regulations: more than 5,088 business regulatory references can be found at
http://www.doingbusiness.org/law-library
Legal sources of information for the Doing Business indicators
4

Time and motion indicators focus on the processExample: The complexity and time it takes to register property varies significantly among economies
5
Registering property in Belgium requires 8 procedures, takes 64 days and costs 12.7% of the property value.
• Measure procedural efficiency of the regulatory process• Follow the entrepreneur from the beginning to the end of a basic transaction• Record every step of the process, and the associated time and cost• Gather all the relevant laws, regulations, decrees and fee schedules

Time and motion indicators focus on the processExample: The complexity and time it takes to register property varies significantly among economies
6
Registering property in Peru requires 4 procedures, takes 6.5 days and costs 3.3% of the property value.

Share of economies implementing at least one reform making it
easier to do business in 2013/2014
7
OECD high Income
Europe and Central Asia
Middle East and North Africa
South Asia
East Asia and Pacific
Sub-Saharan Africa
Latin America &
the Caribbean
Worldwide, 123 economies implemented 230 reforms in 2013/2014, with 145 reforms aimed at reducing the complexity and cost of complying with business regulation, and 85 reforms aimed at strengthening legal institutions.
74%
55%
50%
60%
65%
50%
85%

0
5
10
15
20
25
30
35
40
45
50
55
60
65
70
75
80
85
90
95
Ne
w Z
ea
lan
d
Ho
ng
Ko
ng
SA
R,
Ch
ina
Ire
lan
d
Ta
iwa
n,
Ch
ina
Ma
lay
sia
Sw
itze
rla
nd
Un
ite
d A
rab
Em
ira
tes
Ma
ced
on
ia,
FY
R
Sp
ain
Fra
nce
So
uth
Afr
ica
Mo
nte
ne
gro
Cze
ch R
ep
ub
lic
Rw
an
da
Arm
en
ia
Ro
ma
nia
Ba
hra
in
Co
lom
bia
Pa
na
ma
Be
laru
s
Hu
ng
ary
Luxe
mb
ou
rg
Cyp
rus
Ru
ssia
n F
ed
era
tio
n
Gre
ece
Cro
ati
a
Mo
rocc
o
Gh
an
a
Mo
ng
oli
a
Gu
ate
ma
la
Va
nu
atu
Ka
zakh
sta
n
Ko
sov
o
Mo
ldo
va
Do
min
ica
n R
ep
ub
lic
Jam
aic
a
Se
ych
ell
es
Aze
rba
ija
n
Tri
nid
ad
an
d T
ob
ag
o
Pa
rag
ua
y
Ch
ina
So
lom
on
Isl
an
ds
Sri
La
nk
a
Alb
an
ia
Uk
rain
e
Ind
on
esi
a
Nic
ara
gu
a
Leso
tho
Ira
n,
Isla
mic
Re
p.
Ma
rsh
all
Isl
an
ds
Ind
ia
Sie
rra
Le
on
e
Mo
zam
biq
ue
Ga
mb
ia,
the
Mic
ron
esi
a,
Fe
d.
Sts
.
Uzb
ek
ista
n
Bu
run
di
Ug
an
da
Dji
bo
uti
Lao
PD
R
Cô
te d
'Ivo
ire
Sã
o T
om
é a
nd
Pri
nci
pe
Eq
ua
tori
al
Gu
ine
a
Ma
law
i
To
go
Nig
er
Be
nin
Se
ne
ga
l
Zim
ba
bw
e
Tim
or-
Lest
e
Nig
eri
a
Ta
jik
ista
n
Mya
nm
ar
Co
ng
o,
Re
p.
Ha
iti
Ve
ne
zue
la,
RB
Co
ng
o,
De
m.
Re
p.
Ch
ad
Ce
ntr
al
Afr
ica
n R
ep
ub
lic
So
uth
Su
da
n
Na
rro
win
g d
ista
nce
to
fro
nti
er
fro
m 2
01
3 t
o 2
01
4 (
pe
rce
nta
ge
po
ints
)
Albania
TajikistanBeninSouth Africa
Central African Republic
Jamaica
Colombia
Mozambique
2013
2014
The metric on “distance to frontier”: tracking economies’ progress
over time
8

New computation of ranking - from percentile ranking to
DTF ranking
• The distance to frontier measure benchmarks economies with respect to a measure of regulatory best practice—showing the gap between each economies’ performance and the best performance on each indicator.
• Although the ranking generated from the distance to frontier scores and the percentile rank are highly correlated, the distance to frontier measure captures more information than the percentile rank because it includes not only the ordering of economies but also how far apart they are.
• Economies with higher variance across topics are more likely to have a less favorable classification in the distance to frontier rank than in the percentile rank.
9
The difference of the two ranking calculations (based on DB2014 data)
The correlation between the distance to frontier ranking and the percentile ranking is 99%.
Source: Doing Business database.
Note: The correlation between the distance to frontier ranking and the percentile ranking is 0.99.

Ease of doing business ranking – Top 50 economies
10

Second city added to the data set for 11 economies
● City added in DB15
● City already covered by Doing Business
11
For economies with more than 100 million inhabitants, an extra city was added to the Doing Business measures. These economies are: Bangladesh, Brazil, China, India, Indonesia, Japan, Mexico, Nigeria, Pakistan, the Russian Federation, and the United States.

Small differences between cities within large economies
12
Note: The figure shows data for the 11 large economies for which Doing Business covers both the largest and the second largest business city.Source: Doing Business database.
Indicators measuring the strength of legal institutions show less difference between cities within economies than those measuring the complexity and cost of regulatory processes
Small differences in the distance to frontier
score between cities in the same economy

A new indicator will assess the reliability of electricity supply by measuring both the
duration and the frequency of power outages:
• The indicator will use the system average interruption
duration index (SAIDI) and the system
average interruption frequency index
(SAIFI).
• SAIDI is the average total
duration of outages over the course
of a year for each customer served,
while SAIFI is the average number of
service interruptions experienced by a
customer in a year.
Changes planned for Doing Business 2016 –
Getting Electricity indicator
Reliability of electricity supply
• Duration of power outages
• Frequency of power outages
13
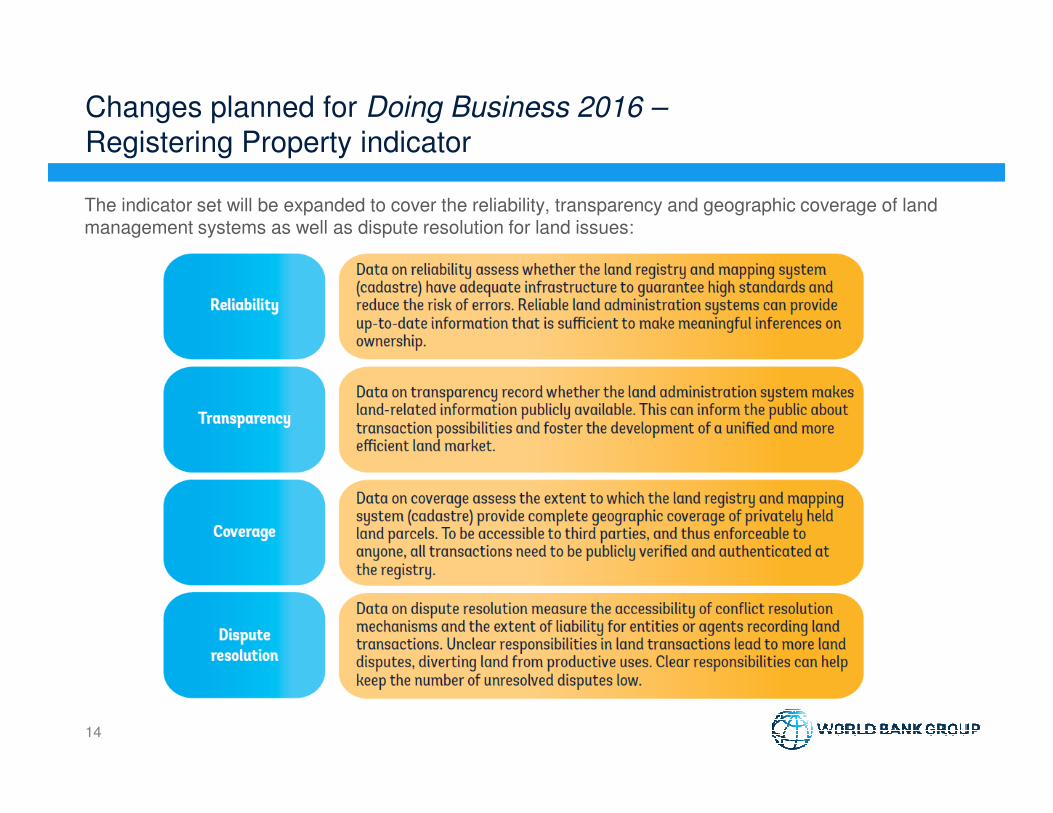
Changes planned for Doing Business 2016 –
Registering Property indicator
The indicator set will be expanded to cover the reliability, transparency and geographic coverage of land management systems as well as dispute resolution for land issues:
14
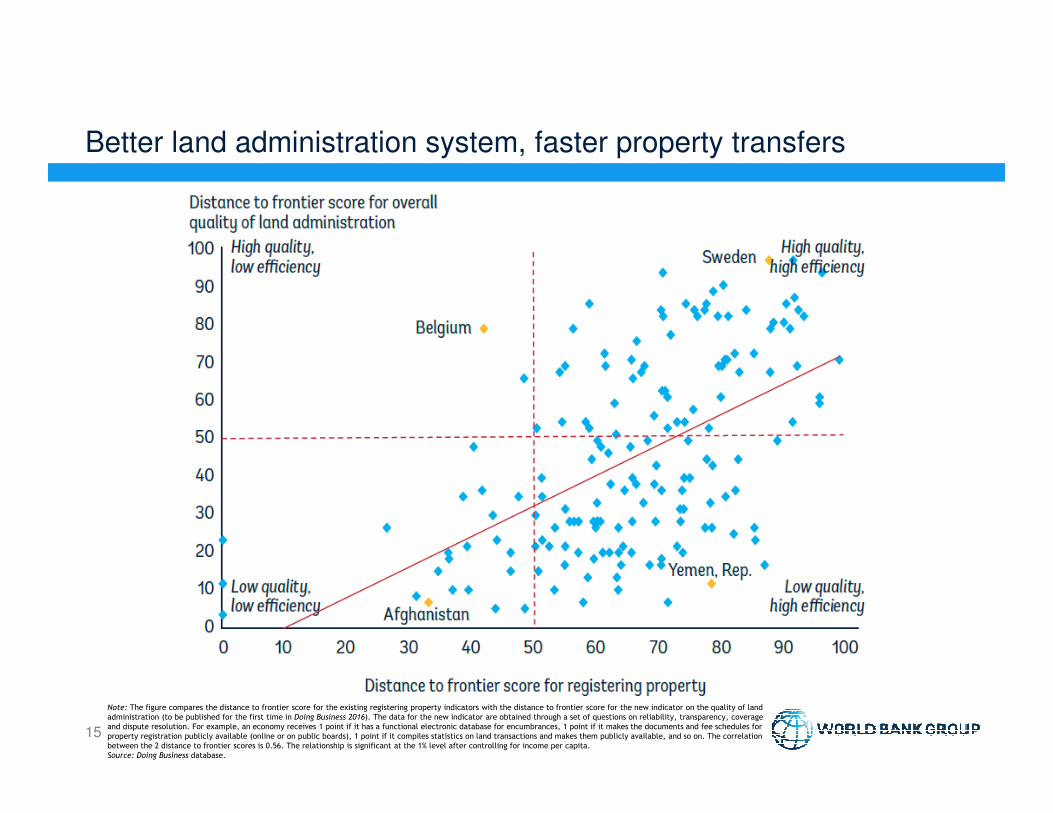
Better land administration system, faster property transfers
15
Note: The figure compares the distance to frontier score for the existing registering property indicators with the distance to frontier score for the new indicator on the quality of land
administration (to be published for the first time in Doing Business 2016). The data for the new indicator are obtained through a set of questions on reliability, transparency, coverage
and dispute resolution. For example, an economy receives 1 point if it has a functional electronic database for encumbrances, 1 point if it makes the documents and fee schedules for
property registration publicly available (online or on public boards), 1 point if it compiles statistics on land transactions and makes them publicly available, and so on. The correlation
between the 2 distance to frontier scores is 0.56. The relationship is significant at the 1% level after controlling for income per capita.
Source: Doing Business database.

It was possible to start a business in less than 20 days in only 41 economies*, mostly in North America and Northern and Central Europe
Now, the time to start a business is less than 20 days for entrepreneurs in 127 economies*
2005
2014*
*Based on samples of 174 economies in 2005 and 189 economies in 2014
Development impact: Countries that regulate entry more heavily have greater corruption and larger unofficial economies, but not better quality of public or private goods. (Quarterly Journal of Economics, February 2002, Djankov, La Porta, Lopez de Silanes, Shleifer.)
Reforms making it easier to start a business were once again most common in 2013/14 – and show results over time in reduced delays…
16
*EU in 2005: 10 economies
*EU in 2014: 25 economies
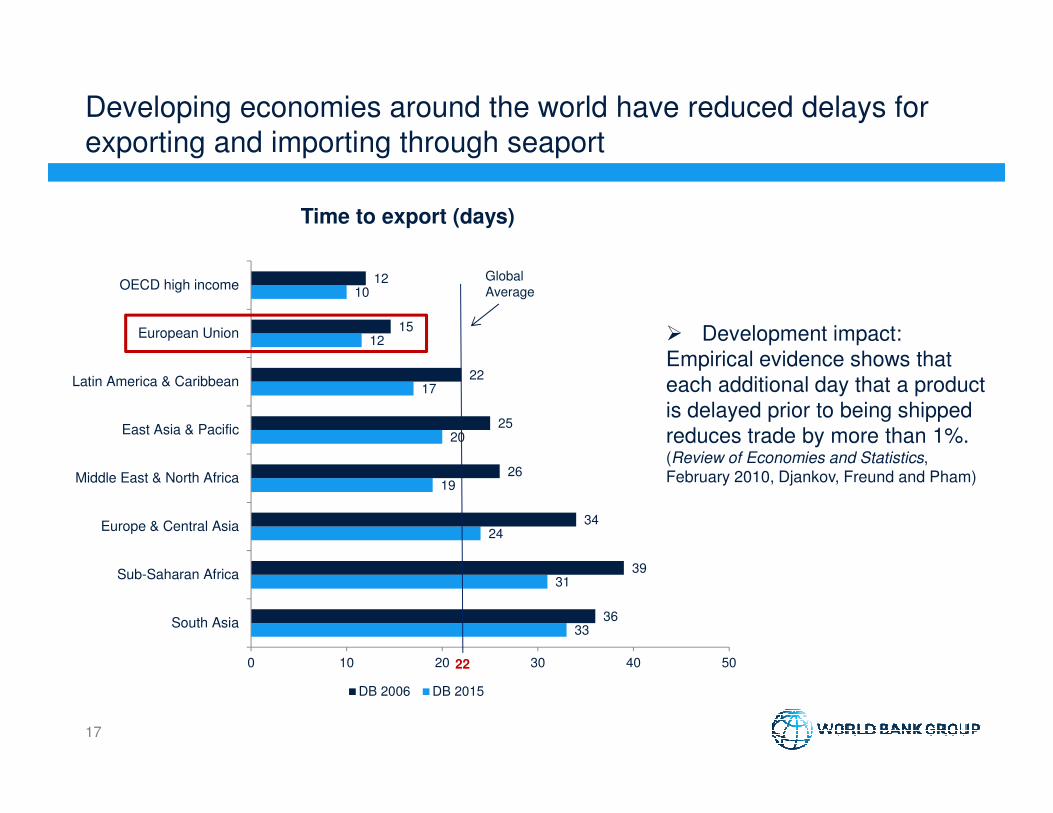
Developing economies around the world have reduced delays for
exporting and importing through seaport
17
33
31
24
19
20
17
12
10
36
39
34
26
25
22
15
12
0 10 20 30 40 50
South Asia
Sub-Saharan Africa
Europe & Central Asia
Middle East & North Africa
East Asia & Pacific
Latin America & Caribbean
European Union
OECD high income
Time to export (days)
DB 2006 DB 2015
Global
Average
22
� Development impact:
Empirical evidence shows that
each additional day that a product
is delayed prior to being shipped
reduces trade by more than 1%. (Review of Economies and Statistics,
February 2010, Djankov, Freund and Pham)

All regions have reduced the time it takes to transfer property
between local firms
18
100
78
63
57
31
23
24
26
137
101
85
104
51
111
57
32
0 50 100 150
South Asia
East Asia & Pacific
Latin America & Caribbean
Sub-Saharan Africa
Middle East & North Africa
Europe & Central Asia
OECD high income
European Union
Average time to register property (days)
DB 2006 DB 2015
Global Average
50

Strong convergence across economies since 2005 Averages by group
19
Note: Economies are ranked in quartiles by performance in 2005 on the indicator shown. The data refer to the 174 economies included in Doing Business 2006 (2005). Fifteen economies were added in subsequent years.Source: Doing Business database.
116
44
29
150
20
40
60
80
100
120
140
2005 2006 2007 2008 2009 2010 2011 2012 2013 2014
Time to start a business (days)
Worst quartile Best 3 quartiles
695
499
216
199
0
100
200
300
400
500
600
700
800
2005 2006 2007 2008 2009 2010 2011 2012 2013 2014
Time to pay taxes (hours per year)
Worst quartile Best 3 quartiles
52
40
20
16
0
10
20
30
40
50
60
2005 2006 2007 2008 2009 2010 2011 2012 2013 2014
Time to export (days)
Worst quartile Best 3 quartiles
235
94
42
33
0
50
100
150
200
250
2005 2006 2007 2008 2009 2010 2011 2012 2013 2014
Time to register property (days)
Worst quartile Best 3 quartiles

Europe & Central Asia is the region that has improved its business environment the
most over the years – from 2005 to 2013 as well as from 2013 to 2014
20
Note: The distance to frontier measure shows how far on average an economy is at a point in time from the best performance achieved by any economy on
each Doing Business indicator since 2005 or the first year in which data for the indicator were collected. The measure is normalized to range between 0
and 100, with 100 representing the frontier. The data refer to the 183 economies included in Doing Business 2010 (2009) and to the regional classifications
for 2013. Six economies were added in subsequent years. Source: Doing Business database.
72.9
76.8
56.1
62.7
53.9
58.9
51.7
65.0
50.4
57.7
48.7
55.0
42.1
51.3
40
50
60
70
80
90
100
2005 2006 2007 2008 2009 2010 2011 2012 2013
OECD high income East Asia & Pacific
Latin America & Caribbean Europe & Central Asia
Middle East & North Africa South Asia
Sub-Saharan Africa
Gap between OECD high-income economies and rest of the world
Regulatory frontier
RegionsDTF DB2014
DTF DB2015
Changein DTF
OECD high income 76.08 76.47 0.39
Europe & Central Asia 65.11 66.67 1.56
East Asia & Pacific 62.42 63.19 0.77
Latin America &
Caribbean59.92 60.66 0.74
Middle East & North
Africa58.92 59.23 0.31
South Asia 54.05 54.56 0.51
Sub-Saharan Africa 50.76 51.87 1.11

Following Doing Business best practices would significantly
decrease the time to start a business
21
• In the 107 economies covered by both Doing
Business and the World Bank’s
Entrepreneurship Database, an estimated 3.1
million limited liability companies were newly
registered in 2012 alone.
• Assuming that they followed the rules and
regulations for company incorporation in their
home economy as measured by Doing
Business, these 3.1 million firms together
spent 40.7 million days to get incorporated.
• Because not all economies followed best
practice, entrepreneurs spent an extra 39.2
million days satisfying bureaucratic
requirements (this figure was 45.4 million days
in 2013).
40.7
1.5
Not following best practices Following best practices
Days to start a business (millions)
Source: World Bank’s Entrepreneurship Database; Doing Business database.

Following Doing Business best practices would also significantly
decrease the time to pay taxes
22
• In the 93 economies covered by both Doing
Business and the World Bank’s
Entrepreneurship Database, an estimated 28.6
million limited liability companies were in
operation in 2012.
• Assuming that they followed the rules and
regulations for paying taxes in their home
economy as measured by Doing Business,
these firms together spent 1.1 billion days to
file their taxes.
• Time saved if economies followed the best
practices in paying taxes � 751 million days0.0
0.2
0.4
0.6
0.8
1.0
1.2
Not following best practices Following best practices
0.3
Days to pay taxes (billions)
Source: World Bank’s Entrepreneurship Database ; Doing Business database.
1.1

23
• In 2013/2014, we estimate that around 4.3 million years of working days could have
been saved if governments had applied best practice in regulating business entry,
transferring property, importing, exporting, resolving commercial disputes through the courts
and paying business taxes.
• This corresponds to 43 years of uninterrupted work (365 days a year, with no breaks) by
an army of 100,000 workers.
To put things in perspective:
this is equivalent to building 13 Panama Canals every year.
Dealing with red tape
Source: http://panamalogisticsnews.com/

Greece made registering property both easier and less expensive
24
Note: In 2014 procedures 3, 4 and 5 occur simultaneously with procedure 2 (although procedures may take place simultaneously,
they cannot start on the same day). Procedure 6 starts after procedure 2.
Source: Doing Business database.

Myanmar reduced the time to export and import by abolishing
license requirements for many types of goods
25
Source: Doing Business database.

Kosovo cut the time for enforcing judgments in half by introducing a
private bailiff service
26
Source: Doing Business database.
Legal indicators focus on the strength of legal institutions:• Measuring the strength of the legal and regulatory framework
• Assessing specific features of local business laws, the civil law, collateral
and bankruptcy laws, or the labor code

THANK YOU!
Questions www.doingbusiness.org