Embed Size (px)
Citation preview

Presented by –
Sulakshya Gaur-121684
Aayush Mittal- 121685
Harshit Thakur-121689
Puneet Goyal-121699
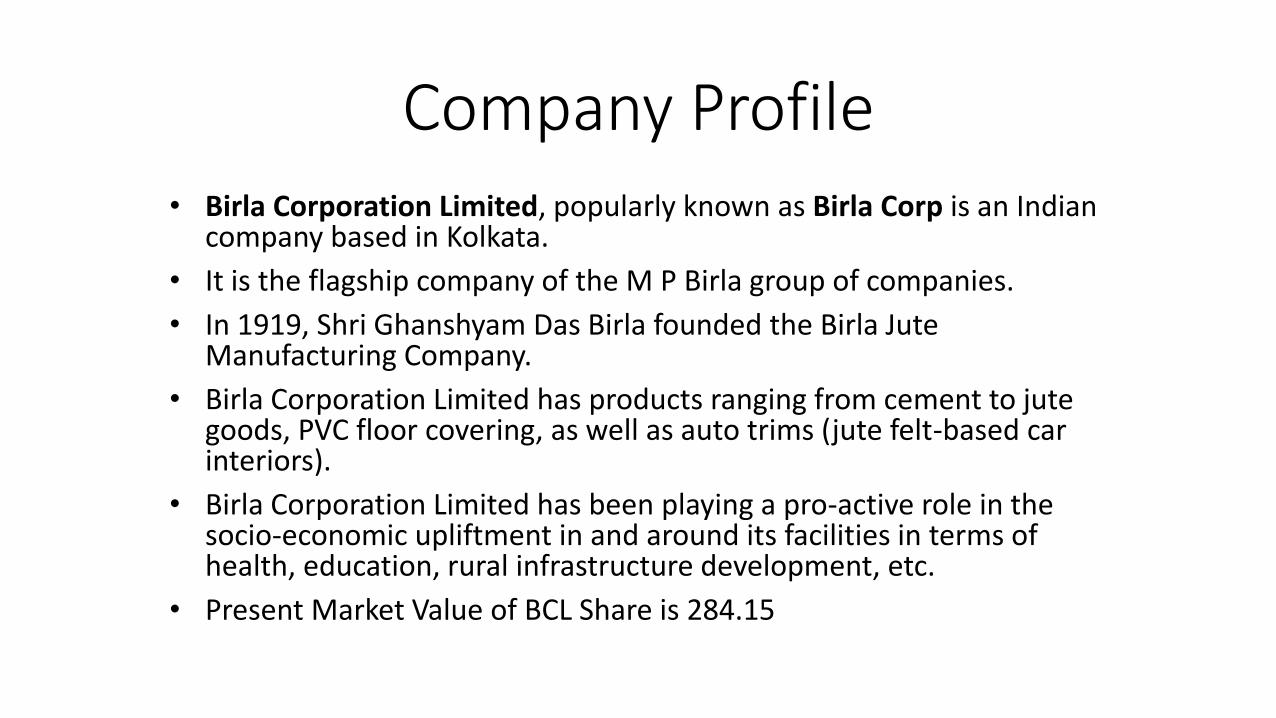
Company Profile• Birla Corporation Limited, popularly known as Birla Corp is an Indian
company based in Kolkata.
• It is the flagship company of the M P Birla group of companies.
• In 1919, Shri Ghanshyam Das Birla founded the Birla Jute Manufacturing Company.
• Birla Corporation Limited has products ranging from cement to jute goods, PVC floor covering, as well as auto trims (jute felt-based car interiors).
• Birla Corporation Limited has been playing a pro-active role in the socio-economic upliftment in and around its facilities in terms of health, education, rural infrastructure development, etc.
• Present Market Value of BCL Share is 284.15

Installed Capacity and Production
Product Installed Capacity Production (2009-2010)
Cement 6.46 Mill. Tons. 5.69 Mill. Tons.
Jute Goods 38000 M T 27,300 MT
PVC Floor Covering 48.60 lakh sq. mtrs 1.09 lakh sq. mtrs.
Auto Trim Parts 7.80 lakh Pcs 0.64 lakh Pcs
Iron & Steel Casting 3,750 tons 1,078 tons

Corporate Sustainability
• Green power: The Waste Heat Recovery System (WHRS) in Satna and Chanderia plants is constantly working on generating power from waste heat, vented out in the atmosphere, from preheaters and clinker coolers. Since the environment-friendly initiative does not generate CO2, it is called green power.
Installation of new energy-efficient grinding systems like Vertical Roller Mill (VRM) for raw mill grinding and Roll Presses for cement grinding.Continuous upgradation of technology through installation of latest energy-efficient clinker coolers and grinding systems like VRM and Roll Press.

Awards And Recogonition
• Birla Corporation Limited has made it to the prestigious list of "200 Best Under a Billion $" companies in the Asia-Pacific region, published by Forbes Asia, in its October 9, 2009 issue.
• Birla Corporation Limited received the Best Corporate Ethics Award for 2008 from the Indian Institute of Planning and Management.
• Satna Cement Works & Birla Vikas Cement have received the IS/ISO 14001 certificate, an international recognition for "Implementation of environmental management system".
• BCL has regularly been receiving CAPEXIL awards for cement exports since the last more than 15 years.

• The Company''s unit at Satna had received the following awards
during the year :
- "Greentech Environment Excellence Award 2012"
- "Greentech - CSR Silver Award-2012"
- "Greentech - HR Gold Award - 2012".

Contents
1. RATIO ANALYSIS
2. COMMON SIZE ANALYSIS
3. INDEX ANALYSIS
4. SWOT ANALYSIS
FINANCIAL STATEMENT ANALYSIS OF
THE BIRLA CORPORATION LTD.

Liquidity Ratio

YEAR Current
Ratio
2008 0.677
2009 1.188
2010 1.311
2011 1.679
2012 1.793
2013 1.608
Current Ratio
0
0.2
0.4
0.6
0.8
1
1.2
1.4
1.6
1.8
2
2008 2009 2010 2011 2012 2013
Series1

YEAR Quick Ratio
2008 0.173
2009 0.764
2010 0.746
2011 0.974
2012 1.045
2013 0.735
Quick Ratio
0
0.2
0.4
0.6
0.8
1
1.2
2008 2009 2010 2011 2012 2013
Series1

Leverage ratio

Debt RatioYEAR Debt Ratio
2008 0.182
2009 0.149
2010 0.265
2011 0.312
2012 0.335
2013 0.334
0
0.05
0.1
0.15
0.2
0.25
0.3
0.35
0.4
2008 2009 2010 2011 2012 2013
Series1

Debt Equity RatioYEAR Debt Equity
Ratio
2008 0.223
2009 0.175
2010 0.360
2011 0.454
2012 0.504
2013 0.501
0
0.1
0.2
0.3
0.4
0.5
0.6
2008 2009 2010 2011 2012 2013
Series1

Debt Asset RatioYEAR Debt Asset
Ratio
2008 0.289
2009 0.187
2010 0.474
2011 0.509
2012 0.479
2013 0.437
0
0.1
0.2
0.3
0.4
0.5
0.6
2008 2009 2010 2011 2012 2013
Series1

Interest Coverage RatioYEAR ICR
2008 27.23
2009 23.40
2010 28.98
2011 9.21
2012 16.28
2013 5.48
0.00
5.00
10.00
15.00
20.00
25.00
30.00
35.00
2008 2009 2010 2011 2012 2013
Series1

Turnover Ratio

YEAR Inventoryturnover ratio
2008 9.936
2009 10.567
2010 8.428
2011 6.755
2012 6.207
2013 5.227
Inventory turnover ratio
0
2
4
6
8
10
12
2008 2009 2010 2011 2012 2013
INVENTORY TURNOVER RATIO
INVENTORY TURNOVER RATIO

YEAR Total Asset
Turnover
Ratio
2008 2.586
2009 1.698
2010 1.762
2011 1.323
2012 1.100
2013 1.071
Total Asset Turnover Ratio
0
0.5
1
1.5
2
2.5
3
2008 2009 2010 2011 2012 2013
Series1

PROFITABILITY RATIOS

Operating Profit Margin
Year
Operating
Profit Margin
2008 29.409
2009 25.904
2010 33.89
2011 21.479
2012 20.577
2013 13.174
0
5
10
15
20
25
30
35
40
2008 2009 2010 2011 2012 2013
Series1

Net Profit Margin
Year
Net Profit
Margin
2008 19.75
2009 15.872
2010 23.299
2011 13.216
2012 9.266
2013 9.053
0
5
10
15
20
25
2008 2009 2010 2011 2012 2013
Series1

Operating Expense Ratio
Year
Operating
Expense Ratio
2008 0.107
2009 0.126
2010 0.120
2011 0.132
2012 0.135
2013 0.158
0
0.02
0.04
0.06
0.08
0.1
0.12
0.14
0.16
0.18
2008 2009 2010 2011 2012 2013
Series1

Operating Ratio
Year
Operating
Ratio
2008 1.555
2009 1.638
2010 1.545
2011 1.763
2012 1.784
2013 1.909
0
0.5
1
1.5
2
2.5
2008 2009 2010 2011 2012 2013
Series1

Return On Total Assets
YearROTA
2008 0.511
2009 0.269
2010 0.410
2011 0.174
2012 0.101
2013 0.096
0
0.1
0.2
0.3
0.4
0.5
0.6
2008 2009 2010 2011 2012 2013
Series1

Return on Net Assets
YearRONA
2008 1.056
2009 0.433
2010 0.651
2011 0.242
2012 0.133
2013 0.126
0
0.2
0.4
0.6
0.8
1
1.2
2008 2009 2010 2011 2012 2013
Series1

Return On EquityYear
ROE
2008 0.394
2009 0.252
2010 0.312
2011 0.156
2012 0.107
2013 0.111
0
0.05
0.1
0.15
0.2
0.25
0.3
0.35
0.4
0.45
2008 2009 2010 2011 2012 2013
Series1

Earning Per Share
YearEPS
2008 5.110
2009 4.200
2010 7.235
2011 4.153
2012 3.106
2013 3.503
0
1
2
3
4
5
6
7
8
2008 2009 2010 2011 2012 2013
Series1

COMMON SIZE ANALYSIS

Balance Sheet: ASSETS
YEAR 2008 2009 2010 2011 2012 2013
Net fixed assets 29.21445 31.92271 22.95337 26.75751 32.70148 37.80145
Investments 36.98 26.71 37.51 32.08 25.34 27.72
Deferred tax assets 1.334134 1.190724 0.950422 1.007155 1.129327 1.167095
Current assets 15.70277 26.10838 21.61595 23.39914 24.18593 22.88794
Loans and advances 8.065476 7.206249 6.206162 4.136991 3.969623 5.060831
Capital work in progress 8.698417 6.860929 10.76806 12.58299 12.46528 4.986442
Miscellaneous expenses not written off 0 0 0 0 0.175123 0.347075
TOTAL ASSETS 100 100 100 99.96461 99.96895 99.97142

Balance Sheet: LIABILITIES
YEAR 2008 2009 2010 2011 2012 2013
Net worth 58.13 61.88 58.58 56.25 54.06 52.94
Borrowings 12.96741 10.82775 21.10706 25.51304 27.25253 26.53997
Current liabilities & provisions 23.18139 21.96745 16.48406 13.93282 13.48692 14.22678
Deferred tax liability 5.225117 4.925882 3.562523 4.094191 4.846452 5.785084
Total liabilities 99.51 99.60 99.74 99.79 99.64 99.49

INDEX ANALYSIS

Balance Sheet: ASSETS
YEAR 2008 2009 2010 2011 2012 2013
net fixed assets 100 131.7991 139.5128 194.7464 269.2133 346.0124
investments 100 87.11199 180.071 184.4353 164.7965 200.429
deferred tax assets 100 107.6519 126.4976 160.516 203.5855 233.9309
current assets 100 200.5461 244.435 316.8437 370.4361 389.7726
loans and advances 100 107.768 136.6339 109.0626 118.3712 167.7926
capital work in progress 100 95.13782 219.8176 307.585 344.6583 153.2962
Miscellaneous expenses not written off 100
TOTAL ASSETS 100 120.6175 177.5682 212.6285 240.5065 267.412

Balance Sheet: LIABILITIES
YEAR 2008 2009 2010 2011 2012 2013
Net worth 100 106.4466 100.7737 96.75317 92.9841 91.06681
Borrowings 100 83.4997 162.77 196.7473 210.1616 204.6666
Current liabilities & provisions 100 94.76331 71.10903 60.10346 58.17994 61.37157
Deferred tax liability 100 94.27314 68.18074 78.35598 92.75298 110.7168
Total liabilities 100 100.0953 100.2307 100.28 100.134 99.98464
shareholders fund 100 106.4466 100.7737 96.75317 92.9841 91.06681

SWOT analysis
Strengths
Weaknesses
Opportunities
Threats
ANALYSIS

STRENGTHS WEAKNESSES OPPORTUNITIES THREATS
• Strong financial position
• Quality products• Large networks • Strong brand name• Asset Leverage• Size Advantage
• Online Presence • Less advertising • No penetration in rural
markets
• Financial Leverage• Acquisition Synergies• Innovation• Emerging Markets• New Technology• Rapid integration with
global markets
• Bad Economy• International
Competition• Substitute • Products Competition• Market uncertainity

Conclusion
The company can include more of equity and improve it’s capital structure.
The company can take up more of government sector projects so as to increase it’s debt payout.

THANK YOU