Embed Size (px)
Citation preview

11
BTG Pactual XIV CEO ConferenceSão Paulo – February 2013

Disclaimer
This presentation contains statements that are forward-looking within the meaning of Section 27A of theSecurities Act of 1933 and Section 21E of the Securities Exchange Act of 1934. Such forward-lookingstatements are only predictions and are not guarantees of future performance. Investors are cautionedthat any such forward-looking statements are and will be, as the case may be, subject to many risks,uncertainties and factors relating to the operations and business environments of General Shoppingand its subsidiaries that may cause the actual results of the companies to be materially different fromany future results expressed or implied in such forward-looking statements.
This material is published solely for informational purposes and is not to be construed as a solicitation oran offer to buy or sell any securities or related financial instruments and should not be treated as givinginvestment advice. It is not targeted to the specific investment objectives, financial situation orparticular needs of any recipient. No representation or warranty, either express or implied, is provided inrelation to the accuracy, completeness or reliability of the information contained herein. This materialrelation to the accuracy, completeness or reliability of the information contained herein. This materialshould not be regarded by recipients as a substitute for the exercise of their own judgment.
Any opinions expressed in this material are expressed as of this date and subject to change withoutnotice and General Shopping is not under the obligation to update or keep current the informationcontained herein. General Shopping and the respective affiliates, directors, partners and employeescontained herein. General Shopping and the respective affiliates, directors, partners and employeesaccept no liability whatsoever for any loss or damage of any kind arising out of the use of all or any partof this material. You should consult with your own legal, regulatory, tax, business, investment, financialand accounting advisers to the extent that you deem it necessary, and make your own investment,hedging and trading decision (including decisions regarding the suitability of this transaction) based
j d t d d i f h d i d d t
222
upon your own judgment and advice from such advisers as you deem necessary and not upon anyviews expressed in this material.

Company OverviewCompany Overview
33

Differentials
Market-driven company with retail approach
B and C consumption classes as target market
Innovative complementary services
Majority ownership: 81.5% average interest
444

Shopping Center´s definitions
ICSC “Is a group of retail stores planned ICSC - Is a group of retail stores, planned, developed and managed like an only one operation.”
ABRASCE – “ A planed group of retail stores with an integrated operation and centralized integrated operation and centralized management,…, and at least part of its rental revenues must be part of retail´s sales revenues.”
555

General Shopping BrasilOwn GLA
Poli Shopping Guarulhos 50.0% 4,527 2,264 15,400Internacional Shopping 100.0% 75,958 75,958 -Auto Shopping 100.0% 11,477 11,477 -
Own GLAExpansion (m2)
Shopping Center Interest Total GLA(m²)
Own GLA(m²)
Shopping Light 85.0% 14,140 12,019 -Santana Parque Shopping 50.0% 26,538 13,269 -Suzano Shopping 100.0% 19,583 19,583 -Cascavel JL Shopping 85.5% 8,877 7,590 2,953Top Center Shopping 100.0% 6,369 6,369 -Parque Shopping Prudente 100.0% 15,148 15,148 -Poli Shopping Osasco 100.0% 3,218 3,218 -Shopping do Vale 84.4% 16,487 13,913 -Unimart Shopping Campinas 100.0% 14,961 14,961 -Outlet Premium São Paulo 50.0% 17,716 8,858 -Parque Shopping Barueri 48.0% 37,420 17,962 -Outlet Premium Brasília 50.0% 16,094 8,047 -Shopping Bonsucesso 100.0% 24,437 24,437 -
81.5% 312,950 255,073 18,353
Total GLA Own GLA
Parque Shopping Sulacap 51.0% 29,932 15,265 Outlet Premium Salvador* 98.0% 27,000 26,460 Outlet Premium Rio de Janeiro* 98.0% 32,000 31,360 Convention Center 100 0% 25 730 25 730
Greenfield Interest Total GLA(m²)
Own GLA(m²)
666
Convention Center 100.0% 25,730 25,730 Parque Shopping Maia 96.5% 27,896 26,920 Parque Shopping Atibaia 100.0% 24,043 24,043
89.9% 166,601 149,778(*) Company may sell up to 48% of the project to BR Partners Fund.

Geographic Distribution
Internacional Shopping Guarulhos Shopping Light Parque Shopping Prudente Auto Shopping
8
Top Center Shopping Shopping do Vale Cascavel JL ShoppingUnimart Shopping Campinas
15,148Total GLA (m2) Total GLA (m2) 11,47775,958Total GLA (m2)
Outlet Premium Rio de Janeiro
14,140Total GLA (m2)
16,487Total GLA (m2) 8,877Total GLA (m2)6,369Total GLA (m2) 32,000(1)Total GLA (m2) 14,961Total GLA (m2)
Poli Shopping Guarulhos Poli Shopping Osasco Outlet Premium São Paulo Convention Center
Greenfield
Shopping inoperation
25,730Total GLA (m2)4,527Total GLA (m2) 3,218Total GLA (m2) (1)
Outlet Premium Salvador
27,000 (1)Total GLA (m2)
Parque Shopping Sulacap
29,932 (1)Total GLA (m2)17,716Total GLA (m2)
Santana Parque Shopping Suzano Shopping
Greenfield
Outlet Premium BrasíliaParque Shopping Maia Parque Shopping BarueriParque Shopping AtibaiaShopping Bonsucesso
777
26,538Total GLA (m2) 19,583Total GLA (m2) 16,094 Total GLA (m2)
(1) EstimatedSource: IBGE 2010
27,896 (1)Total GLA (m2)
Region GDP Retail MktSouth + Southeast 72.6% 72.1%
24,437 Total GLA (m2) (1)24,043Total GLA (m2) 37,420 Total GLA (m2)

Geographic Distribution
GDP(1) Number of Shopping Centers(2)
4%5% %13%
9%56%
5%14%
9%55%
R$ 202 billionR$ 508 billionR$ 351 billionR$ 2,088 billionR$ 622 billion
186041
25482
Retail Sales(1) GLA(2)
18%17%
R$ 622 billion
Total GDP: R$ 3,770 billion Total Number of Shopping Centers: 455
82
GLA
R$ 74 billionR$ 314 billion
4%15%
3%15%
400,211 m²1 660 728 m²R$ 314 billion
R$ 181 billionR$ 1,062 billionR$ 402 billion
15%
9%52%
20%
8%59%
15%
1,660,728 m859,200 m²
6,586,741 m²1,660,242 m²
888(1) Source: IBGE 2010(2) Source: ABRASCE – December 2012
20% 15%Total Retail Sales: R$ 2,033 billion Total GLA: 11,167,122 m²

Estimated to 2015
Number of Shopping Centers
754Total GLA (m2)
754
15.371.65415.371.654
999Source: Alshop Directory, ABRASCE Directory and CompaniesPrepared by General Shopping Brasil

Portfolio
Total GLA Evolution (m2)
185 455 498 405185,455 498,405
98 822 19,69617,919
37,420
50,131
PreIPO
88,962
98,822
101010Dec/06 Dec/07 Dec/08 Dec/09 Dec/11 Dec/12 Until Dec/2014 TOTAL GLA

Diversified Growth Strategy
Consolidation
Shopping center acquisitions
Own GLA(1)Own GLA(1)
Shopping center acquisitions
Greenfields Concept and development of new
h i t
Concluded Greenfields
Greenfields under Development
31.9%
23.9%
35.3%
shopping centers
Expansions
Interest stake increase in assets 23.9%
8.9%
Interest stake increase in assets GLA expansion of the original portfolio Implementation of mixed-use projects
Synergies + ProfitabilityAcquisitions
Expansions
Turnaround
Remodeling and retrofit of tenant mix Innovation in complementary services
111111
Innovation in complementary services
(1) Considering current shopping centers, expansions and announced greenfields.
Case - Outlet
Outlet Premium São Paulo
Type: Greenfield
Stake: 50%
Influence area (inhabitants): super-regional
Occupancy Rate: 98.0% (at opening) - 100.0% today
Description: First outlet of the country Entrance for main brands with Description: First outlet of the country. Entrance for main brands with
outlet operations. Located on the highway which connects São Paulo
capital to the Campinas metropolitan region. Power center
comprising hotel and 2 theme parks.
Initiative: Sales channel for remainder merchandise with occupancy
costs suitable to the off-price operation
121212
p p

Outlet Premium São Paulo- Greenfield
131313
Case - Outlet
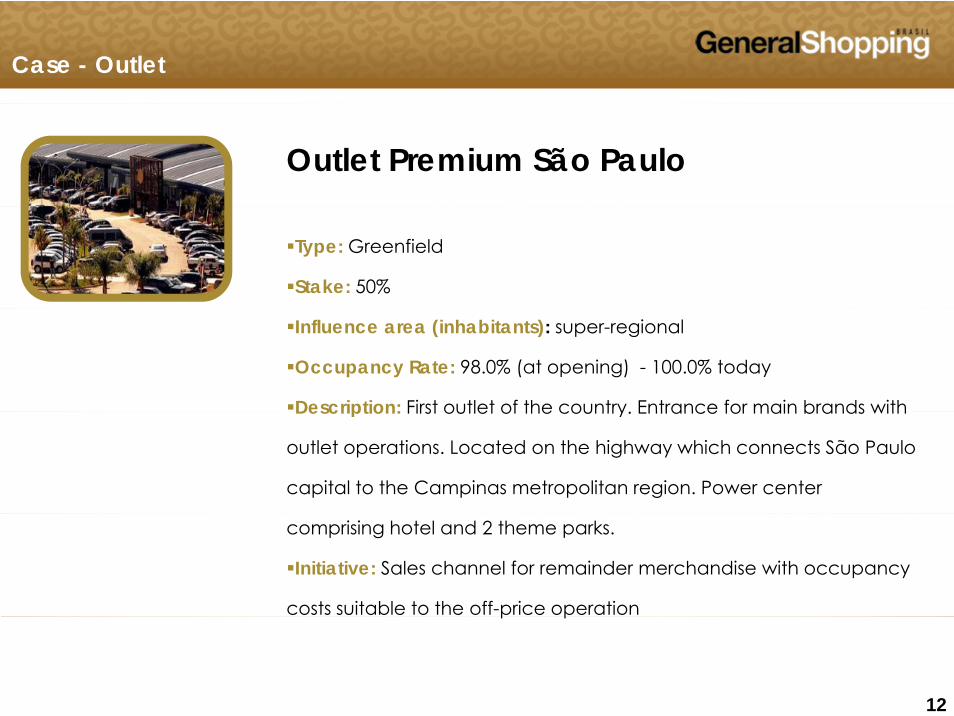
Outlet Premium Brasília
Type: Greenfield
Stake: 50%
Influence area (inhabitants): super-regional
Occupancy Rate: pre-tenanted 90.0% - today 97.0%
Description: Second Outlet developed in the country Located on the Description: Second Outlet developed in the country. Located on the
highway which connects Brasília (country capital) to Goiânia (Goiás
state capital), the two biggest cities in midwestern states.
141414

Outlet Premium Brasília - Greenfield
151515
Case - Outlet
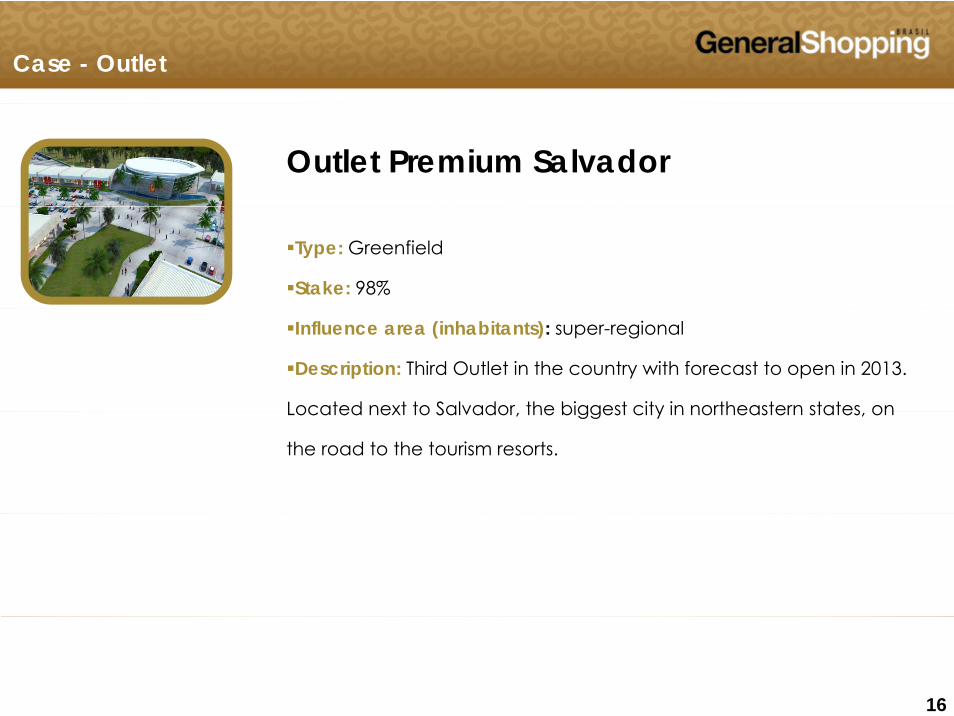
Outlet Premium Salvador
Type: Greenfield
Stake: 98%
Influence area (inhabitants): super-regional
Description: Third Outlet in the country with forecast to open in 2013.
Located next to Salvador the biggest city in northeastern states on Located next to Salvador, the biggest city in northeastern states, on
the road to the tourism resorts.
161616

Outlet Premium Salvador - Greenfield
171717

Unimart Shopping Campinas
Unimart Shopping Campinas
Type: Open Lifestyle Center
Interest: 100%
% of B and C consumption classes: 88%
Public comprised (inhabitants): 277 thousand
Description: Large potential for lifestyle center Office and home Description: Large potential for lifestyle center. Office and home
buildings around. Focus on services, food courts, fitness club and
leisure. Lower occupancy costs with higher rentals/m2.
181818

Unimart Shopping Campinas – Lifestyle Case
Before
Completed
191919

Parque Shopping Prudente - Expansion
Parque Shopping Prudente
Type: Neighborhood
I t t 100 0%Interest: 100.0%
% of B and C consumption classes: 84.0%
Public comprised (inhabitants): 800 thousand
202020

Parque Shopping Prudente - Expansion
212121

Shopping Bonsucesso - Acquisition
Shopping Bonsucesso
Type: Neighborhood
I t t 100 0%Interest: 100.0%
Total GLA: 24,437 m2
Opening: 2006
Acquisition: 2012
Public comprised (inhabitants): 753 thousand
222222

Shopping Bonsucesso - Acquisition
232323

Increasing Complementary Services Activities
Management Parking Water Energy
ISG Auto
Atlas
Poli Light
Santana * Energy
Stake Held
100%
► Responsible for planning the energy supply and leasing of the equipment for its
Cascavel Prudente
Parque
Suzano
Wass100%
q ptransmission and distribution
► Engaged in water supply planning and its treatment and distribution
Poli ShoppingOsasco
Top Center Do Vale
I Park100% ► Controls and manages parking lots
UnimartCampinas
Outlet Premium São Paulo
Parque ShoppingBarueri
GSB Adm
ASG Adm
100%
100%
► Manages operations of shopping centers
► Manages the operations of Auto Shopping
242424
BarueriOutlet Premium
Brasília
Auto Shopping
Services currently provided to the mall Potential services / currently being implemented * Partial
ShoppingBonsucesso

Stock Performance
Stock Performance(Basis 100 – DEC 31 2008)
R$ 10.67*600650700
(Basis 100 DEC 31, 2008)
R$ 10.67370.0%*
60 952*300350400450500550600
60,95262.3%*
050
100150200250
‐08
‐09
‐09
‐09
‐09
09 ‐09
‐09
‐09
‐09
‐09
‐09
‐09
‐10
‐10
‐10
‐10
10 ‐10
‐10
‐10
‐10
‐10
‐10
‐10
‐11
‐11
‐11
‐11
11 ‐11
‐11
‐11
‐11
‐11
‐11
‐11
‐12
‐12
‐12
‐12
12 ‐12
‐12
‐12
‐12
‐12
‐12
‐12
Dec‐
Jan‐
Feb‐
Mar‐
Apr‐
May‐
Jun ‐ Jul‐
Aug
‐Sep‐
Oct‐
Nov
‐Dec‐
Jan‐
Feb‐
Mar‐
Apr‐
May‐
Jun ‐ Jul‐
Aug
‐Sep‐
Oct‐
Nov
‐Dec‐
Jan‐
Feb‐
Mar‐
Apr‐
May‐
Jun ‐ Jul‐
Aug
‐Sep‐
Oct‐
Nov
‐Dec‐
Jan‐
Feb‐
Mar‐
Apr‐
May‐
Jun ‐ Jul‐
Aug
‐Sep‐
Oct‐
Nov
‐
Dec‐
GSHP3 Ibovespa
252525(*) In 12/28/2012

Liquidity
13 164 13,561
GSHP3Volume (R$ thousand)
6,263 5 254
5,945
12,625 13,164
13,391
13,561
5,864
Volume (R$ thousand)
278,611
574 712 568 809 1,105 1,886
5,254 3,911
3,236 3,077
4,545
8,196
6,569
91 672 102,614
150,268
92 470
156,813
122,759
Hiring of newMarket Maker
XP Investimentos
64,685
22,902 13,294 4,231 6,394 17,971
91,672 65,527 66,365
42,790 59,840
,
64,746 92,470
58,566 45,608
1Q08 2Q08 3Q08 4Q08 1Q09 2Q09 3Q09 4Q09 1Q10 2Q10 3Q10 4Q10 1Q11 2Q11 3Q11 4Q11 1Q12 2Q12 3Q12 4Q12
262626
Trading Volume Number of Trades

Shareholders
Nr. Shares Type of investor (*)
Controlling
59.4%
40.6%
Controlling shareholder 30,000,000 -
65.0% - Brazilian
31.0% - ForeignFree float 20,480,600 31.0% Foreign
4.0% - Individual
Total 50,480,600 -
, ,
Free float Controlling shareholder
Listed since July 2007
Market-making activities (through broker XP Investimentos) since October/10
272727(*) Position as of 12/28/2012

Financial PerformanceFinancial Performance
2828

Gross Revenue, NOI and Adjusted EBITDA
49 7
R$ million Gross Revenue
3Q12/3Q11
37 5%
32.834.9 36.1
43.340.9
44.1
49.7
35.933.5
35.6
41.2
37.5%
26.928.7 29.8
21 2 22 9 25.129.5 26.8 28.4
32.0
21.2 22.9
1Q11 2Q11 3Q11 4Q11 1Q12 2Q12 3Q12
Gross Revenue NOI Adjusted EBITDA
1Q11 2Q11 3Q11 4Q11 1Q12 2Q12 3Q12Gross Revenue 32.8 34.9 36.1 43.3 40.9 44.1 49.7
292929
NOI 26.9 28.7 29.8 35.9 33.5 35.6 41.2Adjusted EBITDA 21.2 22.9 25.1 29.5 26.8 28.4 32.0Margin NOI 87.8% 88.3% 88.1% 88.9% 88.0% 86.3% 89.0%Margin Ebitda 69.3% 70.3% 74.4% 72.8% 70.4% 68.7% 69.2%

Rental Gross Revenue
170.3
150 4159.8 157.1
R$ million Rental Revenue
3Q12/3Q11
4.6
2 9 3.74.3
4 1 4.2
1.4
5.15.4
6.0136.7
142.7 144.8 150.4
36.0%
19 9 20.3 20.727.9
24.0 25.0 27.7
2.3 3.1 3.02.93.8 4.1 4.2
19.9 20.3 20.7
1Q11 2Q11 3Q11 4Q11 1Q12 2Q12 3Q12
Minimum Rent Percentage on Sales Other (a) Rent (R$/m²)
RENTAL REVENUE 1Q11 2Q11 3Q11 4Q11 1Q12 2Q12 3Q12Minimum Rent 19.9 20.3 20.7 27.9 24.0 25.0 27.7Percentage on Sales 2 3 3 1 3 0 4 6 2 9 3 7 4 3
303030
Percentage on Sales 2.3 3.1 3.0 4.6 2.9 3.7 4.3Other (a) 3.8 4.1 4.2 1.4 5.1 5.4 6.0Occupancy Rate 96.5% 96.5% 96.8% 96.4% 96.6% 96.4% 96.2%
(a) Includes: Mall/Advertising, Key Money and Straight‐l ining Revenue

Services Gross Revenue
47.2 47.0 48.3R$ million
Services Revenue
3Q12/3Q11
42.5%
36.138.3
42.5 41.7
0 9
5.2 5.86.4
7.7 6.27.3
8.2
0.9 1.0 1.2 1.1 1.0 1.0 1.60.4 0.4 0.3 0.3 1.0 1.01.0
0.3 0.2 0.3 0.30.7 0.7
0.9
1Q11 2Q11 3Q11 4Q11 1Q12 2Q12 3Q12
Energy Water Management Parking Services (R$/m²)
SERVICES REVENUES 1Q11 2Q11 3Q11 4Q11 1Q12 2Q12 3Q12Parking 5.2 5.8 6.4 7.7 6.2 7.3 8.2
313131
gEnergy 0.9 1.0 1.2 1.1 1.0 1.0 1.6Water 0.4 0.4 0.3 0.3 1.0 1.0 1.0Management 0.3 0.2 0.3 0.3 0.7 0.7 0.9

Performance
Description 3Q11 3Q12 Chg % 9M11 9M12 Chg %
Average GLA (m2) 192,906 241,789 25.3% 191,971 222,589 15.9%
R t (R$/ 2) 144 83 157 14 8 5% 424 30 467 48 10 2%
GSB (Total)
Rent (R$/m2) 144.83 157.14 8.5% 424.30 467.48 10.2%Services (R$/m2) 42.48 48.30 13.7% 116.90 137.37 17.5%
Total (R$/m2) 187.31 205.44 9.7% 541.20 604.85 11.8%
323232

$
EBITDA, FFO and Adjusted Net Income
21.2 22.9 25.129.5 26.8 28.4 32.0
6 413.8 10.8
3 811.2
6.8
R$ million
6.4
(0.9)(6.3)
3.8
(5.3)
6.8
(9.9)
(44.2)(46.9)
(73.4)(77.4)
1Q11 2Q11 3Q11 4Q11 1Q12 2Q12 3Q12
Data 1Q11 2Q11 3Q11 4Q11 1Q12 2Q12 3Q12Adjusted EBITDA 21.2 22.9 25.1 29.5 26.8 28.4 32.0
Adjusted EBITDA Adjusted FFO Adjusted Net Income
333333
jAdjusted FFO 6.4 13.8 (44.2) (0.9) 10.8 (73.4) (6.3)Adjusted Net Income 3.8 11.2 (46.9) (5.3) 6.8 (77.4) (9.9)Financial Results (11.1) (4.8) (65.7) (26.6) (12.5) (93.4) (32.6)Income Taxes/Social Contribution (3.7) (4.2) (3.6) (3.8) (3.5) (8.4) (5.7)

Cash X Debt (R$ million)*
AMORTIZATION SCHEDULE
1 389 6
Cash X Debt
791.8
1,193.0
1,389.6
5.2
110.3
30.3 34.9 40.1 45.9 41.9 19.0 12.0 13.22.5
25.0
29.4 21.1 21.1 19.7 13.413.4 13.5 37.510.8
25.2
1.6
3.0 3.0 3.0 1.6 0.10.1
455.2
196.6 196.6
258.6
455.2
2013 2014 2015 2016 2017 2018 2019 2020 After 2020
CCI New Funding Perpetual Bonds Banks Cash
Cash Pro FormaDebt
2012
CDI6 1%
TJLP
Indebtedness Breakdown
Amortization Schedule6.1% TR15.0%
IPCA
0.5%2012 2013 2014 2015 2016 2017 2018 2019 2020
After2020
Total %
CCI 5.2 110.3 30.3 34.9 40.1 45.9 41.9 19.0 12.0 13.2 352.8 25.4%Banks 25.2 1.6 3.0 3.0 3.0 1.6 0.1 0.1 ‐ ‐ 37.6 2.7%New Funding 2.5 25.0 29.4 21.1 21.1 19.7 13.4 13.4 13.5 37.5 196.6 14.1%Perpetual Bonds 10 8 ‐ ‐ ‐ ‐ ‐ ‐ ‐ ‐ 791 8 802 6 57 8%
343434
IPCA20.6%
Fixed0.1%
USD57.7%
* Cash Position and Indebtedness, considering the new funding in amount of R$ 196.6 million
Perpetual Bonds 10.8 791.8 802.6 57.8%Total 43.7 136.9 62.7 59.0 64.2 67.2 55.4 32.5 25.5 842.5 1,389.6 100.0%

Cash X Debt (R$ million)
According to Rating Agencies' Criteria*
CDI6.8%
TR16.8%
Indebtedness Breakdown
1,242.4
Cash X Debt
16.8%
Fixed0.1%
USD
1,045.8455.2
IPCA22.9%
TJLP0.6%
USD52.8%
196.6 196.6
258.6
Cash Debt
0.6%
353535*Considering 50% of the Subordinated Perpetual Bonds’ balance as Equity, amounting to R$ 147.2 millionIncluding credit transactions related to the Subsequent Events, in amount of R$ 196.6 million

Investment Properties- R$ million
Investment Properties
1,648.3 (1)
1,890.3 (2)
782.6
404.8
865 7
782.6
(1) Total value of investment properties (malls in operation) according to theValuation Report of CB Richard Ellis on basis date 12/31/2011. Theaverage rate of discount to the cash flow was 10.75%
865.7
Book Value Adjustment to Fair Value (Operational Assets) Construction in progress
g f fThe Shopping Bonsucesso mall (acquired in Aug/2012) has not beenevaluated by CB Richard Ellis.
(2) Total value of investment properties and land value, consideringconstruction in progress incurred after 12/31/2011.
363636

Contacts
GSB INVESTOR RELATIONS
Alessandro Poli VeroneziIR Officer
Marcio SniokaIR Superintendent
55 11 3159-5100
[email protected] pp g
www.generalshopping.com.br
373737