Embed Size (px)
Citation preview

MBA Program Financial & Management Accounting (FMA)
Individual Assignment - January 2015
Analyzing Financial Statements & Ratios
(Company Evaluation – Cranswick Foods plc)
Prepared by:
Ayman Howera (201458318) Supervised by:
Margaret Stewart Bapna Mammen

Page 2 of 51
Table of Contents Executive Summary ....................................................................................................................................... 3
Introduction .................................................................................................................................................. 3
Performance ................................................................................................................................................. 4
The Balance Sheet ......................................................................................................................................... 7
Only OT out of SWOT .................................................................................................................................... 9
Ratios Analysis ............................................................................................................................................ 10
Cash flow ..................................................................................................................................................... 26
Non-financial performance indicators ........................................................................................................ 28
Conclusion and Recommendations ............................................................................................................ 32
Appendix A - References ……………………………………………………………………………………………………………………… 35
Appendix B - Cranswick Financial Statements………………………………………………………………………………………. 36
Appendix C - Devro Financial Statements…………………………………………………………………………………………….. 42
Appendix D - Smithfield Statements………………………………………………………………………………………………………48
Appendix E - Premier Foods Statements ……………………………………………………………………………………………….49
Appendix F - Reflection Feedback………………………………………………………………………………………………………… 51

Page 3 of 51
Executive Summary
The main objective of the document is to prepare an initial evaluation for Cranswick Foods plc
which is listed on the London Stock Exchange (LSE) to be considered by the Board of Directors of
the company who would like to consider making a takeover bid for this target company. The
document will do a ratio analysis for Cranswick in comparison with Benchmark Company (premier
Food plc was selected for that purpose) and some other companies on the food manufacturing
industry. One of the analysis objectives is to identify major changes in trends, amounts, and
relationships along with an investigation of the reasons of those changes. This analysis is vital to
allow the board of directors to examine the financial strength and performance for this target
company and provide insights to them.
Introduction
190 miles to the north of London and 9 minutes far from the North Sea, Cranswick Food plc is
located in Hull and considered one of the largest food producers in UK. It started its business in
1974 with an intuitive of Jim Bloom, Mike Field and some other East Riding of Yorkshire farmers.
The company originally formed to produce pig feed, and then it subsequently diversified into food
production. In 1993 they have 2 major events, the first was to be listed on London Stock Exchange
and the second was to make the first acquisition for pet food company called George Buckton. After
that, Cranswick made 5 major acquisitions: Continental Fine Foods (2001), The Sandwich Factory
(2003, Perkins Chilled Foods (2005), Delico (2006), Bowes of Norfolk (2010).
With the help of these acquisitions, Cranswick started to gain market share. The horsemeat scandal
on 15th Jan 2013 introduced another reason for Cranswick to grow its revenue although there was
a significant decrease on meat sales affected both frozen Beef and Pork. The acquisition of
Wellingore plant, in Lincolnshire, acquired in March 2000, has helped the company to boost its Pig
feed production to 250,000 tons per year. This acquisition also enabled Cranswick to extend its feed
production to poultry feed. The company manufactures pork products, including sausages, hams,
and other meats, under its Cranswick Country Foods subsidiary manufactured in five production
plants. These products include a 15% share of the U.K. market of premium quality sausages. Having
some pork products that were less popular in its core U.K directed the company to look for new
markets for these products. Therefore, in 1998, the company sales started to grow to the Chinese
market for pigs' feet, as well as sales of pork bellies to South Korea and pig tails to the West Indies.
The company established its first foreign subsidiary in Germany after a successful operation in UK.

Page 4 of 51
The company's food division has overtaken its pig feed division in turnover, accounting for two-
thirds of the company's sales. Cranswick's third area of operations is linked to its core activities: the
company's Tropical Marine Centre is Europe's largest importer, breeder, and distributor of tropical
fish and invertebrates, as well as a leading manufacturer of fish foods. The Pet division's other
subsidiaries, George Buckton and Magnet, produce bird seed. The figures showed that a continuous increase occurred during the last 5 years in revenue, profits, dividends and earnings per share. While the The agri-food sector contributed £97.1 billion or 7.4% to national Gross Value Added (GVA) in 2012, Food manufacturing represents about 20% of that (18.8 billion) and Cranswick represent 4.5% of this food manufacturing value. The main competitors of Cranswick are Premier Foods Plc, Associated British Foods, Green core, Devro and Unilever. The company is led by chairman and cofounder Jim Bloom, and by CEO Martin Davey, who has helped lead the company's diversification since the late 1980s.
Performance This section will explain briefly the company financial performance during the last couple of years
(2012 – 2013). The main financial statements (Income statement – Balance sheet – Cash flow) will
be discussed along with a kind of elaboration on the main threats and opportunities the company
faced.
The financial statements have been prepared under IFRS as adopted by the European Union and in
accordance with the companies ACT 2006.
One of the key performance indicators of any listed company is the performance of that company
on the stock market. Cranswick was doing almost very well since mid of 2008 as it was always
performing better than FTSE 350 food producers and FTSE All share which are 2 major indexes in
London Stock. Cranswick already part of FTSE 250 index.

Page 5 of 51
For the last 5 years Cranswick was almost the best among its peers. The company achieved an
average of 10% revenue growth with an average net income 18%.
Another indicator for the continuous growth can be noticed clearly on the market capitalization of
the company which increased from Mar. 2012 (£386.6m) to Mar. 2013 (£478.5m).
Along with that a stable growth on the revenue (about 7%:8%) and equivalent increase on the
profit was announced for both 2012 and 2013.

Page 6 of 51

Page 7 of 51
Some figures and indicators of the financial statements can be considered clear evidence of the
good performance that the company claimed as follow:
The Balance Sheet
Going through the balance sheet of the last years (Assets Section), we can see that there were
some changes occurred which had slight effects on the Assets’ figures.
- Selling shares of an associate in 2012 (5.79 m£)
- Buying more properties/equipments (7.6 m£ in 2012 – 16.5 m£ in 2013)
- Selling financial assets such as capital stock or bonds (3.4 m£ in 2012 - .7 m£ in 2013)
- Increasing the inventory (Additional 2.9 m£ in 2012 – Additional 10m£ in 2013)
- Increasing receivables (Additional 6.9 m£ in 2012 – Additional 7.5 m£ in 2013)
- Decreasing cash after a significant increase on 2012 (18.8 m£) with an amount of 12.5m£
An overall overview showed that:
- Assets increase almost constantly by 6%
- Assets represent almost 50% of the total revenue

Page 8 of 51
Liabilities
Going through the balance sheet of the last years (Liabilities Section), we can see that there were
some changes occurred which had slight effects on the Liabilities’ figures.
- Increasing payables (Additional 6.1 m£ in 2012 – Additional 15 m£ in 2013) which is
obvious as the sales increased and so for the receivables.
- Decreasing Bank Overdrafts (Part of current financial liabilities) significantly from 3.925 m£
in 2011 to 1.312 m£ in 2012 and only 549K£ in 2013.
- Moving Provisioning from Current to Non Current with a decrease of about 200K£.
An Overall view is showing a slight decrease on the total liabilities along with an equity
increase.
Page 9 of 51
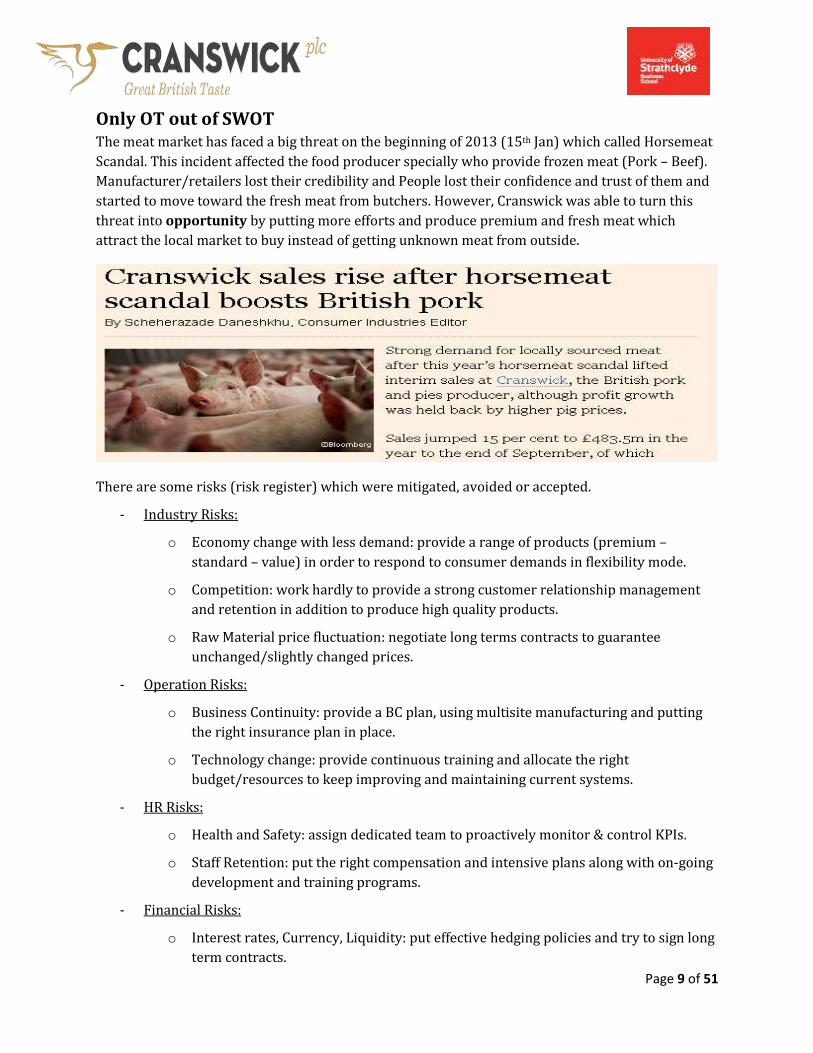
Only OT out of SWOT The meat market has faced a big threat on the beginning of 2013 (15th Jan) which called Horsemeat
Scandal. This incident affected the food producer specially who provide frozen meat (Pork – Beef).
Manufacturer/retailers lost their credibility and People lost their confidence and trust of them and
started to move toward the fresh meat from butchers. However, Cranswick was able to turn this
threat into opportunity by putting more efforts and produce premium and fresh meat which
attract the local market to buy instead of getting unknown meat from outside.
There are some risks (risk register) which were mitigated, avoided or accepted.
- Industry Risks:
o Economy change with less demand: provide a range of products (premium –
standard – value) in order to respond to consumer demands in flexibility mode.
o Competition: work hardly to provide a strong customer relationship management
and retention in addition to produce high quality products.
o Raw Material price fluctuation: negotiate long terms contracts to guarantee
unchanged/slightly changed prices.
- Operation Risks:
o Business Continuity: provide a BC plan, using multisite manufacturing and putting
the right insurance plan in place.
o Technology change: provide continuous training and allocate the right
budget/resources to keep improving and maintaining current systems.
- HR Risks:
o Health and Safety: assign dedicated team to proactively monitor & control KPIs.
o Staff Retention: put the right compensation and intensive plans along with on-going
development and training programs.
- Financial Risks:
o Interest rates, Currency, Liquidity: put effective hedging policies and try to sign long
term contracts.

Page 10 of 51
Ratios Analysis This section will have an objective of analyzing key financial performance indicators such as
(Profitability – Liquidity – Efficiency – Gearing) and provide an explanation for their
behavior/trend compared with those for the Benchmark Company and industry benchmark.
After going through market research, 2 British companies were selected for this benchmark
comparison. One is doing well which is (Devro) and the other one is considered a large one
however it is not performing well. Along with that a comparison with an American company called
Smithfield, which considered one of the largest companies on the food (meat) production
worldwide, will be used also for comparison purpose in addition to the industry
standards/benchmarks.
Basic Data

Page 11 of 51
Calculations:
ROCE = Profit - before taxes and interest (EBIT) / (Equity + Long term debt)
Cranswick 2013 = 48,205 / (273,664 + 29,572) = 15.89%
Cranswick 2012 = 49,354 / (245,932 + 42,301) = 17.12%
Devro 2013 = 40,800 / (158,000 + 39,400) = 20.66%
Devro 2012 = 42,400 / (146,900 + 29,800) = 23.99%
ROSF = Profit after tax (Net Profit) / Equity
Cranswick 2013 = 36,241 / 273,664 = 13.24%
Cranswick 2012 = 37,480 / 245,932 = 15.23%
Devro 2013 = 33,600 / 158,000 = 21.26%
Devro 2012 = 32,000 / 146,900 = 21.78%
Operating Profit Margin = Operating Profit / Sales Revenue
Cranswick 2013 = 48,205 / 875,171 = 5.05%
Cranswick 2012 = 49,354 / 820,775 = 6.01%
Devro 2013 = 40,800 / 242,700 = 16.81%
Devro 2012 = 42,400 / 241,100 = 17.58%
Gross Profit Margin = Gross Profit / Sales Revenue
Cranswick 2013 = 106,538 / 875,171 = 12.17%
Cranswick 2012 = 102,170 / 820,775 = 12.44%
Devro 2013 = 85,200 / 242,700 = 35.10%
Devro 2012 = 86,200 / 241,100 = 35.75%

Page 12 of 51
Stock Holding Period (DIO) = Inventory * 365 / Cost of Sales
Cranswick 2013 = (48,463 * 365)/ 768,663 = 23.01 days
Cranswick 2012 = (38,516 * 365)/ 718,605 = 19.56 days
Devro 2013 = (38,100 * 365)/ 157,500 = 88.29 days
Devro 2012 = (28,100 * 365)/ 154,900 = 66.21 days
Debtor Payment Period (DSO) = Trade Receivables * 365/Sales Revenue
Cranswick 2013 = (39,730 * 365)/ 508,101 = 95.58 days
Cranswick 2012 = (58,593 * 365)/ 587,005 = 95.79 days
Devro 2013 = (99,077 * 365)/ 838,000 = 87.89 days
Devro 2012 = (90,900 * 365)/ 831,100 = 83.38 days
Creditor Payment Period (DPO) = Trade Payables * 365 / Cost of Sales
Cranswick 2013 = (170,173 * 365)/ 768,663 = 87.95 days
Cranswick 2012 = (31,705 * 365)/ 718,605 = 30.86 days
Devro 2013 = (80,000 * 365)/ 157,500 = 01.50 days
Devro 2012 = (97,800 * 365)/ 154,900 = 01.10 days
Cash Conversion Cycle (CCC) = DIO + DSO - DPO
Cranswick 2013 = 23.01 + 38.82 - 50.38 = 11.45 days
Cranswick 2012 = 19.56 + 38.03 – 46.26 = 11.33 days
Devro 2013 = 88.29 + 50.53 – 61.87 = 76.65 days
Devro 2012 = 66.21 + 54.95 – 71.16 = 50.00 days

Page 13 of 51
Current Ratio = Current Assets / Current Liabilities
Cranswick 2013 = 149,889 / 113,840 = 1.31 : 1
Cranswick 2012 = 144,846/ 99,027 = 1.46 : 1
Devro 2013 = 80,300 / 34,700 = 2.31 : 1
Devro 2012 = 73,600 / 36,000 = 2.04 : 1
Quick Ratio = (Current Assets – Inventory) / Current Liabilities
Cranswick 2013 = (149,889 – 48,463) / 113,840 = 1 : 1.12
Cranswick 2012 = (144,846 – 38,516) / 99,027 = 1.07 : 1
Devro 2013 = (80,300 – 38,100) / 34,700 = 1.21 : 1
Devro 2012 = (73,600 - 28,100)/ 36,000 = 1.26 : 1
Gearing = Long term debt / (Equity + Long term debt)
Cranswick 2013 = 29,572 / (273,664 + 29,572) = 9.75%
Cranswick 2012 = 42,301 / (245,932 + 42,301) = 14.67%
Devro 2013 = 39,400 / (158,000 + 39,400) = 19.95%
Devro 2012 = 29,800 / (146,900 + 29,800) = 16.86%
Interest Cover = EBIT / Interest
Cranswick 2013 = 48,205 / 766 = 62.93 Times
Cranswick 2012 = 49,354 / 1,003 = 49.20 Times
Devro 2013 = 40,800 / 3,300 = 12.36 Times
Devro 2012 = 42,400 / 3,100 = 13.67 Times

Page 14 of 51
Price Earnings Ratio = Stock price of ordinary share / EPS
Cranswick 2013 = 9.86 / 0.750 = 13.14
Cranswick 2012 = 8.05 / 0.785 = 10.25
Devro 2013 = 16.70 / 0.201 = 83.08
Devro 2012 = 16.60 / 0.194 = 85.56
Dividend Yield = Dividend value / Stock price of ordinary share
Cranswick 2013 = 0.206 / 9.86 = 2.08%
Cranswick 2012 = 0.195 / 8.05 = 2.42%
Devro 2013 = 0.0855 / 16.70 = 0.51%
Devro 2012 = 0.0815 / 16.60 = 0.49%
Ratios:

Page 15 of 51
Reasons of Ratios Changes
Profitability Ratios
ROCE is a main KPI that enable people to evaluate how much profit this business is returning from the invested capital on it. Simply, Return on Capital Employed is the value of operating profit generated for each investment of £1.
This ratio shows also how efficient the business uses its resources. If the ratio is low, it means that the company might need to invest part of its assets into another type of investments such as a high interest bank account (This almost valid for a small, unprofitable business that has high value assets such as property). Decreasing the Long term debt will be also reflected on a good ROCE ratio.
For Cranswick, it was clear the long term debt is not that much and will not improve ROCE ratio and affects the company performance if it get reduced. The main reason of that low ROCE is because of the low profit (EBIT) compared to the company equity. In order to get a better figure, profit should be increase, company assets should be used and invested efficiently.
Growth Profit Margin
This ratio represents the percentage of profit before considering the overhead or the non-direct
cost. It only considers the direct cost (cost of material – labor cost) and compares it to the sales
revenue. Having this percentage High or low doesn’t mean anything as it very sensitive to the
industry and business type however High Gross profit margin will give better chance to achieve net
profit. This ratio can change easily as long as the cost of goods gets changed up and down. Saving or
decreasing the cost will result on a better gross profit margin and likely better net profit.
For Cranswick, it is almost the same gross profit margin as the cost of goods seems to be increasing
linearly with the sales revenue.
EBIT
This ratio represents the percentage of profit after deducting the overhead (OPEX) and before Tax
& Interest. It considers the direct and non-direct cost and shows almost the net profit. This
percentage can be affected by either increasing or decreasing the non-direct cost. Fixed cost such as
rent, machines, administration and management payroll, etc is of great impact on the final
percentage calculated.
For Cranswick, There was a 10% increase on this non-direct cost which seems to be related to new
human resources and machineries. The final ratio didn’t get affected as the overall sales revenue
got increased so the ratio of EBIT kept on the same level (6%).
Net Profit
This ratio represents the percentage of the final profit after deducting Interest and Tax. This value
is affected by the loans (interest) and revenue (Tax). The more loans the company took the more
interest they will pay end of each year. Selecting a good interest rate and a good channel to get

Page 16 of 51
money (Loans – Bonds) is crucial and easily impact the bottom line of the company (Net Profit). On
the other hand, trying to make use of government Tax allowance will decrease the paid Tax and
increase the net profit ratio.
For Cranswick, although the interest dropped by 30% the net profit percentage dropped to be 4.1%
(4.5% in 2012). This happen because the gross profit margin already dropped however the Tax got
increased (normally because the revenue got increased). The conclusion was that the overall
percentage of net profit affected negatively despite the fact that interest got decreased which means
interest is not of great impact on the percentage unless the debt is too high.
Efficiency Ratios
Stock Holding Period (Inventory turnover period)
This ratio measures the management efficiency in using the company inventory to produce and sell
goods. A large number of days means that management is storing the inventory for long time. This
might be negatively because of either a poor inventory control or a lack of demand from the
market. On the other hand, positive reasons might lead to the increase in stock holding period such
as taking advantage of discounts if buying bulks, reducing the risk of going out of stock or being
ready for expected increase in orders. In both situations, there is an implication of increasing this
period where the costs of storing, handling and insuring this stock will accordingly increase. There
is also an increased risk of inventory damage, expiry or obsolescence.
For Cranswick, The inventory kept on a low level and is sufficient for less than a month (23 days in
2013, 20 days in 2012). The policy used is First-in, First-out.
Debtors Payment Period (Receivables collection period)
The ratio shows how long it takes to collect money from customers after they have purchased
goods. The healthy collection period should be always in-line with the payment terms of the company and its credit policy and should be compared with previous period figures. Long debtors’ payments period is usually considered a bad sign representing improper credit control which may lead to irrecoverable debts. However, this long period might be due to the company policy to attract more customers or offering specific customer(s) different payment terms for such reasons. On the other hand, falling receivables collection period is a good sign, although it might be an indicator that the company have a cash shortage.
The collection receivables period might be a year-end figure or the average for the whole year. When the average is used to calculate the number of days, the ratio is the average number of days' credit taken by customers.

Page 17 of 51
For many type of businesses, the sales revenue is normally used as the cash sales will be neglectable (Non retail business is an example). However, for cash-based businesses, such as supermarkets whose cash transactions represent the majority of their sales, the receivables collection period should be calculated by considering only credit sales activities.
As mentioned above, the result should be compared with the company credit policy. A common credit terms is a period of 97 days or ‘at the end of the month following delivery. The ratio can be distorted by:
using year-end figures which do not represent average receivables factoring of accounts receivables which results in very low trade receivables sales on unusually long credit terms to some customers.
For Cranswick, the company makes a significant proportion of its sales to the major UK supermarket groups, which correspondingly represent a significant proportion of the company trade receivables at any one time. Based on the financial strength of their customers, the directors of Cranswick don’t consider any credit risk and easily their collection period is less than their payment to suppliers’ period (93 days in average).
Creditors Payment Period (Payables payment period)
This ratio represents the credit period taken by the company from its suppliers. A long credit period may be good for the company as it provide a source of free finance for the operation. It also may indicate that the company is unable to pay more quickly because of liquidity/cash issues.
If the credit period is long:
the company may develop a poor reputation as a slow payer and may not be able to attract new suppliers
existing suppliers may decide to discontinue supplies the company may be losing out cash/short term payment discounts.
For Cranswick, as mentioned above the period of paying back their suppliers is good compared
with the receivable period. It went up from 46 days in 2012 to 50 days in 2013. The more days the
company is able to extend the more cash they might have and the more business they can do.
However, the less period they have to pay their suppliers, the more cash they need to fulfill
suppliers’ need which will affect the company cash flow.
Cash Conversion Cycle
This ratio is important for retailers and similar businesses. It illustrates how quickly the company
can convert its current assets (most probably products) into cash through sales. The shorter the
cycle, the less time capital is tied up in the business process, and the better for the company's
bottom line.
For Cranswick, The cash conversion cycle is pretty wonderful as it goes down to 11 days which
means they are able to convert their inventory/receivables to money 3 times per month. This
excellent vale achieved by decreasing the inventory period, decrease the collection period and
increase the suppliers payment period.

Page 18 of 51
Financial structure Ratios
Gearing
The most important point to focus in while assessing the financial position of a company is its stability and willing to take risk. This is can be evaluated by considering the structure of the business and the way it is financed which can be called gearing. There different way o to measure gearing. One of these methods is to compare the outstanding debt a company has to the company equity finance.
External debt financing is considered to be more risky than equity financing, as there are mandatory repayment obligations linked with the first one to lenders while there are no mandatory obligations to pay shareholders in the second case. In case of failure to meet the debt financing obligations, the company will face insolvency or bankruptcy. Failure to pay a dividend would not lead to insolvency proceedings.
The cost of servicing equity finance is higher than it is for servicing external debt. This is because equity holders expect a greater return than what they could achieve in case of offering a fixed loan to a company. Lenders received fixed, mandatory repayments. They also take out security on the assets of a company. On the other hand, Equity holders get no guaranteed returns and they take on considerable risks. That’s why they would expect greater returns on their investments; if they could not achieve this they would not take the risk of buying shares and will prefer to lend their money instead.
Therefore highly geared companies (high level of debt to equity) are considered to be riskier and could go bankruptcy but comparatively cheaper to service than lower geared companies (and vice versa). Low-geared companies think of increasing borrowings when there are potentially profitable opportunities available as they are generally perceived to be less risky by banks and can therefore borrow more easily.
There are a number of methods available for reducing a company's gearing ratio, including:
- Sell shares in the company to settle debts.
- Convert loans into shares in the company after negotiation with lenders.
- Decrease working capital and produce more cash to pay debts (speed up receivable
collections, reduce stock levels, and extend the period to pay suppliers).
- Use any methods to increase profits, which should generate more cash with which to pay
debts.
For Cranswick, it is low geared company with a good positioning with Banks and debtors. They are
keen to keep the gearing at its lowest level. This can be noticed in the drop of this ratio from 15% in
2012 to 10% in 2013.
* Cranswick Annual report calculate the gearing ratio using another formula
Gearing = Long-Term Debt / Average Total Assets

Page 19 of 51
Interest cover
This ratio represents the company capability to pay its financial liabilities interest out of generated
profits. Low interest cover tells shareholders that their dividends are at risk as the profit is mainly
spent to pay interest. In this case, that company might face difficulties financing its loans if the
profits fall. If the interest cover is less than two, it is considered unsatisfactory or in-danger. The
higher ratio the company has the better financial health it has as it means that the company can
easily meet its interest obligations from operating earnings with a good surplus. However, a high
interest cover may also indicate that the company is dropping opportunities to increase its
earnings.
A business must have a sufficient level of long-term capital to finance its long-term investment in
non-current assets. Part of the investment in current assets would usually be financed by relatively
permanent capital with the balance being provided by credit from suppliers and other short-term
borrowings. Any expansion in activity will normally require a broadening of the long-term capital
base, without which 'overtrading' may develop.
It is very important for the company to choose the relevant and suitable financing method for its
activities. While a short term debt can’t be used to finance a permanent expansion of a company's
activities, a short-term increase in activity (specific month sales) could be financed by this type of
financing.
For Cranswick, The interest cover is increased and reached 62.9% in 2013. This happen because they are keen to reduce their loans and use the overdrafts at its minimum levels. They were able to strongly generate cash in 2013 which resulted in lower average borrowings
Page 20 of 51
Liquidity/Solvency ratios
Current ratio
The current ratio always presented in the format of x :y. This ratio measures the feasibility of meeting current liabilities using the current assets. It is good for the company to have this figure high so they can fulfill safely their liabilities but this high value can be also a result of high level stock (Low demand or failure to sell) or too much receivables (Bad credit policy & control).
A current ratio of 2:1 or higher is considered appropriate for most industries. However, a figure of 1.5:1 is the most normal ratio. People deal with this ratio from different perspectives. It seems clear for short-term lenders that they will prefer a high current ratio as it reduces risk. However, investors may prefer a lower current ratio since they are more concerned about growing the business using assets of the company. The current ratio should be, however, looked at in the light of what is normal for the business. It is also worth considering:
availability of further finance, e.g. is the overdraft at the limit? seasonal nature of the business – one way of doing this is to compare the interest charges in
the income statement with the overdraft and other loans in the statement of financial position; if the interest rate appears abnormally high, this is probably because the company has had higher levels of borrowings during the year
long-term liabilities, when they fall due and how will they be financed nature of the inventory – where inventories are slow moving, the quick ratio probably
provides a better indicator of short-term liquidity.
For Cranswick, The current ratio looks good as it resides between 1.5:1 and 1.3:1. This ratio indicates a good capability of the company to pay its liabilities using its assets easily without having some assets wasted without a short or long term investment. The figure can be changed to be safer (up to 2:1) by decreasing the liabilities.
Quick ratio
This ratio is the same as current ratio but eliminating the inventory from current assets figure. It checks if the company has sufficient liquid resources (receivables and cash) to settle its liabilities or not. It is normal level resides between1:1 and 0.7:1.
Similar to the current ratio, the quick ratio is relevant to the nature of the business and industry. The current assets used on the calculation include bank, cash, short-term investments and trade receivables and exclude inventory. While current liabilities include bank overdraft, trade payables, tax and dividends. Income tax liabilities may be excluded. A low quick ratio might not always mean that the company has problems in paying its liabilities as the company might have sufficient overdraft facilities available.
For Cranswick, A more stable quick ratio is achieved in 2013 by decreasing the value from 1.07:1 in 2012 to .089:1. As mentioned above, the overdraft facility that Cranswick has also affects this ratio and makes it low.

Page 21 of 51
Ratio Comparison
A calculation for 3 different companies in addition to Cranswick was done. Devro was selected to be
the main benchmark company. Premier foods (UK) and Smithfield (US) were added to the
comparison to make it more reliable and useful. Along with that the industry benchmark is used to
show where Cranswick is located among other peers.

Page 22 of 51
Profitability Ratios
Cranswick is very close to the industry standard (Food Production). It has good figures on ROCE
(16% while the industry standard is 15%). Operating profit, ROE and Net profit are little bit behind
the industry (6% < 8% , 15% < 19% , 4.5 < 6.8%). However on the gross profit margin there is a big
gap between Cranswick and the industry standard (12% & 40%). There are 2 possibilities for that
high cost of sales figure. Either the company use a different approach in their calculations (put most
of the cost as direct cost), or they are getting expensive materials than their peers (Devro has
35% gross profit margin and the industry standard is 40%). Comparing salaries/wages for both
companies doesn’t show much as it represents about 18% of Cranswick cost and about 37% of
Devro cost but both reports don’t mention how much out of these salaries is part of COG and how
much included in the OPEX. The second option still seems to be more valid as the final net profit
percentage vary from 4% for Cranswick and 14% for Devro.
However, although Cranswick seems to be behind the industry standards and its main competitor
Devro in UK market, It is still in sync with Smithfield , the American pork manufacturing leader, in
their figures and ratios. Comparing both of them together will result on an almost identical result
which might tells that both of them are doing well but Devro is doing excellent!

Page 23 of 51
Liquidity Ratios
Cranswick is behind all other companies on that comparison. It is only ahead of Premier Foods
Company which is already suffering on the market and making loss with bad cash flow. The average
current ratio should be between 1.5:1 and 2:1 and the industry standard is 1.76 however Cranswick
has a ratio of 1.46 in 2012 dropped to 1.32:1 in 2013. Comparing it with Devro (2:1 in 2012 , 2.3:1
in 2013) or with Smithfield (2.9:1 in 2012) showed that Cranswick is not doing very well in this
area and might have liquidity issues in case they are in a need of cash. Similarly, Quick ratio shows
the same lag between Cranswick and others. While the industry standard is about 1:1, Devro quick
ratio is 1.22:1, Smithfield = 1.08:1 and Cranswick is very close to Premier Foods (0.86 “1:1.10” and
0.81 “1:1.89” ) which is not as good as what should be expected.
A deep analysis of the balance sheet and efficiency ratios might clarify these low ratios. Having a
short inventory period (23 days while Devro has 88 days) might be the reason of the low
percentage of current/quick ratio. While both ratios use the current asset as part of their equations,
not storing materials/products for long time decrease the figure of this current asset and resulted
on low efficiency ratios. Inventory management policy of the company should be revised and a
decision should be taken either to increase the period which will result on good ratios but might
affect the inventory performance and increase the storing costs, or maintain the current policy and
accept these low ratios.
Page 24 of 51
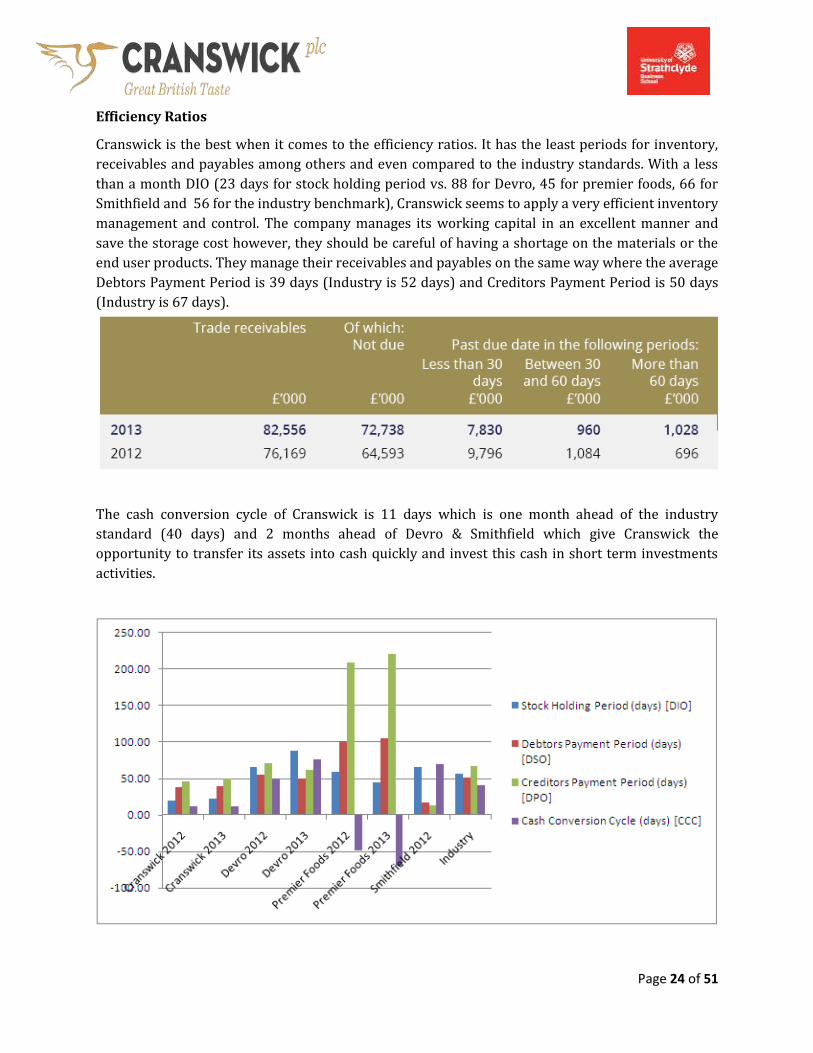
Efficiency Ratios
Cranswick is the best when it comes to the efficiency ratios. It has the least periods for inventory,
receivables and payables among others and even compared to the industry standards. With a less
than a month DIO (23 days for stock holding period vs. 88 for Devro, 45 for premier foods, 66 for
Smithfield and 56 for the industry benchmark), Cranswick seems to apply a very efficient inventory
management and control. The company manages its working capital in an excellent manner and
save the storage cost however, they should be careful of having a shortage on the materials or the
end user products. They manage their receivables and payables on the same way where the average
Debtors Payment Period is 39 days (Industry is 52 days) and Creditors Payment Period is 50 days
(Industry is 67 days).
The cash conversion cycle of Cranswick is 11 days which is one month ahead of the industry
standard (40 days) and 2 months ahead of Devro & Smithfield which give Cranswick the
opportunity to transfer its assets into cash quickly and invest this cash in short term investments
activities.

Page 25 of 51
Financial Structure Ratios
Cranswick is a low Gearing Company as per the standard definition of gearing (Ratio below 25%).
The calculation showed that 2013 gearing ratio is 10% which is less than 2012 value (15%).
Compared with Devro (17% in 2012 – 20% in 2013), Cranswick seems to have conservative
financial management who tries to be safe and not getting too much debts or taking much more
risks. This can be a good sign of financial stability however they might miss some investment or
growth opportunities because of that behavior. On the other hand, having more than 50% gearing
ratio means that the company is high gearing one and that means that the company is in risk and
might risk bankruptcy (Premier Foods Company is an example).
Interest Cover is another ratio that shows the company capabilities of paying its interest from
profit. Cranswick seems to have a very good ratio of that (62.9) which mean they have a profit equal
to 62 times their interest, however being that far from the industry standard (8.95) means again
that there are some growth opportunities missed because of the conservative policy Cranswick
management follow. On the other hand, Devro are more open to the investment opportunities
where they have 13 to 12 times profit than interest which means they get more loans to do more
projects. Premier Foods on the other hand doesn’t have profit to cover their interest in 8718!
Cranswick has a potential earning growth than Premier Foods and Smithfield but still it is less than
the industry Benchmark (13.15 vs. 21.3). Comparing it with Devro shows that Devro is very
attractive to investors more than Cranswick which again can be referred to the conservative policy
the management apply in Cranswick. On contrary, Dividend yield shows that the return per share
for Cranswick is more than same for Devro (2% vs. 1%) and close to the industry standard (3%)
Finally, Possibility for Cranswick for Bankruptcy is 2% while it is 16.5% for Devro.

Page 26 of 51
Cash flow

Page 27 of 51
Going through the cash flow statement of both 2012 and 2013 will show the following:
- Profit before interest and Tax (in Red) was 48.205m for 2013 and 49.354m for 2012
- The major items on the operating cash section are:
o Depreciation (in Green): 15.486m for 2013 and 13.972m for 2012
o Increase in Working Capital (in Blue): 4.3m in 2013 and 4m in 2012
- Investment in property (in Brown): 30.8m in 2013 and 20.3m in 2012
- Acquiring new subsidiary (in Brown): 5.9m in 2013 (Sale of associate 14.5m in 2012)
- Repayment of borrowings (in Purple): 14m in 2013 and 7m in 2012
- Shares dividends (in Purple): 11.4 in 2013 and 11.8m in 2012
The cash used in investing increased from 3.2m in 2012 to 35.4m in 2013. The cash used for finance
activities increased from 20.8m in 2012 to 26m in 2013 and the overall net cash dropped from
18.7m in 2012 to 7m in 2013. It is clear that Cranswick was in a better cash situation in 2012
(recovering from a bad one in 2011). It started the year of 2012 with a negative cash flow (2.6m)
and was able during the year to reach 18.7m. However, in 2013 they lost 11m of this cash and end
up with 7m.
They seem not to be in a big risk yet as they purchase property for investment purpose which is
added to their assets. But they should be careful of going into negative cash flow again as the
expected increase of working capital will be on the same range (5m) and that mean they have to
incur more profits (The new subsidiary purchased should increase their profit)and slowdown their
investment activities in order to keep the cash level on a good position specially if we consider that
their liquidity ratios are not good enough which means they will not be able to get cash easily from
the company if needed (Inventory – Receivables). On the other hand, they are in a good position
from debts point of view which means in case of any shortage they still can increase their loans or
even sell some assets or subsidiary.
As part of Cranswick strategy, some acquisition transactions happened (such as Kingston Food) to
fulfill the company commitment to deliver premium products to its customers. East Anglian Pigs is
another acquisition (RSPCA accreditation). A riverside fresh port facility was another activity along
with construction of a pastry plant in Malton. All of these activities will be contributing to the
company long term growth plan even though they cost it some of its cash now.

Page 28 of 51
Non-financial performance indicators
Cranswick, as part of its missions and responsibility, is considering people and environment very
seriously. The company put some objectives (Non financial) and tries to achieve them hardly.
One of these objectives is about its people. Cranswick push toward ethics, equality, diversity and
continuous training and development. The company is aiming to provide a fair and consistent
environment to its employees. On-going training and development is a major pillar of the HR policy
the company has as it result on an employee satisfaction and accordingly a positive outcome for the
whole company.
Health and Safety is another pillar that Cranswick give it serious attention. The factory based
Health and Safety coordinators hold the appropriate National Examination Board in Occupational
Safety and Health (NEBOSH) qualification. All new machinery will not be used as long as they are
not complying with the latest certificate with the conformity (CEE). All sites within the company
achieved British Standard 18001, the Occupational Health and Safety Management System. Looking
into the accidents chart below will give some insights about that.

Page 29 of 51
After the scandal of Horsemeat, Cranswick was keen to do a quality check on its suppliers and meat
and out of 85% of its materials, 0% was reported to be positive for horsemeat or any
contamination. Quality is a major concern for Cranswick which lead to many awards on the
industry and the market.

Page 30 of 51
Cranswick has a 2020 strategy and targets. One of these targets is to decrease its Carbon
footprints. The company carbon footprints fall by 1.5% although the production increased by 4%.
As a part of the company Green Thinking, Cranswick was able to out-perform its target. Inspired by
this success, a new challenging target was set (30% reduction by 2020). Now, carbon footprint is
already 14% less than what was recorded in 2010 which is considered a good startup and
promising sign. Over the same time period, the company’s absolute carbon footprint get reduced by
7% despite the fact the production is increased.
The tonnage of waste has been reduced by 47% over 2,500 tonnes. New Waste
management policy is applied in 8718 and more of the waste now is going to ‘Waste to
Energy ‘. The company is targeting Zero waste within the coming couple of years. After
partnering with Biffa IRM, all recyclable materials now are removed from the waste stream
and sent to re-processors. This approach increases the recycled material available amount
for the UK manufacturing sector. On the same time, it reduces dramatically the reliance on
disposal methods such as landfill. Since Biffa IRM’s involvement began in April 8718,
Cranswick made amazing progress. Now, only 7% of waste is sent to landfill while
previously it was 70%. (93% of the company’s waste is landfill avoided).

Page 31 of 51
On the water usage side, there was a significant increase lately which led to a discussion on
reducing the consumption or reusing the water. A dedicated project will be under study for that
purpose in order to grant Cranswick commitment to a reduction of 20% on water usage by 2020
(Federation House Commitment).
Energy consumption also increased and the cost of that in addition to its environment effects
justifies the need of investing in energy efficient equipments and building. Solar panels, heat
recovery and induction lighting are all used now.
On the society level, Cranswick encourage engaging local communities and that’s why almost 57%
of employees are living within 10 miles of their workplace. An annual Golf day is held and over
30K£ (its return) is directed to Kids Charity. The red lion brand contributes its profit to Forces
Charity. One of the initiatives toward the environment and community was to plant 4,000 trees at
Preston site.

Page 32 of 51
Conclusion and Recommendations
After going through the last few sections, it is clear that there are some actions should be taken in
order to improve the company performance.
- Decrease the cost of revenue (COG) in order to be in sync with the industry standard and
the competitors. Regardless of the increase of Pigs and Pigs feed in 2013, Cranswick still
considered incurring too much cost for its revenue which need to be discussed with its
suppliers. The company should rely more on their internal production and farms. They
should cut some of the indirect cost (operation expenditures) to recover the high cost of
sales and end up with a better operating profit. Another approach is to negotiate long tern
contract with better prices in order to decrease cost of materials.
- Invest more on acquiring companies that can increase the profit of the company and make
use of the growth opportunities the company has. Continuous acquisition is serving the long
term objectives of the company and will keep and increase the company market share.
- The company should work seriously to improve the liquidity ratios (current – quick). This
can happen by increasing the current assets (receivables – cash – inventory) and decrease
current liabilities (payables – short term loans).
- The cash flow handling needs more attention as it reach to low level at end of 2013 fiscal
year. The company invests about 50% of its cash and end up with cash less than its
operating cost and also its working capital. In order to have healthy cash situation it is
favorably to use the cash in short term investment instead of long term ones. Loans might
be more suitable for new projects and initiatives without affecting the current cash the
company has.
- The company can make use of its retained earnings for growth. They can skip paying
dividend for the year they are going to do huge investment of growth in instead of using the
company available cash.
- The interest cover ratio is too far from the industry standard which means that the
company has a very good capability of paying its interest if borrows. That is another reason
why Cranswick should consider getting more loans or bonds to fund their future projects
and expansion.
The current financial position of the company looks strong and safe for investors with a
neglected possibility for bankruptcy (2%). They don’t have this much loans or liabilities. The net
cash flow is still positive even it is little bit low. Their efficiency ratios are excellent with a good
capability of transferring their current assets into cash. The inventory turnover is good and the cash
conversion cycle is awesome. ROCE seems to be good however the company with its capabilities
and performance should do better than that easily. Overall, it is a stable company with a constant
and small growth. The management is little bit conservative that’s why they are slow and cautious
of expanding and growing. From financial market perspective, there is no risk on investing on
this company however there is no great return on that although EPS and dividend are good.

Page 33 of 51
Here, there is a market feedback from an investor

Page 34 of 51

Page 35 of 51
Appendix A - References http://www.referenceforbusiness.com/history2/18/Cranswick-plc.html http://cranswick.plc.uk/about-us/our-business http://en.wikipedia.org/wiki/Cranswick_plc http://www.google.co.uk/finance?cid=15066210 http://en.wikipedia.org/wiki/2013_meat_adulteration_scandal http://www.ft.com/intl/cms/s/0/e8da4ab0-55d9-11e3-96f5-00144feabdc0.html#axzz3QcmvV2PA http://www.bbc.com/news/business-25715666 http://financials.morningstar.com/competitors/industry-peer.action?t=CWK®ion=gbr&culture=en-US http://www.bloomberg.com/research/stocks/snapshot/snapshot.asp?ticker=CWK:LN http://www.google.co.uk/finance?cid=15066210 http://www.sharesmagazine.co.uk/articles/tuck-into-unloved-food-producers#.VM4CwdKUePy http://www.ngfn.org/resources/ngfn-database/knowledge/2013%20Food%20Hub%20Benchmarking%20Report.pdf http://biz.yahoo.com/p/340conameu.html http://www.macroaxis.com/invest/compare/CWK.L http://www.fundinguniverse.com/company-histories/cranswick-plc-history/ http://csimarket.com/Industry/industry_Financial_Strength_Ratios.php?ind=505 http://www.bizstats.com/corporation-industry-financials/manufacturing-31/food-manufacturing-311/show?asset_class_id=10&submit=Apply http://www.pwc.com/us/en/retail-consumer/financial-performance-report/assets/financial-performance-report.pdf http://www.cranswick.plc.uk/environmental-initiative-year-2014 http://kfknowledgebank.kaplan.co.uk/wiki%20pages/home.aspx

Page 36 of 51
Appendix B – Cranswick Financial Statements
2012 Income Statement
Page 37 of 51
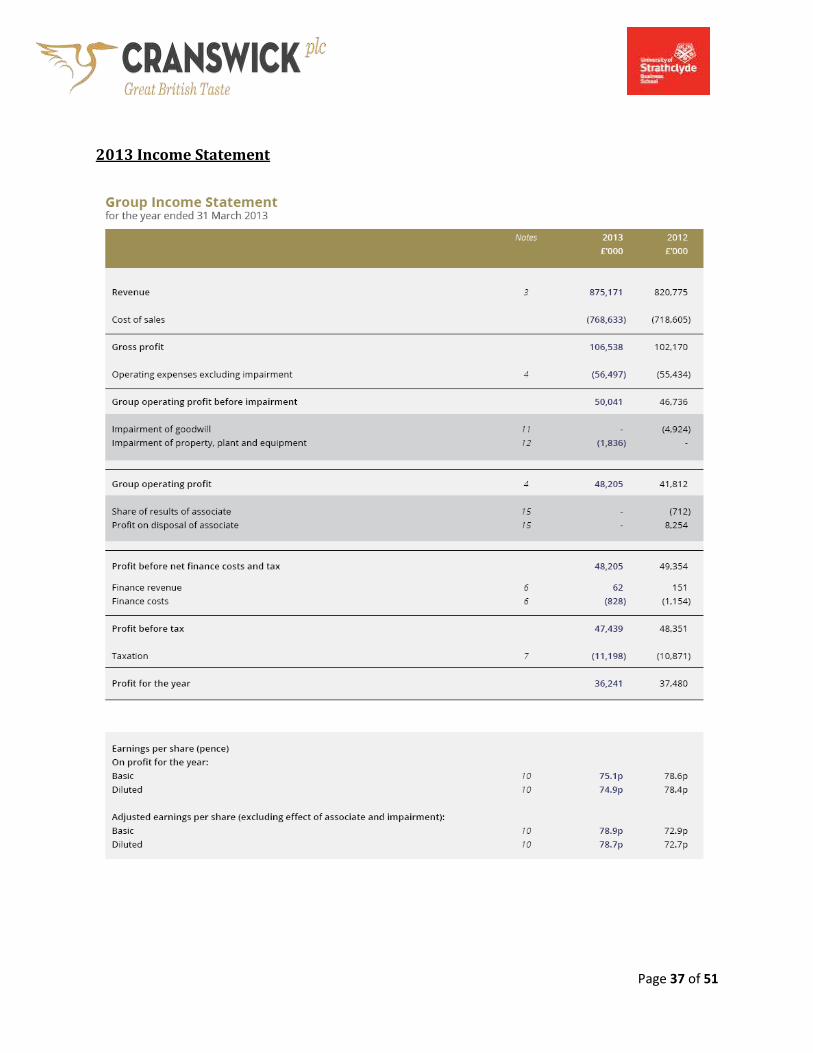
2013 Income Statement

Page 38 of 51
2012 Balance Sheet

Page 39 of 51
2013 Balance Sheet

Page 40 of 51
2012 Cash Flow Statement

Page 41 of 51
2013 Cash Flow Statement

Page 42 of 51
Appendix C – Devro Financial Statements 2012 Income Statement

Page 43 of 51
2013 Income Statement

Page 44 of 51
2012 Balance Sheet

Page 45 of 51
2013 Balance Sheet

Page 46 of 51
2012 Cash Flow Statement

Page 47 of 51
2013 Cash Flow Statement

Page 48 of 51
Appendix D – Smithfield Statements

Page 49 of 51
Appendix E – Premier Foods Statements
2013 Balance Sheet

Page 50 of 51
2013 Income statement

Page 51 of 51
Appendix F – Assignment Reflection Evaluation As a quick feedback on the assignment, one of the most important comments that need to be considered is the company selection. This activity should be considered as a part of the assignment sections and being evaluated with the whole assignment evaluation. In this case, all students will explain in details the selection process, the trials to get companies meeting the assignment criteria (Not making loss, Not involved on a merger transaction, target and benchmark of the same industry and business activities, etc…) and the reason why the student choose this company. On the other hand, if the selection process is not evaluated (such is the case now), a better handling of the selection process should be considered. A better classification for companies should take place and ready list should be shared with students including only companies that have peers on the list with the same business line. The list should include a better variety of industries and wide range of companies on each industry. It must exclude any company with no peer or equivalent company.