Embed Size (px)
Citation preview

3
Creating the future in automotive retailing
2001 Annual Report
213702_G1AnnART.ind 4/15/02, 8:08 AM3
4
Profi le
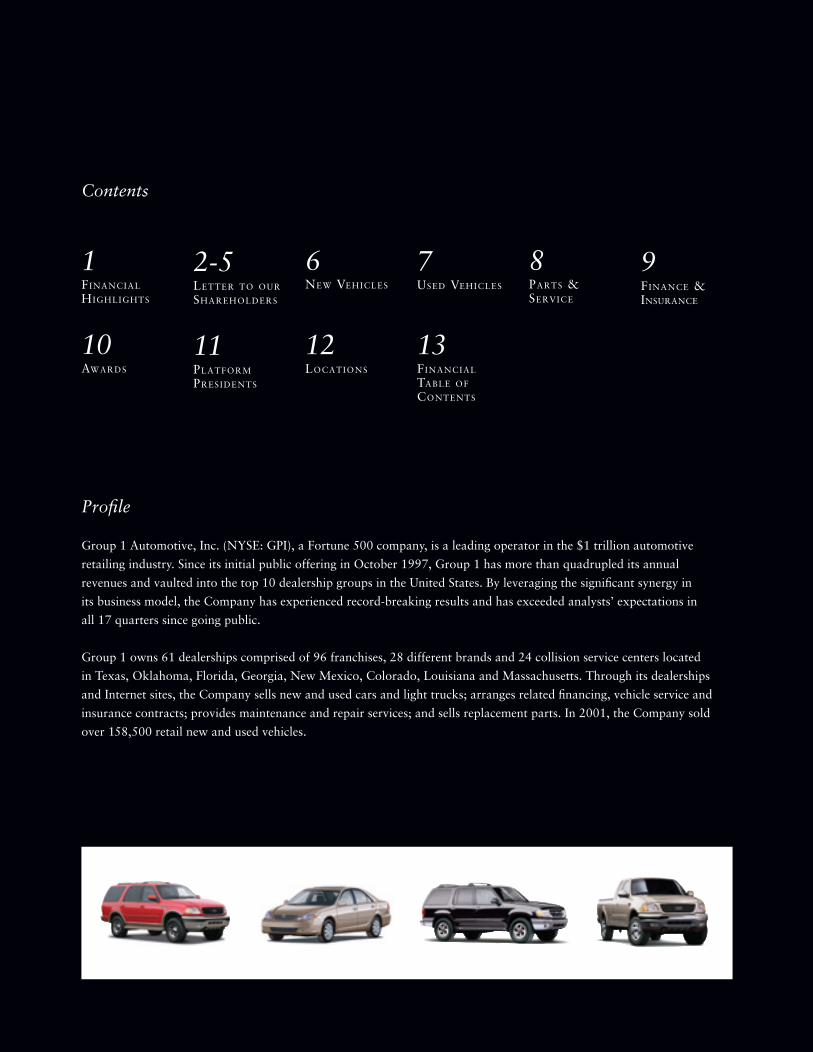
Group 1 Automotive, Inc. (NYSE: GPI), a Fortune 500 company, is a leading operator in the $1 trillion automotive
retailing industry. Since its initial public offering in October 1997, Group 1 has more than quadrupled its annual
revenues and vaulted into the top 10 dealership groups in the United States. By leveraging the signifi cant synergy in
its business model, the Company has experienced record-breaking results and has exceeded analysts’ expectations in
all 17 quarters since going public.
Group 1 owns 61 dealerships comprised of 96 franchises, 28 different brands and 24 collision service centers located
in Texas, Oklahoma, Florida, Georgia, New Mexico, Colorado, Louisiana and Massachusetts. Through its dealerships
and Internet sites, the Company sells new and used cars and light trucks; arranges related fi nancing, vehicle service and
insurance contracts; provides maintenance and repair services; and sells replacement parts. In 2001, the Company sold
over 158,500 retail new and used vehicles.
Contents
1FINANCIAL
HIGHLIGHTS
10AWARDS
2-5LETTER TO OUR
SHAREHOLDERS
11PLATFORM
PRESIDENTS
6NEW VEHICLES
12LOCATIONS
7USED VEHICLES
13FINANCIAL
TABLE OF CONTENTS
8
PARTS &SERVICE
9FINANCE &INSURANCE
213702_G1AnnART.ind 4/15/02, 8:08 AM4
1
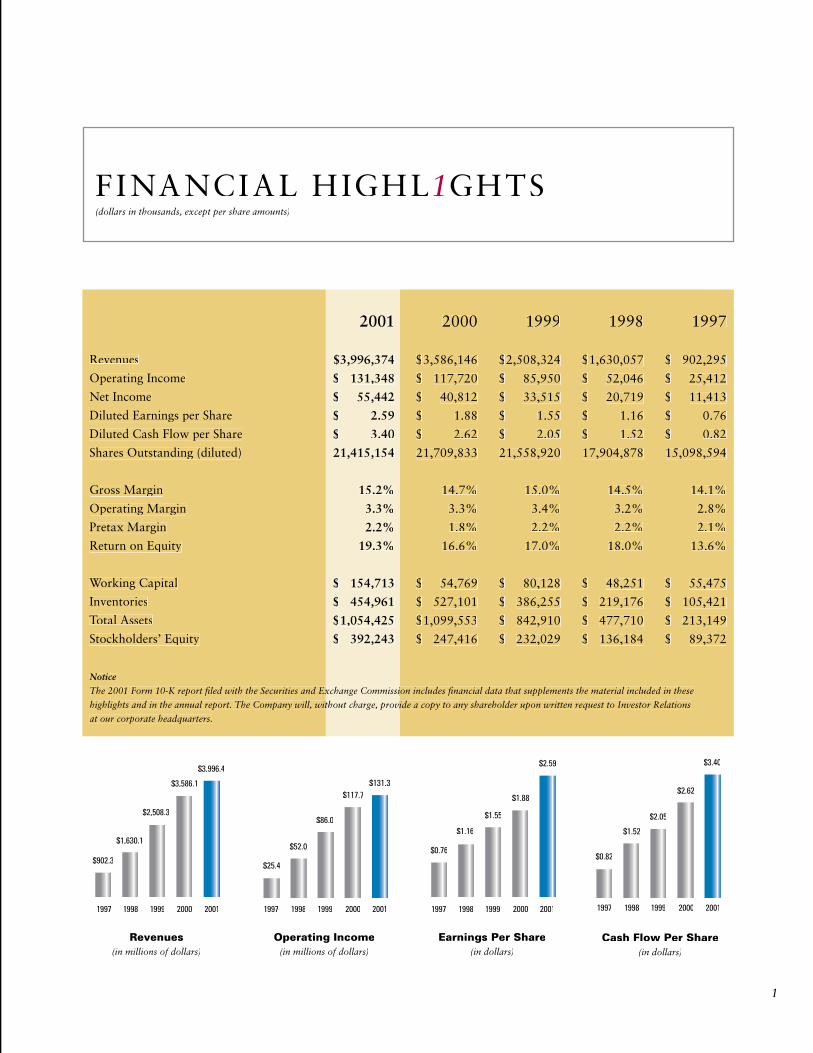
FINANCIAL HIGHL1GHTS(dollars in thousands, except per share amounts)
2001
$3,996,374
$ 131,348
$ 55,442
$ 2.59
$ 3.40
21,415,154
15.2%
3.3%
2.2%
19.3%
$ 154,713
$ 454,961
$1,054,425
$ 392,243
2000
$3,586,146
$ 117,720
$ 40,812
$ 1.88
$ 2.62
21,709,833
14.7%
3.3%
1.8%
16.6%
$ 54,769
$ 527,101
$1,099,553
$ 247,416
1999
$2,508,324
$ 85,950
$ 33,515
$ 1.55
$ 2.05
21,558,920
15.0%
3.4%
2.2%
17.0%
$ 80,128
$ 386,255
$ 842,910
$ 232,029
1998
$1,630,057
$ 52,046
$ 20,719
$ 1.16
$ 1.52
17,904,878
14.5%
3.2%
2.2%
18.0%
$ 48,251
$ 219,176
$ 477,710
$ 136,184
1997
$ 902,295
$ 25,412
$ 11,413
$ 0.76
$ 0.82
15,098,594
14.1%
2.8%
2.1%
13.6%
$ 55,475
$ 105,421
$ 213,149
$ 89,372
Notice
The 2001 Form 10-K report fi led with the Securities and Exchange Commission includes fi nancial data that supplements the material included in these The 2001 Form 10-K report fi led with the Securities and Exchange Commission includes fi nancial data that supplements the material included in these
highlights and in the annual report. The Company will, without charge, provide a copy to any shareholder upon written request to Investor Relations highlights and in the annual report. The Company will, without charge, provide a copy to any shareholder upon written request to Investor Relations
at our corporate headquarters.
Revenues
Operating Income
Net Income
Diluted Earnings per Share
Diluted Cash Flow per Share
Shares Outstanding (diluted)
Gross Margin
Operating Margin
Pretax Margin
Return on Equity
Working Capital
Inventories
Total Assets
Stockholders’ Equity
Revenues(in millions of dollars)
Operating Income(in millions of dollars)
Earnings Per Share(in dollars)
Cash Flow Per Share(in dollars)
$3,996.4
$902.3
$1,630.1
$2,508.3
$3,586.1
$25.4
$52.0
$86.0
$117.7$131.3
$2.59
$0.76
$1.16
$1.55
$1.88
$0.82
$1.52
$2.05
$2.62
$3.40
1997 1998 1999 2000 2001 1997 1998 1999 2000 2001 1997 1998 1999 2000 2001 1997 1998 1999 2000 2001
213702_G1AnnART.ind 4/16/02, 8:48 AM1

2
LETTER TO OUR SHAREHOLDERS
Dear Shareholders:
There can be no question that 2001 was a year of
unprecedented challenges. We extend our thoughts
and prayers to all who were personally affected
by the events of September 11th. This tragedy
coupled with a softening economy created a
diffi cult environment for companies across
many different sectors.
Our 38.0 percent growth in earnings per share in
2001 has captured the attention of the fi nancial
markets. Once again, we achieved double-digit
earnings per share growth and beat the investment community’s earnings expectations
every quarter this year. With fi nancial markets that could be categorized as anything but
favorable, Group 1 successfully completed an offering of 3.3 million shares of common
stock in October 2001 and raised $100 million. Our enhanced capital position ensures
that Group 1 has the resources available to pursue signifi cant acquisition opportunities
in the trillion-dollar automotive retailing business. We are also pleased that our stronger
balance sheet generated a rating upgrade for our public debt by Standard & Poor’s in a
year that saw rating downgrades exceed rating upgrades by over six to one.
In times of economic weakness, the automotive manufacturers and suppliers are often
negatively impacted. However, our unique position in the automotive industry value
chain as a specialty retailer and service company has driven our record operating
results. At the onset of 2001, few investment analysts gave the auto or auto-related
industries much of a chance for strong growth. We are
happy to have delivered to you, our shareholders,
17 straight quarters of double-digit, year-over-year
earnings per share growth. The achievement of your
Company’s fi nancial goals and strategic objectives is
once again evidence of the strength and fl exibility
of our business model as we create the future in
automotive retailing.
2001 Report Card
2001 was another record-breaking year for your
Company. Revenues rose across all categories,
increasing by 11.0 percent to over $3.9 billion.
”2001 was another
record-breaking year
for your Company.”
Gross Margin Breakdown
Parts &Service
55%
16%
10%11%8%
Used withFinance &Insurance
RetailUsed
Vehicles
New withFinance &Insurance
NewVehicles
213702_G1AnnART.ind 4/16/02, 8:48 AM2

3
Brand DiversityNew Vehicle Unit Sales as % of Total Sales
Manufacturers
Group 1
28%
13%
25%
29%
15%13%
11%
6%
10%
26%
7% 7%4%
6%
GM Ford DaimlerChrysler
Other ToyotaLexus
HondaAcura
Nissan
The Company earned $2.59 per share, a 38.0 percent gain over 2000. Our position as a
leading specialty retailer combined with our strong brands allowed us to once again out-
perform industry averages.
Our diversifi ed revenue mix has positively impacted gross margin, which improved to 15.2
percent from 14.7 percent as reported last year. Approximately 40.0 percent of our rev-
enues and 85.0 percent of profi ts came from sales other than new vehicles. Contributions
by used vehicles; parts and service; and fi nance, insurance and vehicle service contracts
were impressive and are typically less cyclical in nature than new vehicle sales. While
striving toward our goal of a 4.0 percent operating margin, initiatives in vehicle sales,
cost control and asset management held our operating margin stable at 3.3 percent in the
less robust 2001 economy.
Focused asset management has contributed to our operating success. We are turning our
new and used vehicle inventory faster than the average dealerships in the country. With
only a 30-day supply, the inventory turnover for used vehicles is particularly signifi cant
given their rapid rate of depreciation. These faster inventory turns have led to a superior
return on invested capital when compared with the rest of the industry.
Business Model for a Tough Environment
Our strategy is highlighted by its emphasis on interrelated revenue streams, the advantages
offered by decentralized operations and the diversity in geographic reach and brands
marketed. Today, Group 1 operates in eight states — Texas, Oklahoma, Florida, Georgia,
New Mexico, Colorado, Louisiana and Massachusetts. Our operations encompass 96
franchises comprised of 28 brands.
While manufacturers fi ght for market share as they deal with the industry’s manufactur-
ing overcapacity, we continue to see vast opportunities as a specialty retailer to profi tably
expand our market share. We extended our reach in 2001 with tuck-in acquisitions
resulting in four additional franchises: Smicklas Chevrolet in Oklahoma City, Casa
Mitsubishi in New Mexico and Wade Lincoln/Mercury in Atlanta. We also were granted
a new Dodge franchise in the Dallas market area by DaimlerChrysler. This new store
opened in January 2002 and is contiguous with our Rockwall Ford dealership.
”The entrepreneurial
spirit exhibited by
our platform presidents
and associates is
paramount to
this success.”
213702_G1AnnART.ind 4/16/02, 8:48 AM3
4
We have maintained our decentralized approach to managing our dealer network and
believe this greatly contributes to the progress of our organization. The entrepreneurial
spirit exhibited by our platform presidents and associates is paramount to this success.
With centralized administrative and control systems, our platform presidents can focus
on what they do best — retailing vehicles, parts and service, and expanding their presence
in their local market.
Group 1’s continued focus on the diversifi cation of our revenue streams and variable
cost structure has made it possible for us to achieve robust earnings per share growth.
We realize company-wide cost advantages in centralized fi nance and risk management,
and platform-wide cost advantages in advertising and purchasing. For example, we
believe that our multi-franchised platforms achieve savings of 40.0 percent in advertising
when compared with stand-alone dealerships. Additionally, our platforms provide us
with a strong foundation for our Internet initiatives. We increasingly use the Internet to
provide special offers to consumers and expand our geographic reach beyond our
traditional market areas. We provide customers information on our inventory and model
specifi cations, and interface with them regarding service appointments and reminders.
These types of synergies combined with our operating managers’ expertise in their local
markets, are at the center of our strategy to build value for our shareholders.
Creating the Future in Automotive Retailing
So how do we top 2001? The answer is simple — by sticking with our strategies, which
have produced such gratifying results.
As 2002 begins, we fi nd ourselves in an enviable position. Low interest rates combined
with manufacturers’ incentives and rebates, and shorter, more innovative product cycles,
continue to drive traffi c into our dealerships and boost vehicle sales. If new vehicle sales
slow down, used vehicles; recurring parts and service; and fi nance, insurance and vehicle
service contract opportunities should continue to drive higher profi ts for your Company.
The enhanced fi nancial resources resulting from the successful October 2001 offering of
common stock will allow for signifi cant growth by the Company. We will continue to seek
strategic tuck-in acquisitions in the markets we currently serve, and will renew our focus
on acquiring platform operations in new geographic areas.
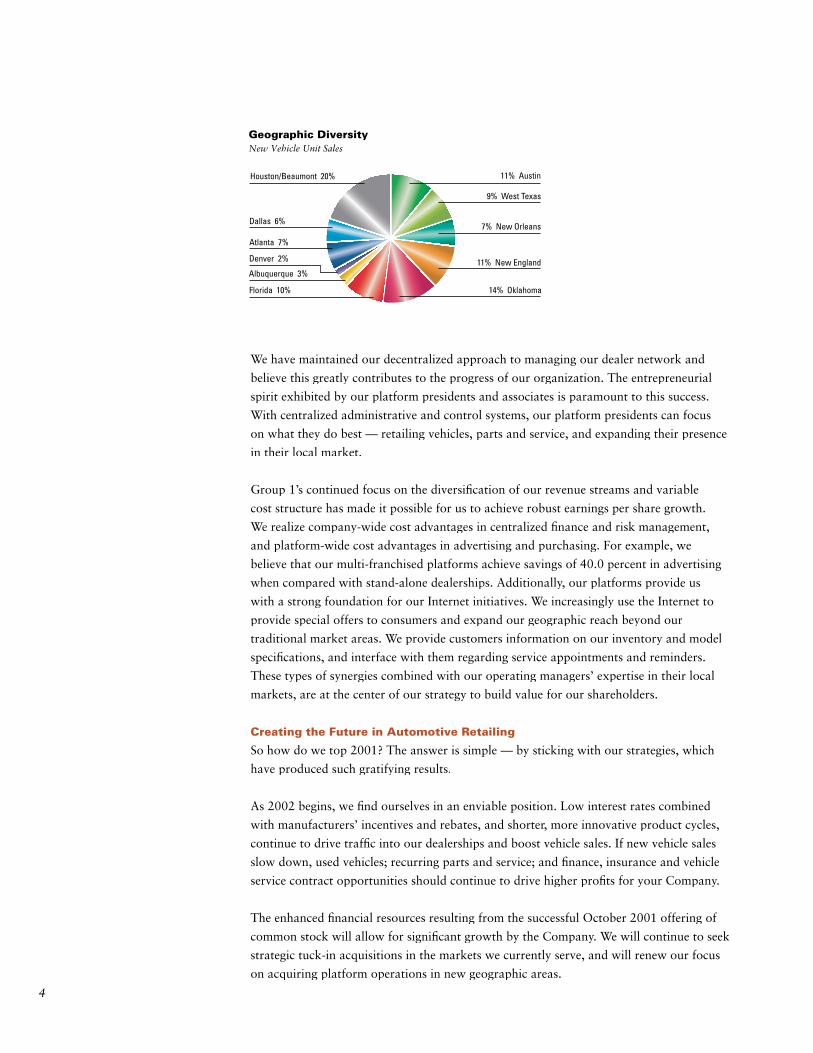
Houston/Beaumont 20%
Albuquerque 3%
Denver 2%
Florida 10% 14% Oklahoma
11% New England
7% New Orleans
9% West Texas
11% Austin
Atlanta 7%
Dallas 6%
Geographic DiversityNew Vehicle Unit Sales
213702_G1AnnART.ind 4/16/02, 8:48 AM4
5
We expect our acquisition pace to accelerate in 2002 with a goal of adding platform and
tuck-in operations with aggregate revenues of at least $500 million, compared with the
$135 million of revenues acquired in 2001.
In addition to enhancing operating leverage to our centralized functions, these potential
acquisitions will augment our brand portfolio mix and provide access to new markets.
We will continue to exercise great discipline by seeking only accretive acquisitions with
attractive returns on investment. We will not focus on revenues at the expense of earnings
per share or shareholder value. Given current economic activity, there will be opportunities
where the right parameters are present and we will make prudent acquisitions to accelerate
your Company’s growth.
Special Appreciation
We would like to take this opportunity to say thank you to a respected member of the
Group 1 team. Co-founder Charles M. Smith, Senior Vice President and member of the
Board of Directors of Group 1, has elected to retire and has resigned as an offi cer and
director. He will continue as a consultant to the Company. We all owe Charles a debt of
gratitude because without his vision, Group 1 would probably not be the company it is
today. Please join me in thanking Charles for all he has contributed and in wishing him
all the best.
We also welcomed two new members elected by you to our Board of Directors. Max P.
Watson, Jr., former President and Chief Executive Offi cer of BMC Software, Inc., and
Kevin H. Whalen, a Group 1 co-founder and President of the Sterling McCall Automotive
Group in Houston, were elected at our Shareholders Meeting held May 23, 2001.
We would also like to thank our 6,000 co-workers for their dedication and support and
our 28 manufacturer-partners for their outstanding contributions. It is because of their
collective effort that we were able to achieve such outstanding results in 2001 and our
future success will be a result of their efforts.
Finally, we would like to thank you, our shareholders, for your unwavering support. Your
dedication, especially during the trying months at the end of 2001, has been invaluable to
us. We look forward to driving forward with you to continue creating the future in
automotive retailing.
B.B. Hollingsworth, Jr.
Chairman, President and Chief Executive Offi cer
Group 1 Automotive, Inc.
March 20, 2002
213702_G1AnnART.ind 4/16/02, 8:48 AM5

6
”…vehicles more affordable than at any time in recent memory.”
NEW VEH1CLES
Once again, Group 1 exceeded expectations in the sales of
new vehicles. This is especially satisfying in the challenging
retail environment experienced during 2001. Our new vehicle
sales in 2001 grew 9.2 percent and reached 90,615 units, or
$2.4 billion in revenues, compared with 86,729 units and $2.2
billion in 2000. Same store new vehicle sales outperformed
the automotive retailing industry as we experienced sales
growth of 7.8 percent versus an overall industry decline of
1.4 percent in new units sold in the U.S.
Sales were propelled higher by the combination of out-
standing execution by our dealerships, lower interest rates,
aggressive manufacturer incentives and fresh, innovative
products such as the Chrysler PT Cruiser, Toyota Camry, Ford
Focus and the Lexus SC 430. Lower interest rates combined
with manufacturer incentives have made vehicles more
affordable than at any time in recent memory. We believe
these positive trends will continue into 2002.
New vehicle gross margin was 7.6 percent. Group 1 sells a
substantially higher percentage of trucks and import brands
than the overall vehicle retailing industry. In fact, Ford’s best-
selling F-series pickup was our leading sales vehicle in 2001,
followed by the Toyota Camry. Our Toyota/Lexus and Ford
franchises contributed over half of new vehicle sales.
Approximately 47.0 percent of our sales volume was from
import manufacturers, highlighting the strength of Group 1’s
diverse brands.
To make sure Group 1 maintains its competitive edge, we
customize our marketing strategies for each market served.
Strategies include fi xed price versus variable price, and
multiple advertising venues. In addition to these local market
strategies, all new vehicle inventories are closely monitored to
ensure a maximum 60-day turn is maintained. This industry-
leading turn provides our customers with fresh inventory and
mitigates valuation issues. With continued emphasis on these
strategies, we will improve on our competitiveness, resulting
in increased value to our shareholders.
Industry-wide New Units
Group 1 Same Store Revenues
7.8%
-1.4%2001200019991998
7.1%
2.7%2.9%
8.7%
12.7%
15.8%
Same Store Sales GrowthExceeding Industry Performance
213702_G1AnnART.ind 4/16/02, 8:48 AM6
7
USED VEH1CLES
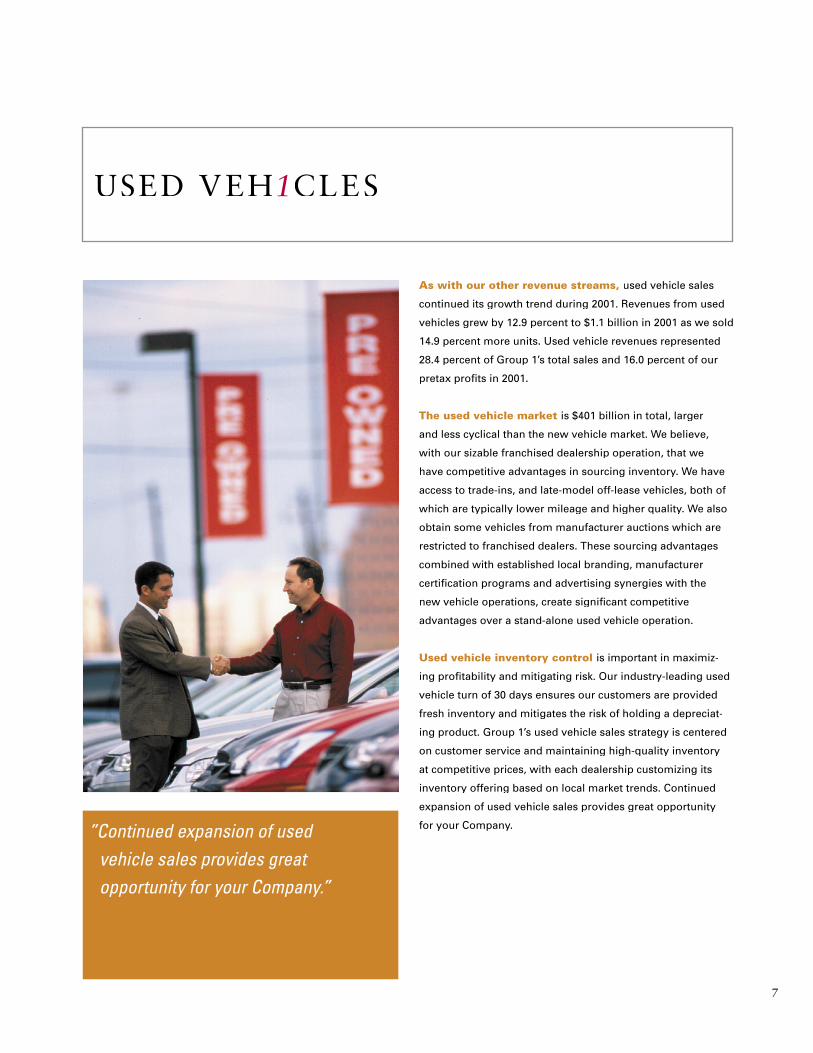
”Continued expansion of used vehicle sales provides great opportunity for your Company.”
As with our other revenue streams, used vehicle sales
continued its growth trend during 2001. Revenues from used
vehicles grew by 12.9 percent to $1.1 billion in 2001 as we sold
14.9 percent more units. Used vehicle revenues represented
28.4 percent of Group 1’s total sales and 16.0 percent of our
pretax profi ts in 2001.
The used vehicle market is $401 billion in total, larger
and less cyclical than the new vehicle market. We believe,
with our sizable franchised dealership operation, that we
have competitive advantages in sourcing inventory. We have
access to trade-ins, and late-model off-lease vehicles, both of
which are typically lower mileage and higher quality. We also
obtain some vehicles from manufacturer auctions which are
restricted to franchised dealers. These sourcing advantages
combined with established local branding, manufacturer
certifi cation programs and advertising synergies with the
new vehicle operations, create signifi cant competitive
advantages over a stand-alone used vehicle operation.
Used vehicle inventory control is important in maximiz-
ing profi tability and mitigating risk. Our industry-leading used
vehicle turn of 30 days ensures our customers are provided
fresh inventory and mitigates the risk of holding a depreciat-
ing product. Group 1’s used vehicle sales strategy is centered
on customer service and maintaining high-quality inventory
at competitive prices, with each dealership customizing its
inventory offering based on local market trends. Continued
expansion of used vehicle sales provides great opportunity
for your Company.
213702_G1AnnART.ind 4/16/02, 8:48 AM7
8
PARTS AND SERV1CE
2001 was a stellar year for our parts and service business.
Revenues increased 17.7 percent to $360.2 million. Parts and
service represented 40.0 percent of our pretax profi ts in 2001
and represents a great opportunity for future growth. Unlike
new vehicle sales, the parts and service business has a
counter-cyclical, recurring revenue base that provides high
margins and consistent cash fl ow.
In the United States, consumers spend approximately
$219 billion on parts and service annually. This extremely
fragmented market is characterized by national chains and
many local garages, which provide less complex services.
We believe that with the increasingly complex content being
added to new vehicles, more customers will make franchised
dealers the preferred service provider to repair and maintain
their vehicles. Group 1 is perfectly positioned to take
advantage of this industry trend.
One advantage for Group 1 compared to local repair
shops is that our dealerships perform warranty work for
manufacturers and under third-party extended service con-
tracts sold with the vehicles. Another key advantage is our
staff of approximately 1,000 OEM-certifi ed technicians who
specialize in every brand of vehicles we sell. Our technicians
are tops in their respective fi elds and are extensively trained
to keep abreast of the rapid technology changes being
incorporated into vehicles.
Group 1 also owns 24 collision service centers. These centers
provide a range of services from fi xing dents to major collision
work. By delivering an outstanding level of service in our colli-
sion centers, we are able to further enhance the strong margins
of our parts and service offerings.
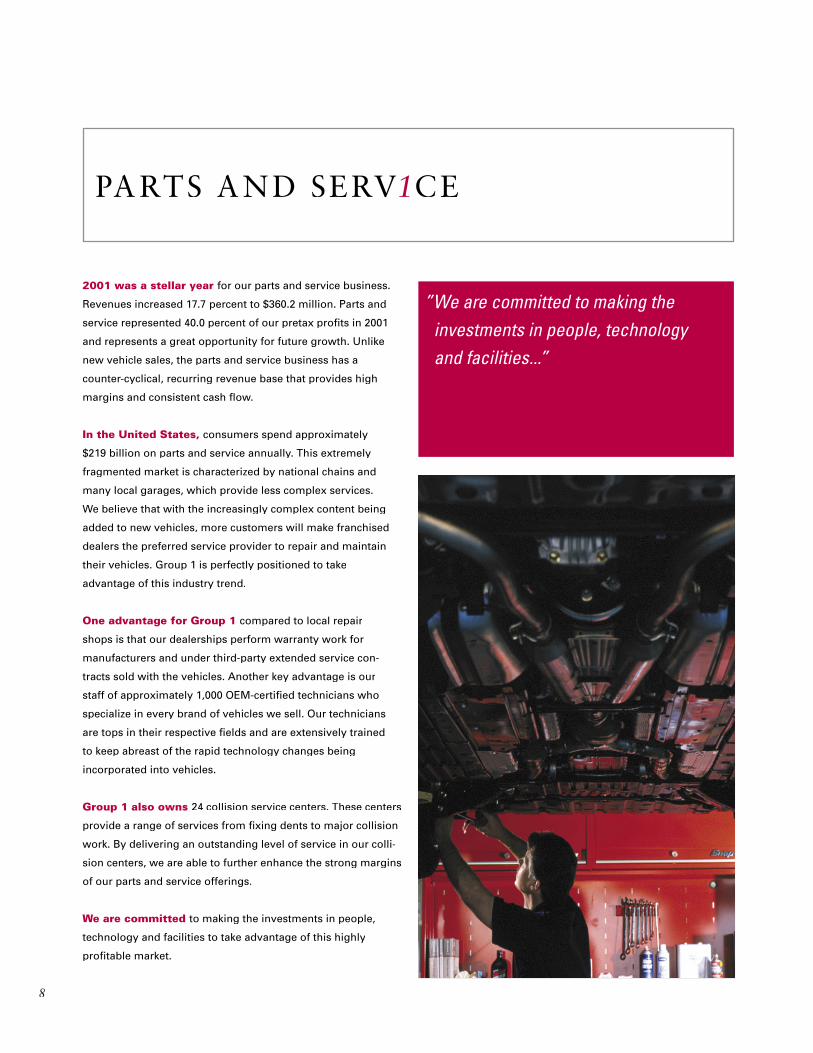
We are committed to making the investments in people,
technology and facilities to take advantage of this highly
profi table market.
”We are committed to making the investments in people, technology and facilities...”
213702_G1AnnART.ind 4/16/02, 8:48 AM8
9
F1NANCE AND INSURANCE
”We arrange retail
fi nancing for our
customers in over
70.0 percent of
sales transactions…”
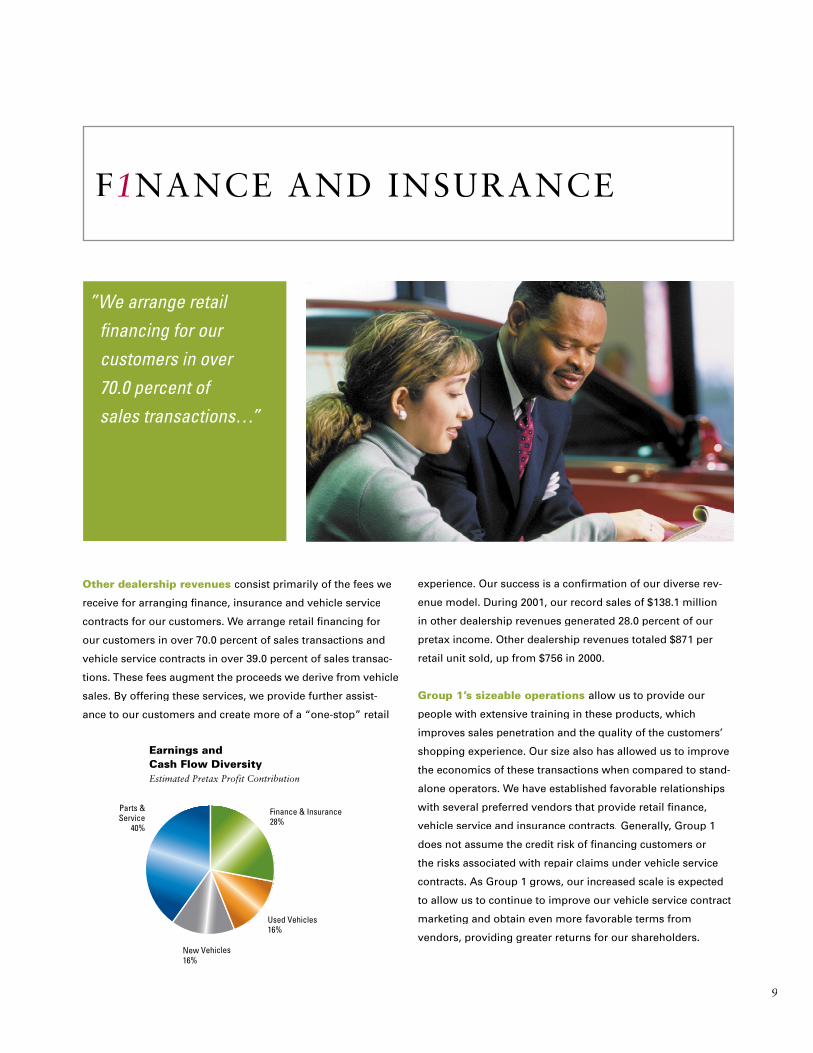
Other dealership revenues consist primarily of the fees we
receive for arranging fi nance, insurance and vehicle service
contracts for our customers. We arrange retail fi nancing for
our customers in over 70.0 percent of sales transactions and
vehicle service contracts in over 39.0 percent of sales transac-
tions. These fees augment the proceeds we derive from vehicle
sales. By offering these services, we provide further assist-
ance to our customers and create more of a “one-stop” retail
experience. Our success is a confi rmation of our diverse rev-
enue model. During 2001, our record sales of $138.1 million
in other dealership revenues generated 28.0 percent of our
pretax income. Other dealership revenues totaled $871 per
retail unit sold, up from $756 in 2000.
Group 1’s sizeable operations allow us to provide our
people with extensive training in these products, which
improves sales penetration and the quality of the customers’
shopping experience. Our size also has allowed us to improve
the economics of these transactions when compared to stand-
alone operators. We have established favorable relationships
with several preferred vendors that provide retail fi nance,
vehicle service and insurance contracts. Generally, Group 1
does not assume the credit risk of fi nancing customers or
the risks associated with repair claims under vehicle service
contracts. As Group 1 grows, our increased scale is expected
to allow us to continue to improve our vehicle service contract
marketing and obtain even more favorable terms from
vendors, providing greater returns for our shareholders.
Earnings and Cash Flow DiversityEstimated Pretax Profit Contribution
Used Vehicles16%
New Vehicles16%
Finance & Insurance28%
Parts &Service
40%
213702_G1AnnART.ind 4/16/02, 8:48 AM9
10
Acura Precision Team –
Dealership of Distinction
Sterling McCall Acura
DaimlerChrysler 5 Star Dealer
Bob Howard Chrysler/Jeep
Bob Howard Dodge
Casa Chrysler/Jeep on the West Side
Gene Messer Chrysler/Jeep
Ira Chrysler/Jeep of Tewksbury
Ira Dodge of Lowell
Maxwell Chrysler South
Maxwell Dodge
Maxwell Taylor Chrysler/Dodge/Jeep
McKinney Dodge
Mike Smith Dodge
Ford Blue Oval Certifi ed
Bohn Ford
Don Bohn Ford
Gene Messer Ford
Gene Messer Ford of Amarillo
Jim Tidwell’s World Ford
Cobb County
Maxwell Ford
Maxwell Ford of Elgin
Rockwall Ford/Mercury
World Ford Kendall
World Ford Pembroke Pines
World Ford Pensacola
World Ford Sandy Springs
World Ford Stone Mountain
GM Mark of Excellence
Bob Howard Pontiac/GMC
Don Bohn Buick/Pontiac/GMC
Gene Messer Cadillac
Mike Smith Buick
South Pointe Chevrolet
Hyundai Star Award
Gene Messer Hyundai
Elite of Lexus
Ira Lexus
Lexus of Clear Lake
Sterling McCall Lexus
Mitsubishi Diamond Chapter
of Excellence
Gene Messer Mitsubishi
Porsche Premier Dealer
Ira Porsche/Audi
Toyota Board of Governors
Ira Toyota
Sterling McCall Toyota
Toyota Customer Service
Advisory Board
Ira Toyota
Toyota Parts Excellence
Sterling McCall Toyota
Toyota President’s Award
Bob Howard Toyota
Bohn Brothers Toyota
Ira Toyota
Sterling McCall Toyota
Toyota Service Excellence
Bohn Brothers Toyota
Ira Toyota
Sterling McCall Toyota
AWARDS
Most Valuable Platform
1998 – Bob Howard Auto Group
1999 – Bob Howard Auto Group
2000 – Gene Messer Auto Group
2001 – Bob Howard Auto Group
213702_G1AnnART.ind 4/16/02, 8:48 AM10
11
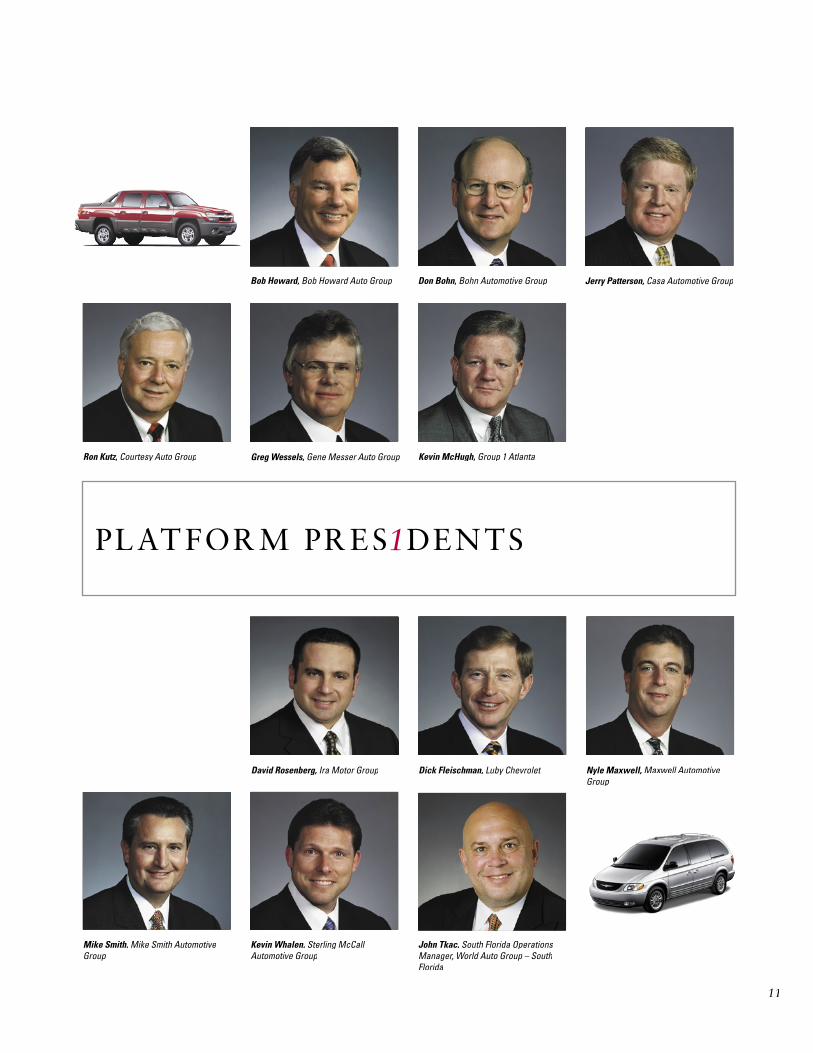
PLATFORM PRES1DENTS
Bob Howard, Bob Howard Auto Group Don Bohn, Bohn Automotive Group Jerry Patterson, Casa Automotive Group
Ron Kutz, Courtesy Auto Group Greg Wessels, Gene Messer Auto Group Kevin McHugh, Group 1 Atlanta
David Rosenberg, Ira Motor Group Dick Fleischman, Luby ChevroletDick Fleischman, Luby ChevroletDick Fleischman, Nyle Maxwell, Maxwell Automotive Group
Mike Smith, Mike Smith Automotive Group
Kevin Whalen, Sterling McCall Automotive Group
John Tkac, South Florida Operations Manager, World Auto Group – South Florida
213702_G1AnnART.ind 4/16/02, 8:49 AM11

12
LOCAT1ONS
Colorado
Luby Chevrolet
Florida
World Auto Group – North Florida
World Auto Group – South Florida
Georgia
Group 1 Atlanta
Louisiana
Bohn Automotive Group
Massachusetts
Ira Motor Group
New Mexico
Casa Automotive Group
Oklahoma
Bob Howard Auto Group
Texas
Courtesy Auto Group – Dallas
Gene Messer Auto Group
– West Texas
Maxwell Automotive Group
– Austin
Sterling McCall Automotive Group
– Houston
Mike Smith Automotive Group
– Beaumont
213702_G1AnnART.ind 4/16/02, 8:49 AM12
1313131313
FINANCIAL TABLE OF CONTENTS
SELECTED CONSOLIDATED FINANCIAL DATA 14
MANAGEMENT’S DISCUSSION AND ANALYSIS OF FINANCIAL CONDITION AND RESULTS OF OPERATIONS 15
CONSOLIDATED BALANCE SHEETS 27
CONSOLIDATED STATEMENTS OF OPERATIONS 28
CONSOLIDATED STATEMENTS OF STOCKHOLDERS’ EQUITY 29
CONSOLIDATED STATEMENTS OF CASH FLOWS 30
NOTES TO CONSOLIDATED FINANCIAL STATEMENTS 31
REPORT OF INDEPENDENT PUBLIC ACCOUNTANTS 46
CORPORATE INFORMATION
BACK
COVER
213702_Finan.ind 4/15/02, 11:03 AM13
14
SELECTED CONSOLIDATED FINANCIAL DATA
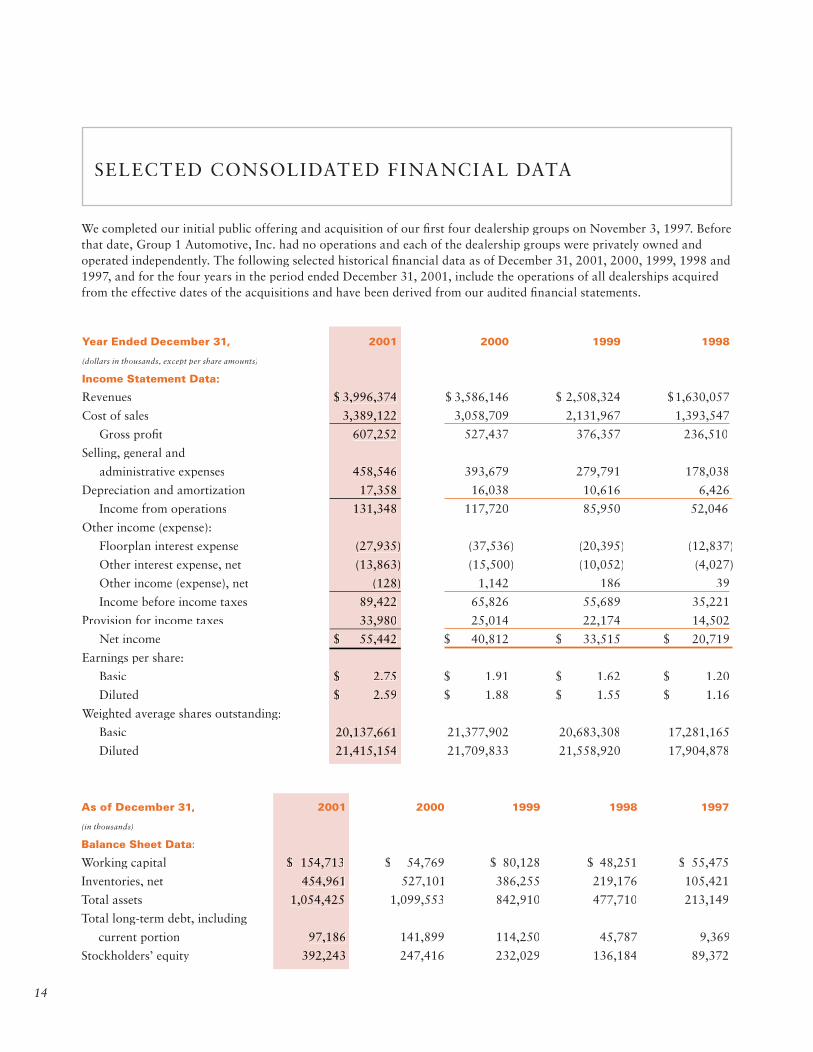
We completed our initial public offering and acquisition of our fi rst four dealership groups on November 3, 1997. Before that date, Group 1 Automotive, Inc. had no operations and each of the dealership groups were privately owned and operated independently. The following selected historical fi nancial data as of December 31, 2001, 2000, 1999, 1998 and 1997, and for the four years in the period ended December 31, 2001, include the operations of all dealerships acquired from the effective dates of the acquisitions and have been derived from our audited fi nancial statements.
Year Ended December 31, 2001 2000 1999 1998
(dollars in thousands, except per share amounts)
Income Statement Data:
Revenues $ 3,996,374 $ 3,586,146 $ 2,508,324 $1,630,057
Cost of sales 3,389,122 3,058,709 2,131,967 1,393,547
Gross profi t 607,252 527,437 376,357 236,510
Selling, general and
administrative expenses 458,546 393,679 279,791 178,038
Depreciation and amortization 17,358 16,038 10,616 6,426
Income from operations 131,348 117,720 85,950 52,046
Other income (expense):
Floorplan interest expense (27,935) (37,536) (20,395) (12,837)
Other interest expense, net (13,863) (15,500) (10,052) (4,027)
Other income (expense), net (128) 1,142 186 39
Income before income taxes 89,422 65,826 55,689 35,221
Provision for income taxes 33,980 25,014 22,174 14,502
Net income $ 55,442 $ 40,812 $ 33,515 $ 20,719
Earnings per share:
Basic $ 2.75 $ 1.91 $ 1.62 $ 1.20
Diluted $ 2.59 $ 1.88 $ 1.55 $ 1.16
Weighted average shares outstanding:
Basic 20,137,661 21,377,902 20,683,308 17,281,165
Diluted 21,415,154 21,709,833 21,558,920 17,904,878
As of December 31, 2001 2000 1999 1998 1997
(in thousands)
Balance Sheet Data:
Working capital $ 154,713 $ 54,769 $ 80,128 $ 48,251 $ 55,475
Inventories, net 454,961 527,101 386,255 219,176 105,421
Total assets 1,054,425 1,099,553 842,910 477,710 213,149
Total long-term debt, including
current portion 97,186 141,899 114,250 45,787 9,369
Stockholders’ equity 392,243 247,416 232,029 136,184 89,372
213702_Finan.ind 4/15/02, 11:03 AM14
1515151515
MANAGEMENT’S DISCUSSION AND ANALYSIS OF FINANCIAL CONDITION AND RESULTS OF OPERATIONS
OverviewWe are a leading operator in the $1 trillion automotive retailing industry. Simultaneously with the closing of our initial public offering in 1997, we acquired four auto-mobile dealership groups, representing 30 automobile dealership franchises. Through a series of acquisitions, we now operate 96 dealership franchises in Texas, Oklahoma, Florida, Georgia, New Mexico, Colorado, Louisiana and Massachusetts. Through our dealerships and Internet sites, we sell new and used cars and light trucks; arrange related fi nancing, vehicle service and insurance contracts; provide maintenance and repair services; and sell replacement parts. We also operate 24 collision service centers.
We have diverse sources of revenues, including: new car sales, new truck sales, used car sales, used truck sales, manufacturer remarketed vehicle sales, parts sales, service sales, collision repair services, fi nance fees, vehicle ser-vice contract fees, insurance fees, documentary fees and after-market product sales. Sales revenues from new and used vehicle sales and parts and service sales include sales to retail customers, other dealerships and wholesalers. Other dealership revenue includes revenues from arrang-ing fi nancing, vehicle service and insurance contracts and documentary fees, net of a provision for anticipated chargebacks.
Our total gross margin varies as our merchandise mix (the mix between new vehicle sales, used vehicle sales, parts and service sales, collision repair service sales and other dealership revenues) changes. Our gross margin on the sale of products and services varies signifi cantly, with new vehicle sales generally resulting in the lowest gross margin and other dealership revenues generally resulting in the highest gross margin. When our new vehicle sales increase or decrease at a rate greater than our other rev-enue sources, our gross margin responds inversely. Factors such as seasonality, weather, cyclicality and manufacturers’ advertising and incentives may impact our merchandise mix, and therefore infl uence our gross margin.
Selling, general and administrative expenses consist pri-marily of incentive-based compensation for sales, admin-istrative, fi nance and general management personnel, rent, marketing, insurance and utilities. We believe that approximately 60% of our selling, general and adminis-trative expenses are variable, allowing us to adjust our cost structure based on business trends. Interest expense consists of interest charges on interest-bearing debt, includ-ing fl oorplan inventory fi nancing, net of interest income earned. We receive interest assistance from various of our manufacturers. This assistance, which is refl ected as a reduction of cost of sales, generally equals between 70% and 100% of fl oorplan interest expense, which mitigates the impact of interest rate changes on our fi nancial results.
213702_Finan.ind 4/15/02, 11:03 AM15

16
MANAGEMENT’S DISCUSSION AND ANALYSIS OF FINANCIAL CONDITION AND RESULTS OF OPERATIONS
16161616
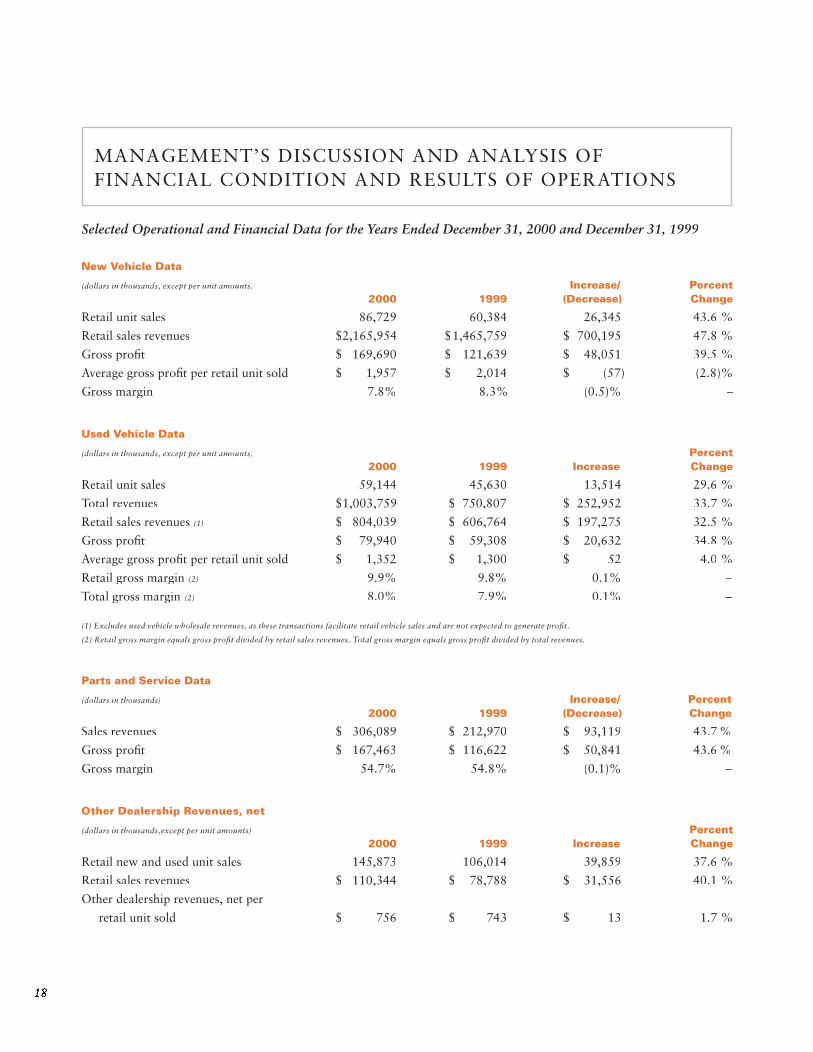
Results of OperationsSelected Operational and Financial Data for the Years Ended December 31, 2001 and December 31, 2000
New Vehicle Data
(dollars in thousands, except per unit amounts) Increase/ Percent 2001 2000 (Decrease) Change
Retail unit sales 90,615 86,729 3,886 4.5 %
Retail sales revenues $2,365,008 $2,165,954 $199,054 9.2 %
Gross profi t $ 179,069 $ 169,690 $ 9,379 5.5 %
Average gross profi t per retail unit sold $ 1,976 $ 1,957 $ 19 1.0 %
Gross margin 7.6% 7.8% (0.2)% –
Used Vehicle Data
(dollars in thousands, except per unit amounts) Increase/ Percent 2001 2000 (Decrease) Change
Retail unit sales 67,927 59,144 8,783 14.9 %
Total revenues $1,133,066 $1,003,759 $129,307 12.9 %
Retail sales revenues (1) $ 942,501 $ 804,039 $138,462 17.2 %
Gross profi t $ 90,213 $ 79,940 $ 10,273 12.9 %
Average gross profi t per retail unit sold $ 1,328 $ 1,352 $ (24) (1.8)%
Retail gross margin (2) 9.6% 9.9% (0.3)% –
Total gross margin (2) 8.0% 8.0% 0.0 % –
(1) Excludes used vehicle wholesale revenues, as these transactions facilitate retail vehicle sales and are not expected to generate profi t.(1) Excludes used vehicle wholesale revenues, as these transactions facilitate retail vehicle sales and are not expected to generate profi t.
(2) Retail gross margin equals gross profi t divided by retail sales revenues. Total gross margin equals gross profi t divided by total revenues. (2) Retail gross margin equals gross profi t divided by retail sales revenues. Total gross margin equals gross profi t divided by total revenues.
Parts and Service Data
(dollars in thousands) Percent
2001 2000 Increase Change
Sales revenues $ 360,201 $ 306,089 $ 54,112 17.7 %
Gross profi t $ 199,871 $ 167,463 $ 32,408 19.4 %
Gross margin 55.5% 54.7% 0.8 % –
Other Dealership Revenues, net
(dollars in thousands, except per unit amounts) Percent 2001 2000 Increase Change
Retail new and used unit sales 158,542 145,873 12,669 8.7 %
Retail sales revenues $ 138,099 $ 110,344 $ 27,755 25.2 %
Other dealership revenues, net per
retail unit sold $ 871 $ 756 $ 115 15.2 %
213702_Finan.ind 4/15/02, 11:03 AM16
17
MANAGEMENT’S DISCUSSION AND ANALYSIS OF FINANCIAL CONDITION AND RESULTS OF OPERATIONS
17171717
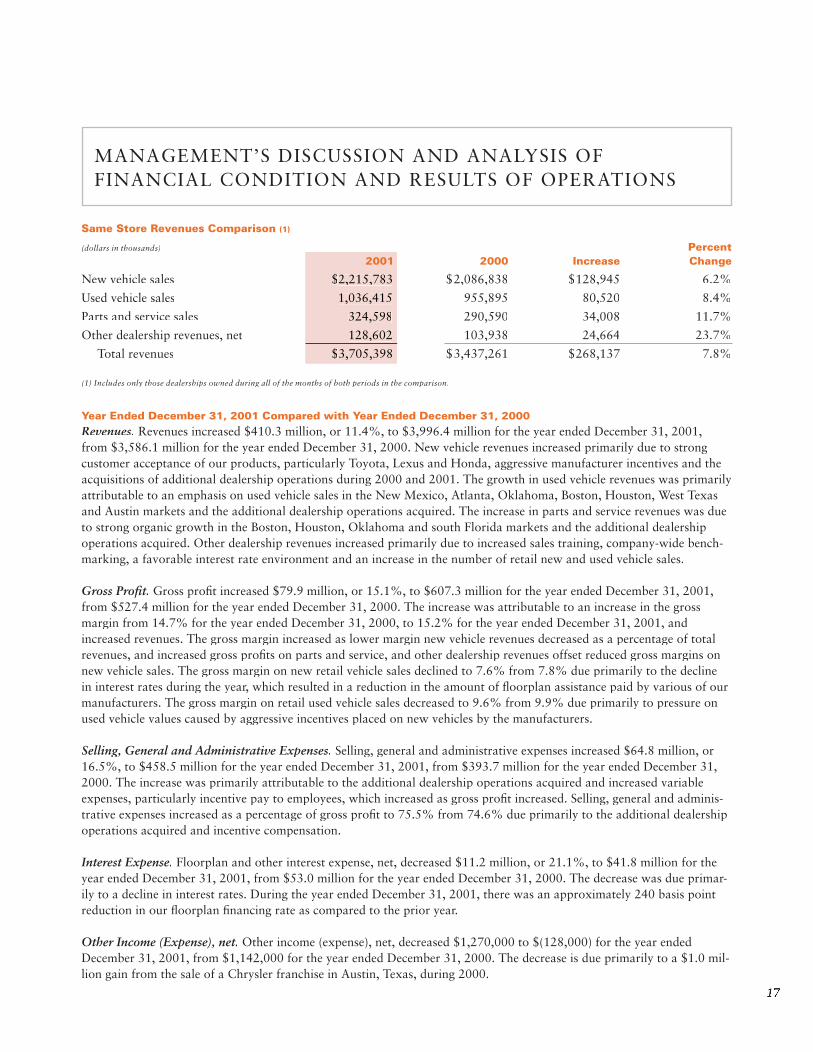
Year Ended December 31, 2001 Compared with Year Ended December 31, 2000
Revenues. Revenues increased $410.3 million, or 11.4%, to $3,996.4 million for the year ended December 31, 2001, from $3,586.1 million for the year ended December 31, 2000. New vehicle revenues increased primarily due to strong customer acceptance of our products, particularly Toyota, Lexus and Honda, aggressive manufacturer incentives and the acquisitions of additional dealership operations during 2000 and 2001. The growth in used vehicle revenues was primarily attributable to an emphasis on used vehicle sales in the New Mexico, Atlanta, Oklahoma, Boston, Houston, West Texas and Austin markets and the additional dealership operations acquired. The increase in parts and service revenues was due to strong organic growth in the Boston, Houston, Oklahoma and south Florida markets and the additional dealership operations acquired. Other dealership revenues increased primarily due to increased sales training, company-wide bench-marking, a favorable interest rate environment and an increase in the number of retail new and used vehicle sales.
Gross Profi t. Gross profi t increased $79.9 million, or 15.1%, to $607.3 million for the year ended December 31, 2001, from $527.4 million for the year ended December 31, 2000. The increase was attributable to an increase in the gross margin from 14.7% for the year ended December 31, 2000, to 15.2% for the year ended December 31, 2001, and increased revenues. The gross margin increased as lower margin new vehicle revenues decreased as a percentage of total revenues, and increased gross profi ts on parts and service, and other dealership revenues offset reduced gross margins on new vehicle sales. The gross margin on new retail vehicle sales declined to 7.6% from 7.8% due primarily to the decline in interest rates during the year, which resulted in a reduction in the amount of fl oorplan assistance paid by various of our manufacturers. The gross margin on retail used vehicle sales decreased to 9.6% from 9.9% due primarily to pressure on used vehicle values caused by aggressive incentives placed on new vehicles by the manufacturers.
Selling, General and Administrative Expenses. Selling, general and administrative expenses increased $64.8 million, or 16.5%, to $458.5 million for the year ended December 31, 2001, from $393.7 million for the year ended December 31, 2000. The increase was primarily attributable to the additional dealership operations acquired and increased variable expenses, particularly incentive pay to employees, which increased as gross profi t increased. Selling, general and adminis-trative expenses increased as a percentage of gross profi t to 75.5% from 74.6% due primarily to the additional dealership operations acquired and incentive compensation.
Interest Expense. Floorplan and other interest expense, net, decreased $11.2 million, or 21.1%, to $41.8 million for the year ended December 31, 2001, from $53.0 million for the year ended December 31, 2000. The decrease was due primar-ily to a decline in interest rates. During the year ended December 31, 2001, there was an approximately 240 basis point reduction in our fl oorplan fi nancing rate as compared to the prior year.
Other Income (Expense), net. Other income (expense), net, decreased $1,270,000 to $(128,000) for the year ended December 31, 2001, from $1,142,000 for the year ended December 31, 2000. The decrease is due primarily to a $1.0 mil-lion gain from the sale of a Chrysler franchise in Austin, Texas, during 2000.
Same Store Revenues Comparison (1)
(dollars in thousands) Percent 2001 2000 Increase Change
New vehicle sales $2,215,783 $2,086,838 $128,945 6.2%
Used vehicle sales 1,036,415 955,895 80,520 8.4%
Parts and service sales 324,598 290,590 34,008 11.7%
Other dealership revenues, net 128,602 103,938 24,664 23.7%
Total revenues $3,705,398 $3,437,261 $268,137 7.8%
(1) Includes only those dealerships owned during all of the months of both periods in the comparison.
213702_Finan.ind 4/15/02, 11:03 AM17
18
MANAGEMENT’S DISCUSSION AND ANALYSIS OF FINANCIAL CONDITION AND RESULTS OF OPERATIONS
18181818
New Vehicle Data
(dollars in thousands, except per unit amounts) Increase/ Percent 2000 1999 (Decrease) Change
Retail unit sales 86,729 60,384 26,345 43.6 %
Retail sales revenues $2,165,954 $1,465,759 $ 700,195 47.8 %
Gross profi t $ 169,690 $ 121,639 $ 48,051 39.5 %
Average gross profi t per retail unit sold $ 1,957 $ 2,014 $ (57) (2.8)%
Gross margin 7.8% 8.3% (0.5)% –
Used Vehicle Data
(dollars in thousands, except per unit amounts) Percent 2000 1999 Increase Change
Retail unit sales 59,144 45,630 13,514 29.6 %
Total revenues $1,003,759 $ 750,807 $ 252,952 33.7 %
Retail sales revenues (1) $ 804,039 $ 606,764 $ 197,275 32.5 %
Gross profi t $ 79,940 $ 59,308 $ 20,632 34.8 %
Average gross profi t per retail unit sold $ 1,352 $ 1,300 $ 52 4.0 %
Retail gross margin (2) 9.9% 9.8% 0.1% –
Total gross margin (2) 8.0% 7.9% 0.1% –
(1) Excludes used vehicle wholesale revenues, as these transactions facilitate retail vehicle sales and are not expected to generate profi t.
(2) Retail gross margin equals gross profi t divided by retail sales revenues. Total gross margin equals gross profi t divided by total revenues.
Parts and Service Data
(dollars in thousands) Increase/ Percent 2000 1999 (Decrease) Change
Sales revenues $ 306,089 $ 212,970 $ 93,119 43.7 %
Gross profi t $ 167,463 $ 116,622 $ 50,841 43.6 %
Gross margin 54.7% 54.8% (0.1)% –
Other Dealership Revenues, net
(dollars in thousands,except per unit amounts) Percent 2000 1999 Increase Change
Retail new and used unit sales 145,873 106,014 39,859 37.6 %
Retail sales revenues $ 110,344 $ 78,788 $ 31,556 40.1 %
Other dealership revenues, net per
retail unit sold $ 756 $ 743 $ 13 1.7 %
Selected Operational and Financial Data for the Years Ended December 31, 2000 and December 31, 1999
213702_Finan.ind 4/15/02, 11:03 AM18
19
MANAGEMENT’S DISCUSSION AND ANALYSIS OF FINANCIAL CONDITION AND RESULTS OF OPERATIONS
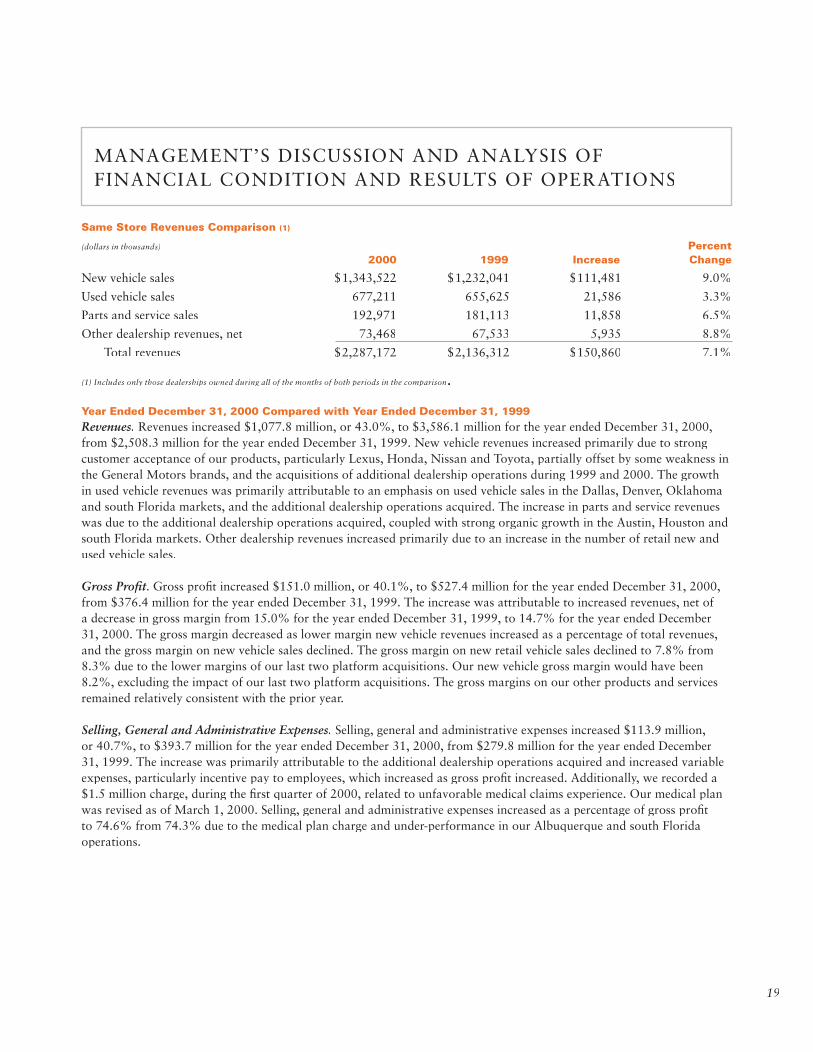
Same Store Revenues Comparison (1)
(dollars in thousands) Percent 2000 1999 Increase Change
New vehicle sales $1,343,522 $1,232,041 $111,481 9.0%
Used vehicle sales 677,211 655,625 21,586 3.3%
Parts and service sales 192,971 181,113 11,858 6.5%
Other dealership revenues, net 73,468 67,533 5,935 8.8%
Total revenues $2,287,172 $2,136,312 $150,860 7.1%
(1) Includes only those dealerships owned during all of the months of both periods in the comparison.
Year Ended December 31, 2000 Compared with Year Ended December 31, 1999
Revenues. Revenues increased $1,077.8 million, or 43.0%, to $3,586.1 million for the year ended December 31, 2000, from $2,508.3 million for the year ended December 31, 1999. New vehicle revenues increased primarily due to strong customer acceptance of our products, particularly Lexus, Honda, Nissan and Toyota, partially offset by some weakness in the General Motors brands, and the acquisitions of additional dealership operations during 1999 and 2000. The growth in used vehicle revenues was primarily attributable to an emphasis on used vehicle sales in the Dallas, Denver, Oklahoma and south Florida markets, and the additional dealership operations acquired. The increase in parts and service revenues was due to the additional dealership operations acquired, coupled with strong organic growth in the Austin, Houston and south Florida markets. Other dealership revenues increased primarily due to an increase in the number of retail new and used vehicle sales.
Gross Profi t. Gross profi t increased $151.0 million, or 40.1%, to $527.4 million for the year ended December 31, 2000, from $376.4 million for the year ended December 31, 1999. The increase was attributable to increased revenues, net of a decrease in gross margin from 15.0% for the year ended December 31, 1999, to 14.7% for the year ended December 31, 2000. The gross margin decreased as lower margin new vehicle revenues increased as a percentage of total revenues, and the gross margin on new vehicle sales declined. The gross margin on new retail vehicle sales declined to 7.8% from 8.3% due to the lower margins of our last two platform acquisitions. Our new vehicle gross margin would have been 8.2%, excluding the impact of our last two platform acquisitions. The gross margins on our other products and services remained relatively consistent with the prior year.
Selling, General and Administrative Expenses. Selling, general and administrative expenses increased $113.9 million, or 40.7%, to $393.7 million for the year ended December 31, 2000, from $279.8 million for the year ended December 31, 1999. The increase was primarily attributable to the additional dealership operations acquired and increased variable expenses, particularly incentive pay to employees, which increased as gross profi t increased. Additionally, we recorded a $1.5 million charge, during the fi rst quarter of 2000, related to unfavorable medical claims experience. Our medical plan was revised as of March 1, 2000. Selling, general and administrative expenses increased as a percentage of gross profi t to 74.6% from 74.3% due to the medical plan charge and under-performance in our Albuquerque and south Florida operations.
213702_Finan.ind 4/15/02, 11:03 AM19
20
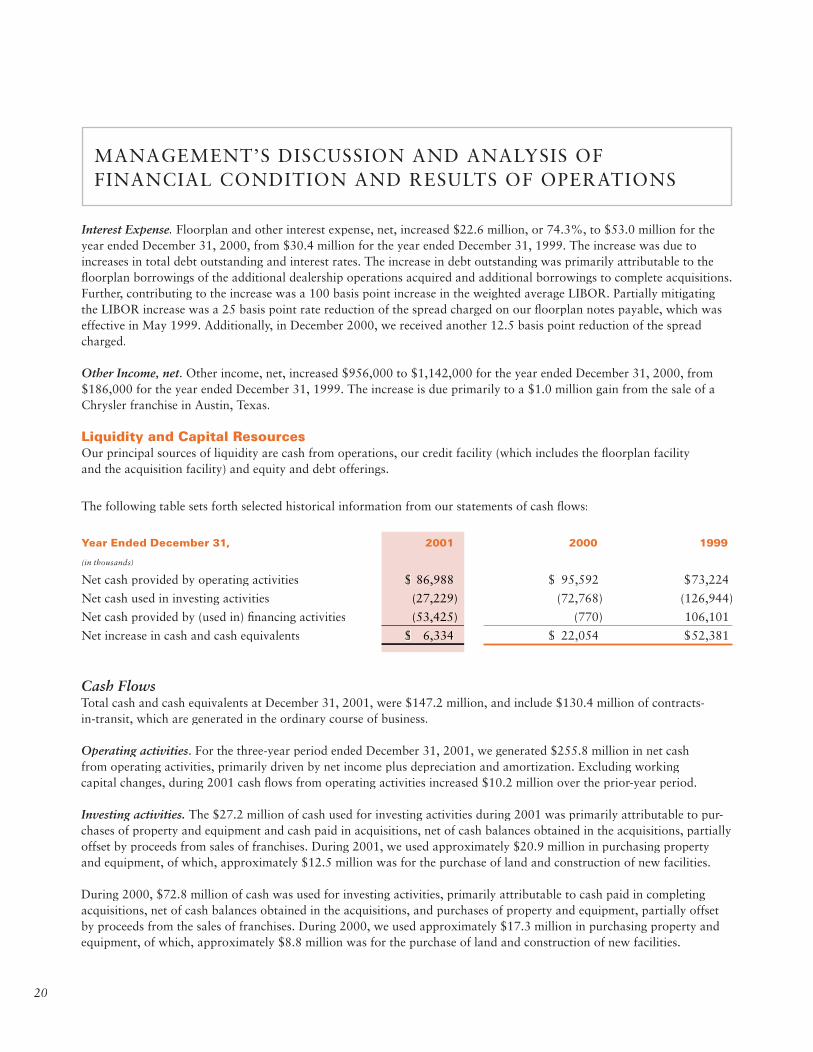
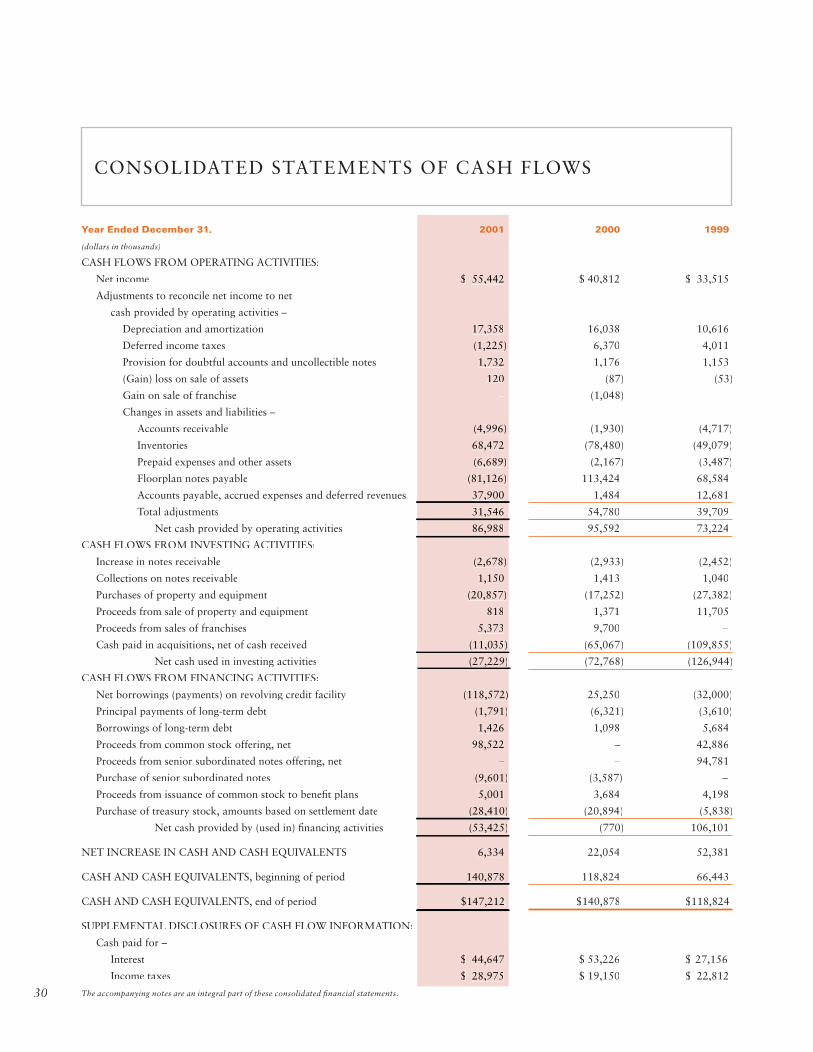
Cash FlowsTotal cash and cash equivalents at December 31, 2001, were $147.2 million, and include $130.4 million of contracts-in-transit, which are generated in the ordinary course of business.
Operating activities. For the three-year period ended December 31, 2001, we generated $255.8 million in net cash from operating activities, primarily driven by net income plus depreciation and amortization. Excluding working capital changes, during 2001 cash fl ows from operating activities increased $10.2 million over the prior-year period.
Investing activities. The $27.2 million of cash used for investing activities during 2001 was primarily attributable to pur-chases of property and equipment and cash paid in acquisitions, net of cash balances obtained in the acquisitions, partially offset by proceeds from sales of franchises. During 2001, we used approximately $20.9 million in purchasing property and equipment, of which, approximately $12.5 million was for the purchase of land and construction of new facilities.
During 2000, $72.8 million of cash was used for investing activities, primarily attributable to cash paid in completing acquisitions, net of cash balances obtained in the acquisitions, and purchases of property and equipment, partially offset by proceeds from the sales of franchises. During 2000, we used approximately $17.3 million in purchasing property and equipment, of which, approximately $8.8 million was for the purchase of land and construction of new facilities.
Year Ended December 31, 2001 2000 1999
(in thousands)
Net cash provided by operating activities $ 86,988 $ 95,592 $73,224
Net cash used in investing activities (27,229) (72,768) (126,944)
Net cash provided by (used in) fi nancing activities (53,425) (770) 106,101
Net increase in cash and cash equivalents $ 6,334 $ 22,054 $52,381
Interest Expense. Floorplan and other interest expense, net, increased $22.6 million, or 74.3%, to $53.0 million for the year ended December 31, 2000, from $30.4 million for the year ended December 31, 1999. The increase was due to increases in total debt outstanding and interest rates. The increase in debt outstanding was primarily attributable to the fl oorplan borrowings of the additional dealership operations acquired and additional borrowings to complete acquisitions. Further, contributing to the increase was a 100 basis point increase in the weighted average LIBOR. Partially mitigating the LIBOR increase was a 25 basis point rate reduction of the spread charged on our fl oorplan notes payable, which was effective in May 1999. Additionally, in December 2000, we received another 12.5 basis point reduction of the spread charged.
Other Income, net. Other income, net, increased $956,000 to $1,142,000 for the year ended December 31, 2000, from $186,000 for the year ended December 31, 1999. The increase is due primarily to a $1.0 million gain from the sale of a Chrysler franchise in Austin, Texas.
Liquidity and Capital ResourcesOur principal sources of liquidity are cash from operations, our credit facility (which includes the fl oorplan facility and the acquisition facility) and equity and debt offerings.
The following table sets forth selected historical information from our statements of cash fl ows:
MANAGEMENT’S DISCUSSION AND ANALYSIS OF FINANCIAL CONDITION AND RESULTS OF OPERATIONS
213702_Finan.ind 4/15/02, 11:03 AM20

21
MANAGEMENT’S DISCUSSION AND ANALYSIS OF FINANCIAL CONDITION AND RESULTS OF OPERATIONS
During 1999, $126.9 million was used for investing activities, primarily attributable to completing acquisi-tions, net of cash balances obtained in the acquisitions, and purchases of property and equipment, partially offset by sales of property and equipment. During 1999, we used approximately $27.4 million in purchasing property and equipment, of which, approximately $19.6 million was for the purchase of land and construction of new facilities. Partially offsetting these uses of cash, we received $11.7 million from sales of property and equipment. The pro-ceeds were received primarily from the sale of dealership properties to a REIT for approximately $11.2 million, and for which no gain or loss was recognized.
Financing activities. We used approximately $53.4 million in fi nancing activities during 2001. The uses were primarily attributable to paydowns made on our revolv-ing credit facility and purchases of treasury stock, largely offset by the proceeds of our common stock offering. In October 2001, we completed an offering of 3.3 million shares of our common stock, with net proceeds from the offering, after expenses, of approximately $98.5 million. The proceeds from the offering, as well as cash fl ows from operations, were used to reduce the outstanding balance under our credit facility by $118.6 million. We may re-borrow the amounts repaid under our credit facility for general corporate purposes, including acquisitions.
During 2000 we used approximately $770,000 in fi nancing activities. Cash was provided primarily through borrow-ings on our revolving credit facility. We used $6.3 million for principal payments of long-term debt. Additionally, we used $20.9 million for purchases of treasury stock.
The net cash provided during 1999 was generated primar-ily from our March 1999 offerings of 2 million shares of common stock and $100 million of senior subordinated notes. The net proceeds from these offerings, approxi-mately $137.7 million, were used to repay $59.0 million borrowed under the acquisition portion of the credit facility, with the remainder of the proceeds being used in completing acquisitions during 1999. Additionally, in connection with the sale of properties to a REIT, we paid off mortgages of approximately $2.5 million.
Working Capital. At December 31, 2001, we had working capital of $154.7 million, which is approximately $100 million higher than we believe we need to operate our business. We expect to use this excess working capital to fund acquisitions and anticipated capital expenditures. Historically, we have funded our operations with internally generated cash fl ow and borrowings. Certain manufac-turers have minimum working capital guidelines, which may limit a subsidiary’s ability to make distributions to the parent company. While we cannot guarantee it, based on current facts and circumstances, we believe we have adequate cash fl ow coupled with borrowing capacity under our credit facility to fund our current operations, anticipated capital expenditures and acquisitions.
Stock RepurchaseThe board of directors has authorized us to repurchase a portion of our stock, subject to management’s judgment and the restrictions of our various debt agreements. Our agreements, subject to other covenants, allow us to spend approximately 33 percent of our cumulative net income to repurchase stock. During 2001 we repurchased 0.4 million shares for approximately $9.3 million, excluding shares repurchased to fulfi ll obligations under our employee stock purchase plan. At times we have purchased our stock from related parties. These transactions were completed at then current market prices. We allocate resources based on a risk-adjusted analysis of expected returns. As such, we may repurchase shares of our common stock if market conditions allow us to receive an acceptable return on investment.
213702_Finan.ind 4/15/02, 11:03 AM21
22
MANAGEMENT’S DISCUSSION AND ANALYSIS OF FINANCIAL CONDITION AND RESULTS OF OPERATIONS
Capital ExpendituresOur capital expenditures include expenditures to extend the useful life of current facilities and expenditures to start or expand operations. Historically, our annual capital expenditures exclusive of new or expanded operations have approximately equaled our annual depreciation charge. Expenditures relating to the construction or expansion of dealership facilities, generally, are driven by new franchises being awarded to us by a manufacturer or signifi cant growth in sales at an existing facility. During 2002, we plan to invest approximately $21 million to expand nine existing facilities and prepare six new facilities for opera-tions. Additionally, during 2002, we will be relocating certain dealerships we own to new facilities that are being constructed and fi nanced by related and third-parties. We estimate that the relocation of our stores to the new facilities will result in incremental rent expense of approximately $0.7 million, per year.
Acquisition FinancingWe anticipate acquiring at least $500 million in revenues during 2002, consisting of both platform and tuck-in acquisitions. We expect the cash needed to complete our acquisitions will come from excess working capital, operating cash fl ows of our dealerships and borrowings under our credit facility.
Credit FacilityOur credit facility provides a fl oorplan facility of $702 million, with an interest rate of LIBOR plus 112.5 basis points, for fi nancing vehicle inventories. Additionally, the credit facility provides an acquisition facility of $198 million for fi nancing acquisitions, general corporate pur-poses and capital expenditures and bears interest at LIBOR plus a margin varying between 175 to 325 basis points, dependent upon certain fi nancial ratios. The amount available to be borrowed under the acquisition portion of the credit facility is dependent upon a calcu-lation based on our cash fl ow and maintaining certain fi nancial ratios. The credit facility also contains various covenants including fi nancial ratios, such as fi xed-charge coverage, interest coverage and a minimum net worth requirement, among others, as well as other requirements which must be maintained. The lending group making up the credit facility is comprised of 15 major fi nancial institutions, including fi ve manufacturer captive fi nance companies. The manufacturer captive fi nance companies
are Ford Motor Credit Company, Toyota Motor Credit Corporation, BMW Financial Services N.A. Inc., Chrysler Financial Company, L.L.C. and Mercedes-Benz Credit Cor-poration. As of March 15, 2002, $198 million is available to be drawn under the acquisition facility, subject to a cash fl ow calculation and the maintenance of certain fi nancial ratios and various covenants. The credit facility allows 33% of net income to be paid as cash dividends.
During July 2001, we entered into a two-year interest rate swap with a notional amount of $100 million. Addition-ally, during October 2001, we entered into a three-year interest rate swap with a notional amount of $100 million. The effect of these swaps is to convert the interest rate on a portion of our borrowings from the 30-day LIBOR to an average fi xed rate of interest of 5.20%.
LeasesWe lease various real estate, facilities and equipment under long-term operating lease agreements, including leases with related parties. Generally, the related-party and third-party leases have 30-year total terms with initial terms of 15 years and three fi ve-year option periods, at our option.See Note 11 to the Financial Statements, which summarizes our obligations to related and third-parties. Additionally, we generally have an option to purchase the real estate and facilities at the end of the lease term, and a right of fi rst refusal, giving us the opportunity to purchase the real estate and facilities, if the owner reaches an agreement to sell them to a third party.
213702_Finan.ind 4/15/02, 11:03 AM22

23
MANAGEMENT’S DISCUSSION AND ANALYSIS OF FINANCIAL CONDITION AND RESULTS OF OPERATIONS
Obligations and CommitmentsThe following is a summary of our future contractual cash obligations:
Our credit facility is currently set to mature on December 31, 2003. The credit facility provides commitments for inven-tory fi nancing, fl oorplan notes payable, up to $702 million, of which we had borrowed $365.0 million at December 31, 2001. Payments, generally, are required to be made on the fl oorplan notes payable as the vehicles are sold. The credit facility also provides commitments for a revolving credit line for general corporate purposes, including acquisitions, up to $198 million, of which none was outstanding at December 31, 2001. Other than the interest rate swap agreements discussed above, there are no other signifi cant contractual commitments to or from us.
Current Business TrendsDuring 2001, approximately 17.2 million new vehicles were sold in the United States. Industry analyst estimates for 2002 are predicting new vehicle unit sales of between 15.5 million and 16.0 million units. Annual sales of 15.5 million units would rank as the sixth highest total of new vehicle retail sales in the United States during the past 100 years. As the used vehicle market is less cyclical than the new vehicle market, we expect to see continued single-digit growth in used vehicle retail sales volume. Due to the increase in units in operation from the recent record new vehicle sales, and the increasing complexity of the vehicles being sold today, we expect to see growth in the parts and service market for franchised auto-mobile dealers. With respect to interest rates, the one-month LIBOR, which averaged approximately 3.9% during 2001, has fallen to approximately 1.9% in March 2002.
Discussion of Critical Accounting PoliciesThe preparation of fi nancial statements in conformity with generally accepted accounting principles requires us to make estimates and assumptions in determining the reported amounts of assets and liabilities and disclosure of contingent assets and liabilities at the date of the fi nancial statements and the reported amounts of revenues and expenses during the report-ing period. The signifi cant estimates made by us in the accompanying consolidated fi nancial statements relate to reserves for inventory valuations and future chargebacks on fi nance and vehicle service contract fees, and valuation of intangible assets. Actual results could differ from those estimates.
Critical accounting policies are those that are both most important to the portrayal of a company’s fi nancial position and results of operations, and require management’s most diffi cult, subjective or complex judgments. Below is a discussion of what we believe are our critical accounting policies. See Note 2 to our consolidated fi nancial statements for additional discussion regarding our accounting policies.
Contractual Cash
Obligations 2002 2003 2004 2005 2006 Thereafter Total
(in thousands)
Debt (1) $ 1,687 $ 1,381 $ 874 $ 881 $ 555 $ 91,808 $ 97,186
Floorplan notes payable (1) _ 364,954 _ _ _ _ 364,954
Leases 30,875 30,455 30,138 28,869 28,445 153,030 301,812
Other long-term obligations 25 25 25 25 25 1,025 1,150
Total $32,587 $396,815 $31,037 $29,775 $29,025 $245,863 $765,102
(1) Excludes interest payments.
213702_Finan.ind 4/15/02, 11:03 AM23
24
MANAGEMENT’S DISCUSSION AND ANALYSIS OF FINANCIAL CONDITION AND RESULTS OF OPERATIONS
InventoriesNew, used and demonstrator vehicles are stated at the lower of cost or market, determined on a specifi c-unit basis. Vehicle inventory cost consists of the amount paid to acquire the inventory, plus reconditioning cost, cost of equipment added and transportation cost. Additionally, we receive interest assistance from some of our manufacturers. The assistance is accounted for as a purchase discount and is refl ected as a reduction to the inventory cost on the bal-ance sheet and as a reduction to cost of sales in the income statement as the vehicles are sold. Parts and accessories are stated at the lower of cost (determined on a fi rst-in, fi rst-out basis) or market. As the market value of our invento-ries typically declines with the passage of time, valuation reserves are provided against the inventory balances based on the agings of the inventories and market trends.
Finance and Service Contract Income RecognitionWe arrange fi nancing for customers through various institutions and receive fi nancing fees based on the difference between the loan rates charged to customers over predetermined fi nancing rates set by the fi nancing institution. In addition, we receive fees from the sale of vehicle service contracts to customers.
We may be charged back (“chargebacks”) for unearned fi nancing fees or vehicle service contract fees in the event of early termination of the contracts by customers. The revenues from fi nancing fees and vehicle service contract fees in administrator-obligor states are recorded at the time of the sale of the vehicles and a reserve for future charge-backs is established based on historical operating results and the termination provisions of the applicable contracts. In dealer-obligor states, revenues from vehicle service contract fees and related direct costs are deferred and recognized over the life of the contracts. Finance and vehicle service contract revenues, net of estimated charge-backs, are included in other dealership revenues in the accompanying consolidated fi nancial statements.
Intangible AssetsThe following are recently issued statements by the Financial Accounting Standards Board that we believe could have a signifi cant impact on our reported fi nancial condition or statement of operations.
In June 2001, Statement of Financial Accounting Standards (“SFAS”) No. 141, “Business Combinations” was issued. SFAS No. 141 eliminates the use of the pooling-of-inter-ests method of accounting for business combinations and establishes the purchase method as the only acceptable method. We adopted this statement effective July 1, 2001. Acquired intangible assets, if any, are separately recognized if, among other things, the benefi t is obtained through contractual or other legal rights, such as franchise agree-ments. Goodwill is recorded only to the extent the pur-chase price for an entity exceeds the fair value of the net tangible assets and identifi able intangible assets acquired.
In June 2001, SFAS No. 142, “Goodwill and Other Intangible Assets” was issued. SFAS No. 142 changes the treatment of goodwill by no longer amortizing goodwill, however, other identifi able intangible assets are to be separately recognized and amortized, as applicable. The statement requires, at least annually, an assessment for impairment of goodwill and other indefi nite life intangible assets by applying a fair-value based test. A portion of our intangible assets relate to franchise value, which is consid-ered to have an indefi nite life. The statement is effective for fi scal years beginning after December 15, 2001. The adoption of the statement will result in the elimination of approximately $7.5 million of goodwill amortization, annually, subsequent to December 31, 2001. Additionally, adoption could result in an impairment of goodwill, based on the new fair-value based test, which would be refl ected as a cumulative effect of change in accounting principle on January 1, 2002. We are currently analyzing the impact this statement will have on our consolidated results of operations and fi nancial position.
213702_Finan.ind 4/15/02, 11:03 AM24
25
MANAGEMENT’S DISCUSSION AND ANALYSIS OF FINANCIAL CONDITION AND RESULTS OF OPERATIONS
Dividend PolicyWe have never declared or paid dividends on our common
stock. We intend to retain future earnings, if any, to fi nance
the development and expansion of our business and/or
repurchase our common stock and/or senior subordinated
notes. Therefore, we do not anticipate paying any cash
dividends on our common stock in the foreseeable future.
The decision whether to pay dividends will be made by
our Board of Directors after considering our results of
operations, fi nancial condition, capital requirements,
general business conditions and other factors.
Certain provisions of the credit facility and the senior
subordinated notes require us to maintain certain fi nancial
ratios and restrict us from making substantial disburse-
ments outside the ordinary course of business, including
limitations on the payment of cash dividends. In addition,
pursuant to the automobile franchise agreements to which
our dealerships are subject, all dealerships are required to
maintain a certain minimum working capital.
Cautionary Statement About Forward-Looking StatementsThis annual report includes certain “forward-looking state-
ments” within the meaning of Section 27A of the Securities
Act of 1933 and Section 21E of the Securities Exchange
Act of 1934. These statements include statements regarding
our plans, goals, beliefs or current expectations, including
those plans, goals, beliefs and expectations of our offi cers
and directors with respect to, among other things:
• the completion of pending and future acquisitions
• operating cash fl ows and availability of capital
• future stock repurchases
• capital expenditures
• changes in sales volumes in the new and used vehicle
and parts and service markets
• impact of new accounting standards
• business trends and interest rates
Any such forward-looking statements are not assurances
of future performance and involve risks and uncertain-
ties. Actual results may differ materially from anticipated
results in the forward-looking statements for a number of
reasons, including;
• the future economic environment, including consumer
confi dence, interest rates and manufacturer incentives,
may affect the demand for new and used vehicles and
parts and service sales
• regulatory environment, adverse legislation, or unex-
pected litigation
• our principal automobile manufacturers, especially Ford,
Toyota and GM may not continue to produce or make
available to us vehicles that are in high demand by
our customers
• requirements imposed on us by our manufacturers may
affect our acquisitions and capital expenditures
related to our dealership facilities
• our dealership operations may not perform at expected
levels or achieve expected improvements
• we may not achieve expected future cost savings and
our future costs could be higher than we expected
• available capital resources and various debt agreements
may limit our ability to repurchase shares. Any
repurchases of our stock may be made, from time
to time, in accordance with applicable securities
laws, in the open market or in privately negotiated
transactions at such time and in such amounts, as
we consider appropriate
• available capital resources may limit our ability to
complete acquisitions
• available capital resources may limit our ability to
complete construction of new or expanded facilities
• our cost of fi nancing could increase signifi cantly
• new accounting standards could materially impact
our reported earnings per share
213702_Finan.ind 4/15/02, 11:03 AM25
26
The information contained in this annual report, including the information set forth under the heading “Business” in the 2001 Form 10-K, identifi es factors that could affect our operating results and performance. We urge you to carefully consider those factors.
All forward-looking statements attributable to us are qualifi ed in their entirety by this cautionary statement.
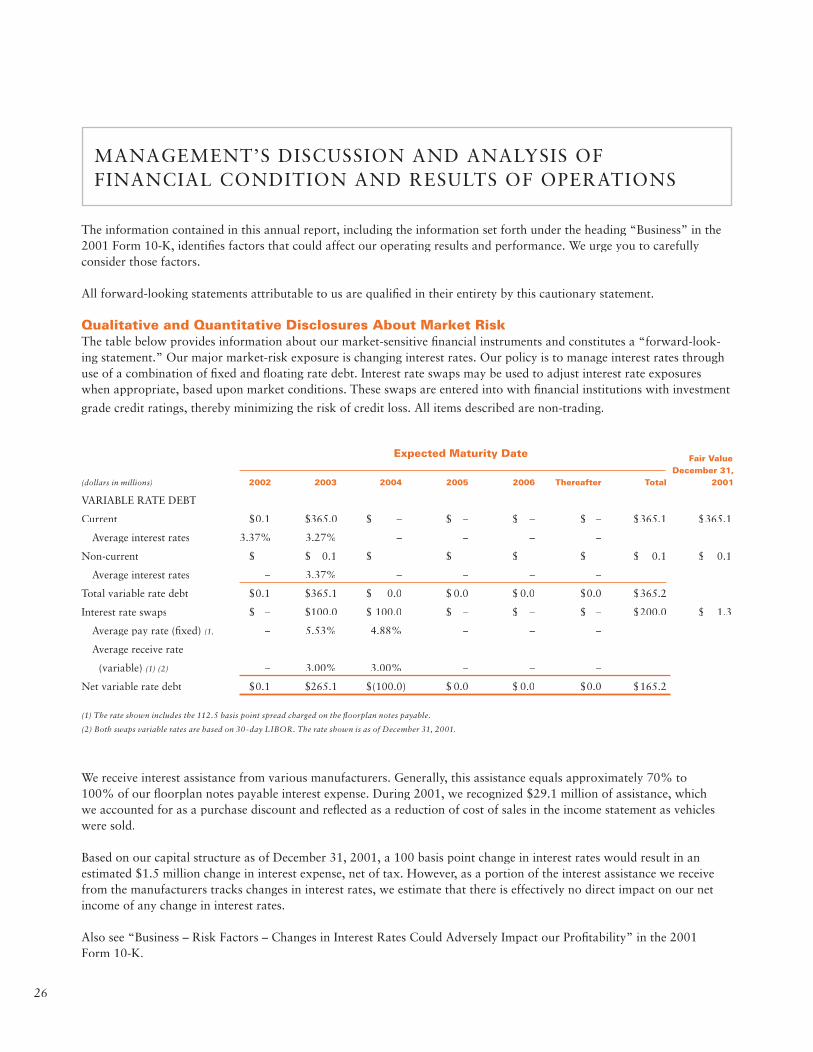
Qualitative and Quantitative Disclosures About Market RiskThe table below provides information about our market-sensitive fi nancial instruments and constitutes a “forward-look-ing statement.” Our major market-risk exposure is changing interest rates. Our policy is to manage interest rates through use of a combination of fi xed and fl oating rate debt. Interest rate swaps may be used to adjust interest rate exposures when appropriate, based upon market conditions. These swaps are entered into with fi nancial institutions with investment
grade credit ratings, thereby minimizing the risk of credit loss. All items described are non-trading.
We receive interest assistance from various manufacturers. Generally, this assistance equals approximately 70% to 100% of our fl oorplan notes payable interest expense. During 2001, we recognized $29.1 million of assistance, which we accounted for as a purchase discount and refl ected as a reduction of cost of sales in the income statement as vehicles were sold.
Based on our capital structure as of December 31, 2001, a 100 basis point change in interest rates would result in an estimated $1.5 million change in interest expense, net of tax. However, as a portion of the interest assistance we receive from the manufacturers tracks changes in interest rates, we estimate that there is effectively no direct impact on our net income of any change in interest rates.
Also see “Business – Risk Factors – Changes in Interest Rates Could Adversely Impact our Profi tability” in the 2001 Form 10-K.
MANAGEMENT’S DISCUSSION AND ANALYSIS OF FINANCIAL CONDITION AND RESULTS OF OPERATIONS
Fair Value December 31, (dollars in millions) 2002 2003 2004 2005 2006 Thereafter Total 2001
VARIABLE RATE DEBT
Current $0.1 $365.0 $ – $ – $ – $ – $365.1 $365.1
Average interest rates 3.37% 3.27% – – – –
Non-current $ – $ 0.1 $ – $ – $ – $ – $ 0.1 $ 0.1
Average interest rates – 3.37% – – – –
Total variable rate debt $0.1 $365.1 $ 0.0 $ 0.0 $ 0.0 $0.0 $365.2
Interest rate swaps $ – $100.0 $ 100.0 $ – $ – $ – $200.0 $ 1.3
Average pay rate (fi xed) (1) – 5.53% 4.88% – – –
Average receive rate
(variable) (1) (2) – 3.00% 3.00% – – –
Net variable rate debt $0.1 $265.1 $(100.0) $ 0.0 $ 0.0 $0.0 $165.2
(1) The rate shown includes the 112.5 basis point spread charged on the fl oorplan notes payable.
(2) Both swaps variable rates are based on 30-day LIBOR. The rate shown is as of December 31, 2001.
Expected Maturity Date
213702_Finan.ind 4/15/02, 11:03 AM26
27
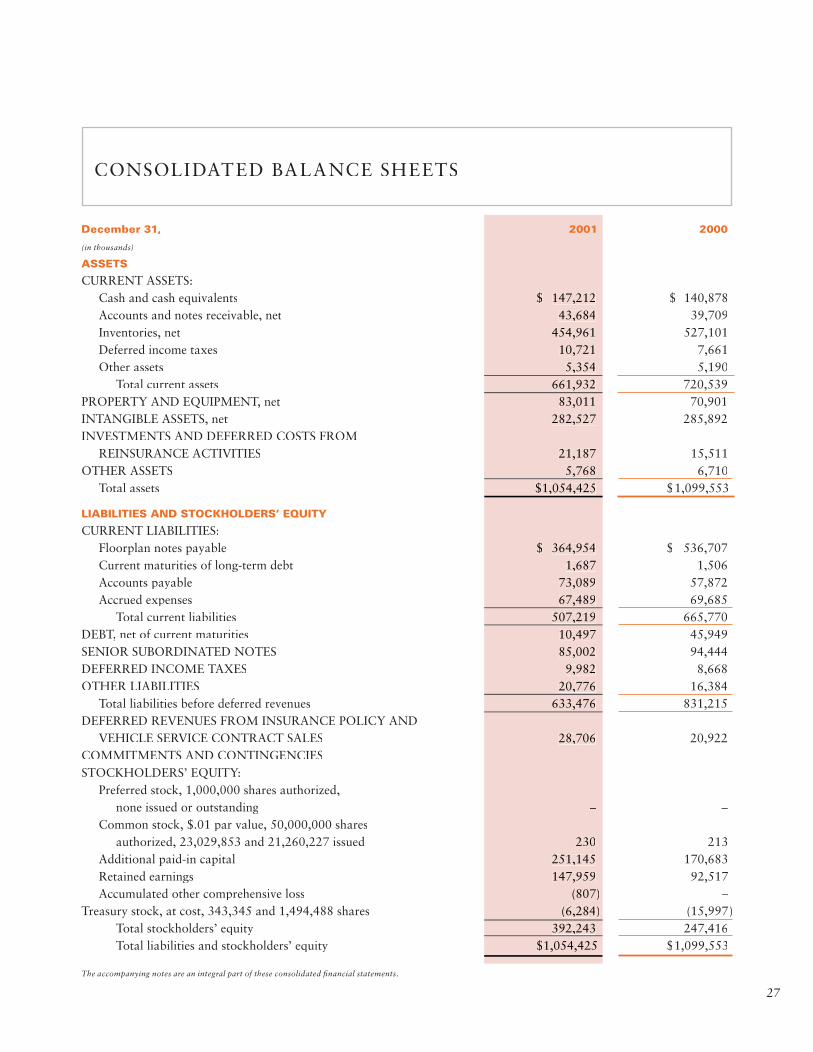
CONSOLIDATED BALANCE SHEETS
December 31, 2001 2000
(in thousands)
ASSETS
CURRENT ASSETS: Cash and cash equivalents $ 147,212 $ 140,878Accounts and notes receivable, net 43,684 39,709Inventories, net 454,961 527,101Deferred income taxes 10,721 7,661Other assets 5,354 5,190
Total current assets 661,932 720,539PROPERTY AND EQUIPMENT, net 83,011 70,901INTANGIBLE ASSETS, net 282,527 285,892INVESTMENTS AND DEFERRED COSTS FROM
REINSURANCE ACTIVITIES 21,187 15,511OTHER ASSETS 5,768 6,710
Total assets $1,054,425 $1,099,553
LIABILITIES AND STOCKHOLDERS’ EQUITY
CURRENT LIABILITIES: Floorplan notes payable $ 364,954 $ 536,707Current maturities of long-term debt 1,687 1,506Accounts payable 73,089 57,872Accrued expenses 67,489 69,685
Total current liabilities 507,219 665,770DEBT, net of current maturities 10,497 45,949SENIOR SUBORDINATED NOTES 85,002 94,444DEFERRED INCOME TAXES 9,982 8,668OTHER LIABILITIES 20,776 16,384
Total liabilities before deferred revenues 633,476 831,215DEFERRED REVENUES FROM INSURANCE POLICY AND
VEHICLE SERVICE CONTRACT SALES 28,706 20,922COMMITMENTS AND CONTINGENCIES STOCKHOLDERS’ EQUITY:
Preferred stock, 1,000,000 shares authorized, none issued or outstanding – –
Common stock, $.01 par value, 50,000,000 shares authorized, 23,029,853 and 21,260,227 issued 230 213
Additional paid-in capital 251,145 170,683 Retained earnings 147,959 92,517 Accumulated other comprehensive loss (807) –
Treasury stock, at cost, 343,345 and 1,494,488 shares (6,284) (15,997) Total stockholders’ equity 392,243 247,416 Total liabilities and stockholders’ equity $1,054,425 $1,099,553
The accompanying notes are an integral part of these consolidated fi nancial statements.
213702_Finan.ind 4/15/02, 11:03 AM27

28
CONSOLIDATED STATEMENTS OF OPERATIONS
Year Ended December 31, 2001 2000 1999
(dollars in thousands, except per share amounts)
Revenues:
New vehicle sales $ 2,365,008 $ 2,165,954 $1,465,759
Used vehicle sales 1,133,066 1,003,759 750,807
Parts and service sales 360,201 306,089 212,970
Other dealership revenues, net 138,099 110,344 78,788
Total revenues 3,996,374 3,586,146 2,508,324
Cost of Sales:
New vehicle sales 2,185,939 1,996,264 1,344,120
Used vehicle sales 1,042,853 923,819 691,499
Parts and service sales 160,330 138,626 96,348
Total cost of sales 3,389,122 3,058,709 2,131,967
Gross Profi t 607,252 527,437 376,357
Selling, General and
Administrative Expenses 458,546 393,679 279,791
Income from operations before
non-cash charges 148,706 133,758 96,566
Depreciation Expense 8,216 7,587 4,853
Amortization Expense 9,142 8,451 5,763
Income from operations 131,348 117,720 85,950
Other Income and (Expenses):
Floorplan interest expense, excludes
manufacturer interest assistance (27,935) (37,536) (20,395)
Other interest expense, net (13,863) (15,500) (10,052)
Other income (expense), net (128) 1,142 186
Income before Income Taxes 89,422 65,826 55,689
Provision for Income Taxes 33,980 25,014 22,174
Net Income $ 55,442 $ 40,812 $ 33,515
Earnings per share:
Basic $ 2.75 $ 1.91 $ 1.62
Diluted $ 2.59 $ 1.88 $ 1.55
Weighted average shares outstanding:
Basic 20,137,661 21,377,902 20,683,308
Diluted 21,415,154 21,709,833 21,558,920
The accompanying notes are an integral part of these consolidated fi nancial statements.
213702_Finan.ind 4/15/02, 11:03 AM28
29
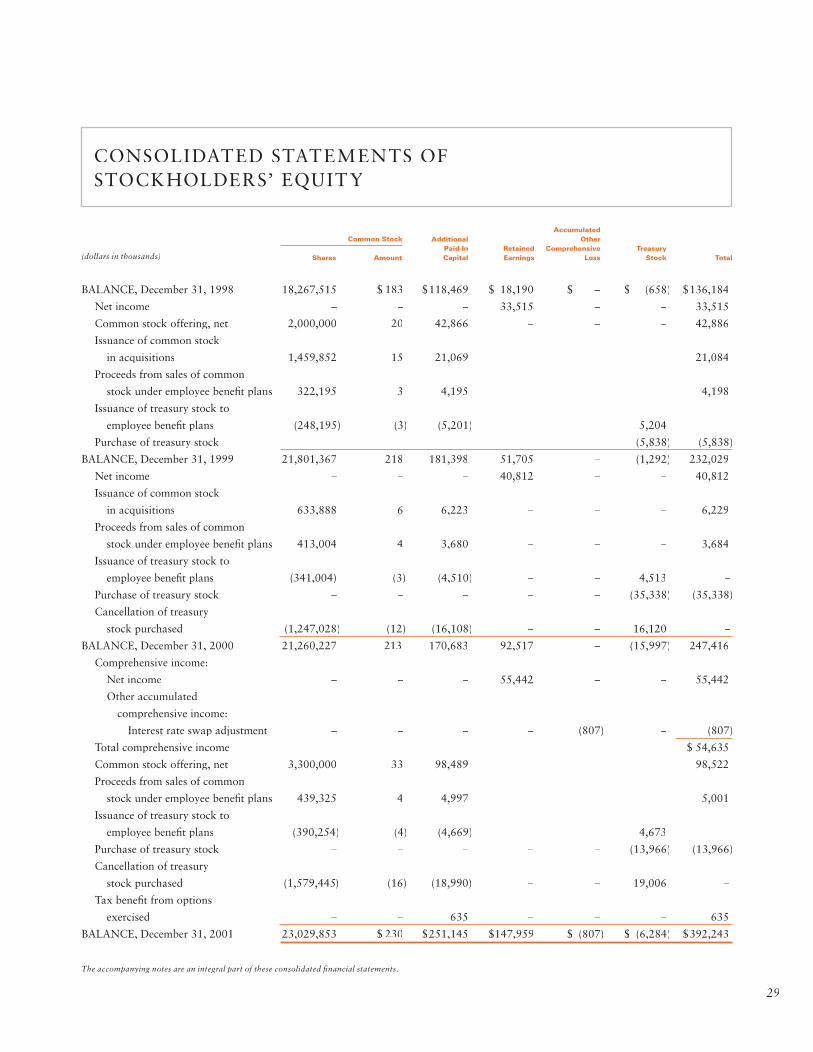
CONSOLIDATED STATEMENTS OF STOCKHOLDERS’ EQUITY
(dollars in thousands)
BALANCE, December 31, 1998 18,267,515 $ 183 $118,469 $ 18,190 $ – $ (658) $136,184
Net income – – – 33,515 – – 33,515
Common stock offering, net 2,000,000 20 42,866 – – – 42,886
Issuance of common stock
in acquisitions 1,459,852 15 21,069 – – – 21,084
Proceeds from sales of common
stock under employee benefi t plans 322,195 3 4,195 – – – 4,198
Issuance of treasury stock to
employee benefi t plans (248,195) (3) (5,201) – – 5,204 –
Purchase of treasury stock – – – – – (5,838) (5,838)
BALANCE, December 31, 1999 21,801,367 218 181,398 51,705 – (1,292) 232,029
Net income – – – 40,812 – – 40,812
Issuance of common stock
in acquisitions 633,888 6 6,223 – – – 6,229
Proceeds from sales of common
stock under employee benefi t plans 413,004 4 3,680 – – – 3,684
Issuance of treasury stock to
employee benefi t plans (341,004) (3) (4,510) – – 4,513 –
Purchase of treasury stock – – – – – (35,338) (35,338)
Cancellation of treasury
stock purchased (1,247,028) (12) (16,108) – – 16,120 –
BALANCE, December 31, 2000 21,260,227 213 170,683 92,517 – (15,997) 247,416
Comprehensive income:
Net income – – – 55,442 – – 55,442
Other accumulated
comprehensive income:
Interest rate swap adjustment – – – – (807) – (807)
Total comprehensive income $ 54,635
Common stock offering, net 3,300,000 33 98,489 – – – 98,522
Proceeds from sales of common
stock under employee benefi t plans 439,325 4 4,997 – – – 5,001
Issuance of treasury stock to
employee benefi t plans (390,254) (4) (4,669) – – 4,673 –
Purchase of treasury stock – – – – – (13,966) (13,966)
Cancellation of treasury
stock purchased (1,579,445) (16) (18,990) – – 19,006 –
Tax benefi t from options
exercised – – 635 – – – 635
BALANCE, December 31, 2001 23,029,853 $ 230 $251,145 $147,959 $ (807) $ (6,284) $392,243
The accompanying notes are an integral part of these consolidated fi nancial statements.
Shares Amount
AdditionalPaid-InCapital
RetainedEarnings
AccumulatedOther
ComprehensiveLoss
TreasuryStock Total
Common Stock
213702_Finan.ind 4/15/02, 11:03 AM29
30
CONSOLIDATED STATEMENTS OF CASH FLOWS
Year Ended December 31, 2001 2000 1999
(dollars in thousands)
CASH FLOWS FROM OPERATING ACTIVITIES:
Net income $ 55,442 $ 40,812 $ 33,515
Adjustments to reconcile net income to net
cash provided by operating activities –
Depreciation and amortization 17,358 16,038 10,616
Deferred income taxes (1,225) 6,370 4,011
Provision for doubtful accounts and uncollectible notes 1,732 1,176 1,153
(Gain) loss on sale of assets 120 (87) (53)
Gain on sale of franchise – (1,048) –
Changes in assets and liabilities –
Accounts receivable (4,996) (1,930) (4,717)
Inventories 68,472 (78,480) (49,079)
Prepaid expenses and other assets (6,689) (2,167) (3,487)
Floorplan notes payable (81,126) 113,424 68,584
Accounts payable, accrued expenses and deferred revenues 37,900 1,484 12,681
Total adjustments 31,546 54,780 39,709
Net cash provided by operating activities 86,988 95,592 73,224
CASH FLOWS FROM INVESTING ACTIVITIES:
Increase in notes receivable (2,678) (2,933) (2,452)
Collections on notes receivable 1,150 1,413 1,040
Purchases of property and equipment (20,857) (17,252) (27,382)
Proceeds from sale of property and equipment 818 1,371 11,705
Proceeds from sales of franchises 5,373 9,700 –
Cash paid in acquisitions, net of cash received (11,035) (65,067) (109,855)
Net cash used in investing activities (27,229) (72,768) (126,944)
CASH FLOWS FROM FINANCING ACTIVITIES:
Net borrowings (payments) on revolving credit facility (118,572) 25,250 (32,000)
Principal payments of long-term debt (1,791) (6,321) (3,610)
Borrowings of long-term debt 1,426 1,098 5,684
Proceeds from common stock offering, net 98,522 – 42,886
Proceeds from senior subordinated notes offering, net – – 94,781
Purchase of senior subordinated notes (9,601) (3,587) –
Proceeds from issuance of common stock to benefi t plans 5,001 3,684 4,198
Purchase of treasury stock, amounts based on settlement date (28,410) (20,894) (5,838)
Net cash provided by (used in) fi nancing activities (53,425) (770) 106,101
NET INCREASE IN CASH AND CASH EQUIVALENTS 6,334 22,054 52,381
CASH AND CASH EQUIVALENTS, beginning of period 140,878 118,824 66,443
CASH AND CASH EQUIVALENTS, end of period $147,212 $140,878 $118,824
SUPPLEMENTAL DISCLOSURES OF CASH FLOW INFORMATION:
Cash paid for –
Interest $ 44,647 $ 53,226 $ 27,156
Income taxes $ 28,975 $ 19,150 $ 22,812
The accompanying notes are an integral part of these consolidated fi nancial statements.
213702_Finan.ind 4/15/02, 11:04 AM30

31
NOTES TO CONSOLIDATED FINANCIAL STATEMENTS
1. Business and Organization:
Group 1 Automotive, Inc., a Delaware corporation, is a leading operator in the automotive retailing industry. Group 1 Automotive, Inc. is a holding company with no independent assets or operations other than its investments in its subsidiaries, which are located in Texas, Oklahoma, Florida, Georgia, New Mexico, Colorado, Louisiana and Massachusetts. These subsidiaries sell new and used cars and light trucks through their dealerships and Internet sites; arrange related fi nancing, vehicle service and insur-ance contracts; provide maintenance and repair service; and sell replacement parts. Group 1 Automotive, Inc. and its subsidiaries are herein collectively referred to as the “Company” or “Group 1”.
2. Summary of Signifi cant Accounting Policies:
Basis of Presentation / Reclassifi cationsAll acquisitions of dealerships completed during the peri-ods presented have been accounted for using the purchase method of accounting and their results of operations are included from the effective dates of the closings of the acquisitions. The allocations of purchase price to the assets acquired and liabilities assumed have been initially assigned and recorded based on preliminary estimates of fair value and may be revised as additional informa-tion concerning the valuation of such assets and liabilities becomes available. All signifi cant intercompany balances and transactions have been eliminated in consolidation. Certain reclassifi cations have been made to prior year fi nancial statements to conform to the current year presentation.
Revenue RecognitionRevenues from vehicle sales, parts sales and vehicle service are recognized upon completion of the sale and delivery to the customer. Conditions to completing a sale include having an agreement with the customer, including pricing, and the sales price must be reasonably expected to be collected.
Finance, Insurance and Service Contract Income RecognitionThe Company arranges fi nancing for customers through various institutions and receives fi nancing fees based on the difference between the loan rates charged to customers and predetermined fi nancing rates set by the fi nancing institu-tion. In addition, the Company receives fees from the sale of vehicle service contracts to customers.
The Company may be charged back (“chargebacks”) for unearned fi nancing fees or vehicle service contract fees in the event of early termination of the contracts by custom-ers. The revenues from fi nancing fees and vehicle service contract fees in administrator-obligor states are recorded at the time of the sale of the vehicles and a reserve for future chargebacks is established based on historical operating results and the termination provisions of the applicable contracts. In dealer-obligor states, revenues from vehicle service contract fees and related direct costs are deferred and recognized over the life of the contracts. Finance and vehicle service contract revenues, net of estimated charge-backs, are included in other dealership revenues in the accompanying consolidated fi nancial statements.
The Company consolidates the operations of its reinsur-ance company. The Company reinsures the credit life and accident and health insurance policies sold by its dealer-ships. All of the revenues and related direct costs from the sales of these policies are deferred and recognized over the life of the policies, in accordance with Statement of Finan-cial Accounting Standards (“SFAS”) No. 60, “Accounting and Reporting by Insurance Enterprises.”
Cash and Cash EquivalentsCash and cash equivalents include highly liquid invest-ments that have an original maturity of three months or less at the date of purchase, as well as contracts-in-transit. Contracts-in-transit represent contracts on vehicles sold, for which the proceeds are in transit from fi nancing institu-tions. As of December 31, 2001 and 2000, contracts-in-transit totaled $130.4 and $117.6 million, respectively.
213702_Finan.ind 4/15/02, 11:04 AM31
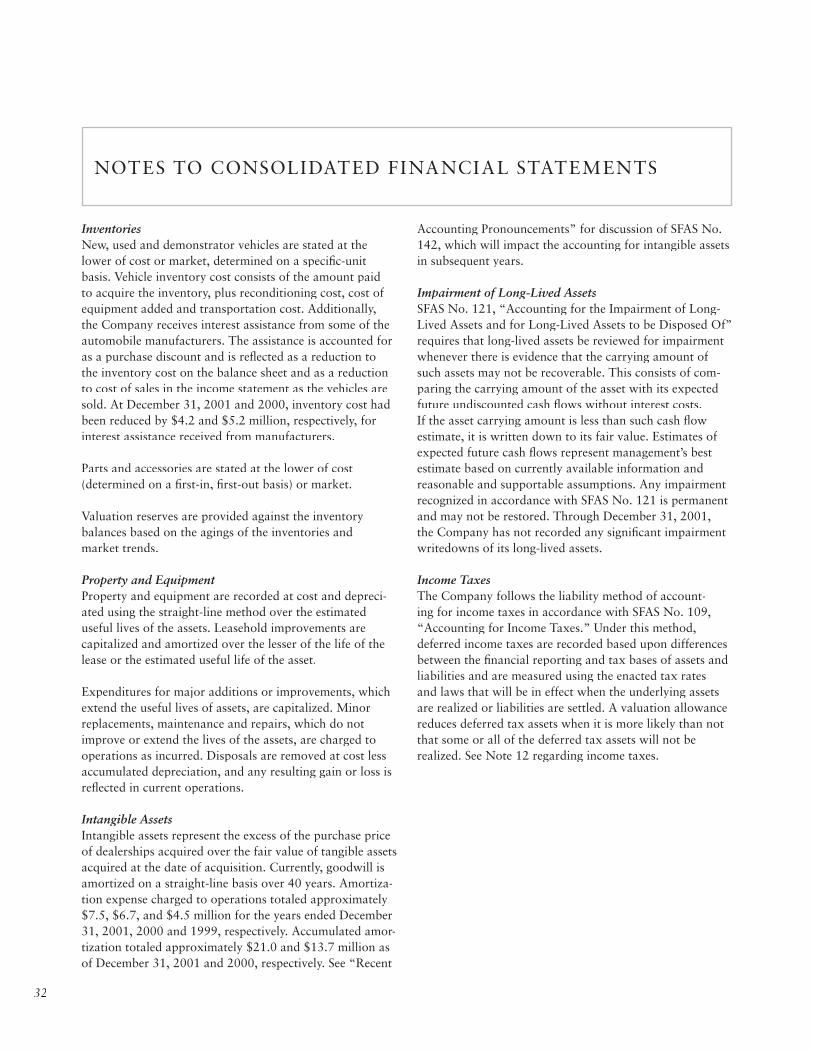
32
NOTES TO CONSOLIDATED FINANCIAL STATEMENTS
InventoriesNew, used and demonstrator vehicles are stated at the lower of cost or market, determined on a specifi c-unit basis. Vehicle inventory cost consists of the amount paid to acquire the inventory, plus reconditioning cost, cost of equipment added and transportation cost. Additionally, the Company receives interest assistance from some of the automobile manufacturers. The assistance is accounted for as a purchase discount and is refl ected as a reduction to the inventory cost on the balance sheet and as a reduction to cost of sales in the income statement as the vehicles are sold. At December 31, 2001 and 2000, inventory cost had been reduced by $4.2 and $5.2 million, respectively, for interest assistance received from manufacturers.
Parts and accessories are stated at the lower of cost (determined on a fi rst-in, fi rst-out basis) or market.
Valuation reserves are provided against the inventory balances based on the agings of the inventories and market trends.
Property and EquipmentProperty and equipment are recorded at cost and depreci-ated using the straight-line method over the estimated useful lives of the assets. Leasehold improvements are capitalized and amortized over the lesser of the life of the lease or the estimated useful life of the asset.
Expenditures for major additions or improvements, which extend the useful lives of assets, are capitalized. Minor replacements, maintenance and repairs, which do not improve or extend the lives of the assets, are charged to operations as incurred. Disposals are removed at cost less accumulated depreciation, and any resulting gain or loss is refl ected in current operations.
Intangible AssetsIntangible assets represent the excess of the purchase price of dealerships acquired over the fair value of tangible assets acquired at the date of acquisition. Currently, goodwill is amortized on a straight-line basis over 40 years. Amortiza-tion expense charged to operations totaled approximately $7.5, $6.7, and $4.5 million for the years ended December 31, 2001, 2000 and 1999, respectively. Accumulated amor-tization totaled approximately $21.0 and $13.7 million as of December 31, 2001 and 2000, respectively. See “Recent
Accounting Pronouncements” for discussion of SFAS No. 142, which will impact the accounting for intangible assets in subsequent years.
Impairment of Long-Lived AssetsSFAS No. 121, “Accounting for the Impairment of Long-Lived Assets and for Long-Lived Assets to be Disposed Of” requires that long-lived assets be reviewed for impairment whenever there is evidence that the carrying amount of such assets may not be recoverable. This consists of com-paring the carrying amount of the asset with its expected future undiscounted cash fl ows without interest costs. If the asset carrying amount is less than such cash fl ow estimate, it is written down to its fair value. Estimates of expected future cash fl ows represent management’s best estimate based on currently available information and reasonable and supportable assumptions. Any impairment recognized in accordance with SFAS No. 121 is permanent and may not be restored. Through December 31, 2001, the Company has not recorded any signifi cant impairment writedowns of its long-lived assets.
Income TaxesThe Company follows the liability method of account-ing for income taxes in accordance with SFAS No. 109, “Accounting for Income Taxes.” Under this method, deferred income taxes are recorded based upon differences between the fi nancial reporting and tax bases of assets and liabilities and are measured using the enacted tax rates and laws that will be in effect when the underlying assets are realized or liabilities are settled. A valuation allowance reduces deferred tax assets when it is more likely than not that some or all of the deferred tax assets will not be realized. See Note 12 regarding income taxes.
213702_Finan.ind 4/15/02, 11:04 AM32
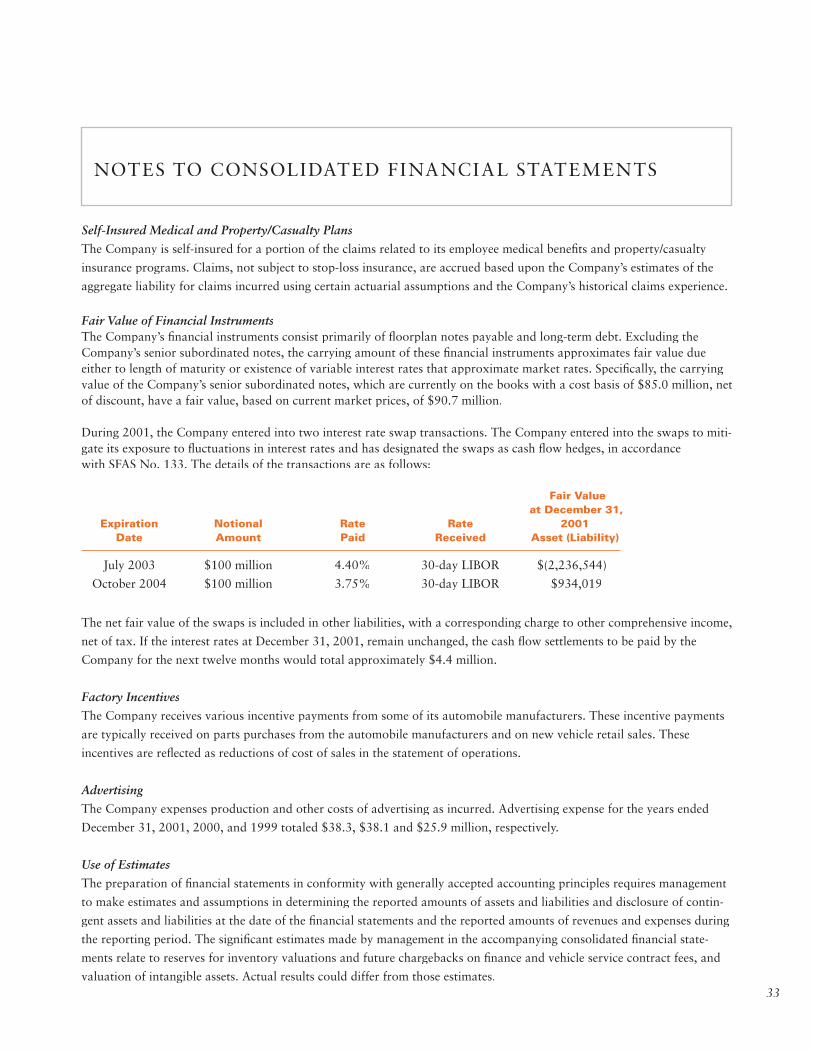
33
NOTES TO CONSOLIDATED FINANCIAL STATEMENTS
Self-Insured Medical and Property/Casualty Plans
The Company is self-insured for a portion of the claims related to its employee medical benefi ts and property/casualty
insurance programs. Claims, not subject to stop-loss insurance, are accrued based upon the Company’s estimates of the
aggregate liability for claims incurred using certain actuarial assumptions and the Company’s historical claims experience.
Fair Value of Financial InstrumentsThe Company’s fi nancial instruments consist primarily of fl oorplan notes payable and long-term debt. Excluding the Company’s senior subordinated notes, the carrying amount of these fi nancial instruments approximates fair value due either to length of maturity or existence of variable interest rates that approximate market rates. Specifi cally, the carrying value of the Company’s senior subordinated notes, which are currently on the books with a cost basis of $85.0 million, net of discount, have a fair value, based on current market prices, of $90.7 million.
During 2001, the Company entered into two interest rate swap transactions. The Company entered into the swaps to miti-gate its exposure to fl uctuations in interest rates and has designated the swaps as cash fl ow hedges, in accordance with SFAS No. 133. The details of the transactions are as follows:
The net fair value of the swaps is included in other liabilities, with a corresponding charge to other comprehensive income,
net of tax. If the interest rates at December 31, 2001, remain unchanged, the cash fl ow settlements to be paid by the
Company for the next twelve months would total approximately $4.4 million.
Factory Incentives
The Company receives various incentive payments from some of its automobile manufacturers. These incentive payments
are typically received on parts purchases from the automobile manufacturers and on new vehicle retail sales. These
incentives are refl ected as reductions of cost of sales in the statement of operations.
Advertising
The Company expenses production and other costs of advertising as incurred. Advertising expense for the years ended
December 31, 2001, 2000, and 1999 totaled $38.3, $38.1 and $25.9 million, respectively.
Use of Estimates
The preparation of fi nancial statements in conformity with generally accepted accounting principles requires management
to make estimates and assumptions in determining the reported amounts of assets and liabilities and disclosure of contin-
gent assets and liabilities at the date of the fi nancial statements and the reported amounts of revenues and expenses during
the reporting period. The signifi cant estimates made by management in the accompanying consolidated fi nancial state-
ments relate to reserves for inventory valuations and future chargebacks on fi nance and vehicle service contract fees, and
valuation of intangible assets. Actual results could differ from those estimates.
Fair Value at December 31, Expiration Notional Rate Rate 2001 Date Amount Paid Received Asset (Liability)
July 2003 $100 million 4.40% 30-day LIBOR $(2,236,544)
October 2004 $100 million 3.75% 30-day LIBOR $934,019
213702_Finan.ind 4/15/02, 11:04 AM33

34
NOTES TO CONSOLIDATED FINANCIAL STATEMENTS
Statements of Cash FlowsFor purposes of the statements of cash fl ows, cash and cash equivalents include contracts-in-transit, which are typically collected within 15 days. Additionally, the net change in fl oorplan fi nancing of inventory, which is a customary fi nancing technique in the industry, is refl ected as an operating activity in the statements of cash fl ows.
Related Party TransactionsFrom time-to-time, the Company enters into transactions with related parties. Related parties include offi cers, directors, fi ve percent or greater shareholders and other management personnel of the Company.
At times, the Company has purchased its stock from related parties. These transactions were completed at then current market prices. See Note 11 for information regarding related party lease commitments. There are no other signifi cant related party transactions.
Earnings Per ShareSFAS No. 128, “Earnings per Share” requires the presentation of basic earnings per share and diluted earnings per share in fi nancial statements of public enterprises. Under the provisions of this statement, basic earnings per share is computed based on weighted average shares outstanding and excludes dilutive securities. Diluted earnings per share is computed including the impact of all potentially dilutive securities. The following table sets forth the shares outstanding for the earn-ings per share calculations for the years ended December 31, 2001, 2000 and 1999:
Recent Accounting PronouncementsIn June 1998, SFAS No. 133, “Accounting for Derivative Instruments and Hedging Activities” was issued. SFAS No. 133 establishes accounting and reporting standards for derivative instruments, including certain derivative instruments embedded in other contracts (collectively referred to as derivatives), and for hedging activities. It requires that an entity recognizes all derivatives as either assets or liabilities in the statement of fi nancial position and measures those instruments at fair value. The accounting for changes in the fair value of a derivative (that is, gains or losses) depends on the intended use of the derivative and the resulting designation. SFAS No. 137 amended the effective date to be for all fi scal quarters of fi scal years beginning after June 15, 2000. SFAS No. 138, issued in June 2000, addresses a limited number of issues
Year Ended December 31, 2001 2000 1999
Common stock issued, beginning of period 21,260,227 21,801,367 18,267,515
Weighted average common stock issued in offerings 605,753 – 1,664,049
Weighted average common stock issued in acquisitions – 633,888 739,071
Weighted average common stock issued to employee stock
purchase plan 180,034 208,202 128,757
Weighted average common stock issued in stock
option exercises 62,773 14,191 32,978
Less: Weighted average treasury shares purchased and
weighted average shares purchased and cancelled (1,971,126) (1,279,746) (149,062)
Shares used in computing basic earnings per share 20,137,661 21,377,902 20,683,308
Dilutive effect of stock options, net of assumed
repurchase of treasury stock 1,277,493 331,931 875,612
Shares used in computing diluted earnings per share 21,415,154 21,709,833 21,558,920
213702_Finan.ind 4/15/02, 11:04 AM34
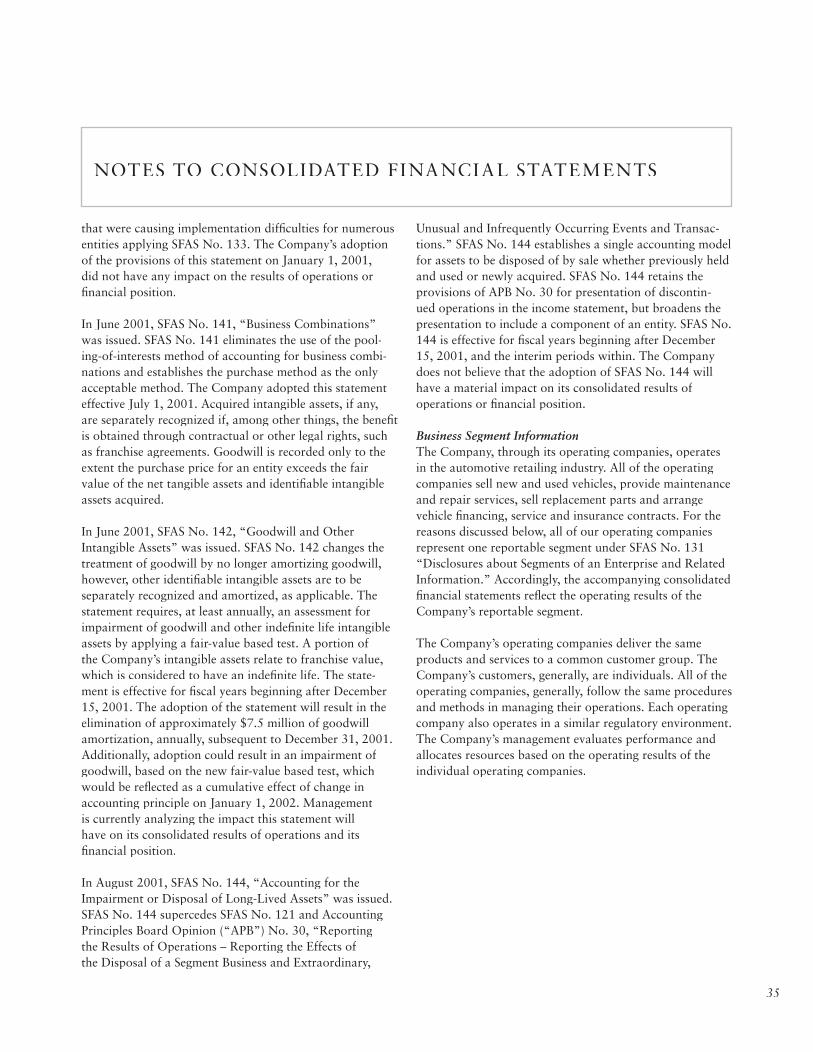
35
NOTES TO CONSOLIDATED FINANCIAL STATEMENTS
that were causing implementation diffi culties for numerous entities applying SFAS No. 133. The Company’s adoption of the provisions of this statement on January 1, 2001, did not have any impact on the results of operations or fi nancial position.
In June 2001, SFAS No. 141, “Business Combinations” was issued. SFAS No. 141 eliminates the use of the pool-ing-of-interests method of accounting for business combi-nations and establishes the purchase method as the only acceptable method. The Company adopted this statement effective July 1, 2001. Acquired intangible assets, if any, are separately recognized if, among other things, the benefi t is obtained through contractual or other legal rights, such as franchise agreements. Goodwill is recorded only to the extent the purchase price for an entity exceeds the fair value of the net tangible assets and identifi able intangible assets acquired.
In June 2001, SFAS No. 142, “Goodwill and Other Intangible Assets” was issued. SFAS No. 142 changes the treatment of goodwill by no longer amortizing goodwill, however, other identifi able intangible assets are to be separately recognized and amortized, as applicable. The statement requires, at least annually, an assessment for impairment of goodwill and other indefi nite life intangible assets by applying a fair-value based test. A portion of the Company’s intangible assets relate to franchise value, which is considered to have an indefi nite life. The state-ment is effective for fi scal years beginning after December 15, 2001. The adoption of the statement will result in the elimination of approximately $7.5 million of goodwill amortization, annually, subsequent to December 31, 2001. Additionally, adoption could result in an impairment of goodwill, based on the new fair-value based test, which would be refl ected as a cumulative effect of change in accounting principle on January 1, 2002. Management is currently analyzing the impact this statement will have on its consolidated results of operations and its fi nancial position.
In August 2001, SFAS No. 144, “Accounting for the Impairment or Disposal of Long-Lived Assets” was issued. SFAS No. 144 supercedes SFAS No. 121 and Accounting Principles Board Opinion (“APB”) No. 30, “Reporting the Results of Operations – Reporting the Effects of the Disposal of a Segment Business and Extraordinary,
Unusual and Infrequently Occurring Events and Transac-tions.” SFAS No. 144 establishes a single accounting model for assets to be disposed of by sale whether previously held and used or newly acquired. SFAS No. 144 retains the provisions of APB No. 30 for presentation of discontin-ued operations in the income statement, but broadens the presentation to include a component of an entity. SFAS No. 144 is effective for fi scal years beginning after December 15, 2001, and the interim periods within. The Company does not believe that the adoption of SFAS No. 144 will have a material impact on its consolidated results of operations or fi nancial position.
Business Segment InformationThe Company, through its operating companies, operates in the automotive retailing industry. All of the operating companies sell new and used vehicles, provide maintenance and repair services, sell replacement parts and arrange vehicle fi nancing, service and insurance contracts. For the reasons discussed below, all of our operating companies represent one reportable segment under SFAS No. 131 “Disclosures about Segments of an Enterprise and Related Information.” Accordingly, the accompanying consolidated fi nancial statements refl ect the operating results of the Company’s reportable segment.
The Company’s operating companies deliver the same products and services to a common customer group. The Company’s customers, generally, are individuals. All of the operating companies, generally, follow the same procedures and methods in managing their operations. Each operating company also operates in a similar regulatory environment. The Company’s management evaluates performance and allocates resources based on the operating results of the individual operating companies.
213702_Finan.ind 4/15/02, 11:04 AM35
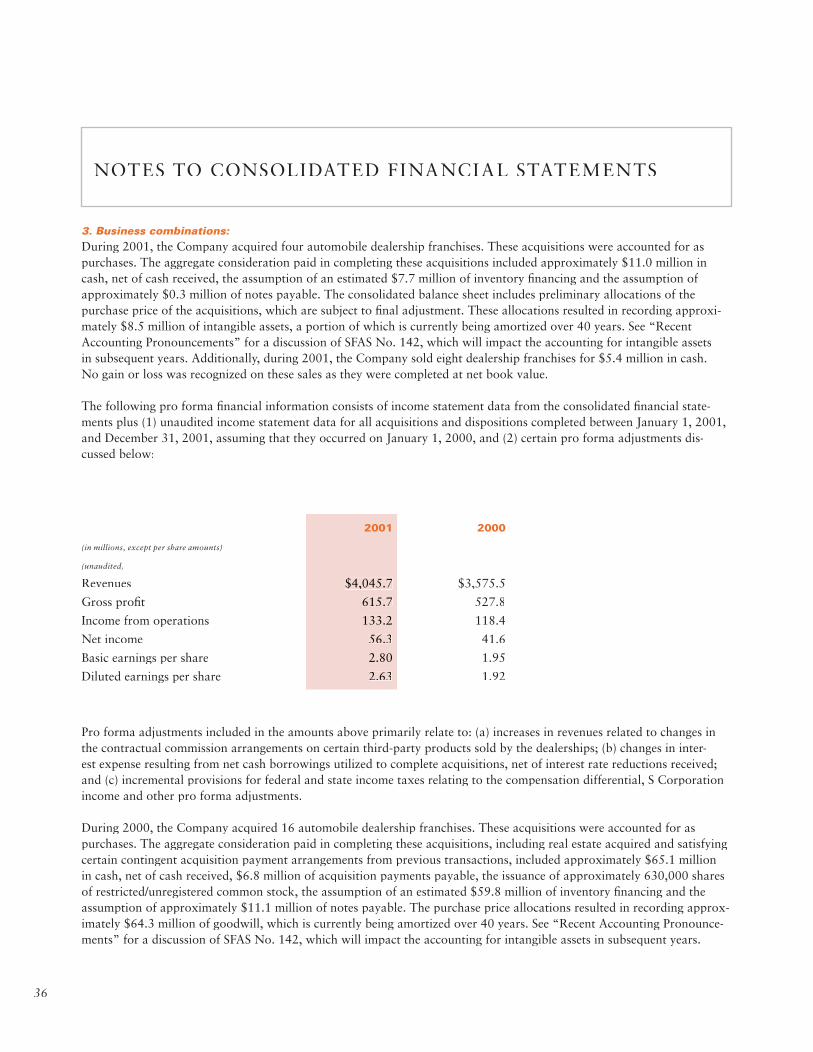
36
NOTES TO CONSOLIDATED FINANCIAL STATEMENTS
3. Business combinations:
During 2001, the Company acquired four automobile dealership franchises. These acquisitions were accounted for as purchases. The aggregate consideration paid in completing these acquisitions included approximately $11.0 million in cash, net of cash received, the assumption of an estimated $7.7 million of inventory fi nancing and the assumption of approximately $0.3 million of notes payable. The consolidated balance sheet includes preliminary allocations of the purchase price of the acquisitions, which are subject to fi nal adjustment. These allocations resulted in recording approxi-mately $8.5 million of intangible assets, a portion of which is currently being amortized over 40 years. See “Recent Accounting Pronouncements” for a discussion of SFAS No. 142, which will impact the accounting for intangible assets in subsequent years. Additionally, during 2001, the Company sold eight dealership franchises for $5.4 million in cash. No gain or loss was recognized on these sales as they were completed at net book value.
The following pro forma fi nancial information consists of income statement data from the consolidated fi nancial state-ments plus (1) unaudited income statement data for all acquisitions and dispositions completed between January 1, 2001, and December 31, 2001, assuming that they occurred on January 1, 2000, and (2) certain pro forma adjustments dis-cussed below:
Pro forma adjustments included in the amounts above primarily relate to: (a) increases in revenues related to changes in the contractual commission arrangements on certain third-party products sold by the dealerships; (b) changes in inter-est expense resulting from net cash borrowings utilized to complete acquisitions, net of interest rate reductions received; and (c) incremental provisions for federal and state income taxes relating to the compensation differential, S Corporation income and other pro forma adjustments.
During 2000, the Company acquired 16 automobile dealership franchises. These acquisitions were accounted for as purchases. The aggregate consideration paid in completing these acquisitions, including real estate acquired and satisfying certain contingent acquisition payment arrangements from previous transactions, included approximately $65.1 million in cash, net of cash received, $6.8 million of acquisition payments payable, the issuance of approximately 630,000 shares of restricted/unregistered common stock, the assumption of an estimated $59.8 million of inventory fi nancing and the assumption of approximately $11.1 million of notes payable. The purchase price allocations resulted in recording approx-imately $64.3 million of goodwill, which is currently being amortized over 40 years. See “Recent Accounting Pronounce-ments” for a discussion of SFAS No. 142, which will impact the accounting for intangible assets in subsequent years.
2001 2000
(in millions, except per share amounts)
(unaudited)
Revenues $4,045.7 $3,575.5
Gross profi t 615.7 527.8
Income from operations 133.2 118.4
Net income 56.3 41.6
Basic earnings per share 2.80 1.95
Diluted earnings per share 2.63 1.92
213702_Finan.ind 4/15/02, 11:04 AM36

37
NOTES TO CONSOLIDATED FINANCIAL STATEMENTS
During 1999, the Company acquired 32 automobile dealership franchises. These acquisitions were accounted for as purchases. The aggregate consideration paid in completing these acquisitions, including real estate acquired and satisfying certain contingent acquisition payment arrangements from previous transactions, included approximately $109.9 million in cash, net of cash received, approximately 1.5 million shares of common stock and the assumption of an estimated $101.5 million of inventory fi nancing and approximately $500,000 of notes payable. The purchase price allocations resulted in recording approximately $116.2 million of goodwill, which is currently being amortized over 40 years. See “Recent Accounting Pronouncements” for a discussion of SFAS No. 142, which will impact the accounting for intangible assets in subsequent years.
4. Detail of Certain Balance Sheet Accounts:
Accounts and notes receivable consist of the following:
December 31, 2001 2000
(in thousands)
Amounts due from manufacturers $24,015 $19,882
Parts and service receivables 10,010 9,446
Due from fi nance companies 7,615 6,196
Other 4,955 6,920
Total accounts and notes receivable 46,595 42,444
Less – Allowance for doubtful accounts (2,911) (2,735)
Accounts and notes receivable, net $43,684 $39,709
Inventories, net of valuation reserves, consist of the following:
December 31, 2001 2000
(in thousands)
New vehicles $349,962 $420,541
Used vehicles 69,351 69,656
Rental vehicles 9,559 11,513
Parts, accessories and other 26,089 25,391
Total inventories $454,961 $ 527,101
4,955
454,961
213702_Finan.ind 4/15/02, 11:04 AM37
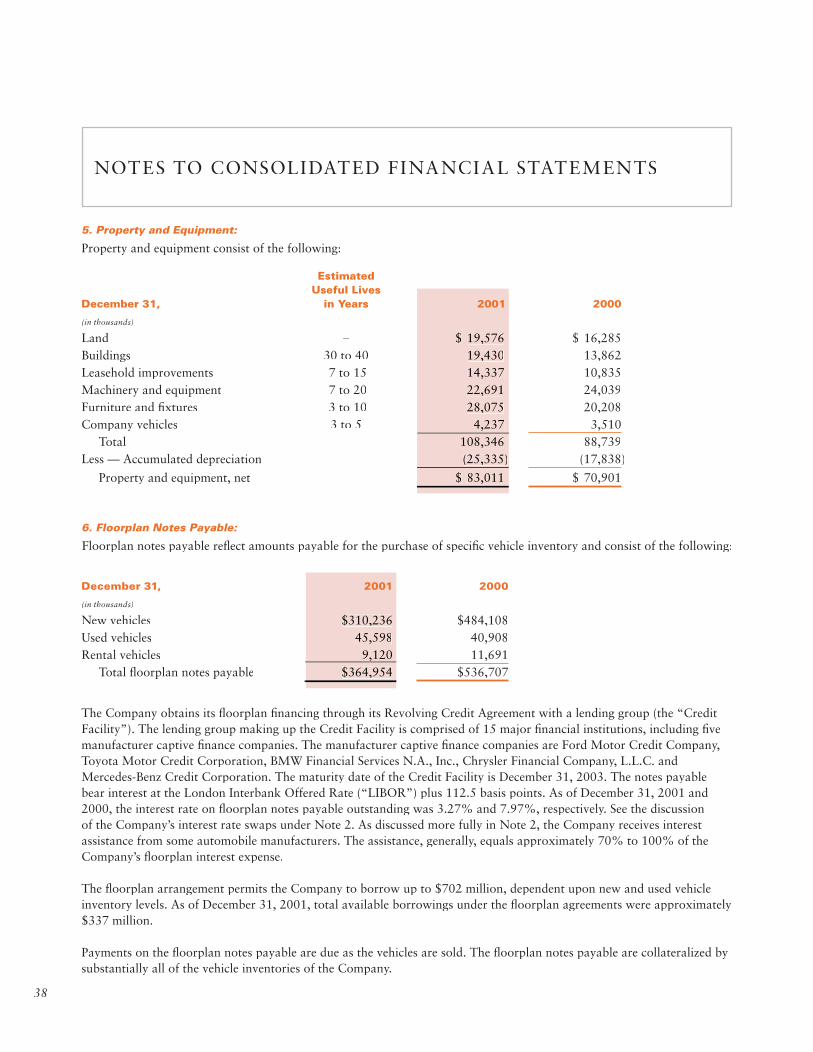
38
NOTES TO CONSOLIDATED FINANCIAL STATEMENTS
6. Floorplan Notes Payable:
Floorplan notes payable refl ect amounts payable for the purchase of specifi c vehicle inventory and consist of the following:
The Company obtains its fl oorplan fi nancing through its Revolving Credit Agreement with a lending group (the “Credit Facility”). The lending group making up the Credit Facility is comprised of 15 major fi nancial institutions, including fi ve manufacturer captive fi nance companies. The manufacturer captive fi nance companies are Ford Motor Credit Company, Toyota Motor Credit Corporation, BMW Financial Services N.A., Inc., Chrysler Financial Company, L.L.C. and Mercedes-Benz Credit Corporation. The maturity date of the Credit Facility is December 31, 2003. The notes payable bear interest at the London Interbank Offered Rate (“LIBOR”) plus 112.5 basis points. As of December 31, 2001 and 2000, the interest rate on fl oorplan notes payable outstanding was 3.27% and 7.97%, respectively. See the discussion of the Company’s interest rate swaps under Note 2. As discussed more fully in Note 2, the Company receives interest assistance from some automobile manufacturers. The assistance, generally, equals approximately 70% to 100% of the Company’s fl oorplan interest expense.
The fl oorplan arrangement permits the Company to borrow up to $702 million, dependent upon new and used vehicle inventory levels. As of December 31, 2001, total available borrowings under the fl oorplan agreements were approximately $337 million.
Payments on the fl oorplan notes payable are due as the vehicles are sold. The fl oorplan notes payable are collateralized by substantially all of the vehicle inventories of the Company.
December 31, 2001 2000
(in thousands)
New vehicles $310,236 $484,108Used vehicles 45,598 40,908Rental vehicles 9,120 11,691
Total fl oorplan notes payable $364,954 $536,707
5. Property and Equipment:
Property and equipment consist of the following:
Estimated Useful Lives December 31, in Years 2001 2000
(in thousands)
Land – $ 19,576 $ 16,285Buildings 30 to 40 19,430 13,862Leasehold improvements 7 to 15 14,337 10,835Machinery and equipment 7 to 20 22,691 24,039Furniture and fi xtures 3 to 10 28,075 20,208Company vehicles 3 to 5 4,237 3,510
Total 108,346 88,739Less — Accumulated depreciation (25,335) (17,838)
Property and equipment, net $ 83,011 $ 70,901
213702_Finan.ind 4/15/02, 11:04 AM38

39
NOTES TO CONSOLIDATED FINANCIAL STATEMENTS
7. Long-term debt:
In addition to fl oorplan notes payable, the Credit Facility provides an acquisition line of credit of up to $198 million for the fi nancing of acquisitions, general corporate purposes or capital expenditures. The amount of funds available under the acquisition line is dependent upon a calculation based on the Company’s cash fl ow and maintaining certain fi nan-cial ratios. The acquisition line of credit of the Credit Facility bears interest based on the LIBOR plus a margin varying from 175 to 325 basis points, dependent upon certain fi nancial ratios. Additionally, the loan agreement contains various covenants including fi nancial ratios, such as, fi xed-charge coverage, interest coverage and a minimum net worth require-ment, among others, and other requirements, which must be maintained by the Company. As of December 31, 2001, the Company was in compliance with these requirements. The Credit Facility allows 33% of net income to be paid as cash dividends. The interest rate on borrowings under the acquisition line of credit of the Credit Facility was 8.70% at Decem-ber 31, 2000, and would have been 3.62% based on LIBOR at December 31, 2001, but there were no amounts outstand-ing at that time. Land, buildings or other assets secure all of the notes payable.
Total interest incurred on long-term debt was approximately $5.2, $5.7 and $2.4 million for the years ended December 31, 2001, 2000 and 1999, respectively, which included approximately $897,000, $352,000, and $592,000 of capitalized interest on construction projects in 2001, 2000 and 1999, respectively.
The aggregate maturities of long-term debt as of December 31, 2001, were as follows (in thousands):
December 31, 2001 2000
(in thousands)
Credit Facility (described below) $ – $ 35,250
Real estate note payable, maturing June 2018, bearing
interest at 9.01%, with a monthly payment of $54,023 5,559 5,699
Notes payable, maturing June 2013, bearing interest at
8.89%, with a monthly payment of $36,783 3,172 3,321
Note payable, maturing in March 2006, bearing interest
at 7.50% with a monthly payment of $29,000 1,263 –
Other notes payable, maturing in varying amounts
through February 2006 with a weighted average
interest rate of 8.27% 2,190 3,185
Total long-term debt 12,184 47,455
Less – Current portion (1,687) (1,506)
Long-term portion $10,497 $ 45,949
2002 $ 1,687
2003 1,381
2004 874
2005 881
2006 555
Thereafter 6,806
Total long-term debt $12,184
213702_Finan.ind 4/15/02, 11:04 AM39
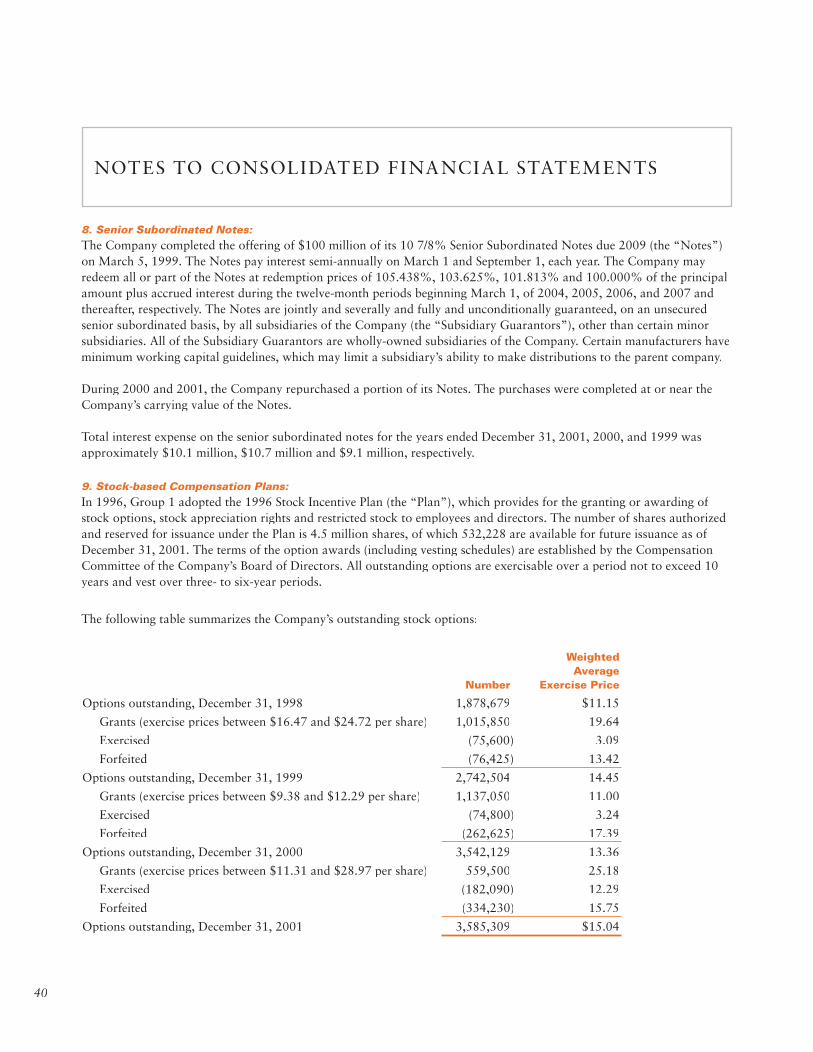
40
NOTES TO CONSOLIDATED FINANCIAL STATEMENTS
8. Senior Subordinated Notes:
The Company completed the offering of $100 million of its 10 7/8% Senior Subordinated Notes due 2009 (the “Notes”) on March 5, 1999. The Notes pay interest semi-annually on March 1 and September 1, each year. The Company may redeem all or part of the Notes at redemption prices of 105.438%, 103.625%, 101.813% and 100.000% of the principal amount plus accrued interest during the twelve-month periods beginning March 1, of 2004, 2005, 2006, and 2007 and thereafter, respectively. The Notes are jointly and severally and fully and unconditionally guaranteed, on an unsecured senior subordinated basis, by all subsidiaries of the Company (the “Subsidiary Guarantors”), other than certain minor subsidiaries. All of the Subsidiary Guarantors are wholly-owned subsidiaries of the Company. Certain manufacturers have minimum working capital guidelines, which may limit a subsidiary’s ability to make distributions to the parent company.
During 2000 and 2001, the Company repurchased a portion of its Notes. The purchases were completed at or near the Company’s carrying value of the Notes.
Total interest expense on the senior subordinated notes for the years ended December 31, 2001, 2000, and 1999 was approximately $10.1 million, $10.7 million and $9.1 million, respectively.
9. Stock-based Compensation Plans:
In 1996, Group 1 adopted the 1996 Stock Incentive Plan (the “Plan”), which provides for the granting or awarding of stock options, stock appreciation rights and restricted stock to employees and directors. The number of shares authorized and reserved for issuance under the Plan is 4.5 million shares, of which 532,228 are available for future issuance as of December 31, 2001. The terms of the option awards (including vesting schedules) are established by the Compensation Committee of the Company’s Board of Directors. All outstanding options are exercisable over a period not to exceed 10 years and vest over three- to six-year periods.
The following table summarizes the Company’s outstanding stock options:
Weighted Average Number Exercise Price
Options outstanding, December 31, 1998 1,878,679 $11.15
Grants (exercise prices between $16.47 and $24.72 per share) 1,015,850 19.64
Exercised (75,600) 3.09
Forfeited (76,425) 13.42
Options outstanding, December 31, 1999 2,742,504 14.45
Grants (exercise prices between $9.38 and $12.29 per share) 1,137,050 11.00
Exercised (74,800) 3.24
Forfeited (262,625) 17.39
Options outstanding, December 31, 2000 3,542,129 13.36
Grants (exercise prices between $11.31 and $28.97 per share) 559,500 25.18
Exercised (182,090) 12.29
Forfeited (334,230) 15.75
Options outstanding, December 31, 2001 3,585,309 $15.04
213702_Finan.ind 4/15/02, 11:04 AM40
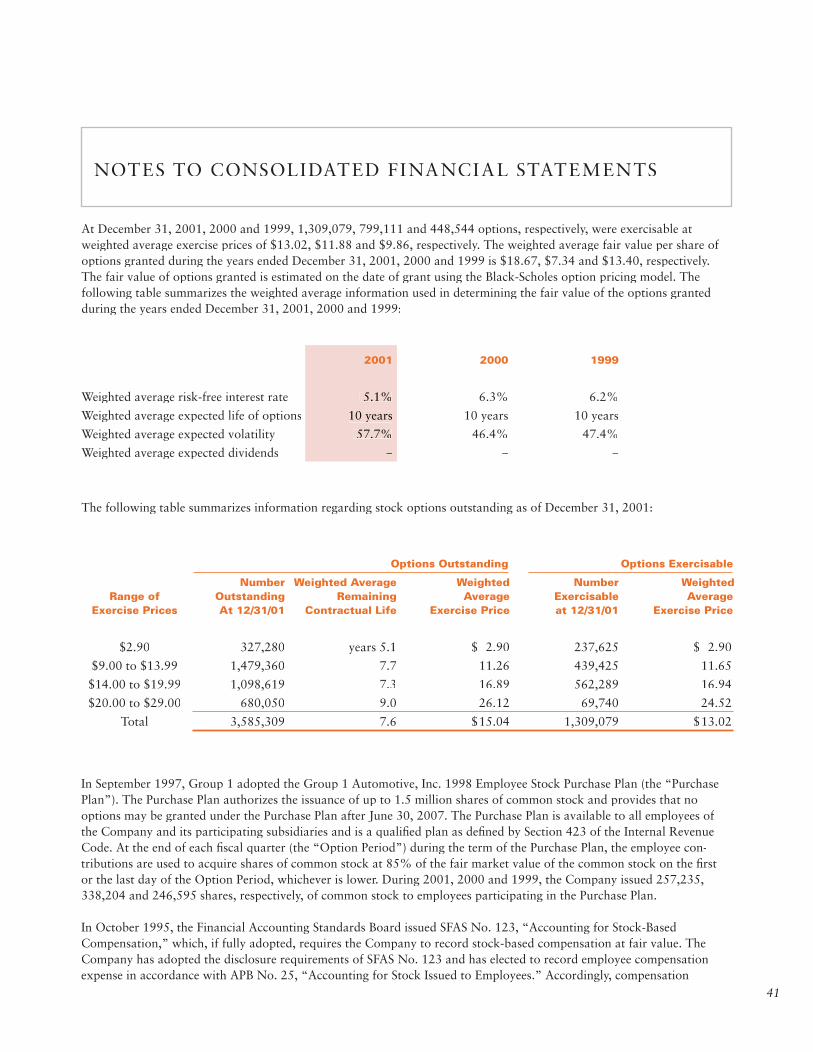
41
In September 1997, Group 1 adopted the Group 1 Automotive, Inc. 1998 Employee Stock Purchase Plan (the “Purchase Plan”). The Purchase Plan authorizes the issuance of up to 1.5 million shares of common stock and provides that no options may be granted under the Purchase Plan after June 30, 2007. The Purchase Plan is available to all employees of the Company and its participating subsidiaries and is a qualifi ed plan as defi ned by Section 423 of the Internal Revenue Code. At the end of each fi scal quarter (the “Option Period”) during the term of the Purchase Plan, the employee con-tributions are used to acquire shares of common stock at 85% of the fair market value of the common stock on the fi rst or the last day of the Option Period, whichever is lower. During 2001, 2000 and 1999, the Company issued 257,235, 338,204 and 246,595 shares, respectively, of common stock to employees participating in the Purchase Plan.
In October 1995, the Financial Accounting Standards Board issued SFAS No. 123, “Accounting for Stock-Based Compensation,” which, if fully adopted, requires the Company to record stock-based compensation at fair value. The Company has adopted the disclosure requirements of SFAS No. 123 and has elected to record employee compensation expense in accordance with APB No. 25, “Accounting for Stock Issued to Employees.” Accordingly, compensation
NOTES TO CONSOLIDATED FINANCIAL STATEMENTS
At December 31, 2001, 2000 and 1999, 1,309,079, 799,111 and 448,544 options, respectively, were exercisable at weighted average exercise prices of $13.02, $11.88 and $9.86, respectively. The weighted average fair value per share of options granted during the years ended December 31, 2001, 2000 and 1999 is $18.67, $7.34 and $13.40, respectively. The fair value of options granted is estimated on the date of grant using the Black-Scholes option pricing model. The following table summarizes the weighted average information used in determining the fair value of the options granted during the years ended December 31, 2001, 2000 and 1999:
2001 2000 1999
Weighted average risk-free interest rate 5.1% 6.3% 6.2%
Weighted average expected life of options 10 years 10 years 10 years
Weighted average expected volatility 57.7% 46.4% 47.4%
Weighted average expected dividends – – –
Options Outstanding Options Exercisable
Number Weighted Average Weighted Number Weighted Range of Outstanding Remaining Average Exercisable Average Exercise Prices At 12/31/01 Contractual Life Exercise Price at 12/31/01 Exercise Price
$2.90 327,280 years 5.1 $ 2.90 237,625 $ 2.90
$9.00 to $13.99 1,479,360 7.7 11.26 439,425 11.65
$14.00 to $19.99 1,098,619 7.3 16.89 562,289 16.94
$20.00 to $29.00 680,050 9.0 26.12 69,740 24.52
Total 3,585,309 7.6 $15.04 1,309,079 $13.02
The following table summarizes information regarding stock options outstanding as of December 31, 2001:
213702_Finan.ind 4/15/02, 11:04 AM41
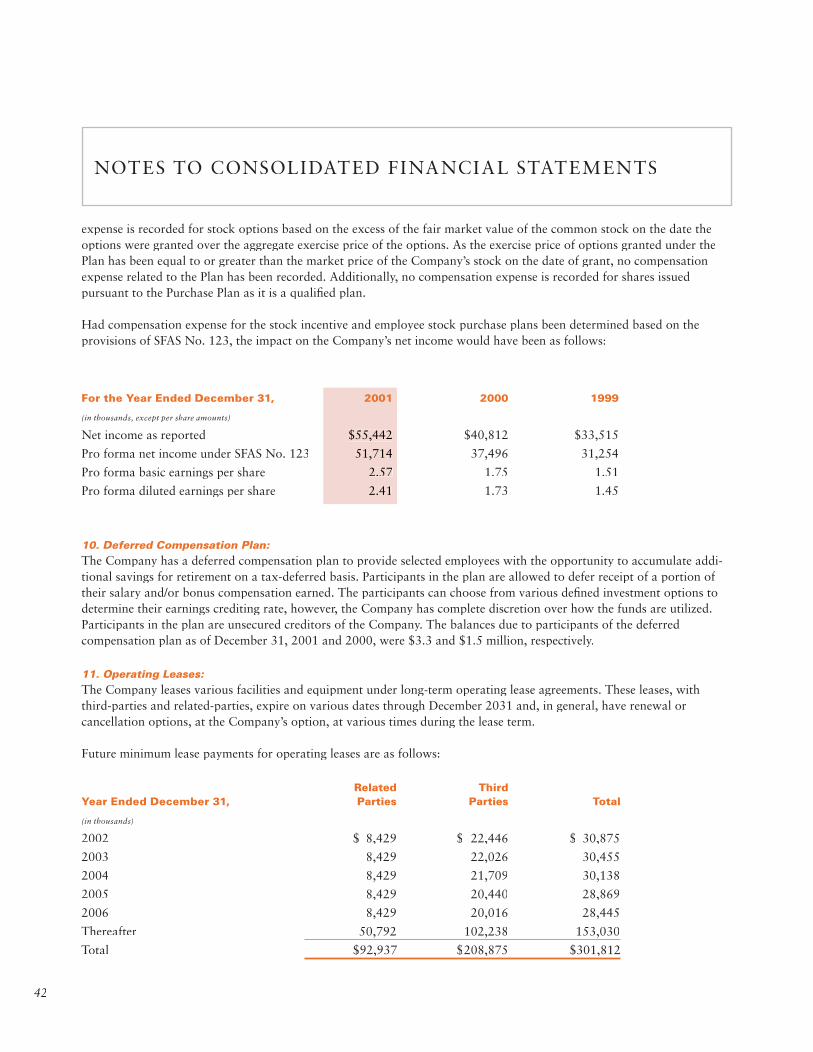
42
NOTES TO CONSOLIDATED FINANCIAL STATEMENTS
For the Year Ended December 31, 2001 2000 1999
(in thousands, except per share amounts)
Net income as reported $55,442 $40,812 $33,515
Pro forma net income under SFAS No. 123 51,714 37,496 31,254
Pro forma basic earnings per share 2.57 1.75 1.51
Pro forma diluted earnings per share 2.41 1.73 1.45
expense is recorded for stock options based on the excess of the fair market value of the common stock on the date the options were granted over the aggregate exercise price of the options. As the exercise price of options granted under the Plan has been equal to or greater than the market price of the Company’s stock on the date of grant, no compensation expense related to the Plan has been recorded. Additionally, no compensation expense is recorded for shares issued pursuant to the Purchase Plan as it is a qualifi ed plan.
Had compensation expense for the stock incentive and employee stock purchase plans been determined based on the provisions of SFAS No. 123, the impact on the Company’s net income would have been as follows:
10. Deferred Compensation Plan:
The Company has a deferred compensation plan to provide selected employees with the opportunity to accumulate addi-tional savings for retirement on a tax-deferred basis. Participants in the plan are allowed to defer receipt of a portion of their salary and/or bonus compensation earned. The participants can choose from various defi ned investment options to determine their earnings crediting rate, however, the Company has complete discretion over how the funds are utilized. Participants in the plan are unsecured creditors of the Company. The balances due to participants of the deferred compensation plan as of December 31, 2001 and 2000, were $3.3 and $1.5 million, respectively.
11. Operating Leases:
The Company leases various facilities and equipment under long-term operating lease agreements. These leases, with third-parties and related-parties, expire on various dates through December 2031 and, in general, have renewal or cancellation options, at the Company’s option, at various times during the lease term.
Future minimum lease payments for operating leases are as follows:
Related Third Year Ended December 31, Parties Parties Total
(in thousands)
2002 $ 8,429 $ 22,446 $ 30,875
2003 8,429 22,026 30,455
2004 8,429 21,709 30,138
2005 8,429 20,440 28,869
2006 8,429 20,016 28,445
Thereafter 50,792 102,238 153,030
Total $92,937 $208,875 $301,812
213702_Finan.ind 4/15/02, 11:04 AM42
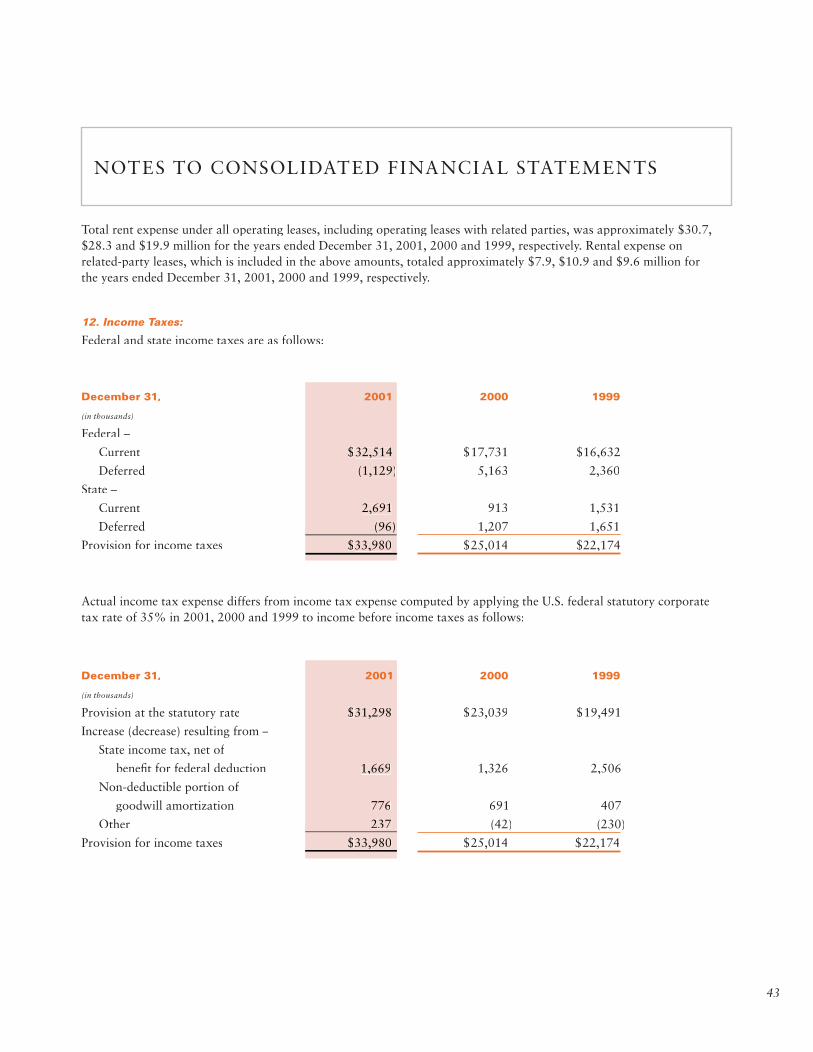
43
NOTES TO CONSOLIDATED FINANCIAL STATEMENTS
December 31, 2001 2000 1999
(in thousands)
Federal –
Current $32,514 $17,731 $16,632
Deferred (1,129) 5,163 2,360
State –
Current 2,691 913 1,531
Deferred (96) 1,207 1,651
Provision for income taxes $33,980 $25,014 $22,174
12. Income Taxes:
Federal and state income taxes are as follows:
Actual income tax expense differs from income tax expense computed by applying the U.S. federal statutory corporate tax rate of 35% in 2001, 2000 and 1999 to income before income taxes as follows:
December 31, 2001 2000 1999
(in thousands)
Provision at the statutory rate $31,298 $23,039 $19,491
Increase (decrease) resulting from –
State income tax, net of
benefi t for federal deduction 1,669 1,326 2,506
Non-deductible portion of
goodwill amortization 776 691 407
Other 237 (42) (230)
Provision for income taxes $33,980 $25,014 $22,174
Total rent expense under all operating leases, including operating leases with related parties, was approximately $30.7, $28.3 and $19.9 million for the years ended December 31, 2001, 2000 and 1999, respectively. Rental expense on related-party leases, which is included in the above amounts, totaled approximately $7.9, $10.9 and $9.6 million for the years ended December 31, 2001, 2000 and 1999, respectively.
213702_Finan.ind 4/15/02, 11:04 AM43
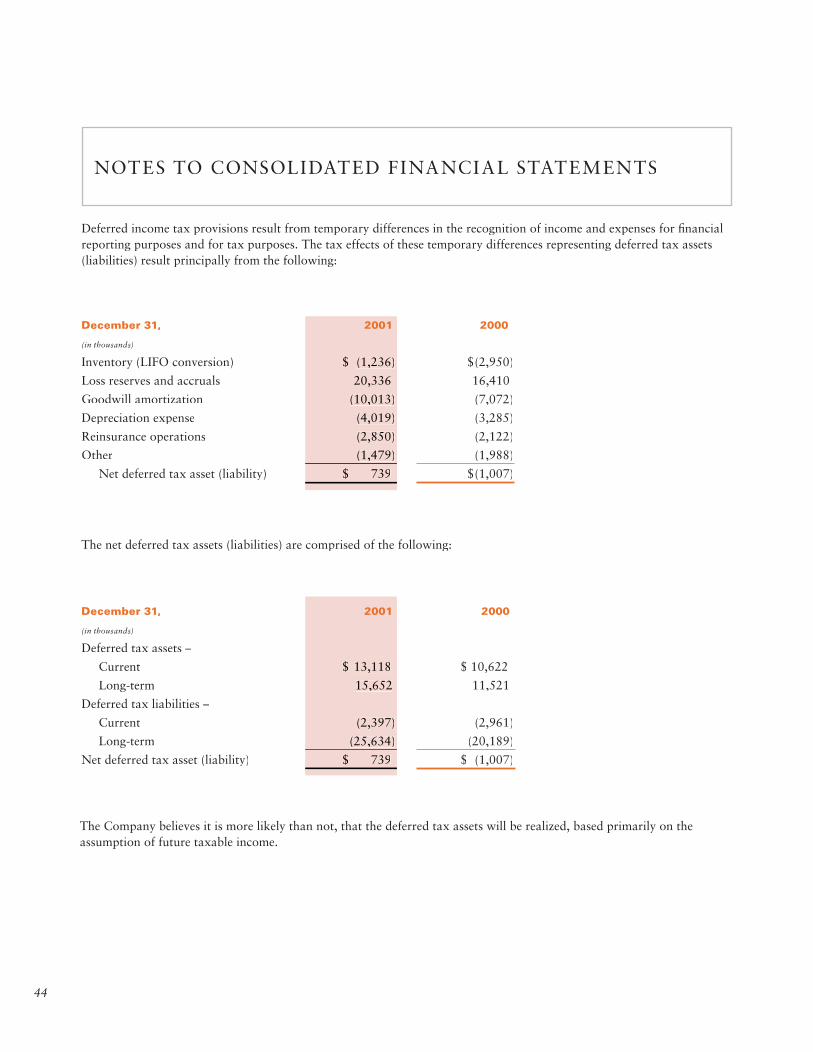
44
NOTES TO CONSOLIDATED FINANCIAL STATEMENTS
Deferred income tax provisions result from temporary differences in the recognition of income and expenses for fi nancial reporting purposes and for tax purposes. The tax effects of these temporary differences representing deferred tax assets (liabilities) result principally from the following:
December 31, 2001 2000
(in thousands)
Inventory (LIFO conversion) $ (1,236) $(2,950)
Loss reserves and accruals 20,336 16,410
Goodwill amortization (10,013) (7,072)
Depreciation expense (4,019) (3,285)
Reinsurance operations (2,850) (2,122)
Other (1,479) (1,988)
Net deferred tax asset (liability) $ 739 $(1,007)
The net deferred tax assets (liabilities) are comprised of the following:
December 31, 2001 2000
(in thousands)
Deferred tax assets –
Current $ 13,118 $ 10,622
Long-term 15,652 11,521
Deferred tax liabilities –
Current (2,397) (2,961)
Long-term (25,634) (20,189)
Net deferred tax asset (liability) $ 739 $ (1,007)
The Company believes it is more likely than not, that the deferred tax assets will be realized, based primarily on the assumption of future taxable income.
213702_Finan.ind 4/15/02, 11:04 AM44
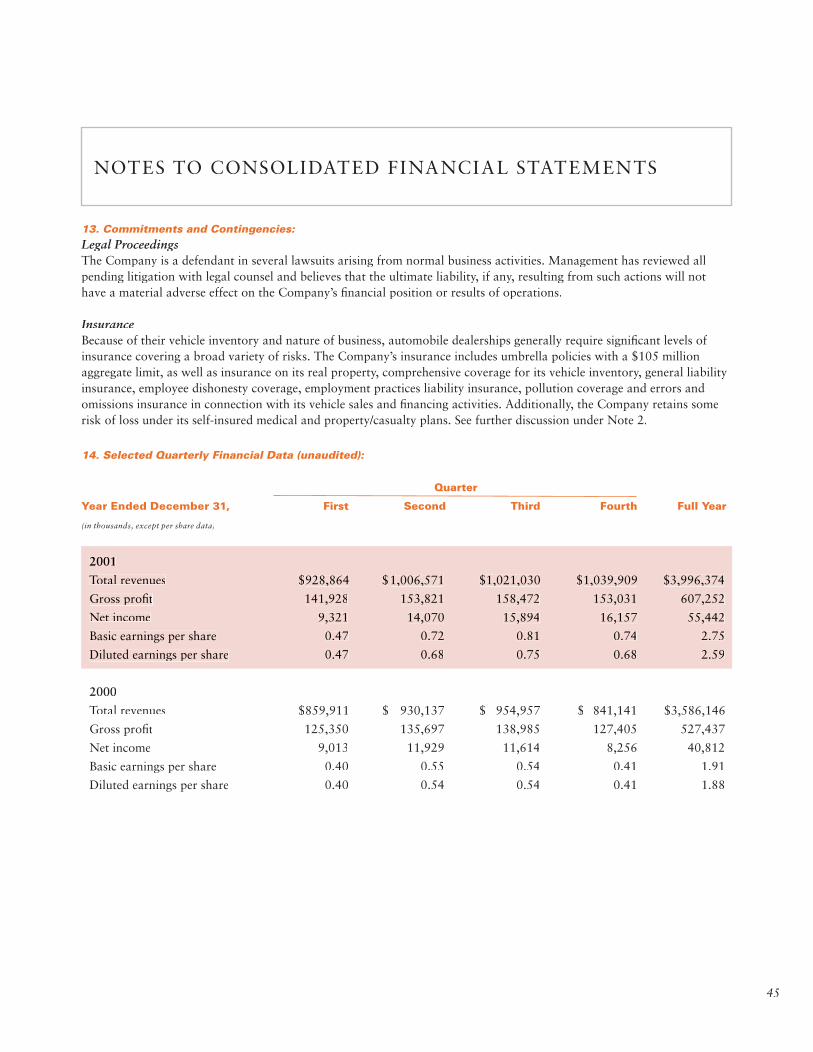
45
NOTES TO CONSOLIDATED FINANCIAL STATEMENTS
13. Commitments and Contingencies:
Legal ProceedingsThe Company is a defendant in several lawsuits arising from normal business activities. Management has reviewed all pending litigation with legal counsel and believes that the ultimate liability, if any, resulting from such actions will not have a material adverse effect on the Company’s fi nancial position or results of operations.
InsuranceBecause of their vehicle inventory and nature of business, automobile dealerships generally require signifi cant levels of insurance covering a broad variety of risks. The Company’s insurance includes umbrella policies with a $105 million aggregate limit, as well as insurance on its real property, comprehensive coverage for its vehicle inventory, general liability insurance, employee dishonesty coverage, employment practices liability insurance, pollution coverage and errors and omissions insurance in connection with its vehicle sales and fi nancing activities. Additionally, the Company retains some risk of loss under its self-insured medical and property/casualty plans. See further discussion under Note 2.
14. Selected Quarterly Financial Data (unaudited):
Quarter
Year Ended December 31, First Second Third Fourth Full Year
(in thousands, except per share data)
2001
Total revenues $928,864 $1,006,571 $1,021,030 $1,039,909 $3,996,374
Gross profi t 141,928 153,821 158,472 153,031 607,252
Net income 9,321 14,070 15,894 16,157 55,442
Basic earnings per share 0.47 0.72 0.81 0.74 2.75
Diluted earnings per share 0.47 0.68 0.75 0.68 2.59
2000
Total revenues $859,911 $ 930,137 $ 954,957 $ 841,141 $3,586,146
Gross profi t 125,350 135,697 138,985 127,405 527,437
Net income 9,013 11,929 11,614 8,256 40,812
Basic earnings per share 0.40 0.55 0.54 0.41 1.91
Diluted earnings per share 0.40 0.54 0.54 0.41 1.88
213702_Finan.ind 4/15/02, 11:04 AM45

46
To Group 1 Automotive, Inc. and Subsidiaries:
We have audited the accompanying consolidated balance sheets of Group 1 Automotive, Inc. (a Delaware corporation) and Subsidiaries (the “Company”) as of December 31, 2001 and 2000 and the related consolidated statements of operations, stockholders’ equity and cash fl ows for each of the three years in the period ended December 31, 2001. These fi nancial statements are the responsibility of the Company’s management. Our responsibility is to express an opinion on these fi nancial statements based on our audits.
We conducted our audits in accordance with auditing standards generally accepted in the United States. Those standards require that we plan and perform the audit to obtain reasonable assurance about whether the fi nancial statements are free of material misstatement. An audit includes examining, on a test basis, evidence supporting the amounts and disclosures in the fi nancial statements. An audit also includes assessing the accounting principles used and signifi cant estimates made by management, as well as evaluating the overall fi nancial statement presentation. We believe that our audits provide a reasonable basis for our opinion.
In our opinion, the consolidated fi nancial statements referred to above present fairly, in all material respects, the fi nancial position of the Company as of December 31, 2001 and 2000, and the results of its operations and its cash fl ows for each of the three years in the period ended December 31, 2001, in conformity with accounting principles generally accepted in the United States.
Arthur Andersen LLPHouston, Texas
February 14, 2002
REPORT OF INDEPENDENT PUBLIC ACCOUNTANTS
213702_Finan.ind 4/15/02, 11:04 AM46

47
213702_Finan.ind 4/15/02, 11:04 AM47

48
213702_Finan.ind 4/15/02, 11:04 AM48
1 Member Audit Committee
2 Member Compensation Committee
*Committee Chairman
Offi cers not shown:
H. Clifford Buster III Vice President, Corporate Development
Randy L. Callison Vice President, Corporate Development
J. Brooks O’Hara Vice President, Human Resources
Michael J. Poppe Vice President and Corporate Controller
Scott J. Ross Vice President, Fixed Operations
John L. Adams 1*,2 Executive Vice 1*,2 Executive Vice 1*,2
President, Trinity Industries, Inc.Bennett E. Bidwell 1,2 Retired Chairman, 1,2 Retired Chairman, 1,2
Chrysler Motors CorporationJohn H. Duncan 1,2* Private Investor1,2* Private Investor1,2* B.B. Hollingsworth, Jr. Chairman, B.B. Hollingsworth, Jr. Chairman, B.B. Hollingsworth, Jr
President and Chief Executive Offi cer
Robert E. Howard II President, Bob Howard Auto Group
Max P. Watson, Jr. 2 Former President and Chief Executive Offi cer, BMC Software, Inc.
Kevin H. Whalen President, Sterling McCall Automotive Group
John S. Bishop Senior Vice President, Operations
Scott L. Thompson Executive Vice President, Chief Financial Offi cer and Treasurer
John T. Turner Executive Vice President
DIRECTORS AND OFF1CERS
213702_G1AnnART.ind 4/16/02, 8:49 AM13

Corporate Headquarters
Group 1 Automotive, Inc.
950 Echo Lane, Suite 100
Houston, Texas 77024
713.647.5700
www.group1auto.com
Annual Meeting
Wednesday, May 22, 2002
10:00 AM CDT
JPMorganChase
707 Travis Street
Mezzanine Board Room
Houston, Texas
Common Stock Listing
Ticker Symbol: GPI
New York Stock Exchange
Stock Transfer Agent
and Registrar
Mellon Investor Services LLC
Plaza of the Americas
600 North Pearl Street
Suite 1010
Dallas, Texas 75201-2884
214.922.4400
Common Stock Quarterly Data
Year Ended December 31,
2001 2000
High Low High Low
First Quarter $13.0000 $ 8.1250 $14.6250 $ 9.5000
Second Quarter 29.9800 12.0000 16.8750 10.5000
Third Quarter 34.9500 20.0000 12.1250 9.5625
Fourth Quarter 34.9900 25.0000 10.7500 8.0625
There were 138 holders of record of our Common Stock as of February 28, 2002.
213702_G1AnnART.ind 4/15/02, 8:08 AM2