Embed Size (px)
Citation preview

Levels & Trends in
Child Mortality
Report 2014Estimates Developed by the UN Inter-agency Group for Child Mortality Estimation
United Nations
This report was prepared at UNICEF Headquarters by Danzhen You, Lucia Hug and Yao Chen with the support of Tessa Wardlaw and Holly Newby on behalf of the United Nations Inter-agency Group for Child Mortality Estimation (UN IGME)
Organizations and individuals involved in generating country-specific estimates of child mortality
United Nations Children’s FundDanzhen You, Lucia Hug, Yao Chen, Holly Newby, Tessa Wardlaw
World Health OrganizationColin Mathers, Ties Boerma, Daniel Hogan, Jessica Ho
The World BankEmi Suzuki
United Nations, Department of Economic and Social Affairs, Population DivisionFrancois Pelletier, Kirill Andreev, Patrick Gerland, Danan Gu, Nan Li, Cheryl Sawyer
United Nations Economic Commission for Latin America and the Caribbean, Population DivisionGuiomar Bay, Tim Miller, Dirk Jaspers Faijer
Special thanks to the Technical Advisory Group of the UN IGME for providing technical guidance on methods for child mortality estimation
Kenneth Hill (Chair), Harvard University Leontine Alkema, National University of SingaporeSimon Cousens, London School of Hygiene and Tropical MedicineTrevor Croft, Measure DHS, ICF Macro
Special thanks to the Joint United Nations Programme on HIV/AIDS for sharing estimates of AIDS mortality. Further thanks go to Jin Rou New and Fengqing Chao from the National University of Singapore for their assistance in preparing the UN IGME estimates as well as Jing Liu from Fafo for preparing the underlying data. And special thanks to Khin Wityee Oo from UNICEF for proofreading. Thanks also go to Agbessi Amouzou, David Anthony, Robert Bain, Ivana Bjelic, Liliana Carvajal, Yadigar Coskun, Archana Dwivedi, Attila Hancioglu, Priscilla Idele, Claes Johansson, Rolf Luyendijk, Colleen Murray, Turgay Unalan, Daniel Vadnais and Upasana Young from UNICEF for their support.
Communications Development Incorporated edited the report.Era Porth, Graphic Design Consultant at UNICEF, laid out the report.
Copyright © 2014by the United Nations Children’s Fund
The Inter-agency Group for Child Mortality Estimation (UN IGME) constitutes representatives of the United Nations Children’s Fund, the World Health Organization, the World Bank and the United Nations Population Division. The child mor-tality estimates presented in this report have been reviewed by UN IGME members. As new information becomes available, esti-mates will be updated by the UN IGME. Differences between the estimates presented in this report and those in forthcoming publications by UN IGME members may arise because of differences in reporting periods or in the availability of data during the production process of each publication and other evidence.
The designations employed and the presentation of the material in this publication do not imply the expression of any opinion whatsoever on the part of UNICEF, the World Health Organization, the World Bank or the United Nations Population Division concerning the legal status of any country, territory, city or area or of its authorities, or concerning the delimitation of its fron-tiers or boundaries. Dotted lines on maps represent approximate border lines for which there may not yet be full agreement.
United Nations Children’s Fund3 UN Plaza, New York, New York, 10017 USA
The World Bank1818 H Street, NW, Washington, DC, 20433 USA
World Health OrganizationAvenue Appia 20, 1211 Geneva 27, Switzerland
United Nations Population Division2 UN Plaza, New York, New York, 10017 USA
Michel Guillot, University of PennsylvaniaJon Pedersen, FafoNeff Walker, Johns Hopkins University

PROGRESS TOWARDS MillEnniuM DEvElOPMEnT GOAl 4: KEY FACTS AnD FiGuRES
• Substantialglobalprogresshasbeenmadein
reducingchilddeathssince1990.Thenumberof
under-fivedeathsworldwidehasdeclinedfrom
12.7(12.5,12.9)1millionin1990to6.3(6.1,6.7)
millionin2013.Whilethattranslatesintoaround
17,000fewerchildrendyingeverydayin2013
thanin1990,itstillimpliesthedeathsofabout
17,000childrenunderagefiveeverydayin2013.
• Since1990theglobalunder-fivemortality
ratehasdropped49percent—from90(89,
92)deathsper1,000livebirthsin1990
to46(44,48)in2013.Allregionsexcept
Sub-SaharanAfricaandOceaniahave
reducedtherateby52percentormore.
• Theglobalunder-fivemortalityrateisfalling
fasterthanatanyothertimeduringthe
pasttwodecades.Theglobalannualrate
ofreductionhassteadilyacceleratedsince
1990–1995—morethantriplingfrom1.2
percentto4.0percentin2005–2013.
• Despitethesegains,progressremains
insufficienttoreachMDG4,particularly
inOceania,Sub-SaharanAfrica,Caucasus
andCentralAsia,andSouthernAsia.
• Acceleratingprogressinchildsurvival
urgentlyrequiresgreaterattentiontoending
preventablechilddeathsinSub-Saharan
AfricaandSouthernAsia.Under-fivedeaths
areincreasinglyconcentratedinSub-Saharan
AfricaandSouthernAsia,whiletheshare
intherestoftheworlddroppedfrom32
percentin1990to18percentin2013.
• ThoughSub-SaharanAfricahasseenthe
declineintheunder-fivemortalityrateaccelerate,
withtheaverageannualrateofreduction
increasingfrom0.8percentin1990–1995to4.2
percentin2005–2013,theregionstillhas
thehighestchildmortalityrate—92deaths
per1,000livebirths,morethan15timesthe
averagefordevelopedregions.By2050close
to40percentofallbirthswilltakeplacein
Sub-SaharanAfrica,and37percentof
childrenunderagefivewilllivethere,
sothenumberofunder-fivedeaths
couldstagnateorevenincreasewithout
moreprogressintheregion.
• Abouthalfofunder-fivedeathsoccurin
onlyfivecountries:India,Nigeria,Pakistan,
DemocraticRepublicoftheCongoand
China.India(21percent)andNigeria
(13percent)togetheraccountformore
thanathirdofallunder-fivedeaths.
• Theglobalneonatalmortalityratedeclined
40percentfrom33deathsper1,000live
birthsin1990to20in2013.Despitefalling
ratesandlevelsofneonatalmortality,the
proportionofunder-fivedeathsthatoccur
withinthefirstmonthoflife(theneonatal
period)hasincreasedfrom37percentin1990
to44percentin2013,becausedeclinesin
theneonatalmortalityrateareslowerthan
thoseinthemortalityrateforolderchildren.
• Aroundtwo-thirdsofneonataldeathsoccurin
just10countries,withIndiaaccountingformore
thanaquarterandNigeriaforaboutatenth.
• Theleadingcausesofdeathamongchildren
underagefiveincludepretermbirth
complications(17percentofunder-fivedeaths),
pneumonia(15percent),intrapartum-related
complications(complicationsduringlabourand
delivery;11percent),diarrhoea(9percent)and
malaria(7percent).Globally,nearlyhalfofunder-
fivedeathsareattributabletoundernutrition.
1

Introduction
The under-five mortality rate is a key indicator of child well-being, including health and nutrition status. It is also a key indicator of the coverage of child survival interventions and, more broadly, of social and economic development. Millennium Development Goal 4 (MDG 4) calls for reduc-ing the under-five mortality rate by two-thirds between 1990 and 2015. The world has made sub-stantial progress, reducing the rate 49 percent, from 90 (89, 92) deaths per 1,000 live births in 1990 to 46 (44, 48) in 2013. Since 1990 almost 100 million children under age five—roughly the cur-rent population of the Philippines—have been saved. The world is also reducing under-five mor-tality faster than at any other time during the past two decades. The global annual rate of reduction has steadily accelerated since 1990–1995—more than tripling from 1.2 percent to 4.0 percent in 2005–2013.
Despite these gains, child survival remains an urgent concern. The toll of under-five deaths over the past two decades is staggering: between 1990 and 2013, 223 million children worldwide died before their fifth birthday—more than today’s population of Brazil, the world’s fifth most pop-ulous country. Progress has been insufficient, and the MDG 4 target risks being missed at the global level. To achieve MDG 4 on time, the global annual rate of reduction in under-five mortality would need to rise to 20.8 percent for 2013–2015, much higher than the 4.0 percent achieved over 2005–2013. At the country level, historical trends show that progress for most countries has been too slow and that only 12 of the 60 countries with high under-five mortality rates (at least 40 deaths per 1,000 live births) are on track to achieve MDG 4 if current trends continue.
It is unacceptable that every day 17,000 children still die before their fifth birthday, mostly from preventable causes and treatable diseases, even though the knowledge and technologies for life-saving interventions are available. In addition,
inequities in child mortality between low- and high-income countries remain large. In 2013 the under-five mortality rate in low-income countries was 76 deaths per 1,000 live births—more than 12 times the average rate in high-income countries (6). Many countries still have very high rates—par-ticularly in Sub-Saharan Africa, home to all 12 countries with an under-five mortality rate of 100 deaths or more per 1,000 live births. Reducing these inequities across countries and saving more children’s lives by ending preventable child deaths are important priorities.
With the share of under-five deaths during the neonatal period rising in every region and almost all countries, accelerated change for child sur-vival needs more focus on a healthy start to life. In 2013, 2.8 million newborns died within 28 days of birth, accounting for 44 percent of global under-five deaths. Neonatal health will need to be addressed more effectively to continue the rapid progress on overall child mortality.
In recent years, the Every Woman Every Child strategy launched by United Nations Secretary-General Ban Ki-moon has boosted global momen-tum in improving newborn and child survival. The United Nations Children’s Fund (UNICEF), the World Health Organization (WHO) and other UN organizations are joining public, private and civil society partners in a global movement to accelerate reduction in preventable maternal, newborn and child deaths. Under the banner of A Promise Renewed, the partners have pledged to redouble efforts to end preventable maternal, new-born and child deaths. In this context, monitor-ing progress at the global and country levels has become even more critical. The United Nations Inter-agency Group for Child Mortality Estima-tion (UN IGME) updates child mortality estimates annually, and this report presents the group’s lat-est estimates of under-five, infant and neonatal mortality and assesses progress towards MDG 4 at the country, regional and global levels.
2


The UN Inter-agency Group for Child Mortality EstimationThe UN IGME was established in 2004 to har-monize child mortality estimates within the UN system for reporting on progress towards the MDGs, to improve methods for child mortal-ity estimation and to enhance country capacity to produce timely and properly assessed esti-mates of child mortality. The UN IGME is led by UNICEF and includes the WHO, the World Bank and the Population Division of the United Nations Department of Economic and Social Affairs as full members.
The UN IGME’s Technical Advisory Group, com-prising leading academic scholars and indepen-dent experts in demography and biostatistics, provides guidance on estimation methods, tech-nical issues and strategies for data analysis and data quality assessment.
The UN IGME updates its child mortality esti-mates annually after reviewing newly available data and assessing data quality. These estimates are widely used in UNICEF’s flagship publica-tions, the UN Secretary-General’s MDG report, and publications by other UN agencies, govern-ments and donors.
Broad strategy of the UN IGMETo minimize the errors for each estimate, harmo-nize trends over time and produce up-to-date and properly assessed estimates of child mortality, the UN IGME follows a three-part broad strategy:
First, the UN IGME compiles all available nation-ally representative data relevant to estimating child mortality, including data from vital registra-tion systems, population censuses, household sur-veys and sample registration systems.
Second, the UN IGME assesses data quality, recal-culates data inputs and makes needed adjustments by applying standard methods.
Third, the UN IGME fits a statistical model to the data to generate a smooth trend curve that aver-ages over possibly disparate estimates from the dif-ferent data sources for a country, and extrapolates the model to a target year.
To increase the transparency of the estimation pro-cess, the UN IGME has developed a child mortality database, CME Info (www.childmortality.org). It provides estimates as well as all available data and data sources for every country. Once new esti-mates are finalized, CME Info is updated to reflect any changes.
Estimating Child Mortality
The un iGME Child Mortality Estimation Database: CME info
TheUNIGMEpublishesitsestimatesandtheunder-lyingdataforallcountriesinitschildmortalitydata-base,CMEInfo(www.childmortality.org).CMEInfoisacomprehensivedataportalonchildmortal-itywidelyusedbygovernments,UNagencies,donorsandthegeneralpublic.ItwaslaunchedbyUNICEFasaninitiativeoftheUNIGMEtosourceandshareun-derlyingdataandtopublishthelatestestimateson
childmortality.CMEInfoservesasaplatformforUNICEFandtheUNIGMEtocollaboratewithnationalpartnersinharmonizinganddisseminatingchildmor-talityestimates.Itusesleading-edgeinformationtech-nologytovisualizeinatransparentwayhownationaldatacanbeusedtogeneratechildmortalitytrendes-timates.UNICEFhosts,maintainsandfinanciallysup-portsCMEInfo.
4

Data sourcesIf each country had a single source of high-qual-ity data covering the last few decades, report-ing on child mortality levels and trends would be straightforward. But few countries do, and the limited availability of high-quality data over time for many countries makes generating accu-rate estimates of child mortality a considerable challenge.
Nationally representative estimates of child mortality can be derived from several sources, including civil registration, censuses and sample surveys. Demographic surveillance sites and hos-pital data are excluded because they are rarely representative. The preferred source of data is a civil registration system that records births and deaths on a continuous basis, collects informa-tion as events occur and covers the entire popula-tion. If registration coverage is complete and the systems function efficiently, the resulting child mortality estimates will be accurate and timely. However, many countries remain without viable or fully functioning vital registration systems that accurately record all births and deaths—only around 60 countries have such systems. There-fore, household surveys, such as the UNICEF-supported Multiple Indicator Cluster Surveys and the US Agency for International Development–supported Demographic and Health Surveys, which ask women about the survival of their chil-dren, are the basis of child mortality estimates for most developing countries.
The majority of household survey data comes in one of two forms: the full birth history, which asks women for the date of birth of each of their children and for the age at death of children who have died, and the summary birth history, which asks women only about the number of children they have given birth to and the number that have died (or equivalently the number still alive).
Full birth history data, collected by all Demo-graphic and Health Surveys and increasingly also Multiple Indicator Cluster Surveys, allow the cal-culation of child mortality indicators for specific time periods in the past. This allows for trend estimates of child mortality rates over a period of 15–25 years before the survey. Whenever sur-vey microdata are available, the UN IGME recal-culates estimates using single calendar years for periods shortly before the survey and gradually
increasing the number of years for periods fur-ther in the past. Period ranges for a given survey are based on the estimates’ coefficients of varia-tion (a measure of sampling uncertainty).2
In general, summary birth history data, collected by censuses and many household surveys, use the age of the woman as an indicator of the average exposure time of the children to the risk of dying and use models to estimate mortality indicators for periods in the past for women ages 25–29 through ages 45–49. This method is well known but has several shortcomings. In 2014 the UN IGME changed the method of estimating sum-mary birth histories to one based on classifica-tion of women by the time that has passed since their first birth. This method has three main benefits: it generally has lower sampling errors, it avoids the problematic assumption that the esti-mates for each age group adequately represent the mortality of the whole population and thus is less susceptible to the selection effect of young women who give birth early (since all women who give birth must have a first birth), and it tends to show less fluctuation across time, in particular in countries with low fertility and mortality. The UN IGME considers the improvements in the estimates based on time since first birth worth-while compared with the estimates derived from the classification by age of mother, so in cases where the microdata are available, the UN IGME has reanalysed the data using the new method. Moreover, following advice from the UN IGME’s Technical Advisory Group, child mortality esti-mates based on a summary birth history were not included when estimates based on a full birth his-tory in the same survey were available.3
Further improved methodology The UN IGME continually seeks to improve its methods. Since 2013, estimates and projections of under-five mortality have been produced using the Bayesian B-splines bias-reduction model, referred to as the B3 model.4 Compared with the previously applied Loess estimation approach the B3 model better accounts for data errors, includ-ing biases and sampling and nonsampling errors in the data. It can better capture short-term fluc-tuations in the under-five mortality rate and its annual rate of reduction and thus is better able to account for evidence of acceleration in the decline of under-five mortality from new surveys.
5

Challenges in estimating child mortality
Countries with sparse and no recent data Countries with abundant data but wide variations
Under-fivemortalityrate(deathsper1,000livebirths) Under-fivemortalityrate(deathsper1,000livebirths)
Somalia Nigeria
Generating accurate estimates of child mortality poses a considerable challenge because of the limited availability of high-quality data for many low- and middle-income countries:
• Many developing countries lack a single source of high-quality data covering the last several decades.
• Estimates calculated from household surveys are often subject to sampling and nonsampling errors, and estimates derived from census or vital registration systems may in-clude nonsampling errors. Age misreporting, selection bias and recall bias can all reduce the accuracy of estimates. Underreporting of births and particularly of early neonatal deaths is also very common. Uncertainty will always exist around data and estimates in the absence of error-free data. To increase comparability, the UN IGME generates estimates with uncertainty bounds.
• Data collected by countries may be inconsistent across sources. All data sources for a country must be analysed, reconciled and evaluated simultaneously. Each new survey or data point must be examined in the context of all others, including previous data.
• The latest data produced by countries often are not current estimates but refer to an earlier reference period. This is particularly the case for estimates from the most recent national survey (such as a Demographic and Health Survey or Multiple Indicator Cluster Survey), which typically refers to a period before the survey year that is several years before the target year of UN IGME estimates. Around 70 countries do not have high-quality data on child mortality
for the last 5 years, and 13 countries do not have high-quality data for the past 10 years. Thus the UN IGME extrapolates estimates to a common reference year, in this case 2013.
Below are examples of the real underlying data used to derive the estimates of the under-five mortality rate from Somalia, a country with sparse and no recent data, and Nigeria, a country with abundant data but wide variations in rates and trends between data sources. The Nigeria example also shows the trend line of the under-five mortality rate that results from the UN IGME model (black line) with the corresponding 90 percent uncertainty range (orange band). Detailed graphs showing all underlying data and UN IGME trend estimates are available for all countries at www.child-mortality.org.
Specific data improvements needed include:
• For estimates derived from household surveys, well designed questionnaires, proper training and supervision of survey interviewers, as well as reasonable interview length, are important measures for improving data quality. Household surveys that include data collection on child mortality through a full birth history or pregnancy history should ideally be carried out at least once every three to five years. A large sample size is required for disaggre-gated child mortality data.
• Strengthening vital registration systems to ensure accurate reporting of births and deaths is essential for improving estimates of child mortality.
19700
50
100
150
200
250
300
1980 1990 2000 2010 1950 19600
100
200
300
400
1970 1980 1990 2000 2010
6

Validation exercises show that the B3 model also performs better in short-term projections.
Estimates of infant mortality rates are gener-ated by applying the B3 model for countries with high-quality vital registration data. For other countries, infant mortality rates are derived from under-five mortality rates using model life tables that contain known regularities in age patterns of child mortality. This approach ensures that the internal relationships of the two indicators are consistent with established norms. Estimates of neonatal mortality rates are produced using a sta-tistical model that uses under-five mortality rates as an input. These methods provide a transpar-ent and objective way of fitting a smoothed trend to a set of observations and of extrapolating the trend to the present.
In 2012 the UN IGME produced sex-specific esti-mates of the under-five mortality rate for the first time. In many countries fewer sources provide data disaggregated by sex than for both sexes combined. So the UN IGME uses the available data by sex to estimate a time trend in the sex ratio (male–female) of child mortality rather than estimating child mortality trends by sex directly from reported mortality levels by sex. Since 2013 a Bayesian model developed by the UN IGME has been used to estimate sex ratios of child mortality, with a focus on identifying coun-tries with outlying levels or trends.5
In addition to the further improved methods, a substantial amount of newly available data have been incorporated since the last round of estima-tion: data from 27 surveys and censuses for 26 countries and new data from vital registration systems for about 125 countries.
The increased data have substantially changed the estimates for some countries from previous editions partly because the fitted trend line is based on the entire time series of data available for each country. The estimates presented in this report may differ from and are not necessar-ily comparable with previous sets of UN IGME estimates or the most recent underlying country data.
Country consultationIn 2014 the WHO and UNICEF undertook joint country consultations to give each country’s
ministry of health and national statistics office the opportunity to review all data inputs and the draft estimates for its country. The objec-tive was to identify relevant data not included in the UN IGME database, CME Info, and to allow countries to review and provide feedback on esti-mates. It was not a country clearance process. In 2014, 75 of 195 countries sent responses, and 43 of those provided comments or data. After the consultations the UN IGME draft estimates were revised for 28 countries using new data.
Capacity strengthening at the country levelModelled estimates of child mortality can be only as good as the underlying data. UN IGME members, including UNICEF, the WHO, the World Bank and other UN agencies, are actively involved in strengthening national capacity in data collection, estimation techniques and inter-pretation of results.
Population-based survey data are critical for developing reliable estimates for countries that lack fully functioning vital registration systems. The UNICEF-supported Multiple Indicator Clus-ter Surveys programme has worked since 1995 to build country-level capacity for survey imple-mentation, data analysis and dissemination. The surveys are government owned and implemented, and UNICEF provides support through work-shops, technical consultations and peer-to-peer mentoring. Almost 300 surveys in more than 100 countries will be conducted by the end of 2014. In addition to population-based surveys, UNICEF, the WHO, the World Bank and the United Nations Statistics Division work with coun-tries to strengthen vital registration systems. The United Nations Population Fund provides tech-nical assistance for population censuses, another important source of under-five mortality data.
The UN IGME strengthens capacity by working with countries to improve understanding of under-five mortality data and estimation. CME Info, a comprehensive data portal on child mortality funded and maintained by UNICEF, is a powerful platform for sharing underlying data and collaborating with national partners on child mortality estimates. Since 2008 a series of regional workshops has trained about 300 participants from more than 100 countries in the use of CME Info and in the demographic
7

techniques and modelling methods underlying the estimates. In the last few years UNICEF and the UN IGME have sent experts to some 20 countries to conduct training on child mortality estimation. As part of the data review process, UNICEF’s network of field offices provides opportunities to assess the plausibility of estimates by engaging in a dialogue about the estimates and the underlying data. The WHO and UNICEF also engage countries in a country consultation process through which governments provide feedback on the estimates and their underlying data (see above).
Guiding this capacity strengthening work is a fundamental principle: child mortality estimation is not simply an academic exercise but a fundamental part of effective policies and programming. UNICEF works with countries to ensure that child mortality estimates are used effectively at the country level, in conjunction with other data on child health, to improve child survival programmes and stimulate action through advocacy. This work involves partnering with other agencies, organizations and initiatives such as the Countdown to 2015.
8
Levels and Trends in Child Mortality
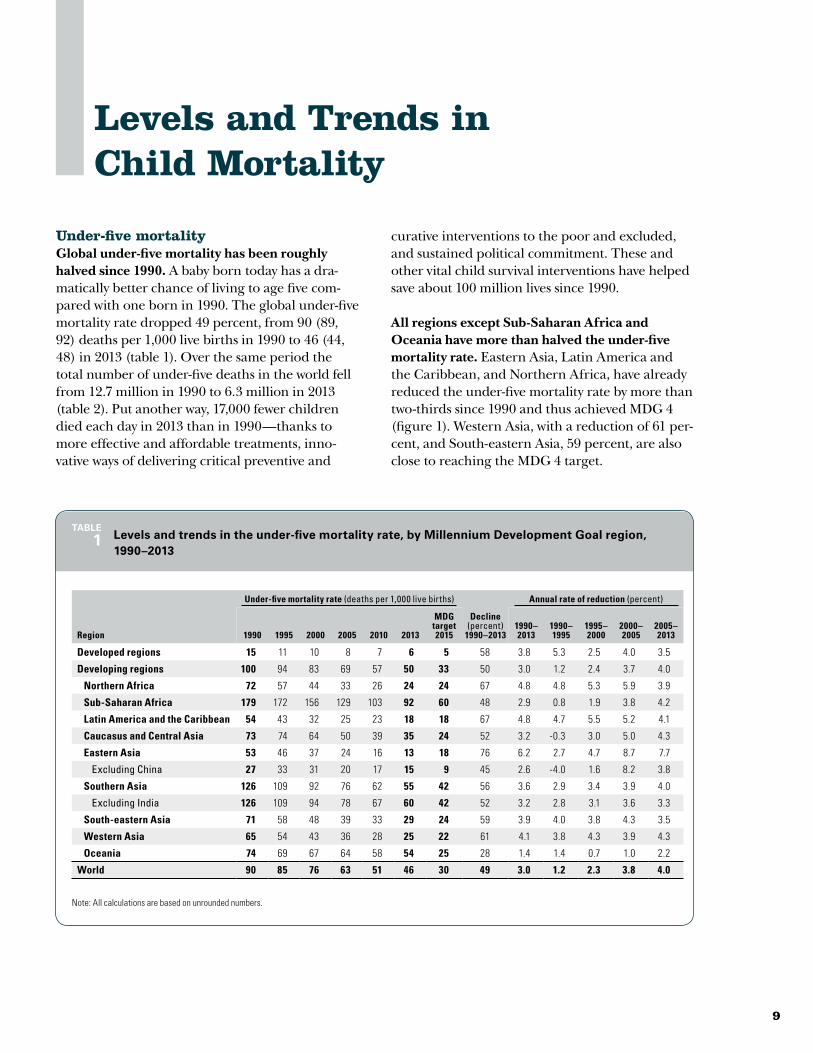
Under-five mortalityGlobal under-five mortality has been roughly halved since 1990. A baby born today has a dra-matically better chance of living to age five com-pared with one born in 1990. The global under-five mortality rate dropped 49 percent, from 90 (89, 92) deaths per 1,000 live births in 1990 to 46 (44, 48) in 2013 (table 1). Over the same period the total number of under-five deaths in the world fell from 12.7 million in 1990 to 6.3 million in 2013 (table 2). Put another way, 17,000 fewer children died each day in 2013 than in 1990—thanks to more effective and affordable treatments, inno-vative ways of delivering critical preventive and
curative interventions to the poor and excluded, and sustained political commitment. These and other vital child survival interventions have helped save about 100 million lives since 1990.
All regions except Sub-Saharan Africa and Oceania have more than halved the under-five mortality rate. Eastern Asia, Latin America and the Caribbean, and Northern Africa, have already reduced the under-five mortality rate by more than two-thirds since 1990 and thus achieved MDG 4 (figure 1). Western Asia, with a reduction of 61 per-cent, and South-eastern Asia, 59 percent, are also close to reaching the MDG 4 target.
TAblE 1 levels and trends in the under-five mortality rate, by Millennium Development Goal region,
1990–2013
Region
Under-five mortality rate (deaths per 1,000 live births)
Decline (percent)
1990–2013
Annual rate of reduction (percent)
1990 1995 2000 2005 2010 2013
MDG target 2015
1990–2013
1990–1995
1995–2000
2000–2005
2005–2013
Developed regions 15 11 10 8 7 6 5 58 3.8 5.3 2.5 4.0 3.5
Developing regions 100 94 83 69 57 50 33 50 3.0 1.2 2.4 3.7 4.0
Northern Africa 72 57 44 33 26 24 24 67 4.8 4.8 5.3 5.9 3.9
Sub-Saharan Africa 179 172 156 129 103 92 60 48 2.9 0.8 1.9 3.8 4.2
Latin America and the Caribbean 54 43 32 25 23 18 18 67 4.8 4.7 5.5 5.2 4.1
Caucasus and Central Asia 73 74 64 50 39 35 24 52 3.2 -0.3 3.0 5.0 4.3
Eastern Asia 53 46 37 24 16 13 18 76 6.2 2.7 4.7 8.7 7.7
Excluding China 27 33 31 20 17 15 9 45 2.6 -4.0 1.6 8.2 3.8
Southern Asia 126 109 92 76 62 55 42 56 3.6 2.9 3.4 3.9 4.0
Excluding India 126 109 94 78 67 60 42 52 3.2 2.8 3.1 3.6 3.3
South-eastern Asia 71 58 48 39 33 29 24 59 3.9 4.0 3.8 4.3 3.5
Western Asia 65 54 43 36 28 25 22 61 4.1 3.8 4.3 3.9 4.3
Oceania 74 69 67 64 58 54 25 28 1.4 1.4 0.7 1.0 2.2
World 90 85 76 63 51 46 30 49 3.0 1.2 2.3 3.8 4.0
Note: All calculations are based on unrounded numbers.
9

FiGuRE 1
under-five mortality declined in all regions between 1990 and 2013
0
50
100
150
200
Sub
-Sah
aran
Afr
ica
Sou
ther
n A
sia
Oce
ania
Cau
casu
s an
d C
entr
al A
sia
Sou
th-e
aste
rn A
sia
Wes
tern
Asi
a
Nor
ther
n A
fric
a
Latin
Am
eric
a an
d th
e C
arib
bean
Eas
tern
Asi
a
Dev
elop
ed r
egio
ns
Dev
elop
ing
regi
ons
Wor
ld
2013 1990 MDG target for 2015
Under-five mortality rate, by Millenium Development Goal region, 1990 and 2013 (deaths per 1,000 live births)
179
92
126
55
74
54
7335
7129
6525
7224
5418
5313 15
6
100
50
9046
TAblE 2 levels and trends in the number of deaths of children under age five, by Millennium Development Goal region,
1990–2013
Region
Under-five deaths (thousands) Decline (percent)
1990–2013
Share of global under-five deaths (percent)
1990 1995 2000 2005 2010 2013 1990 2013
Developed regions 226 153 131 112 97 87 62 1.8 1.4
Developing regions 12,444 10,757 9,613 8,108 6,836 6,199 50 98.2 98.6
Northern Africa 266 189 140 105 98 95 64 2.1 1.5
Sub-Saharan Africa 3,809 4,033 4,113 3,766 3,318 3,113 18 30.1 49.5
Latin America and the Caribbean 628 500 383 285 248 196 69 5.0 3.1
Caucasus and Central Asia 145 124 89 73 69 61 58 1.1 1.0
Eastern Asia 1,672 864 659 426 300 249 85 13.2 4.0
Excluding China 28 42 30 17 15 14 51 0.2 0.2
Southern Asia 4,796 4,106 3,495 2,827 2,268 2,015 58 37.9 32.1
Excluding India 1,463 1,245 1,083 853 772 675 54 11.5 10.7
South-eastern Asia 848 696 524 450 383 330 61 6.7 5.3
Western Asia 265 230 195 160 135 124 53 2.1 2.0
Oceania 14 15 16 16 15 14 0 0.1 0.2
World 12,670 10,909 9,745 8,219 6,933 6,285 50 100.0 100.0
Note: All calculations are based on unrounded numbers.
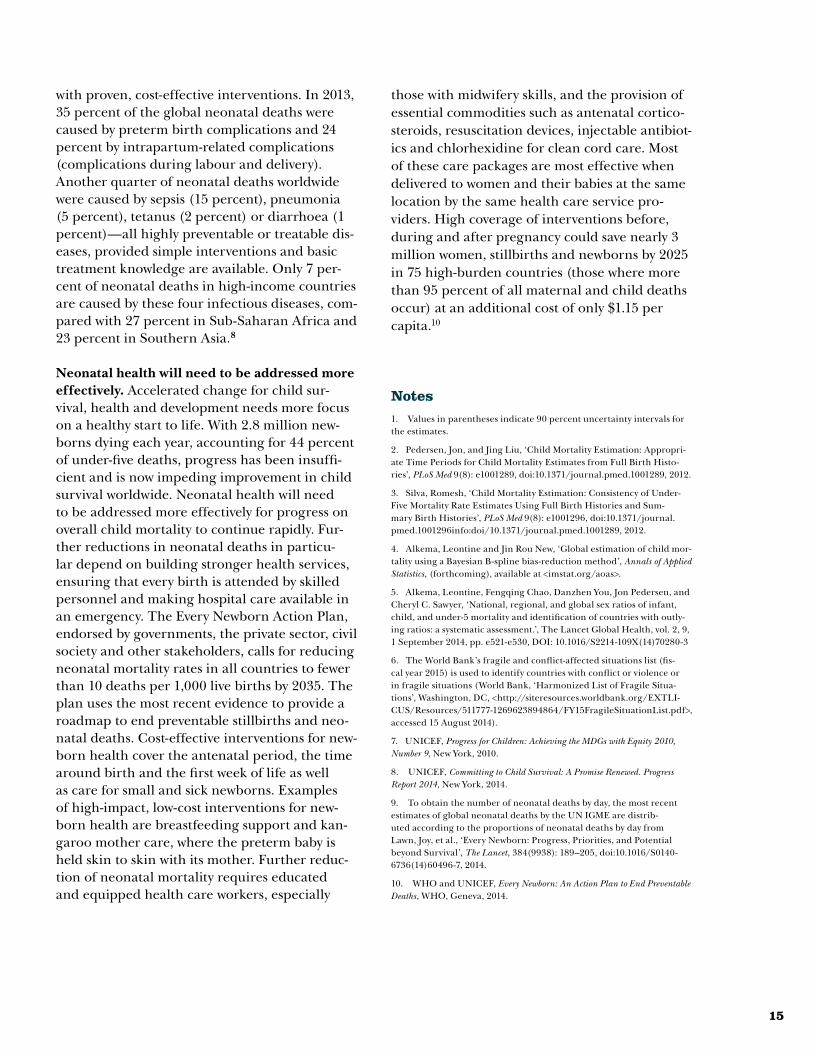
Eight of the 60 high-mortality countries have reduced the under-five mortality rate by two-thirds or more since 1990. Of the 60 countries with at least 40 deaths per 1,000 live births in 2013, 27 have reduced the under-five mortality rate by at least half since 1990, and 8 of those—Malawi (72 percent), Bangladesh (71 percent), Liberia (71 per-cent), United Republic of Tanzania (69 percent), Ethiopia (69 percent), Timor-Leste (68 percent), Niger (68 percent) and Eritrea (67 percent)—have reduced it by two-thirds. The rapid declines in these countries show that tremendous progress in lowering under-five mortality is possible even in low- and lower middle-income countries.
The world is reducing under-five mortality faster than at any other time in the past two decades. The global annual rate of reduction has steadily accelerated since 1990–1995—more than tripling from 1.2 percent to 4.0 percent in 2005–2013. Sub-Saharan Africa, the region with the highest child mortality rate and least progress, has also seen a continuously faster decline, with the annual rate of reduction rising from 0.8 percent in 1990–1995 to 1.9 percent in 1995–2000 to 3.8 percent in 2000–2005 to 4.2 percent in 2005–2013.
10

MAP 1
Children in Sub-Saharan Africa and Southern Asia face a higher risk of dying before their fifth birthday
0 – 19.9
20 – 39.940 – 79.980 – 99.9100+Data not available
Under-five mortality rate, 2013(deaths per 1,000 live births)
Notes: The classification is based on unrounded numbers. This map is stylized and not to scale. It does not reflect a position by UN IGME agencies on the legal status of any country or territory or the delimitation of any frontiers.
But progress is insufficient to achieve MDG 4. The global toll of under-five deaths over the past two decades is staggering: between 1990 and 2013, 223 million children died before age five. Globally, the 49 percent decline in the under-five mortal-ity rate since 1990 is still far below the two-thirds reduction required to reach the MDG 4 target. If current trends continue, only three regions—East-ern Asia, Latin America and the Caribbean, and Northern Africa—will achieve MDG 4 by 2015. The rate of decline in under-five mortality in all other regions remains insufficient to achieve MDG 4.
Conflicts and political fragility contribute to higher under-five mortality rates. One fifth of all under-five deaths in 2013 occur in countries cur-rently classified as fragile and conflict affected contexts.6 Of the 20 countries with the highest under-five mortality rates, 11 are affected mark-edly by conflict or violence or are in fragile situa-tions. Six of these are also among the 20 countries with the lowest annual rate of reduction since 1990 (excluding countries with fewer than 10,000 live births in 2013), indicating little progress where it is needed most.
Reducing inequities across regions and income groups is an important priority to save children’s lives. Sub-Saharan Africa’s under-five mortality rate, 92 deaths per 1,000 live births in 2013, is more than 15 times the average for developed regions (6). Southern Asia’s, 55 deaths per 1,000 live births, is more than 9 times the average for developed regions. And the under-five mortality rate for low-income countries, 76 deaths per 1,000 live births, is more than 12 times the average for high-income countries (6).
Many countries still have very high under-five mor-tality rates—particularly those in Sub-Saharan Africa, home to all 12 countries with a rate of 100 deaths or more per 1,000 live births (map 1). Chil-dren born in Angola, with the highest under-five mortality rate in the world (167 deaths per 1,000 live births), are 84 times more likely to die before age five than children born in Luxembourg, with the lowest rate (2).
Evidence also shows alarming disparities in under-five mortality rates within countries. A child’s risk of dying before age five increases if she or he is born in a remote rural area, into a poor household
20–39
40–79
80–99
100 and above
Data not available
Less than 20
11

or to a mother with no education.7 Survey data show that the under-five mortality rates for the poorest fifth of the population average around twice as high as the rates for the richest fifth. Nevertheless, a child in the poorest fifth of the population born today still has a better chance of surviving through age five than one born in 1990, since under-five mortality has been reduced for the poorest fifth of the population in all regions. More-over, the disparity in under-five mortality between the richest and poorest households has steadily declined since 1990, except in Sub-Saharan Africa where it has not changed markedly.8
Acceleration in reducing child mortality is urgently required, particularly in Sub-Saharan Africa and Southern Asia. As the region with the highest mortality rates, Sub-Saharan Africa contin-ues to face considerable challenges. The region’s 48 percent reduction in under-five mortality since 1990 has been slower than any other region’s except Oceania. Faster progress in reducing child mortality in the rest of the world has led to a higher concentration of under-five deaths in Sub-Saharan Africa. In 2013, 3.1 million deaths—half of under-five deaths globally—occurred there. It is the only region where the number of live births and child population is expected to rise substan-tially over the next two decades. By 2050 close to 40 percent of live births will take place in Sub-Saha-ran Africa, and 37 percent of the world’s children under age five will live there. Thus, the number of under-five deaths may stagnate or even increase without further progress in the region.
Southern Asia has made strong progress in reduc-ing the number of child deaths. But the region continues to have a high under-five mortality rate (55 deaths per 1,000 live births in 2013), and nearly one in three under-five deaths still takes place there. Two-thirds of the under-five deaths in South-ern Asia occur in India, which has the highest number of under-five deaths in the world (1.3 mil-lion in 2013).
Ending child deaths from preventable infectious diseases is critical. Despite strong advances in fighting childhood diseases, infectious diseases—which are most often diseases of the poor and thus
are a marker of equity—remain highly prevalent, particularly in Sub-Saharan Africa and Southern Asia. Pneumonia, diarrhoea and malaria remain leading causes of death among children under age five—killing roughly 2 million in 2013 and accounting for almost a third of global under-five deaths.8 Pneumonia, diarrhoea and malaria accounted for about 1.3 million—or about 40 per-cent—of under-five deaths in Sub-Saharan Africa and roughly half a million—or about 25 percent—in Southern Asia.
The major improvements in child survival since 1990 are partly attributable to affordable, evidence-based interventions against the leading infectious diseases, such as immunization, insecticide-treated mosquito nets, rehydration treatment for diar-rhoea, nutritional supplements and therapeutic food. Accelerating the reduction in under-five mortality is possible by expanding effective preven-tive and curative interventions that target the main causes of post-neonatal deaths and the most vul-nerable newborns and children.
Neonatal mortalityNeonatal mortality is declining globally but more slowly than post-neonatal (1-59 months) mortality. The first 28 days of life—the neonatal period—are the most vulnerable time for a child’s survival. Neo-natal mortality is becoming increasingly impor-tant not only because the proportion of under-five deaths that occur during the neonatal period is increasing as under-five mortality declines, but also because the health interventions needed to address the major causes of neonatal deaths generally dif-fer from those needed to address other under-five deaths and are intimately linked to those that are necessary to protect maternal health.
Globally, the neonatal mortality rate fell from 33 deaths per 1,000 live births in 1990 to 20 in 2013 (figure 2), and the number of neonatal deaths declined from 4.7 million in 1990 to 2.8 million in 2013 (table 3). However, the decline in neonatal mortality over 1990–2013 has been slower than that of post-neonatal mortality: 40 percent, compared with 56 percent (and 49 percent for overall under-five mortality), a pattern consistent across all MDG regions (figure 3).
12

TAblE 3 neonatal mortality rate, number of neonatal deaths and neonatal deaths as a share of under-five deaths, by
Millennium Development Goal region, 1990 and 2013
Neonatal mortality rate (deaths per 1,000 live births)
Number of neonatal deaths (thousands)
Neonatal deaths as a share of under-five deaths (percent)
Region 1990 2013
Decline (percent) 1990–2013 1990 2013 1990 2013
Relative increase (percent)
1990–2013
Developed regions 8 3 55 118 48 52 56 7
Developing regions 36 22 40 4,554 2,714 37 44 20
Northern Africa 30 13 56 109 53 41 56 37
Sub-Saharan Africa 46 31 32 977 1,066 26 34 34
Latin America and the Caribbean 22 9 58 255 101 41 51 26
Caucasus and Central Asia 26 15 42 51 26 35 42 19
Eastern Asia 25 8 69 784 150 47 60 29
Excluding China 12 8 35 11 7 41 51 25
Southern Asia 51 30 42 1,940 1,086 40 54 33
Excluding India 49 30 39 578 338 39 50 27
South-eastern Asia 27 14 47 321 160 38 49 28
Western Asia 28 14 50 111 67 42 54 28
Oceania 26 21 19 5 6 35 40 12
World 33 20 40 4,672 2,763 37 44 19
FiGuRE 3
The decline in the neonatal mortality rate has been slower than the decline in the post-neonatal mortality rate in all regions
FiGuRE 2
neonatal mortality rate is declining in all regions
Decline in neonatal and post-neonatal (age 1–59 months) mortality rates, by Millennium Development Goal region, 1990–2013 (percent)
56 56
40 40
NeonatalPost-neonatal
83
73 76
69 66
57
67
55
33
62
69
58 56
50 47
42 42
32
19
55
0
25
50
75
100
Eas
tern
Asi
a
Nor
ther
n A
fric
a
Latin
Am
eric
a an
d th
e C
arib
bean
Wes
tern
Asi
a
Sou
th-e
aste
rn A
sia
Sou
ther
n A
sia
Cau
casu
s an
d C
entr
al A
sia
Sub
-Sah
aran
Afr
ica
Oce
ania
Dev
elop
ed r
egio
ns
Dev
elop
ing
regi
ons
Wor
ld
20131990
Neonatal mortality rate by Millennium Development Goal region, 1990 and 2013 (deaths per 1,000 live births)
46
51
26 26 27 28
30
22
25
8
36
33
31 30
21
15 14 14 13
9 8
3
22
20
0
20
40
60
Eas
tern
Asi
a
Nor
ther
n A
fric
a
Latin
Am
eric
a an
d th
e C
arib
bean
Wes
tern
Asi
a
Sou
th-e
aste
rn A
sia
Sou
ther
n A
sia
Cau
casu
s an
d C
entr
al A
sia
Sub
-Sah
aran
Afr
ica
Oce
ania
Dev
elop
ed r
egio
ns
Dev
elop
ing
regi
ons
Wor
ld
Note: All calculations are based on unrounded numbers.
13

Around 44 percent of under-five deaths world-wide occur during the neonatal period. Despite falling rates and levels of neonatal mortality, its importance in the burden of under-five deaths has never been greater. Because declines in the neo-natal mortality rate are slower than those in the post-neonatal mortality rate, the share of neonatal deaths among under-five deaths increased from about 37 percent in 1990 to 44 percent in 2013 (fig-ure 4). This trend is expected to continue as the under-five mortality rate continues to decline.
In five developing regions—Eastern Asia, Latin America and the Caribbean, Northern Africa, Southern Asia and Western Asia—more than half of under-five deaths took place during the neona-tal period in 2013. Eastern Asia cut overall under-five mortality rates so quickly that the share of neonatal deaths among under-five deaths jumped from 47 percent in 1990 to 60 percent in 2013 (table 3).
Sub-Saharan Africa lags behind other regions in reducing neonatal mortality. Sub-Saharan Africa—where about a third of under-five deaths occurred during the neonatal period—has the highest neonatal mortality rate (31 deaths per
1,000 live births in 2013) and accounts for 39 percent of global neonatal deaths. Together with Oceania, the region has recorded the least improvement over the last two decades, with the neonatal mortality rate declining only 32 per-cent. The greatest progress was in Eastern Asia (69 percent decline in the neonatal mortality rate), followed by Latin America and the Carib-bean (58 percent) and Northern Africa (56 percent).
At all levels of national income, it is possible to make rapid advances in reducing neonatal mor-tality. Although neonatal deaths are often more difficult to prevent, 80 countries have reduced the neonatal mortality rate by at least half since 1990, and 27 of those have reduced it by two-thirds or more since 1990. Many of these are countries with low neonatal mortality rates. The largest relative gains in neonatal survival have been in nine European countries and one Asian country. Encouragingly, many low- and lower middle-income countries have also experienced considerable declines in the neonatal mortality rates. The 10 countries with the largest absolute declines in neonatal mortality are all low- and lower middle-income countries in Africa or Asia: Bangladesh, Nepal, Ethiopia, Malawi, Liberia, Mozambique, South Sudan, Bhutan, Timor-Leste and United Republic of Tanzania. The decline in these 10 countries saved the lives of 3.4 million newborns.
The substantial progress in these countries dem-onstrates that combining political commitment, sound strategies and adequate resources makes it possible to rapidly reduce neonatal mortality, regardless of national income.
The first day and week are most critical for the survival of newborns. In 2013 almost 1 mil-lion newborns (36 percent) died on the day they were born, and another 1 million (37 percent) died within the next six days of birth. Some 0.8 million neonatal deaths (27 percent) occurred between day 7 and day 27 of life.9
Most neonatal deaths are preventable. Children that die in the first 28 days of life suffer from diseases and conditions that are often associated with quality of care around the time of child-birth and are readily preventable or treatable
FiGuRE 4
The share of neonatal deaths among under-five deaths has increased since 1990
44%
37%
Deaths in the first month after birth
Deaths (1-11 months)
Deaths (1 - 4 years)
0 1990 1995 2000 2005 2010
25
50
75
100
Age distribution of global under-five deaths, 1990 and 2013 (percent)
14
with proven, cost-effective interventions. In 2013, 35 percent of the global neonatal deaths were caused by preterm birth complications and 24 percent by intrapartum-related complications (complications during labour and delivery). Another quarter of neonatal deaths worldwide were caused by sepsis (15 percent), pneumonia (5 percent), tetanus (2 percent) or diarrhoea (1 percent)—all highly preventable or treatable dis-eases, provided simple interventions and basic treatment knowledge are available. Only 7 per-cent of neonatal deaths in high-income countries are caused by these four infectious diseases, com-pared with 27 percent in Sub-Saharan Africa and 23 percent in Southern Asia.8
Neonatal health will need to be addressed more effectively. Accelerated change for child sur-vival, health and development needs more focus on a healthy start to life. With 2.8 million new-borns dying each year, accounting for 44 percent of under-five deaths, progress has been insuffi-cient and is now impeding improvement in child survival worldwide. Neonatal health will need to be addressed more effectively for progress on overall child mortality to continue rapidly. Fur-ther reductions in neonatal deaths in particu-lar depend on building stronger health services, ensuring that every birth is attended by skilled personnel and making hospital care available in an emergency. The Every Newborn Action Plan, endorsed by governments, the private sector, civil society and other stakeholders, calls for reducing neonatal mortality rates in all countries to fewer than 10 deaths per 1,000 live births by 2035. The plan uses the most recent evidence to provide a roadmap to end preventable stillbirths and neo-natal deaths. Cost-effective interventions for new-born health cover the antenatal period, the time around birth and the first week of life as well as care for small and sick newborns. Examples of high-impact, low-cost interventions for new-born health are breastfeeding support and kan-garoo mother care, where the preterm baby is held skin to skin with its mother. Further reduc-tion of neonatal mortality requires educated and equipped health care workers, especially
those with midwifery skills, and the provision of essential commodities such as antenatal cortico-steroids, resuscitation devices, injectable antibiot-ics and chlorhexidine for clean cord care. Most of these care packages are most effective when delivered to women and their babies at the same location by the same health care service pro-viders. High coverage of interventions before, during and after pregnancy could save nearly 3 million women, stillbirths and newborns by 2025 in 75 high-burden countries (those where more than 95 percent of all maternal and child deaths occur) at an additional cost of only $1.15 per capita.10
Notes1. Values in parentheses indicate 90 percent uncertainty intervals for the estimates.
2. Pedersen, Jon, and Jing Liu, ‘Child Mortality Estimation: Appropri-ate Time Periods for Child Mortality Estimates from Full Birth Histo-ries’, PLoS Med 9(8): e1001289, doi:10.1371/journal.pmed.1001289, 2012.
3. Silva, Romesh, ‘Child Mortality Estimation: Consistency of Under-Five Mortality Rate Estimates Using Full Birth Histories and Sum-mary Birth Histories’, PLoS Med 9(8): e1001296, doi:10.1371/journal.pmed.1001296info:doi/10.1371/journal.pmed.1001289, 2012.
4. Alkema, Leontine and Jin Rou New, ‘Global estimation of child mor-tality using a Bayesian B-spline bias-reduction method’, Annals of Applied Statistics, (forthcoming), available at <imstat.org/aoas>.
5. Alkema, Leontine, Fengqing Chao, Danzhen You, Jon Pedersen, and Cheryl C. Sawyer, ‘National, regional, and global sex ratios of infant, child, and under-5 mortality and identification of countries with outly-ing ratios: a systematic assessment.’, The Lancet Global Health, vol. 2, 9, 1 September 2014, pp. e521-e530, DOI: 10.1016/S2214-109X(14)70280-3
6. The World Bank’s fragile and conflict-affected situations list (fis-cal year 2015) is used to identify countries with conflict or violence or in fragile situations (World Bank, ‘Harmonized List of Fragile Situa-tions’, Washington, DC, <http://siteresources.worldbank.org/EXTLI-CUS/Resources/511777-1269623894864/FY15FragileSituationList.pdf>, accessed 15 August 2014).
7. UNICEF, Progress for Children: Achieving the MDGs with Equity 2010, Number 9, New York, 2010.
8. UNICEF, Committing to Child Survival: A Promise Renewed. Progress Report 2014, New York, 2014.
9. To obtain the number of neonatal deaths by day, the most recent estimates of global neonatal deaths by the UN IGME are distrib-uted according to the proportions of neonatal deaths by day from Lawn, Joy, et al., ‘Every Newborn: Progress, Priorities, and Potential beyond Survival’, The Lancet, 384(9938): 189–205, doi:10.1016/S0140-6736(14)60496-7, 2014.
10. WHO and UNICEF, Every Newborn: An Action Plan to End Preventable Deaths, WHO, Geneva, 2014.
15

Country
Under-five mortality rate (U5MR) (deaths per 1,000 live births)
Country
Number of under-five deaths (thousands)
Sex-specific under-five mortality rate
(deaths per 1,000 live births)
Infant mortality
rate (deaths per 1,000 live
births)
Number of infant deaths
(thousands)
Neonatal mortality rate
(deaths per 1,000 live
births)
Number of neonatal deaths
(thousands)
1990 2000 2013Millennium
Development Goal
target for 2015
Annual rate of reduction (ARR) (percent)
1990–2013 1990 2013
U5MRLower bound
Upper bound U5MR
Lower bound
Upper bound U5MR
Lower bound
Upper bound ARR
Lower bound
Upper bound
Under-five
deathsLower bound
Upper bound
Under-five
deathsLower bound
Upper bound
1990 2013
Male Female Male Female 1990 2013 1990 2013 1990 2013 1990 2013
Afghanistan 179 161 198 136 124 149 97 79 120 60 2.7 1.7 3.6 Afghanistan 98 87 110 100 81 125 184 174 101 94 121 70 67 71 51 36 28 37
Albania 41 36 46 26 22 30 15 9 24 14 4.3 2.1 6.6 Albania 4 3 4 1 0 1 44 36 16 13 35 13 3 1 17 7 2 0
Algeria 47 44 50 40 39 41 25 24 26 16 2.7 2.4 3.0 Algeria 39 36 42 25 24 25 51 43 26 24 40 22 33 21 23 14 18 14
Andorra 9 5 15 5 4 6 3 2 5 3 4.5 1.2 7.8 Andorra 0 0 0 0 0 0 9 8 3 3 8 2 0 0 4 1 0 0
Angola 226 201 254 217 190 248 167 108 253 75 1.3 -0.5 3.2 Angola 114 99 131 153 96 246 236 215 175 159 133 102 68 93 54 47 28 43
Antigua and Barbuda 26 18 36 15 14 17 9 7 13 9 4.4 2.3 6.6 Antigua and Barbuda 0 0 0 0 0 0 28 23 10 8 23 8 0 0 12 5 0 0
Argentina 28 27 28 20 20 21 13 13 14 9 3.2 2.9 3.4 Argentina 20 20 21 9 9 10 31 24 15 12 24 12 18 8 16 7 12 5
Armenia 50 45 55 30 27 33 16 12 20 17 5.0 3.9 6.1 Armenia 4 4 4 1 0 1 54 45 17 14 42 14 3 1 24 10 2 0
Australia 9 9 9 6 6 6 4 4 4 3 3.6 3.4 3.9 Australia 2 2 2 1 1 1 10 8 4 4 8 3 2 1 5 2 1 1
Austria 10 9 10 6 5 6 4 4 4 3 3.9 3.6 4.3 Austria 1 1 1 0 0 0 11 8 4 3 8 3 1 0 5 2 0 0
Azerbaijan 95 85 105 74 66 83 34 23 52 32 4.4 2.6 6.2 Azerbaijan 19 17 22 6 4 9 102 86 37 31 75 30 16 5 32 16 7 3
Bahamas 24 22 25 16 15 17 13 11 16 8 2.6 1.6 3.5 Bahamas 0 0 0 0 0 0 25 22 14 12 20 10 0 0 12 7 0 0
Bahrain 23 22 24 13 12 13 6 5 7 8 5.8 5.1 6.4 Bahrain 0 0 0 0 0 0 24 22 6 6 20 5 0 0 8 2 0 0
Bangladesh 144 140 148 88 85 91 41 37 46 48 5.4 4.9 6.0 Bangladesh 531 514 549 129 115 145 146 141 44 38 100 33 366 105 55 24 203 77
Barbados 18 17 19 16 15 18 14 12 17 6 1.0 0.3 1.7 Barbados 0 0 0 0 0 0 20 16 16 13 16 13 0 0 10 8 0 0
Belarus 17 16 17 14 14 15 5 5 5 6 5.3 5.0 5.6 Belarus 3 3 3 1 0 1 19 14 6 4 14 4 2 0 8 2 1 0
Belgium 10 10 10 6 6 6 4 4 5 3 3.6 3.2 3.9 Belgium 1 1 1 1 1 1 11 9 5 4 8 4 1 0 5 2 1 0
Belize 40 35 45 25 24 27 17 14 20 13 3.8 2.8 4.7 Belize 0 0 0 0 0 0 44 35 18 15 32 14 0 0 16 8 0 0
Benin 179 168 192 146 134 159 85 55 124 60 3.2 1.6 5.2 Benin 39 36 42 31 19 46 186 172 89 81 108 56 24 20 41 27 9 10
Bhutan 134 118 153 79 72 88 36 28 46 45 5.7 4.4 7.1 Bhutan 3 2 3 1 0 1 140 127 40 33 93 30 2 0 43 18 1 0
Bolivia (Plurinational State of) 123 116 130 77 72 83 39 29 52 41 5.0 3.7 6.3 Bolivia (Plurinational State of) 29 28 31 10 8 14 129 116 43 35 85 31 20 8 38 18 9 5
Bosnia and Herzegovina 18 18 19 9 9 10 7 6 8 6 4.4 3.9 5.0 Bosnia and Herzegovina 1 1 1 0 0 0 20 16 7 6 16 6 1 0 12 4 1 0
Botswana 50 43 57 85 64 104 47 19 92 17 0.3 -2.9 4.3 Botswana 2 2 3 2 1 5 54 45 50 43 39 36 2 2 25 25 1 1
Brazil 62 57 66 33 30 36 14 12 16 21 6.5 5.9 7.2 Brazil 218 201 236 41 36 47 67 55 15 12 51 12 179 37 28 8 96 25
Brunei Darussalam 12 12 13 10 9 10 10 9 11 4 0.9 0.4 1.5 Brunei Darussalam 0 0 0 0 0 0 13 11 11 9 9 8 0 0 6 5 0 0
Bulgaria 22 22 23 21 21 22 12 11 13 7 2.8 2.4 3.2 Bulgaria 3 3 3 1 1 1 25 19 13 10 18 10 2 1 12 6 1 0
Burkina Faso 202 189 216 186 173 200 98 78 121 67 3.2 2.3 4.1 Burkina Faso 79 73 85 64 51 80 210 194 103 92 103 64 40 43 40 27 16 18
Burundi 171 155 189 149 131 170 83 50 129 57 3.1 1.2 5.4 Burundi 45 41 51 35 21 55 181 161 89 77 103 55 28 24 46 30 12 13
Cabo Verde 63 61 65 35 34 36 26 24 28 21 3.8 3.5 4.2 Cabo Verde 1 1 1 0 0 0 67 58 28 23 48 22 1 0 22 11 0 0
Cambodia 118 109 127 111 102 121 38 21 70 39 4.9 2.2 7.4 Cambodia 40 37 44 14 8 26 125 109 42 33 86 33 28 12 38 18 12 7
Cameroon 136 127 146 151 139 165 95 58 148 45 1.6 -0.4 3.7 Cameroon 70 65 75 75 45 121 144 128 101 88 85 61 44 49 35 28 18 23
Canada 8 8 8 6 6 6 5 5 6 3 2.0 1.7 2.3 Canada 3 3 3 2 2 2 9 7 6 5 7 5 3 2 5 3 2 1
Central African Republic 177 160 196 174 156 194 139 100 195 59 1.0 -0.5 2.6 Central African Republic 20 18 23 21 15 31 184 170 145 132 115 96 13 15 48 43 6 7
Chad 215 199 232 191 175 207 148 108 199 72 1.6 0.3 3.0 Chad 61 56 66 82 59 114 224 205 155 140 116 89 33 50 48 40 14 23
Chile 19 19 20 11 11 11 8 7 10 6 3.7 2.8 4.6 Chile 6 6 6 2 2 2 21 17 9 7 16 7 5 2 8 5 2 1
China 54 50 59 37 35 39 13 11 15 18 6.3 5.6 7.0 China 1,644 1,509 1,803 236 205 273 56 52 14 12 42 11 1,315 203 25 8 772 143
Colombia 35 33 38 25 23 27 17 13 23 12 3.2 1.8 4.5 Colombia 32 29 34 15 11 21 39 31 19 15 29 15 26 13 19 10 17 9
Comoros 125 111 139 101 82 119 78 45 139 42 2.1 -0.6 4.5 Comoros 2 2 2 2 1 4 133 118 83 72 88 58 1 1 41 31 1 1
Congo 92 81 105 121 110 135 49 35 68 31 2.7 1.3 4.3 Congo 8 7 9 8 5 11 98 86 53 45 60 36 5 6 30 19 3 3
Cook Islands 24 22 27 17 15 19 9 6 12 8 4.4 2.9 6.0 Cook Islands 0 0 0 0 0 0 27 22 10 8 21 8 0 0 12 5 0 0
Costa Rica 17 17 17 13 13 13 10 8 12 6 2.5 1.4 3.5 Costa Rica 1 1 1 1 1 1 19 15 11 9 14 8 1 1 9 6 1 0
Côte d'Ivoire 152 141 162 146 134 159 100 83 121 51 1.8 1.0 2.6 Côte d'Ivoire 73 68 79 72 60 88 163 139 109 91 104 71 50 53 48 38 23 28
Croatia 13 13 13 8 8 9 5 4 5 4 4.5 4.1 5.0 Croatia 1 1 1 0 0 0 14 11 5 4 11 4 1 0 8 3 0 0
Cuba 13 13 14 8 8 9 6 5 7 4 3.3 2.8 3.9 Cuba 2 2 3 1 1 1 15 11 7 5 11 5 2 1 7 3 1 0
StatiStical table
country, regional and global estimates of under-five, infant and neonatal mortality
16

StatiStical table (continued)
country, regional and global estimates of under-five, infant and neonatal mortality
Country
Under-five mortality rate (U5MR) (deaths per 1,000 live births)
Country
Number of under-five deaths (thousands)
Sex-specific under-five mortality rate
(deaths per 1,000 live births)
Infant mortality
rate (deaths per 1,000 live
births)
Number of infant deaths
(thousands)
Neonatal mortality rate
(deaths per 1,000 live
births)
Number of neonatal deaths
(thousands)
1990 2000 2013Millennium
Development Goal
target for 2015
Annual rate of reduction (ARR) (percent)
1990–2013 1990 2013
U5MRLower bound
Upper bound U5MR
Lower bound
Upper bound U5MR
Lower bound
Upper bound ARR
Lower bound
Upper bound
Under-five
deathsLower bound
Upper bound
Under-five
deathsLower bound
Upper bound
1990 2013
Male Female Male Female 1990 2013 1990 2013 1990 2013 1990 2013
Afghanistan 179 161 198 136 124 149 97 79 120 60 2.7 1.7 3.6 Afghanistan 98 87 110 100 81 125 184 174 101 94 121 70 67 71 51 36 28 37
Albania 41 36 46 26 22 30 15 9 24 14 4.3 2.1 6.6 Albania 4 3 4 1 0 1 44 36 16 13 35 13 3 1 17 7 2 0
Algeria 47 44 50 40 39 41 25 24 26 16 2.7 2.4 3.0 Algeria 39 36 42 25 24 25 51 43 26 24 40 22 33 21 23 14 18 14
Andorra 9 5 15 5 4 6 3 2 5 3 4.5 1.2 7.8 Andorra 0 0 0 0 0 0 9 8 3 3 8 2 0 0 4 1 0 0
Angola 226 201 254 217 190 248 167 108 253 75 1.3 -0.5 3.2 Angola 114 99 131 153 96 246 236 215 175 159 133 102 68 93 54 47 28 43
Antigua and Barbuda 26 18 36 15 14 17 9 7 13 9 4.4 2.3 6.6 Antigua and Barbuda 0 0 0 0 0 0 28 23 10 8 23 8 0 0 12 5 0 0
Argentina 28 27 28 20 20 21 13 13 14 9 3.2 2.9 3.4 Argentina 20 20 21 9 9 10 31 24 15 12 24 12 18 8 16 7 12 5
Armenia 50 45 55 30 27 33 16 12 20 17 5.0 3.9 6.1 Armenia 4 4 4 1 0 1 54 45 17 14 42 14 3 1 24 10 2 0
Australia 9 9 9 6 6 6 4 4 4 3 3.6 3.4 3.9 Australia 2 2 2 1 1 1 10 8 4 4 8 3 2 1 5 2 1 1
Austria 10 9 10 6 5 6 4 4 4 3 3.9 3.6 4.3 Austria 1 1 1 0 0 0 11 8 4 3 8 3 1 0 5 2 0 0
Azerbaijan 95 85 105 74 66 83 34 23 52 32 4.4 2.6 6.2 Azerbaijan 19 17 22 6 4 9 102 86 37 31 75 30 16 5 32 16 7 3
Bahamas 24 22 25 16 15 17 13 11 16 8 2.6 1.6 3.5 Bahamas 0 0 0 0 0 0 25 22 14 12 20 10 0 0 12 7 0 0
Bahrain 23 22 24 13 12 13 6 5 7 8 5.8 5.1 6.4 Bahrain 0 0 0 0 0 0 24 22 6 6 20 5 0 0 8 2 0 0
Bangladesh 144 140 148 88 85 91 41 37 46 48 5.4 4.9 6.0 Bangladesh 531 514 549 129 115 145 146 141 44 38 100 33 366 105 55 24 203 77
Barbados 18 17 19 16 15 18 14 12 17 6 1.0 0.3 1.7 Barbados 0 0 0 0 0 0 20 16 16 13 16 13 0 0 10 8 0 0
Belarus 17 16 17 14 14 15 5 5 5 6 5.3 5.0 5.6 Belarus 3 3 3 1 0 1 19 14 6 4 14 4 2 0 8 2 1 0
Belgium 10 10 10 6 6 6 4 4 5 3 3.6 3.2 3.9 Belgium 1 1 1 1 1 1 11 9 5 4 8 4 1 0 5 2 1 0
Belize 40 35 45 25 24 27 17 14 20 13 3.8 2.8 4.7 Belize 0 0 0 0 0 0 44 35 18 15 32 14 0 0 16 8 0 0
Benin 179 168 192 146 134 159 85 55 124 60 3.2 1.6 5.2 Benin 39 36 42 31 19 46 186 172 89 81 108 56 24 20 41 27 9 10
Bhutan 134 118 153 79 72 88 36 28 46 45 5.7 4.4 7.1 Bhutan 3 2 3 1 0 1 140 127 40 33 93 30 2 0 43 18 1 0
Bolivia (Plurinational State of) 123 116 130 77 72 83 39 29 52 41 5.0 3.7 6.3 Bolivia (Plurinational State of) 29 28 31 10 8 14 129 116 43 35 85 31 20 8 38 18 9 5
Bosnia and Herzegovina 18 18 19 9 9 10 7 6 8 6 4.4 3.9 5.0 Bosnia and Herzegovina 1 1 1 0 0 0 20 16 7 6 16 6 1 0 12 4 1 0
Botswana 50 43 57 85 64 104 47 19 92 17 0.3 -2.9 4.3 Botswana 2 2 3 2 1 5 54 45 50 43 39 36 2 2 25 25 1 1
Brazil 62 57 66 33 30 36 14 12 16 21 6.5 5.9 7.2 Brazil 218 201 236 41 36 47 67 55 15 12 51 12 179 37 28 8 96 25
Brunei Darussalam 12 12 13 10 9 10 10 9 11 4 0.9 0.4 1.5 Brunei Darussalam 0 0 0 0 0 0 13 11 11 9 9 8 0 0 6 5 0 0
Bulgaria 22 22 23 21 21 22 12 11 13 7 2.8 2.4 3.2 Bulgaria 3 3 3 1 1 1 25 19 13 10 18 10 2 1 12 6 1 0
Burkina Faso 202 189 216 186 173 200 98 78 121 67 3.2 2.3 4.1 Burkina Faso 79 73 85 64 51 80 210 194 103 92 103 64 40 43 40 27 16 18
Burundi 171 155 189 149 131 170 83 50 129 57 3.1 1.2 5.4 Burundi 45 41 51 35 21 55 181 161 89 77 103 55 28 24 46 30 12 13
Cabo Verde 63 61 65 35 34 36 26 24 28 21 3.8 3.5 4.2 Cabo Verde 1 1 1 0 0 0 67 58 28 23 48 22 1 0 22 11 0 0
Cambodia 118 109 127 111 102 121 38 21 70 39 4.9 2.2 7.4 Cambodia 40 37 44 14 8 26 125 109 42 33 86 33 28 12 38 18 12 7
Cameroon 136 127 146 151 139 165 95 58 148 45 1.6 -0.4 3.7 Cameroon 70 65 75 75 45 121 144 128 101 88 85 61 44 49 35 28 18 23
Canada 8 8 8 6 6 6 5 5 6 3 2.0 1.7 2.3 Canada 3 3 3 2 2 2 9 7 6 5 7 5 3 2 5 3 2 1
Central African Republic 177 160 196 174 156 194 139 100 195 59 1.0 -0.5 2.6 Central African Republic 20 18 23 21 15 31 184 170 145 132 115 96 13 15 48 43 6 7
Chad 215 199 232 191 175 207 148 108 199 72 1.6 0.3 3.0 Chad 61 56 66 82 59 114 224 205 155 140 116 89 33 50 48 40 14 23
Chile 19 19 20 11 11 11 8 7 10 6 3.7 2.8 4.6 Chile 6 6 6 2 2 2 21 17 9 7 16 7 5 2 8 5 2 1
China 54 50 59 37 35 39 13 11 15 18 6.3 5.6 7.0 China 1,644 1,509 1,803 236 205 273 56 52 14 12 42 11 1,315 203 25 8 772 143
Colombia 35 33 38 25 23 27 17 13 23 12 3.2 1.8 4.5 Colombia 32 29 34 15 11 21 39 31 19 15 29 15 26 13 19 10 17 9
Comoros 125 111 139 101 82 119 78 45 139 42 2.1 -0.6 4.5 Comoros 2 2 2 2 1 4 133 118 83 72 88 58 1 1 41 31 1 1
Congo 92 81 105 121 110 135 49 35 68 31 2.7 1.3 4.3 Congo 8 7 9 8 5 11 98 86 53 45 60 36 5 6 30 19 3 3
Cook Islands 24 22 27 17 15 19 9 6 12 8 4.4 2.9 6.0 Cook Islands 0 0 0 0 0 0 27 22 10 8 21 8 0 0 12 5 0 0
Costa Rica 17 17 17 13 13 13 10 8 12 6 2.5 1.4 3.5 Costa Rica 1 1 1 1 1 1 19 15 11 9 14 8 1 1 9 6 1 0
Côte d'Ivoire 152 141 162 146 134 159 100 83 121 51 1.8 1.0 2.6 Côte d'Ivoire 73 68 79 72 60 88 163 139 109 91 104 71 50 53 48 38 23 28
Croatia 13 13 13 8 8 9 5 4 5 4 4.5 4.1 5.0 Croatia 1 1 1 0 0 0 14 11 5 4 11 4 1 0 8 3 0 0
Cuba 13 13 14 8 8 9 6 5 7 4 3.3 2.8 3.9 Cuba 2 2 3 1 1 1 15 11 7 5 11 5 2 1 7 3 1 0
17

StatiStical table (continued)
country, regional and global estimates of under-five, infant and neonatal mortality
Country
Under-five mortality rate (U5MR) (deaths per 1,000 live births)
Country
Number of under-five deaths (thousands)
Sex-specific under-five mortality rate
(deaths per 1,000 live births)
Infant mortality
rate (deaths per 1,000 live
births)
Number of infant deaths
(thousands)
Neonatal mortality rate
(deaths per 1,000 live
births)
Number of neonatal deaths
(thousands)
1990 2000 2013Millennium
Development Goal
target for 2015
Annual rate of reduction (ARR) (percent)
1990–2013 1990 2013
U5MRLower bound
Upper bound U5MR
Lower bound
Upper bound U5MR
Lower bound
Upper bound ARR
Lower bound
Upper bound
Under-five
deathsLower bound
Upper bound
Under-five
deathsLower bound
Upper bound
1990 2013
Male Female Male Female 1990 2013 1990 2013 1990 2013 1990 2013
Cyprus 11 11 12 7 6 7 4 3 5 4 4.9 4.0 5.8 Cyprus 0 0 0 0 0 0 12 10 4 3 10 3 0 0 6 2 0 0
Czech Republic 15 14 15 7 6 7 4 3 4 5 6.1 5.6 6.5 Czech Republic 2 2 2 0 0 0 17 13 4 3 13 3 2 0 10 2 1 0
Democratic People's Republic of Korea 43 34 56 60 47 77 27 22 35 14 2.0 2.0 2.0
Democratic People's Republic of Korea 16 12 20 10 8 13 47 39 30 24 33 22 12 8 21 15 7 5
Democratic Republic of the Congo 176 160 193 176 160 193 119 82 167 59 1.7 0.3 3.3
Democratic Republic of the Congo 275 248 304 320 218 461 184 168 126 111 115 86 183 235 48 38 76 105
Denmark 9 9 9 6 5 6 4 3 4 3 4.1 3.4 4.6 Denmark 1 1 1 0 0 0 10 8 4 3 7 3 0 0 5 2 0 0
Djibouti 119 102 137 101 86 120 70 50 96 40 2.3 0.8 3.9 Djibouti 3 3 4 2 1 2 127 110 76 63 92 57 3 1 44 31 1 1
Dominica 17 16 19 16 14 18 11 8 16 6 1.8 0.3 3.3 Dominica 0 0 0 0 0 0 19 16 12 10 14 10 0 0 12 8 0 0
Dominican Republic 60 56 63 41 38 44 28 23 34 20 3.3 2.4 4.1 Dominican Republic 13 12 13 6 5 7 64 55 31 25 46 24 10 5 28 16 6 3
Ecuador 57 52 63 34 30 40 23 15 34 19 4.0 2.2 5.7 Ecuador 17 16 19 7 5 11 62 52 25 20 44 19 14 6 21 11 7 3
Egypt 85 81 89 45 42 48 22 21 23 28 5.9 5.7 6.2 Egypt 154 146 162 42 40 43 85 85 23 21 63 19 114 35 32 12 58 22
El Salvador 60 54 65 32 29 37 16 11 24 20 5.8 4.0 7.6 El Salvador 10 9 11 2 1 3 64 54 17 14 46 14 8 2 19 7 3 1
Equatorial Guinea 184 155 223 142 119 172 96 53 172 61 2.8 0.2 5.5 Equatorial Guinea 3 3 4 2 1 5 192 175 101 90 124 69 2 2 48 33 1 1
Eritrea 151 138 165 89 81 99 50 36 70 50 4.8 3.3 6.3 Eritrea 21 19 23 11 8 16 161 139 55 45 93 36 13 8 36 18 5 4
Estonia 20 20 21 11 11 12 3 3 4 7 7.7 7.1 8.5 Estonia 0 0 1 0 0 0 23 17 4 3 17 3 0 0 12 2 0 0
Ethiopia 205 190 221 146 134 158 64 48 84 68 5.0 3.9 6.4 Ethiopia 447 409 486 196 143 259 218 191 70 58 122 44 268 136 55 28 120 84
Fiji 30 25 35 24 23 26 24 21 26 10 1.0 0.2 1.9 Fiji 1 1 1 0 0 0 33 27 26 21 25 20 1 0 13 10 0 0
Finland 7 7 7 4 4 5 3 2 3 2 4.1 3.8 4.6 Finland 0 0 0 0 0 0 7 6 3 2 6 2 0 0 4 1 0 0
France 9 9 9 5 5 6 4 4 4 3 3.3 3.1 3.6 France 6 6 6 3 3 4 10 8 5 4 7 4 5 3 4 2 2 2
Gabon 93 81 107 85 73 99 56 43 73 31 2.2 0.9 3.5 Gabon 3 3 4 3 2 4 99 86 61 51 60 39 2 2 33 23 1 1
Gambia 170 152 191 119 105 135 74 51 106 57 3.6 2.1 5.2 Gambia 7 6 8 6 4 8 177 162 79 69 80 49 3 4 46 28 2 2
Georgia 47 43 53 36 32 41 13 11 16 16 5.6 4.7 6.4 Georgia 4 4 5 1 1 1 53 42 15 11 41 12 4 1 28 10 3 1
Germany 9 8 9 5 5 5 4 4 4 3 3.4 3.2 3.6 Germany 7 7 7 3 3 3 10 7 4 4 7 3 6 2 4 2 3 2
Ghana 128 121 136 101 95 108 78 60 102 43 2.1 1.0 3.3 Ghana 70 66 75 62 46 81 136 121 84 72 80 52 44 41 40 29 22 23
Greece 13 12 13 8 8 8 4 4 5 4 4.5 4.2 5.0 Greece 1 1 1 0 0 1 14 11 5 4 11 4 1 0 9 3 1 0
Grenada 22 21 24 16 15 17 12 9 15 7 2.7 1.6 4.0 Grenada 0 0 0 0 0 0 24 20 13 11 18 11 0 0 10 6 0 0
Guatemala 81 76 86 51 46 56 31 22 45 27 4.2 2.6 5.6 Guatemala 27 25 29 15 10 21 86 75 34 28 60 26 20 12 29 15 10 7
Guinea 238 223 254 170 159 183 101 82 123 79 3.7 2.9 4.6 Guinea 63 58 68 42 34 52 246 229 106 95 140 65 37 27 53 33 14 14
Guinea-Bissau 225 200 253 181 161 204 124 88 174 75 2.6 1.0 4.2 Guinea-Bissau 9 8 11 7 5 11 240 209 133 114 133 78 5 5 61 44 2 3
Guyana 61 55 68 49 44 55 37 25 54 20 2.2 0.5 4.0 Guyana 1 1 1 1 0 1 68 54 41 32 47 30 1 0 29 20 1 0
Haiti 145 136 155 104 97 113 73 62 87 48 3.0 2.2 3.7 Haiti 37 34 39 19 16 23 153 136 79 67 100 55 25 14 38 25 9 7
Holy See — — — — — — — — — — — — — Holy See — — — — — — — — — — — — — — — — — —
Honduras 59 55 63 38 35 41 22 18 27 20 4.3 3.4 5.1 Honduras 11 10 12 5 4 6 64 54 25 20 46 19 8 4 25 12 4 2
Hungary 19 19 20 11 11 12 6 6 7 6 4.9 4.5 5.4 Hungary 3 3 3 1 1 1 21 17 6 6 17 5 3 1 13 4 2 0
Iceland 6 6 7 4 4 5 2 2 3 2 4.8 3.5 6.1 Iceland 0 0 0 0 0 0 7 6 2 2 5 2 0 0 3 1 0 0
India 126 122 130 91 88 95 53 48 58 42 3.8 3.3 4.3 India 3,333 3,216 3,454 1,340 1,203 1,478 122 130 51 55 88 41 2,339 1,053 51 29 1,362 748
Indonesia 84 81 88 52 50 55 29 26 34 28 4.6 4.0 5.2 Indonesia 387 369 406 136 119 157 91 77 33 26 62 25 281 112 31 14 138 66
Iran (Islamic Republic of) 57 52 61 35 32 38 17 14 21 19 5.3 4.3 6.3 Iran (Islamic Republic of) 107 99 117 25 20 31 57 56 18 16 44 14 83 21 27 10 50 15
Iraq 53 49 58 45 41 49 34 28 42 18 2.0 1.0 2.9 Iraq 35 32 38 35 28 44 57 49 37 31 42 28 28 29 26 19 17 19
Ireland 9 9 10 7 7 7 4 4 4 3 3.8 3.4 4.1 Ireland 0 0 0 0 0 0 10 8 4 3 8 3 0 0 5 2 0 0
Israel 12 11 12 7 7 7 4 4 4 4 4.6 4.3 5.0 Israel 1 1 1 1 1 1 12 11 4 4 10 3 1 1 6 2 1 0
Italy 10 10 10 6 5 6 4 3 4 3 4.3 3.9 4.7 Italy 5 5 6 2 2 2 11 9 4 3 8 3 5 2 6 2 4 1
Jamaica 30 25 35 24 20 28 17 11 25 10 2.5 0.5 4.3 Jamaica 2 1 2 1 1 1 33 26 19 15 25 14 1 1 17 10 1 1
18

StatiStical table (continued)
country, regional and global estimates of under-five, infant and neonatal mortality
Country
Under-five mortality rate (U5MR) (deaths per 1,000 live births)
Country
Number of under-five deaths (thousands)
Sex-specific under-five mortality rate
(deaths per 1,000 live births)
Infant mortality
rate (deaths per 1,000 live
births)
Number of infant deaths
(thousands)
Neonatal mortality rate
(deaths per 1,000 live
births)
Number of neonatal deaths
(thousands)
1990 2000 2013Millennium
Development Goal
target for 2015
Annual rate of reduction (ARR) (percent)
1990–2013 1990 2013
U5MRLower bound
Upper bound U5MR
Lower bound
Upper bound U5MR
Lower bound
Upper bound ARR
Lower bound
Upper bound
Under-five
deathsLower bound
Upper bound
Under-five
deathsLower bound
Upper bound
1990 2013
Male Female Male Female 1990 2013 1990 2013 1990 2013 1990 2013
Cyprus 11 11 12 7 6 7 4 3 5 4 4.9 4.0 5.8 Cyprus 0 0 0 0 0 0 12 10 4 3 10 3 0 0 6 2 0 0
Czech Republic 15 14 15 7 6 7 4 3 4 5 6.1 5.6 6.5 Czech Republic 2 2 2 0 0 0 17 13 4 3 13 3 2 0 10 2 1 0
Democratic People's Republic of Korea 43 34 56 60 47 77 27 22 35 14 2.0 2.0 2.0
Democratic People's Republic of Korea 16 12 20 10 8 13 47 39 30 24 33 22 12 8 21 15 7 5
Democratic Republic of the Congo 176 160 193 176 160 193 119 82 167 59 1.7 0.3 3.3
Democratic Republic of the Congo 275 248 304 320 218 461 184 168 126 111 115 86 183 235 48 38 76 105
Denmark 9 9 9 6 5 6 4 3 4 3 4.1 3.4 4.6 Denmark 1 1 1 0 0 0 10 8 4 3 7 3 0 0 5 2 0 0
Djibouti 119 102 137 101 86 120 70 50 96 40 2.3 0.8 3.9 Djibouti 3 3 4 2 1 2 127 110 76 63 92 57 3 1 44 31 1 1
Dominica 17 16 19 16 14 18 11 8 16 6 1.8 0.3 3.3 Dominica 0 0 0 0 0 0 19 16 12 10 14 10 0 0 12 8 0 0
Dominican Republic 60 56 63 41 38 44 28 23 34 20 3.3 2.4 4.1 Dominican Republic 13 12 13 6 5 7 64 55 31 25 46 24 10 5 28 16 6 3
Ecuador 57 52 63 34 30 40 23 15 34 19 4.0 2.2 5.7 Ecuador 17 16 19 7 5 11 62 52 25 20 44 19 14 6 21 11 7 3
Egypt 85 81 89 45 42 48 22 21 23 28 5.9 5.7 6.2 Egypt 154 146 162 42 40 43 85 85 23 21 63 19 114 35 32 12 58 22
El Salvador 60 54 65 32 29 37 16 11 24 20 5.8 4.0 7.6 El Salvador 10 9 11 2 1 3 64 54 17 14 46 14 8 2 19 7 3 1
Equatorial Guinea 184 155 223 142 119 172 96 53 172 61 2.8 0.2 5.5 Equatorial Guinea 3 3 4 2 1 5 192 175 101 90 124 69 2 2 48 33 1 1
Eritrea 151 138 165 89 81 99 50 36 70 50 4.8 3.3 6.3 Eritrea 21 19 23 11 8 16 161 139 55 45 93 36 13 8 36 18 5 4
Estonia 20 20 21 11 11 12 3 3 4 7 7.7 7.1 8.5 Estonia 0 0 1 0 0 0 23 17 4 3 17 3 0 0 12 2 0 0
Ethiopia 205 190 221 146 134 158 64 48 84 68 5.0 3.9 6.4 Ethiopia 447 409 486 196 143 259 218 191 70 58 122 44 268 136 55 28 120 84
Fiji 30 25 35 24 23 26 24 21 26 10 1.0 0.2 1.9 Fiji 1 1 1 0 0 0 33 27 26 21 25 20 1 0 13 10 0 0
Finland 7 7 7 4 4 5 3 2 3 2 4.1 3.8 4.6 Finland 0 0 0 0 0 0 7 6 3 2 6 2 0 0 4 1 0 0
France 9 9 9 5 5 6 4 4 4 3 3.3 3.1 3.6 France 6 6 6 3 3 4 10 8 5 4 7 4 5 3 4 2 2 2
Gabon 93 81 107 85 73 99 56 43 73 31 2.2 0.9 3.5 Gabon 3 3 4 3 2 4 99 86 61 51 60 39 2 2 33 23 1 1
Gambia 170 152 191 119 105 135 74 51 106 57 3.6 2.1 5.2 Gambia 7 6 8 6 4 8 177 162 79 69 80 49 3 4 46 28 2 2
Georgia 47 43 53 36 32 41 13 11 16 16 5.6 4.7 6.4 Georgia 4 4 5 1 1 1 53 42 15 11 41 12 4 1 28 10 3 1
Germany 9 8 9 5 5 5 4 4 4 3 3.4 3.2 3.6 Germany 7 7 7 3 3 3 10 7 4 4 7 3 6 2 4 2 3 2
Ghana 128 121 136 101 95 108 78 60 102 43 2.1 1.0 3.3 Ghana 70 66 75 62 46 81 136 121 84 72 80 52 44 41 40 29 22 23
Greece 13 12 13 8 8 8 4 4 5 4 4.5 4.2 5.0 Greece 1 1 1 0 0 1 14 11 5 4 11 4 1 0 9 3 1 0
Grenada 22 21 24 16 15 17 12 9 15 7 2.7 1.6 4.0 Grenada 0 0 0 0 0 0 24 20 13 11 18 11 0 0 10 6 0 0
Guatemala 81 76 86 51 46 56 31 22 45 27 4.2 2.6 5.6 Guatemala 27 25 29 15 10 21 86 75 34 28 60 26 20 12 29 15 10 7
Guinea 238 223 254 170 159 183 101 82 123 79 3.7 2.9 4.6 Guinea 63 58 68 42 34 52 246 229 106 95 140 65 37 27 53 33 14 14
Guinea-Bissau 225 200 253 181 161 204 124 88 174 75 2.6 1.0 4.2 Guinea-Bissau 9 8 11 7 5 11 240 209 133 114 133 78 5 5 61 44 2 3
Guyana 61 55 68 49 44 55 37 25 54 20 2.2 0.5 4.0 Guyana 1 1 1 1 0 1 68 54 41 32 47 30 1 0 29 20 1 0
Haiti 145 136 155 104 97 113 73 62 87 48 3.0 2.2 3.7 Haiti 37 34 39 19 16 23 153 136 79 67 100 55 25 14 38 25 9 7
Holy See — — — — — — — — — — — — — Holy See — — — — — — — — — — — — — — — — — —
Honduras 59 55 63 38 35 41 22 18 27 20 4.3 3.4 5.1 Honduras 11 10 12 5 4 6 64 54 25 20 46 19 8 4 25 12 4 2
Hungary 19 19 20 11 11 12 6 6 7 6 4.9 4.5 5.4 Hungary 3 3 3 1 1 1 21 17 6 6 17 5 3 1 13 4 2 0
Iceland 6 6 7 4 4 5 2 2 3 2 4.8 3.5 6.1 Iceland 0 0 0 0 0 0 7 6 2 2 5 2 0 0 3 1 0 0
India 126 122 130 91 88 95 53 48 58 42 3.8 3.3 4.3 India 3,333 3,216 3,454 1,340 1,203 1,478 122 130 51 55 88 41 2,339 1,053 51 29 1,362 748
Indonesia 84 81 88 52 50 55 29 26 34 28 4.6 4.0 5.2 Indonesia 387 369 406 136 119 157 91 77 33 26 62 25 281 112 31 14 138 66
Iran (Islamic Republic of) 57 52 61 35 32 38 17 14 21 19 5.3 4.3 6.3 Iran (Islamic Republic of) 107 99 117 25 20 31 57 56 18 16 44 14 83 21 27 10 50 15
Iraq 53 49 58 45 41 49 34 28 42 18 2.0 1.0 2.9 Iraq 35 32 38 35 28 44 57 49 37 31 42 28 28 29 26 19 17 19
Ireland 9 9 10 7 7 7 4 4 4 3 3.8 3.4 4.1 Ireland 0 0 0 0 0 0 10 8 4 3 8 3 0 0 5 2 0 0
Israel 12 11 12 7 7 7 4 4 4 4 4.6 4.3 5.0 Israel 1 1 1 1 1 1 12 11 4 4 10 3 1 1 6 2 1 0
Italy 10 10 10 6 5 6 4 3 4 3 4.3 3.9 4.7 Italy 5 5 6 2 2 2 11 9 4 3 8 3 5 2 6 2 4 1
Jamaica 30 25 35 24 20 28 17 11 25 10 2.5 0.5 4.3 Jamaica 2 1 2 1 1 1 33 26 19 15 25 14 1 1 17 10 1 1
19

StatiStical table (continued)
country, regional and global estimates of under-five, infant and neonatal mortality
Country
Under-five mortality rate (U5MR) (deaths per 1,000 live births)
Country
Number of under-five deaths (thousands)
Sex-specific under-five mortality rate
(deaths per 1,000 live births)
Infant mortality
rate (deaths per 1,000 live
births)
Number of infant deaths
(thousands)
Neonatal mortality rate
(deaths per 1,000 live
births)
Number of neonatal deaths
(thousands)
1990 2000 2013Millennium
Development Goal
target for 2015
Annual rate of reduction (ARR) (percent)
1990–2013 1990 2013
U5MRLower bound
Upper bound U5MR
Lower bound
Upper bound U5MR
Lower bound
Upper bound ARR
Lower bound
Upper bound
Under-five
deathsLower bound
Upper bound
Under-five
deathsLower bound
Upper bound
1990 2013
Male Female Male Female 1990 2013 1990 2013 1990 2013 1990 2013
Japan 6 6 6 5 4 5 3 3 3 2 3.4 3.3 3.6 Japan 8 8 8 3 3 3 7 6 3 3 5 2 5 2 3 1 3 1
Jordan 37 34 39 28 26 30 19 16 23 12 2.9 2.1 3.8 Jordan 4 4 4 4 3 4 38 35 20 18 30 16 3 3 19 11 2 2
Kazakhstan 53 48 58 44 40 48 16 15 18 18 5.1 4.6 5.6 Kazakhstan 21 19 23 5 5 6 59 46 19 14 45 15 18 5 23 9 9 3
Kenya 99 93 105 111 102 121 71 47 106 33 1.5 -0.3 3.2 Kenya 96 90 103 106 70 162 104 93 75 66 64 48 63 71 33 26 32 40
Kiribati 95 82 111 71 61 82 58 40 85 32 2.1 0.4 3.9 Kiribati 0 0 0 0 0 0 101 89 63 53 69 45 0 0 30 22 0 0
Kuwait 17 16 17 13 12 13 10 9 10 6 2.5 2.1 2.8 Kuwait 1 1 1 1 1 1 18 15 10 9 14 8 1 1 9 5 0 0
Kyrgyzstan 66 58 74 49 44 54 24 23 26 22 4.3 3.8 4.9 Kyrgyzstan 9 8 10 4 3 4 71 60 27 21 55 22 8 3 28 13 4 2
Lao People's Democratic Republic 162 147 179 117 106 131 71 56 90 54 3.6 2.5 4.7
Lao People's Democratic Republic 28 26 32 13 10 17 172 152 77 65 111 54 20 10 48 29 9 5
Latvia 20 20 21 17 16 18 8 7 10 7 3.9 3.2 4.6 Latvia 1 1 1 0 0 0 23 18 9 8 17 7 1 0 13 5 1 0
Lebanon 32 29 36 20 17 24 9 5 15 11 5.5 3.4 7.8 Lebanon 2 2 2 1 0 1 34 31 10 9 27 8 2 1 16 5 1 0
Lesotho 86 78 95 115 105 125 98 72 137 29 -0.6 -2.1 0.9 Lesotho 5 4 5 6 4 8 93 79 105 91 70 73 4 4 45 44 2 3
Liberia 248 226 272 175 160 193 71 51 99 83 5.4 4.0 6.9 Liberia 23 20 25 10 7 15 260 235 76 66 165 54 15 8 52 26 5 4
Libya 42 36 50 28 27 30 15 12 19 14 4.7 3.4 5.9 Libya 5 4 6 2 1 2 46 39 16 13 36 12 4 2 21 9 2 1
Liechtenstein — — — — — — — — — — — — — Liechtenstein — — — — — — — — — — — — — — — — — —
Lithuania 17 16 17 12 11 12 5 4 6 6 5.3 4.8 5.8 Lithuania 1 1 1 0 0 0 18 15 5 4 13 4 1 0 9 3 1 0
Luxembourg 9 8 10 5 4 5 2 2 3 3 6.4 5.1 7.5 Luxembourg 0 0 0 0 0 0 10 8 2 2 7 2 0 0 4 1 0 0
Madagascar 161 150 172 111 101 121 56 38 82 54 4.6 2.9 6.3 Madagascar 82 76 88 43 29 64 168 153 60 52 98 40 52 31 41 21 22 17
Malawi 245 231 260 174 163 186 68 52 90 82 5.6 4.4 6.8 Malawi 103 97 111 41 31 55 255 235 72 63 143 44 61 27 50 23 21 14
Malaysia 17 16 17 10 10 10 9 7 10 6 2.9 2.3 3.6 Malaysia 8 8 8 5 4 5 18 15 9 8 14 7 7 4 8 4 4 2
Maldives 94 85 103 44 40 48 10 9 11 31 9.8 9.0 10.5 Maldives 1 1 1 0 0 0 99 88 11 9 68 8 1 0 36 6 0 0
Mali 254 238 272 220 204 238 123 85 175 85 3.2 1.7 4.8 Mali 91 84 98 82 56 120 263 245 129 117 131 78 47 53 59 40 21 28
Malta 11 11 12 8 7 9 6 5 8 4 2.7 1.8 3.6 Malta 0 0 0 0 0 0 12 10 7 6 10 5 0 0 7 4 0 0
Marshall Islands 50 42 58 42 35 49 38 29 49 17 1.2 -0.2 2.6 Marshall Islands 0 0 0 0 0 0 54 45 42 33 39 31 0 0 20 16 0 0
Mauritania 118 106 130 113 101 128 90 57 145 39 1.2 -1.0 3.2 Mauritania 9 8 10 12 7 19 127 108 98 82 78 67 6 9 41 35 3 4
Mauritius 23 22 24 19 18 20 14 13 16 8 2.1 1.6 2.5 Mauritius 0 0 0 0 0 0 26 20 16 13 20 13 0 0 16 9 0 0
Mexico 46 42 51 26 24 28 15 14 15 15 5.1 4.6 5.5 Mexico 112 102 124 33 31 34 50 43 16 13 37 13 90 28 17 7 41 15
Micronesia (Federated States of) 55 45 68 53 37 77 36 18 76 18 1.8 -1.2 4.7 Micronesia (Federated States of) 0 0 0 0 0 0 60 51 40 33 43 30 0 0 22 16 0 0
Monaco 8 7 9 5 5 6 4 3 4 3 3.2 2.4 4.0 Monaco 0 0 0 0 0 0 9 7 4 3 6 3 0 0 4 2 0 0
Mongolia 108 99 117 65 58 72 32 21 47 36 5.3 3.6 7.0 Mongolia 8 7 9 2 1 3 123 92 38 26 77 26 6 2 31 13 2 1
Montenegro 17 16 18 14 13 15 5 5 6 6 5.0 4.2 5.7 Montenegro 0 0 0 0 0 0 18 16 6 5 15 5 0 0 11 4 0 0
Morocco 81 76 86 51 47 55 30 25 37 27 4.2 3.4 5.1 Morocco 57 53 61 24 20 29 86 76 34 27 64 26 44 21 36 18 25 14
Mozambique 237 220 257 169 157 182 87 73 106 79 4.3 3.5 5.1 Mozambique 135 124 148 83 69 101 246 228 92 82 158 62 89 59 56 30 32 29
Myanmar 109 99 121 80 73 87 51 36 68 36 3.3 1.9 4.9 Myanmar 119 108 134 46 33 63 116 101 55 45 78 40 82 36 42 26 45 23
Namibia 74 67 80 76 69 83 50 40 64 25 1.7 0.5 2.8 Namibia 4 3 4 3 2 4 78 69 54 46 50 35 3 2 29 22 2 1
Nauru 58 36 93 41 35 49 37 24 54 19 2.0 -0.9 4.9 Nauru 0 0 0 0 0 0 62 53 40 33 45 30 0 0 28 20 0 0
Nepal 142 133 152 82 76 88 40 31 52 47 5.6 4.4 6.7 Nepal 95 89 103 23 17 30 143 142 42 37 99 32 67 18 53 23 36 13
Netherlands 8 8 9 6 6 6 4 4 4 3 3.2 2.9 3.4 Netherlands 2 2 2 1 1 1 9 7 4 4 7 3 1 1 5 3 1 0
New Zealand 11 11 12 7 7 8 6 6 7 4 2.5 1.9 3.1 New Zealand 1 1 1 0 0 0 12 10 7 6 9 5 1 0 4 3 0 0
Nicaragua 67 62 72 40 37 44 24 16 36 22 4.5 2.7 6.3 Nicaragua 10 9 11 3 2 5 72 61 26 21 51 20 7 3 25 12 4 2
Niger 327 308 348 227 212 244 104 82 130 109 5.0 4.0 6.0 Niger 129 120 140 86 68 109 332 323 108 100 138 60 54 51 50 28 19 24
Nigeria 213 200 227 188 176 200 117 96 142 71 2.6 1.8 3.4 Nigeria 852 792 915 804 653 986 224 202 124 111 126 74 503 518 52 37 206 262
Niue 14 9 20 23 15 36 25 12 52 5 -2.5 -6.1 1.0 Niue 0 0 0 0 0 0 15 12 27 22 12 21 0 0 7 12 0 0
Norway 9 8 9 5 5 5 3 3 3 3 4.9 4.4 5.5 Norway 1 0 1 0 0 0 10 8 3 2 7 2 0 0 4 2 0 0
20

StatiStical table (continued)
country, regional and global estimates of under-five, infant and neonatal mortality
Country
Under-five mortality rate (U5MR) (deaths per 1,000 live births)
Country
Number of under-five deaths (thousands)
Sex-specific under-five mortality rate
(deaths per 1,000 live births)
Infant mortality
rate (deaths per 1,000 live
births)
Number of infant deaths
(thousands)
Neonatal mortality rate
(deaths per 1,000 live
births)
Number of neonatal deaths
(thousands)
1990 2000 2013Millennium
Development Goal
target for 2015
Annual rate of reduction (ARR) (percent)
1990–2013 1990 2013
U5MRLower bound
Upper bound U5MR
Lower bound
Upper bound U5MR
Lower bound
Upper bound ARR
Lower bound
Upper bound
Under-five
deathsLower bound
Upper bound
Under-five
deathsLower bound
Upper bound
1990 2013
Male Female Male Female 1990 2013 1990 2013 1990 2013 1990 2013
Japan 6 6 6 5 4 5 3 3 3 2 3.4 3.3 3.6 Japan 8 8 8 3 3 3 7 6 3 3 5 2 5 2 3 1 3 1
Jordan 37 34 39 28 26 30 19 16 23 12 2.9 2.1 3.8 Jordan 4 4 4 4 3 4 38 35 20 18 30 16 3 3 19 11 2 2
Kazakhstan 53 48 58 44 40 48 16 15 18 18 5.1 4.6 5.6 Kazakhstan 21 19 23 5 5 6 59 46 19 14 45 15 18 5 23 9 9 3
Kenya 99 93 105 111 102 121 71 47 106 33 1.5 -0.3 3.2 Kenya 96 90 103 106 70 162 104 93 75 66 64 48 63 71 33 26 32 40
Kiribati 95 82 111 71 61 82 58 40 85 32 2.1 0.4 3.9 Kiribati 0 0 0 0 0 0 101 89 63 53 69 45 0 0 30 22 0 0
Kuwait 17 16 17 13 12 13 10 9 10 6 2.5 2.1 2.8 Kuwait 1 1 1 1 1 1 18 15 10 9 14 8 1 1 9 5 0 0
Kyrgyzstan 66 58 74 49 44 54 24 23 26 22 4.3 3.8 4.9 Kyrgyzstan 9 8 10 4 3 4 71 60 27 21 55 22 8 3 28 13 4 2
Lao People's Democratic Republic 162 147 179 117 106 131 71 56 90 54 3.6 2.5 4.7
Lao People's Democratic Republic 28 26 32 13 10 17 172 152 77 65 111 54 20 10 48 29 9 5
Latvia 20 20 21 17 16 18 8 7 10 7 3.9 3.2 4.6 Latvia 1 1 1 0 0 0 23 18 9 8 17 7 1 0 13 5 1 0
Lebanon 32 29 36 20 17 24 9 5 15 11 5.5 3.4 7.8 Lebanon 2 2 2 1 0 1 34 31 10 9 27 8 2 1 16 5 1 0
Lesotho 86 78 95 115 105 125 98 72 137 29 -0.6 -2.1 0.9 Lesotho 5 4 5 6 4 8 93 79 105 91 70 73 4 4 45 44 2 3
Liberia 248 226 272 175 160 193 71 51 99 83 5.4 4.0 6.9 Liberia 23 20 25 10 7 15 260 235 76 66 165 54 15 8 52 26 5 4
Libya 42 36 50 28 27 30 15 12 19 14 4.7 3.4 5.9 Libya 5 4 6 2 1 2 46 39 16 13 36 12 4 2 21 9 2 1
Liechtenstein — — — — — — — — — — — — — Liechtenstein — — — — — — — — — — — — — — — — — —
Lithuania 17 16 17 12 11 12 5 4 6 6 5.3 4.8 5.8 Lithuania 1 1 1 0 0 0 18 15 5 4 13 4 1 0 9 3 1 0
Luxembourg 9 8 10 5 4 5 2 2 3 3 6.4 5.1 7.5 Luxembourg 0 0 0 0 0 0 10 8 2 2 7 2 0 0 4 1 0 0
Madagascar 161 150 172 111 101 121 56 38 82 54 4.6 2.9 6.3 Madagascar 82 76 88 43 29 64 168 153 60 52 98 40 52 31 41 21 22 17
Malawi 245 231 260 174 163 186 68 52 90 82 5.6 4.4 6.8 Malawi 103 97 111 41 31 55 255 235 72 63 143 44 61 27 50 23 21 14
Malaysia 17 16 17 10 10 10 9 7 10 6 2.9 2.3 3.6 Malaysia 8 8 8 5 4 5 18 15 9 8 14 7 7 4 8 4 4 2
Maldives 94 85 103 44 40 48 10 9 11 31 9.8 9.0 10.5 Maldives 1 1 1 0 0 0 99 88 11 9 68 8 1 0 36 6 0 0
Mali 254 238 272 220 204 238 123 85 175 85 3.2 1.7 4.8 Mali 91 84 98 82 56 120 263 245 129 117 131 78 47 53 59 40 21 28
Malta 11 11 12 8 7 9 6 5 8 4 2.7 1.8 3.6 Malta 0 0 0 0 0 0 12 10 7 6 10 5 0 0 7 4 0 0
Marshall Islands 50 42 58 42 35 49 38 29 49 17 1.2 -0.2 2.6 Marshall Islands 0 0 0 0 0 0 54 45 42 33 39 31 0 0 20 16 0 0
Mauritania 118 106 130 113 101 128 90 57 145 39 1.2 -1.0 3.2 Mauritania 9 8 10 12 7 19 127 108 98 82 78 67 6 9 41 35 3 4
Mauritius 23 22 24 19 18 20 14 13 16 8 2.1 1.6 2.5 Mauritius 0 0 0 0 0 0 26 20 16 13 20 13 0 0 16 9 0 0
Mexico 46 42 51 26 24 28 15 14 15 15 5.1 4.6 5.5 Mexico 112 102 124 33 31 34 50 43 16 13 37 13 90 28 17 7 41 15
Micronesia (Federated States of) 55 45 68 53 37 77 36 18 76 18 1.8 -1.2 4.7 Micronesia (Federated States of) 0 0 0 0 0 0 60 51 40 33 43 30 0 0 22 16 0 0
Monaco 8 7 9 5 5 6 4 3 4 3 3.2 2.4 4.0 Monaco 0 0 0 0 0 0 9 7 4 3 6 3 0 0 4 2 0 0
Mongolia 108 99 117 65 58 72 32 21 47 36 5.3 3.6 7.0 Mongolia 8 7 9 2 1 3 123 92 38 26 77 26 6 2 31 13 2 1
Montenegro 17 16 18 14 13 15 5 5 6 6 5.0 4.2 5.7 Montenegro 0 0 0 0 0 0 18 16 6 5 15 5 0 0 11 4 0 0
Morocco 81 76 86 51 47 55 30 25 37 27 4.2 3.4 5.1 Morocco 57 53 61 24 20 29 86 76 34 27 64 26 44 21 36 18 25 14
Mozambique 237 220 257 169 157 182 87 73 106 79 4.3 3.5 5.1 Mozambique 135 124 148 83 69 101 246 228 92 82 158 62 89 59 56 30 32 29
Myanmar 109 99 121 80 73 87 51 36 68 36 3.3 1.9 4.9 Myanmar 119 108 134 46 33 63 116 101 55 45 78 40 82 36 42 26 45 23
Namibia 74 67 80 76 69 83 50 40 64 25 1.7 0.5 2.8 Namibia 4 3 4 3 2 4 78 69 54 46 50 35 3 2 29 22 2 1
Nauru 58 36 93 41 35 49 37 24 54 19 2.0 -0.9 4.9 Nauru 0 0 0 0 0 0 62 53 40 33 45 30 0 0 28 20 0 0
Nepal 142 133 152 82 76 88 40 31 52 47 5.6 4.4 6.7 Nepal 95 89 103 23 17 30 143 142 42 37 99 32 67 18 53 23 36 13
Netherlands 8 8 9 6 6 6 4 4 4 3 3.2 2.9 3.4 Netherlands 2 2 2 1 1 1 9 7 4 4 7 3 1 1 5 3 1 0
New Zealand 11 11 12 7 7 8 6 6 7 4 2.5 1.9 3.1 New Zealand 1 1 1 0 0 0 12 10 7 6 9 5 1 0 4 3 0 0
Nicaragua 67 62 72 40 37 44 24 16 36 22 4.5 2.7 6.3 Nicaragua 10 9 11 3 2 5 72 61 26 21 51 20 7 3 25 12 4 2
Niger 327 308 348 227 212 244 104 82 130 109 5.0 4.0 6.0 Niger 129 120 140 86 68 109 332 323 108 100 138 60 54 51 50 28 19 24
Nigeria 213 200 227 188 176 200 117 96 142 71 2.6 1.8 3.4 Nigeria 852 792 915 804 653 986 224 202 124 111 126 74 503 518 52 37 206 262
Niue 14 9 20 23 15 36 25 12 52 5 -2.5 -6.1 1.0 Niue 0 0 0 0 0 0 15 12 27 22 12 21 0 0 7 12 0 0
Norway 9 8 9 5 5 5 3 3 3 3 4.9 4.4 5.5 Norway 1 0 1 0 0 0 10 8 3 2 7 2 0 0 4 2 0 0
21

StatiStical table (continued)
country, regional and global estimates of under-five, infant and neonatal mortality
Country
Under-five mortality rate (U5MR) (deaths per 1,000 live births)
Country
Number of under-five deaths (thousands)
Sex-specific under-five mortality rate
(deaths per 1,000 live births)
Infant mortality
rate (deaths per 1,000 live
births)
Number of infant deaths
(thousands)
Neonatal mortality rate
(deaths per 1,000 live
births)
Number of neonatal deaths
(thousands)
1990 2000 2013Millennium
Development Goal
target for 2015
Annual rate of reduction (ARR) (percent)
1990–2013 1990 2013
U5MRLower bound
Upper bound U5MR
Lower bound
Upper bound U5MR
Lower bound
Upper bound ARR
Lower bound
Upper bound
Under-five
deathsLower bound
Upper bound
Under-five
deathsLower bound
Upper bound
1990 2013
Male Female Male Female 1990 2013 1990 2013 1990 2013 1990 2013
Oman 39 35 45 17 15 19 11 11 12 13 5.4 4.7 6.0 Oman 3 2 3 1 1 1 43 36 12 10 32 10 2 1 19 7 1 1
Pakistan 139 134 144 113 108 118 86 73 101 46 2.1 1.4 2.8 Pakistan 620 596 646 394 333 470 141 136 89 82 106 69 480 316 56 42 255 194
Palau 36 31 42 27 23 31 18 10 30 12 3.1 0.7 5.6 Palau 0 0 0 0 0 0 40 32 19 16 31 15 0 0 16 9 0 0
Panama 31 27 35 26 22 30 18 12 27 10 2.4 0.5 4.2 Panama 2 2 2 1 1 2 34 28 20 16 26 15 2 1 13 8 1 1
Papua New Guinea 89 80 99 78 68 91 61 40 94 30 1.6 -0.3 3.5 Papua New Guinea 12 11 14 13 8 20 94 83 66 57 65 47 9 10 31 24 4 5
Paraguay 46 42 51 34 29 39 22 15 32 15 3.2 1.6 4.9 Paraguay 6 6 7 3 2 5 50 42 24 20 37 19 5 3 22 12 3 2
Peru 80 76 84 40 37 43 17 13 21 27 6.8 5.7 7.9 Peru 52 49 55 10 8 13 84 76 18 15 57 13 37 8 26 8 17 5
Philippines 59 55 63 40 37 43 30 24 38 20 2.9 1.8 4.0 Philippines 119 111 128 71 56 91 64 53 33 26 41 24 85 56 23 14 46 33
Poland 17 17 18 9 9 10 5 5 5 6 5.2 5.0 5.4 Poland 9 9 9 2 2 2 19 15 6 5 15 5 8 2 11 3 6 1
Portugal 15 14 15 7 7 7 4 3 4 5 5.9 5.5 6.4 Portugal 2 2 2 0 0 0 16 13 4 3 12 3 1 0 7 2 1 0
Qatar 21 19 22 12 12 13 8 8 9 7 4.0 3.6 4.5 Qatar 0 0 0 0 0 0 23 19 9 7 18 7 0 0 10 4 0 0
Republic of Korea 7 7 7 6 6 6 4 4 4 2 2.8 2.6 3.0 Republic of Korea 4 4 4 2 2 2 7 7 4 3 6 3 3 2 3 2 2 1
Republic of Moldova 32 27 39 31 25 37 15 12 23 11 3.2 1.4 4.7 Republic of Moldova 3 2 3 1 0 1 36 29 17 14 27 13 2 1 14 8 1 0
Romania 38 37 38 27 27 28 12 11 13 13 5.0 4.8 5.2 Romania 16 16 17 3 3 3 42 34 13 11 31 11 14 2 17 7 7 2
Russian Federation 26 26 27 23 23 24 10 9 11 9 4.1 3.6 4.6 Russian Federation 59 58 60 17 15 19 30 22 11 9 22 9 49 14 15 5 33 9
Rwanda 152 143 162 182 170 195 52 38 73 51 4.7 3.2 6.0 Rwanda 50 46 53 22 16 31 160 144 56 48 93 37 31 16 39 20 13 9
Saint Kitts and Nevis 29 26 31 18 16 20 10 6 17 10 4.5 2.2 6.7 Saint Kitts and Nevis 0 0 0 0 0 0 31 26 11 9 23 8 0 0 17 7 0 0
Saint Lucia 23 21 24 18 17 19 15 13 17 8 1.9 1.2 2.6 Saint Lucia 0 0 0 0 0 0 25 20 16 13 19 13 0 0 13 9 0 0
Saint Vincent and the Grenadines 25 23 27 22 21 24 19 16 22 8 1.1 0.4 1.9 Saint Vincent and the Grenadines 0 0 0 0 0 0 27 22 21 17 21 17 0 0 15 12 0 0
Samoa 31 27 35 22 19 25 18 13 23 10 2.3 1.1 3.8 Samoa 0 0 0 0 0 0 34 28 20 16 26 16 0 0 12 8 0 0
San Marino 11 9 14 6 4 8 3 2 6 4 5.5 2.4 8.5 San Marino 0 0 0 0 0 0 12 10 3 3 10 3 0 0 4 1 0 0
Sao Tome and Principe 110 97 125 89 76 105 51 33 80 37 3.4 1.3 5.3 Sao Tome and Principe 0 0 1 0 0 1 117 104 55 47 70 37 0 0 32 19 0 0
Saudi Arabia 44 35 55 23 20 26 16 10 26 15 4.5 2.1 6.7 Saudi Arabia 24 19 30 9 5 14 46 41 17 14 35 13 19 7 21 9 11 5
Senegal 141 134 149 137 128 146 55 43 71 47 4.1 3.0 5.2 Senegal 44 42 47 29 22 37 148 134 60 50 71 44 22 23 42 23 13 12
Serbia 28 27 29 13 12 13 7 6 8 9 6.3 5.7 6.7 Serbia 4 4 4 1 1 1 30 26 7 6 24 6 4 1 17 4 3 0
Seychelles 17 15 18 14 13 16 14 12 17 6 0.7 -0.2 1.6 Seychelles 0 0 0 0 0 0 18 15 15 13 14 12 0 0 10 9 0 0
Sierra Leone 268 246 291 232 214 252 161 131 193 89 2.2 1.3 3.2 Sierra Leone 46 42 51 34 27 42 280 255 169 152 158 107 27 23 57 44 10 9
Singapore 8 7 8 4 4 4 3 3 3 3 4.4 3.9 4.9 Singapore 0 0 0 0 0 0 8 7 3 3 6 2 0 0 4 1 0 0
Slovakia 18 17 18 12 12 12 7 7 8 6 3.9 3.6 4.2 Slovakia 1 1 2 0 0 0 20 15 8 6 16 6 1 0 12 4 1 0
Slovenia 10 10 11 6 5 6 3 3 3 3 5.6 4.8 6.2 Slovenia 0 0 0 0 0 0 11 9 3 3 9 2 0 0 5 2 0 0
Solomon Islands 39 33 45 34 29 41 30 19 50 13 1.1 -1.2 3.3 Solomon Islands 0 0 1 1 0 1 42 35 33 27 32 25 0 0 16 13 0 0
Somalia 180 149 219 174 137 226 146 91 237 60 0.9 -0.9 2.7 Somalia 50 41 63 65 39 112 187 172 152 139 108 90 31 40 52 46 15 21
South Africa 61 54 69 74 67 84 44 35 55 20 1.4 0.2 2.6 South Africa 65 57 74 47 38 60 67 55 48 39 47 33 50 35 20 15 22 16
South Sudan 253 211 296 183 157 213 99 67 143 84 4.1 2.3 5.9 South Sudan 67 54 80 39 26 57 263 242 104 94 150 64 40 25 65 39 17 16
Spain 11 11 11 7 6 7 4 4 5 4 4.2 3.9 4.5 Spain 5 4 5 2 2 2 12 10 4 4 9 4 4 2 7 3 3 1
Sri Lanka 21 21 22 16 16 17 10 8 11 7 3.5 2.8 4.1 Sri Lanka 7 7 7 4 3 4 23 19 10 9 18 8 6 3 12 6 4 2
State of Palestine 43 40 47 30 27 33 22 16 31 14 3.0 1.4 4.5 State of Palestine 4 3 4 3 2 4 46 41 24 20 35 19 3 2 21 12 2 2
Sudan 128 119 138 108 98 118 77 61 95 43 2.2 1.3 3.3 Sudan 101 93 109 94 74 117 135 121 81 71 80 51 64 63 41 30 33 37
Suriname 48 40 56 35 28 45 23 12 42 16 3.2 0.5 5.9 Suriname 0 0 0 0 0 0 53 43 25 20 41 20 0 0 22 12 0 0
Swaziland 74 64 85 123 111 136 80 55 115 25 -0.3 -1.9 1.2 Swaziland 3 2 3 3 2 4 79 68 85 75 55 56 2 2 30 30 1 1
Sweden 7 7 7 4 4 4 3 3 3 2 3.6 3.3 3.9 Sweden 1 1 1 0 0 0 8 6 3 3 6 2 1 0 4 2 0 0
Switzerland 8 8 9 6 6 6 4 4 5 3 2.9 2.4 3.4 Switzerland 1 1 1 0 0 0 9 7 5 4 7 4 1 0 4 3 0 0
Syrian Arab Republic 37 34 40 23 22 25 15 12 19 12 4.1 2.9 5.2 Syrian Arab Republic 17 15 18 8 6 10 40 34 16 13 30 12 14 6 17 8 8 4
Tajikistan 108 98 120 94 82 107 48 34 69 36 3.6 1.9 5.1 Tajikistan 24 21 26 13 9 19 117 99 53 42 85 41 19 11 38 22 8 6
22

StatiStical table (continued)
country, regional and global estimates of under-five, infant and neonatal mortality
Country
Under-five mortality rate (U5MR) (deaths per 1,000 live births)
Country
Number of under-five deaths (thousands)
Sex-specific under-five mortality rate
(deaths per 1,000 live births)
Infant mortality
rate (deaths per 1,000 live
births)
Number of infant deaths
(thousands)
Neonatal mortality rate
(deaths per 1,000 live
births)
Number of neonatal deaths
(thousands)
1990 2000 2013Millennium
Development Goal
target for 2015
Annual rate of reduction (ARR) (percent)
1990–2013 1990 2013
U5MRLower bound
Upper bound U5MR
Lower bound
Upper bound U5MR
Lower bound
Upper bound ARR
Lower bound
Upper bound
Under-five
deathsLower bound
Upper bound
Under-five
deathsLower bound
Upper bound
1990 2013
Male Female Male Female 1990 2013 1990 2013 1990 2013 1990 2013
Oman 39 35 45 17 15 19 11 11 12 13 5.4 4.7 6.0 Oman 3 2 3 1 1 1 43 36 12 10 32 10 2 1 19 7 1 1
Pakistan 139 134 144 113 108 118 86 73 101 46 2.1 1.4 2.8 Pakistan 620 596 646 394 333 470 141 136 89 82 106 69 480 316 56 42 255 194
Palau 36 31 42 27 23 31 18 10 30 12 3.1 0.7 5.6 Palau 0 0 0 0 0 0 40 32 19 16 31 15 0 0 16 9 0 0
Panama 31 27 35 26 22 30 18 12 27 10 2.4 0.5 4.2 Panama 2 2 2 1 1 2 34 28 20 16 26 15 2 1 13 8 1 1
Papua New Guinea 89 80 99 78 68 91 61 40 94 30 1.6 -0.3 3.5 Papua New Guinea 12 11 14 13 8 20 94 83 66 57 65 47 9 10 31 24 4 5
Paraguay 46 42 51 34 29 39 22 15 32 15 3.2 1.6 4.9 Paraguay 6 6 7 3 2 5 50 42 24 20 37 19 5 3 22 12 3 2
Peru 80 76 84 40 37 43 17 13 21 27 6.8 5.7 7.9 Peru 52 49 55 10 8 13 84 76 18 15 57 13 37 8 26 8 17 5
Philippines 59 55 63 40 37 43 30 24 38 20 2.9 1.8 4.0 Philippines 119 111 128 71 56 91 64 53 33 26 41 24 85 56 23 14 46 33
Poland 17 17 18 9 9 10 5 5 5 6 5.2 5.0 5.4 Poland 9 9 9 2 2 2 19 15 6 5 15 5 8 2 11 3 6 1
Portugal 15 14 15 7 7 7 4 3 4 5 5.9 5.5 6.4 Portugal 2 2 2 0 0 0 16 13 4 3 12 3 1 0 7 2 1 0
Qatar 21 19 22 12 12 13 8 8 9 7 4.0 3.6 4.5 Qatar 0 0 0 0 0 0 23 19 9 7 18 7 0 0 10 4 0 0
Republic of Korea 7 7 7 6 6 6 4 4 4 2 2.8 2.6 3.0 Republic of Korea 4 4 4 2 2 2 7 7 4 3 6 3 3 2 3 2 2 1
Republic of Moldova 32 27 39 31 25 37 15 12 23 11 3.2 1.4 4.7 Republic of Moldova 3 2 3 1 0 1 36 29 17 14 27 13 2 1 14 8 1 0
Romania 38 37 38 27 27 28 12 11 13 13 5.0 4.8 5.2 Romania 16 16 17 3 3 3 42 34 13 11 31 11 14 2 17 7 7 2
Russian Federation 26 26 27 23 23 24 10 9 11 9 4.1 3.6 4.6 Russian Federation 59 58 60 17 15 19 30 22 11 9 22 9 49 14 15 5 33 9
Rwanda 152 143 162 182 170 195 52 38 73 51 4.7 3.2 6.0 Rwanda 50 46 53 22 16 31 160 144 56 48 93 37 31 16 39 20 13 9
Saint Kitts and Nevis 29 26 31 18 16 20 10 6 17 10 4.5 2.2 6.7 Saint Kitts and Nevis 0 0 0 0 0 0 31 26 11 9 23 8 0 0 17 7 0 0
Saint Lucia 23 21 24 18 17 19 15 13 17 8 1.9 1.2 2.6 Saint Lucia 0 0 0 0 0 0 25 20 16 13 19 13 0 0 13 9 0 0
Saint Vincent and the Grenadines 25 23 27 22 21 24 19 16 22 8 1.1 0.4 1.9 Saint Vincent and the Grenadines 0 0 0 0 0 0 27 22 21 17 21 17 0 0 15 12 0 0
Samoa 31 27 35 22 19 25 18 13 23 10 2.3 1.1 3.8 Samoa 0 0 0 0 0 0 34 28 20 16 26 16 0 0 12 8 0 0
San Marino 11 9 14 6 4 8 3 2 6 4 5.5 2.4 8.5 San Marino 0 0 0 0 0 0 12 10 3 3 10 3 0 0 4 1 0 0
Sao Tome and Principe 110 97 125 89 76 105 51 33 80 37 3.4 1.3 5.3 Sao Tome and Principe 0 0 1 0 0 1 117 104 55 47 70 37 0 0 32 19 0 0
Saudi Arabia 44 35 55 23 20 26 16 10 26 15 4.5 2.1 6.7 Saudi Arabia 24 19 30 9 5 14 46 41 17 14 35 13 19 7 21 9 11 5
Senegal 141 134 149 137 128 146 55 43 71 47 4.1 3.0 5.2 Senegal 44 42 47 29 22 37 148 134 60 50 71 44 22 23 42 23 13 12
Serbia 28 27 29 13 12 13 7 6 8 9 6.3 5.7 6.7 Serbia 4 4 4 1 1 1 30 26 7 6 24 6 4 1 17 4 3 0
Seychelles 17 15 18 14 13 16 14 12 17 6 0.7 -0.2 1.6 Seychelles 0 0 0 0 0 0 18 15 15 13 14 12 0 0 10 9 0 0
Sierra Leone 268 246 291 232 214 252 161 131 193 89 2.2 1.3 3.2 Sierra Leone 46 42 51 34 27 42 280 255 169 152 158 107 27 23 57 44 10 9
Singapore 8 7 8 4 4 4 3 3 3 3 4.4 3.9 4.9 Singapore 0 0 0 0 0 0 8 7 3 3 6 2 0 0 4 1 0 0
Slovakia 18 17 18 12 12 12 7 7 8 6 3.9 3.6 4.2 Slovakia 1 1 2 0 0 0 20 15 8 6 16 6 1 0 12 4 1 0
Slovenia 10 10 11 6 5 6 3 3 3 3 5.6 4.8 6.2 Slovenia 0 0 0 0 0 0 11 9 3 3 9 2 0 0 5 2 0 0
Solomon Islands 39 33 45 34 29 41 30 19 50 13 1.1 -1.2 3.3 Solomon Islands 0 0 1 1 0 1 42 35 33 27 32 25 0 0 16 13 0 0
Somalia 180 149 219 174 137 226 146 91 237 60 0.9 -0.9 2.7 Somalia 50 41 63 65 39 112 187 172 152 139 108 90 31 40 52 46 15 21
South Africa 61 54 69 74 67 84 44 35 55 20 1.4 0.2 2.6 South Africa 65 57 74 47 38 60 67 55 48 39 47 33 50 35 20 15 22 16
South Sudan 253 211 296 183 157 213 99 67 143 84 4.1 2.3 5.9 South Sudan 67 54 80 39 26 57 263 242 104 94 150 64 40 25 65 39 17 16
Spain 11 11 11 7 6 7 4 4 5 4 4.2 3.9 4.5 Spain 5 4 5 2 2 2 12 10 4 4 9 4 4 2 7 3 3 1
Sri Lanka 21 21 22 16 16 17 10 8 11 7 3.5 2.8 4.1 Sri Lanka 7 7 7 4 3 4 23 19 10 9 18 8 6 3 12 6 4 2
State of Palestine 43 40 47 30 27 33 22 16 31 14 3.0 1.4 4.5 State of Palestine 4 3 4 3 2 4 46 41 24 20 35 19 3 2 21 12 2 2
Sudan 128 119 138 108 98 118 77 61 95 43 2.2 1.3 3.3 Sudan 101 93 109 94 74 117 135 121 81 71 80 51 64 63 41 30 33 37
Suriname 48 40 56 35 28 45 23 12 42 16 3.2 0.5 5.9 Suriname 0 0 0 0 0 0 53 43 25 20 41 20 0 0 22 12 0 0
Swaziland 74 64 85 123 111 136 80 55 115 25 -0.3 -1.9 1.2 Swaziland 3 2 3 3 2 4 79 68 85 75 55 56 2 2 30 30 1 1
Sweden 7 7 7 4 4 4 3 3 3 2 3.6 3.3 3.9 Sweden 1 1 1 0 0 0 8 6 3 3 6 2 1 0 4 2 0 0
Switzerland 8 8 9 6 6 6 4 4 5 3 2.9 2.4 3.4 Switzerland 1 1 1 0 0 0 9 7 5 4 7 4 1 0 4 3 0 0
Syrian Arab Republic 37 34 40 23 22 25 15 12 19 12 4.1 2.9 5.2 Syrian Arab Republic 17 15 18 8 6 10 40 34 16 13 30 12 14 6 17 8 8 4
Tajikistan 108 98 120 94 82 107 48 34 69 36 3.6 1.9 5.1 Tajikistan 24 21 26 13 9 19 117 99 53 42 85 41 19 11 38 22 8 6
23
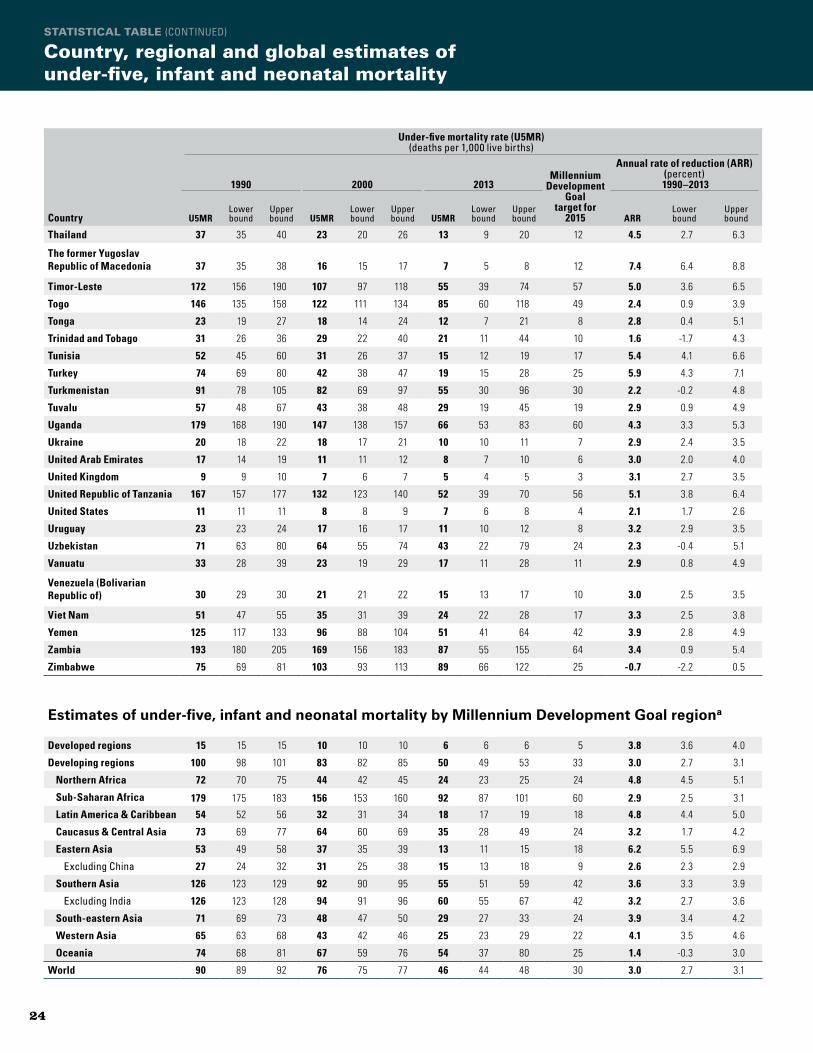
StatiStical table (continued)
country, regional and global estimates of under-five, infant and neonatal mortality
Country
Under-five mortality rate (U5MR) (deaths per 1,000 live births)
Country
Number of under-five deaths (thousands)
Sex-specific under-five mortality rate
(deaths per 1,000 live births)
Infant mortality
rate (deaths per 1,000 live
births)
Number of infant deaths
(thousands)
Neonatal mortality rate
(deaths per 1,000 live
births)
Number of neonatal deaths
(thousands)
1990 2000 2013Millennium
Development Goal
target for 2015
Annual rate of reduction (ARR) (percent)
1990–2013 1990 2013
U5MRLower bound
Upper bound U5MR
Lower bound
Upper bound U5MR
Lower bound
Upper bound ARR
Lower bound
Upper bound
Under-five
deathsLower bound
Upper bound
Under-five
deathsLower bound
Upper bound
1990 2013
Male Female Male Female 1990 2013 1990 2013 1990 2013 1990 2013
Thailand 37 35 40 23 20 26 13 9 20 12 4.5 2.7 6.3 Thailand 40 38 43 9 6 14 42 32 15 11 30 11 33 8 19 8 20 5
The former Yugoslav Republic of Macedonia 37 35 38 16 15 17 7 5 8 12 7.4 6.4 8.8
The former Yugoslav Republic of Macedonia 1 1 1 0 0 0 38 35 7 6 33 6 1 0 17 4 1 0
Timor-Leste 172 156 190 107 97 118 55 39 74 57 5.0 3.6 6.5 Timor-Leste 5 4 5 2 2 3 180 163 59 50 130 46 4 2 48 24 1 1
Togo 146 135 158 122 111 134 85 60 118 49 2.4 0.9 3.9 Togo 23 21 25 20 14 29 155 137 91 78 90 56 14 14 42 30 7 7
Tonga 23 19 27 18 14 24 12 7 21 8 2.8 0.4 5.1 Tonga 0 0 0 0 0 0 25 20 13 11 19 10 0 0 11 6 0 0
Trinidad and Tobago 31 26 36 29 22 40 21 11 44 10 1.6 -1.7 4.3 Trinidad and Tobago 1 1 1 0 0 1 33 28 23 19 27 19 1 0 20 15 0 0
Tunisia 52 45 60 31 26 37 15 12 19 17 5.4 4.1 6.6 Tunisia 11 10 13 3 2 4 55 49 16 14 41 13 9 2 24 9 5 2
Turkey 74 69 80 42 38 47 19 15 28 25 5.9 4.3 7.1 Turkey 103 96 111 25 19 36 78 71 21 17 56 17 77 21 31 11 43 14
Turkmenistan 91 78 105 82 69 97 55 30 96 30 2.2 -0.2 4.8 Turkmenistan 12 10 14 6 3 11 101 79 63 47 73 47 10 5 32 23 4 3
Tuvalu 57 48 67 43 38 48 29 19 45 19 2.9 0.9 4.9 Tuvalu 0 0 0 0 0 0 61 53 32 26 44 24 0 0 22 13 0 0
Uganda 179 168 190 147 138 157 66 53 83 60 4.3 3.3 5.3 Uganda 146 137 156 102 81 129 191 166 72 60 107 44 89 68 40 22 33 35
Ukraine 20 18 22 18 17 21 10 10 11 7 2.9 2.4 3.5 Ukraine 14 12 16 5 5 5 22 17 11 9 17 9 12 4 9 5 6 2
United Arab Emirates 17 14 19 11 11 12 8 7 10 6 3.0 2.0 4.0 United Arab Emirates 1 1 1 1 1 1 18 14 9 7 14 7 1 1 9 5 0 1
United Kingdom 9 9 10 7 6 7 5 4 5 3 3.1 2.7 3.5 United Kingdom 7 7 7 4 3 4 10 8 5 4 8 4 6 3 5 3 4 2
United Republic of Tanzania 167 157 177 132 123 140 52 39 70 56 5.1 3.8 6.4 United Republic of Tanzania 180 168 192 95 71 130 174 160 55 48 101 36 110 68 43 21 47 39
United States 11 11 11 8 8 9 7 6 8 4 2.1 1.7 2.6 United States 44 43 44 29 26 32 12 10 8 6 9 6 37 25 6 4 22 17
Uruguay 23 23 24 17 16 17 11 10 12 8 3.2 2.9 3.5 Uruguay 1 1 1 1 1 1 26 20 12 10 20 10 1 0 11 6 1 0
Uzbekistan 71 63 80 64 55 74 43 22 79 24 2.3 -0.4 5.1 Uzbekistan 52 46 59 26 14 50 79 63 48 37 59 37 43 23 20 14 15 9
Vanuatu 33 28 39 23 19 29 17 11 28 11 2.9 0.8 4.9 Vanuatu 0 0 0 0 0 0 36 29 19 15 27 15 0 0 15 9 0 0
Venezuela (Bolivarian Republic of) 30 29 30 21 21 22 15 13 17 10 3.0 2.5 3.5
Venezuela (Bolivarian Republic of) 17 17 17 9 8 10 33 26 17 13 25 13 14 8 15 8 9 5
Viet Nam 51 47 55 35 31 39 24 22 28 17 3.3 2.5 3.8 Viet Nam 99 92 108 33 30 40 56 45 27 20 37 19 72 26 23 13 45 18
Yemen 125 117 133 96 88 104 51 41 64 42 3.9 2.8 4.9 Yemen 71 67 76 38 30 48 130 119 55 47 88 40 50 30 43 24 25 18
Zambia 193 180 205 169 156 183 87 55 155 64 3.4 0.9 5.4 Zambia 63 59 68 51 32 95 201 183 93 82 115 56 38 34 44 29 15 18
Zimbabwe 75 69 81 103 93 113 89 66 122 25 -0.7 -2.2 0.5 Zimbabwe 28 26 30 39 29 55 81 68 95 82 50 55 19 24 31 39 12 17
Estimates of under-five, infant and neonatal mortality by Millennium Development Goal regiona Estimates of under-five, infant and neonatal mortality by Millennium Development Goal regiona (continued)
Developed regions 15 15 15 10 10 10 6 6 6 5 3.8 3.6 4.0 Developed regions 226 224 229 87 83 90 16 13 7 5 12 5 189 73 8 3 118 48
Developing regions 100 98 101 83 82 85 50 49 53 33 3.0 2.7 3.1 Developing regions 12,444 12,252 12,672 6,199 5,981 6,598 102 97 52 48 69 37 8,691 4,568 36 22 4,554 2,714
Northern Africa 72 70 75 44 42 45 24 23 25 24 4.8 4.5 5.1 Northern Africa 266 257 276 95 90 100 74 70 25 22 55 20 204 82 30 13 109 53
Sub-Saharan Africa 179 175 183 156 153 160 92 87 101 60 2.9 2.5 3.1 Sub-Saharan Africa 3,809 3,728 3,901 3,113 2,931 3,441 188 169 98 86 107 61 2,305 2,084 46 31 977 1,066
Latin America & Caribbean 54 52 56 32 31 34 18 17 19 18 4.8 4.4 5.0 Latin America & Caribbean 628 608 651 196 188 211 59 49 20 16 43 15 497 167 22 9 255 101
Caucasus & Central Asia 73 69 77 64 60 69 35 28 49 24 3.2 1.7 4.2 Caucasus & Central Asia 145 138 154 61 48 87 80 65 39 31 59 31 120 53 26 15 51 26
Eastern Asia 53 49 58 37 35 39 13 11 15 18 6.2 5.5 6.9 Eastern Asia 1,672 1,536 1,832 249 218 287 55 51 14 12 42 11 1,336 214 25 8 784 150
Excluding China 27 24 32 31 25 38 15 13 18 9 2.6 2.3 2.9 Excluding China 28 24 33 14 11 17 29 25 16 13 21 12 21 11 12 8 11 7
Southern Asia 126 123 129 92 90 95 55 51 59 42 3.6 3.3 3.9 Southern Asia 4,796 4,675 4,924 2,015 1,869 2,178 124 128 55 55 90 43 3,409 1,588 51 30 1,940 1,086
Excluding India 126 123 128 94 91 96 60 55 67 42 3.2 2.7 3.6 Excluding India 1,463 1,429 1,498 675 610 758 128 123 63 57 92 48 1,070 535 49 30 578 338
South-eastern Asia 71 69 73 48 47 50 29 27 33 24 3.9 3.4 4.2 South-eastern Asia 848 823 875 330 303 368 77 65 33 26 52 24 611 267 27 14 321 160
Western Asia 65 63 68 43 42 46 25 23 29 22 4.1 3.5 4.6 Western Asia 265 254 277 124 112 143 69 61 28 23 49 21 200 102 28 14 111 67
Oceania 74 68 81 67 59 76 54 37 80 25 1.4 -0.3 3.0 Oceania 14 13 16 14 10 22 79 69 58 49 55 42 11 11 26 21 5 6
World 90 89 92 76 75 77 46 44 48 30 3.0 2.7 3.1 World 12,670 12,479 12,900 6,285 6,069 6,686 93 88 47 44 63 34 8,880 4,641 33 20 4,672 2,763
24

StatiStical table (continued)
country, regional and global estimates of under-five, infant and neonatal mortality
Country
Under-five mortality rate (U5MR) (deaths per 1,000 live births)
Country
Number of under-five deaths (thousands)
Sex-specific under-five mortality rate
(deaths per 1,000 live births)
Infant mortality
rate (deaths per 1,000 live
births)
Number of infant deaths
(thousands)
Neonatal mortality rate
(deaths per 1,000 live
births)
Number of neonatal deaths
(thousands)
1990 2000 2013Millennium
Development Goal
target for 2015
Annual rate of reduction (ARR) (percent)
1990–2013 1990 2013
U5MRLower bound
Upper bound U5MR
Lower bound
Upper bound U5MR
Lower bound
Upper bound ARR
Lower bound
Upper bound
Under-five
deathsLower bound
Upper bound
Under-five
deathsLower bound
Upper bound
1990 2013
Male Female Male Female 1990 2013 1990 2013 1990 2013 1990 2013
Thailand 37 35 40 23 20 26 13 9 20 12 4.5 2.7 6.3 Thailand 40 38 43 9 6 14 42 32 15 11 30 11 33 8 19 8 20 5
The former Yugoslav Republic of Macedonia 37 35 38 16 15 17 7 5 8 12 7.4 6.4 8.8
The former Yugoslav Republic of Macedonia 1 1 1 0 0 0 38 35 7 6 33 6 1 0 17 4 1 0
Timor-Leste 172 156 190 107 97 118 55 39 74 57 5.0 3.6 6.5 Timor-Leste 5 4 5 2 2 3 180 163 59 50 130 46 4 2 48 24 1 1
Togo 146 135 158 122 111 134 85 60 118 49 2.4 0.9 3.9 Togo 23 21 25 20 14 29 155 137 91 78 90 56 14 14 42 30 7 7
Tonga 23 19 27 18 14 24 12 7 21 8 2.8 0.4 5.1 Tonga 0 0 0 0 0 0 25 20 13 11 19 10 0 0 11 6 0 0
Trinidad and Tobago 31 26 36 29 22 40 21 11 44 10 1.6 -1.7 4.3 Trinidad and Tobago 1 1 1 0 0 1 33 28 23 19 27 19 1 0 20 15 0 0
Tunisia 52 45 60 31 26 37 15 12 19 17 5.4 4.1 6.6 Tunisia 11 10 13 3 2 4 55 49 16 14 41 13 9 2 24 9 5 2
Turkey 74 69 80 42 38 47 19 15 28 25 5.9 4.3 7.1 Turkey 103 96 111 25 19 36 78 71 21 17 56 17 77 21 31 11 43 14
Turkmenistan 91 78 105 82 69 97 55 30 96 30 2.2 -0.2 4.8 Turkmenistan 12 10 14 6 3 11 101 79 63 47 73 47 10 5 32 23 4 3
Tuvalu 57 48 67 43 38 48 29 19 45 19 2.9 0.9 4.9 Tuvalu 0 0 0 0 0 0 61 53 32 26 44 24 0 0 22 13 0 0
Uganda 179 168 190 147 138 157 66 53 83 60 4.3 3.3 5.3 Uganda 146 137 156 102 81 129 191 166 72 60 107 44 89 68 40 22 33 35
Ukraine 20 18 22 18 17 21 10 10 11 7 2.9 2.4 3.5 Ukraine 14 12 16 5 5 5 22 17 11 9 17 9 12 4 9 5 6 2
United Arab Emirates 17 14 19 11 11 12 8 7 10 6 3.0 2.0 4.0 United Arab Emirates 1 1 1 1 1 1 18 14 9 7 14 7 1 1 9 5 0 1
United Kingdom 9 9 10 7 6 7 5 4 5 3 3.1 2.7 3.5 United Kingdom 7 7 7 4 3 4 10 8 5 4 8 4 6 3 5 3 4 2
United Republic of Tanzania 167 157 177 132 123 140 52 39 70 56 5.1 3.8 6.4 United Republic of Tanzania 180 168 192 95 71 130 174 160 55 48 101 36 110 68 43 21 47 39
United States 11 11 11 8 8 9 7 6 8 4 2.1 1.7 2.6 United States 44 43 44 29 26 32 12 10 8 6 9 6 37 25 6 4 22 17
Uruguay 23 23 24 17 16 17 11 10 12 8 3.2 2.9 3.5 Uruguay 1 1 1 1 1 1 26 20 12 10 20 10 1 0 11 6 1 0
Uzbekistan 71 63 80 64 55 74 43 22 79 24 2.3 -0.4 5.1 Uzbekistan 52 46 59 26 14 50 79 63 48 37 59 37 43 23 20 14 15 9
Vanuatu 33 28 39 23 19 29 17 11 28 11 2.9 0.8 4.9 Vanuatu 0 0 0 0 0 0 36 29 19 15 27 15 0 0 15 9 0 0
Venezuela (Bolivarian Republic of) 30 29 30 21 21 22 15 13 17 10 3.0 2.5 3.5
Venezuela (Bolivarian Republic of) 17 17 17 9 8 10 33 26 17 13 25 13 14 8 15 8 9 5
Viet Nam 51 47 55 35 31 39 24 22 28 17 3.3 2.5 3.8 Viet Nam 99 92 108 33 30 40 56 45 27 20 37 19 72 26 23 13 45 18
Yemen 125 117 133 96 88 104 51 41 64 42 3.9 2.8 4.9 Yemen 71 67 76 38 30 48 130 119 55 47 88 40 50 30 43 24 25 18
Zambia 193 180 205 169 156 183 87 55 155 64 3.4 0.9 5.4 Zambia 63 59 68 51 32 95 201 183 93 82 115 56 38 34 44 29 15 18
Zimbabwe 75 69 81 103 93 113 89 66 122 25 -0.7 -2.2 0.5 Zimbabwe 28 26 30 39 29 55 81 68 95 82 50 55 19 24 31 39 12 17
Estimates of under-five, infant and neonatal mortality by Millennium Development Goal regiona Estimates of under-five, infant and neonatal mortality by Millennium Development Goal regiona (continued)
Developed regions 15 15 15 10 10 10 6 6 6 5 3.8 3.6 4.0 Developed regions 226 224 229 87 83 90 16 13 7 5 12 5 189 73 8 3 118 48
Developing regions 100 98 101 83 82 85 50 49 53 33 3.0 2.7 3.1 Developing regions 12,444 12,252 12,672 6,199 5,981 6,598 102 97 52 48 69 37 8,691 4,568 36 22 4,554 2,714
Northern Africa 72 70 75 44 42 45 24 23 25 24 4.8 4.5 5.1 Northern Africa 266 257 276 95 90 100 74 70 25 22 55 20 204 82 30 13 109 53
Sub-Saharan Africa 179 175 183 156 153 160 92 87 101 60 2.9 2.5 3.1 Sub-Saharan Africa 3,809 3,728 3,901 3,113 2,931 3,441 188 169 98 86 107 61 2,305 2,084 46 31 977 1,066
Latin America & Caribbean 54 52 56 32 31 34 18 17 19 18 4.8 4.4 5.0 Latin America & Caribbean 628 608 651 196 188 211 59 49 20 16 43 15 497 167 22 9 255 101
Caucasus & Central Asia 73 69 77 64 60 69 35 28 49 24 3.2 1.7 4.2 Caucasus & Central Asia 145 138 154 61 48 87 80 65 39 31 59 31 120 53 26 15 51 26
Eastern Asia 53 49 58 37 35 39 13 11 15 18 6.2 5.5 6.9 Eastern Asia 1,672 1,536 1,832 249 218 287 55 51 14 12 42 11 1,336 214 25 8 784 150
Excluding China 27 24 32 31 25 38 15 13 18 9 2.6 2.3 2.9 Excluding China 28 24 33 14 11 17 29 25 16 13 21 12 21 11 12 8 11 7
Southern Asia 126 123 129 92 90 95 55 51 59 42 3.6 3.3 3.9 Southern Asia 4,796 4,675 4,924 2,015 1,869 2,178 124 128 55 55 90 43 3,409 1,588 51 30 1,940 1,086
Excluding India 126 123 128 94 91 96 60 55 67 42 3.2 2.7 3.6 Excluding India 1,463 1,429 1,498 675 610 758 128 123 63 57 92 48 1,070 535 49 30 578 338
South-eastern Asia 71 69 73 48 47 50 29 27 33 24 3.9 3.4 4.2 South-eastern Asia 848 823 875 330 303 368 77 65 33 26 52 24 611 267 27 14 321 160
Western Asia 65 63 68 43 42 46 25 23 29 22 4.1 3.5 4.6 Western Asia 265 254 277 124 112 143 69 61 28 23 49 21 200 102 28 14 111 67
Oceania 74 68 81 67 59 76 54 37 80 25 1.4 -0.3 3.0 Oceania 14 13 16 14 10 22 79 69 58 49 55 42 11 11 26 21 5 6
World 90 89 92 76 75 77 46 44 48 30 3.0 2.7 3.1 World 12,670 12,479 12,900 6,285 6,069 6,686 93 88 47 44 63 34 8,880 4,641 33 20 4,672 2,763
25

StatiStical table (continued)
country, regional and global estimates of under-five, infant and neonatal mortality
Estimates of under-five, infant and neonatal mortality by uniCEF regiona Estimates of under-five, infant and neonatal mortality by uniCEF regiona (continued)
Region
Under-five mortality rate (U5MR) (deaths per 1,000 live births)
Region
Number of under-five deaths (thousands)
Sex-specific under-five mortality rate
(deaths per 1,000 live births)
Infant mortality rate
(deaths per 1,000 live
births)
Number of infant deaths
(thousands)
Neonatal mortality rate
(deaths per 1,000 live
births)
Number of neonatal deaths
(thousands)
1990 2000 2013Millennium
Development Goal
target for 2015
Annual rate of reduction (ARR) (percent)
1990-2013 1990 2013
U5MRLower bound
Upper bound U5MR
Lower bound
Upper bound U5MR
Lower bound
Upper bound ARR
Lower bound
Upper bound
Under-five
deathsLower bound
Upper bound
Under-five
deathsLower bound
Upper bound
1990 2013
Male Female Male Female 1990 2013 1990 2013 1990 2013 1990 2013
Africa 163 160 167 144 141 147 85 80 93 54 2.8 2.4 3.1 Africa 4,076 3,994 4,168 3,208 3,026 3,536 171 155 90 79 100 57 2,508 2,166 43 29 1,086 1,120
Sub-Saharan Africa 179 175 183 156 153 160 92 87 101 60 2.9 2.5 3.1 Sub-Saharan Africa 3,809 3,728 3,901 3,113 2,931 3,441 188 169 98 86 107 61 2,305 2,084 46 31 977 1,066
Eastern and Southern Africa 165 161 170 140 137 145 74 69 85 55 3.5 2.9 3.8 Eastern and Southern Africa 1,707 1,659 1,762 1,144 1,052 1,318 174 156 79 69 102 50 1,062 770 43 27 452 419
West and Central Africa 197 191 203 175 170 181 109 99 123 66 2.6 2.0 3.0 West and Central Africa 1,998 1,931 2,072 1,874 1,690 2,129 206 187 116 103 115 72 1,177 1,250 48 35 491 609
Middle East and North Africa 70 69 72 50 49 52 31 28 33 23 3.6 3.2 4.0 Middle East and North Africa 639 623 657 314 291 344 73 67 33 28 52 24 475 249 29 15 262 159
Asia 90 88 93 70 69 72 39 37 42 30 3.7 3.4 3.9 Asia 7,223 7,042 7,429 2,584 2,435 2,758 91 90 39 39 65 31 5,284 2,059 37 21 3,000 1,387
South Asia 129 126 133 94 92 97 57 53 61 43 3.6 3.3 3.9 South Asia 4,689 4,568 4,816 1,991 1,843 2,153 127 132 56 57 92 45 3,327 1,567 52 30 1,890 1,070
East Asia and Pacific 58 55 62 41 40 43 19 18 21 19 4.8 4.4 5.2 East Asia and Pacific 2,534 2,397 2,696 594 553 650 61 55 21 17 44 16 1,958 492 25 10 1,110 316
Latin America and Caribbean 54 52 56 32 31 34 18 17 19 18 4.8 4.4 5.0 Latin America and Caribbean 628 608 651 196 188 211 59 49 20 16 43 15 497 167 22 9 255 101
Central and Eastern Europe/Commonwealth of Independent States 47 46 49 37 36 39 20 17 24 16 3.8 2.9 4.4
Central and Eastern Europe/Commonwealth of Independent States 357 347 369 114 100 143 52 43 22 17 38 17 288 99 20 9 150 55
World 90 89 92 76 75 77 46 44 48 30 3.0 2.7 3.1 World 12,670 12,479 12,900 6,285 6,069 6,686 93 88 47 44 63 34 8,880 4,641 33 20 4,672 2,763
Estimates of under-five, infant and neonatal mortality by World Health Organization regiona Estimates of under-five, infant and neonatal mortality by World Health Organization regiona (continued)
Region
Under-five mortality rate (U5MR) (deaths per 1,000 live births)
Region
Number of under-five deaths (thousands)
Sex-specific under-five mortality rate
(deaths per 1,000 live births)
Infant mortality rate
(deaths per 1,000 live
births)
Number of infant deaths
(thousands)
Neonatal mortality rate
(deaths per 1,000 live
births)
Number of neonatal deaths
(thousands)
1990 2000 2013Millennium
Development Goal
target for 2015
Annual rate of reduction (ARR) (percent)
1990-2013 1990 2013
U5MRLower bound
Upper bound U5MR
Lower bound
Upper bound U5MR
Lower bound
Upper bound ARR
Lower bound
Upper bound
Under-five
deathsLower bound
Upper bound
Under-five
deathsLower bound
Upper bound
1990 2013
Male Female Male Female 1990 2013 1990 2013 1990 2013 1990 2013
Africa 176 172 179 155 152 159 90 85 99 59 2.9 2.5 3.2 Africa 3,694 3,612 3,783 2,978 2,791 3,294 185 166 96 84 106 60 2,240 2,000 45 31 947 1,021
Americas 42 41 44 26 25 27 15 14 16 14 4.6 4.3 4.9 Americas 675 654 698 227 218 242 46 39 16 13 34 12 536 193 18 8 279 119
Eastern Mediterranean 101 98 103 80 78 83 55 51 62 34 2.6 2.1 3.0 Eastern Mediterranean 1,365 1,333 1,401 845 775 951 103 98 58 52 75 43 1,018 652 40 26 540 395
Europe 32 31 33 23 22 24 12 11 15 11 4.2 3.4 4.7 Europe 417 407 429 137 122 166 35 29 14 11 26 11 338 118 14 6 183 68
South-East Asia 118 115 121 83 81 86 47 43 51 39 4.0 3.7 4.4 South-East Asia 4,538 4,418 4,665 1,700 1,562 1,843 117 120 47 47 84 37 3,191 1,346 47 26 1,819 941
Western Pacific 52 49 56 36 34 37 15 14 17 17 5.3 4.7 5.8 Western Pacific 1,977 1,841 2,139 395 360 443 55 49 17 14 40 13 1,555 330 24 8 902 217
World 90 89 92 76 75 77 46 44 48 30 3.0 2.7 3.1 World 12,670 12,479 12,900 6,285 6,069 6,686 93 88 47 44 63 34 8,880 4,641 33 20 4,672 2,763
26

StatiStical table (continued)
country, regional and global estimates of under-five, infant and neonatal mortality
Estimates of under-five, infant and neonatal mortality by uniCEF regiona Estimates of under-five, infant and neonatal mortality by uniCEF regiona (continued)
Region
Under-five mortality rate (U5MR) (deaths per 1,000 live births)
Region
Number of under-five deaths (thousands)
Sex-specific under-five mortality rate
(deaths per 1,000 live births)
Infant mortality rate
(deaths per 1,000 live
births)
Number of infant deaths
(thousands)
Neonatal mortality rate
(deaths per 1,000 live
births)
Number of neonatal deaths
(thousands)
1990 2000 2013Millennium
Development Goal
target for 2015
Annual rate of reduction (ARR) (percent)
1990-2013 1990 2013
U5MRLower bound
Upper bound U5MR
Lower bound
Upper bound U5MR
Lower bound
Upper bound ARR
Lower bound
Upper bound
Under-five
deathsLower bound
Upper bound
Under-five
deathsLower bound
Upper bound
1990 2013
Male Female Male Female 1990 2013 1990 2013 1990 2013 1990 2013
Africa 163 160 167 144 141 147 85 80 93 54 2.8 2.4 3.1 Africa 4,076 3,994 4,168 3,208 3,026 3,536 171 155 90 79 100 57 2,508 2,166 43 29 1,086 1,120
Sub-Saharan Africa 179 175 183 156 153 160 92 87 101 60 2.9 2.5 3.1 Sub-Saharan Africa 3,809 3,728 3,901 3,113 2,931 3,441 188 169 98 86 107 61 2,305 2,084 46 31 977 1,066
Eastern and Southern Africa 165 161 170 140 137 145 74 69 85 55 3.5 2.9 3.8 Eastern and Southern Africa 1,707 1,659 1,762 1,144 1,052 1,318 174 156 79 69 102 50 1,062 770 43 27 452 419
West and Central Africa 197 191 203 175 170 181 109 99 123 66 2.6 2.0 3.0 West and Central Africa 1,998 1,931 2,072 1,874 1,690 2,129 206 187 116 103 115 72 1,177 1,250 48 35 491 609
Middle East and North Africa 70 69 72 50 49 52 31 28 33 23 3.6 3.2 4.0 Middle East and North Africa 639 623 657 314 291 344 73 67 33 28 52 24 475 249 29 15 262 159
Asia 90 88 93 70 69 72 39 37 42 30 3.7 3.4 3.9 Asia 7,223 7,042 7,429 2,584 2,435 2,758 91 90 39 39 65 31 5,284 2,059 37 21 3,000 1,387
South Asia 129 126 133 94 92 97 57 53 61 43 3.6 3.3 3.9 South Asia 4,689 4,568 4,816 1,991 1,843 2,153 127 132 56 57 92 45 3,327 1,567 52 30 1,890 1,070
East Asia and Pacific 58 55 62 41 40 43 19 18 21 19 4.8 4.4 5.2 East Asia and Pacific 2,534 2,397 2,696 594 553 650 61 55 21 17 44 16 1,958 492 25 10 1,110 316
Latin America and Caribbean 54 52 56 32 31 34 18 17 19 18 4.8 4.4 5.0 Latin America and Caribbean 628 608 651 196 188 211 59 49 20 16 43 15 497 167 22 9 255 101
Central and Eastern Europe/Commonwealth of Independent States 47 46 49 37 36 39 20 17 24 16 3.8 2.9 4.4
Central and Eastern Europe/Commonwealth of Independent States 357 347 369 114 100 143 52 43 22 17 38 17 288 99 20 9 150 55
World 90 89 92 76 75 77 46 44 48 30 3.0 2.7 3.1 World 12,670 12,479 12,900 6,285 6,069 6,686 93 88 47 44 63 34 8,880 4,641 33 20 4,672 2,763
Estimates of under-five, infant and neonatal mortality by World Health Organization regiona Estimates of under-five, infant and neonatal mortality by World Health Organization regiona (continued)
Region
Under-five mortality rate (U5MR) (deaths per 1,000 live births)
Region
Number of under-five deaths (thousands)
Sex-specific under-five mortality rate
(deaths per 1,000 live births)
Infant mortality rate
(deaths per 1,000 live
births)
Number of infant deaths
(thousands)
Neonatal mortality rate
(deaths per 1,000 live
births)
Number of neonatal deaths
(thousands)
1990 2000 2013Millennium
Development Goal
target for 2015
Annual rate of reduction (ARR) (percent)
1990-2013 1990 2013
U5MRLower bound
Upper bound U5MR
Lower bound
Upper bound U5MR
Lower bound
Upper bound ARR
Lower bound
Upper bound
Under-five
deathsLower bound
Upper bound
Under-five
deathsLower bound
Upper bound
1990 2013
Male Female Male Female 1990 2013 1990 2013 1990 2013 1990 2013
Africa 176 172 179 155 152 159 90 85 99 59 2.9 2.5 3.2 Africa 3,694 3,612 3,783 2,978 2,791 3,294 185 166 96 84 106 60 2,240 2,000 45 31 947 1,021
Americas 42 41 44 26 25 27 15 14 16 14 4.6 4.3 4.9 Americas 675 654 698 227 218 242 46 39 16 13 34 12 536 193 18 8 279 119
Eastern Mediterranean 101 98 103 80 78 83 55 51 62 34 2.6 2.1 3.0 Eastern Mediterranean 1,365 1,333 1,401 845 775 951 103 98 58 52 75 43 1,018 652 40 26 540 395
Europe 32 31 33 23 22 24 12 11 15 11 4.2 3.4 4.7 Europe 417 407 429 137 122 166 35 29 14 11 26 11 338 118 14 6 183 68
South-East Asia 118 115 121 83 81 86 47 43 51 39 4.0 3.7 4.4 South-East Asia 4,538 4,418 4,665 1,700 1,562 1,843 117 120 47 47 84 37 3,191 1,346 47 26 1,819 941
Western Pacific 52 49 56 36 34 37 15 14 17 17 5.3 4.7 5.8 Western Pacific 1,977 1,841 2,139 395 360 443 55 49 17 14 40 13 1,555 330 24 8 902 217
World 90 89 92 76 75 77 46 44 48 30 3.0 2.7 3.1 World 12,670 12,479 12,900 6,285 6,069 6,686 93 88 47 44 63 34 8,880 4,641 33 20 4,672 2,763
27

StatiStical table (continued)
country, regional and global estimates of under-five, infant and neonatal mortality
Estimates of under-five, infant and neonatal mortality by World bank regiona Estimates of under-five, infant and neonatal mortality by World bank regiona (continued)
Region
Under-five mortality rate (U5MR) (deaths per 1,000 live births)
Region
Number of under-five deaths (thousands)
Sex-specific under-five mortality rate
(deaths per 1,000 live births)
Infant mortality rate
(deaths per 1,000 live
births)
Number of infant deaths
(thousands)
Neonatal mortality rate
(deaths per 1,000 live
births)
Number of neonatal deaths
(thousands)
1990 2000 2013Millennium
Development Goal
target for 2015
Annual rate of reduction (ARR) (percent) 1990-2013 1990 2013
U5MRLower bound
Upper bound U5MR
Lower bound
Upper bound U5MR
Lower bound
Upper bound ARR
Lower bound
Upper bound
Under-five
deathsLower bound
Upper bound
Under-five
deathsLower bound
Upper bound
1990 2013
Male Female Male Female 1990 2013 1990 2013 1990 2013 1990 2013
Low income 167 164 170 135 133 138 76 72 84 56 3.4 3.0 3.7 Low income 3,209 3,155 3,276 2,000 1,877 2,221 174 159 81 71 105 53 2,015 1,396 47 28 914 748
Middle income 87 86 89 71 70 73 43 41 47 29 3.0 2.7 3.3 Middle income 9,241 9,051 9,459 4,191 3,986 4,494 89 86 45 42 63 33 6,685 3,166 34 20 3,645 1,963
Lower middle income 119 117 121 93 91 96 59 56 64 40 3.0 2.7 3.3 Lower middle income 6,475 6,341 6,618 3,456 3,254 3,727 120 118 61 57 83 44 4,497 2,579 44 27 2,409 1,596
Upper middle income 54 52 58 39 37 40 20 18 22 18 4.4 3.8 4.9 Upper middle income 2,766 2,630 2,931 736 672 842 57 51 21 18 43 16 2,188 586 24 10 1,236 366
Low and middle income 100 98 101 84 83 85 50 49 54 33 3.0 2.7 3.1 Low and middle income 12,451 12,260 12,680 6,191 5,973 6,591 102 97 52 48 69 37 8,699 4,562 36 22 4,559 2,711
High income 14 14 15 10 10 10 6 6 7 5 3.6 3.2 3.8 High income 219 214 225 94 89 101 16 13 7 6 12 5 180 79 8 4 113 52
World 90 89 92 76 75 77 46 44 48 30 3.0 2.7 3.1 World 12,670 12,479 12,900 6,285 6,069 6,686 93 88 47 44 63 34 8,880 4,641 33 20 4,672 2,763
Estimates of under-five, infant and neonatal mortality by united nations Population Division regiona Estimates of under-five, infant and neonatal mortality by united nations Population Division regiona (continued)
Region
Under-five mortality rate (U5MR) (deaths per 1,000 live births)
Region
Number of under-five deaths (thousands)
Sex-specific under-five mortality rate
(deaths per 1,000 live births)
Infant mortality rate
(deaths per 1,000 live
births)
Number of infant deaths
(thousands)
Neonatal mortality rate
(deaths per 1,000 live
births)
Number of neonatal deaths
(thousands)
1990 2000 2013Millennium
Development Goal
target for 2015
Annual rate of reduction (ARR) (percent) 1990-2013 1990 2013
U5MRLower bound
Upper bound U5MR
Lower bound
Upper bound U5MR
Lower bound
Upper bound ARR
Lower bound
Upper bound
Under-five
deathsLower bound
Upper bound
Under-five
deathsLower bound
Upper bound
1990 2013
Male Female Male Female 1990 2013 1990 2013 1990 2013 1990 2013
More developed regions 15 15 15 10 10 10 6 6 6 5 3.8 3.6 4.0 More developed regions 224 223 227 86 82 90 16 13 7 6 12 5 187 73 8 3 117 48
Less developed regions 100 98 101 83 82 85 50 48 53 33 3.0 2.7 3.1 Less developed regions 12,445 12,253 12,673 6,199 5,982 6,599 102 97 52 48 69 37 8,693 4,569 36 22 4,555 2,715
Least developed countries 174 171 177 139 136 142 80 76 88 58 3.4 3.0 3.6 Least developed countries 3,563 3,504 3,635 2,275 2,149 2,523 181 166 85 75 108 55 2,227 1,579 49 29 1,004 838
Excluding least developed countries 85 83 87 69 67 70 41 39 44 28 3.1 2.8 3.4
Excluding least developed countries 8,882 8,693 9,097 3,925 3,716 4,203 87 83 43 40 61 31 6,466 2,990 34 20 3,551 1,876
Excluding China 114 113 116 91 90 93 57 55 60 38 3.0 2.8 3.2 Excluding China 10,801 10,657 10,966 5,964 5,744 6,360 117 111 59 54 78 41 7,377 4,366 40 25 3,782 2,572
Sub-Saharan Africa 181 177 185 158 155 162 93 87 102 60 2.9 2.5 3.2 Sub-Saharan Africa 3,709 3,627 3,799 3,019 2,837 3,344 190 171 99 87 109 61 2,241 2,021 46 31 944 1,029
Africa 163 160 167 144 141 147 85 80 93 54 2.8 2.4 3.1 Africa 4,076 3,994 4,168 3,208 3,026 3,536 171 155 90 79 100 57 2,508 2,166 43 29 1,086 1,120
Asia 87 85 89 67 65 68 37 35 39 29 3.7 3.4 4.0 Asia 7,735 7,553 7,945 2,784 2,638 2,967 87 86 38 36 63 30 5,682 2,228 36 20 3,211 1,490
Europe 18 17 18 12 12 12 6 6 7 6 4.5 4.3 4.7 Europe 167 165 170 50 48 52 20 15 7 6 15 5 140 42 9 4 89 28
Latin America & Caribbean 54 52 56 32 31 34 18 17 19 18 4.8 4.4 5.0 Latin America & Caribbean 628 608 651 196 188 211 59 49 20 16 43 15 497 167 22 9 255 101
Northern America 11 11 11 8 8 8 7 6 7 4 2.1 1.7 2.5 Northern America 47 46 48 31 28 34 12 10 7 6 9 6 39 27 6 4 24 18
Oceania 34 32 37 33 30 37 25 18 36 11 1.5 -0.1 2.9 Oceania 17 16 19 16 11 23 37 32 27 22 26 19 13 12 13 10 6 7
World 90 89 92 76 75 77 46 44 48 30 3.0 2.7 3.1 World 12,670 12,479 12,900 6,285 6,069 6,686 93 88 47 44 63 34 8,880 4,641 33 20 4,672 2,763
DefinitionsUnder-five mortality rate: Probability of dying between birth and exactly five years of age, expressed per 1,000 live births.Infant mortality rate: Probability of dying between birth and exactly one year of age, expressed per 1,000 live births.Neonatal mortality rate: Probability of dying in the first month of life, expressed per 1,000 live births.Note: Upper and lower bounds refer to the 90 percent uncertainty intervals for the estimates. Estimates are generated by the United Nations Inter-agency Group for Child Mortality Estimation to ensure comparability; they are not necessarily the official statistics of UN Member States, which may use alternative rigorous methods.a The sum of the number of deaths by region may differ from the world total because of rounding.
28

StatiStical table (continued)
country, regional and global estimates of under-five, infant and neonatal mortality
Estimates of under-five, infant and neonatal mortality by World bank regiona Estimates of under-five, infant and neonatal mortality by World bank regiona (continued)
Region
Under-five mortality rate (U5MR) (deaths per 1,000 live births)
Region
Number of under-five deaths (thousands)
Sex-specific under-five mortality rate
(deaths per 1,000 live births)
Infant mortality rate
(deaths per 1,000 live
births)
Number of infant deaths
(thousands)
Neonatal mortality rate
(deaths per 1,000 live
births)
Number of neonatal deaths
(thousands)
1990 2000 2013Millennium
Development Goal
target for 2015
Annual rate of reduction (ARR) (percent) 1990-2013 1990 2013
U5MRLower bound
Upper bound U5MR
Lower bound
Upper bound U5MR
Lower bound
Upper bound ARR
Lower bound
Upper bound
Under-five
deathsLower bound
Upper bound
Under-five
deathsLower bound
Upper bound
1990 2013
Male Female Male Female 1990 2013 1990 2013 1990 2013 1990 2013
Low income 167 164 170 135 133 138 76 72 84 56 3.4 3.0 3.7 Low income 3,209 3,155 3,276 2,000 1,877 2,221 174 159 81 71 105 53 2,015 1,396 47 28 914 748
Middle income 87 86 89 71 70 73 43 41 47 29 3.0 2.7 3.3 Middle income 9,241 9,051 9,459 4,191 3,986 4,494 89 86 45 42 63 33 6,685 3,166 34 20 3,645 1,963
Lower middle income 119 117 121 93 91 96 59 56 64 40 3.0 2.7 3.3 Lower middle income 6,475 6,341 6,618 3,456 3,254 3,727 120 118 61 57 83 44 4,497 2,579 44 27 2,409 1,596
Upper middle income 54 52 58 39 37 40 20 18 22 18 4.4 3.8 4.9 Upper middle income 2,766 2,630 2,931 736 672 842 57 51 21 18 43 16 2,188 586 24 10 1,236 366
Low and middle income 100 98 101 84 83 85 50 49 54 33 3.0 2.7 3.1 Low and middle income 12,451 12,260 12,680 6,191 5,973 6,591 102 97 52 48 69 37 8,699 4,562 36 22 4,559 2,711
High income 14 14 15 10 10 10 6 6 7 5 3.6 3.2 3.8 High income 219 214 225 94 89 101 16 13 7 6 12 5 180 79 8 4 113 52
World 90 89 92 76 75 77 46 44 48 30 3.0 2.7 3.1 World 12,670 12,479 12,900 6,285 6,069 6,686 93 88 47 44 63 34 8,880 4,641 33 20 4,672 2,763
Estimates of under-five, infant and neonatal mortality by united nations Population Division regiona Estimates of under-five, infant and neonatal mortality by united nations Population Division regiona (continued)
Region
Under-five mortality rate (U5MR) (deaths per 1,000 live births)
Region
Number of under-five deaths (thousands)
Sex-specific under-five mortality rate
(deaths per 1,000 live births)
Infant mortality rate
(deaths per 1,000 live
births)
Number of infant deaths
(thousands)
Neonatal mortality rate
(deaths per 1,000 live
births)
Number of neonatal deaths
(thousands)
1990 2000 2013Millennium
Development Goal
target for 2015
Annual rate of reduction (ARR) (percent) 1990-2013 1990 2013
U5MRLower bound
Upper bound U5MR
Lower bound
Upper bound U5MR
Lower bound
Upper bound ARR
Lower bound
Upper bound
Under-five
deathsLower bound
Upper bound
Under-five
deathsLower bound
Upper bound
1990 2013
Male Female Male Female 1990 2013 1990 2013 1990 2013 1990 2013
More developed regions 15 15 15 10 10 10 6 6 6 5 3.8 3.6 4.0 More developed regions 224 223 227 86 82 90 16 13 7 6 12 5 187 73 8 3 117 48
Less developed regions 100 98 101 83 82 85 50 48 53 33 3.0 2.7 3.1 Less developed regions 12,445 12,253 12,673 6,199 5,982 6,599 102 97 52 48 69 37 8,693 4,569 36 22 4,555 2,715
Least developed countries 174 171 177 139 136 142 80 76 88 58 3.4 3.0 3.6 Least developed countries 3,563 3,504 3,635 2,275 2,149 2,523 181 166 85 75 108 55 2,227 1,579 49 29 1,004 838
Excluding least developed countries 85 83 87 69 67 70 41 39 44 28 3.1 2.8 3.4
Excluding least developed countries 8,882 8,693 9,097 3,925 3,716 4,203 87 83 43 40 61 31 6,466 2,990 34 20 3,551 1,876
Excluding China 114 113 116 91 90 93 57 55 60 38 3.0 2.8 3.2 Excluding China 10,801 10,657 10,966 5,964 5,744 6,360 117 111 59 54 78 41 7,377 4,366 40 25 3,782 2,572
Sub-Saharan Africa 181 177 185 158 155 162 93 87 102 60 2.9 2.5 3.2 Sub-Saharan Africa 3,709 3,627 3,799 3,019 2,837 3,344 190 171 99 87 109 61 2,241 2,021 46 31 944 1,029
Africa 163 160 167 144 141 147 85 80 93 54 2.8 2.4 3.1 Africa 4,076 3,994 4,168 3,208 3,026 3,536 171 155 90 79 100 57 2,508 2,166 43 29 1,086 1,120
Asia 87 85 89 67 65 68 37 35 39 29 3.7 3.4 4.0 Asia 7,735 7,553 7,945 2,784 2,638 2,967 87 86 38 36 63 30 5,682 2,228 36 20 3,211 1,490
Europe 18 17 18 12 12 12 6 6 7 6 4.5 4.3 4.7 Europe 167 165 170 50 48 52 20 15 7 6 15 5 140 42 9 4 89 28
Latin America & Caribbean 54 52 56 32 31 34 18 17 19 18 4.8 4.4 5.0 Latin America & Caribbean 628 608 651 196 188 211 59 49 20 16 43 15 497 167 22 9 255 101
Northern America 11 11 11 8 8 8 7 6 7 4 2.1 1.7 2.5 Northern America 47 46 48 31 28 34 12 10 7 6 9 6 39 27 6 4 24 18
Oceania 34 32 37 33 30 37 25 18 36 11 1.5 -0.1 2.9 Oceania 17 16 19 16 11 23 37 32 27 22 26 19 13 12 13 10 6 7
World 90 89 92 76 75 77 46 44 48 30 3.0 2.7 3.1 World 12,670 12,479 12,900 6,285 6,069 6,686 93 88 47 44 63 34 8,880 4,641 33 20 4,672 2,763
29

Regional Classifications
The regional classifications that are referred to in the report and for which aggregate data are provided in the statistical table are Millennium Development Goal regions (see below). Aggregates presented for member organizations of the Inter-agency Group for Child Mortality Estimation may differ. Regions with the same names in different agencies may include different countries.
Developed regionsAlbania, Andorra, Australia, Austria, Belarus, Bel-gium, Bosnia and Herzegovina, Bulgaria, Canada, Croatia, Cyprus, Czech Republic, Denmark, Estonia, Finland, France, Germany, Greece, Hungary, Iceland, Ireland, Israel, Italy, Japan, Latvia, Liechtenstein, Lithuania, Luxembourg, Malta, Monaco, Montenegro, Netherlands, New Zealand, Norway, Poland, Portugal, Republic of Moldova, Romania, Russian Federation, San Marino, Serbia, Slovakia, Slovenia, Spain, Sweden, Switzerland, The former Yugoslav Republic of Mace-donia, Ukraine, United Kingdom, United States
Developing regionsCaucasus and Central AsiaArmenia, Azerbaijan, Georgia, Kazakhstan, Kyrgyz-stan, Tajikistan, Turkmenistan, Uzbekistan
Eastern Asia China, Democratic People’s Republic of Korea, Mongolia, Republic of Korea
latin America and the CaribbeanAntigua and Barbuda, Argentina, Bahamas, Barba-dos, Belize, Bolivia (Plurinational State of), Brazil, Chile, Colombia, Costa Rica, Cuba, Dominica, Domin-ican Republic, Ecuador, El Salvador, Grenada, Gua-temala, Guyana, Haiti, Honduras, Jamaica, Mexico, Nicaragua, Panama, Paraguay, Peru, Saint Kitts and Nevis, Saint Lucia, Saint Vincent and the Grenadines, Suriname, Trinidad and Tobago, Uruguay, Venezuela (Bolivarian Republic of)
northern AfricaAlgeria, Egypt, Libya, Morocco, Tunisia
OceaniaCook Islands, Fiji, Kiribati, Marshall Islands, Micronesia (Federated States of), Nauru, Niue, Palau, Papua New Guinea, Samoa, Solomon Islands, Tonga, Tuvalu, Vanuatu
South-eastern AsiaBrunei Darussalam, Cambodia, Indonesia, Lao People’s Democratic Republic, Malaysia, Myanmar, Philippines, Singapore, Thailand, Timor-Leste, Viet Nam
Southern AsiaAfghanistan, Bangladesh, Bhutan, India, Iran (Islamic Republic of), Maldives, Nepal, Pakistan, Sri Lanka
Sub-Saharan AfricaAngola, Benin, Botswana, Burkina Faso, Burundi, Cabo Verde, Cameroon, Central African Republic, Chad, Comoros, Congo, Côte d’Ivoire, Democratic Republic of the Congo, Djibouti, Equatorial Guinea, Eritrea, Ethiopia, Gabon, Gambia, Ghana, Guinea, Guinea-Bissau, Kenya, Lesotho, Liberia, Madagascar, Malawi, Mali, Mauritania, Mauritius, Mozambique, Namibia, Niger, Nigeria, Rwanda, Sao Tome and Principe, Senegal, Seychelles, Sierra Leone, Soma-lia, South Africa, South Sudan, Sudan, Swaziland, Togo, Uganda, United Republic of Tanzania, Zambia, Zimbabwe
Western AsiaBahrain, Iraq, Jordan, Kuwait, Lebanon, Oman, Qatar, Saudi Arabia, State of Palestine, Syrian Arab Republic, Turkey, United Arab Emirates, Yemen
30


Cover photo: © UNICEF/NYHQ2012-2248/MARKISzPhoto on page 3: © UNICEF/BANA2013-01071/KIRONPhoto on page 8: © UNICEF/PFPG2014P-0421/SCHERMBRUCKERPhoto on page 31: © UNICEF/NYHQ2008-1649/PIROzzI

The UN Inter-agency Group for Child Mortality Estimation
The UN Inter-agency Group for Child Mortality Estimation (UN IGME) was formed in 2004 to share data on child mortality, harmonize estimates within the UN system, improve methods for child mortality estimation, report on progress towards the Millennium Development Goals and enhance country capacity to produce timely and properly assessed estimates of child mortality. The UN IGME includes the United Nations Children’s Fund, the World Health Organization, the World Bank and the United Nations Population Division of the Department of Economic and Social Affairs as full members.
The UN IGME’s independent Technical Advisory Group, comprising eminent scholars and independent experts in demography, provides technical guidance on estimation methods, technical issues and strategies for data analysis and data quality assessment.
The UN IGME updates its child mortality estimates annually after reviewing newly available data and assessing data quality. This report contains the latest UN IGME estimates of child mortality at the country, regional and global levels. Country-specific estimates and the data used to derive them are available at www.childmortality.org.
United Nations