Embed Size (px)
Citation preview

Consolidated Financial ResultsFor the Fiscal Year Ended March 31, 2013
Prepared in Conformity with Generally Accepted Accounting Principles in Japan
English Translation from the Original Japanese-Language Document
April 26, 2013
Company Name : Mazda Motor Corporation (Tokyo Stock Exchange / Code No. 7261)
URL : http://www.mazda.co.jpRepresentative Person : Takashi Yamanouchi, Representative Director and PresidentContact Person : Shinji Maeda, General Manager, Accounting Department, Financial Services Division
Phone 082-282-1111General Meeting of the Shareholders : Scheduled for June 25, 2013Payment of Dividends : -Filing of Yuka Shoken Hokokusho ,
annual securities report : Scheduled for June 26, 2013Supplementary Material : YesBriefing Session : Yes (Intended for securities analysts, institutional investors and media)
(In Japanese yen rounded to millions, except amounts per share)
1. Consolidated Financial Highlights (April 1, 2012 through March 31, 2013)(1) Consolidated Financial Results
(Percentage indicates change from the previous fiscal year)
Net Sales Operating Income/(Loss) Ordinary Income/(Loss) Net Income/(Loss)millions of yen % millions of yen % millions of yen % millions of yen %
FY2013
FY2012
Note: Comprehensive income/(loss) FY2013 millions of yen ( %)
FY2012 millions of yen ( %)
Net Income/(Loss) Net Income Ordinary Income/(Loss) Operating Income/Per Share to Total Assets (Loss) to Sales
yen yen % % %
FY2013
FY2012
Reference: Equity in net income of affiliates (for the fiscal years ended March 31) FY2013 millions of yen
FY2012 millions of yen
(2) Consolidated Financial Position
millions of yen millions of yen % yen
As of Mar. 31, 2013
As of Mar. 31, 2012
Reference: Equity (as of March 31) FY2013 millions of yen
FY2012 millions of yen
(3) Consolidated Cash FlowsCash Flows from Cash Flows from Cash Flows from Ending Cash &
Operating Activities Investing Activities Financing Activities Cash Equivalentsmillions of yen millions of yen millions of yen millions of yen
FY2013
FY2012
2. Dividends
yen yen yen yen yen millions of yen % %
FY2012
FY2013
FY2014 (Forecast)
3. Consolidated Financial Forecast (April 1, 2013 through March 31, 2014)(Percentage indicates change from the previous term)
FY2014 millions of yen % millions of yen % millions of yen % millions of yen % yen
First Half
Full Year
28,412
(104,511)
10,090
9,552
Per Share (Diluted)
9.4 292.21,120,000 45,000 21,000
Net SalesOperating
Income/(Loss)Ordinary Income/(Loss)
-
Full Year
Net Income/(Loss) Per
Share
468,854
Dividends Payout
Ratio
(Consolidated)
Ratio of Dividends to
Equity
(Consolidated)
0.00
97,000
Total Amount of
Annual Dividends
Dividends per Share
1st.Qtr. 2nd.Qtr. 3rd.Qtr. Year-End
70,000
-
2,205,270
2,033,058 (12.6)
8.5 53,936 -
(38,718) -
33,087 -
(36,817) -
34,304 -
(107,733)
Total Assets Equity Equity Ratio
Net Income/(Loss)
193.22,480,000
11.48
(57.80)
-
120,00012.5 122.5
Return on Equity
104.1
-
-
Equity per Share
10,000
166.04
156.85
444,875
477,307
-
7.1
(24.0)
1.7
(2.0)
2.4
(1.9)
1,978,567
1,915,943
513,226
474,429
25.1
24.5
49,033
(9,098)
(40,287)
(70,317)
(57,181)
236,462
0.00
0.00
-
-
-
0.00
0.00
0.00
0.00
3.35
23.42
-
-
-
-
-
-
-
74.1
496,312
0.00
0.00
-
-
-
*Notes
(1) Changes in Significant Subsidiaries during the period (changes in specified subsidiaries resulting in the change
in scope of consolidation): None
Newly added subsidiaries: None Excluded subsidiaries: None
(2) Changes in accounting policies/ Changes in accounting estimates / Restatement:
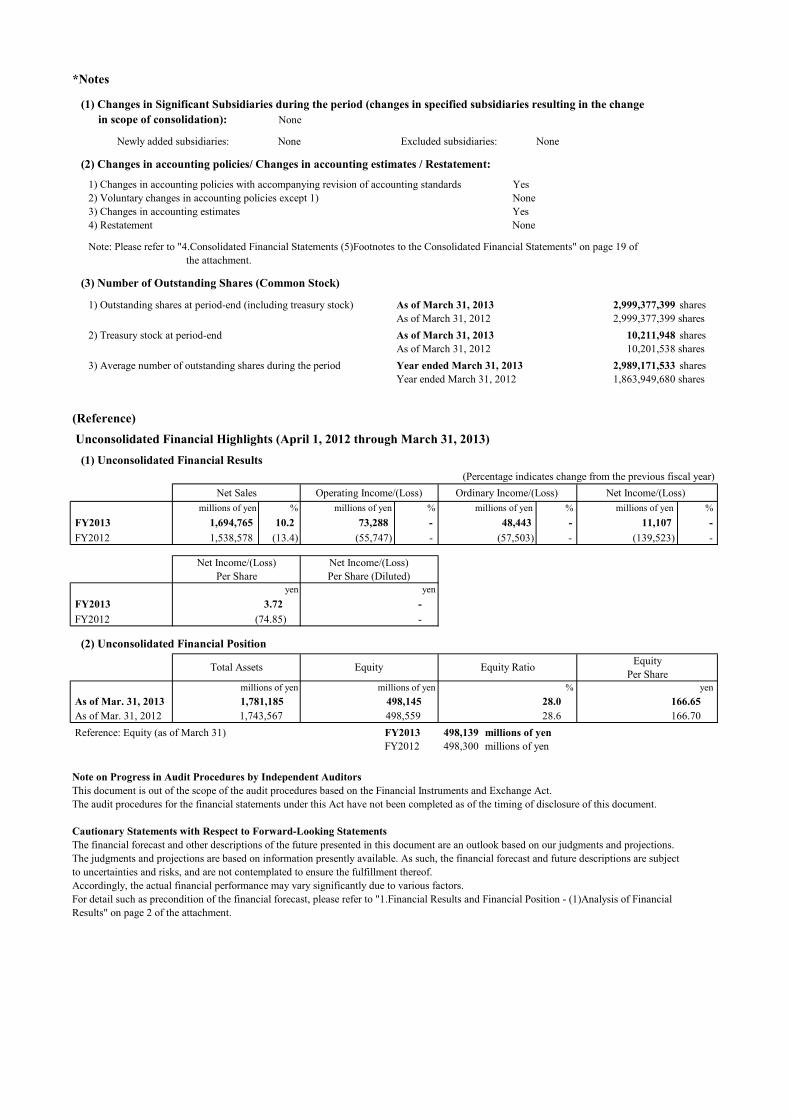
1) Changes in accounting policies with accompanying revision of accounting standards Yes
2) Voluntary changes in accounting policies except 1) None
3) Changes in accounting estimates Yes
4) Restatement None
Note: Please refer to "4.Consolidated Financial Statements (5)Footnotes to the Consolidated Financial Statements" on page 19 of
the attachment.
(3) Number of Outstanding Shares (Common Stock)
1) Outstanding shares at period-end (including treasury stock) As of March 31, 2013 shares
As of March 31, 2012 shares
2) Treasury stock at period-end As of March 31, 2013 shares
As of March 31, 2012 shares
3) Average number of outstanding shares during the period Year ended March 31, 2013 shares
Year ended March 31, 2012 shares
(Reference)
Unconsolidated Financial Highlights (April 1, 2012 through March 31, 2013)
(1) Unconsolidated Financial Results
(Percentage indicates change from the previous fiscal year)
Net Sales Operating Income/(Loss) Ordinary Income/(Loss) Net Income/(Loss)
millions of yen % millions of yen % millions of yen % millions of yen %
FY2013
FY2012
Net Income/(Loss) Net Income/(Loss)
Per Share Per Share (Diluted)yen yen
FY2013
FY2012
(2) Unconsolidated Financial Position
Equity
Per Sharemillions of yen millions of yen % yen
As of Mar. 31, 2013
As of Mar. 31, 2012
Reference: Equity (as of March 31) FY2013 millions of yen
FY2012 millions of yen
Note on Progress in Audit Procedures by Independent Auditors
This document is out of the scope of the audit procedures based on the Financial Instruments and Exchange Act.
The audit procedures for the financial statements under this Act have not been completed as of the timing of disclosure of this document.
Cautionary Statements with Respect to Forward-Looking Statements
The financial forecast and other descriptions of the future presented in this document are an outlook based on our judgments and projections.
The judgments and projections are based on information presently available. As such, the financial forecast and future descriptions are subject
to uncertainties and risks, and are not contemplated to ensure the fulfillment thereof.
Accordingly, the actual financial performance may vary significantly due to various factors.
For detail such as precondition of the financial forecast, please refer to "1.Financial Results and Financial Position - (1)Analysis of Financial
Results" on page 2 of the attachment.
2,989,171,533
1,863,949,680
-
- 11,107
(13.4) (55,747) -
Equity Ratio
-48,443
(57,503) - (139,523)
28.6
166.65
166.70
10,201,538
2,999,377,399
2,999,377,399
10,211,948
1,781,185
1,743,567
498,145
498,559
1,538,578
498,300
498,139
Total Assets Equity
1,694,765 10.2 73,288 -
28.0
3.72
(74.85)
-
-

Attachment
Table of Contents
1. Financial Results and Financial Position…………………………………………………………………………P. 2
(1) Analysis of Financial Results…………………………………………………………………………………P. 2
(2) Analysis on the Financial Position……………………………………………………………………………P. 5
(3) Dividend Policy…………………………………………………………………………………………………..P. 6
(4) Risks………………………………………………………………………………………………………….P. 6
2. Mazda Group of Companies…………………………………………………………………………………….P. 7
3. Management Policy………………………………………………………………………………………………P. 8
(1) Basic Policy of Corporate Management…………………………………………………………………….P. 8
(2) Target Business Indicators……………………………………………………………………………………P. 8
(3) Issues to be Addressed and the Mid- and Long-term Corporate Business Strategy………………….P. 10
(4) Other Important Items for the Company's Business Management……………………………………..P. 10
4. Consolidated Financial Statements……………………………………………………………………………….P. 11
(1) Consolidated Balance Sheet………………………………………………………………………………….P. 11
(2) Consolidated Statements of Operations and Comprehensive Income……………………………………..P. 13
(3) Consolidated Statement of Equity……………………………………………………………………………P. 16
(4) Consolidated Statement of Cash Flows………………………………………………………………………P. 17
(5) Footnotes to the Consolidated Financial Statements……………………………………………………………P. 19
Note on the Assumptions as Going Concern…………………..…………………..…………………..…………………..…………………..P. 19
Significant Accounting Policies in Preparing the Consolidated Financial Statements………………………P. 19
Changes in Accounting Policies / Changes in Accounting estimates / Restatement…………………………P. 22
Changes in Financial Statement Presentation…………………………………………………………………P. 22
Segment Information………………………………………………………………………………………..P. 23
Information on Amounts Per Share of Common Stock…………………………………………………….P. 25
Significant Subsequent Events…………………………………………………………………………….P. 25
5. Unconsolidated Financial Statements…………………………………………………………………………..P. 26
(1) Unconsolidated Balance Sheet………………………………………………………………………………..P. 26
(2) Unconsolidated Statement of Operations…………………………………………………………………….P. 28
(3) Unconsolidated Statement of Equity…………………………………………………………………………P. 29
(4) Footnotes to the Unconsolidated Financial Statements………………………………………………………..P. 31
Note on the Assumptions as Going Concern…………………………………………………………………………………………………..P. 31
6. Other……………………………………………………………………………………………………………..P. 31
(1) Production and Sales Information…………………………………………………………………………….P. 31
(References)
Financial Summary (Consolidated) For the Fiscal Year Ended March 2013
Financial Summary (Unconsolidated) For the Fiscal Year Ended March 2013
― 1 ―

1. Financial Results and Financial Position(1) Analysis of Financial Results
(Financial Results for the Fiscal Year Ended March 31, 2013)
Economic and business environment surrounding Mazda Group for the fiscal year ended March 31, 2013 was
as follows. Overall, a sense of economic stagnation was deepened. Although U.S. economy is in the trend of
recovery, its pace of recovery is slow and the economic stagnation in European countries has been prolonged.
And also, in emerging countries, the pace of economic expansion has slowed down, while some countries
showed signs of picking-up. In Japan, reconstruction demand following the Great East Japan Earthquake is
expected to prop up the economy and the improvement in export environment with the correction of yen
appreciation is expected to lead to economic recovery. But the outlook for the economy remains uncertain
affected by concern about downturn in overseas economy.
Under such situation, Mazda Group is stepping up its efforts to improve earnings structure by steady
implementation of key measures based on “Structural Reform Plan” and introduction of the new models with
the new generation technology, “SKYACTIV TECHNOLOGY” (hereinafter referred to as “SKYACTIV”),
which thoroughly improves the base technologies of vehicle’s core performance, to the major markets in series.
Retail volume by market for the fiscal year ended March 31, 2013 was as follows. In Japan, the retail volume
increased by 5.2% year-over-year to 216 thousand units; mainly due to the strong sales of "Mazda CX-5" and
all-new “Mazda Atenza”. On the other hand, in overseas, in North America, retail volume remained almost flat
from the previous year to 372 thousand units. In Europe, retail volume decreased by 6.2% year-over-year to
172 thousand units, while the sales of “CX-5” continue to be strong. In China, retail volume decreased by
21.5% year-over-year to 175 thousand units, while the sales are in the trend of recovery. In other areas, retail
volume increased by 13.5% year-over-year to 300 thousand units through high level of sales maintained in
Australia and ASEAN countries. As a result, the global retail volume in total was 1,235 thousand units, down
1.0% from the prior fiscal year.
Financial performance on the consolidated basis for the fiscal year ended March 31, 2013 was as follows.
Net sales amounted to ¥2,205.3 billion, increased by ¥172.2 billion year-over-year or 8.5% from the prior fiscal
year, owing to the increase in wholesale volume and the product mix improvement. Operating results
amounted to a profit of ¥53.9 billion, owing to the improvement in volume, products mix and cost.
(Consolidated operating result in the last fiscal year was a loss of ¥38.7 billion.) Ordinary results amounted to a
profit of ¥33.1 billion. (Consolidated ordinary result in the last fiscal year was a loss of ¥36.8 billion.) Net
results amounted to a profit of ¥34.3 billion. (Consolidated net result in the last fiscal year was a loss of ¥107.7
billion.)
Financial results by reportable segment were as follows.
In Japan, net sales increased by ¥148.6 billion (up 8.5%) year-over-year to ¥1,893.6 billion and segment
income (operating income) increased by ¥126.8 billion to ¥108.4 billion. In North America, net sales increased
by ¥78.3 billion (up 13.7%) year-over-year to ¥650 billion and segment loss (operating loss) increased by ¥8.6
billion to ¥48.9 billion. In Europe, net sales decreased by ¥5.7 billion (down 1.6%) year-over-year to ¥354.8
billion and segment income (operating income) decreased by ¥2.5 billion to ¥3.1 billion. In other areas, net
sales increased by ¥124.4 billion (up 42.3%) year-over-year to ¥418.7 billion and segment income (operating
income) increased by ¥6.8 billion to ¥16.8 billion.
Business overview of Mazda Group by activity for the fiscal year ended March 31, 2013 was as follows.
In terms of products, since November last year, we have launched the all-new “Mazda Atenza (called Mazda6
in overseas markets)” in the major markets as the second of Mazda's new generation of products, which
incorporate both the full range of “SKYACTIV” and the new “KODO-Soul of Motion” design theme. The
― 2 ―
all-new “Atenza” is a flagship model, which delivers responsive, high-quality, sporty driving along with
outstanding fuel economy, environmental and safety performance. With regard to the engines of all-new
“Atenza”, in addition to “SKYACTIV-D 2.2” clean diesel engine which “CX-5” received high praise for, newly
developed “SKYACTIV-G 2.5” gasoline engine which satisfies both of ample torque and a superbly quiet
cabin is newly added to the line-up. In addition, the all-new “Atenza” features "i-ACTIVSENSE", a series of
advanced safety technologies, and the real-world fuel economy is further improved with “i-stop”, Mazda's
idling stop system, and “i-ELOOP”, which is the world's first brake energy regeneration system in a passenger
vehicle to use a capacitor to store electricity.
And also, we launched the freshened versions of “Mazda CX-9” and “Mazda Premacy (called Mazda5 in
overseas markets)” to the markets in series. The facelifted “CX-9” carries over the utility and dynamic driving
performance of the previous model while adopting Mazda’s new “KODO” design theme for even sportier
styling and stronger presence. In addition, the major 2WD model grades of the facelifted “Premacy” feature
two “SKYACTIV”, a highly efficient direct injection “SKYACTIV-G 2.0” gasoline engine and a highly
efficient six-speed “SKYACTIV-DRIVE” automatic transmission, which contribute to further evolution of the
high-quality and more comfortable ride while achieving an outstanding fuel economy.
In November last year, “CX-5”, which is the first model to adopt the full suite of “SKYACTIV”, won the
“2012-2013 Car of the Year Japan”. The last Mazda to be named the Car of the Year Japan was the “Mazda
Roadster” in 2005. The “CX-5” is the fourth Mazda to win the award.
In the sales area, “CX-5” has maintained a high level of sales since its launch in February last year and was the
best selling SUV in 2012 in Japan. The mix of clean diesel engine models accounted for about 80%, exceeding
our initial forecast. And also, in Australia where we have continued strong sales trend, we marked record high
sales of 104,000 units and share of 9.3% in 2012 and “Mazda3 (called Mazda Axela in Japan)” was the best
selling model two years in a row.
In R&D area, we incorporated "i-ACTIVSENSE" technologies into the all-new “Atenza”. The
“i-ACTIVSENSE” is a series of Mazda's advanced safety technologies designed to aid the driver in
recognizing hazards, avoiding collisions and reducing the severity of accidents. The “i-ACTIVSENSE”
includes systems which automatically apply the brakes in an emergency, sound an alarm if the vehicle drifts out
of its lane, and prevent the car from taking off if the driver mistakenly steps on the accelerator instead of the
brake. At Mazda, the research and development of safety technology is based upon the company's safety
philosophy, “Mazda Proactive Safety”, which aims to minimize the risk of an accident by maximizing the
range of conditions in which the driver can safely operate the vehicle. Mazda's “i-ACTIVSENSE” is an
umbrella term covering a series of advanced safety technologies, developed in line with “Mazda Proactive
Safety”, which make use of detection devices such as milliwave radars and cameras. They includes active
safety technologies that support safe driving by helping the driver to recognize potential hazards, and pre-crash
safety technologies which help to avert collisions or reduce their severity in situations where it’s difficult to
avoid an accident. The ultimate goal of “Mazda Proactive Safety” is the realization of a collision-free
automotive society. In pursuit of this ideal Mazda will continue to expand its research and development of
safety technologies in order to provide all customers with both driving pleasure and outstanding environmental
and safety performance.
In the production area, Mazda is in the way of advancing an approach to reinforce business in emerging
countries and establish global production footprints. In May last year, Thailand plant increased the production
capacity of pickup trucks by 20,000 units per year to meet the increased global demand for all-new pickup
trucks. In Russia, we established a joint venture company with Sollers. Following the production of “CX-5”
from last October, we started to produce the all-new “Mazda6” in Russia. In China, we obtained an approval to
restructure the joint venture company to optimize our business structure and operational system. The
― 3 ―

restructuring went into effect in last November. And also, we decided to construct a transmission plant with an
annual production capacity of approximately 400,000 units in Thailand in order to respond to increasing
demand for models featuring “SKYACTIV” and to strengthen its global production footprints. Operations at
the new plant will commence in the first half of the fiscal year ending March 2016. In Malaysia, we established
a joint venture company with Bermaz and started local production (consignment production) of “CX-5”,
following the local production of “Mazda3”.
With regard to the construction of new plant in Mexico, we are making smooth progress to start operations in
the fourth quarter of the fiscal year ending March 2014. Although annual production capacity will be
approximately 140,000 units at the beginning of the operations, we are planning to further increase the
production capacity up to 230,000 units in the fiscal year ending March 2016 in order to meet the increasing
demand for SKYACTIV models that are successful globally; in addition to production of a Toyota brand
vehicle based on “Mazda2 (called Mazda Demio in Japan)” that we will produce approximately 50,000 units at
our Mexico plant starting from the summer of 2015.
With regard to the promotion of global alliances, in January this year, we signed the agreement on cooperation
with Fiat. Through this contractual agreement, we will produce an open-top two-seater sports car for Fiat’s Alfa
Romeo brand. The new Alfa Romeo roadster will be developed based on the FR architecture of the next
generation “Roadster (called Mazda MX-5 in overseas markets)” and will be produced at our Hiroshima plant
in Japan, starting from 2015. And also, we are supplying Nissan Motor Co., Ltd. with the freshened version of
“Premacy” on an OEM basis, just like previous model. This is the first time “SKYACTIV” is supplied to
another company.
(Financial Forecast for the Year Ending March 31, 2014)
With the protracted problem of the European sovereign debt crisis and the outlook for economic trends in
emerging counties, the overall operating environment is expected to remain unclear, while the correction of yen
appreciation is expected to improve corporate performance. Under such situation, Mazda Group aims to
improve the profitability through steadily carrying out “Structural Reform Plan”.
Consolidated financial forecast for next fiscal year ending March 2014 is as follows.
Our global retail volume for next fiscal year is projected to be 1,335 thousand units, up 8.1% year-over-year.
Looking at retail volume projection by market, the retail volume in Japan is projected to increase by 1.7%
year-to-year to 220 thousand units. The retail volume in North America is projected to be at 415 thousand units
(up 11.4%), 200 thousand units in Europe (up 16.6%), 200 thousand units in China (up 14.5%) and 300
thousand units in other markets (up 0.1%). The exchange rate assumption is ¥90 to the US dollar and ¥120 to
the Euro.
As for the consolidated financial performance for next fiscal year, sales revenue is projected at ¥2,480 billion, up
12.5% year-over-year. Operating income and net income are projected at ¥120 billion (up 122.5%) and ¥70
billion (up 104.1%), respectively.
Consolidated Financial Forecast for the Year Ending March 31, 2014 (April 1, 2013 through March 31, 2014)
First Half vs. Prior Year Full Year vs. Prior Year
Sales 1,120 billion yen 9.4 % 2,480 billion yen 12.5 %
Operating Income 45 292.2 120 122.5
Ordinary Income 21 4,661.9 97 193.2
Net Income 10 74.1 70 104.1
― 4 ―

Note: The forecast stated above is based on management’s judgment and views in the light of information presently available.
By nature, such forecasts are subject to risks and uncertainties, and are not contemplated to ensure the fulfillment thereof.
Therefore, we advise against making an investment decision by solely relying on this forecast. Variables that could affect the
actual financial results include, but are not limited to, the economic environments surrounding our business areas and
fluctuations in yen-to-dollar and other exchange rates.
(2) Analysis on the Financial Position
(Analysis on Assets, Liabilities, and Equity)
As of March 31, 2013, total assets amounted to ¥1,978.6 billion, an increase of ¥62.6 billion compared to the
end of the last fiscal year, mainly reflecting increases in cash and time deposits as well as inventories. Total
liabilities amounted to ¥1,465.3 billion, an increase of ¥23.8 billion compared to the end of the last fiscal year,
mainly reflecting an increase in account payable, while interest-bearing debt decreased by ¥59.1 billion from
the previous year.
Equity amounted to ¥513.2 billion, an increase of ¥38.8 billion compared to the end of the last fiscal year.
Equity ratio increased by 0.6 percentage points from the end of the last fiscal year to 25.1%. Equity ratio after
the recognition of equity credit attributes of the Subordinated Loan was 26.9%.
(Analysis on Cash Flows)
Cash and cash equivalent as of March 31, 2013 amounted to ¥444.9 billion, a decrease of ¥32.4 billion
compared to the end of the last fiscal year.
Net cash provided by operating activities was ¥49.0 billion. (For the previous fiscal year, net cash used in
operating activities was ¥9.1 billion.) Net cash used in investing activities was ¥40.3 billion, mainly reflecting
capital expenditure for the acquisition of tangible fixed assets and intangible fixed assets of ¥76.0 billion and
the proceeds from sales of investments in subsidiaries and tangible fixed assets of ¥35.9 billion. (For the
previous fiscal year, net cash used in investing activities was ¥70.3 billion.) As a result, consolidated free cash
flow (net of operating and investing activities) was positive ¥8.7 billion. (For the previous fiscal year,
consolidated free cash flow was negative ¥79.4 billion.) Also, net cash used in financing activities amounted to
¥57.2 billion, mainly reflecting the redemption of bond and payment of long-term loans payable. (For the
previous fiscal year, net cash provided by financing activities was ¥236.5 billion.)
After deducting cash and cash equivalents from financial debt, net financial debt totaled ¥274.1 billion, and the
net debt-to-equity ratio was at 55.2%. (Net-debt-to-equity ratio after the recognition of equity credit attributes
of the Subordinated Loan was at 45.0%)
(Trends of cash flow data)
As of /
Year Ended
March 31, 2009
As of /
Year Ended
March 31, 2010
As of /
Year Ended
March 31, 2011
As of /
Year Ended
March 31, 2012
As of /
Year Ended
March 31, 2013
Equity Ratio (1)
Equity Ratio (2)
22.9%
-
26.1%
-
24.2%
-
24.5%
26.3%
25.1%
26.9%
Fair Value Equity Ratio 11.9% 23.9% 18.3% 22.6% 42.5%
Cash Flow to Total Debt Ratio - 6.5 45.2 - 14.7
Interest Coverage Ratio - 8.1 1.3 - 3.6
Equity Ratio (1): Equity/Total Assets
Equity Ratio (2): Equity (after the recognition of equity credit attributes of the Subordinated Loan) / Total Assets
Fair Value Equity Ratio: Gross Market Capitalization/Total Assets
Cash Flow to Total Debt: Total Debt/Operating Cash Flow
Interest Coverage Ratio: Operating Cash Flow/Interest Payments
1) All indicators are calculated on the basis of consolidated financial values.
2) Gross Market Capitalization is calculated based on the total number of outstanding shares excluding treasury stock.
3) Cash flows from operating activities are used as “Cash Flow” for calculation purpose.
4) Total Debt includes all debts that interests are paid on among debts booked in consolidated balance sheet.
― 5 ―

(3) Dividend Policy
Our policy on distribution of earnings is to declare dividends by carefully considering each fiscal year’s financial
results and business environment. As our retained earnings carried forward are still negative as of the end of the
fiscal year ended March 31, 2013, while we reported a net profit in that fiscal year, we have decided to forgo the
payment of year-end dividends for the fiscal year ended March 31, 2013.
In addition, we are expecting that retained earnings carried forward of Mazda Motor Corporation
(Unconsolidated) will be still negative, and therefore payment of dividends is to be suspended for the next fiscal
year ending March 31. 2014. We really regret the necessity of this decision and ask for shareholders’
understanding.
(4) RisksNo significant changes from the descriptions of business risks presented in Mazda’s “Yuka Shoken Hokokusho”
(annual securities report) for the last fiscal year and the latest “Shihannki Hokokusho” (quarterly securities
report). Please see Mazda’s “Yuka Shoken Hokokusho” and “Shihannki Hokokusho” from the URL below.
(Japanese only)
Mazda Website:
http://www.mazda.co.jp/corporate/investors/library/s_report/
― 6 ―

2. Mazda Group of Companies
(Japan) (North America) (Europe) (Other areas)
S) Mazda Autozam, Inc. S) Mazda Motor S) Mazda Motors S) Mazda Australia
S) Kanto Mazda Co., Ltd. of America, Inc. (Deutschland) GmbH Pty. Ltd.
S) Tokai Mazda Hanbai Co., Ltd. S) Mazda Canada, Inc. S) Mazda Motor E) FAW Mazda Motor
S) Kansai Mazda Co., Ltd. and others Logistics Europe N.V. Sales Co., Ltd.
S) Kyusyu Mazda Co., Ltd. S) Mazda Motor Rus, OOO and others
and others and others
S) Mazda Parts Co., Ltd. S) Mazda Motor E) Mazda Sollers E) AutoAlliance
S) Mazda Chuhan, Co., Ltd. Manufacturing de Manufacturing Rus LLC (Thailand) Co., Ltd.
S) MALOX Co., Ltd. Mexico S. A. de C. V. E) Changan Mazda
S) Mazda Engineering and Automobile Co., Ltd.
Technology Co., Ltd. E) Changan Ford Mazda
E) SMM Auto Finance, Inc. Engine Co., Ltd.
and others S) Compania Colombiana
Automotriz S.A.
S) Mazda Powertrain
Manufacturing
S) Kurashiki Kako Co., Ltd. (Thailand) Co., Ltd.
E) Japan Climate Systems Corp.
and others S) Consolidated subsidiaries
E) Equity method-applied affiliates
Flows of automobiles and automotive parts
Flows of services
Mazda group of companies consists of Mazda Motor Corporation, 56 consolidated subsidiaries and 15 equity method-
applied affiliates (as of March 31, 2013) and is mainly engaged in the manufacturing and sales of automobiles and
automotive parts as well as in other automobile-related businesses.
In Japan, Mazda Motor Corporation manufactures automobiles. Mazda Motor Corporation, Kurashiki Kako Co., Ltd. and
other companies manufacture automotive parts. In overseas, AutoAlliance (Thailand) Co., Ltd. and other companies
manufacture automobiles and automotive parts. The automobiles and automotive parts manufactured by our group of
companies are sold to customers by our sales companies. In Japan, Mazda Autozam, Inc., Kanto Mazda Co., Ltd. and other
companies sell our automobiles and automotive parts to customers. To certain corporate customers, Mazda Motor
Corporation directly sells our automobiles. In overseas, the sales companies that sell our automobiles and automotive parts
to customers include Mazda Motor of America, Inc. in North America, Mazda Motors (Deutschland) GmbH in Europe,
and Mazda Australia Pty. Ltd. in Other areas, among other companies.
The following diagram approximately illustrates the roles, and the relations with segments, of Mazda Motor Corporation
and its main related companies in conducting the group's business. The segments shown are identical to those discussed in
the applicable section of the footnotes to the consolidated financial statements.
Domestic Automotive Parts
Manufacturers
Customers
Other Automobile-Related
Business Companies
Domestic Sales Companies
Mazda Motor
Corporation
Foreign Sales Companies
Foreign Automobile Manufacturers
― 7 ―
3. Management Policy
(1) Basic Policy of Corporate Management
Mazda’s Corporate Vision is comprised of three factors: “Vision” (corporate objectives) along with a
statement of “Mission” (roles and responsibilities) and “Value” (the values Mazda seeks to produce). These
principles help express what Mazda and Mazda’s employees aim for, their roles and responsibilities, and the
sense of worth with which they seek to achieve these aims. Through the realization of this Corporate Vision,
we aim to consistently augment corporate value, which we view as leading to meeting the expectations of our
stakeholders – including shareholders, customers, suppliers, employees and the community – and also leading
to realizing sustainable development of society and of Mazda.
Vision: To create new value, excite and delight our customers through the best automotive products and
services.
Mission: With passion, pride and speed, we actively communicate with our customers to deliver insightful
automotive products and services that exceed their expectations.
Value: We value integrity, customer focus, creativity, efficient and nimble actions and respect highly
motivated people and team spirit. We positively support environmental matters, safety and society.
Guided by these values, we provide superior rewards to all people associated with Mazda.
(2) Target Business Indicators
In February 2012, we announced a “Structural Reform Plan” to strengthen our “Framework for Medium- and
Long-term Initiatives”, in order to respond to harsh external environment and ensure future growth. Since the
announcement of the plan, we have forcefully advanced the structural reforms using “SKYACTIV” as the
linchpin.
Although it is expected that the harsh external environment may be continued, we will maintain the current
momentum and further advance/accelerate the “Structural Reform Plan” so that we can go up to the next stage.
The principal measures set forth in the “Structural Reform Plan” and its progress are as follows.
1. Business innovation by SKYACTIV
We are launching new vehicles equipped with the new generation technology, “SKYACTIV”, in series,
which delivers the ultimate improvement of the base technology of the vehicles. With such base technology,
we are combining electric device technologies step by step, which we call “Building Block Strategy”.
“SKYACTIV” has received excellent feedback from various quarters and high reputation since the
introduction to the markets, which continuously improve the brand value. The “Mazda CX-5”, which is the
first model fully equipped with “SKYACTIV”, received high praise because of its styling based on Mazda’s
“KODO” new design theme as well as the vehicle dynamics that combine driving performance and fuel
economy at the same time. In November last year, the “CX-5” won the “2012-2013 Car of the Year Japan”.
On the sales front, the “CX-5” became a big hit, significantly contributing to minimizing incentives as well
as improving residual value and profit. And also, starting in Japan, we globally launched the all-new
“Mazda Atenza” as the second of Mazda's new generation of products, which incorporate both the full
range of “SKYACTIV” and the “KODO” new design theme. Sales of the “CX-5” have been exceeding our
initial sale plan since its launch. Especially, “SKYACTIV-D” clean diesel engine models, just as “CX-5”,
have received high praise, creating a new market for clean diesel in Japan.
Using “SKYACTIV”, we will advance product strength, the brand, and design, while building a cost
structure that can respond to a strong yen environment. This will also drive technological innovation as well
as our business innovation itself.
― 8 ―

2. Accelerate further cost improvement through “Monotsukuri Innovation”
We are accelerating further cost improvement actions through “Monotsukuri Innovation”, improving
vehicles’ performance at the same time.
Cost improvement of new generation products, starting with “CX-5” and continuing with the all-new
“Atenza” is proceeding according to the plan. In addition to the improvement in product marketability, we
are also steadily making progress in vehicle development that is profitable even in the strong yen
environment. We also reinforce our business structure against exchange fluctuations by promoting optimum
global procurements and expanding sourcing in foreign currencies continuously.
3. Reinforce business in emerging countries and establish global production footprints
To aim at the increase in retail volume in emerging markets, we have achieved steady results of increase in
sales and expansion of production bases in the markets. At the same time, we have accelerated our actions
to establish global production footprints.
In Russia, we established a joint venture company with Sollers. Following the production of “CX-5” from
last October, we started to produce the all-new “Mazda6” in Russia. In China, to meet market needs and
strengthen business through optimizing business structure and operational system, we restructured the joint
venture company. In Thailand, in addition to the expansion of the production capacity at vehicle plant, we
decided to construct a transmission plant in order to meet the increasing demand for “SKYACTIV” models
and to establish stronger global production footprints. In Malaysia, we established a joint venture company
with Bermaz and started local production (consignment production) of “CX-5”, following the local
production of “Mazda3”. The construction of our plant in Mexico is also progressing smoothly. We decided
to further increase production capacity from the original 140,000 to 230,000 units in order to produce a
Toyota brand vehicle and to meet the increasing demand for “SKYACTIV” models that are successful
globally.
We will steadily promote the establishment of well-balanced production footprints globally, while
maintaining domestic production at a certain level.
4. Promote Global Alliance
In order to strengthen the Mazda brand, we are proactively pursuing an alliance strategy to build appropriate
and complimentary relationships in individual products, technologies, and regions.
Following the licensing of hybrid system technology from Toyota Motor Corporation, we will start the
production of a Toyota brand vehicle at our Mexico plant from the summer of 2015. In addition, we signed
the agreement on cooperation with Fiat. Through this contractual agreement, we will produce an open-top
two-seater sports car at our Hiroshima plant in Japan. And also, we are supplying Nissan Motor Co., Ltd.
with the “SKYACTIV” equipped model on an OEM basis. Through this OEM supply, we aim to improve
our business efficiency. And we are planning to start the sales of light automobiles with 3 rows of seats,
which SUZUKI MOTOR CORPORTAION will supply in Indonesia.
The business indices in the fiscal year ending March 2016, which we announced in “Structural Reform
Plan” to strengthen our “Framework for Medium- and Long-term Initiatives”, are as follows.
Outlook of business indices in the Fiscal Year ending March 2016
- Global sales volume: 1.7 million units
- Consolidated operating profit: 150 billion yen
- ROS (Consolidated operating return on sales): 6% or more
― 9 ―

Please note that business indicators and other descriptions of the future are based on certain assumptions
judged by Mazda Group as of March 31, 2013. Such description may differ from the actual results and
the achievement of such description is not guaranteed in any way.
(3) Issues to be Addressed and the Mid- and Long-term Corporate Business Strategy
Under the uncertain economic situation, including the prolonged economic stagnation in European countries and
stagnation of economic growth in emerging counties, we will actively continue and strengthen the measures to
improve the cost structure and invest in manufacturing and sales bases in Mexico and ASEAN countries, etc.
and environmental and safety technologies. In the medium- and long-term, as stated in (2) Target Business
Indicators, we will advance “Structural Reform Plan” using “SKYACTIV” to reinforce “Framework for
Medium- and Long-term Initiatives” and push through fundamental structural reforms so that Mazda Group can
realize a steady growth in the future and profitability even in an environment with strong yen.
(4) Other Important Items for the Company’s Business Management
Mazda formed a global partnership with the Ford Motor Company in 1979, and since then both companies have
further developed and strengthened their cooperative relationship. An agreement was concluded in 1996 to
further bolster that relationship with an increase in Ford’s equity in Mazda’s total shares outstanding to 33.4%.
On November 19, 2008, Ford sold a portion of its shareholding, reducing its stake in Mazda to 13.8%.
Subsequently, Mazda carried out a capital increase by means of public offering; the payment date was October
21, 2009. Mazda also carried out a capital increase by means of third-party allotment; the payment date was
November 12, 2009. As a consequence of these capital increases, Ford’s shareholding was reduced to 11.0% of
Mazda’s total shares outstanding. On November 19, 2010, Ford sold a part of its stake in Mazda. As a
consequence, Ford owned 3.5% of Mazda’s outstanding shares. Further, Mazda carried out a capital increase by
means of public offering; the payment date was March 12, 2012. Mazda also carried out a capital increase by
means of third-party allotment; the payment date was March 27, 2012. Though Ford’s stake in Mazda decreased
to 2.1% as a result of aforementioned capital increase, Ford is still one of Mazda’s largest shareholders and, as
such, the two companies have agreed to continue their strategic partnership. The two companies will continue to
collaborate on areas of mutual benefit, such as key joint ventures, joint projects, and exchange of technology
information.
― 10 ―

4. Consolidated Financial Statements
(1) Consolidated Balance Sheet
(Millions of Yen)
As of
ASSETS
Current Assets:
228,442 301,133
166,008 171,770
Securities 249,874 144,871
Inventories 216,190 265,687
Deferred tax assets 45,997 59,999
Other 84,643 85,019
Allowance for doubtful receivables (1,457) (1,002)
989,697 1,027,477
Fixed Assets:
Tangible fixed assets:
142,094 139,035
157,070 156,150
Tools, furniture, and fixtures (net) 18,518 19,605
Land 426,700 409,926
Leased assets (net) 8,391 5,245
Construction in progress 31,319 54,307
144 123
784,236 784,391
18,463 18,336
2,273 2,121
20,736 20,457
Investments and other fixed assets:
93,358 120,806
Long-term loans receivable 5,411 5,552
Deferred tax assets 6,035 5,155
20,781 19,311
(3,787) (4,058)
(524) (524)
121,274 146,242
926,246 951,090
Total Assets 1,915,943 1,978,567
FY2012
March 31, 2012
FY2013
March 31, 2013
Total fixed assets
Other
Investment valuation allowance
Total investments and other fixed assets
Buildings and structures (net)
Total intangible fixed assets
Allowance for doubtful receivables
Other (net)
Total tangible fixed assets
Intangible fixed assets:
Investment securities
Cash and time deposits
Trade notes and accounts receivable
Total current assets
Software
Machinery and vehicles (net)
Other
― 11 ―

(Millions of Yen)
As of
LIABILITIES
Current Liabilities:
Trade notes and accounts payable 244,405 279,642
Short-term loans payable 65,842 97,833
Long-term loans payable due within one year 41,439 91,518
Bonds due within one year 45,100 10,100
Lease obligations 7,702 2,652
Income taxes payable 8,684 11,454
Other accounts payable 23,040 22,146
Accrued expenses 119,346 145,706
Reserve for warranty expenses 33,178 28,626
Other 34,063 69,235
Total current liabilities 622,799 758,912
Fixed Liabilities:
Bonds 50,650 40,550
Long-term loans payable 563,043 473,115
Lease obligations 4,309 3,215
Deferred tax liability related to land revaluation 79,774 75,209
Employees' and executive officers' severance and retirement benefits 76,150 69,790
Reserve for loss from business of affiliates 7,671 6,957
Reserve for environmental measures 1,494 1,577
Other 35,624 36,016
Total fixed liabilities 818,715 706,429
Total Liabilities 1,441,514 1,465,341
EQUITY
Capital and Retained Earnings:
Common stock 258,957 258,957
Capital surplus 242,649 242,649
Retained earnings (88,715) (46,299)
Treasury stock (2,190) (2,192)
Total capital and retained earnings 410,701 453,115
Accumulated Other Comprehensive Income/(Loss):
Net unrealized gain/(loss) on available-for-sales securities (160) 409
Net gain/(loss) on derivative instruments (3,529) (15,064)
Land revaluation 143,108 135,565
Foreign currency translation adjustments (76,833) (72,200)
Pension adjustments recognized by foreign consolidated subsidiaries (4,433) (5,513)
Total accumulated other comprehensive income/(loss) 58,153 43,197
Stock Acquisition Rights 259 6
Minority Interests in Consolidated Subsidiaries 5,316 16,908
Total Equity 474,429 513,226
Total Liabilities and Equity 1,915,943 1,978,567
FY2012
March 31, 2012
FY2013
March 31, 2013
― 12 ―
(2) Consolidated Statements of Operations and Comprehensive Income
Consolidated Statement of Operations(Millions of Yen)
For the years ended
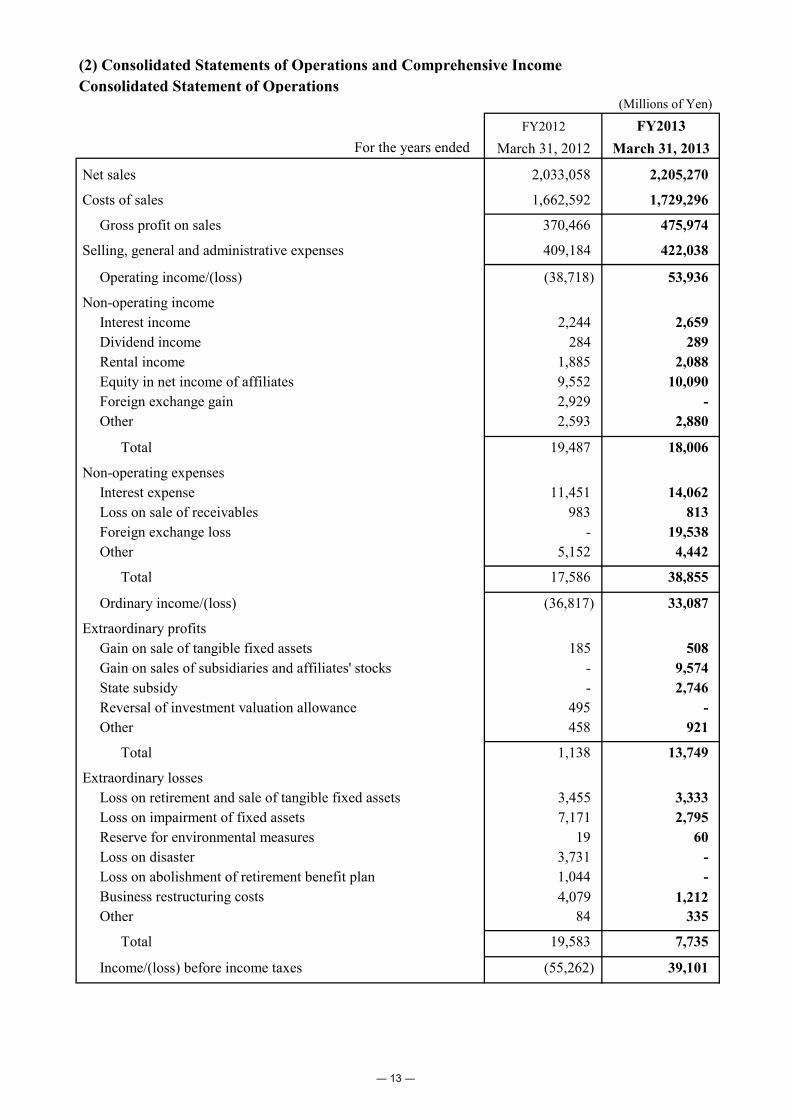
Net sales 2,033,058 2,205,270
Costs of sales 1,662,592 1,729,296
Gross profit on sales 370,466 475,974
409,184 422,038
Operating income/(loss) (38,718) 53,936
2,244 2,659
284 289
Rental income 1,885 2,088
Equity in net income of affiliates 9,552 10,090
Foreign exchange gain 2,929 -
Other 2,593 2,880
Total 19,487 18,006
Interest expense 11,451 14,062
Loss on sale of receivables 983 813
Foreign exchange loss - 19,538
Other 5,152 4,442
Total 17,586 38,855
Ordinary income/(loss) (36,817) 33,087
185 508
Gain on sales of subsidiaries and affiliates' stocks - 9,574
State subsidy - 2,746
Reversal of investment valuation allowance 495 -
Other 458 921
Total 1,138 13,749
3,455 3,333
7,171 2,795
Reserve for environmental measures 19 60
Loss on disaster 3,731 -
Loss on abolishment of retirement benefit plan 1,044 -
Business restructuring costs 4,079 1,212
Other 84 335
Total 19,583 7,735
Income/(loss) before income taxes (55,262) 39,101
March 31, 2012
Interest income
Dividend income
Non-operating expenses
Selling, general and administrative expenses
Non-operating income
FY2013
March 31, 2013
Extraordinary losses
Extraordinary profits
Gain on sale of tangible fixed assets
Loss on retirement and sale of tangible fixed assets
Loss on impairment of fixed assets
FY2012
― 13 ―

(Millions of Yen)
For the years ended March 31, 2012
FY2013
March 31, 2013
FY2012
Current 15,755 16,231
Prior years (2,158) -
Deferred 38,759 (11,606)
Total 52,356 4,625
Income/(loss) before minority interests (107,618) 34,476
115 172
Net income/(loss) (107,733) 34,304
Income taxes
Minority interests in consolidated subsidiaries
― 14 ―

Consolidated Statement of Comprehensive Income(Millions of Yen)
For the years ended
Income/(loss) before minority interests (107,618) 34,476
Other comprehensive income/(loss)
Net unrealized gain/(loss) on available-for-sale securities 8 542
Net gain/(loss) on derivative instruments (719) (11,366)
11,250 -
Foreign currency translation adjustments (1,494) (4,497)
(2,106) (1,080)
(3,832) 10,337
Total 3,107 (6,064)
Comprehensive income/(loss) (104,511) 28,412
Comprehensive income/(loss) attributable to:
Owners of the parent (104,871) 26,891
Minority interests 360 1,521
Share of other comprehensive income/(loss) of
equity method-applied affiliates
Revaluation reserve for land
Pension adjustments recognized by foreign
consolidated subsidiaries
FY2012
March 31, 2012
FY2013
March 31, 2013
― 15 ―
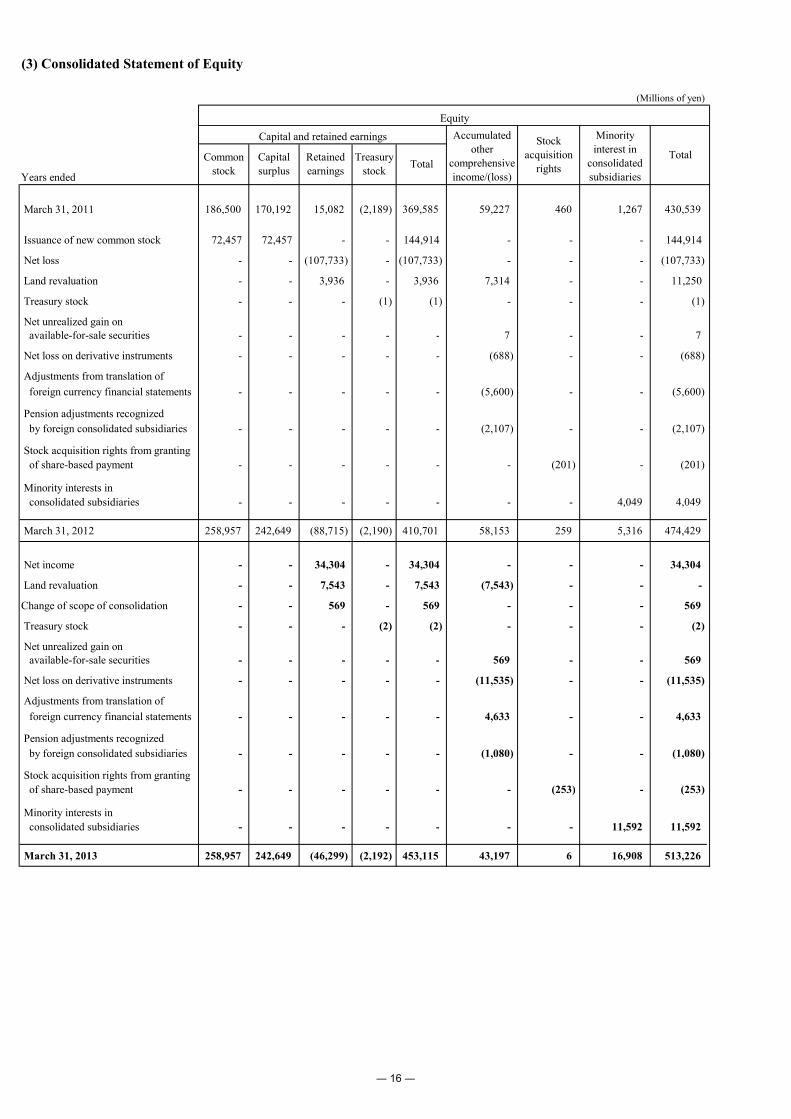
(3) Consolidated Statement of Equity
(Millions of yen)
Years ended
March 31, 2011 186,500 170,192 15,082 (2,189) 369,585 59,227 460 1,267 430,539
Issuance of new common stock 72,457 72,457 - - 144,914 - - - 144,914
Net loss - - (107,733) - (107,733) - - - (107,733)
Land revaluation - - 3,936 - 3,936 7,314 - - 11,250
Treasury stock - - - (1) (1) - - - (1)
Net unrealized gain onavailable-for-sale securities - - - - - 7 - - 7
Net loss on derivative instruments - - - - - (688) - - (688)
Adjustments from translation of
foreign currency financial statements - - - - - (5,600) - - (5,600)
Pension adjustments recognized
by foreign consolidated subsidiaries - - - - - (2,107) - - (2,107)
Stock acquisition rights from granting
of share-based payment - - - - - - (201) - (201)
Minority interests in
consolidated subsidiaries - - - - - - - 4,049 4,049
March 31, 2012 258,957 242,649 (88,715) (2,190) 410,701 58,153 259 5,316 474,429
Net income - - 34,304 - 34,304 - - - 34,304
Land revaluation - - 7,543 - 7,543 (7,543) - - -
Change of scope of consolidation - - 569 - 569 - - - 569
Treasury stock - - - (2) (2) - - - (2)
Net unrealized gain onavailable-for-sale securities - - - - - 569 - - 569
Net loss on derivative instruments - - - - - (11,535) - - (11,535)
Adjustments from translation of
foreign currency financial statements - - - - - 4,633 - - 4,633
Pension adjustments recognized
by foreign consolidated subsidiaries - - - - - (1,080) - - (1,080)
Stock acquisition rights from granting
of share-based payment - - - - - - (253) - (253)
Minority interests in
consolidated subsidiaries - - - - - - - 11,592 11,592
March 31, 2013 258,957 242,649 (46,299) (2,192) 453,115 43,197 6 16,908 513,226
Capital and retained earnings
Common
stock
Capital
surplus
Retained
earnings
Treasury
stock
Equity
Accumulated
other
comprehensive
income/(loss)
Stock
acquisition
rights
Minority
interest in
consolidated
subsidiaries
TotalTotal
― 16 ―

(4) Consolidated Statement of Cash Flows
(Millions of Yen)
For the years ended
Cash flows from operating activities:Income/(loss) before income taxes (55,262) 39,101
Adjustments to reconcile income/(loss) before income taxes to net cash
provided by/(used in) operating activities:
Depreciation and amortization 68,791 59,954
Loss on impairment of fixed assets 7,171 2,795
Allowance for doubtful receivables (245) 113
Investment valuation allowance (495) -
Reserve for warranty expenses (9,378) (4,552)
Employees' and executive officers' severance and retirement benefits (2,134) (5,739)
Reserve for loss from business of affiliates (2,327) (714)
Reserve for environmental measures 19 60
Interest and dividend income (2,528) (2,948)
Interest expense 11,451 14,062
Equity in net loss/(income) of affiliates (9,552) (10,090)
Loss/(gain) on retirement and sale of tangible fixed assets 3,270 2,721
Loss/(gain) on sale of investment securities 36 (329)
Loss/(gain) on sales of subsidiaries and affiliates' stocks - (9,574)
State subsidy - (2,746)
Decrease/(increase) in trade notes and accounts receivable (15,709) (4,532)
Decrease/(increase) in inventories (28,185) (37,187)
Increase/(decrease) in trade notes and accounts payable 37,551 33,994
Increase/(decrease) in other current liabilities 2,142 21,716
Other 7,581 (20,686)
Subtotal 12,197 75,419
Interest and dividends received 3,112 3,075
Interest paid (11,267) (13,678)
Income taxes refunded/(paid) (13,140) (15,783)
Net cash provided by/(used in) operating activities (9,098) 49,033
Cash flows from investing activities:Payments into time deposits (1,000) (3,644)
Proceeds from withdrawal of time deposits - 3,574
Purchase of investment securities (12) (5,097)
Proceeds from sale and redemption of investment securities 600 1,166
Acquisition of tangible fixed assets (61,724) (69,899)
Proceeds from sale of tangible fixed assets 1,412 16,065
Proceeds from state subsidy - 2,746
Acquisition of intangible fixed assets (8,160) (6,110)
Decrease/(increase) in short-term loans receivable (1,321) 1,317
Long-term loans receivable made (319) (467)
Collections of long-term loans receivable 219 345
Proceeds from sales of investments in subsidiaries resulting in
change in scope of consolidation - 19,804
Other (12) (87)
Net cash used in investing activities (70,317) (40,287)
FY2012
March 31, 2012
FY2013
March 31, 2013
― 17 ―

(Millions of Yen)
For the years ended
FY2012
March 31, 2012
FY2013
March 31, 2013
Cash flows from financing activities:Increase/(decrease) in short-term loans payable (9,983) 25,683
Proceeds from long-term loans payable 227,550 2,680
Repayment of long-term loans payable (96,492) (41,647)
Redemption of bonds (20,100) (45,100)
Proceeds from issuance of common stock 144,656 -
Payment of lease obligations (12,858) (7,980)
Proceeds from stock issuance to minority shareholders 3,691 9,364
Cash dividends paid to minority shareholders (1) (15)
Treasury stock transactions (1) (2)
Other - (164)
Net cash provided by/(used in) financing activities 236,462 (57,181)
(2,589) 15,041
Net increase/(decrease) in cash and cash equivalents 154,458 (33,394)
Cash and cash equivalents at beginning of the period 322,849 477,307Increase/(decrease) in cash and cash equivalents resulting from
change of scope of consolidation - 962
Cash and cash equivalents at end of the period 477,307 444,875
Effects of exchange rate fluctuations on cash and cash equivalents
― 18 ―

(5) Footnotes to the Consolidated Financial Statements
(Note on the Assumptions as Going Concern)
There are no matters to be discussed.
(Significant Accounting Policies in Preparing the Consolidated Financial Statements)
1. Consolidation Scope and Application of Equity Method1) Consolidated Subsidiaries 56
Overseas 33 Mazda Motor of America, Inc.Mazda Motors (Deutschland) GmbH and others
Domestic 23 15 dealers and 8 others
2) Equity Method-Applied Affiliates 15
Overseas 6 AutoAlliance (Thailand) Co., Ltd.Changan Mazda Automobile Co., Ltd. and others
Domestic 9 2 automotive parts sales companies and 7 others
2. Changes in Consolidation Scope and Application of Equity MethodThe changes in Consolidation Scope and Application of Equity Method are as follow.1) Consolidated Subsidiaries
(Newly added) 4Overseas 4 (increased in materiality)
Logistics Alliance (Thailand) Co., Ltd.Kurashiki Kako (Dalian) Co., Ltd.
(newly founded)Mazda Malaysia Sdn. Bhd.Mazda Powertrain Manufacturing (Thailand) Co., Ltd.
(Excluded) 4Overseas 2 (decrease in the ratio of voting right with an allocation of
new shares to a third party)MAZDA SOLLERS Manufacturing Rus LLC (Note: its company
name was changed from Mazda Motor Manufacturing Rus, OOO)
(liquidation)Mazda America Real Estate LLC
Domestic 2 (transfer of stocks)Toyo Advanced Technologies Co., Ltd.Microtechno Corporation
2) Equity Method-Applied Affiliates(Newly added) 3
Overseas 2 (new joint venture companies)MAZDA SOLLERS Manufacturing Rus LLCChangan Mazda Automobile Co., Ltd.
Domestic 1 (decrease in the ratio of voting right)Toyo Advanced Technologies Co., Ltd.
(Excluded) 1
Overseas 1 (restructuring)Changan Ford Mazda Automobile Co., Ltd.
― 19 ―

3. Accounting Periods of Consolidated SubsidiariesThe year-end consolidated balance sheet date is March 31. Among the consolidated subsidiaries, the followingsubsidiaries have a year-end balance sheet date (in its statutory financial statements) different from theyear-end consolidated balance sheet date.
(Company name) (Balance sheet date)Compania Colombiana Automotriz S.A. December 31 (Note 1)Vehiculos Mazda de Venezuela C.A. December 31 (Note 1)Mazda Motor (China) Co., Ltd. December 31 (Note 2)Mazda South East Asia, Ltd. December 31 (Note 2)Mazda Motor de Mexico, S. de R.L de C.V. December 31 (Note 1)Mazda Servicios de Mexico, S. de R.L de C.V. December 31 (Note 1)Mazda Motor Manufacturing de Mexico S.A.de C.V. December 31 (Note 1)Mazda Motor Operaciones de Mexico S.A.de C.V. December 31 (Note 1)Mazda Motor Rus, OOO December 31 (Note 1)Mazda Motor do Brasil Ltda December 31 (Note 2)Logistics Alliance (Thailand) Co., Ltd. December 31 (Note 2)Kurashiki Kako (Dalian) Co., Ltd. December 31 (Note 2)Mazda Malaysia Sdn. Bhd. December 31 (Note 2)Mazda Powertrain Manufacturing (Thailand) Co., Ltd. December 31 (Note 2)
(Note 1) In preparing the consolidated financial statements, special purpose financial statements prepared forconsolidation as of the consolidated balance sheet date are used.
(Note 2) In preparing the consolidated financial statements, adjustments necessary in consolidation were madefor material transactions that occurred between the balance sheet dates (in its statutory financial statements) ofthese subsidiaries and the consolidated balance sheet date.
4. Accounting Policies
1) Valuation Standards and Methods of Significant Assets
a) SecuritiesAvailable-for-sale securities
With available fair value: Recorded at fair value estimated based on quoted market prices on thebalance sheet date, with unrealized gains and losses excluded fromincome and reported in a separate component of equity net of tax. Thebases of cost are on a historical cost basis mainly based on a movingaverage method.
Without available fair value: Recorded at cost on a historical cost basis mainly on a moving averagemethod.
b) Derivative instruments: Mainly a fair value method.
c) Inventories: For inventories that are held for the purpose of sales in the normalcourse
of business, inventories are recorded mainly on a historical cost basisbased on an average method. (The carrying value in the consolidatedbalance sheet is determined by the lower of cost or net realizable value.)
2) Depreciation and Amortization Methods of Significant Fixed Assets
a) Tangible Fixed Assets (excluding leased assets)Mainly a straight-line method over the estimated useful lives of the assets with an assumed residual value atone yen (i.e. memorandum value).
b) Intangible Fixed Assets (excluding leased assets)Straight-line method with periods of useful life estimated by a method equivalent to the provisions ofJapanese income tax law. Software for internal use is amortized on a straight-line basis over the period ofinternal use, i.e., 5 years.
c) Leased assets
― 20 ―

For finance leases which do not transfer ownership, depreciation or amortization expense is recognized on astraight-line basis over the lease period. For leases with a guaranteed minimum residual value, the contractedresidual value is considered to be the residual value for financial accounting purposes. For other leases, theresidual value is zero.
3) Standards for Recognition of Reserves
a) Allowance for doubtful receivablesAllowance for doubtful receivables provides for the losses from bad debt. The amount estimated to beuncollectible is recognized. For receivables at an ordinary risk, the amount is estimated based on the pastdefault ratio. For receivables at a high risk and receivables from debtors under bankruptcy proceedings, theamount is estimated based on the financial standing of the debtor.
b) Investment valuation allowanceInvestment valuation allowance provides for losses from investments. The amount is estimated in light ofthe financial standings of the investee companies.
c) Reserve for warranty expensesReserve for warranty expenses provides for after-sales expenses of products (vehicles). The amount isestimated per product warranty provisions and actual costs incurred in the past, taking future prospects intoconsideration.
d) Employees’ and executive officers’ severance and retirement benefitsEmployees’ and executive officers’ severance and retirement benefits provide for the costs of severance andretirement benefits to employees and executive officers. For employees’ severance and retirement benefits,the amount estimated to have been incurred as of the end of the current fiscal year is recognized based onthe estimated amount of liabilities for severance and retirement benefits and the estimated fair value of thepension plan assets at the end of the current fiscal year. The recognition of prior service cost is deferred on astraight-line basis over a period equal to or less than the average remaining service period of employees atthe time such cost is incurred (mainly 12 years). The recognition of actuarial differences is also deferred onthe straight-line basis over a period equal to or less than the average remaining service period of employeesat the time such gains or losses are realized (mainly 13 years). The amortization of net gains or losses startsfrom the fiscal year immediately following the year in which such gains or losses arise. For executiveofficers’ retirement benefits, the liability is provided for the amount that would be required by the internalcorporate policy if all the eligible executive officers retired at the balance sheet date.
e) Reserve for loss from business of affiliatesReserve for loss from business of affiliates provides for losses from affiliates’ businesses. The amount ofloss estimated to be incurred by Mazda Motor Corporation is recognized.
f) Reserve for environmental measuresReserve for environmental measures provides for expenditure aimed at environmental measures. Theamount of future expenditure estimated as of the end of the current fiscal year is recognized.
4) Foreign Currency TranslationReceivables and payables denominated in foreign currencies are translated into Japanese yen at the exchangerate on the fiscal year end; gains and losses in foreign currency translation are included in the income of thecurrent period. Balance sheets of consolidated foreign subsidiaries are translated into Japanese yen at the rateson the fiscal year ends of the subsidiaries’ accounting periods except for equity accounts, which are translated atthe historical rates. Income statements of consolidated foreign subsidiaries are translated at average rates of thesubsidiaries’ fiscal years, with the translation differences prorated and included in the equity as foreign currencytranslation adjustments and minority interests.
5) Accounting for Hedging ActivitiesFull-deferral hedge accounting is mainly applied. Also, for certain interest rate swap contracts that are used ashedges and meet certain hedging criteria, the net amount to be paid or received under the interest rate swapcontract is added to or deducted from the interest on the assets or liabilities for which the interest rate swapcontract was executed.
― 21 ―

6) Amortization of GoodwillGoodwill is amortized on a straight-line basis over a period (primarily 5 years) during which each investment isexpected to generate benefits.
7) Cash and Cash Equivalents in the Consolidated Statement of Cash FlowsCash and cash equivalents consist of cash on hand, bank deposits that can be readily withdrawn, and short-term,highly liquid investments with maturities of three months or less at the time of acquisition that presentinsignificant risk of changes in value.
8) Othersa) Accounting for Consumption Taxes
Tax-excluded methodIn addition, any non-deductible consumption taxes associated with asset purchases are recorded as anexpense during the current fiscal year.
a) Adoption of Consolidated taxation systemConsolidated taxation system with domestic subsidiaries has been adopted since the current consolidatedfiscal year.
(Changes in accounting policies / Changes in accounting estimates / Restatement)
(Changes in accounting estimates)Useful lives and residual values of tangible fixed assets of Mazda were estimated by a method equivalent to the
provisions of Japanese Corporation Tax Law until last Fiscal Year ended March 31, 2012.
The use of machinery and equipment, tools, furniture and fixtures was investigated as the utility of production
facility is broadened in line with the introduction of the next generation models equipped with SKYACTIV,
manufactured by flexible production system led by Monotsukuri (Manufacturing) Innovation and the increase in
investment in associated production facility.
As a result of the above mentioned research, useful lives for most of the tangible fixed assets turned out to be
longer. The effect of the change in useful lives was recognized prospectively from the Fiscal Year ended March 31,
2013. Also, residual values for all of the tangible fixed assets were revised as it will be one yen (i.e. memorandum
value) at the end of the useful lives.
By the above mentioned changes in useful lives, operating income for the Fiscal Year ended March 31, 2013
increased by ¥5,114 million, ordinary income and income before income taxes increased by ¥5,269 million,
respectively.
(Changes in accounting policies which are difficult to distinguish from changes in accounting estimates)From the Fiscal Year ended March 31, 2013, domestic consolidated subsidiaries changed the depreciation method
due to the revision of Japanese Corporation Tax Law for depreciable assets acquired on or after April 1, 2012. The
effect of this change on the consolidated statement of operations for the Fiscal Year ended March 31, 2013 is
immaterial.
(Changes in Financial Statement Presentation)
(Consolidated Statement of Operations)The amounts of “Extraordinary profits-Gain on reversal of subscription rights to shares” and “Extraordinary
profits-Compensation for the exercise of eminent domain” for the previous fiscal year are included in
“Extraordinary profits-Other” for the fiscal year ended March 31, 2013 due to decrease in materiality. For the
purpose of reflecting this change in financial statement presentation, we reclassified Consolidated Financial
Statements for the fiscal year ended March 31, 2012.
As a result of this change, ¥201 million presented as “Extraordinary profits-Gain on reversal of subscription rights
to shares” and ¥257 million presented as “Extraordinary profits-Compensation for the exercise of eminent domain”
for the fiscal year ended March 31, 2012 were reclassified to “Extraordinary profits-Other” of ¥458 million.
― 22 ―
(Segment Information)
1) Overview of Reportable Segments
2) Measurement of Sales, Income or Loss, Assets, and Other Items by Reportable Segments
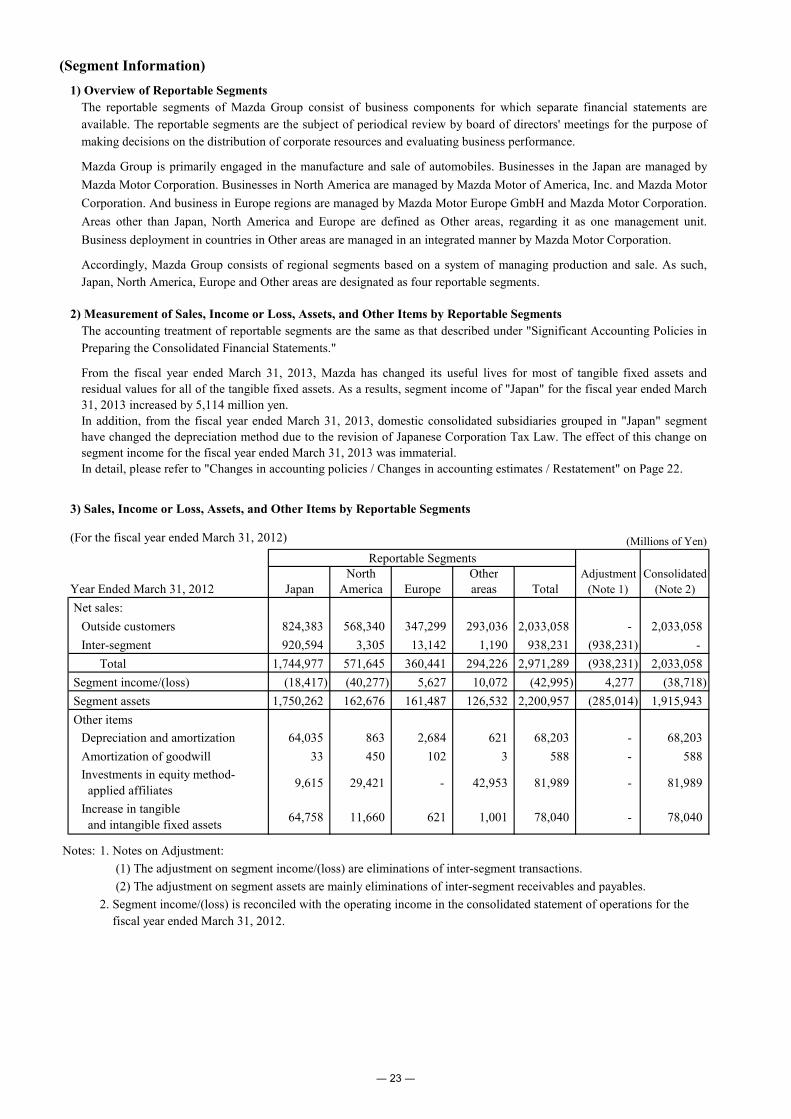
3) Sales, Income or Loss, Assets, and Other Items by Reportable Segments
(For the fiscal year ended March 31, 2012) (Millions of Yen)
Reportable SegmentsNorth Other Adjustment Consolidated
Year Ended March 31, 2012 Japan America Europe areas Total (Note 1) (Note 2)
Net sales:
Outside customers 824,383 568,340 347,299 293,036 2,033,058 - 2,033,058
Inter-segment 920,594 3,305 13,142 1,190 938,231 (938,231) -
Total 1,744,977 571,645 360,441 294,226 2,971,289 (938,231) 2,033,058
Segment income/(loss) (18,417) (40,277) 5,627 10,072 (42,995) 4,277 (38,718)
Segment assets 1,750,262 162,676 161,487 126,532 2,200,957 (285,014) 1,915,943
Other items
Depreciation and amortization 64,035 863 2,684 621 68,203 - 68,203
Amortization of goodwill 33 450 102 3 588 - 588
9,615 29,421 - 42,953 81,989 - 81,989
64,758 11,660 621 1,001 78,040 - 78,040
Notes: 1. Notes on Adjustment:
(1) The adjustment on segment income/(loss) are eliminations of inter-segment transactions.
(2) The adjustment on segment assets are mainly eliminations of inter-segment receivables and payables.
2. Segment income/(loss) is reconciled with the operating income in the consolidated statement of operations for the
fiscal year ended March 31, 2012.
Investments in equity method-
applied affiliates
Increase in tangible
and intangible fixed assets
The reportable segments of Mazda Group consist of business components for which separate financial statements are
available. The reportable segments are the subject of periodical review by board of directors' meetings for the purpose of
making decisions on the distribution of corporate resources and evaluating business performance.
Mazda Group is primarily engaged in the manufacture and sale of automobiles. Businesses in the Japan are managed by
Mazda Motor Corporation. Businesses in North America are managed by Mazda Motor of America, Inc. and Mazda Motor
Corporation. And business in Europe regions are managed by Mazda Motor Europe GmbH and Mazda Motor Corporation.
Areas other than Japan, North America and Europe are defined as Other areas, regarding it as one management unit.
Business deployment in countries in Other areas are managed in an integrated manner by Mazda Motor Corporation.
Accordingly, Mazda Group consists of regional segments based on a system of managing production and sale. As such,
Japan, North America, Europe and Other areas are designated as four reportable segments.
The accounting treatment of reportable segments are the same as that described under "Significant Accounting Policies in
Preparing the Consolidated Financial Statements."
From the fiscal year ended March 31, 2013, Mazda has changed its useful lives for most of tangible fixed assets and
residual values for all of the tangible fixed assets. As a results, segment income of "Japan" for the fiscal year ended March
31, 2013 increased by 5,114 million yen.
In addition, from the fiscal year ended March 31, 2013, domestic consolidated subsidiaries grouped in "Japan" segment
have changed the depreciation method due to the revision of Japanese Corporation Tax Law. The effect of this change on
segment income for the fiscal year ended March 31, 2013 was immaterial.
In detail, please refer to "Changes in accounting policies / Changes in accounting estimates / Restatement" on Page 22.
― 23 ―
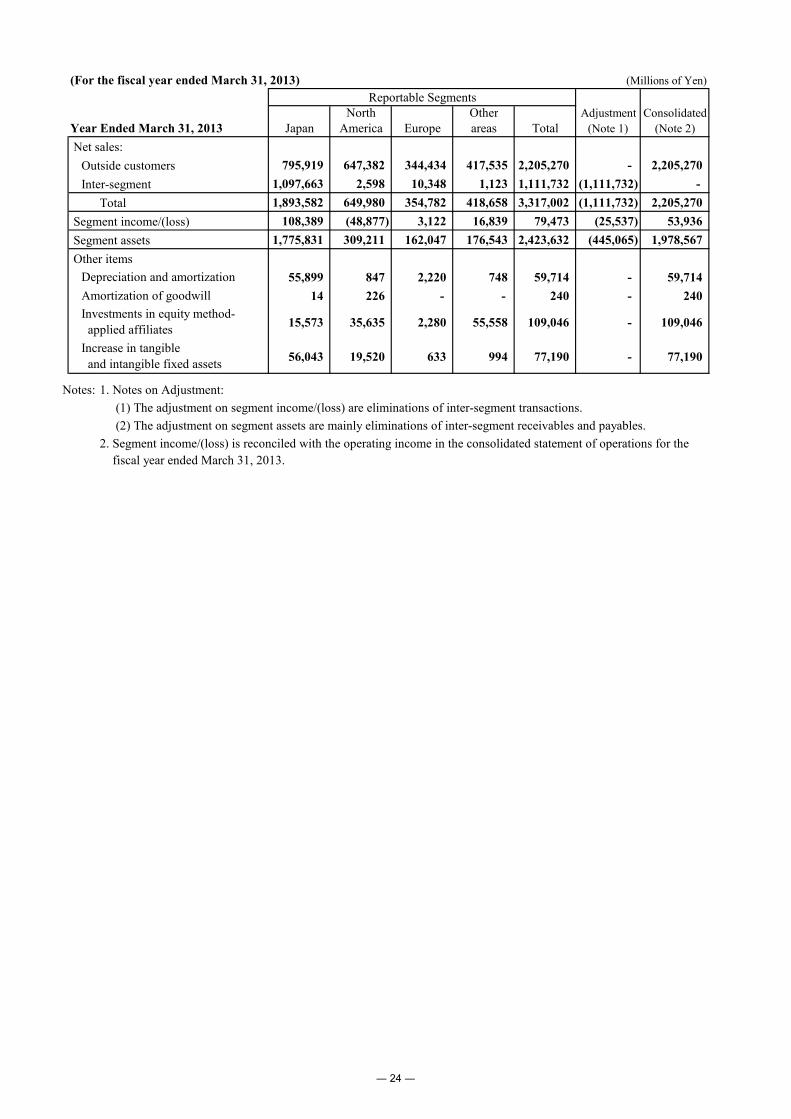
(For the fiscal year ended March 31, 2013) (Millions of Yen)
Reportable SegmentsNorth Other Adjustment Consolidated
Year Ended March 31, 2013 Japan America Europe areas Total (Note 1) (Note 2)
Net sales:
Outside customers 795,919 647,382 344,434 417,535 2,205,270 - 2,205,270
Inter-segment 1,097,663 2,598 10,348 1,123 1,111,732 (1,111,732) -
Total 1,893,582 649,980 354,782 418,658 3,317,002 (1,111,732) 2,205,270
Segment income/(loss) 108,389 (48,877) 3,122 16,839 79,473 (25,537) 53,936
Segment assets 1,775,831 309,211 162,047 176,543 2,423,632 (445,065) 1,978,567
Other items
Depreciation and amortization 55,899 847 2,220 748 59,714 - 59,714
Amortization of goodwill 14 226 - - 240 - 240
15,573 35,635 2,280 55,558 109,046 - 109,046
56,043 19,520 633 994 77,190 - 77,190
Notes: 1. Notes on Adjustment:
(1) The adjustment on segment income/(loss) are eliminations of inter-segment transactions.
(2) The adjustment on segment assets are mainly eliminations of inter-segment receivables and payables.
2. Segment income/(loss) is reconciled with the operating income in the consolidated statement of operations for the
fiscal year ended March 31, 2013.
Investments in equity method-
applied affiliates
Increase in tangible
and intangible fixed assets
― 24 ―

(Information on Amounts Per Share of Common Stock)
Equity per share of common stock (Yen) 156.85 166.04
Net income/(loss) per share of common stock: Basic (Yen) (57.80) 11.48
Diluted (Yen) - -
Note1: The calculation basis of Net income/(loss) per share of common stock is as follows.
Net income/(loss) per common stock:
Net income/(loss) (Millions of Yen) (107,733) 34,304
Amount not attribute to common stock shareholders (Millions of Yen) - -
Net income/(loss) related to common stock (Millions of Yen) (107,733) 34,304
1,863,949 2,989,171
-
(Note) Stock acquisition rights (stock option) resolved at the general meeting of shareholders on June 25, 2008.
On June 27, 2012, we acquired a part of the stock acquisition rights with no compensation on right
holders' consent and cancelled them.
- Number of stock acquisition rights cancelled 1,802 units
- Number of common shares underlying the share option
for the cancelled stocks 1,802,000 shares
Note2: The calculation basis of Equity per share of common stock is as follows.
Total Equity (Millions of Yen) 474,429 513,226
Amount deducted from total equity (Millions of Yen) 5,575 16,914
(of which Stock Acquisition Rights) (259) (6)
(of which Minority Interests) (5,316) (16,908)
Equity related to common stock (Millions of Yen) 468,854 496,312
2,989,175 2,989,165
(Significant Subsequent Events)
None
Number of common stock used in the calculation of equity per share (Thousands
of shares)
FY2012(as of March 31,
2012)
FY2013(as of March 31,
2013)
FY2012(April 1, 2011 to
March 31, 2012)
FY2013(April 1, 2012 to
March 31, 2013)
For the fiscal year ended March 31, 2012, although potentially dilutive securities exist, since net loss was recorded,
diluted information is not presented. For the fiscal year ended March 31, 2013, since there are no dilutive potential
securities that have dilutive effects, diluted information is not presented.
FY2012(April 1, 2011 to
March 31, 2012)
FY2013(April 1, 2012 to
March 31, 2013)
(Note)
Average number of shares outstanding during the period
(Thousands of shares)
Outline of dilutive potential securities, which undergo important changes from
the end of previous fiscal year and are not used to calculate net income per
share because they do not have dilutive effects
― 25 ―

5. Unconsolidated Financial Statements
(1) Unconsolidated Balance Sheet
As of
ASSETS
Current Assets:
Cash and time deposits 129,776 183,151
Accounts receivable - Trade 210,617 249,089
Securities 247,000 143,000
Finished Products 26,355 32,555
Work in process 54,523 61,735
Raw material and Supplies 6,229 5,130
Prepaid expenses 2,224 2,458
Deferred tax assets 35,761 41,913
Accounts receivable - Other 53,642 57,671
Short-term loans receivable 106,035 116,462
Other 10,467 11,828
Allowance for doubtful receivables (394) (328)
Total current assets 882,234 904,664
Fixed Assets:
Tangible fixed assets:
Buildings (net) 83,613 81,960
Structures (net) 15,567 14,478
Machinery and equipment (net) 134,039 135,290
Transportation equipment (net) 1,246 1,277
Tools, furniture and fixtures (net) 15,121 16,047
Land 305,921 291,145
Leased assets (net) 6,942 3,803
Construction in progress 25,247 26,514
Total tangible fixed assets 587,697 570,514
Intangible fixed assets:
Software 15,375 15,195
Leased assets (net) 19 10
Total intangible fixed assets 15,394 15,205
Investments and other fixed assets:
Investment securities 3,084 3,351
Investment securities for affiliates 219,696 243,644
Investments 3 3
Investment for affiliates 23,213 34,635
Long-term loans receivable 1,467 1,467
Long-term loans receivable for employees - 1
Long-term loans receivable for affiliates 2,604 2,604
Claims in bankruptcy, rehabilitation and others 989 989
Long-term prepaid expenses 4,470 2,722
Deferred tax assets 2,647 1,191
Other 3,680 3,982
Allowance for doubtful receivables (3,100) (3,276)
Investment valuation allowance (511) (511)
Total investments and other fixed assets 258,243 290,802
Total fixed assets 861,333 876,521
Total Assets 1,743,567 1,781,185
FY2013
March 31, 2012 March 31, 2013
(Millions of Yen)
FY2012
― 26 ―

As of
LIABILITIES
Current Liabilities:
Trade notes payable 553 830
Accounts payable - Trade 195,095 219,282
Bonds due within one year 45,000 10,000
Long-term loans payable due within one year 38,599 89,824
Lease obligations 4,080 2,008
Accounts payable - Other 10,467 77,922
Accrued expenses 48,791 56,097
Income tax payable 559 4,352
Unearned revenue 579 632
Deferred revenue 173 271
Deposit received 16,779 23,920
Reserve for warranty expenses 33,032 28,307
Forward exchange contracts 10,067 41,750
Total current liabilities 403,774 555,195
Fixed Liabilities:
Bonds 50,000 40,000
Long-term loans payable 556,088 466,264
Lease obligations 3,297 2,075
Deferred tax liability related to land revaluation 79,774 75,209
Employees' and executive officers' severance and retirement benefits 53,767 48,493
Reserve for loss from business of subsidiaries and affiliates 86,054 82,765
Reserve for environmental measures 1,454 1,514
Guaranty money received 3,389 3,562
Asset retirement obligations 4,844 6,784
Other 2,566 1,179
Total fixed liabilities 841,233 727,845
Total Liabilities 1,245,007 1,283,040
EQUITY
Capital and Retained Earnings:
Common stock 258,957 258,957
Capital surplus
Capital reserve 168,847 168,847
Other capital surplus 73,802 73,802
Total capital surplus 242,649 242,649
Retained earnings
Other earned surplus
Unappropriated retained earnings (140,785) (122,135)
Total retained earnings (140,785) (122,135)
Treasury stock (2,185) (2,187)
Total capital and retained earnings 358,636 377,284
Valuation and Translation Adjustments:
Net unrealized gain/(loss) on available-for-sale securities 61 168
Net gain/(loss) on derivative instruments (3,505) (14,878)
Land revaluation 143,108 135,565
Total valuation and translation adjustments 139,664 120,855
Stock Acquisition Rights 259 6
Total Equity 498,559 498,145
Total Liabilities and Equity 1,743,567 1,781,185
(Millions of Yen)
FY2012
March 31, 2012
FY2013
March 31, 2013
― 27 ―
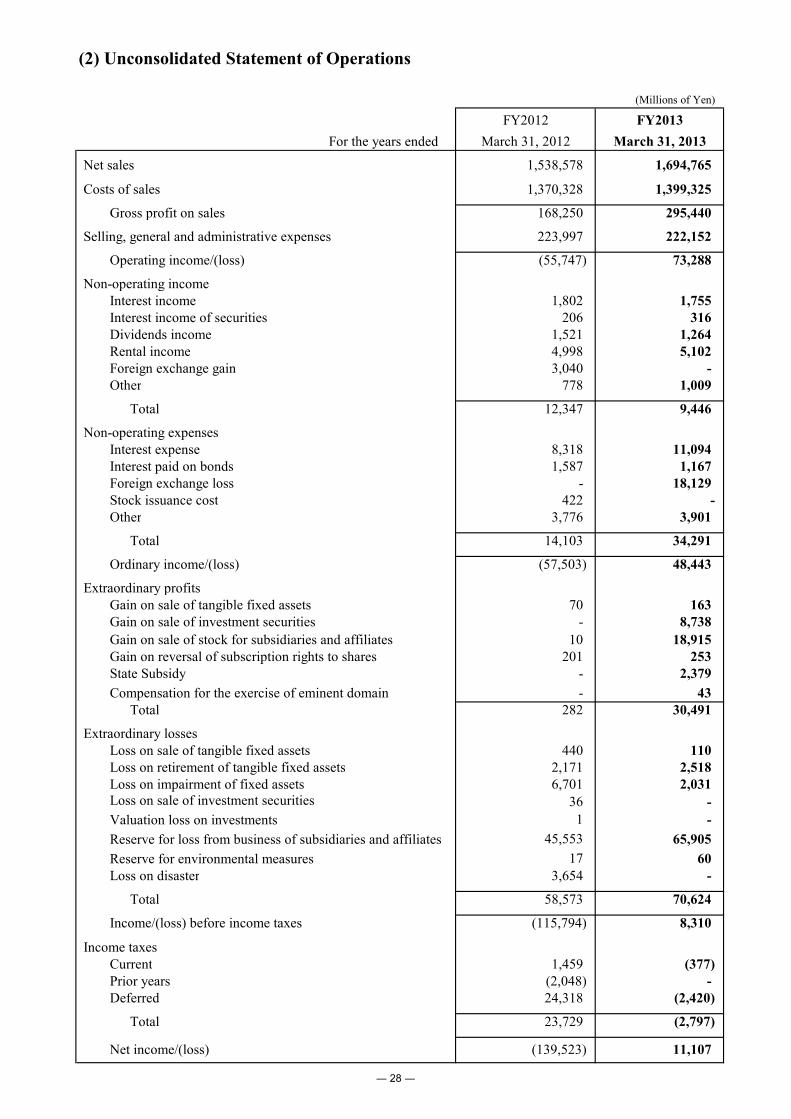
(2) Unconsolidated Statement of Operations
For the years ended
Net sales 1,538,578 1,694,765
Costs of sales 1,370,328 1,399,325
Gross profit on sales 168,250 295,440
Selling, general and administrative expenses 223,997 222,152
Operating income/(loss) (55,747) 73,288
Non-operating incomeInterest income 1,802 1,755Interest income of securities 206 316Dividends income 1,521 1,264Rental income 4,998 5,102Foreign exchange gain 3,040 -Other 778 1,009
Total 12,347 9,446
Non-operating expensesInterest expense 8,318 11,094Interest paid on bonds 1,587 1,167Foreign exchange loss - 18,129Stock issuance cost 422 -Other 3,776 3,901
Total 14,103 34,291
Ordinary income/(loss) (57,503) 48,443
Extraordinary profitsGain on sale of tangible fixed assets 70 163Gain on sale of investment securities - 8,738
Gain on sale of stock for subsidiaries and affiliates 10 18,915Gain on reversal of subscription rights to shares 201 253State Subsidy - 2,379
Compensation for the exercise of eminent domain - 43Total 282 30,491
Extraordinary lossesLoss on sale of tangible fixed assets 440 110Loss on retirement of tangible fixed assets 2,171 2,518Loss on impairment of fixed assets 6,701 2,031Loss on sale of investment securities 36 -
Valuation loss on investments 1 -
Reserve for loss from business of subsidiaries and affiliates 45,553 65,905
Reserve for environmental measures 17 60Loss on disaster 3,654 -
Total 58,573 70,624
Income/(loss) before income taxes (115,794) 8,310
Income taxesCurrent 1,459 (377)Prior years (2,048) -Deferred 24,318 (2,420)
Total 23,729 (2,797)
Net income/(loss) (139,523) 11,107
(Millions of Yen)
FY2013
March 31, 2013
FY2012
March 31, 2012
― 28 ―
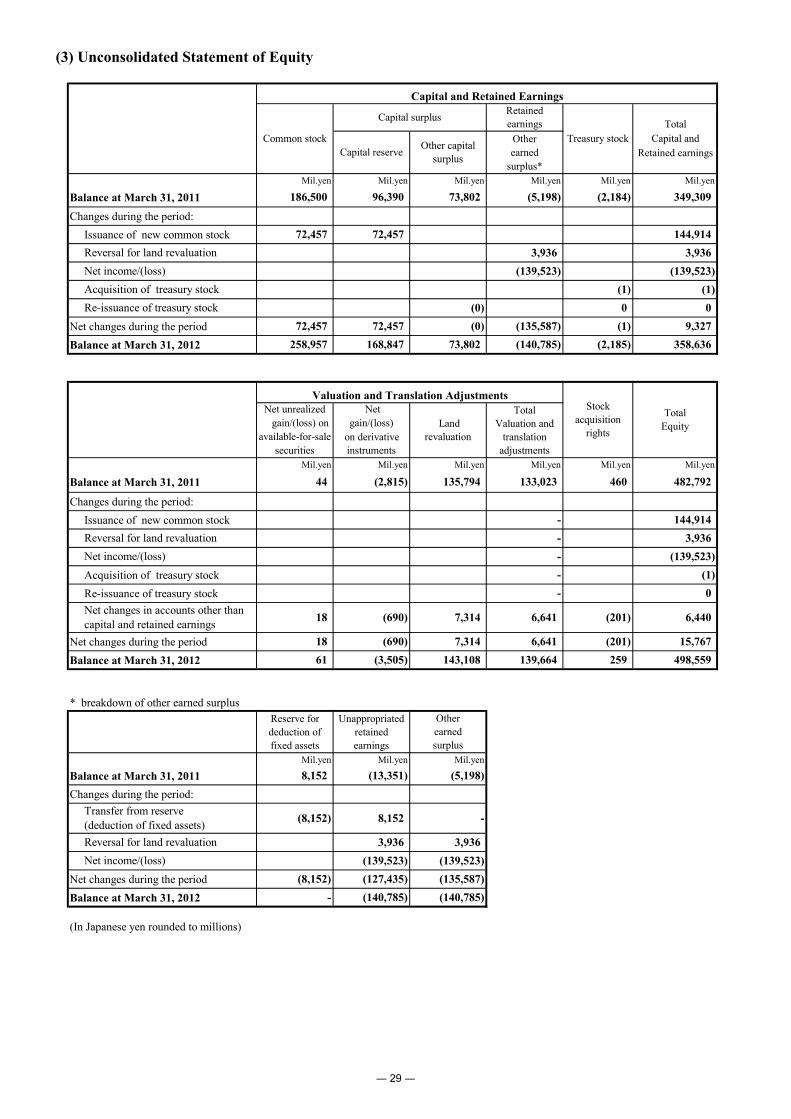
(3) Unconsolidated Statement of Equity
Mil.yen Mil.yen Mil.yen Mil.yen Mil.yen Mil.yen
Balance at March 31, 2011
Changes during the period:
Issuance of new common stock
Net changes during the period
Balance at March 31, 2012
Mil.yen Mil.yen Mil.yen Mil.yen Mil.yen Mil.yen
Balance at March 31, 2011
Changes during the period:
Issuance of new common stock
Acquisition of treasury stock
Re-issuance of treasury stock
Net changes during the period
Balance at March 31, 2012
* breakdown of other earned surplus
Mil.yen Mil.yen Mil.yen
Balance at March 31, 2011
Changes during the period:
Net changes during the period
Balance at March 31, 2012
(In Japanese yen rounded to millions)
(8,152) (127,435) (135,587)
- (140,785) (140,785)
Reversal for land revaluation 3,936 3,936
Net income/(loss) (139,523) (139,523)
Transfer from reserve(deduction of fixed assets)
(8,152) 8,152 -
Reserve for
deduction of
fixed assets
Unappropriated
retained
earnings
Other
earned
surplus
8,152 (13,351) (5,198)
61 (3,505) 143,108 139,664 259 498,559
6,440
18 (690) 7,314 6,641 (201) 15,767
Net changes in accounts other thancapital and retained earnings
18 (690) 7,314 6,641 (201)
Net income/(loss) - (139,523)
- (1)
- 0
Reversal for land revaluation - 3,936
133,023 460 482,792
- 144,914
on derivative
securities instruments
44 (2,815) 135,794
Valuation and Translation AdjustmentsStock
acquisition
rights
Total
Equity
Net unrealized Net
Land
revaluation
Total
Valuation and
translation
adjustments
gain/(loss) on gain/(loss)
available-for-sale
258,957 168,847 73,802 (140,785) (2,185) 358,636
72,457 72,457 (0) (135,587) (1) 9,327
Acquisition of treasury stock (1) (1)
Re-issuance of treasury stock (0) 0 0
Reversal for land revaluation 3,936 3,936
Net income/(loss) (139,523) (139,523)
144,91472,457 72,457
earned Retained earnings
surplus*
186,500 96,390 73,802 (5,198) (2,184) 349,309
Capital and Retained Earnings
Common stock
Capital surplusRetained
earnings
Treasury stock
Total
Capital reserveOther capital
surplus
Other Capital and
― 29 ―

Mil.yen Mil.yen Mil.yen Mil.yen Mil.yen Mil.yen
Balance at March 31, 2012
Changes during the period:
Issuance of new common stock
Net changes during the period
Balance at March 31, 2013
Mil.yen Mil.yen Mil.yen Mil.yen Mil.yen Mil.yen
Balance at March 31, 2012
Changes during the period:
Issuance of new common stock
Acquisition of treasury stock
Re-issuance of treasury stock
Net changes during the period
Balance at March 31, 2013
(In Japanese yen rounded to millions)
168 (14,878) 135,565 120,855 6 498,145
(19,062)
107 (11,373) (7,543) (18,809) (253) (414)
Net changes in accounts other thancapital and retained earnings
107 (11,373) (7,543) (18,809) (253)
Net income/(loss) - 11,107
- (2)
- 0
Reversal for land revaluation - 7,543
139,664 259 498,559
- -
on derivative
securities instruments
61 (3,505) 143,108
Valuation and Translation AdjustmentsStock
acquisition
rights
Total
Equity
Net unrealized Net
Land
revaluation
Total
Valuation and
translation
adjustments
gain/(loss) on gain/(loss)
available-for-sale
258,957 168,847 73,802 (122,135) (2,187) 377,284
Re-issuance of treasury stock (0) 0 0
- - (0) 18,650 (2) 18,648
Net income/(loss) 11,107 11,107
Acquisition of treasury stock (2) (2)
Reversal for land revaluation 7,543 7,543
258,957 168,847 73,802
-
Capital and Retained Earnings
Common stock
Capital surplusRetained
earnings
Treasury stock
Total
Capital reserveUnappropriated
retained
earnings
Other capital
surplus
Capital and
Retained earnings
(140,785) (2,185) 358,636
― 30 ―

(4) Footnotes to the Unconsolidated Financial Statements
(Note on the Assumptions as Going Concern)
There are no matters to be discussed.
6. Other
(1) Production and Sales Information
a) Production Volume
units units unitsJapan Passenger cars 831,025 863,626 32,601
Trucks 15,549 15,503 (46)
Total 846,574 879,129 32,555
Note: Production volume figures do not include those Mazda-brand vehicles produced by the following
joint venture assembly plants with Ford Motor Company (that are equity method-applied affiliates):
AutoAlliance International, Inc. 39,546 units 37,563 units (1,983) units
AutoAlliance (Thailand) Co., Ltd. 75,630 units 115,815 units 40,185 units
b) Sales by Reportable Segment
millions of yen millions of yen millions of yen824,383 795,919 (28,464)
568,340 647,382 79,042
347,299 344,434 (2,865)
293,036 417,535 124,499
2,033,058 2,205,270 172,212
Note: Inter-segment transactions are eliminated from the sales figures shown in the above table.
c) Sales by Product Type
units millions of yen units millions of yen units millions of yen1,016,430 1,510,789 1,053,262 1,753,850 36,832 243,061
- 93,113 - 55,938 - (37,175)
- 200,107 - 189,749 - (10,358)
- 229,049 - 205,733 - (23,316)
- 2,033,058 - 2,205,270 - 172,212
< Wholesales Volume by Market >
units units unitsVehicles Japan 226,242 225,683 (559)
North America 361,917 370,263 8,346
Europe 170,771 157,608 (13,163)
Other 257,500 299,708 42,208
790,188 827,579 37,391
Total 1,016,430 1,053,262 36,832
Overseas Total
FY2012
Year Ended March 31, 2012
Year Ended March 31, 2012
Japan
North America
FY2012
Year Ended March 31, 2012
Increase / (Decrease)
Europe
Other areas
FY2012
Year Ended March 31, 2012
Year Ended March 31, 2013
Vehicles
Parts
Year Ended March 31, 2013
FY2013
Year Ended March 31, 2013
FY2013
Year Ended March 31, 2013
Increase / (Decrease)
Increase / (Decrease)
Increase / (Decrease)
Increase / (Decrease)
FY2013
Year Ended March 31, 2013
Year Ended March 31, 2012
FY2012
FY2013
FY2013
Knockdown Parts (Overseas)
FY2012
Total
Total
Other
― 31 ―

Financial Summary (Consolidated) April 26, 2013
For the Fiscal Year Ended March 31, 2013 Mazda Motor Corporation
(In 100 millions of yen)
(In thousands of units)
(Upper left: return on sales)% % %
1 5,602 3.5 1,425 1,520 1,201 1,734 5,880 5.0 5,900 0.3
2 14,729 (17.5) 3,641 3,649 3,916 4,967 16,173 9.8 18,900 16.9
Net sales 3 20,331 (12.6) 5,066 5,169 5,117 6,701 22,053 8.5 24,800 12.5
(1.9%) 0.4% 1.9% 1.6% 5.1% 2.4% 4.8%
Operating income/(loss) 4 (387) - 18 97 81 343 539 - 1,200 -
(1.8%) (1.8%) 1.8% 4.1% 1.7% 1.5% 3.9%
Ordinary income/(loss) 5 (368) - (89) 93 210 117 331 - 970 -
(2.7%) (1.9%) 3.3% 4.5% 1.3% 1.8% 3.5%
6 (553) - (97) 170 228 90 391 - 880 -
(5.3%) (1.3%) 2.4% 3.9% 1.3% 1.6% 2.8%
Net income/(loss) 7 (1,077) - (65) 122 199 87 343 - 700 -
Japan 8 (184) 63 256 191 574 1,084
North America 9 (403) (107) (153) (123) (106) (489)
Europe 10 56 9 (6) 19 9 31
Other areas 11 101 41 45 56 26 168
Operating profit changes
Volume & mix 12 242 (7) 97 6 338 499
Exchange rate 13 (79) (32) 95 200 184 560
Cost improvement 14 93 78 101 95 367 157
Marketing expense 15 (43) 14 10 (49) (68) (183)
Other 16 36 29 105 (65) 105 (372)
Total 17 249 82 408 187 926 661
JPY / USD 79 80 79 81 92 83 90
JPY / EUR 109 103 98 105 122 107 120
JPY / USD 79 78 79 82 80 79 88
JPY / EUR 111 103 104 103 102 103 117
Capital investment 20 780 151 188 193 240 772 1,300
Depreciation and amortization 21 688 152 146 151 151 600 580
R&D cost 22 917 218 209 224 248 899 1,000
Total assets 23 19,159 18,717 18,146 19,141 19,786
Equity 24 4,744 4,792 4,864 4,897 5,132
Financial debt 25 7,781 7,660 7,447 7,661 7,190
Net financial debt 26 3,008 3,265 3,243 3,451 2,741
27 (794) (203) 7 (280) 563 87
Domestic 28 206 (0.2) 51 59 40 66 216 5.2 220 1.7
North America 29 372 8.5 90 92 88 102 372 0.2 415 11.4
Europe 30 183 (13.6) 44 41 34 53 172 (6.2) 200 16.6
China 31 223 (5.6) 46 44 39 46 175 (21.5) 200 14.5
Other 32 263 (4.7) 69 77 79 75 300 13.5 300 0.1
Overseas 33 1,041 (2.4) 249 254 240 276 1,019 (2.2) 1,115 9.5
Global retail volume 34 1,247 (2.0) 300 313 280 342 1,235 (1.0) 1,335 8.1
Domestic production volume 35 847 (2.4) 207 205 221 246 879 3.8 960 9.2
36 37,617 37,745
Note: Global retail volume refers to the total retail units of Mazda-brand vehicles sold on a global basis.
Number of employees
(excluding dispatches)
Operating income/(loss) bysegment (geographic area)
Transaction rate
Income/(loss) before
income taxes
19
Overseas
(Apr.'13-Mar.'14)
Domestic
Average ratefor the period
18
Free cash flow(Operating C/F & Investing C/F)
Fiscal Year
Ended Mar. 2012
FY 2014
Full Year Forecast
(Apr.'11-Mar.'12)
Fiscal Year
Ended Mar.2013
(Apr.'12-Mar.'13)1st. Qtr. 2nd. Qtr. 3rd. Qtr. 4th. Qtr.

Financial Summary (Unconsolidated)For the Fiscal Year Ended March 31, 2013 April 26, 2013
Mazda Motor Corporation(In 100 millions of yen)(In thousands of units)
(Upper left: return on sales)
% %
Domestic 1 3,738 11.0 4,002 7.1
Export 2 11,648 (19.1) 12,946 11.1
Net sales 3 15,386 (13.4) 16,948 10.2
(3.6%) 4.3%
Operating income/(Loss) 4 (557) - 733 -
(3.7%) 2.9%
Ordinary income/(Loss) 5 (575) - 484 -
(7.5%) 0.5%
Income/(loss) before taxes 6 (1,158) - 83 -
(9.1%) 0.7%
Net income/(loss) 7 (1,395) - 111 -
79Yen/US$ 83Yen/US$
Average rate for the period 8 109Yen/EUR 107Yen/EUR
Capital investment 9 552 487
Depreciation & amortization 10 559 482
R & D cost 11 887 876
Total assets 12 17,436 17,812
Equity 13 4,986 4,981
Financial debt 14 6,971 6,102
Net financial debt 15 3,213 2,850
Domestic 16 234 10.8 229 (2.0)
North America 17 353 0.8 379 7.6
Europe 18 176 (17.5) 166 (5.7)
Others 19 211 (22.3) 225 6.4
Wholesales (units) 20 974 (6.9) 999 2.6
Domestic production units 21 847 (2.4) 879 3.8
22 20,863 20,566
Fiscal Year
Ended March 2012
Fiscal Year
Ended March 2013
Number of employees
(excluding dispatchees)