Rethinking Energy, Materials, & Transporta6on in Passive Houses
Source: Hausbau-‐Beratung24.de

Embodied Energy and Carbon
Steelmaking (Source: Jupiter Images Corpora6on)

Embodied Energy vs. Carbon Footprint
Embodied Energy = Sum of all energy needed to produce any product, as if that energy was incorporated or "embodied" into the product itself.
Source: Building Green
Carbon Footprint = Sum of all greenhouse gases emiQed by the full life cycle of a product.

Life Cycle Energy Assessment for Passive Houses = Embodied Energy + Opera6ons + Maintenance
Source: Stephan, André, Robert H. Crawford, and Kristel De MyQenaere. "A Comprehensive Assessment of the Life Cycle Energy Demand of Passive Houses." Applied Energy112 (2013): 23-‐34. Print.

But source data may not be appropriate for our context.
DETAILS
Base case passive house:
• Period of analysis = 100 years
• Usable floor area = 3,197 a2
• Structure: Steel-‐framed, concrete floor slabs
• Façade = Block walls, Glued bricks – 220 mm of polyurethane insula6on –
• Triple glazed, argon filled, wood windows
• Roof = TerracoQa 6les – 300 mm of polyurethane insula6on and 100 mm of rock wool insula6on
0
200
400
600
800
1000
1200
Base Case As-‐Built
Stephan et al Study uses Australian figures for Belgian case

Energy Choices Not Fixed Study: "The embodied, opera6onal and transport energy requirements represent 40.0%, 32.8% and 27.2% of the total, respec6vely." Source: Stephan et al
However, material and process choices have a significant effect on embodied energy.
Map of Material origina6on loca6ons: by Linnean

Carbon Emissions
Two Very similar office renova6on projects Upper total = 86 MJ/sf Lower total = 43 MJ/sf

Life Cycle Energy Demand: Embodied, Opera6onal, & Transport
Embodied: 4,001,000 kWh 145,332 kWh/C2
Graph Compares GJ and GJ/m2 1 GJ = 278 kWh 1m² = 10.8C²
OperaLonal: 3,280,277 kWh 118,885 kWh/C2 Transport:
2,273,333 kWh 98,700 kWh/C2
Total: 10,013,611 kWh 362,918 kWh/C2
100 Year Analysis Period

Life Cycle Energy Demand of Passive Houses Compared with Varia6ons
Graph Compares GJ of energy over 100 years
Standard house with electrical appliances now powered by gas uses 9,292,631 kWh
Passive house with electrical appliances now powered by gas uses 8,660,732 kWh
Standard house with electrical appliances now powered by gas plus reduced operaLonal energy
Passive house base case uses 10,013,611 kWh Standard
house uses 10,070,277 kWh

Embodied vs. Opera6onal Energy This needs some explana6on. What are the two bars and the confidence intervals?
And a way more descrip6ve 6tle.
EcoCalculator for North East Belgian Style = 7,376 GJ
EcoCalulator for NE US Style = 3,600 GJ
OE = 35 Kbtu/sf/yr

Embodied Energy By Material Timber use in base case: • 158.9 a3 -‐ hardwood
window frames • 247.2 a3 -‐ parquet
flooring; hollow core MDF doors; roof; cupboards and closets
• 10.6 a3 -‐ soawood (framing) in hollow core MDF doors
• 416.7 a3 = Total

Carbon Emissions By Material
Other poten6al uses of 6mber in passive houses: • Upper floor slabs • Roof structure • Columns and beams
Source: Coopera6ve Research Centre for Greenhouse Accoun6ng (Australia)
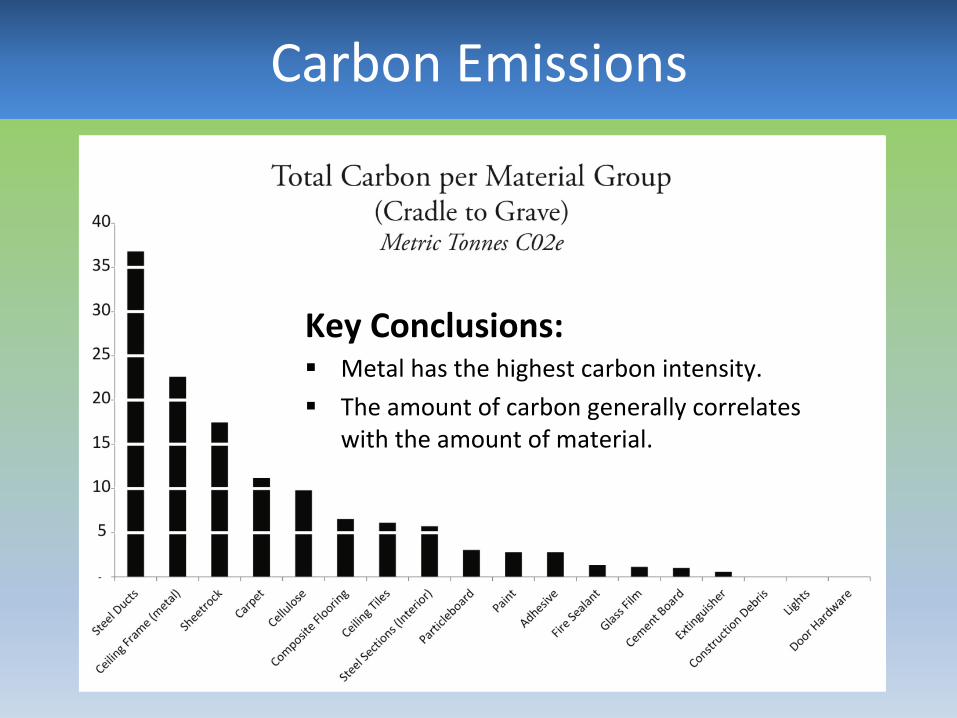
Carbon Emissions
Key Conclusions: § Metal has the highest carbon intensity. § The amount of carbon generally correlates
with the amount of material.

• Time Value of Carbon Savings Carbon saved now is worth more than Carbon later (area under the line is total carbon emiQed)
10% reduc6on per year
Start slow -‐ increase rate of reduc6on
Start fast -‐ decrease rate of reduc6on
Time
Car
bon
Red
uctio
n WHY FOCUS ON EMBODIED CARBON?

Carbon & Chemical of Concern Accoun7ng
§ Typical Interior Office Renova6on § Calculated carbon emissions for materials
and contractor commu6ng § Assessed VOC quan6ty and quality of
materials § Evaluated economic impact on local and
na6onal community

Toxicity of Materials
PVC piping (Source: True Well Pipes)

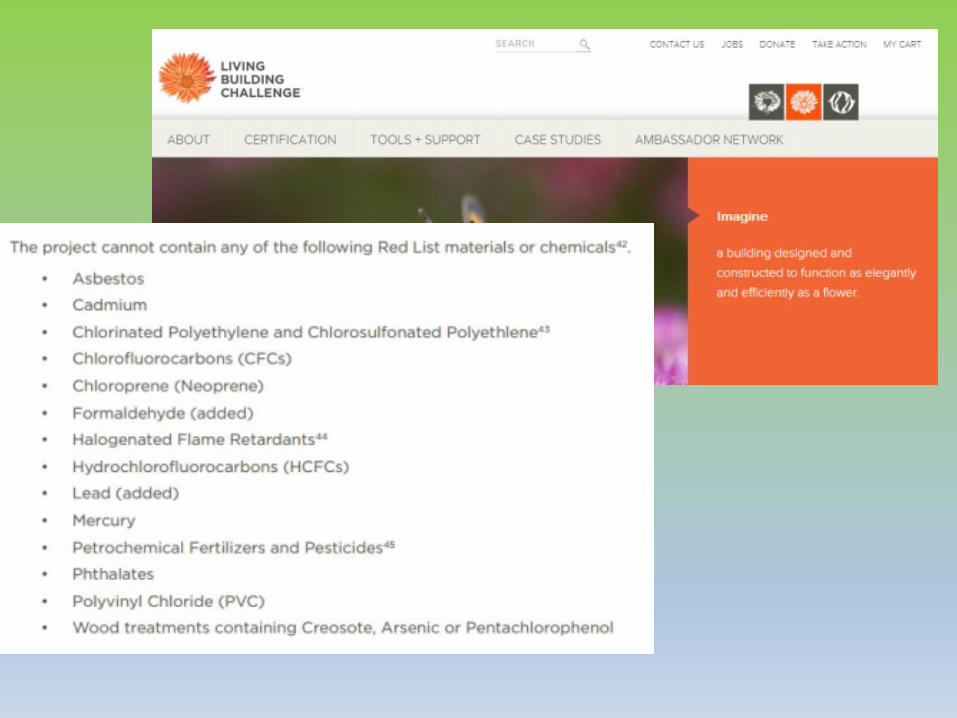
Red Lists and Transparency
“Red lists,” such as the Living Building Challenge’s are increasingly common but cau6on is advised, as new subs6tutes for listed chemical may be as bad or worse.
LEED ra6ng system rewards projects for using products with low VOC emissions, but doesn’t address chemical cons6tuents of building products.

LEED
Materials & Resources Energy & Air Quality

Risks From Adhesives & Sealants
Source: Green Building Supply Source: Building Green

Greener Adhesive Choices
Acrylic Tape
Butyl Rubber Tape
Source: Building Green
To minimize environmental and health impacts: • Select low-‐emiyng tapes over
solvent-‐based, wet-‐applied products.
• Provide adequate worker training and protec6on.

Risks From Insula6on
Spray Polyurethane Foam (SPF)
Extruded Polystyrene (XPS)
“The more insula6on the beQer” is common refrain in green building industry. Insula6on = strategy for net-‐zero-‐energy & carbon-‐neutral performance
But both XPS and SPF contribute to climate change via embodied energy and blowing-‐agent leakage. And, the brominated flame retardant HBCD in XPS is persistent, bioaccumula6ve, and toxic in animal studies.

Greener Insula6on Choices
Mineral Wool
Cellulose
Source: Building Green

Wood
• Compared with nonrenewable building materials, wood: – is produced largely from input of sunlight (through photosynthesis),
– sequesters carbon in its produc6on, – carries low embodied energy, and – is nontoxic, reusable, and biodegradable.
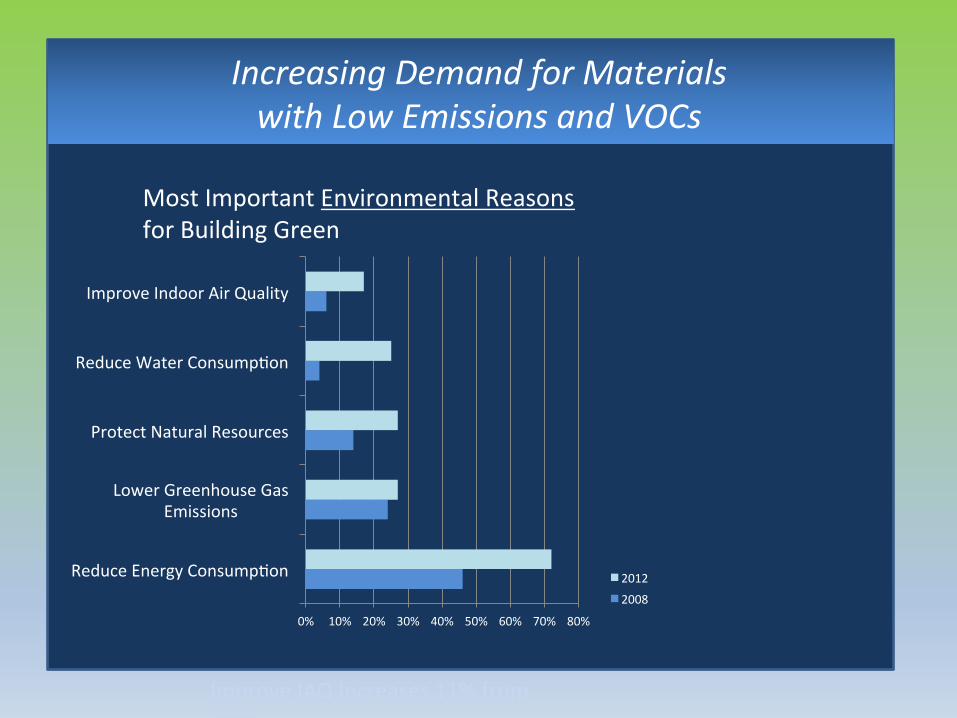
Increasing Demand for Materials with Low Emissions and VOCs
Improve IAQ Increases 11% from 2008 McGraw-‐Hill Construc7on, 2013
0% 10% 20% 30% 40% 50% 60% 70% 80%
Reduce Energy Consump6on
Lower Greenhouse Gas Emissions
Protect Natural Resources
Reduce Water Consump6on
Improve Indoor Air Quality
2012 2008
Most Important Environmental Reasons for Building Green

Chemicals of Concern Present in Project
§ Formaldehyde was found in plywood – a frequently used product
§ PVC was found in some ‘green’ flooring § Phthalates were found in adhesives
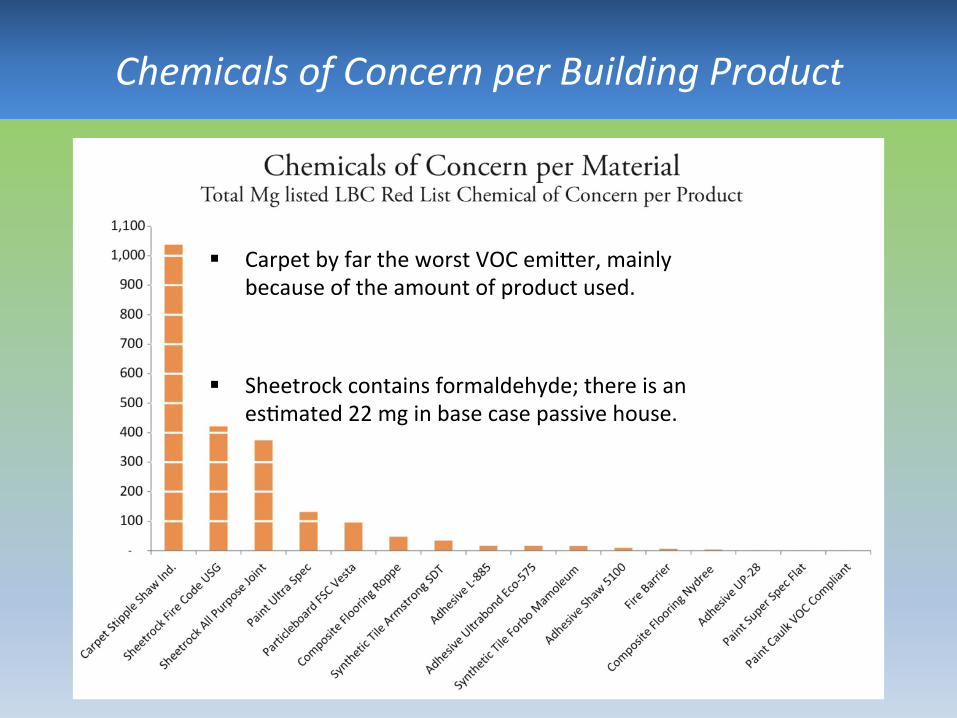
Chemicals of Concern per Building Product
§ Carpet by far the worst VOC emiQer, mainly because of the amount of product used.
§ Sheetrock contains formaldehyde; there is an es6mated 22 mg in base case passive house.

Total Weight of Chemicals of Concern in the Project

Contractor Transporta6on
During Construc6on
New Bedford: .90 MT C02e for 140 labor hours (1 MT/156 hours)
Easton: 3.62 MT C02e for 1,274 labor hours (1 MT/354 hours)
Woburn: 1.89 MT C02e for 1,205 labor hours (1 MT/638 hours) Boston: .44 MT C02e
for 1,873 labor hours (1 MT/4,257 hours)

Contractor Transporta6on
During Construc6on

Transporta6on Post-‐Construc6on
Study Trans Energy per year = 93 MBtu

Ques6ons As we reduce opera6onal energy, how can we find similar reduc6ons in other impacts?
• Reduce embodied carbon materials?
• Lower toxicity of materials? • Minimize loca6on effects?
Recommended