www.mcs.bc.ca
Central Vancouver Island
Results of the 2013 BC Adolescent Health Survey

www.mcs.bc.ca
2013 BC Adolescent Health Survey:Central Vancouver Island
▪ Background
▪ Positive findings and trends
▪ Areas of concern
▪ Protective factors
▪ Using the data

www.mcs.bc.ca
Administration
2013 BC Adolescent Health Survey
▪ 29,832 surveys completed
▪ 1,645 classrooms
▪ 56 school districts
▪ 325 PHNs and nursing students
Northern Interior

www.mcs.bc.ca
Youth in Central Vancouver Island
▪ 70% of students reported European heritage
▪ 14% reported Aboriginal heritage
▪ 9% of students were born outside of Canada

www.mcs.bc.ca
Home life
▪ 94% of students lived with at least one parent
▪ 4% had lived in foster care
▪ 1% had lived in a group home
▪ 23% moved from one home to another

www.mcs.bc.ca
Young carers
A relative Pets or other animals
14%
60%
21%
69%
Who youth took care of on an average school day
Males Females
www.mcs.bc.ca
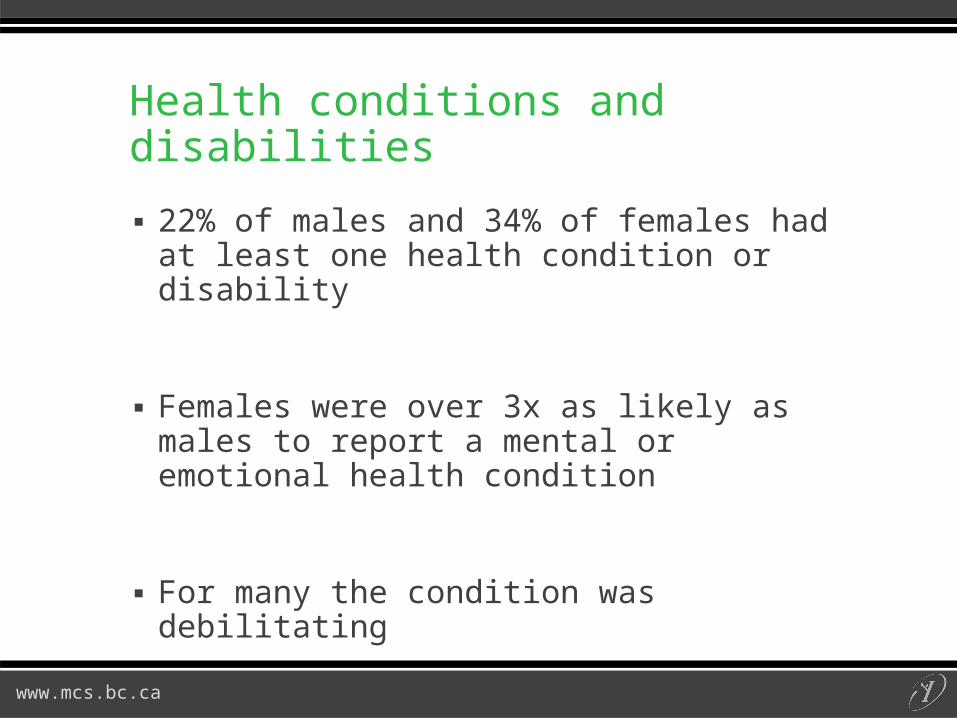
Health conditions and disabilities
▪ 22% of males and 34% of females had at least one health condition or disability
▪ Females were over 3x as likely as males to report a mental or emotional health condition
▪ For many the condition was debilitating

www.mcs.bc.ca
Working
Note: Not all age differences were statistically significant.
12 years old or
younger
13 14 15 16 17 years or older
0%
25%
50%
75%
13%21% 24%
29%
41%
61%
Students who worked at a paid job during the school year

www.mcs.bc.ca
Technology
▪ 86% of males and 93% of females had a cellphone
▪ Cellphone use was linked to:– More likely to have adult outside family to talk
to;
– More likely to have approached a friend for help
▪ Students without a cellphone:– More likely to have slept for 8 or more hours

www.mcs.bc.ca
Positive Findings and Trends

www.mcs.bc.ca
Most youth had seen a dentist in the past year
9% of students missed out on needed medical care Poor Fair Good Excellent
2%
12%
49%
37%
Overall health ratings

www.mcs.bc.ca
Decrease in serious injuries
▪ 29% seriously injured in past year, decrease from 35% in 2008
▪ 53% injured during recreational activities

www.mcs.bc.ca
Injury prevention improvements
▪ 78% of youth always wore seat belt, an increase from 67% in 2008 and 51% in 2003
▪ Fewer students driving after drinking alcohol
▪ Fewer driving after using marijuana

www.mcs.bc.ca
▪ Most youth ate fruit and vegetables
▪ 91% of youth never went to bed hungry
▪ 59% of males and 43% of females always ate breakfast on school days
Nutrition

www.mcs.bc.ca
Never eat breakfast Sometimes eat breakfast Always eat breakfast
32%
50%
65%
Slept for 8 or more hours last night in re-lation to frequency of eating breakfast on
school days
Sle
pt
for
8 o
r m
ore
hou
rs last
nig
ht

www.mcs.bc.ca
Risky sexual behaviour decreased
26% had ever had sex
Among those:
21% used drugs or alcohol last time they had sex
69% (they or their partner) used condom last time
Fewer males reported pregnancy involvement

www.mcs.bc.ca
24% had ever tried smoking
Among those:
▪ Fewer youth first smoked at 14 or younger
▪ Males more likely to use certain products
▪ 49% were recent smokers
Fewer exposed to second-hand smoke daily
Fewer youth tried tobacco

www.mcs.bc.ca
Fewer youth tried alcohol
53% had ever tried alcohol
Among those:
▪ Youth waited longer to try alcohol
▪ 40% reported having five or more drinks over a short period of time
22% of all youth drank last Saturday

www.mcs.bc.ca
Fewer youth tried marijuana
30% had ever tried marijuana
Among those:
▪ Youth waited longer to try marijuana compared to 2003
▪ 58% had used it in the past month
7% of all youth used marijuana and alcohol last Saturday

www.mcs.bc.ca
Decreases in substance use
2003 2008 20130%
40%
80%
65% 64%
53%
43% 40%
30%35%
30%24%
Youth who had ever tried different substancesAlcohol Marijuana Tobacco
Note: The differences between 2003 and 2008 in youth who had tried alcohol and youth who had tried marijuana were not statistically significant.

www.mcs.bc.ca
Using other substances 2013Change
since 2008Prescription pills without a doctor’s consent
11%
Mushrooms 7%
Ecstasy 5%
Hallucinogens 5%
Cocaine 3%
Inhalants 2%
Amphetamines 2%
Ketamine, GHB 2%
Crystal meth 1%
Steroids without a doctor’s consent
1%
Heroin 1%
NA

www.mcs.bc.ca
School safety increased
Library Classroom Cafeteria Hallways Washrooms Outside on school
property
85% 83%76%
68% 66%59%
96% 93% 91% 91% 90% 90%
Locations where students always or usually felt safe 2008 2013
www.mcs.bc.ca
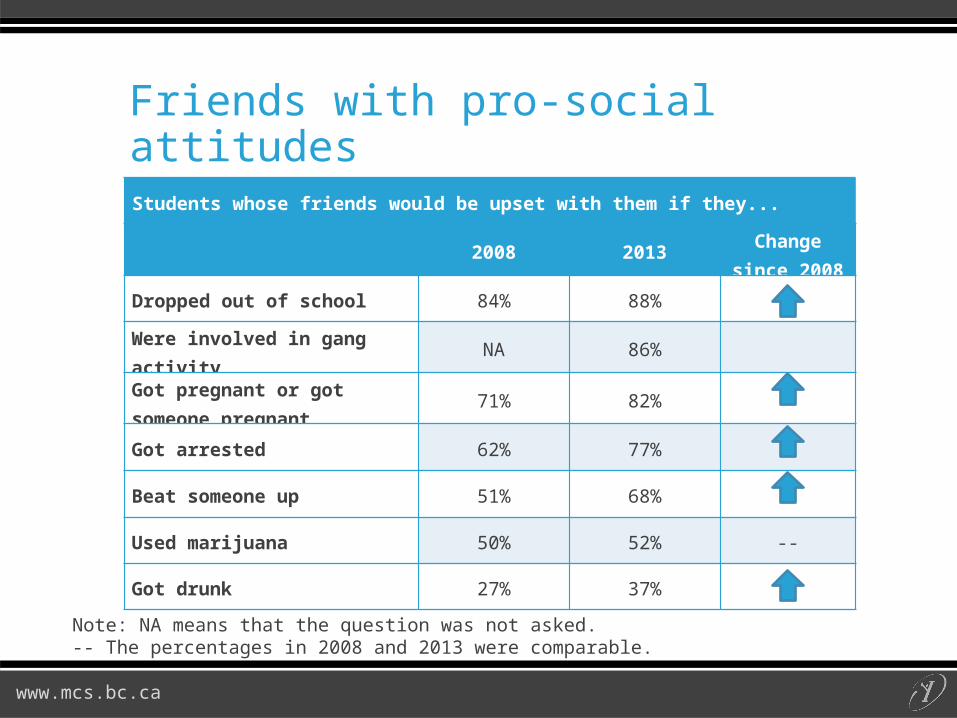
Note: NA means that the question was not asked.-- The percentages in 2008 and 2013 were comparable.
Students whose friends would be upset with them if they...
2008 2013Change
since 2008
Dropped out of school 84% 88%
Were involved in gang activity
NA 86%
Got pregnant or got someone pregnant
71% 82%
Got arrested 62% 77%
Beat someone up 51% 68%
Used marijuana 50% 52% --
Got drunk 27% 37%
Friends with pro-social attitudes

www.mcs.bc.ca
Areas of Concern

www.mcs.bc.ca
Concussions
Lost consciousness
Ringing in the ears
Blurred vision
Dazed, confused or suffered a gap in memory
Dizziness or balance problems
Headaches
25%
40%
43%
44%
64%
69%
Concussion symptoms experienced(among youth who had a concussion in the
past year)

www.mcs.bc.ca
Ratings of mental health
Poor or Fair Good or Excellent
20%
80%
14%
86%
Mental health and overall health ratings
Mental health Overall health

www.mcs.bc.ca
Other mental health concerns
Most commonly reported conditions
MalesFemal
es
Depression 6% 14%
Anxiety Disorder/Panic Attacks
3% 16%
Attention Deficit/Hyperactivity Disorder (ADHD)
6%Extreme stress Extreme despair
7%
3%
14%
10%
Students who experienced extreme stress and despair in
the past month
Males Females

www.mcs.bc.ca
Suicide
Males
▪ 8% considered suicide
▪ 3% attempted suicide
Females
▪ 16% considered suicide
▪ 9% attempted suicide

www.mcs.bc.ca
Foregone mental health care
▪ 16% of females and 6% of males did not access needed mental health services
▪ Most common reasons were thinking or hoping the problem would go away, and not wanting their parents to know.
▪ More likely than in 2008 to report not wanting parents to know and not knowing where to go

www.mcs.bc.ca
Getting enough sleep
4 hours or less
5 6 7 8 9 10 hours or more
5% 6%
12%
22%
29%
18%
8%
Hours slept last night

www.mcs.bc.ca
Mental health and sleep
* The percentage should be interpreted with caution as the standard error was relatively high but still within a releasable range.
Note: Not all differences were statistically significant.
4 hours or less
5 6 7 8 9 hours or more
0%
50%
100%
51%59%
69%79%
85%90%
Good/excellent mental health in relation to hours slept last night
Good
/exce
llen
t m
en
tal
healt
h
www.mcs.bc.ca
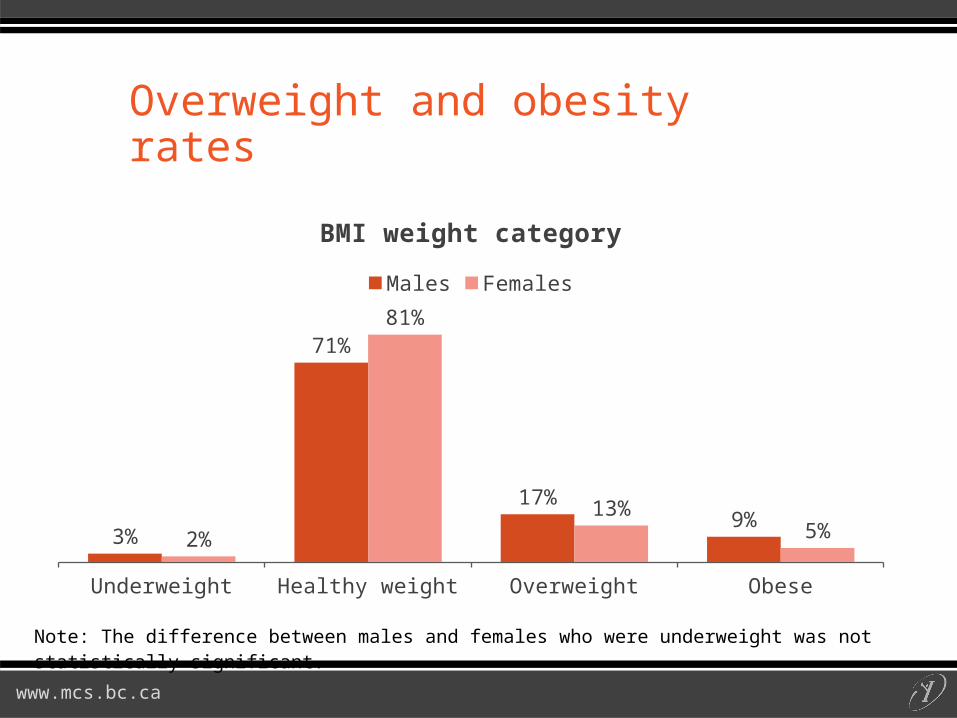
Overweight and obesity rates
Note: The difference between males and females who were underweight was not statistically significant.
Underweight Healthy weight Overweight Obese
3%
71%
17%9%
2%
81%
13%5%
BMI weight category
Males Females
www.mcs.bc.ca
Bullying
▪ Increase in rates of: – Female students experiencing teasing
– All students being excluded
▪ Rates decreased or stayed consistent of: – Physical assaults
– Cyberbullying

www.mcs.bc.ca
Perpetrators of bullying
Victim of 0 types of bullying
Victim of 1 type of bullying
Victim of 2 types of bullying
9%
25%
48%*
Youth who were perpetrators of bullying in relation to the number of different types of
bullying they experienced in past year (teased, excluded, assaulted)
Perc
en
tag
e o
f you
th w
ho
bu
llie
d o
thers
* The percentage should be interpreted with caution as the standard error was relatively high but still within a releasable range.

www.mcs.bc.ca
Abuse
Physically abused Sexually abused Both physically and sexually abused
10%
4%
1%
16%17%
8%
Students who were ever abused
Males Females

www.mcs.bc.ca
Exercise participation
▪ 18% of students aged 12-17 met their daily activity guidelines
▪ 59%* of students aged 18 or older reached their daily activity guidelines
▪ On a weekly basis: 60% involved in informal sports, 56% played organized sports, 18% did exercise or dance classes
www.mcs.bc.ca
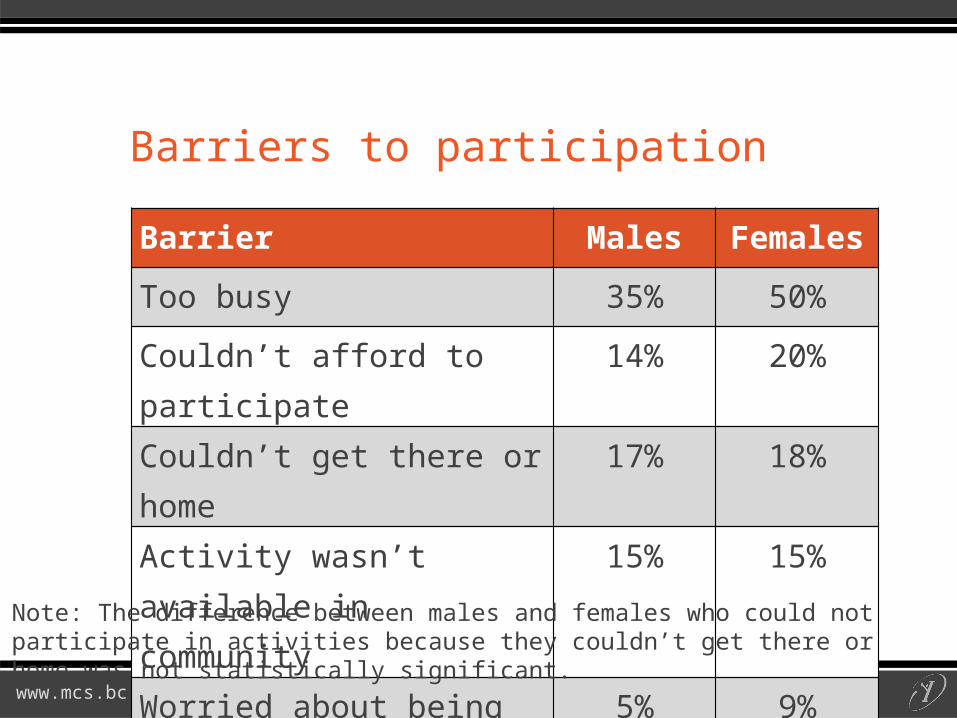
Barrier Males Females
Too busy 35% 50%
Couldn’t afford to participate 14% 20%
Couldn’t get there or home 17% 18%
Activity wasn’t available in community
15% 15%
Worried about being bullied 5% 9%
Barriers to participation
Note: The difference between males and females who could not participate in activities because they couldn’t get there or home was not statistically significant.

www.mcs.bc.ca
Protective Factors

www.mcs.bc.ca
• School connectedness
• Positive family relationships
• Caring adults outside the family
• Someone to turn to for help
Established Protective Factors

www.mcs.bc.ca
• Peer relationships
• Good nutrition
• Feeling engaged and valued
• Stable home
Established Protective Factors

www.mcs.bc.ca
• Eight or more hours of sleep
• Neighbourhood safety
• Community connectedness
• Cultural connectedness
Protective Factors - 2013

www.mcs.bc.ca
Youth are generally making fewer risky choices about their health
Mental health for females is among the areas of concern, and where there have been fewer improvements
Promoting protective factors have and can continue to play a key role in improving outcomes for BC youth

www.mcs.bc.ca
56 school district data
tables
16 HSDA reports
Growing Up in BC
Sexual health report
Youth resources
Using the data

www.mcs.bc.ca

www.mcs.bc.ca
Next Steps
▪ Youth-led projects or initiatives
In Our Shoes
▪ Bullying awareness video
▪ https://www.youtube.com/user/McCrearyCentre

www.mcs.bc.ca
Discussing the results
▪ Commentary on the AHS findings from:–Mary Ellen Turpel-Lafond,
Representative for Children and Youth
–Bob Lenarduzzi, President, Vancouver Whitecaps
–And more!
▪ Video on McCreary’s YouTube channel

www.mcs.bc.ca
Central Vancouver Island
Results of the 2013 BC Adolescent Health Survey
Recommended