WTO AccessionWTO Accession & &
Russia’s Agri-Food Russia’s Agri-Food
SectorSector Eu.Serova
Analytical Centre AFE
www.iet.ru/afe
International Agricultural Trade and Sustainable Development
in Southeast Asia October 31, 2005
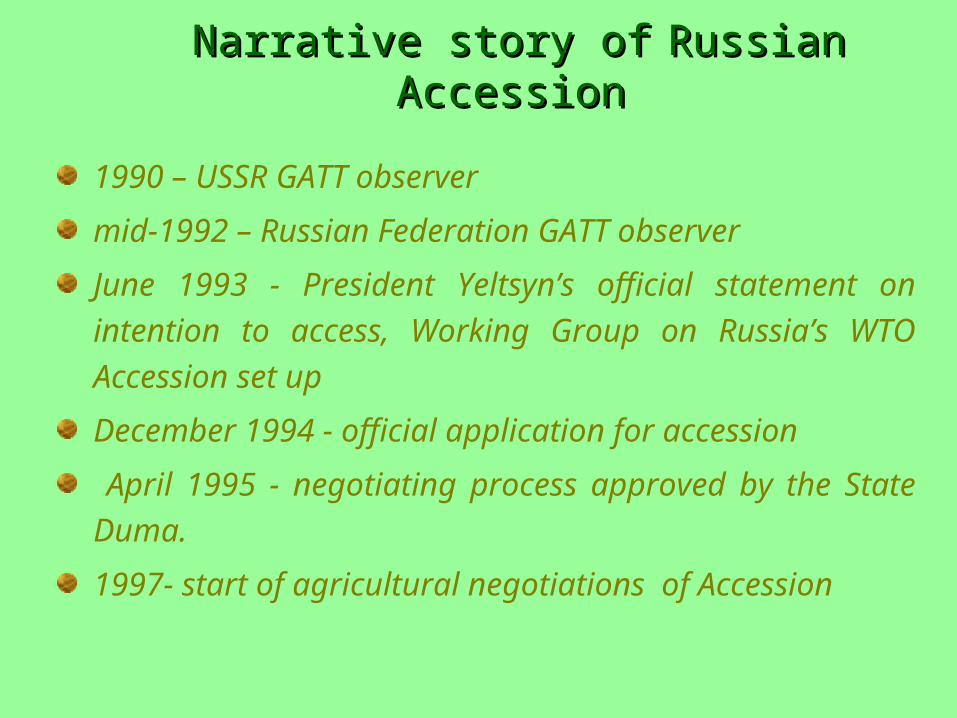
Narrative story ofNarrative story of Russian AccessionRussian Accession
1990 – USSR GATT observer
mid-1992 – Russian Federation GATT observer
June 1993 - President Yeltsyn’s official statement on
intention to access, Working Group on Russia’s WTO
Accession set up
December 1994 - official application for accession
April 1995 - negotiating process approved by the State
Duma.
1997- start of agricultural negotiations of Accession

CurrentCurrent Russian negotiation positionRussian negotiation position
Base period 1993-1995
AMS – US$9 bln
Bound tariff 19%
Export subsidies
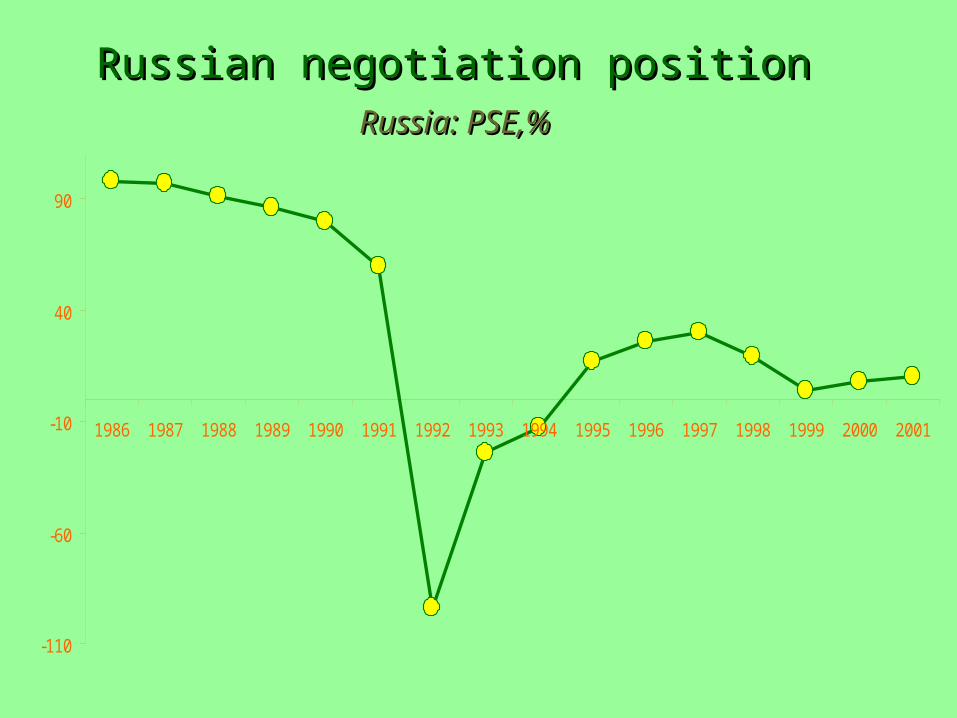
Russian negotiation positionRussian negotiation position
Russia: PSE,%Russia: PSE,%
-110
-60
-10
40
90
1986 1987 1988 1989 1990 1991 1992 1993 1994 1995 1996 1997 1998 1999 2000 2001

Russian negotiation positionRussian negotiation positionRussia: AMS=US 9 $ blnRussia: AMS=US 9 $ bln
0
10
20
30
40
50
60
70
80
Au
stra
lia
Ca
na
da
Cze
ch
EU
-15
Hu
ng
ary
Isla
nd
Jap
an
Ko
rea
Me
xico
N.Z
ea
lan
d
No
rwa
y
Po
lan
d
Sw
ize
rla
nd
US
A
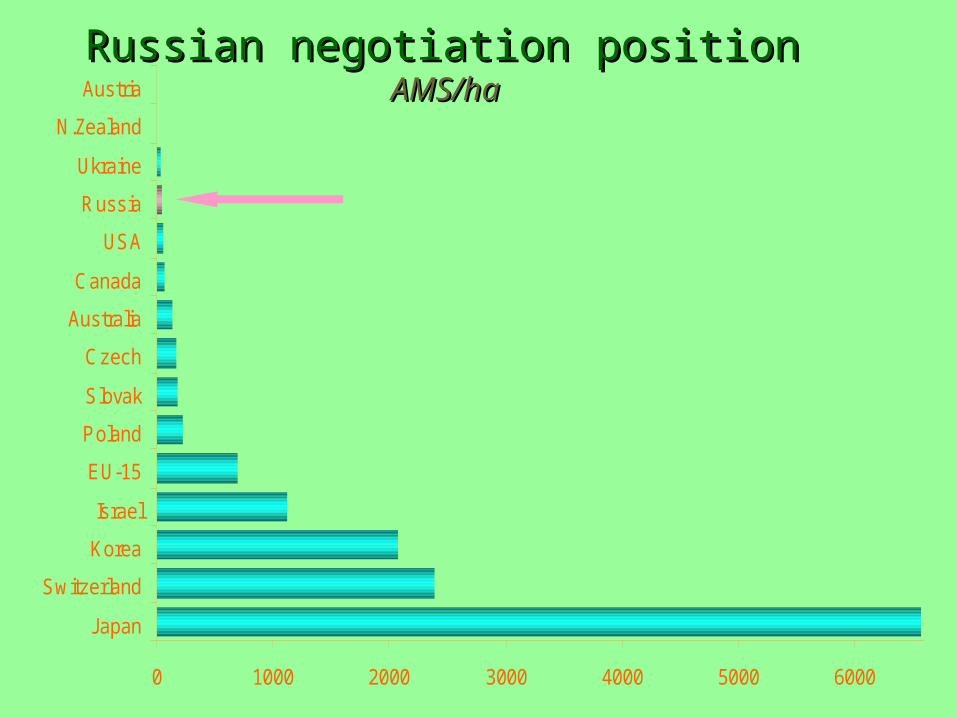
Russian negotiation positionRussian negotiation position AMS/haAMS/ha
0 1000 2000 3000 4000 5000 6000
Japan
Switzerland
Korea
Israel
EU-15
Poland
Slovak
Czech
Australia
Canada
USA
Russia
Ukraine
N.Zealand
Austria

Russian negotiation positionRussian negotiation position Russia:Russia: import tariffimport tariff
0
5
10
15
20
25
30
35
40
45
50
poul
try
red
mea
t
red
mea
t
fish
dairy
cear
eals
cere
als
flour
oil s
eeds
caca
o
past
a
vega
tabl
es
beve
arge
s
TRQ: beef and pork
Volume quota: poultry
Variable import duty: sugar
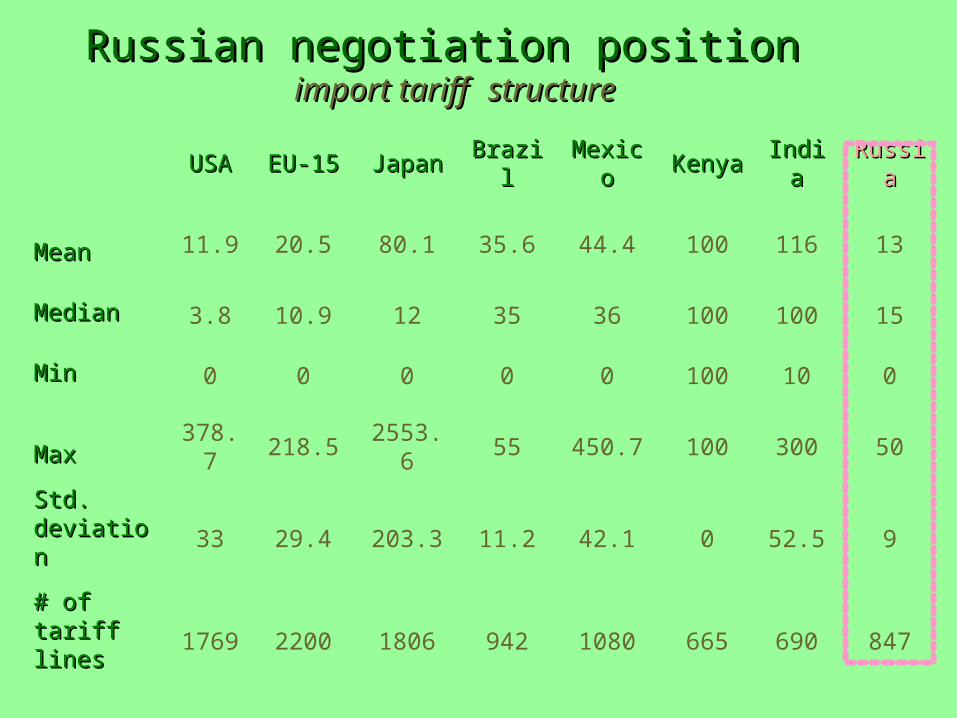
Russian negotiation positionRussian negotiation position import tariffimport tariff structurestructure
USAUSA EU-15EU-15 JapanJapan BrazilBrazil MexicoMexico KenyaKenya IndiaIndia RussiaRussia
MeanMean 11.9 20.5 80.1 35.6 44.4 100 116 13
MedianMedian 3.8 10.9 12 35 36 100 100 15
MinMin 0 0 0 0 0 100 10 0
MaxMax 378.7 218.5 2553.6 55 450.7 100 300 50
Std. Std. deviationdeviation
33 29.4 203.3 11.2 42.1 0 52.5 9
# of tariff # of tariff lineslines
1769 2200 1806 942 1080 665 690 847

Russian negotiation positionRussian negotiation position Russia:Russia: effect of tiered formulaeffect of tiered formula
Current tariff
Negotiated initial bound tariff
New Agreement final tariff t1=at0/(a+t0)
a=5 a=15 a=50
Meat 19.4 67.5 4.7 12.3 28.7
Fish 10 19.5 4 8.5 14
Dairy 15 42.5 4.5 11.1 23
Sugar 29 49.5 4.5 11.5 24.9

Impact of Russia’s accession on Agri-Food Impact of Russia’s accession on Agri-Food sectorsector
Russia: share of green box measures in total ag. budgetRussia: share of green box measures in total ag. budget
0,0
20,0
40,0
60,0
80,0
100,0
1995 1996 1997 1998 1999
%
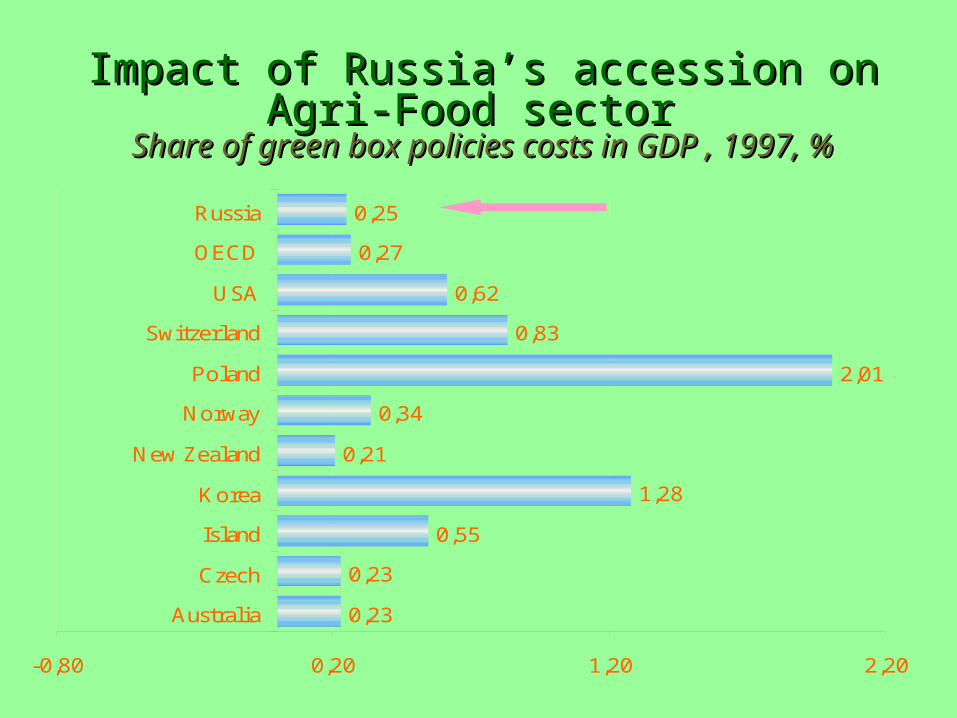
Impact of Russia’s accession on Agri-Food Impact of Russia’s accession on Agri-Food sectorsector
Share of green box policies costs in GDP , 1997, %Share of green box policies costs in GDP , 1997, %
0,23
0,23
0,55
1,28
0,21
0,34
2,01
0,83
0,62
0,27
0,25
-0,80 0,20 1,20 2,20
Australia
Czech
Island
Korea
New Zealand
Norway
Poland
Switzerland
USA
OECD
Russia

Impact of Russia’s accession on Agri-Food Impact of Russia’s accession on Agri-Food sectorsector
ag. budget structureag. budget structure
0% 20% 40% 60% 80% 100%
2001
2002
2003
2004
Federal Regional Local

Impact of Russia’s accession on Agri-Food Impact of Russia’s accession on Agri-Food sectorsector
export taxesexport taxes
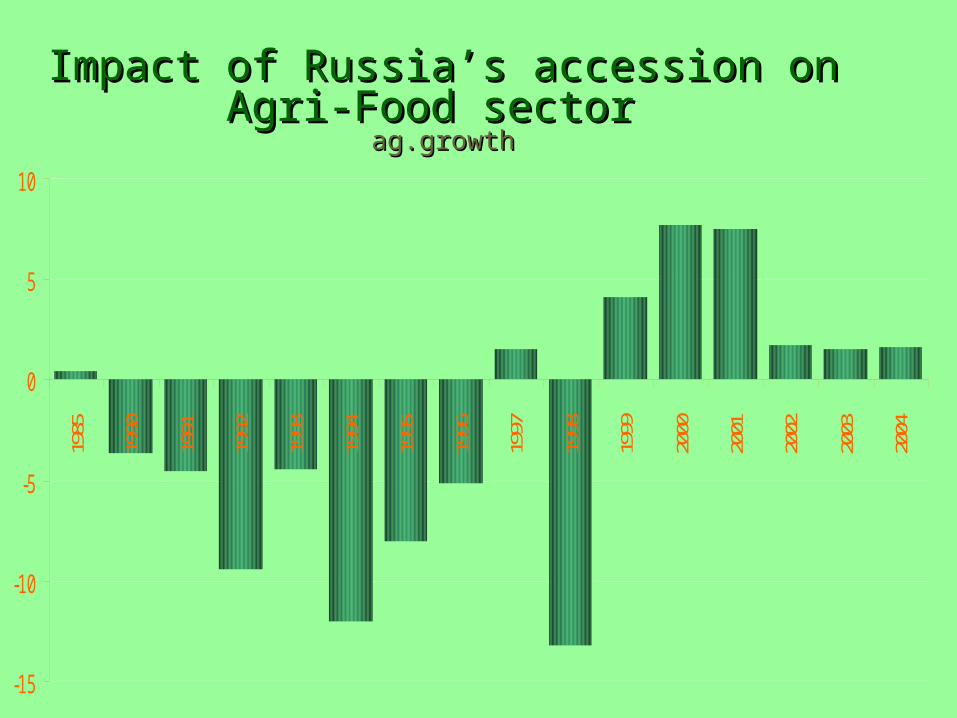
Impact of Russia’s accession on Agri-Food Impact of Russia’s accession on Agri-Food sectorsector ag.growthag.growth
-15
-10
-5
0
5
10
1985
1990
1991
1992
1993
1994
1995
1996
1997
1998
1999
2000
2001
2002
2003
2004

Impact of Russia’s accession on Agri-Food Impact of Russia’s accession on Agri-Food sectorsector
food industry growthfood industry growth
-16
-6
4
14
1986
-199
0 1991
1992
1993
1994
1995
1996
1997
1998
1999
2000
2001
2002
2003
2004

Impact of Russia’s accession on Agri-Food Impact of Russia’s accession on Agri-Food sectorsector
tradetrade
-15000
-10000
-5000
0
5000
10000
15000
1994 1995 1996 1997 1998 1999 2000 2001 2002 2003 2004US
$ m
io
export import balance
Recommended