Winnetka Public Schools District 36
Demographic Study
August 2016

WINNETKA PUBLIC SCHOOLS DISTRICT 36, IL DEMOGRAPHIC STUDY
Table of Contents
Executive Summary 1
Introduction 2
Data 2
Assumptions 3
Methodology 5
References 6
Appendix A: Enrollment Forecasts 7
Appendix B: Population Forecasts 15
Appendix C: Population Pyramids 17
Appendix D: Additional Tables 21
Appendix E: Live Attend Analysis 24

WINNETKA PUBLIC SCHOOLS DISTRICT 36, IL DEMOGRAPHIC STUDY
Executive Summary
1. The resident total fertility rate for the Winnetka Public Schools District over the life of the forecasts is below
replacement level. (1.56 vs. the replacement level of 2.1)
2. Most in-migration to the district continues to occur in the 0-to-9 and 35-to-49 year old age groups. 3. The local 18-to-24 year old population continues to leave the district, going to college or moving to other
urbanized areas. This population group accounts for the largest segment of the district’s out-migration flow. 4. The primary factors causing the district's enrollment to decline over the next 10 years are the growing number of
empty nest households, an insufficient existing homes sales market to maintain the current enrollment in the district, and a steady rate of in-migration of families.
5. Changes in year-to-year enrollment over the next 10 years will primarily be due to small cohorts entering and
moving through the school system in conjunction with larger cohorts leaving the system.
6. The elementary enrollment will begin a slight decline after the 2021-22 school year. This will be due primarily to the fact that the rising 4th grade cohorts will be greater than 175 students in size.
7. The median age of the population will increase from 42.7 in 2010 to 45.1 in 2025. 8. The rate, magnitude and price of existing home sales will become the increasingly dominant factor affecting the
amount of population and enrollment change.
9. Total district enrollment is forecasted to decrease by 93 students, or -5.4%, between 2015-16 and 2020-21. Total enrollment will decline by 59 students, or -3.6%, from 2020-21 to 2025-26.
1 Revised: 08/04/2016

WINNETKA PUBLIC SCHOOLS DISTRICT 36, IL DEMOGRAPHIC STUDY
INTRODUCTION
By demographic principle, distinctions are made between projections and forecasts. A projection extrapolates the past (and present) into the future with little or no attempt to take into account any factors that may impact the extrapolation (e.g., changes in fertility rates, housing patterns or migration patterns) while a forecast results when a projection is modified by reasoning to take into account the aforementioned factors.
To maximize the use of this study as a planning tool, the ultimate goal is not simply to project the past into the future, but rather to assess various factors’ impact on the future. The future population and enrollment change of each school district is influenced by a variety of factors. Not all factors will influence the entire school district at the same level. Some may affect different areas at dissimilar magnitudes and rates causing changes at varying points of time within the same district. The forecaster’s judgment, based on a thorough and intimate study of the district, has been used to modify the demographic trends and factors to more accurately predict likely changes. Therefore, strictly speaking, this study is a forecast, not a projection; and the amount of modification of the demographic trends varies between different areas of the district as well as within the timeframe of the forecast.
To calculate population forecasts of any type, particularly for smaller populations such as a school district, realistic suppositions must be made as to what the future will bring in terms of age specific fertility rates and residents’ demographic behavior at certain points of the life course. The demographic history of the school district and its interplay with the social and economic history of the area is the starting point and basis of most of these suppositions particularly on key factors such as the age structure of the area. The unique nature of each district's and attendance area’s demographic composition and rate of change over time must be assessed and understood to be factors throughout the life of the forecast series. Moreover, no two populations, particularly at the school district and attendance area level, have exactly the same characteristics.
The manifest purpose of these forecasts is to ascertain the demographic factors that will ultimately influence the enrollment levels in the district’s schools. There are of course, other non-demographic factors that affect enrollment levels over time. These factors include, but are not limited to transfer policies within the district; student transfers to and from neighboring districts; placement of “special programs” within school facilities that may serve students from outside the attendance area; state or federal mandates that dictate the movement of students from one facility to another (No Child Left Behind was an excellent example of this factor); the development of charter schools in the district; the prevalence of home schooling in the area; and the dynamics of local private schools.
Unless the district specifically requests the calculation of forecasts that reflect the effects of changes in these non-demographic factors, their influences are held constant for the life of the forecasts. Again, the main function of these forecasts is to determine what impact demographic changes will have on future enrollment. It is quite possible to calculate special “scenario” forecasts to measure the impact of school policy modifications as well as planned economic and financial changes. However in this case the results of these population and enrollment forecasts are meant to represent the most likely scenario for changes over the next 10 years in the district and its attendance areas.
The first part of the report will examine the assumptions made in calculating the population forecasts for the Winnetka Public Schools. Since the results of the population forecasts drive the subsequent enrollment forecasts, the assumptions listed in this section are paramount to understanding the area’s demographic dynamics. The remainder of the report is an explanation and analysis of the district's population forecasts and how they will shape the district's grade level enrollment forecasts. DATA
The data used for the forecasts come from a variety of sources. The Winnetka Public Schools provided enrollments by grade and attendance center for the school years 2011-2012 to 2015-16. Birth and death data for the years 2000 through 2013 were obtained from the Illinois Department of Health. The net migration values were calculated using Internal
2 Revised: 08/04/2016

WINNETKA PUBLIC SCHOOLS DISTRICT 36, IL DEMOGRAPHIC STUDY
Revenue Service migration reports for the years 2000 through 2012. The data used for the calculation of migration models came from the United States Bureau of the Census, 2005 to 2010, and the models were designed using demographic and economic factors. The base age-sex population counts used are from the results of the 2010 Census.
Recently the Census Bureau began releasing annual estimates of demographic variables at the block group and tract level from the American Community Survey (ACS). There has been wide scale reporting of these results in the national, state and local media. However, due to the methodological problems the Census Bureau is experiencing with their estimates derived from ACS data, particularly in areas with a population of less than 60,000, the results of the ACS are not used in these forecasts. For example, given the sampling framework used by the Census Bureau, each year only 120 of the over 4,000 current households in the district would have been included. For comparison 600 households in the district were included in the sample for the long form questionnaire in the 2000 Census. As a result of this small sample size, the ACS survey result from the last 5 years must be aggregated to produce the tract and block group estimates.
To develop the population forecast models, past migration patterns, current age specific fertility patterns, the magnitude and dynamics of the gross migration, the age specific mortality trends, the distribution of the population by age and sex, the rate and type of existing housing unit sales, and future housing unit construction are considered to be primary variables. In addition, the change in household size relative to the age structure of the forecast area was addressed. While there was a slight drop in the average household size in the Winnetka Public Schools as well as most other areas of the state during the previous 20 years, the rate of this decline has been forecasted to slow over the next ten years. ASSUMPTIONS
For these forecasts, the mortality probabilities
are held constant at the levels calculated for the year 2010. While the number of deaths in an area are impacted by and will change given the proportion of the local population over age 65, in the absence of an extraordinary event such as a natural disaster or a
breakthrough in the treatment of heart disease, death rates rarely move rapidly in any direction, particularly at the school district or attendance area level. Thus, significant changes are not foreseen in district’s mortality rates between now and the year 2025. Any increases forecasted in the number of deaths will be due primarily to the general aging of the district’s population and specifically to the increase in the number of residents aged 65 and older.
Similarly, fertility rates are assumed to stay fairly constant for the life of the forecasts. Like mortality rates, age specific fertility rates rarely change quickly or dramatically, particularly in small areas. Even with the recently reported rise in the fertility rates of the United States, overall fertility rates have stayed within a 10% range for most of the last 40 years. In fact, the vast majority of year to year change in an area’s number of births is due to changes in the number of women in child bearing ages (particularly ages 20-29) rather than any fluctuation in an area’s fertility rate.
The total fertility rate (TFR), the average number of births a woman will have while living in the school district during her lifetime, is estimated to be 1.56 for the total district for the ten years of the population forecasts. A TFR of 2.1 births per woman is considered to be the theoretical “replacement level” of fertility necessary for a population to remain constant in the absence of in-migration. Therefore, in the absence of migration, fertility alone would be insufficient to maintain the current level of population and enrollment within the Winnetka Public Schools over the course of the forecast period.
A close examination of data for the Winnetka Public Schools has shown the age specific pattern of net migration will be nearly constant throughout the life of the forecasts. While the number of in and out-migrants has changed in past years for the Winnetka Public Schools(and will change again over the next 10 years), the basic age pattern of the migrants has stayed nearly the same over the last 30 years. Based on the analysis of data it is safe to assume this age specific migration trend will remain unchanged into the future. This pattern of migration shows most of the local out-migration occurring in the 18-to-24 year old age group as young adults leave the area to go to college or move to other urbanized areas. The second group of out-migrants is those householders aged 70 and older who are downsizing their residences. Most of the local in-
3 Revised: 08/04/2016

WINNETKA PUBLIC SCHOOLS DISTRICT 36, IL DEMOGRAPHIC STUDY
migration occurs in the 0-to-9 and 35-49 age groups (the bulk of the which come from areas within 75 miles of the Winnetka Public Schools) primarily consisting of younger adults and their children.
As the suburban Cook County area is not currently contemplating any major expansions or contractions, the forecasts also assume that the current economic, political, social, and environmental factors, as well as the transportation and public works infrastructure (with a few notable exceptions) of the Winnetka Public Schools and its attendance areas will remain the same through the year 2025. Below is a list of assumptions and issues that are specific to the Winnetka Public Schools. These issues have been used to modify the population forecast models to more accurately predict the impact of these factors on each area’s population change. Specifically, the forecasts for the Winnetka Public Schools assume that throughout the study period:
a. There will be no short term economic recovery
in the next 18 months and the national, state or regional economy does not go into deep recession at any time during the 10 years of the forecasts; (Deep recession is defined as four consecutive quarters where the GDP contracts greater than 1% per quarter)
b. Interest rates have reached a historic low and will not fluctuate more than one percentage point in the short term; the interest rate for a 30 year fixed home mortgage stays below 5.0%;
c. The rate of mortgage approval stays at 1999-2003 levels and lenders do not return to “sub-prime” mortgage practices;
d. There are no additional restrictions placed on home mortgage lenders or additional bankruptcies of major credit providers;
e. The rate of housing foreclosures does not exceed 125% of the 2005-2007 average of suburban Cook County for any year in the forecasts;
f. All currently planned, platted, and approved housing developments are built out and completed by 2024. All housing units constructed are occupied by 2025;
g. The unemployment rates for the suburban Cook County and the Chicago Metropolitan Area will remain below 7.0% for the 10 years of the forecasts;
h. The rate of students transferring into and out of the Winnetka Public Schools will remain at the 2011-12 to 2015-16 average;
i. The Winnetka School District will continue to experience between 150 and 200 existing home sales annually over the next 10 years.
j. The inflation rate for gasoline will stay below 5% per year for the 10 years of the forecasts;
k. There will be no building moratorium within the district;
l. Businesses within the district and the Winnetka Public Schools area will remain viable;
m. The number of existing home sales in the district that are a result of “distress sales” (homes worth less than the current mortgage value) will not exceed 20% of total homes sales in the district for any given year;
n. Housing turnover rates (sale of existing homes in the district) will remain at their current levels. The majority of existing home sales are made by home owners over the age of 60;
o. Private school and home school attendance rates will remain constant;
p. The rate of foreclosures for commercial property remains at the 2004-2008 average for suburban Cook County; If a major employer in the district or in the
Greater Chicago Metropolitan Area closes, reduces or expands its operations, the population forecasts would need to be adjusted to reflect the changes brought about by the change in economic and employment conditions. The same holds true for any type of natural disaster, major change in the local infrastructure (e.g., highway construction, water and sewer expansion, changes in zoning regulations etc.), a further economic downturn, any additional weakness in the housing market or any instance or situation that causes rapid and dramatic population changes that could not be foreseen at the time the forecasts were calculated.
The high proportion of high school graduates from the Winnetka Public Schools that attend college or move to urban areas outside of the district for employment is a significant demographic factor. Their departure is a major reason for the extremely high out-migration in the 18 to 24 age group, and was taken into account when calculating these forecasts. The out-migration of graduating high school seniors is expected
4 Revised: 08/04/2016

WINNETKA PUBLIC SCHOOLS DISTRICT 36, IL DEMOGRAPHIC STUDY
to continue over the period of the forecasts and the rate of out-migration has been forecasted to remain the same over the life of the forecast series. Finally, all demographic trends (i.e., births, deaths, and migration) are assumed to be linear in nature and annualized over the forecast period. For example, if 1,000 births are forecasted for a 5-year period, an equal number, or proportion of the births are assumed to occur every year, 200 per year. Actual year-to-year variations do and will occur, but overall year to year trends are expected to be constant. METHODOLOGY
The population forecasts presented in this report are the result of using the Cohort-Component Method of population forecasting (Siegel, and Swanson, 2004: 561-601) (Smith et. al. 2004). As stated in the INTRODUCTION, the difference between a projection and a forecast is in the use of explicit judgment based upon the unique features of the area under study. Strictly speaking, a cohort projection refers to the future population that would result from a mathematical extrapolation of historical trends. Conversely, a cohort-component forecast refers to the future population that is expected because of a studied and purposeful selection of the components of change (i.e., births, deaths, and migration) and forecast models are developed to measure the impact of these changes in each specific geographic area.
Five sets of data are required to generate population and enrollment forecasts. These five data sets are:
1. a base-year population (here, the 2010
Census population for Winnetka Public Schools and its attendance areas);
2. a set of age-specific fertility rates for the district to be used over the forecast period and its attendance areas;
3. a set of age-specific survival (mortality) rates for the district and its attendance areas;
4. a set of age-specific migration rates for the district and its attendance areas; and;
5. the historical enrollment figures by grade.
The most significant and difficult aspect of producing enrollment forecasts is the generation of the
population forecasts in which the school age population (and enrollment) is embedded. In turn, the most challenging aspect of generating the population forecasts is found in deriving the rates of change in fertility, mortality, and migration. From the standpoint of demographic analysis, the Winnetka Public Schools is classified as a “small area” population (as compared to the population of the state of Illinois or to that of the United States). Small area population forecasts are more complicated to calculate because local variations in fertility, mortality, and migration may be more irregular than those at the regional, state or national scale. Especially challenging is the forecast of the migration rates for local areas, because changes in the area's socioeconomic characteristics can quickly change from past and current patterns (Peters and Larkin, 2002.)
The population forecasts for Winnetka Public Schools were calculated using a cohort-component method with the populations divided into male and female groups by five-year age cohorts that range from 0-to-4 years of age to 85 years of age and older (85+). Age- and sex-specific fertility, mortality, and migration models were constructed to specifically reflect the unique demographic characteristics of each of the attendance areas in the Winnetka Public Schools.
The enrollment forecasts were calculated using a modified average survivorship method. Average survivor rates (i.e., the proportion of students who progress from one grade level to the next given the average amount of net migration for that grade level) over the previous five years of year-to-year enrollment data were calculated for grades two through twelve. This procedure is used to identify specific grades where there are large numbers of students changing facilities for non-demographic factors, such as private school transfers or enrollment in special programs.
The survivorship rates were modified or adjusted to reflect the average rate of forecasted in and out migration of 5-to-9, 10-to-14 and 15-to-17 year old cohorts to each of the attendance centers in Winnetka Public Schools for the period 2010 to 2015. These survivorship rates then were adjusted to reflect the forecasted changes in age-specific migration the district should experience over the next five years. These modified survivorship rates were used to project the enrollment of grades 2 through 12 for the period 2015 to 2020. The survivorship rates were adjusted again for the period 2020 to 2025 to reflect the predicted changes in
5 Revised: 08/04/2016

WINNETKA PUBLIC SCHOOLS DISTRICT 36, IL DEMOGRAPHIC STUDY
the amount of age-specific migration in the district for the period.
The forecasted enrollments for kindergarten and first grade are derived from the 5-to-9 year old population of the age-sex population forecast at the elementary attendance center district level. This procedure allows the changes in the incoming grade sizes to be factors of forecasted population change and not an extrapolation of previous class sizes. Given the potentially large amount of variation in Kindergarten enrollment due to parental choice, changes in the state's minimum age requirement, and differing district policies on allowing children to start Kindergarten early, first grade enrollment is deemed to be a more accurate and reliable starting point for the forecasts. (McKibben, 1996) The level of the accuracy for both the population and enrollment forecasts at the school district level is estimated to be ±2.0% for the life of the forecasts.
REFERENCES McKibben, J.
The Impact of Policy Changes on Forecasting for School Districts.Population Research and Policy Review, Vol. 15, No. 5-6, December 1996
McKibben, J., M. Gann, and K. Faust. The Baby Boomlet's Role in Future College Enrollment.American Demographics, June 1999.
Peters, G. and R. Larkin Population Geography. 7th Edition. Dubuque, IA: Kendall Hunt Publishing. 2002.
Siegel, J. and D. Swanson The Methods and Materials of Demography: Second Edition, Academic Press: New York, New York. 2004.
Smith, S., J. Tayman and D. Swanson State and Local Population Projections, Academic Press, New York, New York. 2001.
6 Revised: 08/04/2016

WINNETKA PUBLIC SCHOOLS DISTRICT 36, IL DEMOGRAPHIC STUDY
Appendix A: Enrollment Forecasts
2011-12 2012-13 2013-14 2014-15 2015-16 2016-17 2017-18 2018-19 2019-20 2020-21 2021-22 2022-23 2023-24 2024-25 2025-26
K 133 139 152 157 132 145 143 144 143 143 141 140 138 137 140
1 178 174 173 172 191 171 171 169 168 166 164 161 158 155 152
2 188 186 188 180 168 197 176 176 174 174 172 169 166 163 160
3 189 204 195 196 177 171 201 179 179 177 177 175 172 169 166
4 225 203 218 189 199 180 174 204 181 184 182 182 181 178 175
2011-12 2012-13 2013-14 2014-15 2015-16 2016-17 2017-18 2018-19 2019-20 2020-21 2021-22 2022-23 2023-24 2024-25 2025-26
Total: K-4 913 906 926 894 867 864 865 872 845 844 836 827 815 802 793
2011-12 2012-13 2013-14 2014-15 2015-16 2016-17 2017-18 2018-19 2019-20 2020-21 2021-22 2022-23 2023-24 2024-25 2025-26
5 201 223 204 224 201 203 184 177 208 186 190 187 187 186 183
6 203 217 226 215 217 207 209 190 182 216 193 198 194 194 193
2011-12 2012-13 2013-14 2014-15 2015-16 2016-17 2017-18 2018-19 2019-20 2020-21 2021-22 2022-23 2023-24 2024-25 2025-26
Total:5-6 404 440 430 439 418 410 393 367 390 402 383 385 381 380 376
2011-12 2012-13 2013-14 2014-15 2015-16 2016-17 2017-18 2018-19 2019-20 2020-21 2021-22 2022-23 2023-24 2024-25 2025-26
7 250 206 216 224 220 219 209 211 192 186 220 197 202 198 198
8 212 249 207 217 217 223 222 212 214 197 191 226 202 207 203
2011-12 2012-13 2013-14 2014-15 2015-16 2016-17 2017-18 2018-19 2019-20 2020-21 2021-22 2022-23 2023-24 2024-25 2025-26
Total: 7-8 462 455 423 441 437 442 431 423 406 383 411 423 404 405 401
2011-12 2012-13 2013-14 2014-15 2015-16 2016-17 2017-18 2018-19 2019-20 2020-21 2021-22 2022-23 2023-24 2024-25 2025-26
Total: K-8 1779 1801 1779 1774 1722 1716 1689 1662 1641 1629 1630 1635 1600 1587 1570
2011-12 2012-13 2013-14 2014-15 2015-16 2016-17 2017-18 2018-19 2019-20 2020-21 2021-22 2022-23 2023-24 2024-25 2025-26
Total: K-8 1779 1801 1779 1774 1722 1716 1689 1662 1641 1629 1630 1635 1600 1587 1570
Change 22 -22 -5 -52 -6 -27 -27 -21 -12 1 5 -35 -13 -17
%-Change 1.2% -1.2% -0.3% -2.9% -0.3% -1.6% -1.6% -1.3% -0.7% 0.1% 0.3% -2.1% -0.8% -1.1%
2011-12 2012-13 2013-14 2014-15 2015-16 2016-17 2017-18 2018-19 2019-20 2020-21 2021-22 2022-23 2023-24 2024-25 2025-26
Total: K-4 913 906 926 894 867 864 865 872 845 844 836 827 815 802 793
Change -7 20 -32 -27 -3 1 7 -27 -1 -8 -9 -12 -13 -9
%-Change -0.8% 2.2% -3.5% -3.0% -0.3% 0.1% 0.8% -3.1% -0.1% -0.9% -1.1% -1.5% -1.6% -1.1%
2011-12 2012-13 2013-14 2014-15 2015-16 2016-17 2017-18 2018-19 2019-20 2020-21 2021-22 2022-23 2023-24 2024-25 2025-26
Total: 5-6 404 440 430 439 418 410 393 367 390 402 383 385 381 380 376
Change 36 -10 9 -21 -8 -17 -26 23 12 -19 2 -4 -1 -4
%-Change 8.9% -2.3% 2.1% -4.8% -1.9% -4.1% -6.6% 6.3% 3.1% -4.7% 0.5% -1.0% -0.3% -1.1%
2011-12 2012-13 2013-14 2014-15 2015-16 2016-17 2017-18 2018-19 2019-20 2020-21 2021-22 2022-23 2023-24 2024-25 2025-26
Total: 7-8 462 455 423 441 437 442 431 423 406 383 411 423 404 405 401
Change -7 -32 18 -4 5 -11 -8 -17 -23 28 12 -19 1 -4
%-Change -1.5% -7.0% 4.3% -0.9% 1.1% -2.5% -1.9% -4.0% -5.7% 7.3% 2.9% -4.5% 0.2% -1.0%
Green Cells (2015-16 and earlier) are historical data
Blue Cells (2016-17 and later) are forcasted years
Winnetka Public Schools: Total District Enrollment
Forecasts Developed July 2016
Green Cells (2015-16 and earlier) are historical data
Blue Cells (2016-17 and later) are forcasted years
Forecasts Developed July 2016
7 Revised: 08/04/2016

WINNETKA PUBLIC SCHOOLS DISTRICT 36, IL DEMOGRAPHIC STUDY
0
200
400
600
800
1000
1200
1400
1600
1800
2000
Winnetka Public Schools: Total District Enrollment
Winnetka PublicSchools: Total DistrictEnrollment
0
100
200
300
400
500
600
700
800
900
1000
Winnetka Public Schools: K-4th Enrollment
Winnetka Public Schools:K-4th Enrollment
8 Revised: 08/04/2016

WINNETKA PUBLIC SCHOOLS DISTRICT 36, IL DEMOGRAPHIC STUDY
0
50
100
150
200
250
300
350
400
450
Winnetka Public Schools: 5-6th Enrollment
Winnetka Public Schools:5-6th Enrollment
0
50
100
150
200
250
300
350
400
450
500
Winnetka Public Schools: 7-8th Enrollment
Winnetka Public Schools:7-8th Enrollment
9 Revised: 08/04/2016

WINNETKA PUBLIC SCHOOLS DISTRICT 36, IL DEMOGRAPHIC STUDY
2011-12 2012-13 2013-14 2014-15 2015-16 2016-17 2017-18 2018-19 2019-20 2020-21 2021-22 2022-23 2023-24 2024-25 2025-26
K 52 62 72 78 59 67 67 68 68 68 67 66 65 64 65
1 74 67 70 77 91 73 74 74 75 75 74 73 72 71 70
2 63 76 75 74 77 95 76 77 77 77 77 75 74 73 72
3 73 68 80 79 76 81 100 80 81 79 79 79 77 76 75
4 80 75 73 77 82 78 83 103 82 84 82 82 82 80 79
2011-12 2012-13 2013-14 2014-15 2015-16 2016-17 2017-18 2018-19 2019-20 2020-21 2021-22 2022-23 2023-24 2024-25 2025-26
Total: K-4 342 348 370 385 385 394 400 402 383 383 379 375 370 364 361
2011-12 2012-13 2013-14 2014-15 2015-16 2016-17 2017-18 2018-19 2019-20 2020-21 2021-22 2022-23 2023-24 2024-25 2025-26
Total: K-4 342 348 370 385 385 394 400 402 383 383 379 375 370 364 361
Change 6 22 15 0 9 6 2 -19 0 -4 -4 -5 -6 -3
% Change 1.8% 6.3% 4.1% 0.0% 2.3% 1.5% 0.5% -4.7% 0.0% -1.0% -1.1% -1.3% -1.6% -0.8%
Blue Cells (2016-17 and later) are forcasted years
Crow Island Elementary
Forecasts Developed July 2016
Green Cells (2015-16 and earlier) are historical data
Blue Cells (2016-17 and later) are forcasted years
Forecasts Developed July 2016
Green Cells (2015-16 and earlier) are historical data
0
50
100
150
200
250
300
350
400
450
Crow Island Elementary
Crow IslandElementary
10 Revised: 08/04/2016

WINNETKA PUBLIC SCHOOLS DISTRICT 36, IL DEMOGRAPHIC STUDY
2011-12 2012-13 2013-14 2014-15 2015-16 2016-17 2017-18 2018-19 2019-20 2020-21 2021-22 2022-23 2023-24 2024-25 2025-26
K 53 34 41 47 34 43 42 42 41 41 40 40 40 40 41
1 53 64 49 48 58 52 52 51 50 49 48 47 46 45 44
2 49 59 64 48 44 59 53 53 52 52 51 50 49 48 47
3 50 59 60 65 43 42 57 51 51 51 51 50 49 48 47
4 74 55 65 58 62 42 41 55 49 50 50 50 50 49 48
2011-12 2012-13 2013-14 2014-15 2015-16 2016-17 2017-18 2018-19 2019-20 2020-21 2021-22 2022-23 2023-24 2024-25 2025-26
Total: K-4 279 271 279 266 241 238 245 252 243 243 240 237 234 230 227
2011-12 2012-13 2013-14 2014-15 2015-16 2016-17 2017-18 2018-19 2019-20 2020-21 2021-22 2022-23 2023-24 2024-25 2025-26
Total: K-4 279 271 279 266 241 238 245 252 243 243 240 237 234 230 227
Change -8 8 -13 -25 -3 7 7 -9 0 -3 -3 -3 -4 -3
% Change -2.9% 3.0% -4.7% -9.4% -1.2% 2.9% 2.9% -3.6% 0.0% -1.2% -1.3% -1.3% -1.7% -1.3%
Blue Cells (2016-17 and later) are forcasted years
Greeley Elementary
Forecasts Developed July 2016
Green Cells (2015-16 and earlier) are historical data
Blue Cells (2016-17 and later) are forcasted years
Forecasts Developed July 2016
Green Cells (2015-16 and earlier) are historical data
0
50
100
150
200
250
300
Greeley Elementary
GreeleyElementary
11 Revised: 08/04/2016

WINNETKA PUBLIC SCHOOLS DISTRICT 36, IL DEMOGRAPHIC STUDY
2011-12 2012-13 2013-14 2014-15 2015-16 2016-17 2017-18 2018-19 2019-20 2020-21 2021-22 2022-23 2023-24 2024-25 2025-26
K 28 43 39 32 39 35 34 34 34 34 34 34 33 33 34
1 51 43 54 47 42 46 45 44 43 42 42 41 40 39 38
2 76 51 49 58 47 43 47 46 45 45 44 44 43 42 41
3 66 77 55 52 58 48 44 48 47 47 47 46 46 45 44
4 71 73 80 54 55 60 50 46 50 50 50 50 49 49 48
2011-12 2012-13 2013-14 2014-15 2015-16 2016-17 2017-18 2018-19 2019-20 2020-21 2021-22 2022-23 2023-24 2024-25 2025-26
Total: K-4 292 287 277 243 241 232 220 218 219 218 217 215 211 208 205
2011-12 2012-13 2013-14 2014-15 2015-16 2016-17 2017-18 2018-19 2019-20 2020-21 2021-22 2022-23 2023-24 2024-25 2025-26
Total: K-4 292 287 277 243 241 232 220 218 219 218 217 215 211 208 205
Change -5 -10 -34 -2 -9 -12 -2 1 -1 -1 -2 -4 -3 -3
% Change -1.7% -3.5% -12.3% -0.8% -3.7% -5.2% -0.9% 0.5% -0.5% -0.5% -0.9% -1.9% -1.4% -1.4%
Forecasts Developed July 2016
Green Cells (2015-16 and earlier) are historical data
Blue Cells (2016-17 and later) are forcasted years
Forecasts Developed July 2016
Green Cells (2015-16 and earlier) are historical data
Blue Cells (2016-17 and later) are forcasted years
Hubbard Woods Elementary
0
50
100
150
200
250
300
Hubbard Woods Elementary
Hubbard WoodsElementary
12 Revised: 08/04/2016

WINNETKA PUBLIC SCHOOLS DISTRICT 36, IL DEMOGRAPHIC STUDY
2011-12 2012-13 2013-14 2014-15 2015-16 2016-17 2017-18 2018-19 2019-20 2020-21 2021-22 2022-23 2023-24 2024-25 2025-26
5 201 223 204 224 201 203 184 177 208 186 190 187 187 186 183
6 203 217 226 215 217 207 209 190 182 216 193 198 194 194 193
2011-12 2012-13 2013-14 2014-15 2015-16 2016-17 2017-18 2018-19 2019-20 2020-21 2021-22 2022-23 2023-24 2024-25 2025-26
Total: 5-6 404 440 430 439 418 410 393 367 390 402 383 385 381 380 376
2011-12 2012-13 2013-14 2014-15 2015-16 2016-17 2017-18 2018-19 2019-20 2020-21 2021-22 2022-23 2023-24 2024-25 2025-26
Total: 5-6 404 440 430 439 418 410 393 367 390 402 383 385 381 380 376
Change 36 -10 9 -21 -8 -17 -26 23 12 -19 2 -4 -1 -4
% Change 8.9% -2.3% 2.1% -4.8% -1.9% -4.1% -6.6% 6.3% 3.1% -4.7% 0.5% -1.0% -0.3% -1.1%
Blue Cells (2016-17 and later) are forcasted years
The Skokie School
Forecasts Developed July 2016
Green Cells (2015-16 and earlier) are historical data
Blue Cells (2016-17 and later) are forcasted years
Forecasts Developed July 2016
Green Cells (2015-16 and earlier) are historical data
0
50
100
150
200
250
300
350
400
450
The Skokie School
The SkokieSchool
13 Revised: 08/04/2016

WINNETKA PUBLIC SCHOOLS DISTRICT 36, IL DEMOGRAPHIC STUDY
2011-12 2012-13 2013-14 2014-15 2015-16 2016-17 2017-18 2018-19 2019-20 2020-21 2021-22 2022-23 2023-24 2024-25 2025-26
7 250 206 216 224 220 219 209 211 192 186 220 197 202 198 198
8 212 249 207 217 217 223 222 212 214 197 191 226 202 207 203
2011-12 2012-13 2013-14 2014-15 2015-16 2016-17 2017-18 2018-19 2019-20 2020-21 2021-22 2022-23 2023-24 2024-25 2025-26
Total: 7-8 462 455 423 441 437 442 431 423 406 383 411 423 404 405 401
2011-12 2012-13 2013-14 2014-15 2015-16 2016-17 2017-18 2018-19 2019-20 2020-21 2021-22 2022-23 2023-24 2024-25 2025-26
Total: 7-8 462 455 423 441 437 442 431 423 406 383 411 423 404 405 401
Change -7 -32 18 -4 5 -11 -8 -17 -23 28 12 -19 1 -4
% Change -1.5% -7.0% 4.3% -0.9% 1.1% -2.5% -1.9% -4.0% -5.7% 7.3% 2.9% -4.5% 0.2% -1.0%
Blue Cells (2016-17 and later) are forcasted years
Washburne Middle School
Forecasts Developed July 2016
Green Cells (2015-16 and earlier) are historical data
Blue Cells (2016-17 and later) are forcasted years
Forecasts Developed July 2016
Green Cells (2015-16 and earlier) are historical data
0
50
100
150
200
250
300
350
400
450
500
Washburne Middle School
WashburneMiddle School
14 Revised: 08/04/2016

WINNETKA PUBLIC SCHOOLS DISTRICT 36, IL DEMOGRAPHIC STUDY
Appendix B: Population Forecasts
Males 2010 2015 2020 2025 Females 2010 2015 2020 2025 Total 2010 2015 2020 20252010 to
2015
2015 to
2020
2020 to
2025
0-4 323 300 310 260 0-4 327 300 310 260 0-4 650 600 620 520 Births 240 240 240
5-9 601 550 540 520 5-9 549 560 540 520 5-9 1,150 1,110 1,080 1,040 Deaths 450 460 450
10-14 746 630 580 570 10-14 670 580 580 560 10-14 1,416 1,210 1,160 1,130 Natural Increase -210 -220 -210
15-19 559 650 540 510 15-19 518 580 480 500 15-19 1,077 1,230 1,020 1,010 Net Migration 150 150 130
20-24 144 160 200 170 20-24 127 120 130 120 20-24 271 280 330 290 Change -60 -70 -80
25-29 95 90 120 160 25-29 76 80 80 80 25-29 171 170 200 240
30-34 92 140 140 170 30-34 108 110 120 120 30-34 200 250 260 290
35-39 203 230 280 260 35-39 276 250 250 240 35-39 479 480 530 500
40-44 426 320 350 380 40-44 490 400 370 360 40-44 916 720 720 740
45-49 554 480 400 400 45-49 618 550 470 430 45-49 1,172 1,030 870 830
50-54 535 550 480 400 50-54 554 610 550 470 50-54 1,089 1,160 1,030 870
55-59 453 510 530 450 55-59 469 550 600 530 55-59 922 1,060 1,130 980
60-64 361 380 470 480 60-64 329 410 500 560 60-64 690 790 970 1,040
65-69 237 300 320 390 65-69 247 270 350 440 65-69 484 570 670 830
70-74 152 170 220 250 70-74 197 190 220 290 70-74 349 360 440 540
75-79 148 80 100 140 75-79 196 130 130 160 75-79 344 210 230 300
80-84 118 90 40 60 80-84 132 150 90 90 80-84 250 240 130 150
85+ 69 90 110 70 85+ 111 150 190 180 85+ 180 240 300 250
Total 5,816 5,720 5,730 5,640 Total 5,994 5,990 5,960 5,910 Total 11,810 11,710 11,690 11,550
Median Age 42.7 43.6 44.5 45.1
Winnetka Public Schools: Total Population
Differences between period Totals may not
equal Change due to rounding.
Males 2010 2015 2020 2025 Females 2010 2015 2020 2025 Total 2010 2015 2020 20252010 to
2015
2015 to
2020
2020 to
2025
0-4 141 130 150 120 0-4 147 130 150 120 0-4 288 260 300 240 Births 110 100 100
5-9 227 240 240 230 5-9 206 240 240 230 5-9 433 480 480 460 Deaths 160 160 160
10-14 284 240 250 250 10-14 254 220 250 250 10-14 538 460 500 500 Natural Increase -50 -60 -60
15-19 225 250 200 220 15-19 198 220 180 220 15-19 423 470 380 440 Net Migration 60 60 50
20-24 59 70 70 70 20-24 58 50 40 50 20-24 117 120 110 120 Change 10 0 -10
25-29 27 40 60 50 25-29 31 40 30 20 25-29 58 80 90 70
30-34 43 50 60 80 30-34 54 50 60 50 30-34 97 100 120 130
35-39 80 90 100 100 35-39 103 100 100 100 35-39 183 190 200 200
40-44 160 120 130 130 40-44 184 140 140 130 40-44 344 260 270 260
45-49 220 180 140 140 45-49 245 210 160 160 45-49 465 390 300 300
50-54 211 220 180 140 50-54 213 240 210 160 50-54 424 460 390 300
55-59 168 200 210 170 55-59 172 210 240 200 55-59 340 410 450 370
60-64 134 140 180 190 60-64 123 150 190 220 60-64 257 290 370 410
65-69 79 110 120 150 65-69 96 100 130 160 65-69 175 210 250 310
70-74 51 50 80 90 70-74 76 70 80 100 70-74 127 120 160 190
75-79 60 20 30 50 75-79 71 50 50 60 75-79 131 70 80 110
80-84 43 30 10 10 80-84 45 50 30 30 80-84 88 80 40 40
85+ 21 30 40 20 85+ 33 50 60 60 85+ 54 80 100 80
Total 2,233 2,210 2,250 2,210 Total 2,309 2,320 2,340 2,320 Total 4,542 4,530 4,590 4,530
Median Age 41.9 42.0 42.1 42.0
Crow Island Elementary School
Differences between period Totals may not
equal Change due to rounding.
15 Revised: 08/04/2016

WINNETKA PUBLIC SCHOOLS DISTRICT 36, IL DEMOGRAPHIC STUDY
Males 2010 2015 2020 2025 Females 2010 2015 2020 2025 Total 2010 2015 2020 20252010 to
2015
2015 to
2020
2020 to
2025
0-4 141 130 150 120 0-4 147 130 150 120 0-4 288 260 300 240 Births 110 100 100
5-9 227 240 240 230 5-9 206 240 240 230 5-9 433 480 480 460 Deaths 160 160 160
10-14 284 240 250 250 10-14 254 220 250 250 10-14 538 460 500 500 Natural Increase -50 -60 -60
15-19 225 250 200 220 15-19 198 220 180 220 15-19 423 470 380 440 Net Migration 60 60 50
20-24 59 70 70 70 20-24 58 50 40 50 20-24 117 120 110 120 Change 10 0 -10
25-29 27 40 60 50 25-29 31 40 30 20 25-29 58 80 90 70
30-34 43 50 60 80 30-34 54 50 60 50 30-34 97 100 120 130
35-39 80 90 100 100 35-39 103 100 100 100 35-39 183 190 200 200
40-44 160 120 130 130 40-44 184 140 140 130 40-44 344 260 270 260
45-49 220 180 140 140 45-49 245 210 160 160 45-49 465 390 300 300
50-54 211 220 180 140 50-54 213 240 210 160 50-54 424 460 390 300
55-59 168 200 210 170 55-59 172 210 240 200 55-59 340 410 450 370
60-64 134 140 180 190 60-64 123 150 190 220 60-64 257 290 370 410
65-69 79 110 120 150 65-69 96 100 130 160 65-69 175 210 250 310
70-74 51 50 80 90 70-74 76 70 80 100 70-74 127 120 160 190
75-79 60 20 30 50 75-79 71 50 50 60 75-79 131 70 80 110
80-84 43 30 10 10 80-84 45 50 30 30 80-84 88 80 40 40
85+ 21 30 40 20 85+ 33 50 60 60 85+ 54 80 100 80
Total 2,233 2,210 2,250 2,210 Total 2,309 2,320 2,340 2,320 Total 4,542 4,530 4,590 4,530
Median Age 41.9 42.0 42.1 42.0
Greeley Elementary School
Differences between period Totals may not
equal Change due to rounding.
Males 2010 2015 2020 2025 Females 2010 2015 2020 2025 Total 2010 2015 2020 20252010 to
2015
2015 to
2020
2020 to
2025
0-4 98 90 80 70 0-4 91 90 80 70 0-4 189 180 160 140 Births 80 80 70
5-9 218 180 170 160 5-9 202 180 170 160 5-9 420 360 340 320 Deaths 170 170 160
10-14 265 230 190 180 10-14 231 210 190 180 10-14 496 440 380 360 Natural Increase -90 -90 -90
15-19 182 230 200 170 15-19 170 200 180 160 15-19 352 430 380 330 Net Migration 50 50 40
20-24 50 50 70 60 20-24 38 30 40 50 20-24 88 80 110 110 Change -40 -40 -50
25-29 43 30 30 60 25-29 36 20 20 20 25-29 79 50 50 80
30-34 31 50 40 40 30-34 26 40 30 20 30-34 57 90 70 60
35-39 60 80 100 80 35-39 101 80 90 70 35-39 161 160 190 150
40-44 162 110 130 140 40-44 174 160 130 130 40-44 336 270 260 270
45-49 176 180 150 160 45-49 204 190 190 150 45-49 380 370 340 310
50-54 179 170 180 150 50-54 182 200 190 190 50-54 361 370 370 340
55-59 167 170 170 170 55-59 161 180 200 190 55-59 328 350 370 360
60-64 122 140 170 160 60-64 109 140 170 190 60-64 231 280 340 350
65-69 94 100 120 140 65-69 85 90 120 160 65-69 179 190 240 300
70-74 51 70 70 100 70-74 70 70 70 100 70-74 121 140 140 200
75-79 54 30 40 50 75-79 71 50 50 50 75-79 125 80 90 100
80-84 40 30 10 30 80-84 61 50 30 30 80-84 101 80 40 60
85+ 36 40 40 20 85+ 51 70 80 70 85+ 87 110 120 90
Total 2,028 1,980 1,960 1,940 Total 2,063 2,050 2,030 1,990 Total 4,091 4,030 3,990 3,930
Median Age 43.0 44.2 45.8 47.3
Hubbard Woods Elementary School
Differences between period Totals may not
equal Change due to rounding.
16 Revised: 08/04/2016

WINNETKA PUBLIC SCHOOLS DISTRICT 36, IL DEMOGRAPHIC STUDY
Appendix C: Population Pyramids
Winnetka Public Schools Total Population – 2010 Census
1,000 500 0 500 1,000
0-4
5-9
10-14
15-19
20-24
25-29
30-34
35-39
40-44
45-49
50-54
55-59
60-64
65-69
70-74
75-79
80-84
85+
Males Females
17 Revised: 08/04/2016

WINNETKA PUBLIC SCHOOLS DISTRICT 36, IL DEMOGRAPHIC STUDY
Crow Island Elementary School Total Population – 2010 Census
300 150 0 150 300
0-4
5-9
10-14
15-19
20-24
25-29
30-34
35-39
40-44
45-49
50-54
55-59
60-64
65-69
70-74
75-79
80-84
85+
Males Females
18 Revised: 08/04/2016
WINNETKA PUBLIC SCHOOLS DISTRICT 36, IL DEMOGRAPHIC STUDY
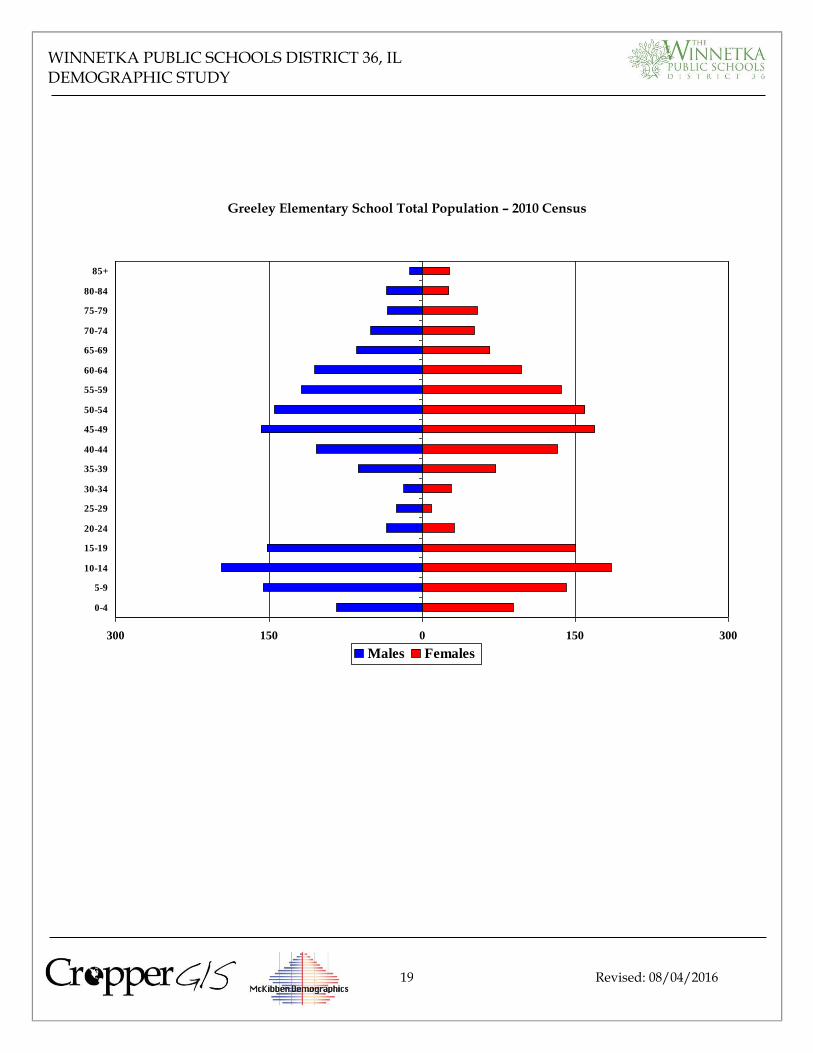
Greeley Elementary School Total Population – 2010 Census
300 150 0 150 300
0-4
5-9
10-14
15-19
20-24
25-29
30-34
35-39
40-44
45-49
50-54
55-59
60-64
65-69
70-74
75-79
80-84
85+
Males Females
19 Revised: 08/04/2016

WINNETKA PUBLIC SCHOOLS DISTRICT 36, IL DEMOGRAPHIC STUDY
Hubbard Woods Elementary School Total Population – 2010 Census
300 150 0 150 300
0-4
5-9
10-14
15-19
20-24
25-29
30-34
35-39
40-44
45-49
50-54
55-59
60-64
65-69
70-74
75-79
80-84
85+
Males Females
20 Revised: 08/04/2016

WINNETKA PUBLIC SCHOOLS DISTRICT 36, IL DEMOGRAPHIC STUDY
Appendix D: Additional Tables
HH w/ Pop
Under 18
% HH w/ Pop
Under 18
Total
Households
Household
Population
Persons Per
Household
Crow Island 720 47.7% 1508 4538 3.01
Greeley 496 46.8% 1059 3177 3.00
Hubbard Woods 615 44.1% 1396 4091 2.93
District Total 1831 46.2% 3963 11806 2.98
Table 2: Household Characteristics by Elementary Area, 2010 Census
2010 2015
2010-2015
Change 2020
2015-2020
Change
2010-2020
Change
Crow Island 4,542 4,530 -0.3% 4,590 1.3% 1.1%
Greeley 3,177 3,150 -0.9% 3,110 -1.3% -2.1%
Hubbard Woods 4,091 4,030 -1.5% 3,990 -1.0% -2.5%
District Total 11,810 11,710 -0.9% 11,690 -0.2% -1.0%
Table 1: Forecasted Elementary Area Population Change, 2010 to 2020
Percentage of
Householders aged
35-54
Percentage of
Householders aged 65+
Percentage of
Householders Who
Own Homes
Crow Island 48.6% 24.5% 88.7%
Greeley 48.4% 25.4% 93.1%
Hubbard Woods 45.3% 28.5% 88.2%
District Total 47.4% 26.2% 89.7%
Table 3: Householder Characteristics by Elementary Area, 2010 Census
21 Revised: 08/04/2016
WINNETKA PUBLIC SCHOOLS DISTRICT 36, IL DEMOGRAPHIC STUDY
Percentage of Single
Person Households
Percentage of Single Person
Households and are 65+
Crow Island 16.0% 8.3%
Greeley 15.7% 9.0%
Hubbard Woods 19.3% 10.7%
District Total 17.1% 9.3%
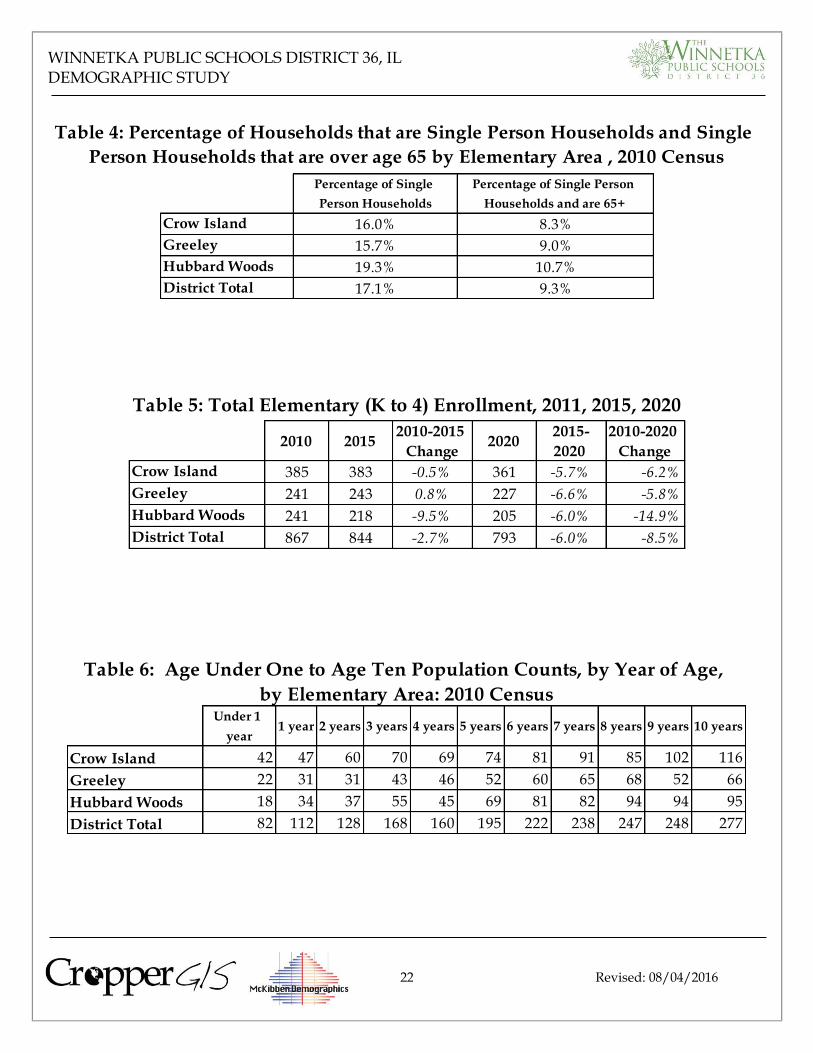
Table 4: Percentage of Households that are Single Person Households and Single
Person Households that are over age 65 by Elementary Area , 2010 Census
2010 20152010-2015
Change2020
2015-
2020
2010-2020
Change
Crow Island 385 383 -0.5% 361 -5.7% -6.2%
Greeley 241 243 0.8% 227 -6.6% -5.8%
Hubbard Woods 241 218 -9.5% 205 -6.0% -14.9%
District Total 867 844 -2.7% 793 -6.0% -8.5%
Table 5: Total Elementary (K to 4) Enrollment, 2011, 2015, 2020
Under 1
year1 year 2 years 3 years 4 years 5 years 6 years 7 years 8 years 9 years 10 years
Crow Island 42 47 60 70 69 74 81 91 85 102 116
Greeley 22 31 31 43 46 52 60 65 68 52 66
Hubbard Woods 18 34 37 55 45 69 81 82 94 94 95
District Total 82 112 128 168 160 195 222 238 247 248 277
Table 6: Age Under One to Age Ten Population Counts, by Year of Age,
by Elementary Area: 2010 Census
22 Revised: 08/04/2016

WINNETKA PUBLIC SCHOOLS DISTRICT 36, IL DEMOGRAPHIC STUDY
2010 CensusUnder 1
year1 year 2 years 3 years 4 years 5 years 6 years 7 years 8 years 9 years 10 years 11 years 12 years
2015 Enrollment 132 191 168 177 199 201 217 220 217
160.98% 170.54% 131.25% 105.36% 124.38% 103.08% 97.75% 92.44% 87.85%
2014 Enrollment 157 172 180 196 189 224 215 224 217
140.18% 134.38% 107.14% 122.50% 96.92% 100.90% 90.34% 90.69% 87.50%
2013 Enrollment 152 173 188 195 218 204 226 216 207
118.75% 102.98% 117.50% 100.00% 98.20% 85.71% 91.50% 87.10% 74.73%
2012 Enrollment 139 174 186 204 203 223 217 206 249
82.74% 108.75% 95.38% 91.89% 85.29% 90.28% 87.50% 74.37% 86.76%
2011 Enrollment 133 178 188 189 225 201 203 250 212
83.13% 91.28% 84.68% 79.41% 91.09% 81.05% 73.29% 87.11% 79.70%
Table 7: Comparison of District Enrollment by Grade with 2010 Census Counts by Age, 2010-2015
Winnetka Public
Schools Total:82 112 128 168 160 195 222 238 247 248 277 287 266
23 Revised: 08/04/2016

WINNETKA PUBLIC SCHOOLS DISTRICT 36, IL DEMOGRAPHIC STUDY
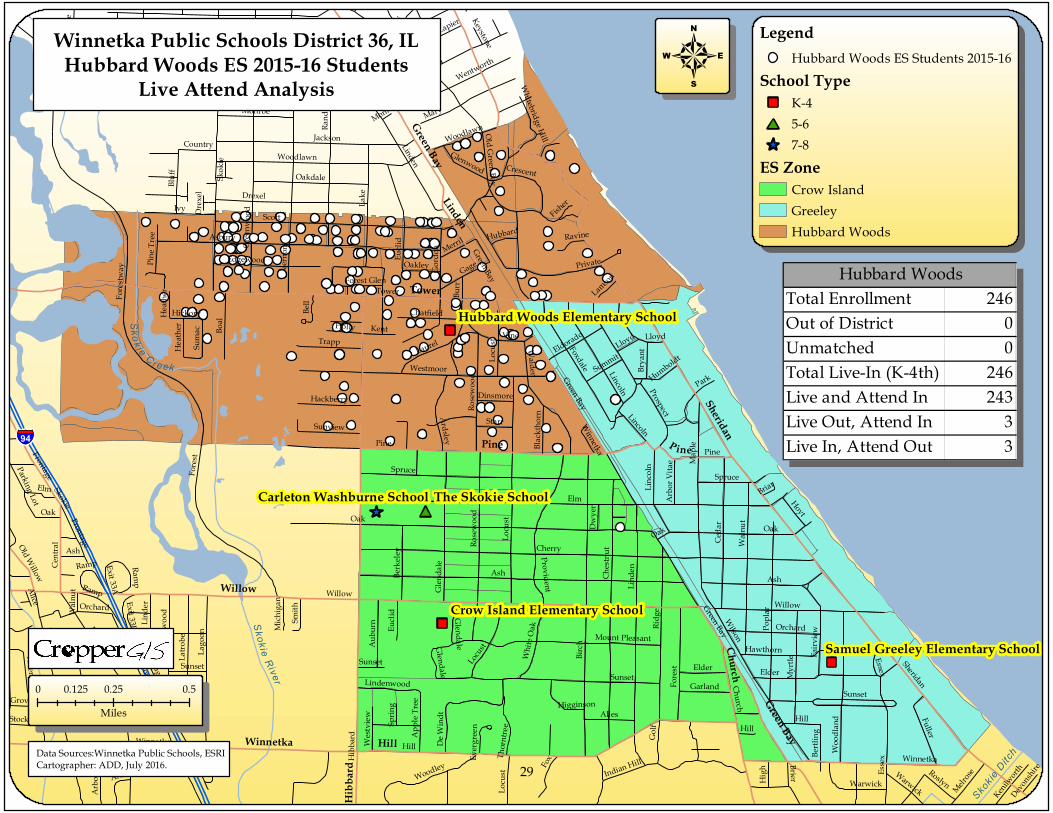
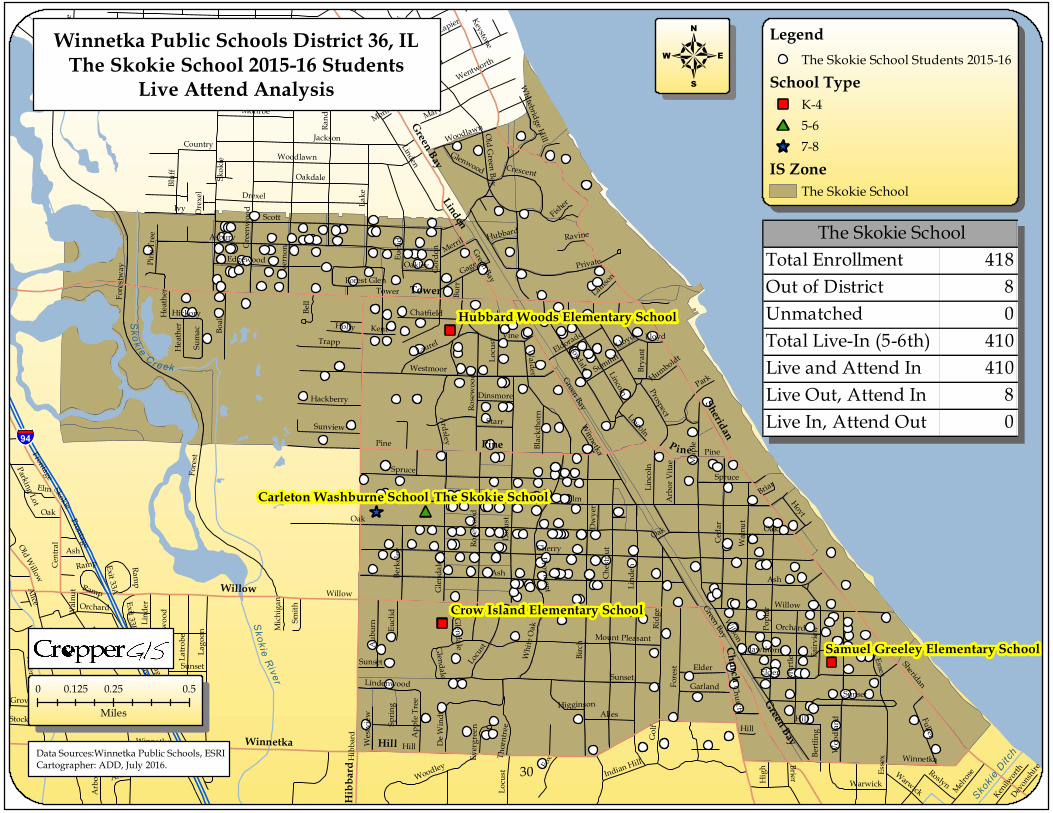
Appendix E: Live Attend Analysis This map series focuses on illustrating the geographic distribution of the Winnetka Public Schools 2015-16 students in relation to school attendance boundaries. Below is an example of a map from this series. Basic Map Elements The legend explains how different features are represented, either by a point (e.g. schools and students), or by an area/polygon (e.g. attendance boundaries). The scale bar references the distance ratio of the map in relation to the real world. Please note that each white dot represents a student’s address, at which, multiple students could reside. Therefore, counting the number of dots shown on the map might not reflect the student population accurately.
24 Revised: 08/04/2016

WINNETKA PUBLIC SCHOOLS DISTRICT 36, IL DEMOGRAPHIC STUDY
Live-Attend Tables Each map has a table listing various statistics about the student data in this region. Here is a guide for reading this table:
Total Enrollment – the number of students attending Crow Island ES. Out of District – the number of students who live outside of the Winnetka Public Schools boundary, yet attend this school. Unmatched – the number of students attending Crow Island ES whose addresses were not located by the GIS. Total Live-In – number of students who live within the school’s attendance boundary, who are in the K-4th grade cohort. The ‘total-live in’ statistic here indicates there are 378 K-4th grade students living within the Crow Island ES attendance boundary.
Live and Attend In – number of K-4th students who live within the attendance boundary, and also attend that school. In this example, 376 K-4th grade students who live within the Crow Island ES attendance boundary also attend Crow Island ES. Live Out, Attend In – number of K-4th students who live outside of the Crow Island ES attendance boundary, but attend Crow Island ES. Live In, Attend Out – number of K-4th students who live inside the Crow Island ES attendance boundary, yet attend a different elementary school.
Total Enrollment 386
Out of District 5
Unmatched 1
Total Live-In (K-4th) 378
Live and Attend In 376
Live Out, Attend In 10
Live In, Attend Out 2
Crow Island
25 Revised: 08/04/2016

WINNETKA PUBLIC SCHOOLS DISTRICT 36, IL DEMOGRAPHIC STUDY
Live Attend Matrix The table below gives details on the schools that students attend and the school zones where they live. The schools of attendance are listed on the left while the districts where students live are listed on the top line. The numbers highlighted in green are counts of students who attend the assigned schools for the zones where they live.
Where K-4 Students Live
Cro
w Is
land
Gre
eley
Hubbar
d Woods
Out o
f Dist
rict
Unm
atch
ed
Live
Out A
ttend In
378 236 246 8 1
Crow Island 386 376 1 3 5 1 10
Greeley School 237 1 233 3 4
Hubbard Woods 246 1 2 243 3
Live In Attend Out 2 3 3
Wh
ere
K-4
Stu
de
nts
Att
en
d
26 Revised: 08/04/2016

#*_̂
")
")
")
The Skokie SchoolCarleton Washburne School
Crow Island Elementary School
Hubbard Woods Elementary School
Samuel Greeley Elementary School
94
Sheridan
Elm
Tower
Hill
Willow
Oak
Ash
Cherry
Hibb
ard
Birch
ScottGr
ove
Fores
tway
Happ
Verno
n
Spruce
Winnetka
Asbury
Green BayWilson
Ridge
Maple
Fores
t
Popla
r
Jackson
Chest
nut Ce
dar
Westmoor
Green
wood
Essex
Walnu
t
Drexel
Old Green Bay
Linden
Burr
Frontage
Ivy
Church
Harbor
Rand
olph
Lago
on
Mary
Eucli
d
Foxdale
Adams
Jefferson
Madison
Myrtl
e
Walden
Vine
Provident
Boal
Northfield
Mount Pleasant
Wood
land
Park
Hawthorn
OakdaleLa
trobe
Chatfield
Sunset
Fox
Gordo
n
Bluff
Bryan
t
Private
Fuller
Centr
al
Rosew
ood
Palos
Lincol
n
Trapp
Riverside
Pine
Gage
Golf
Wentworth
Locu
st
Alles
Edgewood
Fairv
iew
Arbo
rMonroe
Ardsley
De W
indt
Laurel
Fisher
Ramp
Brier
Lapier
Elder
Lockw
oodOrchard
Aubu
rn
Harding
Country
Prospect
Merril
Woodley
Bell
Sunview Starr
White
Oak
Hoyt
Warwick
Kent
Eldorado
Melrose
Holly
Garland
Crescent
Woodlawn
Hackberry
Holder
Thorn
tree
Glenwood
Linde
r
Suma
c
Smith
Roslyn
Apple
Tree
Lake
Summit
Parking Lot
OakleyPine T
ree
Briar
High
Prairie
Indian Hill
Exit 33B
Heath
er
Glendale
Bertl
ing
Lindenwood
Westv
iew
Kenilworth
Blackt
horn
Old Willow
Ravine
Higginson
Lloyd
Hickory
Arbo
r Vita
e
Dwye
r
DinsmoreHumboldt
Stockton
Mich
igan
Alice
Sprin
g
Whitebridge Hill
LamsonForest Glen
Berke
ley
Hubbard
Everg
reen
Skok
ie
Exit 33A
Keystone
Devonshir
e
Crestwood
Lloyd
Frontage
Harding
Ash
Willow
Locu
st
Frontage
Monroe
Spruce
Fairvi
ew
Hill
Essex
Grove
Locu
st
Lago
on
Pine
Hill
Locust
WarwickArbor
LincolnGl
enda
le
Winnetka
Winnetka
Skokie
Ramp
Heath
er
Oak
Orchard
Woodlawn
Green Bay
Glendale
Frontage
94
Oak
Elm
Oak
Walnu
t
Sunset
Ash
Sunset
Green Bay
Green Bay
Drexe
l
Eucli
d
Rosew
ood
Sunset ElderFo
rest
Lincoln
Linde
nRamp
Lake
§̈¦94
Lake Michigan
Sheridan
Tower
Hill
Willow
Pine
Hibb
ard
Winnetka
Green Bay
Church
Linden
P ine
Green Bay
Sko ki e C r eek
SkokieRiver
Skokie
Ditch
Skok ie Creek
LegendCrow Island ES Students 2015-16
School Type") K-4#* 5-6_̂ 7-8
ES ZoneCrow IslandGreeleyHubbard Woods
0 0.25 0.50.125Miles
4
Data Sources:Winnetka Public Schools, ESRICartographer: ADD, July 2016.
Winnetka Public Schools District 36, ILCrow Island ES 2015-16 Students
Live Attend Analysis
Total Enrollment 386Out of District 5Unmatched 1Total Live-In (K-4th) 378Live and Attend In 376Live Out, Attend In 10Live In, Attend Out 2
Crow Island
27

#*_̂
")
")
")
The Skokie SchoolCarleton Washburne School
Crow Island Elementary School
Hubbard Woods Elementary School
Samuel Greeley Elementary School
94
Sheridan
Elm
Tower
Hill
Willow
Oak
Ash
Cherry
Hibb
ard
Birch
ScottGr
ove
Fores
tway
Happ
Verno
n
Spruce
Winnetka
Asbury
Green BayWilson
Ridge
Maple
Fores
t
Popla
r
Jackson
Chest
nut Ce
dar
Westmoor
Green
wood
Essex
Walnu
t
Drexel
Old Green Bay
Linden
Burr
Frontage
Ivy
Church
Harbor
Rand
olph
Lago
on
Mary
Eucli
d
Foxdale
Adams
Jefferson
Madison
Myrtl
e
Walden
Vine
Provident
Boal
Northfield
Mount Pleasant
Wood
land
Park
Hawthorn
OakdaleLa
trobe
Chatfield
Sunset
Fox
Gordo
n
Bluff
Bryan
t
Private
Fuller
Centr
al
Rosew
ood
Palos
Lincol
n
Trapp
Riverside
Pine
Gage
Golf
Wentworth
Locu
st
Alles
Edgewood
Fairv
iew
Arbo
rMonroe
Ardsley
De W
indt
Laurel
Fisher
Ramp
Brier
Lapier
Elder
Lockw
oodOrchard
Aubu
rn
Harding
Country
Prospect
Merril
Woodley
Bell
Sunview Starr
White
Oak
Hoyt
Warwick
Kent
Eldorado
Melrose
Holly
Garland
Crescent
Woodlawn
Hackberry
Holder
Thorn
tree
Glenwood
Linde
r
Suma
c
Smith
Roslyn
Apple
Tree
Lake
Summit
Parking Lot
OakleyPine T
ree
Briar
High
Prairie
Indian Hill
Exit 33B
Heath
er
Glendale
Bertl
ing
Lindenwood
Westv
iew
Kenilworth
Blackt
horn
Old Willow
Ravine
Higginson
Lloyd
Hickory
Arbo
r Vita
e
Dwye
r
DinsmoreHumboldt
Stockton
Mich
igan
Alice
Sprin
g
Whitebridge Hill
LamsonForest Glen
Berke
ley
Hubbard
Everg
reen
Skok
ie
Exit 33A
Keystone
Devonshir
e
Crestwood
Lloyd
Frontage
Harding
Ash
Willow
Locu
st
Frontage
Monroe
Spruce
Fairvi
ew
Hill
Essex
Grove
Locu
st
Lago
on
Pine
Hill
Locust
WarwickArbor
LincolnGl
enda
le
Winnetka
Winnetka
Skokie
Ramp
Heath
er
Oak
Orchard
Woodlawn
Green Bay
Glendale
Frontage
94
Oak
Elm
Oak
Walnu
t
Sunset
Ash
Sunset
Green Bay
Green Bay
Drexe
l
Eucli
d
Rosew
ood
Sunset ElderFo
rest
Lincoln
Linde
nRamp
Lake
§̈¦94
Lake Michigan
Sheridan
Tower
Hill
Willow
Pine
Hibb
ard
Winnetka
Green Bay
Church
Linden
P ine
Green Bay
Sko ki e C r eek
SkokieRiver
Skokie
Ditch
Skok ie Creek
LegendGreeley ES Students 2015-16
School Type") K-4#* 5-6_̂ 7-8
ES ZoneCrow IslandGreeleyHubbard Woods
0 0.25 0.50.125Miles
4
Data Sources:Winnetka Public Schools, ESRICartographer: ADD, July 2016.
Winnetka Public Schools District 36, ILGreeley ES 2015-16 Students
Live Attend Analysis
Total Enrollment 237Out of District 3Unmatched 0Total Live-In (K-4th) 236Live and Attend In 233Live Out, Attend In 4Live In, Attend Out 3
Greeley School
28
#*_̂
")
")
")
The Skokie SchoolCarleton Washburne School
Crow Island Elementary School
Hubbard Woods Elementary School
Samuel Greeley Elementary School
94
Sheridan
Elm
Tower
Hill
Willow
Oak
Ash
Cherry
Hibb
ard
Birch
ScottGr
ove
Fores
tway
Happ
Verno
n
Spruce
Winnetka
Asbury
Green BayWilson
Ridge
Maple
Fores
t
Popla
r
Jackson
Chest
nut Ce
dar
Westmoor
Green
wood
Essex
Walnu
t
Drexel
Old Green Bay
Linden
Burr
Frontage
Ivy
Church
Harbor
Rand
olph
Lago
on
Mary
Eucli
d
Foxdale
Adams
Jefferson
Madison
Myrtl
e
Walden
Vine
Provident
Boal
Northfield
Mount Pleasant
Wood
land
Park
Hawthorn
OakdaleLa
trobe
Chatfield
Sunset
Fox
Gordo
n
Bluff
Bryan
t
Private
Fuller
Centr
al
Rosew
ood
Palos
Lincol
n
Trapp
Riverside
Pine
Gage
Golf
Wentworth
Locu
st
Alles
Edgewood
Fairv
iew
Arbo
rMonroe
Ardsley
De W
indt
Laurel
Fisher
Ramp
Brier
Lapier
Elder
Lockw
oodOrchard
Aubu
rn
Harding
Country
Prospect
Merril
Woodley
Bell
Sunview Starr
White
Oak
Hoyt
Warwick
Kent
Eldorado
Melrose
Holly
Garland
Crescent
Woodlawn
Hackberry
Holder
Thorn
tree
Glenwood
Linde
r
Suma
c
Smith
Roslyn
Apple
Tree
Lake
Summit
Parking Lot
OakleyPine T
ree
Briar
High
Prairie
Indian Hill
Exit 33B
Heath
er
Glendale
Bertl
ing
Lindenwood
Westv
iew
Kenilworth
Blackt
horn
Old Willow
Ravine
Higginson
Lloyd
Hickory
Arbo
r Vita
e
Dwye
r
DinsmoreHumboldt
Stockton
Mich
igan
Alice
Sprin
g
Whitebridge Hill
LamsonForest Glen
Berke
ley
Hubbard
Everg
reen
Skok
ie
Exit 33A
Keystone
Devonshir
e
Crestwood
Lloyd
Frontage
Harding
Ash
Willow
Locu
st
Frontage
Monroe
Spruce
Fairvi
ew
Hill
Essex
Grove
Locu
st
Lago
on
Pine
Hill
Locust
WarwickArbor
LincolnGl
enda
le
Winnetka
Winnetka
Skokie
Ramp
Heath
er
Oak
Orchard
Woodlawn
Green Bay
Glendale
Frontage
94
Oak
Elm
Oak
Walnu
t
Sunset
Ash
Sunset
Green Bay
Green Bay
Drexe
l
Eucli
d
Rosew
ood
Sunset ElderFo
rest
Lincoln
Linde
nRamp
Lake
§̈¦94
Lake Michigan
Sheridan
Tower
Hill
Willow
Pine
Hibb
ard
Winnetka
Green Bay
Church
Linden
P ine
Green Bay
Sko ki e C r eek
SkokieRiver
Skokie
Ditch
Skok ie Creek
LegendHubbard Woods ES Students 2015-16
School Type") K-4#* 5-6_̂ 7-8
ES ZoneCrow IslandGreeleyHubbard Woods
0 0.25 0.50.125Miles
4Winnetka Public Schools District 36, ILHubbard Woods ES 2015-16 Students
Live Attend Analysis
Data Sources:Winnetka Public Schools, ESRICartographer: ADD, July 2016.
Total Enrollment 246Out of District 0Unmatched 0Total Live-In (K-4th) 246Live and Attend In 243Live Out, Attend In 3Live In, Attend Out 3
Hubbard Woods
29
#*_̂
")
")
")
The Skokie SchoolCarleton Washburne School
Crow Island Elementary School
Hubbard Woods Elementary School
Samuel Greeley Elementary School
94
Sheridan
Elm
Tower
Hill
Willow
Oak
Ash
Cherry
Hibb
ard
Birch
ScottGr
ove
Fores
tway
Happ
Verno
n
Spruce
Winnetka
Asbury
Green BayWilson
Ridge
Maple
Fores
t
Popla
r
Jackson
Chest
nut Ce
dar
Westmoor
Green
wood
Essex
Walnu
t
Drexel
Old Green Bay
Linden
Burr
Frontage
Ivy
Church
Harbor
Rand
olph
Lago
on
Mary
Eucli
d
Foxdale
Adams
Jefferson
Madison
Myrtl
e
Walden
Vine
Provident
Boal
Northfield
Mount Pleasant
Wood
land
Park
Hawthorn
OakdaleLa
trobe
Chatfield
Sunset
Fox
Gordo
n
Bluff
Bryan
t
Private
Fuller
Centr
al
Rosew
ood
Palos
Lincol
n
Trapp
Riverside
Pine
Gage
Golf
Wentworth
Locu
st
Alles
Edgewood
Fairv
iew
Arbo
rMonroe
Ardsley
De W
indt
Laurel
Fisher
Ramp
Brier
Lapier
Elder
Lockw
oodOrchard
Aubu
rn
Harding
Country
Prospect
Merril
Woodley
Bell
Sunview Starr
White
Oak
Hoyt
Warwick
Kent
Eldorado
Melrose
Holly
Garland
Crescent
Woodlawn
Hackberry
Holder
Thorn
tree
Glenwood
Linde
r
Suma
c
Smith
Roslyn
Apple
Tree
Lake
Summit
Parking Lot
OakleyPine T
ree
Briar
High
Prairie
Indian Hill
Exit 33B
Heath
er
Glendale
Bertl
ing
Lindenwood
Westv
iew
Kenilworth
Blackt
horn
Old Willow
Ravine
Higginson
Lloyd
Hickory
Arbo
r Vita
e
Dwye
r
DinsmoreHumboldt
Stockton
Mich
igan
Alice
Sprin
g
Whitebridge Hill
LamsonForest Glen
Berke
ley
Hubbard
Everg
reen
Skok
ie
Exit 33A
Keystone
Devonshir
e
Crestwood
Lloyd
Frontage
Harding
Ash
Willow
Locu
st
Frontage
Monroe
Spruce
Fairvi
ew
Hill
Essex
Grove
Locu
st
Lago
on
Pine
Hill
Locust
WarwickArbor
LincolnGl
enda
le
Winnetka
Winnetka
Skokie
Ramp
Heath
er
Oak
Orchard
Woodlawn
Green Bay
Glendale
Frontage
94
Oak
Elm
Oak
Walnu
t
Sunset
Ash
Sunset
Green Bay
Green Bay
Drexe
l
Eucli
d
Rosew
ood
Sunset ElderFo
rest
Lincoln
Linde
nRamp
Lake
§̈¦94
Lake Michigan
Sheridan
Tower
Hill
Willow
Pine
Hibb
ard
Winnetka
Green Bay
Church
Linden
P ine
Green Bay
Sko ki e C r eek
SkokieRiver
Skokie
Ditch
Skok ie Creek
LegendThe Skokie School Students 2015-16
School Type") K-4#* 5-6_̂ 7-8
IS ZoneThe Skokie School
0 0.25 0.50.125Miles
4
Data Sources:Winnetka Public Schools, ESRICartographer: ADD, July 2016.
Winnetka Public Schools District 36, ILThe Skokie School 2015-16 Students
Live Attend Analysis
Total Enrollment 418Out of District 8Unmatched 0Total Live-In (5-6th) 410Live and Attend In 410Live Out, Attend In 8Live In, Attend Out 0
The Skokie School
30

#*_̂
")
")
")
The Skokie SchoolCarleton Washburne School
Crow Island Elementary School
Hubbard Woods Elementary School
Samuel Greeley Elementary School
94
Sheridan
Elm
Tower
Hill
Willow
Oak
Ash
Cherry
Hibb
ard
Birch
ScottGr
ove
Fores
tway
Happ
Verno
n
Spruce
Winnetka
Asbury
Green BayWilson
Ridge
Maple
Fores
t
Popla
r
Jackson
Chest
nut Ce
dar
Westmoor
Green
wood
Essex
Walnu
t
Drexel
Old Green Bay
Linden
Burr
Frontage
Ivy
Church
Harbor
Rand
olph
Lago
on
Mary
Eucli
d
Foxdale
Adams
Jefferson
Madison
Myrtl
e
Walden
Vine
Provident
Boal
Northfield
Mount Pleasant
Wood
land
Park
Hawthorn
OakdaleLa
trobe
Chatfield
Sunset
Fox
Gordo
n
Bluff
Bryan
t
Private
Fuller
Centr
al
Rosew
ood
Palos
Lincol
n
Trapp
Riverside
Pine
Gage
Golf
Wentworth
Locu
st
Alles
Edgewood
Fairv
iew
Arbo
rMonroe
Ardsley
De W
indt
Laurel
Fisher
Ramp
Brier
Lapier
Elder
Lockw
oodOrchard
Aubu
rn
Harding
Country
Prospect
Merril
Woodley
Bell
Sunview Starr
White
Oak
Hoyt
Warwick
Kent
Eldorado
Melrose
Holly
Garland
Crescent
Woodlawn
Hackberry
Holder
Thorn
tree
Glenwood
Linde
r
Suma
c
Smith
Roslyn
Apple
Tree
Lake
Summit
Parking Lot
OakleyPine T
ree
Briar
High
Prairie
Indian Hill
Exit 33B
Heath
er
Glendale
Bertl
ing
Lindenwood
Westv
iew
Kenilworth
Blackt
horn
Old Willow
Ravine
Higginson
Lloyd
Hickory
Arbo
r Vita
e
Dwye
r
DinsmoreHumboldt
Stockton
Mich
igan
Alice
Sprin
g
Whitebridge Hill
LamsonForest Glen
Berke
ley
Hubbard
Everg
reen
Skok
ie
Exit 33A
Keystone
Devonshir
e
Crestwood
Lloyd
Frontage
Harding
Ash
Willow
Locu
st
Frontage
Monroe
Spruce
Fairvi
ew
Hill
Essex
Grove
Locu
st
Lago
on
Pine
Hill
Locust
WarwickArbor
LincolnGl
enda
le
Winnetka
Winnetka
Skokie
Ramp
Heath
er
Oak
Orchard
Woodlawn
Green Bay
Glendale
Frontage
94
Oak
Elm
Oak
Walnu
t
Sunset
Ash
Sunset
Green Bay
Green Bay
Drexe
l
Eucli
d
Rosew
ood
Sunset ElderFo
rest
Lincoln
Linde
nRamp
Lake
§̈¦94
Lake Michigan
Sheridan
Tower
Hill
Willow
Pine
Hibb
ard
Winnetka
Green Bay
Church
Linden
P ine
Green Bay
Sko ki e C r eek
SkokieRiver
Skokie
Ditch
Skok ie Creek
LegendCarleton Washburne Students 2015-16
School Type") K-4#* 5-6_̂ 7-8
MS ZoneCarleton Washburne School
0 0.25 0.50.125Miles
4
Data Sources:Winnetka Public Schools, ESRICartographer: ADD, July 2016.
Winnetka Public Schools District 36, ILWashburne MS 2015-16 Students
Live Attend Analysis
Total Enrollment 437Out of District 7Unmatched 0Total Live-In (7-8th) 430Live and Attend In 430Live Out, Attend In 7Live In, Attend Out 0
Washburne School
31

#*_̂
")
")
")
-5-5%
6228%
43%
-10-27%
-10-9%
-9-26%
-38-38%
710%
-28-31%
The Skokie School
Carleton Washburne School
Crow Island Elementary School
Hubbard Woods Elementary School
Samuel Greeley Elementary School
94
Sheridan
Elm
Tower
Hill
Willow
Oak
Ash
Cherry
Hibb
ard
Birch
ScottGr
ove
Fores
tway
Happ
Verno
n
Spruce
Winnetka
Asbury
Green BayWilson
Ridge
Maple
Fores
t
Popla
r
Jackson
Chest
nut
Ceda
r
Westmoor
Green
wood
Essex
Walnu
t
Drexel
Old Green Bay
Linden
Burr
Frontage
Ivy
Church
Harbor
Rand
olph
Lago
on
Mary
Eucli
d
Foxdale
Adams
Jefferson
Madison
Myrtl
e
Walden
Vine
Provid
ent
Boal
Northfield
Mount Pleasant
Wood
land
Park
Hawthorn
OakdaleLa
trobe
Chatfield
Sunset
Fox
Gordo
n
Bluff
Private
Fuller
Centr
al
Rosew
ood
Palos
Lincol
n
Trapp
Riverside
Pine
Gage
Golf
Wentworth
Locu
st
Alles
Fairv
iew
Arbo
rMonroe
Ardsley
De W
indt
Laurel
Brier
Ramp
Lapier
Elder
Lockw
oodOrchard
Aubu
rn
Harding
Country
Prospe
ct
Merril
Woodley
Bell
Sunview Starr
Hoyt
Warwick
Kent
Eldorado
Melrose
Holly
Garland
Crescent
Woodlawn
Hackberry
Holder
Thorn
tree
Glenwood
Linde
r
Smith
Roslyn
Apple
Tree
Lake
Summit
Parking Lot
OakleyPine T
ree
Briar
High
Prairie
Indian Hill
Exit 33B
Heath
er
Glendale
Bertl
ing
Lindenwood
Kenilworth
Westv
iew
Blackt
horn
Old Willow
Ravine
Lloyd
Hickory
Arbo
r Vita
e
Dwye
r
Dinsmore
Stockton
Mich
igan
Alice
Sprin
g
Whitebridge Hill
LamsonForest Glen
Berke
ley
Everg
reen
Skok
ie
Exit 33A
Keystone
Devonshir
e
Crestwood
Lloyd
Frontage
Harding
Ash
Willow
Locu
st
Frontage
Monroe
Spruce
Fairvi
ew
Hill
Essex
Grove
Locu
st
Lago
on
Pine
Hill
Locust
WarwickArbor
LincolnGl
enda
le
Winnetka
Winnetka
Skokie
Ramp
Heath
er
Oak
Orchard
Woodlawn
Green Bay
Glendale
Frontage
94
Oak
Elm
Oak
Walnu
t
Sunset
Ash
Sunset
Green Bay
Green Bay
Drexe
l
Eucli
d
Rosew
ood
Sunset ElderFo
rest
Lincoln
Linde
nRamp
Lake
§̈¦94
Lake Michigan
Sheridan
Tower
Hill
Willow
Pine
Hibb
ard
Winnetka
Green Bay
Church
Linden
P ine
Winnetka
Green Bay
Sko ki e C r eek
SkokieRiver
SkokieDitch
Skok ie Creek
Data Sources: Winnetka Public Schools, ESRICartographer: ADD, July 2016.
Winnetka Public School District 36, ILPercent K-4th Student Change
2012-13 to 2015-16
LegendES Zone 2015-16
School Type#* 5-6_̂ 7-8") K-4
K-4th Percent Change 12-13 to 15-16-38%-37% - -31%-30% - -26%-25% - -5%-4% - 10%11% - 28%
0 0.25 0.50.125Miles
4
Map Note: The top pink labels show thetotal K-4 change between 2012-13 and 2015-16.The bottom labels show the percent change.
32
Recommended