Texas Asphalt Pavement Association (TxAPA) 2016 Annual
Meeting
September 2016
Why specify Surface Aggregate Classification ‘A’ (SAC-A) ?
• Reduce wet surface crashes & fatalities
• FHWA mandate issued June 27, 1967
Highway Safety Program Standard 12
• Three components of the program
1. Wet surface crash data analysis – Traffic Operations
Division
2. Aggregate selection guidelines – Construction Division
3. Network level skid testing – Maintenance Division
TxDOT’s Wet Surface Crash Reduction Program (WSCRP)

Texas Asphalt Pavement Association (TxAPA) 2016 Annual
Meeting
September 2016
TxDOT/WSCRP - Aggregate Selection Guidelines (CST/M&P)
Frictional Demand of Roadway Surface Surface Aggregate Classification (SAC)

Texas Asphalt Pavement Association (TxAPA) 2016 Annual
Meeting
September 2016
Where are SAC-A sources available in Texas?
- SAC A
- SAC B
(5)
(11)
(4)
New Mexico
Oklahoma
Arkansas
Amarillo
Corpus
Christi
Austin
San Antonio
Fort WorthDallas
Waco
Yoakum
Bryan
Lubbock
Childress
Abilene
Brownwood
San Angelo
Odessa
El Paso
Laredo
Pharr
Wichita Falls
Paris
Atlanta
Tyler
Houston
Lufkin
Beaumont
Mexico
(2)
(2)
SAC A 42 Sources (45%)
SAC B 52 Sources (55%)

Texas Asphalt Pavement Association (TxAPA) 2016 Annual
Meeting
September 2016
When will TxDOT Implement a SAC ‘B+’ Rating Classification?
- SAC A
- SAC B
- Dolomite
(5)
(11)
(4)
New Mexico
Oklahoma
Arkansas
Amarillo
Corpus
Christi
Austin
San Antonio
Fort WorthDallas
Waco
Yoakum
Bryan
Lubbock
Childress
Abilene
Brownwood
San Angelo
OdessaEl Paso
Laredo
Pharr
Wichita Falls
Paris
Atlanta
Tyler
Houston
Lufkin
Beaumont
Mexico
(2)
(2)
SAC A 41 Sources (45%)
SAC B 43 Sources (45%)
Dolomite 10 Sources* (10%)
* 1 SAC A and 9 SAC B
Texas Asphalt Pavement Association (TxAPA) 2016 Annual
Meeting
September 2016
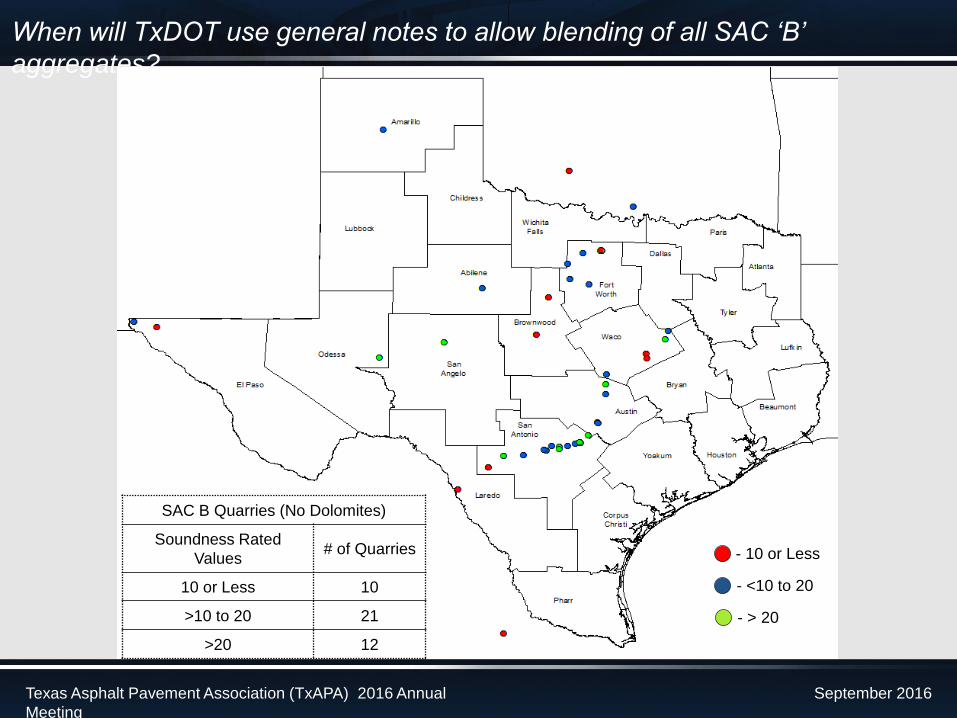
When will TxDOT use general notes to allow blending of all SAC ‘B’
aggregates?
SAC B Quarries (No Dolomites)
Soundness Rated
Values# of Quarries
10 or Less 10
>10 to 20 21
>20 12
- 10 or Less
- <10 to 20
- > 20

Texas Asphalt Pavement Association (TxAPA) 2016 Annual
Meeting
September 2016
TxDOT SAC ‘A’ Estimated Letting Quantities
Year Total Seal Coat* HMA**
2013 417,987 58,915 359,072
2014 954,903 159,392 795,511
2015 1,579,229 318,278 1,260,952
2016(Jan – Sept)
1,095,553 96,647 998,906
* - Seal coat aggregate conversion factor of 1.20 Tons per CY. No quantities included from item description
codes for Tiers I, II, or III aggregate from seal coat material selection table; SAC not specified.
** - Includes assumptions for percentage of mix and bin percentages for each mix type.

Texas Asphalt Pavement Association (TxAPA) 2016 Annual
Meeting
September 2016
TxDOT Aggregate Research and Testing
DFT
• Dynamic Friction Tester (DFT)
• Measures Coefficient of Friction on wet surface
• Platform speed starts at 50 mph (80 km/h) and
measures friction continuously to 6 mph (10 km/h)
• Maryland DOT has specifications for aggregate
blending
AIMS
• Aggregate Image Measurement System (AIMS)
• Measures aggregate characteristics for texture,
angularity, and shape (round or flat)
• Image based analysis, investigating use of optical
sensors for a laser based system for texture only
Long term (3-5 years) research efforts to quantify microtexture and to predict friction

Texas Asphalt Pavement Association (TxAPA) 2016 Annual
Meeting
September 2016
0
200
400
600
800
1000
0 10 20 30 40
Maxim
um
Load
, lb
s
Number of Cycles
First Crack
Retardation Rate
Power equation
representing load
reduction curve
y = axb , a=1
The fracture energy and crack retardation rate are plotted together
on a design interaction plot
-800
-400
0
400
800
1200
0.00 0.01 0.02 0.03
Lo
ad
, lb
s
Displacement, in.
Maximum LoadArea used for
Fracture Energy
𝑮𝒇 =𝑾
𝑨
OT Data Analysis

Texas Asphalt Pavement Association (TxAPA) 2016 Annual
Meeting
September 2016
Overall View of All Mixtures
9
0.0
0.5
1.0
1.5
2.0
2.5
3.0
3.5
4.0
0.00 0.25 0.50 0.75 1.00 1.25
Cri
tica
l F
ract
ure
En
ergy, lb
s-in
./in
.2
Crack Progression Rate
CAM
TOM-F
TOM-C
SMA-C
SMA-D
SMA-F
SMAR-C
SMAR-F
SP-C
SP-D
SP-B
Type D
Type C
Type B
TO
UG
HN
ES
S
FLEXIBILITY
Texas Asphalt Pavement Association (TxAPA) 2016 Annual
Meeting
September 2016
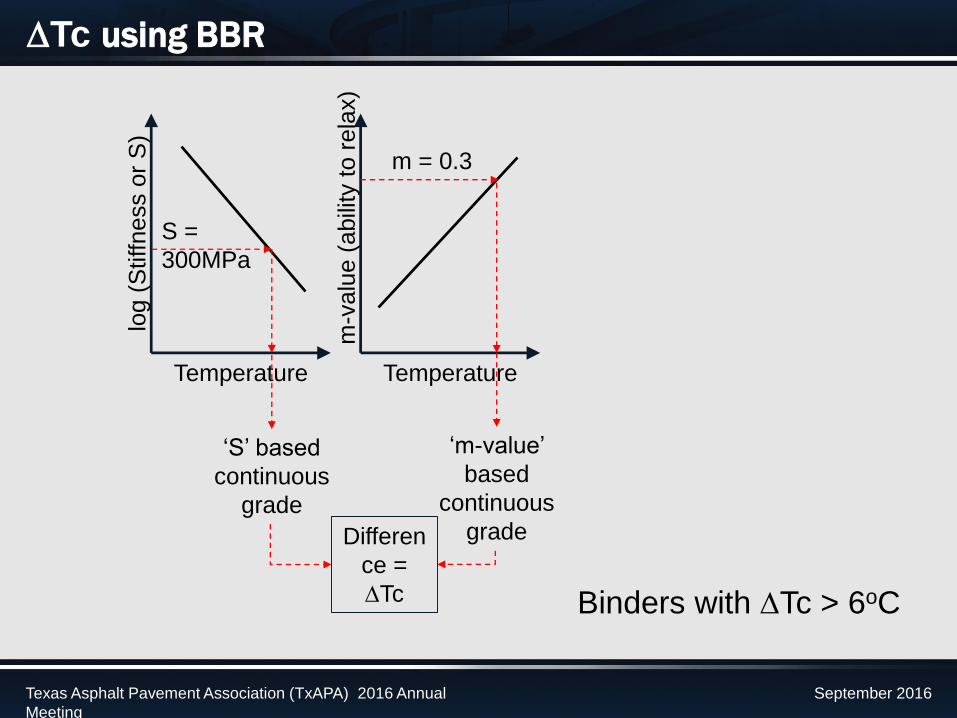
Binders with DTc > 6oC
Temperature
log (
Stiffness o
r S
)
Temperaturem
-valu
e (
abili
ty t
o r
ela
x)
S =
300MPa
‘S’ based
continuous
grade
m = 0.3
‘m-value’
based
continuous
gradeDifferen
ce =
DTc
DTc using BBR
Recommended