Excellent healthcare – locally delivered
WHO guidelines on the use of CD4, Viral Load and EID
tests for initiation and monitoring of ART
Meg Doherty
Treatment and Care Unit
WHO, Geneva

Clinically relevant
• Earlier initiation of ART (CD4 count ≤ 500 cells/mm3) for adult s & adolescents
• Immediate ART for children below 5 years
• More potent regimens for children < 3 years (LPV/r)
• Immediate & lifelong ART for all pregnant and breastfeeding women (Option B/B+)
• Simplified, less toxic 1st-line
regimens (TDF/XTC/EFV)
Operationally relevant
• Use of Fixed Dose Combinations (FDCs)
• Improved patient monitoring with increased use of viral load
• Recommend task shifting, decentralization, and integration
• Community based testing and ARV delivery
The 2013 Consolidated ARV Guidelines: Key recommendations

0
10
20
30
40
50
60
70
80
90
100
% CD4 500yes
% < 5 yrs yes % OptionB/B+
%TDF/XTC/EVF
yes
% Routine VLYes
% SDC yes
AFRO
AMRO
EMRO
EURO
SEARO
WPRO
Making Impact in Countries – 2013-14 ARV Policies (% responding yes, by region)
Uptake of 2013 recommendations as of Oct 2014
Policy uptake in 58 WHO focus countries end 2014, by region

Access to ART worldwide has significantly increased but coverage still very
heterogeneous…
Hill et al. CROI 2015 [abstr 1118]
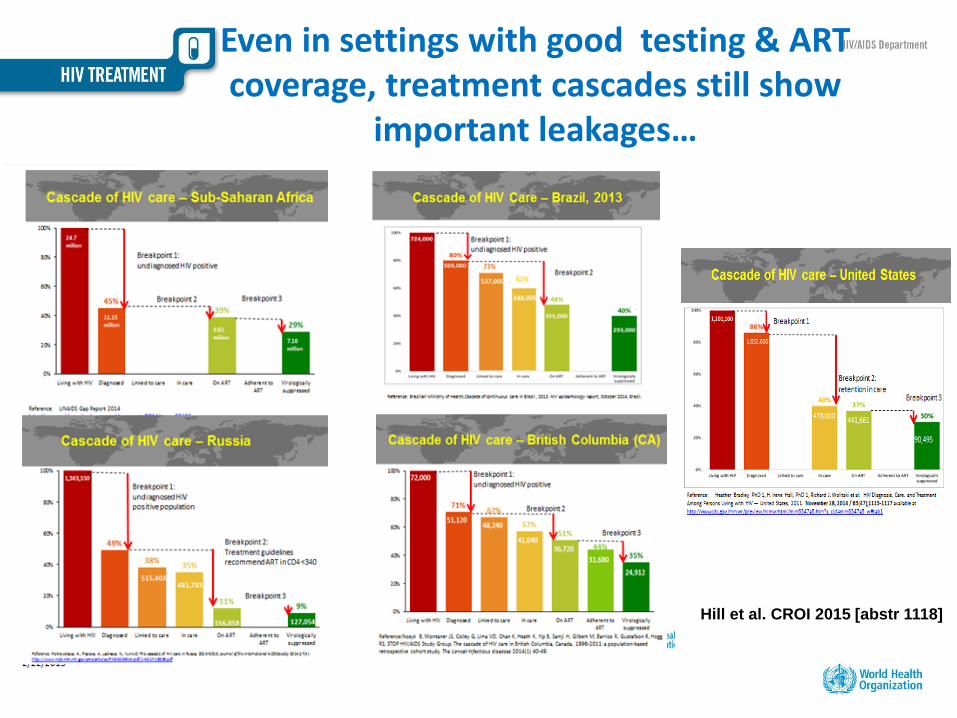
Even in settings with good testing & ART coverage, treatment cascades still show
important leakages…
Hill et al. CROI 2015 [abstr 1118]
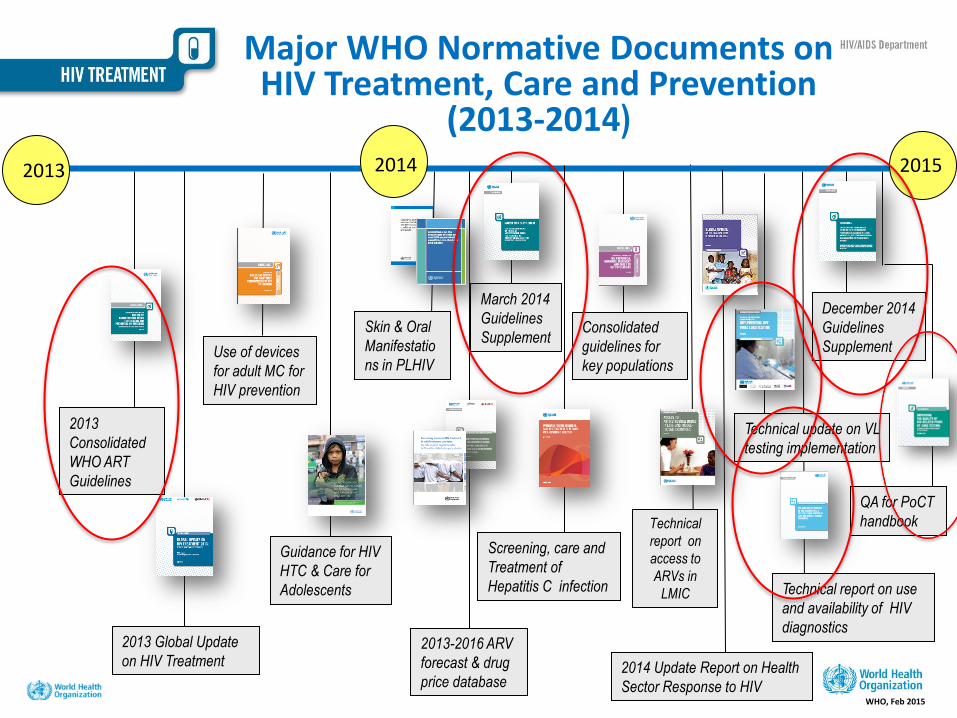
Major WHO Normative Documents on HIV Treatment, Care and Prevention
(2013-2014)
2013
2013
Consolidated
WHO ART
Guidelines
Screening, care and
Treatment of
Hepatitis C infection
Guidance for HIV
HTC & Care for
Adolescents
Use of devices
for adult MC for
HIV prevention
2014 Update Report on Health
Sector Response to HIV
December 2014
Guidelines
Supplement
Technical update on VL
testing implementation
Consolidated
guidelines for
key populations
2014 2015
March 2014
Guidelines
Supplement
WHO, Feb 2015
Technical
report on
access to
ARVs in
LMIC
2013 Global Update
on HIV Treatment
Technical report on use
and availability of HIV
diagnostics 2013-2016 ARV
forecast & drug
price database
Skin & Oral
Manifestatio
ns in PLHIV
QA for PoCT
handbook

Innovations in Diagnostics • CD4 • VL • EID

Treatment initiation still late in the large majority of countries
Courtesy: D Cooper, IAC 2014

POC CD4 implementation across sub-Saharan Africa
Ethiopia: 104 sites
Kenya: 77 sites
Uganda: 303 sites
Tanzania: 445 sites
Zambia: 68 sites
Malawi: 126 sites
Mozambique: 132 sites
Zimbabwe: 276 sites
Swaziland: 77 sites
Lesotho: 42 sites 9

Weinberg et al, JIAS 2013
Impact of Point of care CD4 on linkage/retention in HIV care
• Odds of linking to care increased • Time to testing reduced by 9 days • Time from testing to receiving the
result was reduced by 17 days
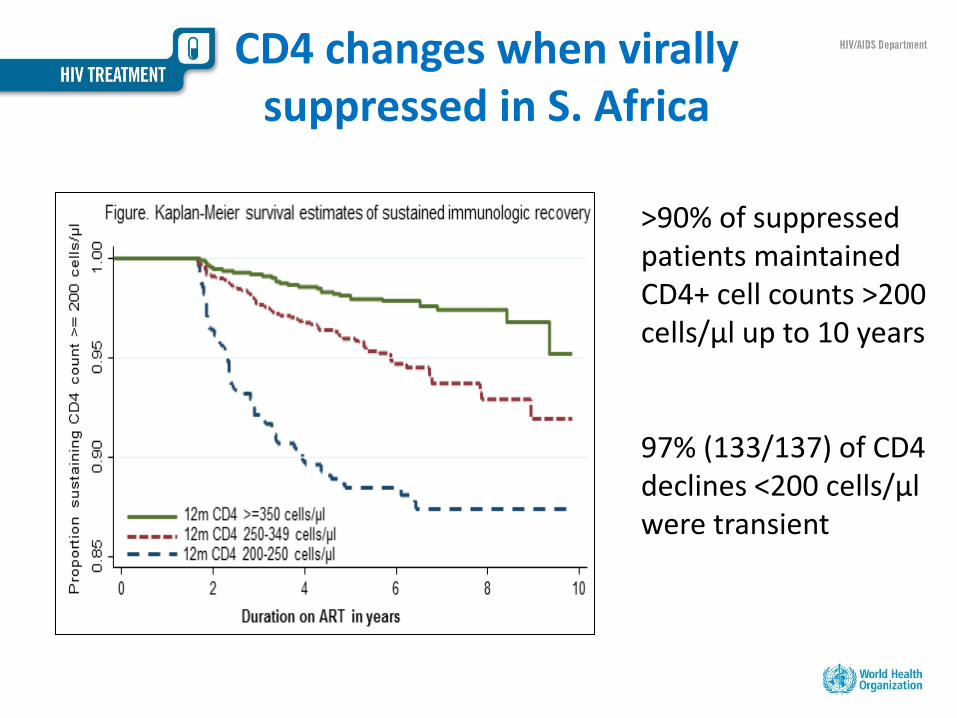
CD4 changes when virally suppressed in S. Africa
>90% of suppressed patients maintained CD4+ cell counts >200 cells/µl up to 10 years 97% (133/137) of CD4 declines <200 cells/µl were transient
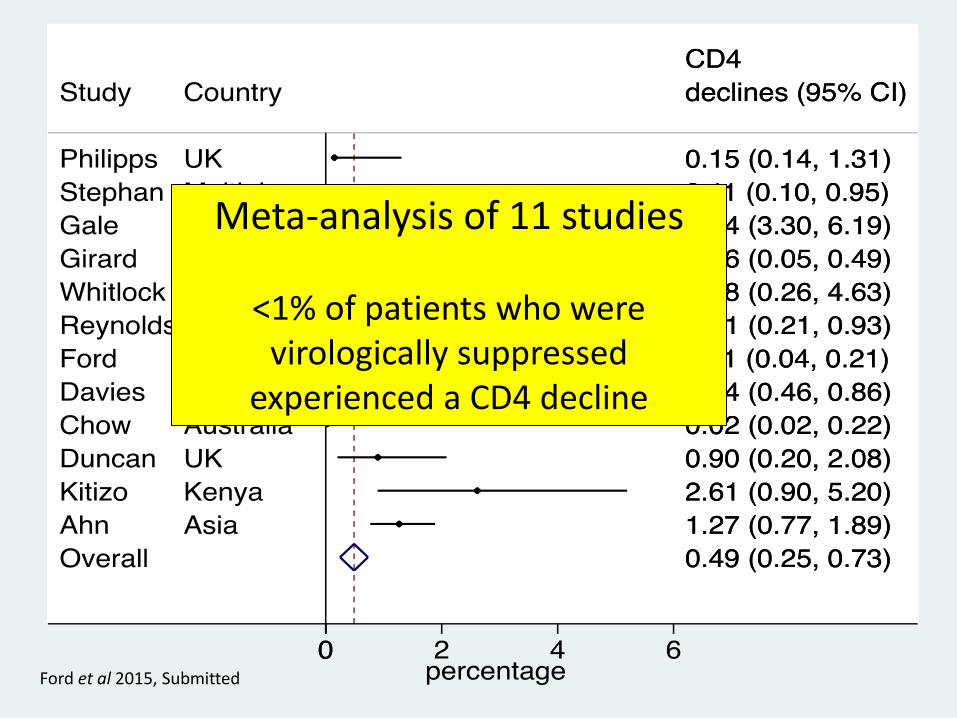
Ford et al 2015, Submitted
Meta-analysis of 11 studies
<1% of patients who were virologically suppressed
experienced a CD4 decline
Safe to scale down CD4 for monitoring when VL
• These data are consistent with findings from trial and observational studies in Western settings that CD4 measures rarely change in virologically suppressed patients
• CD4 remains a critical diagnostic tool for risk stratification and ART and prophylaxis decisions
• In settings where both CD4 and viral load are available, countries could consider reducing or eliminating CD4 for monitoring

When should CD4 be used for initiation & monitoring?
• CD4 for initiation: Point of care CD4: – Increased access to testing in rural and remote areas – Reduced turn around time for results – Potential decrease in LTFU
• 2013 ARV Guidelines:
– CD4 monitoring every 6 months on ART
• 2014 Supplement: Changing role of CD4
– “ HIV viral load when available is a more reliable tool for monitoring adherence…than CD4..”
– CD4 for screening for opportunistic infections

2015 - CD4 guidelines new questions
• 1.1 Does point of care CD4 count improve linkage to HIV care and timeliness of ART initiation?
• 1.2 In individuals with HIV who have achieved viral suppression on ART is CD4 count and VL annually more effective than VL annually?

RECOMMENDATION STRENGTH
Viral load is recommended as the preferred monitoring approach to diagnose and confirm ARV treatment failure
Strong recommendation, low-quality evidence
If viral load is not routinely available, CD4 count and clinical monitoring should be used to diagnose treatment failure
Strong recommendation, moderate-quality evidence
WHO 2013 Recommendations: Monitoring for ART Response
Plasma DBS
1000 cpm
1000 cpm
Threshold for defining virological failure:
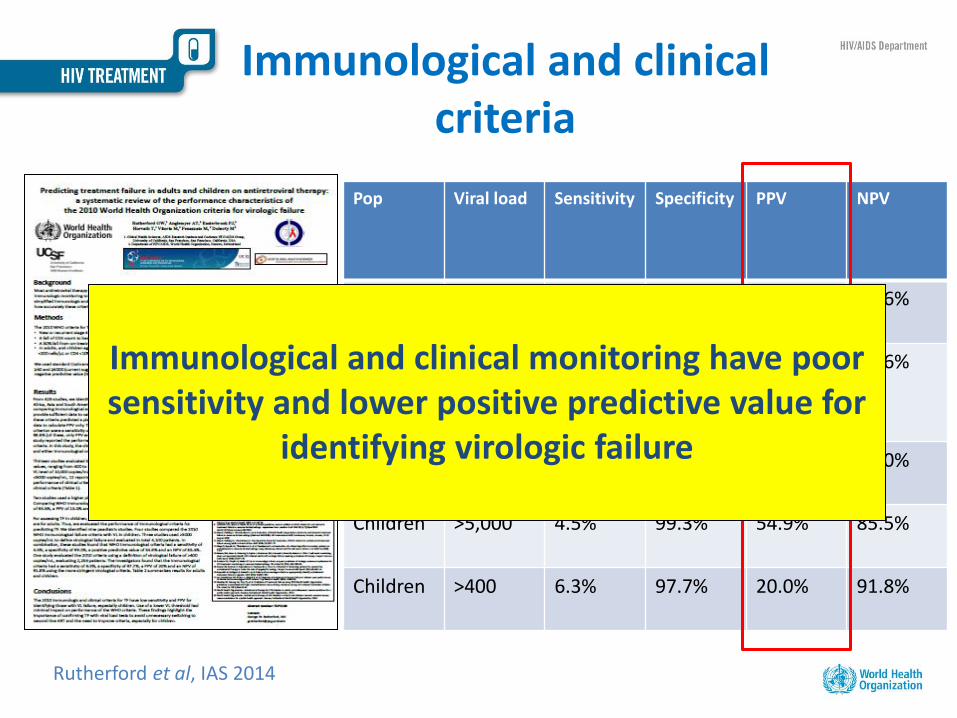
Pop Viral load Sensitivity Specificity PPV NPV
Adults >5000 68.9% 92.1% 27.0% 98.6%
Adults 50-4,999 55.6% 74.5% 29.8% 89.6%
Adults >10,000 16.8% 95.5% 15.0% 96.0%
Children >5,000 4.5% 99.3% 54.9% 85.5%
Children >400 6.3% 97.7% 20.0% 91.8%
Immunological and clinical criteria
Rutherford et al, IAS 2014
Immunological and clinical monitoring have poor sensitivity and lower positive predictive value for
identifying virologic failure

Targeted viral load monitoring (suspected clinical or
immunological failure)
Routine viral load monitoring (early detection of virological failure)
Switch to second-line therapy
Maintain first-line therapy
Viral load ≤1000 copies/ml
Viral load >1000 copies/ml
Repeat viral load testing after 3–6 months
Evaluate for adherence concerns
Viral load >1000 copies/ml
Test viral load
Rationale: Viral Load Monitoring
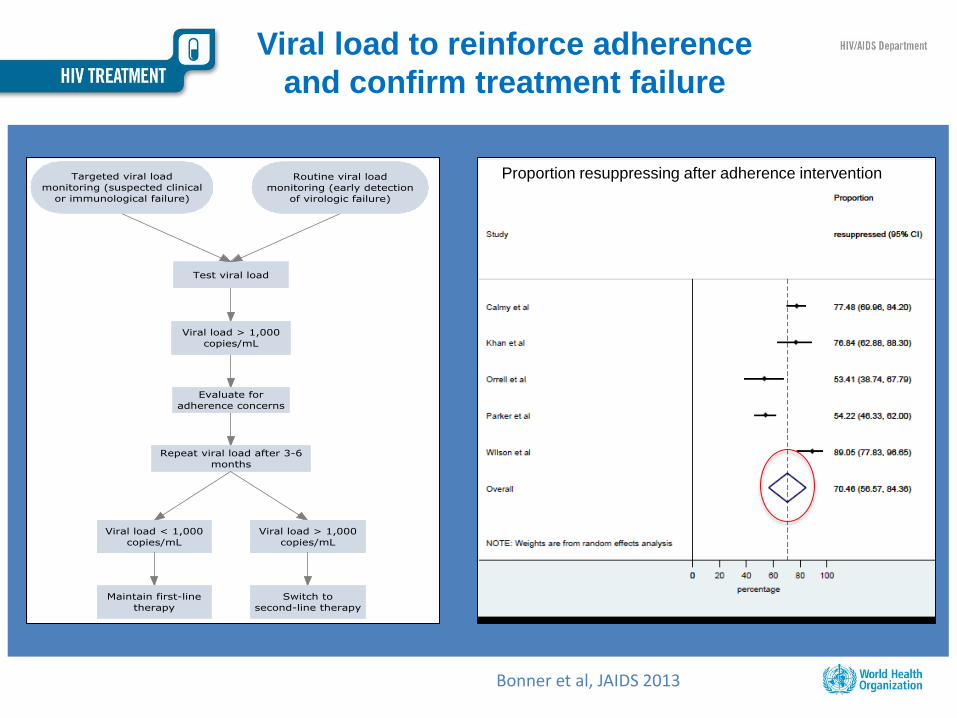
Viral load to reinforce adherence
and confirm treatment failure
Proportion resuppressing after adherence intervention
Bonner et al, JAIDS 2013
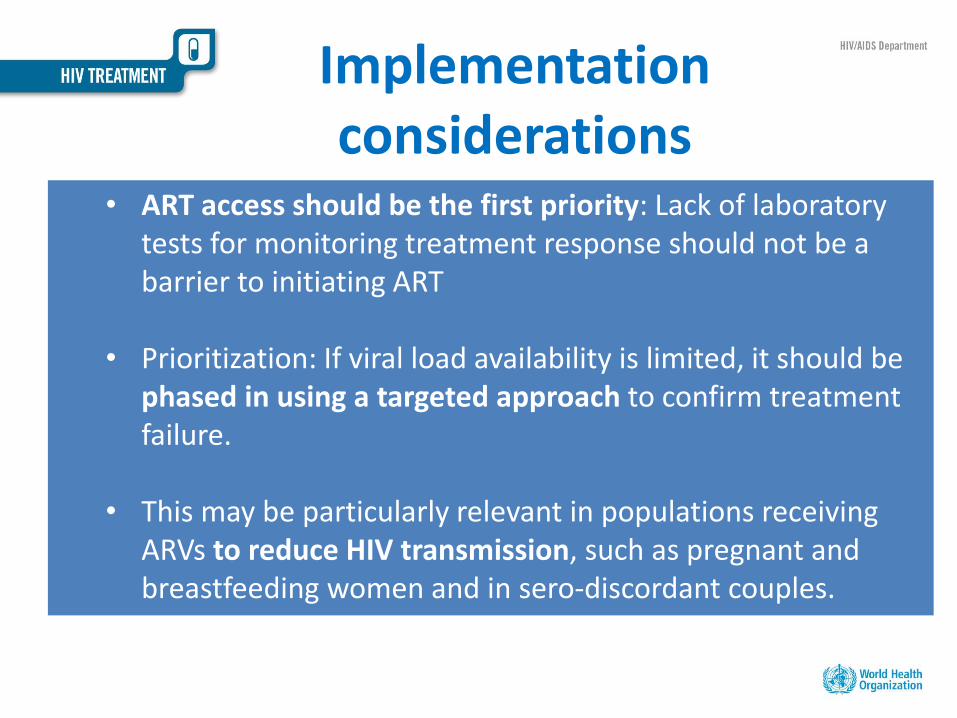
Implementation considerations
• ART access should be the first priority: Lack of laboratory tests for monitoring treatment response should not be a barrier to initiating ART
• Prioritization: If viral load availability is limited, it should be phased in using a targeted approach to confirm treatment failure.
• This may be particularly relevant in populations receiving ARVs to reduce HIV transmission, such as pregnant and breastfeeding women and in sero-discordant couples.
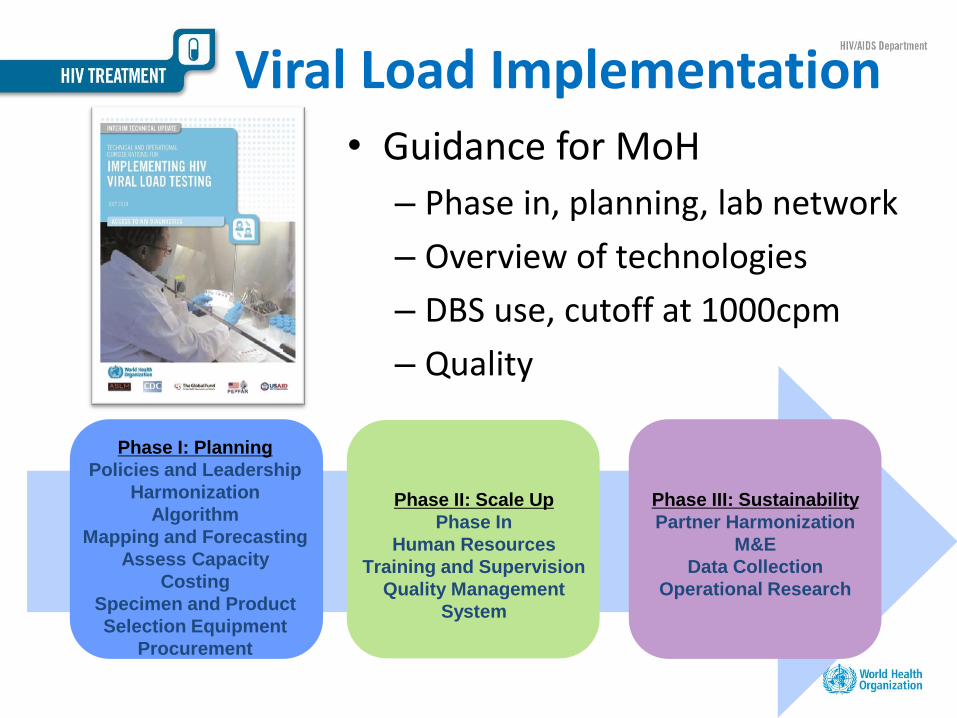
Viral Load Implementation • Guidance for MoH
– Phase in, planning, lab network
– Overview of technologies
– DBS use, cutoff at 1000cpm
– Quality
Phase I: Planning
Policies and Leadership
Harmonization
Algorithm
Mapping and Forecasting
Assess Capacity
Costing
Specimen and Product
Selection Equipment
Procurement
Phase II: Scale Up
Phase In
Human Resources
Training and Supervision
Quality Management
System
Phase III: Sustainability
Partner Harmonization
M&E
Data Collection
Operational Research
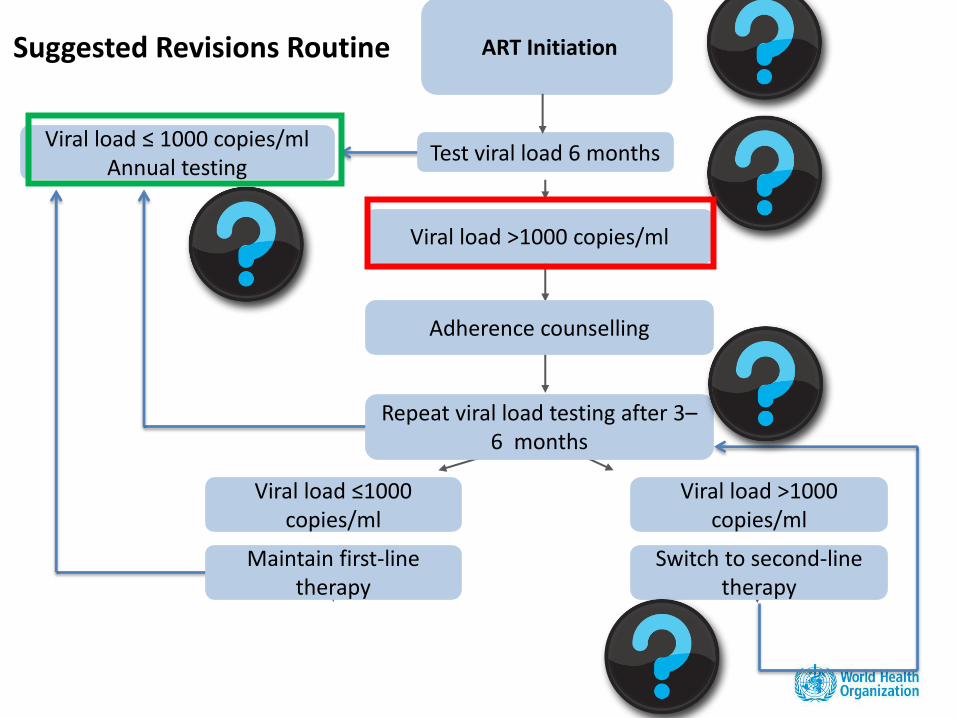
Viral load ≤ 1000 copies/ml Annual testing
ART Initiation
Switch to second-line therapy
Maintain first-line therapy
Viral load ≤1000 copies/ml
Viral load >1000 copies/ml
Repeat viral load testing after 3–6 months
Adherence counselling
Viral load >1000 copies/ml
Test viral load 6 months
Suggested Revisions Routine
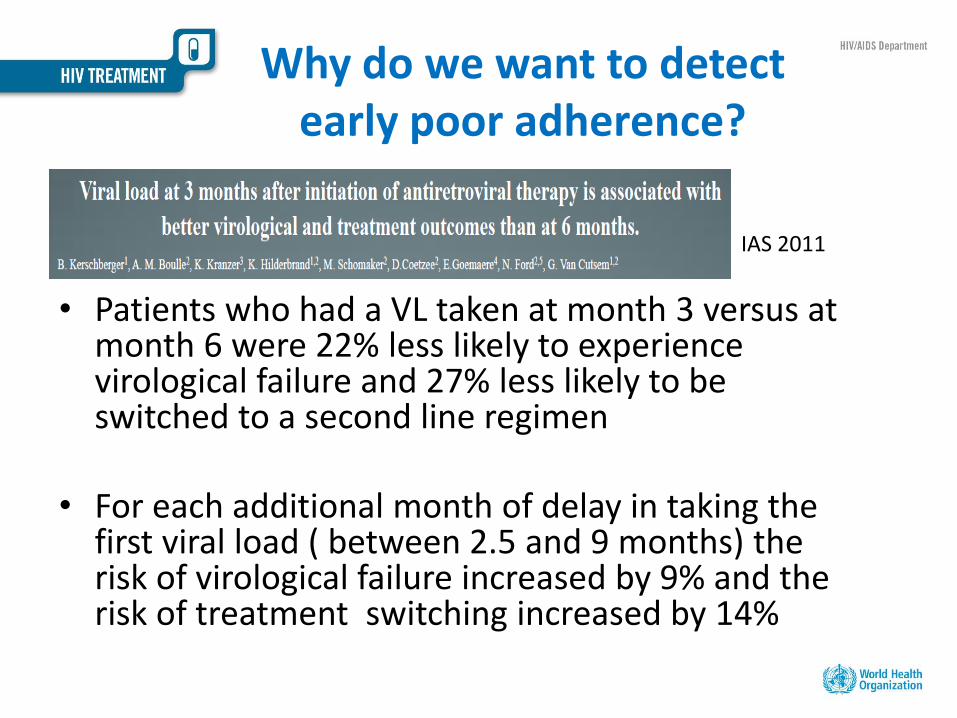
Why do we want to detect early poor adherence?
• Patients who had a VL taken at month 3 versus at month 6 were 22% less likely to experience virological failure and 27% less likely to be switched to a second line regimen
• For each additional month of delay in taking the first viral load ( between 2.5 and 9 months) the risk of virological failure increased by 9% and the risk of treatment switching increased by 14%
IAS 2011
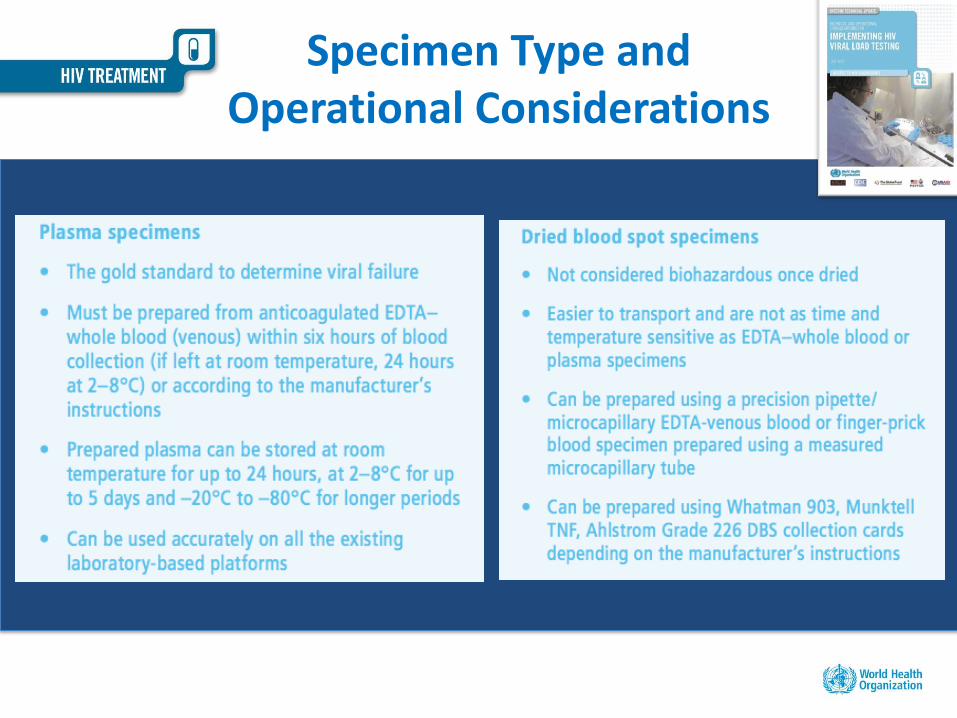
Specimen Type and Operational Considerations

WHO Technical Update 2014
Table 1. Provisional data on performance characteristics for commercially available molecular HIV viral load assays using dried blood spot specimens compared with plasma at 1,000 copies/ml cut-off

Guidance on use DBS for Viral Load
• The use of dried blood spots for viral load testing is recommended if logistical constraints challenge the use of plasma.
• Dried blood spots should be used with the same threshold of plasma for ART failure: 1,000 copies/ml.
• Not all technologies should be used for viral load testing with dried blood spot samples.
• While the performance of dried blood spot samples is currently acceptable for most technologies, the lower acceptable limits for sensitivity and specificity are unclear.

QA Cycle for Implementing POCT
Plan
Define
Implement
Monitor
Evaluate
Improve
27
PHASE III: Evaluate, Improve, and Sustain 1. Post market surveillance 2. Use monitoring data for
decision making 3. Advocacy and
communication of best practices
4. Encourage social entrepreneurship and public private partnerships
5. Increase country ownership 6. Operational research
Quality Assurance
Cycle Ensuring accurate
patient results
PHASE I: Planning Quality Improvement for HIV-related POCT 1. Engage Leadership 2. Establish the national QA/POCT coordination team 3. Define roles and responsibilities 4. Develop or review policies & incorporate QA into
national plan 5. Define standards for quality for POCT 6. Conduct situational analysis 7. Develop and implement plan 8. Plan financial and human resources 9. Selection and assessment of sites 10. Selection of product
PHASE II: Implementation of Quality Assurance for POCT 1. Improve training and ensure certification of all POC Testers 2. Site supervision and certification 3. Implement QA Process Control 4. Strengthen and innovate QA-related documentation 5. Strengthen supply chain for QA
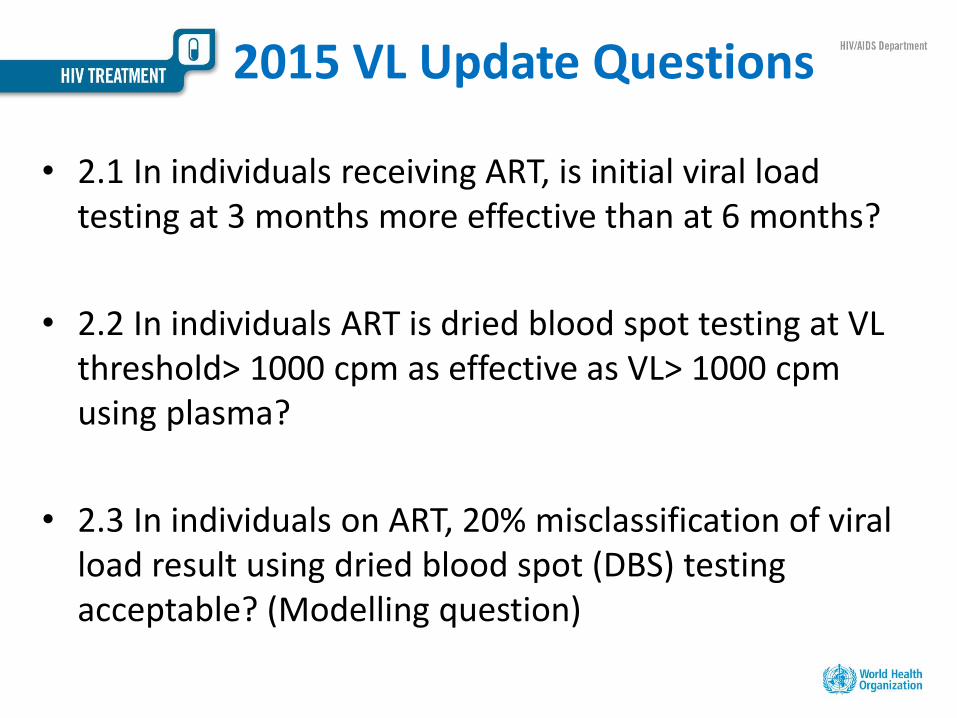
2015 VL Update Questions
• 2.1 In individuals receiving ART, is initial viral load testing at 3 months more effective than at 6 months?
• 2.2 In individuals ART is dried blood spot testing at VL threshold> 1000 cpm as effective as VL> 1000 cpm using plasma?
• 2.3 In individuals on ART, 20% misclassification of viral load result using dried blood spot (DBS) testing acceptable? (Modelling question)

29
Infant Testing Algorithm

4/10/2015 30
Better retention in the
cascade
Earlier ART initiation
Low sensitivity of
virological testing at birth
Increased cost
Birth
PCR
Testing at birth
4/10/2015 31
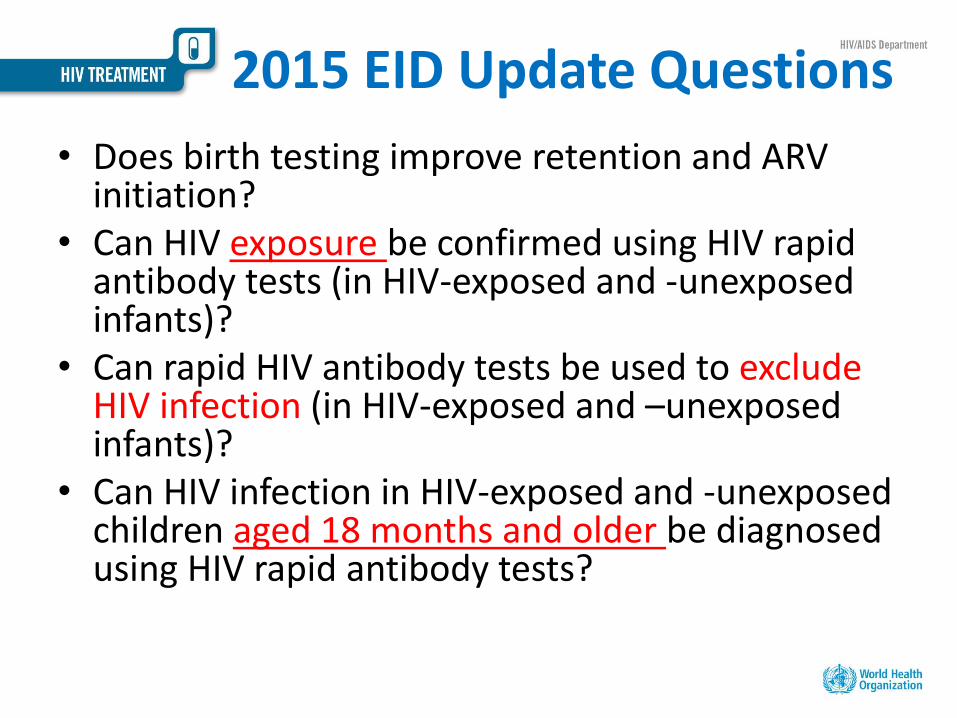
2015 EID Update Questions 1 • Does birth testing improve retention and ARV
initiation? • Can HIV exposure be confirmed using HIV rapid
antibody tests (in HIV-exposed and -unexposed infants)?
• Can rapid HIV antibody tests be used to exclude HIV infection (in HIV-exposed and –unexposed infants)?
• Can HIV infection in HIV-exposed and -unexposed children aged 18 months and older be diagnosed using HIV rapid antibody tests?

2015 ARV Guidelines Timeline
Sep
tem
ber
Oct
ob
er
No
vem
ber
Dec
emb
er
Jan
uar
y
Feb
ruar
y
Mar
ch
Ap
ril
May
Jun
e
July
Au
gust
Sep
tem
ber
Oct
ob
er
No
vem
ber
Dec
emb
er
Jan
uar
y
Feb
ruar
y
Publication
Process
Updated
Consolidated ARV
Guidelines
Launch
Dec 2015
Systematic reviews
Values and
preferences
Community
consultations
Modelling
(Dec – May, 2015)
Supplement
launch WAD
Dec 1 2014
PADO 2
Dec 8-9
Core
Group
meeting
Oct 20-21
2014
Civil society representation
Civil society representation
Community consultation
Community consultation
Values and preferences
CSRG CSRG CSRG
B+
Jan
14-16
PEER REVIEW
Submission
to GRC
Sept 2014
Vancouver IAS July 19-22
Guideline
Development Group
Meetings:
Clinical/operational
Jun 1-5 2015
June 16-19 2015
Programmatic
Update
IAS July 2014
Programmatic Chapter
Core
Group
July 23-24
Recommended