What Audio Engineers Should Know About Human Sound Perception
Part 2. Binaural Effects and Spatial Hearing
AES 112th Convention, MunichAES 113th Convention, Los Angeles
Durand R. Begault
Human Factors Research & Technology DivisionNASA Ames Research CenterMoffett Field, California
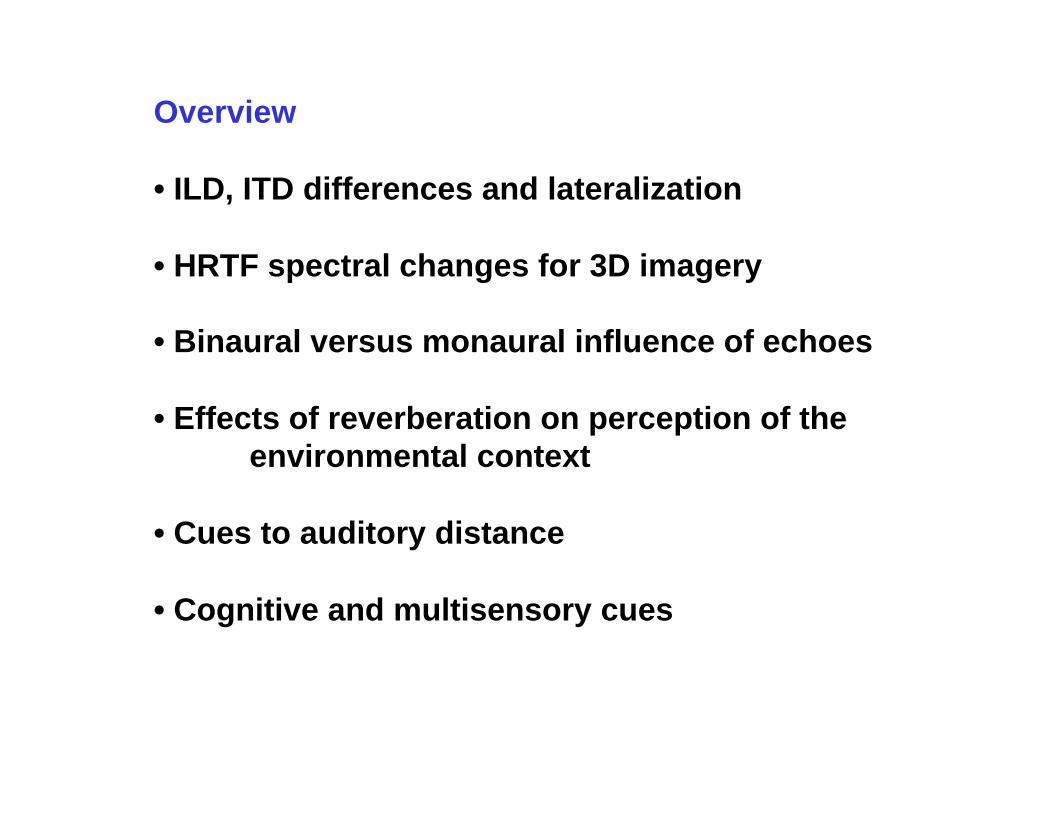
Overview
• ILD, ITD differences and lateralization
• HRTF spectral changes for 3D imagery
• Binaural versus monaural influence of echoes
• Effects of reverberation on perception of the environmental context
• Cues to auditory distance
• Cognitive and multisensory cues

Sound source(s),interaction withroom acoustics
SOURCE MEDIUM RECEIVER
Communication chain for acoustic events
FrequencyAmplitudeSpectrumLocation

Sound source(s),interaction withroom acoustics
SOURCE MEDIUM RECEIVER
Communication chain for acoustic events
FrequencyAmplitudeSpectrumLocation
Recording & playback: acoustical-electrical- acoustical transformation

Sound source(s),interaction withroom acoustics
SOURCE MEDIUM RECEIVER
Communication chain for acoustic events
FrequencyAmplitudeSpectrumLocation
Recording & playback: acoustical-electrical- acoustical transformation
Hearing: perception, cognition, multi-sensory interaction
PitchLoudnessTimbreLocalization

Sound source(s),interaction withroom acoustics
SOURCE MEDIUM RECEIVER
Communication chain for acoustic events
Recording & playback: acoustical-electrical- acoustical transformation
Hearing: perception, cognition, multi-sensory interaction
Mismatch between prescribed & perceived spatial events

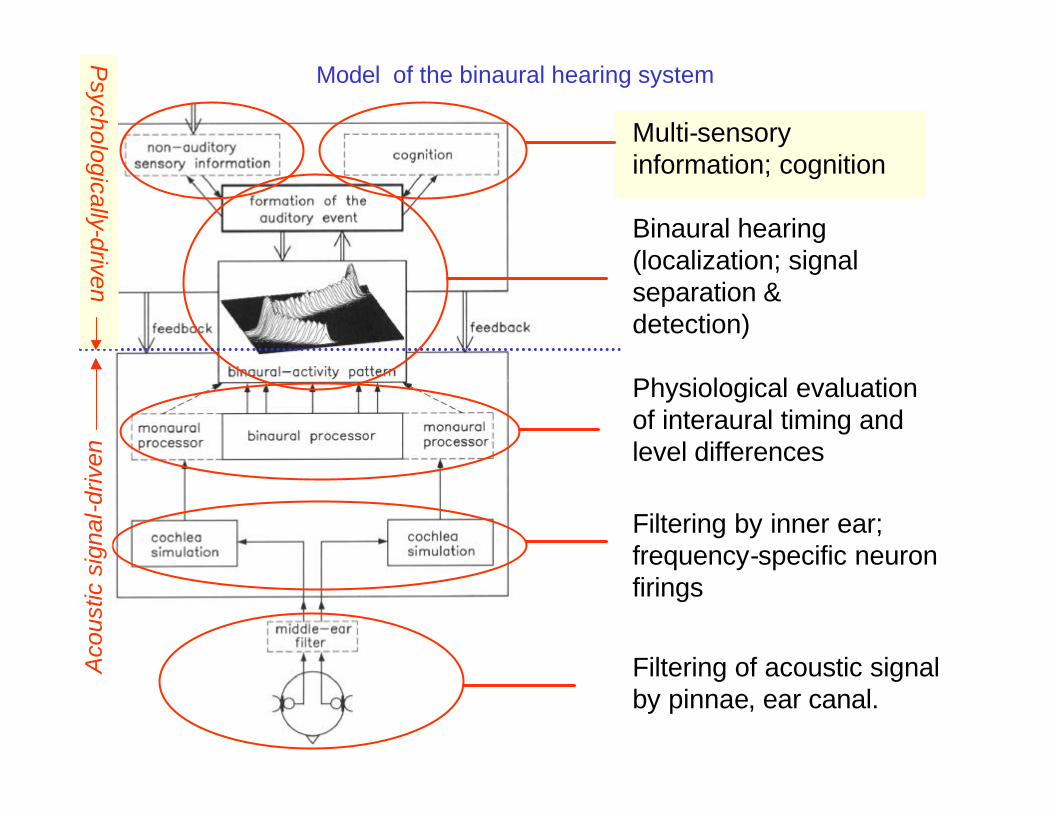
Model of the binaural hearing systemA
cous
tic s
igna
l-driv
en
Binaural hearing (localization; signal separation & detection):
forming spatial auditory events from acoustical (bottom-up) and psychological (top-down) inputs
Psychologically-driven
Figure adapted from JensBlauert, “Spatial Hearing.The Pychophysics of Human Sound Localization.Revised Edition. 1983, MIT Press.

Model of the binaural hearing system
Filtering of acoustic signalby pinnae, ear canal
Binaural hearing (localization; signal separation & detection)

Model of the binaural hearing system
Filtering of acoustic signalby pinnae, ear canal
Filtering by inner ear; frequency-specific neuronfirings
Binaural hearing (localization; signal separation & detection)

Model of the binaural hearing system
Filtering of acoustic signalby pinnae, ear canal
Filtering by inner ear; frequency-specific neuronfirings
Physiological evaluationof interaural timing andlevel differences
Binaural hearing (localization; signal separation & detection)
Model of the binaural hearing system
Filtering of acoustic signalby pinnae, ear canal.
Filtering by inner ear; frequency-specific neuronfirings
Physiological evaluationof interaural timing andlevel differences
Aco
ustic
sig
nal-d
riven
Binaural hearing (localization; signal separation & detection)
Multi-sensory information; cognition
Aco
ustic
sig
nal-d
riven
Psychologically-driven

Two important functions of the binaural hearing system
for recording engineers:
• Localization
(lateral and 3-dimensional)
• Binaural masking:
Echo supression, room perception
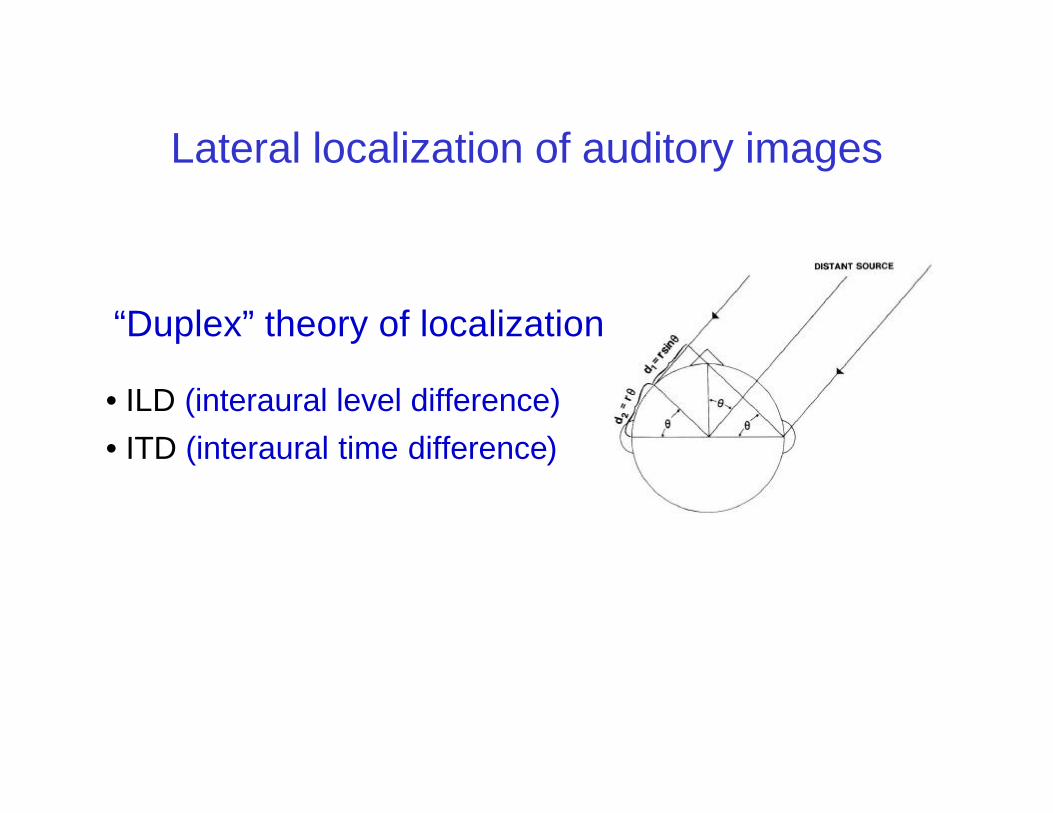
• ILD (interaural level difference)• ITD (interaural time difference)
“Duplex” theory of localization
Lateral localization of auditory images
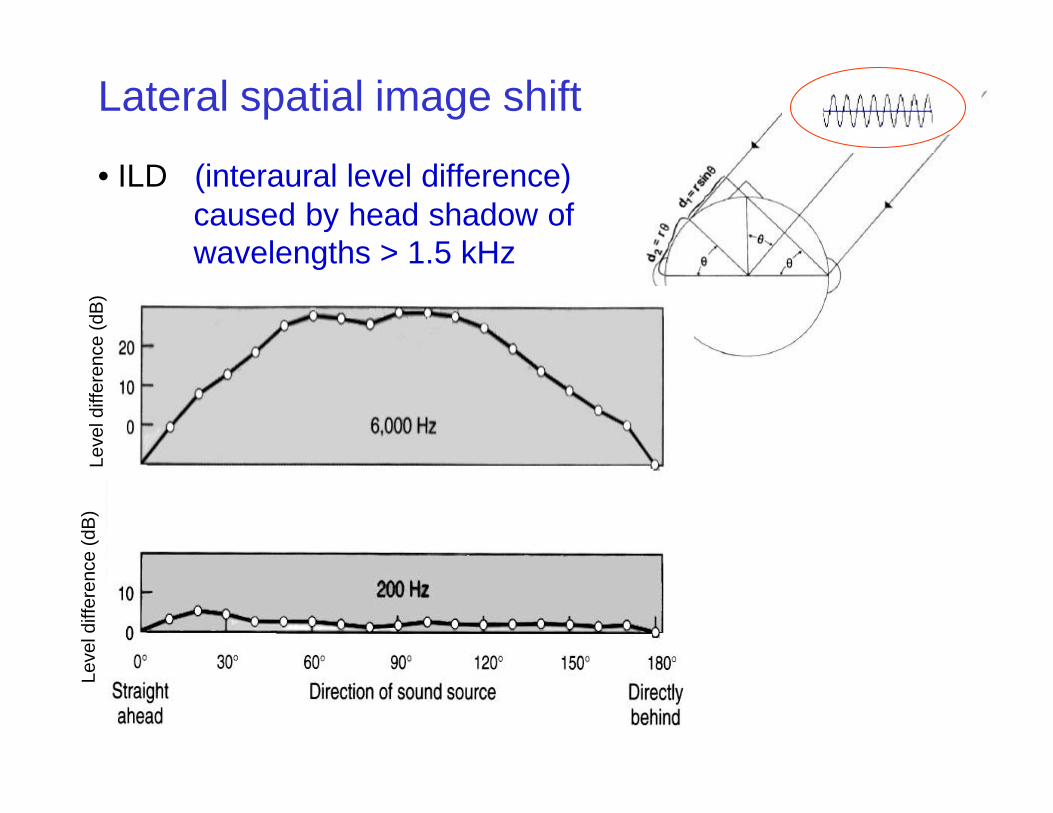
• ILD (interaural level difference) caused by head shadow of wavelengths > 1.5 kHz
Lateral spatial image shiftLe
vel d
iffer
ence
(dB
)Le
vel d
iffer
ence
(dB
)

Perceptual decoding of spatial cuesin a cross-coincident microphonerecording is based on ILDs
rotation
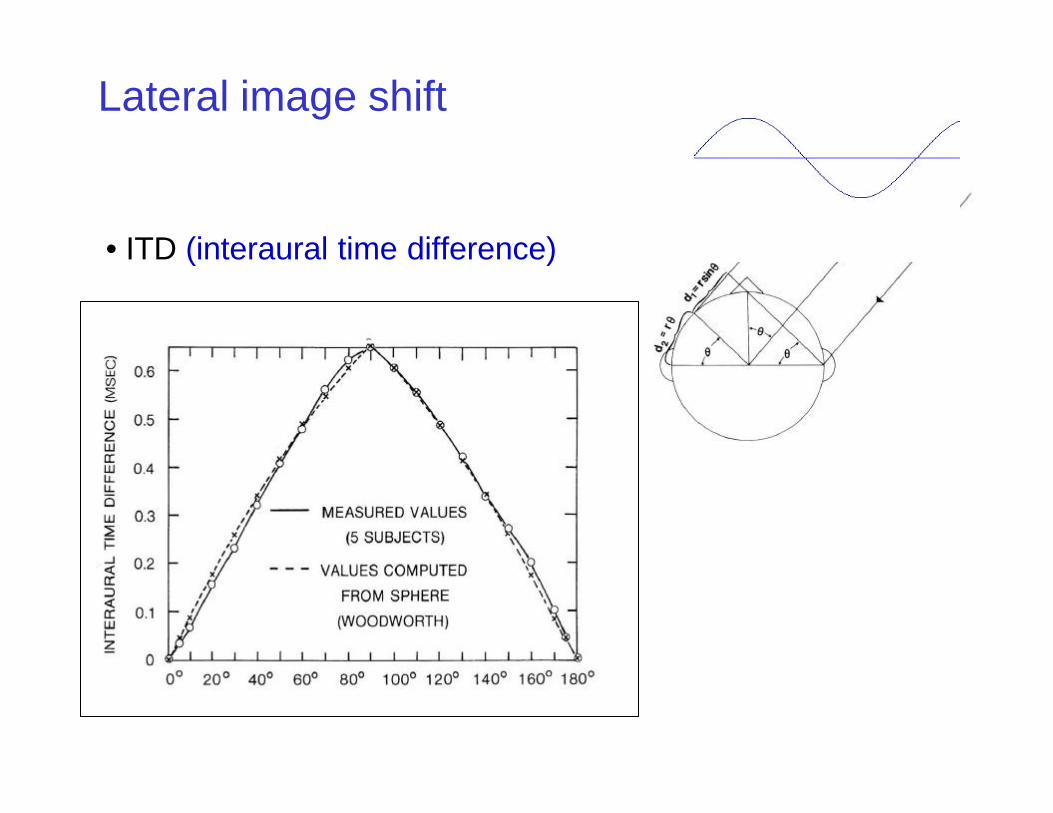
• ITD (interaural time difference)
Lateral image shift
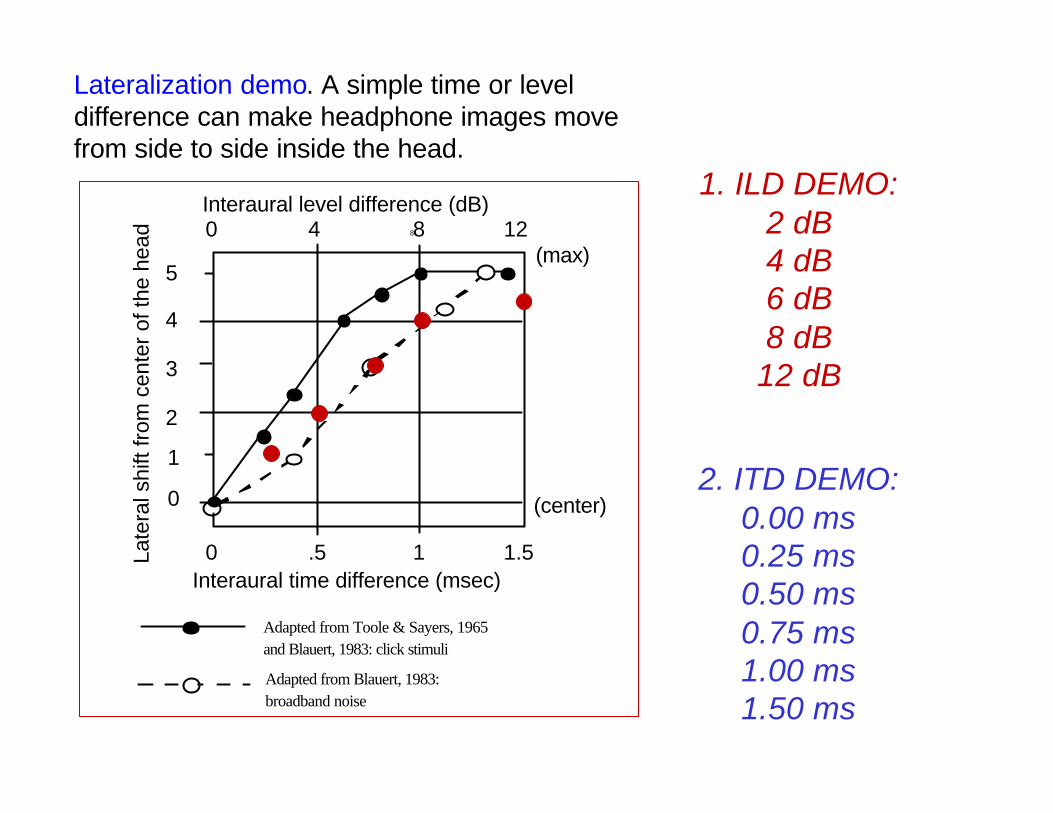
Lateralization demo. A simple time or level difference can make headphone images move from side to side inside the head.
Interaural level difference (dB)0 4 8 12
. 5 1 1 . 5
0 (center)
4
2
(max) 5
3
1
8
Interaural time difference (msec)0 .5 1.51
Adapted from Toole & Sayers, 1965 and Blauert, 1983: click stimuli
Adapted from Blauert, 1983: broadband noise
Late
ral s
hift
from
cen
ter
of th
e he
ad
2. ITD DEMO:0.00 ms0.25 ms0.50 ms0.75 ms1.00 ms1.50 ms
1. ILD DEMO:2 dB4 dB6 dB8 dB
12 dB
Elevation and front-back discrimination: HRTF, pinnae cues

Exte rnalize d pe rc ept ion
Lis t ene r
Source Le f t 3 0 °
Source Le f t 1 5 0 °
The cone of confusion causes reversals for virtual sources with identical or near-identical ITD or ILD

Frequency
Log
Mag
nitu
de (
dB)
2000 4000 6000 8000 10000 12000 14000100 16000
-40
-30
-20
-10
0
-50
10Right 30°, elevated
Right 90°, ear level
Right 120, below
Head-related transfer function cues (HRTFs) providecues for front-back discrimination and elevation
45°, 0°
135°, 0°
3. audio example:HRTF “clock positions”
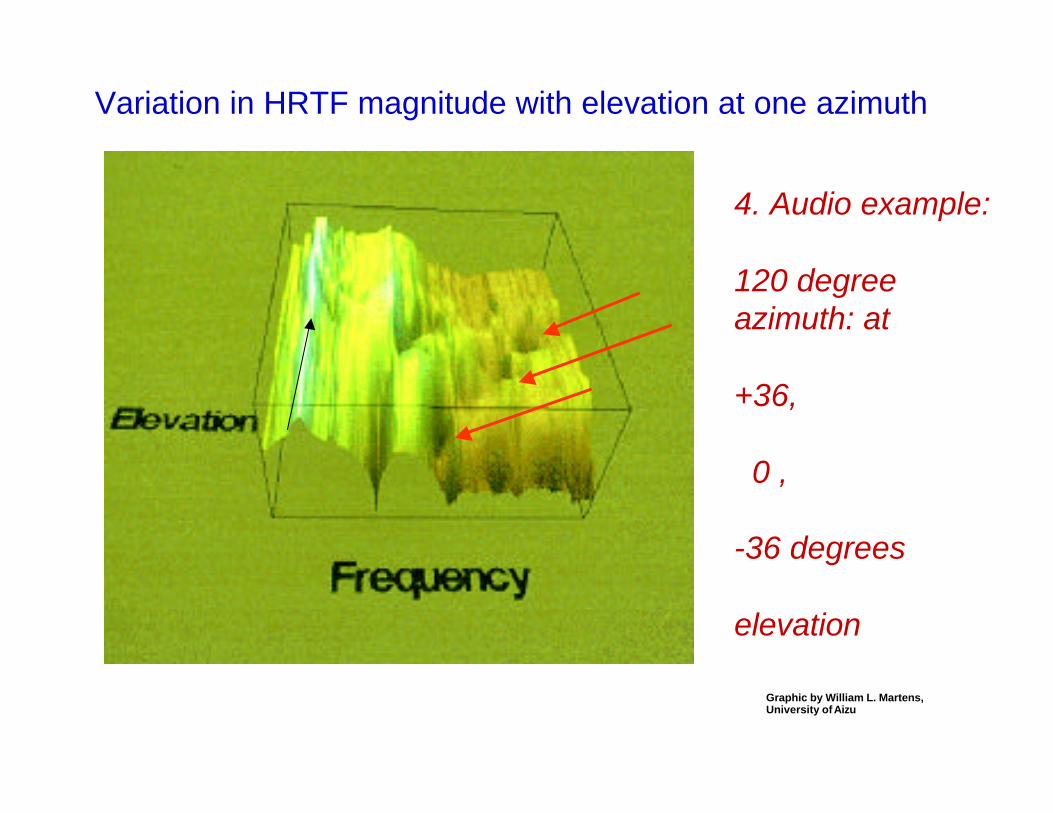
Variation in HRTF magnitude with elevation at one azimuth
4. Audio example:
120 degreeazimuth: at
+36,
0 ,
-36 degrees
elevation
Graphic by William L. Martens,University of Aizu
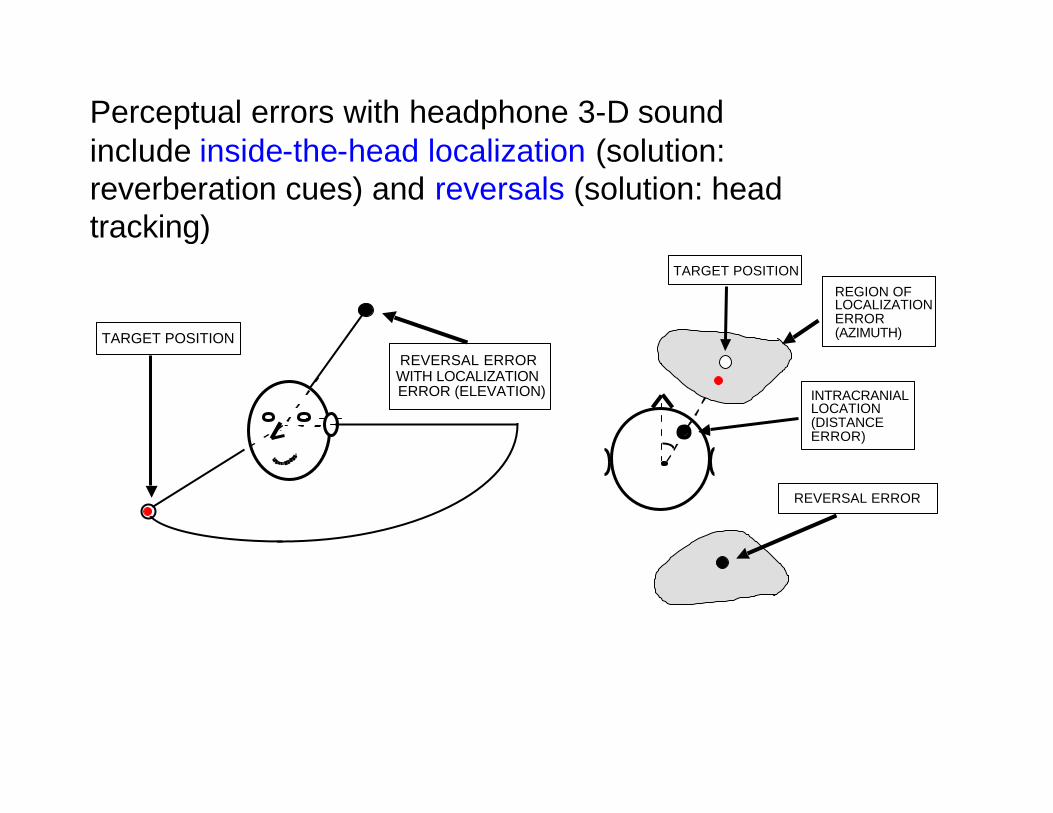
TARGET POSITIONREVERSAL ERROR WITH LOCALIZATION ERROR (ELEVATION)
TARGET POSITION
REVERSAL ERROR
REGION OF LOCALIZATION ERROR (AZIMUTH)
INTRACRANIAL LOCATION (DISTANCE ERROR)
Perceptual errors with headphone 3-D sound include inside-the-head localization (solution: reverberation cues) and reversals (solution: head tracking)

0
5
10
15
20
25
30
anechoic early reflections full auralization
reverberation treatment
Uns
igne
d az
imut
h er
ror
(deg
rees
)
Localization error for headphone stimuli (azimuth)
AnechoicSpeech:Individualdifferences
Mean values for different reverberation conditions

Echoes, reverberation and background sound: perception of the environmental
context

Spatial hearing fundamentally involves perception of the location of a sound source at a point in space (azimuth, elevation, distance).
But a sound source simultaneously reveals information about its environmental context.
-reverberation-image size & extent
Distance
Elevation
Image Size
Azimuth
Environmental Context
Listener
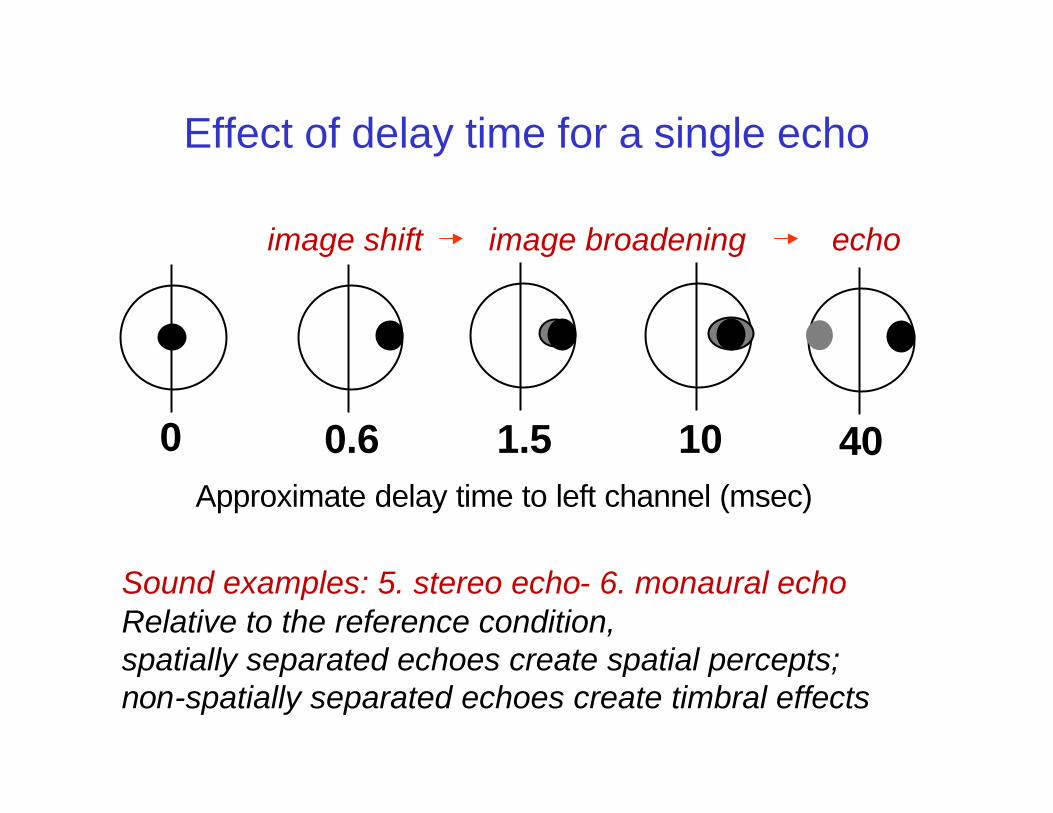
Effect of delay time for a single echo
0 0.6 1.5 40 10Approximate delay time to left channel (msec)
image shift image broadening echo
Sound examples: 5. stereo echo- 6. monaural echoRelative to the reference condition,spatially separated echoes create spatial percepts;non-spatially separated echoes create timbral effects
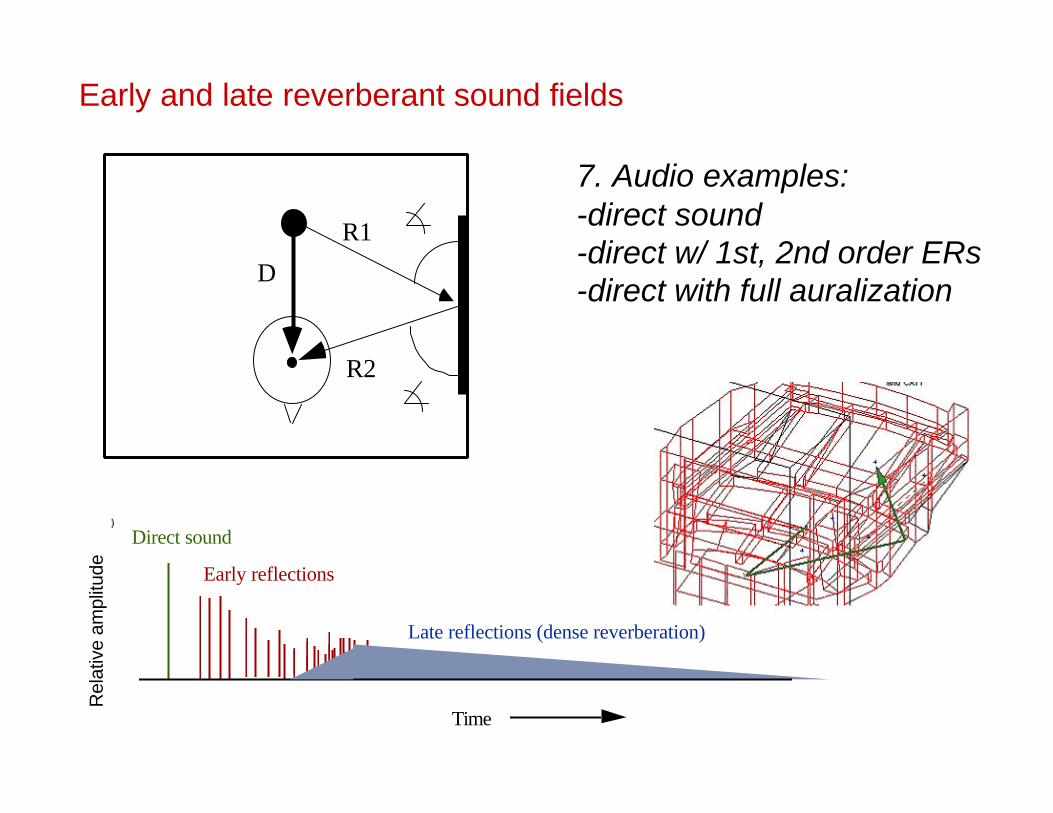
Direct sound
Early reflections
Late reflections (dense reverberation)
Time
Early and late reverberant sound fieldsR
elat
ive
ampl
itude
7. Audio examples:-direct sound-direct w/ 1st, 2nd order ERs-direct with full auralization
R2
D
R1

Direct sound
Early reflections
Late reflections (dense reverberation)
Time
Early and late reverberant sound fields
0 . 5 1 1 . 5 2 2 . 5 3 3 . 5 4 4 . 5 5 5 . 5
x 1 04
- 4 0
- 3 5
- 3 0
- 2 5
- 2 0
- 1 5
- 1 0
- 5
Rel
ativ
e am
plitu
deR
elat
ive
ampl
itude
8. audio examples: normal and 0.25 speed impulse response

Echo thresholds• Sensitivity can increase as much as 10 dB
if echoes occur at different locations• Late reverberation can decrease sensitivity• Sensitivity increases with increasing time delay

Although thresholds for reverberation are relatively low, background noise(e.g., NC 35) can mask the reverberant decay.
Noise Criteria (NC) curves
0
10
20
30
40
50
60
70
80
One-Third Octave Band Center Frequency, Hz
reverberation threshold
NC 65
NC 60
NC 55
NC 50
NC 45
NC 40
NC35NC 30
NC 25
NC 20
NC 15Approximate Threshold of Hearing for Continuous Noise
NC 10NC 5
31.5 63 125 250 500 1k 2k 4k 8k-40
-35
-30
-25
-20
-15
-10
250
500
1000
2000 fb
w
250
500
1000
2000 fb
w
250
500
1000
2000 fb
w
Small Medium Large
Octave-Band Center Frequency (fbw=full bandwidth)
Rev
erbe
ratio
n th
resh
old
(spe
ech)
re 6
0 dB
SP
L
speech

Distance perception: amplitude cues
• The inverse square law states that sound decays 6 decibels per doubling of distance in a reflection-free environment.
2
4
8
85
1
79 73dB SPL
''
''
67
9. sound example
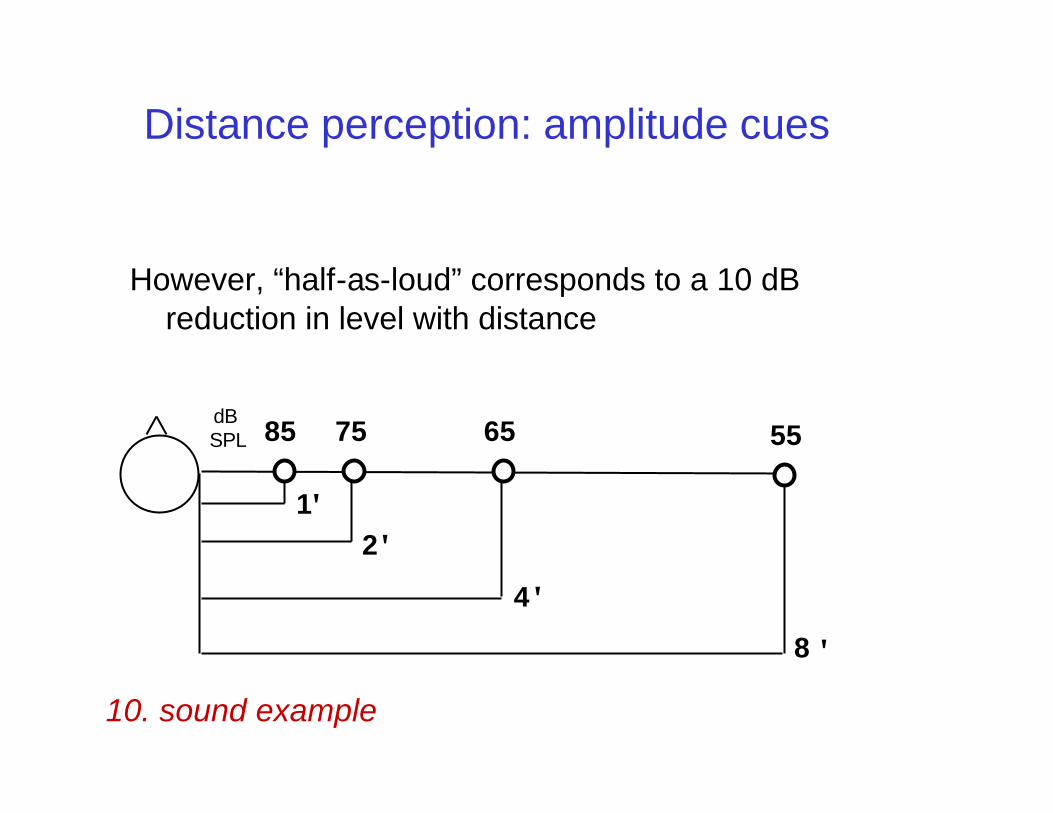
Distance perception: amplitude cues
However, “half-as-loud” corresponds to a 10 dB reduction in level with distance
2
4
8
85
1
75 65dB SPL
''
''
55
10. sound example

Distance perception: reverberant ratio cues
108642070
73
76
79
82
85
88
91
94
Anechoic
w/ ER
w/ ER + LR
distance (feet)
An increase in reverberant level indicatesmovement into the diffuse sound field

Concert Hall reverberation physical-perceptual parameters
• Reverberance (reverberation time, strength)
• Apparent source width (ASW) (interaural cross-correlation)
• Envelopment (spatial diffusion of reflections from all around)
• Clarity (ratio of first 50-80 ms of early sound to late sound)
• Warmth (ratio of bass frequency RT to mid-band RT)
Cognitive cues; multisensory cues
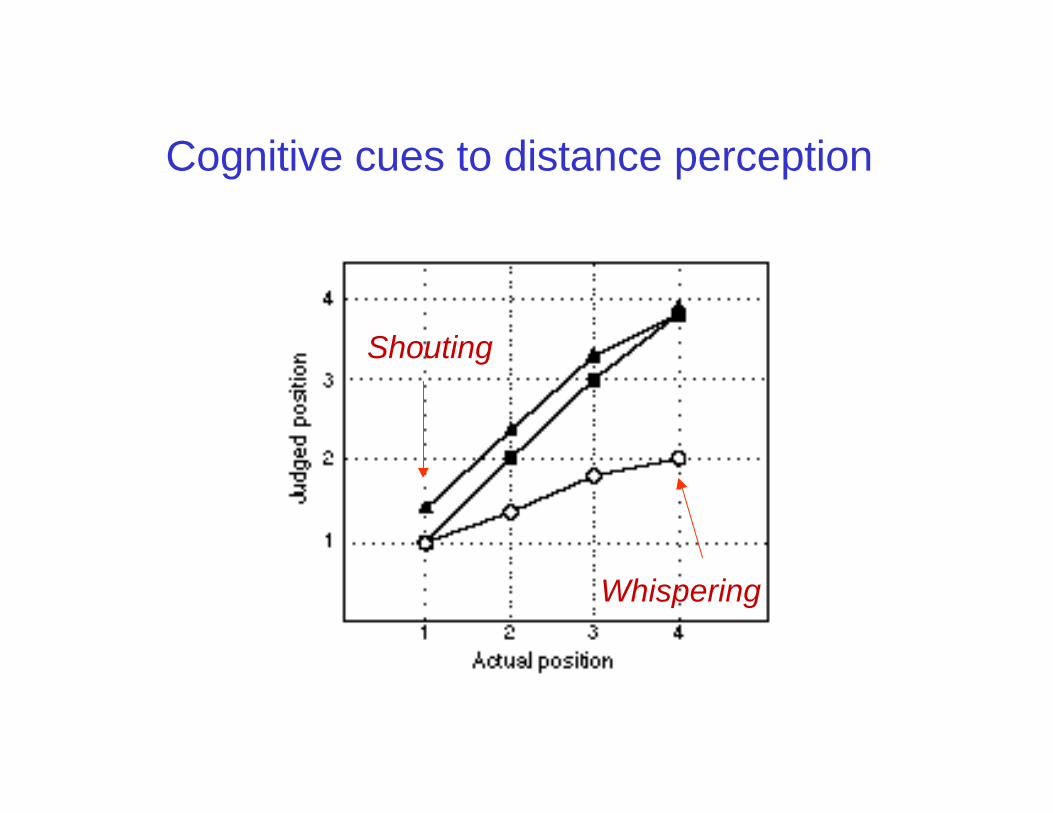
Cognitive cues to distance perception
Shouting
Whispering
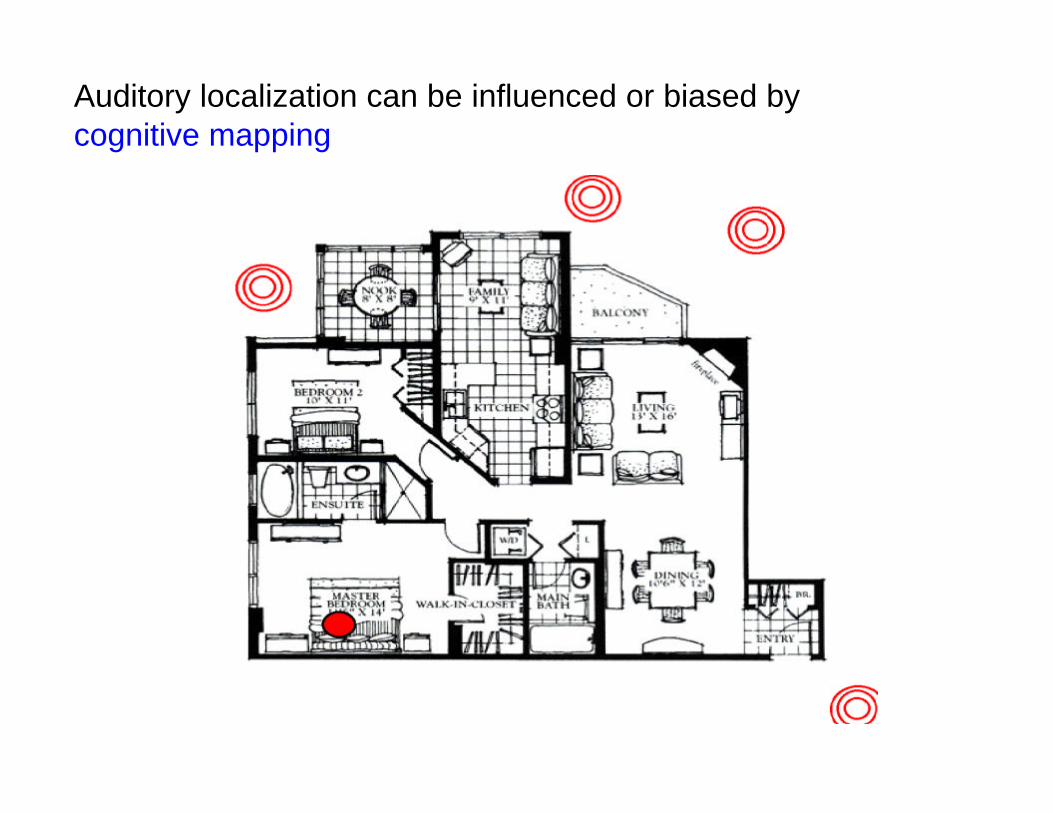
Auditory localization can be influenced or biased bycognitive mapping
Influence of visual, vibratory cues
Explosions & crashes
Helicopter fly-overs

Summary
• ILD, ITD differences and lateralization
• HRTF spectral changes for 3D imagery
• Binaural versus monaural influence of echoes
• Effects of reverberation on perception of the environmental context
• Cues to auditory distance
• Cognitive and multisensory cues
Recommended