Water Droplet Can Mitigate Dust fromHydrophobized Micro-Post Array SurfacesAbba Abubakar
King Fahd University of Petroleum and MineralsBekir Yilbas ( [email protected] )
King Fahd University of Petroleum and MineralsHussain Al-Qahtani
King Fahd University of Petroleum and MineralsGhassan Hassan
King Fahd University of Petroleum and MineralsJohnny Adukwu Adukwu
King Fahd University of Petroleum and Minerals
Research Article
Keywords: Micro-post arrays, hydrophobic, droplet motion, dust
Posted Date: May 6th, 2021
DOI: https://doi.org/10.21203/rs.3.rs-488933/v1
License: This work is licensed under a Creative Commons Attribution 4.0 International License. Read Full License

1
WATER DROPLET CAN MITIGATE DUST FROM HYDROPHOBIZED MICRO-POST
ARRAY SURFACES
Abba Abdulhamid Abubakar1 Bekir Sami Yilbas1,2,3 Hussain Al-Qahtani1
Ghassan Hassan1,4 Johnny Ebaika Adukwu1,4
1Mechanical Engineering Department, KFUPM, Dhahran 31261, Saudi Arabia.
2Center of Excellence for Renewable Energy, Mechanical Engineering Department, KFUPM,
Dhahran 31261, Saudi Arabia.
3Senior Researcher at K.A. CARE Energy Research & Innovation Center at Dhahran, Saudi Arabia
4Researcher at K.A. CARE Energy Research & Innovation Center at Dhahran, Saudi Arabia
*Correspondence and requests for materials should be addressed to B.S.Y. (Email:
[email protected]; Phone: +966 3 860 4481).
ABSTRACT
Water droplet rolling motion over the hydrophobized and optically transparent micro-post array
surfaces is examined towards dust removal pertinent to self-cleaning applications. Micro-post
arrays are replicated over the optically transparent polydimethylsiloxane (PDMS) surfaces. The
influence of micro-post array spacing on droplet rolling dynamics is explored for clean and dusty
surfaces. The droplet motions over clean and dusty micro-post array surfaces are monitored and
quantified. Flow inside the rolling droplet is simulated adopting the experimental conditions.
Findings reveal that micro-post gap spacing significantly influences droplet velocity on clean and
dusty hydrophobized surfaces. Air trapped within the micro-post gaps acts like a cushion reducing
the three-phase contact line and interfacial contact area of the rolling droplet. This gives rise to
increased droplet velocity over the micro-post array surface. Droplet kinetic energy dissipation
remains large for plain and micro-post arrays with small gap spacings. A Rolling droplet can pick
up dust particles from micro-post array gaps; however, few dust residues are observed for large
gap spacings. Nevertheless, dust residues are small in quantity over hydrophobized micro-post
array surfaces.

2
Keywords: Micro-post arrays, hydrophobic, droplet motion, dust
INTRODUCTION
The hydrophobic wetting state of surfaces finds a wide range of applications in many fields
including energy harvesting,1 biomedical technology and medicine,2 self-cleaning,3 and similar.
Hydrophobic state demonstrates water-repellant characteristics over the surface, which becomes
critical for water droplet motion in terms of rolling and sliding. Because of the topology of surface
texture, air-trap in between the texture gaps enables reducing three-phase contact line (water-air-
surface). This lowers the lateral surface tension force component at the droplet liquid-solid
interface while easing interfacial retarding and pinning forces acting over the liquid droplet. The
spacing between the pillars in the surface texture morphology becomes important for achieving
minimum interfacial resistance during droplet rolling. Increasing pillar spacing can cause droplet
fluid reaching at the pillar bottoms and the droplet fluid can wet the surface. This changes the
wetting state from Cassie & Baxter to Wenzel. Similarly, the hierarchal distribution of texture
pillars becomes essential maintaining the Cassie & Baxter state over the entire surface. The
hierarchical distribution of pillars can be rearranged to create sufficiently spaced micro-posts while
creating micro-post-arrays over the surface. Although water repellency from micro-post-array
depends on the geometric distribution of micro-posts over the surface, the surface free energy of
the micro-post structures is important in maintaining the hydrophobic characteristics over the
surface.4 The micro-post arrays can easily be produced on solid surfaces such as on silicon wafers.
In addition, the micro-post array topology created on silicon wafers can be replicated over soft
material surfaces such as polydimethylsiloxane (PDMS), which can be used for self-cleaning
applications.5 The micro-post pillar spacing and maintaining hydrophobicity over the surface
become critically important for self-cleaning applications. This is because the low dimensional
dust particles can reside in the spacing of micro-post gaps while resisting mitigation from the
surface. One of the methods increasing surface hydrophobicity on micro-post arrays is to introduce
a coating layer with low surface energy materials such as functionalized silica nano-particles.
Although hydrophobizing of micro-post array enhances liquid droplet mobility on the surface, the
droplet mobility can be further enhanced by reducing the interfacial contact area and three-phase-
contact line over the surface of micro-post arrays. This can be possible via altering the micro-post

3
gap spacing towards increasing the interfacial air-droplet fluid contact length. However, for self-
cleaning applications, the possibility of the number of particles (such as dust) residing in the micro-
post gaps increases as the micro-post gap spacing increases. This is because the three-phase-
contact line between the droplet fluid and gap becomes larger, i.e. dust surfaces contribute to the
extension of the contact line. This can cause droplet fluid to spread over the dust surface within
the gap width. Hence, spreading creates an adverse effect on the droplet mobility and the amount
of dust being mitigated from the micro-post array surface becomes less. Consequently, the
investigation into the effect of configurations of micro-post array gap spacing on droplet mobility
and dust mitigation becomes essential.
Considerable research studies have been reported exploring micro-post arrays and surface water
repellency. The processes, in general, involve multi-steps towards creating the surfaces with
hydrophobic micro-post arrays, which also depend on the applications. For metallic micro-post
structures that are used for high-temperature applications can be produced through surface
deposition of multi-layer coatings including Cu/Cr coatings.6 The wettability of metallic micro-
post arrays can be improved through the proper setting of the geometric topology of micro-posts.
The dual-scale hierarchical surfaces could be one of the alternative methods creating the Cassie &
Baxter wetting states over the surfaces. Hence, micro-poles having ripple-like nanopatterns give
rise to superhydrophobic states.7 Moreover, a lithographic technique can be used to decorate
substrate material surfaces by micro-post arrays. The lithographic technique provides high
dimensional accuracy making geometrically desired micro-post arrays. Moreover, dimensional
accuracy becomes critical in microbiologic research such as microcontact printing for patterning
proteins on substrates.8 The shape and size of micro-post arrays play an important role in the micro-
channel flow towards reducing the pressure drop via lowering frictional drag.9,10 In addition,
micro-post arrays can be impregnated by a fluid while producing lubricant surfaces, which become
critically important for medical applications such as artificial hip joints.11 Micro-post arrays also
find various applications in heat transfer enhancement in various applications such as fuel cells.
This is because of extended surfaces within the channel wall and capillary effect created around
micro-post wicks12,13 as well as liquid droplet formation and behavior, such as detachment and
removal from fuel-channel wall, are closely related to fuel cell performance.14 The geometric shape
of array posts influences droplet detachment time and mobility inside the fuel-cell channels.15 The

4
influence of micro-post array geometric configuration, in terms of roughness parameter, remains
significant on improved droplet sliding motion over oil-impregnated surfaces.16 However, self-
cleaning applications, particularly droplet mobility enhancement over dusty micro-post array
surfaces need further attention for improved dust mitigation rates from the surface.
On the other hand, rolling liquid droplets over the textured hydrophobic surfaces are faced
retarding effects due to irregular texture patterns; in which, droplet motion slows down. The
droplet dynamics and droplet fluid infusion over solid particles, such as dust particles, play a major
role in the self-cleaning of surfaces by water droplets. To accelerate droplet motion over dusty
surfaces, rolling of the droplet is required rather than droplet sliding motion. Droplet rolling can
be enhanced by creating sufficient air gaps between pillars and droplet fluid at the interface of
micro-post arrays. In this case, air gaps act like a cushion at the interface reducing droplet pinning
over the surfaces.17 It is demonstrated that the interfacial air cushion can be created via bubbles
inside the droplet fluid, which notably contribute to droplet rolling enhancement.18 Although
droplet rolling over hydrophobic dusty surfaces was presented previously,18,19 the influence of
texture characteristics on the removal of dust from hydrophobized micro-post array surfaces was
left for future study. Moreover, achieving the over the entire hydrophobic surface becomes
challenging. Hydrophobized micro-post arrays have uniform texture characteristics, which result
in uniform texture morphology over the surface. Altering micro-post spacing can provide different
texture topology over micro-post arrays surface. This can influence droplet mobility over dusty
hydrophobic micro-post surfaces. Hence, in the present study, dynamics of rolling water droplet
over hydrophobized micro-post array surfaces is examined. The study is extended to include dust
mitigation from hydrophobized micro-post arrays surfaces having various array spacings.
Experiments and numerical simulations are carried out to determine energy losses related to
droplet rolling over clean and dusty micro-post array surfaces. Micro-post array surfaces are
hydrophobized via deposition of functionalized nano-silica particles. High-speed recording system
and tracker program are utilized to monitor and evaluating droplet motion over the surfaces.

5
NUMERICAL
The rolling dynamics of a droplet on a micro-post array surface are considered adopting the
Navier-Stokes’ equation. Droplet fluid (water) is considered to be incompressible and Newtonian
while the surrounding air is considered to be weakly-compressible due to the low Mach number
(i.e. 𝑀𝑎 < 0.3) associated with the airflow created during droplet rolling. Hence, the simulation
of droplet rolling is conducted via using the continuity and momentum equations as follows: 𝜕𝜌𝜕𝑡 + 𝛻 ∙ (𝜌�̅�) = 0 (1)
The momentum equation yields:
𝜌 𝜕�̄�𝜕𝑡 + 𝜌(�̄� ⋅ 𝛻)�̄� = 𝛻 ⋅ [−𝑝𝐼 + 𝜇(𝛻�̄� + (𝛻�̄�)𝑇) − (2𝜇3 − 𝜅) (∇ ∙ �̄�)𝐼]̅ + 𝜌�̄� + 𝛾𝑘𝛿�̄� + �̄�𝑓𝑟 (2)
here: 𝜌 is density, �̅� is velocity vector, �̅� is acceleration vector due to gravity, 𝑝 is gauge pressure, 𝛾 is surface tension, 𝜇 is dynamic viscosity, 𝑘 = �̅�|�̅�| is curvature where �̅� is the unit normal vector
at the water-air interface, 𝛿 is Dirac-Delta function, �̄�𝑓𝑟 is friction source term, and 𝑡 is time.
The rolling droplet and micro-post array surface are considered to be in stagnant air ambient. To
model the rolling droplet model, the conserved level-set two-phase (liquid for water and gas for
air) flow model is adopted (Eq. (3)), i.e.:
𝜕𝜙𝜕𝑡 + �̅� ∙ 𝛻𝜙𝑠 = 𝛾𝑟 ∙ 𝛻 ∙ (𝜀𝑙𝑠𝛻𝜙𝑠 − 𝜙𝑠(1 − 𝜙𝑠) 𝛻𝜙𝑠|𝛻𝜙𝑠|) (3)
here: 𝜙𝑠 is a level-set function, �̅� is velocity vector, 𝛾𝑟 is re-initialization parameter, 𝜀𝑙𝑠 is the
parameter that controls interface thickness, and 𝑡 is time. With the level-set function, properties
such as density, viscosity, contact resistance, and thermal conductivity of air and water are scaled
according to mixtures rules. Hence, the density can be written as 𝜌 = 𝜌2 + (𝜌1 − 𝜌2) ⋅ 𝜙𝑠.
Initial conditions

6
As depicted in Figure 1, the droplet is considered to be initially at rest and then rolls down along
the inclined micro-post array surface under the gravitational influence. Droplet initial size and
location on the surface are defined according to the experimental data. Hence, the initial conditions
used for the current analysis are expressed as: �̄�(𝑥, 𝑦, 0) = {0 𝑓𝑜𝑟 𝑑𝑟𝑜𝑝𝑙𝑒𝑡0 𝑓𝑜𝑟 𝑎𝑖𝑟 (4)
𝑝(𝑥, 𝑦, 0) = {2𝛾𝑅 𝑓𝑜𝑟 𝑑𝑟𝑜𝑝𝑙𝑒𝑡0 𝑓𝑜𝑟 𝑎𝑖𝑟 (5)
𝜙𝑠(𝑥, 𝑦, 0) = {1 for droplet0.5 for interface0 for air (6)
Boundary conditions
For fluid flow, boundary 1 between the droplet and surrounding air (Figure 1) is considered to be
free to deform within the computational domain. The pressure outlet is defined at boundaries 4, 3,
and 2 (Figure 1). Boundary 5 (Figure 1) is considered to be a wetted wall in which the dynamic
contact angle between droplet, air, and the surface is defined in line with the previous studies.20,21
In addition, experimentally obtained adhesion/frictional forces are defined at boundary 5 from
which droplet motion is inhibited by the resistive interfacial forces. Thus, the boundary conditions
used can be expressed as: 𝑝(𝑥, 𝑦, 𝑡) = 0 (pressure outlet) (7) �̄�(𝑥, 𝑦, 𝑡) ⋅ �̄�𝑤𝑎𝑙𝑙 = 0 (slip at wetted wall) (8)
Here, �̅�𝑤𝑎𝑙𝑙 is a unit normal vector at the wetted wall. 𝐹𝑓𝑟 = 𝛾(�̄�𝑤𝑎𝑙𝑙 − �̅� cos 𝜃𝑑)𝛿 − 𝜇𝛽 �̅�(Γ, 𝑡) + 𝐹𝑎𝑑
(total frictional force at the wetted wall) (9)
Here, �̅� is a unit normal vector at the water-air interface, 𝜃𝑑 is the dynamic contact angle, 𝛽 is
slipped length at the wetted wall and Γ denotes a boundary. For numerical calculations, a suitable
choice is 𝛽 = ℎ5, where ℎ is the edge length of the mesh element.
7
A slip boundary is adopted at droplet and air interface; in which case, shear stresses on droplet and
air regions are considered to be the same order, i.e., no boundary layer is developed. Hence, the
following boundary condition on droplet free surface at the liquid-air interface is introduced: (−𝑝𝐼 + 𝜇(𝛻�̄� + (𝛻�̄�)𝑇))�̄� = 0 (10)
here, I is the identity matrix, the superscript T is the matrix transpose, �̅� is velocity vector, and �̅�
is a normal unit vector. Moreover, no fluid penetration occurs from the surrounding air; hence: �̄� ⋅ �̄� = 0; �̄� − (�̄� ⋅ �̄�) = 0 (11)
where, �̄� = 𝜇(𝛻�̄� + (𝛻�̄�)𝑇)�̄�. Boundary 5 is the wetted wall at which the contact angle and
adhesive forces are defined.
Numerical implementation
COMSOL multi-physics code22 is used to model the dynamics of a rolling droplet on the micro-
post array surface incorporating the initial and the boundary conditions presented through Eq. (1)
to (26). The governing equations are presented in the cartesian coordinate system, which enabled
to build of the numerical case for 3D simulations. Moreover, the numerical accuracy of the scheme
is limited by the time step size, mesh size and level-set parameters adopted. Hence, time steps as
small as 10-8 s are adopted for the numerical solution ensuring the convergence of time derivatives.
The second-order Euler backward difference scheme is used to discretize the time derivatives in
the flow and energy equations. With the level-set approach, the droplet interface is treated
implicitly such that numerical convergence is achieved with a regular mesh of sufficient density
(shown in Figure 2). However, the level-set parameters (𝛾𝑟 and 𝜀𝑙𝑠) need to be properly set so that
the movement of the droplet can be effectively captured within the fixed mesh. Based on the initial
tests and the practice, the re-initialization parameter (𝛾𝑟) is set to be equal to the maximum velocity
of flow (0.6 m/s); while the interface thickness (𝜀𝑙𝑠) is taken as half of the maximum element
(edge) length. As demonstrated in Figure3, the grid-independent solution for the 40 µL droplet and
b = 50 µm after a total duration of 21 ms is obtained with 1,279,003 tetrahedral elements having
an average quality of 0.94. Furthermore, mass is conserved during the analysis by ensuring that
the change in mass during the impact of the droplet is negligible.

8
EXPERIMENTAL
Silicon wafers of 1 mm thickness were used to create micro-post arrays texture over the surfaces
by using the lithographic method. Micro-post arrays of 10 m, 25 m, and 50 m gap spacing
were produced on silicon wafer surfaces. Since the silicon wafers were opaque to the UV visible
spectrum, micro-post array texture topology was replicated by polydimethylsiloxane (PDMS). In
order to hydrophobizing micro-post arrays surfaces, functionalized silicon nanoparticles were
deposited via dip-coating technique. The process for preparing functionalized silica particles was
the same as described in the early work.23 In the functionalizing cycle, tetraethyl orthosilicate
(TEOS), isobutyltrimethoxysilane (OTES), ethanol, and ammonium hydroxide were utilized. The
wetting state of the hydrophobized PDMS surfaces is assessed incorporating the contact angle
measurements. A goniometer (Kyowa, model - DM 501) was used and high precision drop shape
analysis was used for evaluating the droplet contact angles.24 The hydrophobized micro-post arrays
surface demonstrated a uniform wetting state over the surface and the contact angle measured over
the hydrophobized surface was found to be almost independent of micro-post array gap spacing.
Hence, the contact angle of 150o 3o with the hysteresis of 3o 1o was measured. Moreover, a
JEOL 6460 SEM (scanning electron microscope) with a magnification of 10× to 300 000× was
used for imaging the micro-post array topology before and after the coating. A high-speed video-
recording facility (Speed Sense 9040) was used to record the rolling droplet motion over the
surfaces. The video recording was realized at 5,000 frames-per-second (fps) with the pixel size of
14 µm × 14 µm and having the resolution of 1280 × 800 pixels. A tracker program [25] was used
to quantify the recorded data in terms of droplet rolling and transitional velocities. Video recording
experiments were repeated 10 times and the error estimated was about 2.7%. The uncertainty (u)
involved with the measurements were evaluated through:26
𝜎𝑢 = √∫ (𝑥 − 𝑥𝑒)2𝜒(𝑥)𝑑𝑥𝑥𝑚𝑥𝑜 (12)
Here, xe corresponds to the mean value of the data (x), m is the number of points in the data-set,
and 𝜒(x) being the probability distribution function. The function 𝜒(x) was determined from an

9
instant correlation plane. Later, it was fitted into a Gaussian function to evaluate the corresponding
Gaussian diameter. The uncertainty was evaluated by adopting a least-squared-Gaussian-fit
technique and later it was normalized with the pixel numbers contributing to the cross-correlation-
peak. In addition, the bias error was about 0.02 pixels, which was based on the complexity involved
through quantifying extremely small peaks in the Gaussian function. The uncertainty was
estimated at 2.9%.
Dust was gathered from PV panel surfaces via using soft brushers in the close region of
Dammam in Saudi Arabia and dust was stored in tightly sealed containers. Dust particles
were deposited forming a layer over hydrophobized micro-post arrays using metallic
meshes towards achieving the uniform dust layer thickness. The dust layer thickness is kept
at about 300 m, which was the same order of averaged dust layer thickness on PV panel
surfaces over six months period in the Dammam area in Saudi Arabia.
RESULTS AND DISCUSSION
Droplet mobility assessment over hydrophobized micro-post array surfaces is considered and dust
mitigation by rolling droplet is evaluated. Droplet motion is monitored and characterized by using
a high-speed camera and a tracker program in terms of rolling, sliding, and translational velocities
of the droplet, droplet wetting over the surface, and maximum droplet height. Droplet behavior is
simulated numerically adopting the experimental conditions.
PDMS Replication of Micro-post Arrays and Surface Hydrophobizing:
Micro-post arrays are created over silicon wafers and later replicated over polydimethylsiloxane
(PDMS) wafer surfaces. Figure 4a to 4c shows micrographs of micro-post arrays formed on a
silicon wafer and replicated micro-post arrays on PDMS wafer while Figure 4d to 4f show a close
view of PDMS micro-posts before and after coating. The replicated micro-post arrays on PDMS
are identical to micro-post arrays formed on a silicon wafer. The area ratio (Pr
soilds
ojected
A
A )

10
determining the fraction of post area over the projected area for the micro-post arrays is (Figure
4b):
2
2s
a
a b
(13)
here, a is the length of the square micro-post and b is the gap length (spacing between two-
consecutive micro-posts). In addition, the area ratio of the total micro-posts surface over the
projected area yields:
2
2 2
4 41
a b ah ahr
a b a b
(14)
here, h is the height of the micro-post. The droplet fluid is expected not to spread over the micro-
post array surface during rolling. The wettability of the plain (not textured) PDMS surface is
assessed by estimating the spreading factor of the droplet fluid over the surface. The spreading
factor for plain PDMS surface is: 𝑆𝑠−𝑤 = 𝛾𝑤 − 𝛾𝑠 − 𝛾𝑠−𝑤, here w is droplet fluid surface tension
(water), and s is the surface free energy of Polydimethylsiloxane, and 𝛾𝑠−𝑤 is the interfacial
tension between droplet liquid and Polydimethylsiloxane. The surface free energy of
Polydimethylsiloxane is 21.3 mJ/m2 27 and the interfacial tension between droplet fluid and
Polydimethylsiloxane is 40 mJ/m2 .28 This gives rise to 𝑆𝑠−𝑤 in the order of 𝑆𝑠𝑤(𝑎) = −61.229
mJ/m2, which demonstrates that the droplet fluid can spread over the plain Polydimethylsiloxane
surface (𝑆𝑠𝑤(𝑎) < 0). However, creating the micro-post array on the PDMS surface, via the
replication method, can alter the spreading rate of the droplet fluid over the surface because of
reduced interfacial resistance under the influence of the roughness parameter. The condition for
partial-spreading of droplet fluid over micro-post surface satisfies: 𝑆𝑠−𝑤 < −𝛾𝑤 (𝑟−1)(𝑟−𝜙𝑠) .29 Since
three different spacing of micro-post arrays (b = 10 m, 25 m, and 50 m) are replicated while
keeping other dimensions of micro-post arrays (a = 10 m and h = 10 m) are same, the droplet
fluid spreading factor over the different space setting of micro-post array surface changes.

11
Inserting the values for r and s from Eqs. 13 and 14, the spreading factor (𝑆𝑠−𝑤) takes the values
-0.04114 for b = 10 m, -0.01889 for b = 25 m, and -0.00738 for b = 50 m. Hence, droplet
liquid can partially spread over the micro-post arrays surface. In order to eliminate partial
spreading of the droplet liquid over the surface, micro-post array surfaces are hydrophobized
through deposition of functionalized silica nanoparticles. Figure 4d and 4f show functionalized
silica nanoparticles deposited micro-post array surface as formed on PDMS surface. Silica
nanoparticles uniformly cover the surfaces of micro-posts and gap spacings over micro-post arrays.
The nanoparticles are in a spherical shape with almost 30 nm size. They agglomerate over the
deposited surface of micro-posts and gap spacing forming fine size peaks and valleys. This is
because of the condensing monomers, which suppress the nucleation rate and lowers the number
of new nuclei formation during the synthesizing cycle of the nano-silica particles.30,31 As the
condensation takes place at high rates, it results in adhesion and agglomeration of the silica
particles over the surface. The average roughness of nanoparticles deposited surface is about 160
nm. The water droplet contact angle is measured is about 150o 3o and the hysteresis is about 3o
1o. It should be noted that high-precision drop shape analysis is adopted to measure the droplet
contact angle.24 Hence, coating of micro-post arrays surface results in a hydrophobic wetting state.
Droplet Rolling over Hydrophobic Micro-post Arrays:
The rotational kinetic energy of the rolling droplet over inclined hydrophobic surfaces is
influenced by the forces of pinning (under surface tension), air drag, and interfacial shear (created
over the wetted surface).32 The pinning force is proportional to the droplet wetting diameter (Dw),
the solid fraction (s), droplet fluid surface tension (), and advancing (A) and receding (R) angles
during rolling. It takes the form: 𝐹𝑎𝑑 = 24𝜋3 𝛾𝜙𝑠𝐷(𝑐𝑜𝑠𝜃𝑅 − 𝑐𝑜𝑠𝜃𝐴).32 The air-drag force acting
over rolling droplet can be formulated via 𝐷𝑎 ≅ 1/2𝐶𝑑𝜌𝑎𝐴𝑐𝑈𝑓2, here, Cd is drag coefficient and
air velocity is Uf , which can be considered as rolling droplet translational velocity (Vd).33 The
interfacial shear force created over the wedded area can be simplified to take the form of: 𝐹𝜏 =𝐴𝑤(𝜇 𝑑𝑉𝑑𝑑𝑦 ), here Aw is wetted area, is fluid viscosity, y is distance normal to the wetted
area. Droplet wobbling during rolling gives rise to volume deformation of droplet during
its transition over the surface. This causes droplet kinetic energy dissipation over the rolling

12
surface. Moreover, the force balance yields the rotational velocity ( ) of the droplet on the
inclined hydrophobic surface: 32
3
5 24sin cos cos
2
51
4
s R A w f
d a c
umg A mg
mR y
C A Rm
(15)
where m is droplet mass, R is droplet radius, is the inclination angle of the hydrophobic surface,
and f is friction coefficient between the droplet and the surface. Hence, droplet size, advancing
and receding angles of the droplet, interfacial resistance, and drag coefficient influence the droplet
rotational velocity. In addition, the rolling droplet suffers from wobbling because of gravity, which
in turn causes extra work done due to the geometric deformation of the rolling droplet. The work
is done, due to volume deformation, can be formulated as: ∆𝐸𝑑𝑒𝑓𝑜𝑟𝑚𝑎𝑡𝑖𝑜𝑛~ ∀𝑝𝛾(𝐷ℎ1−𝐷ℎ2𝐷ℎ1𝐷ℎ2 ),
here p is droplet volume, 𝐷ℎ1 and 𝐷ℎ2 are hydraulic diameter of the droplet during
wobbling. The wobbling of rolling droplet rolling results in puddling and the puddle
thickness is related to √2(1 − 𝑐𝑜𝑠𝜃) 𝛾𝜌𝑔 , here g is the gravity and 𝜃 being the droplet contact
angle.34 It is worth mentioning that for small droplets (comparable to capillary length (𝜅−1), 𝜅−1 =√ 𝛾𝜌𝑔), the puddling ceases and droplet rolls like a spherical solid body.35 The volume deformation
alters advancing and receding angles of the rolling droplet. Hence, the pinning force can be
influenced indirectly by the droplet wobbling. This situation becomes critical as the rolling droplet
size increases. In the case of micro-post arrays, air trapped in the spacing between the micro-posts
acts like an air cushion while minimizing the droplet fluid contacting at the PDMS surface. Hence,
the pinning force and the fluid shear stress over the contacted area are affected by the size of micro-
post spacing because of reduced: i) length of the three-phase-contact line, and ii) interfacial contact
area between the micro-post surface and droplet fluid, i.e. air trapped in micro-posts spacing lowers
both the contact length and area between droplet fluid and surface. The solid fraction (
2
2s
a
a b

13
) reduces as the spacing (b) between the micro-posts increases, which results in reduced pinning
force. In addition, the projected solid area 2a b reduces by b2, i.e. 𝑏 ≥ 𝑎 and the condition 𝑏 =𝑎 gives rise to almost 1/4 reduction of the solid region in the projected area. Moreover, the
wobbling of droplets causes the change of the gravitational center of the droplet with an amount 𝜆. The difference in the potential energy between puddled and spherical droplets having the
same volume is about 𝛾𝜆 2 gR3,36 here R being the droplet radius.36 The length of droplet
liquid contact (l) over the solid surface for the wobbling droplet is 𝑙 ≅ √𝑅𝜆. Hence, the
relation 𝜌𝑔𝜆~𝛾𝑙2/𝑅3 can be written for potential energy difference between spherical and
puddled droplet. This gives rise to the contact length of about 𝑙 ≅ 𝑅2/√ 𝛾𝜌𝑔, which
corresponds to the ratio of square of droplet radius over the capillary length, which is also
reported earlier.36 However, the contact length (𝑙) reduces by the repeats of the number of
micro-posts spacings along the contact length. Hence, the contact length increase because
of droplet puddling over the micro-post arrays surface becomes less than that corresponding
to hydrophobized plane surface. In addition, the force ratio of gravity over the surface
tension varies during rotation because of droplet wobbling. This effect can be associated
with the rotational Bond number, which is 𝜌𝜔2𝑅38 , where being the droplet rotational
velocity. At high rotational velocities, the Bond number increases significantly because of
square relation with the rotational velocity. The droplet wobbling ceases at high Bond
numbers.37 Hence, increasing droplet rotational velocity lowers droplet wobbling and the
difference between the centroidal and the gravitational center of the droplet becomes
significantly small. In addition, as the droplet rolls over the hydrophobic surface, the droplet
undergoes sliding because of the slip length on the hydrophobic surface. The ratio of
tangential velocity basing on droplet rotational velocity (angular velocity) over the droplet
translational velocity can differ from unity, i.e. R/Vd 1, here Vd is the droplet
translational velocity. The slipping action taking place becomes different for the wobbling
droplet than the marble-like rolling droplet. From the high speed camera data, R/Vd is
found to be about 0.98. This influences the dynamic pressure generated inside the droplet;
hence, the difference between droplet fluid and its ambient pressures varies with time. The
droplet wobbling and oscillation of pressure difference have a coupled effect, i.e one

14
influences the other. The effect of dynamic pressure oscillation on wobbling becomes less
important for the condition 𝜑 = ∆𝜌𝜔2𝑅2𝜌𝑎𝑉2 ≫ 1, here is density difference between droplet
fluid and air.37 Since the average rotational speed of 20 L rolling droplet on 5o inclined
micro-post arrays is about 13 rad/s, which yields the ratio (𝜑) in the order of 700. Therefore,
the dynamic pressure change does not notably influence by the wobbling of the droplet.
Figure 5 shows high-speed camera images of the droplet over the inclined micro-post array
surface. The droplet wobbling results in a transient change of droplet maximum height and
maximum width, which have an effect on the wetting length and advancing and receding
angles of the droplet. Figure 6 shows droplet translational velocity obtained from
experiments and predicted from Eq. 15 after multiplying by rolling droplet hydraulic radius
and the ratio of Vd/R, along the inclined surface. It can be observed that analytical solution
results in similar droplet velocity of those obtained from the experiment. The differences
in droplet velocities is small and can be related to the experimental errors, which is about
5%, and the assumptions made in the analysis, such as constant air-drag force, and uniform
surface texture. Moreover, the droplet translational velocity increases almost parabolically
with the distance despite the magnitude of velocity changes with micro-post gap spacing.
The droplet velocity remains lowest on the plain hydrophobized PDMS surface as
compared to the micro-post array's surface. The gap spacing influences the droplet
translational velocity over the inclined hydrophobized micro-post surface. Increasing gap
spacing enhances the droplet velocity, which is more pronounced for the gap space of b =
50 m. However, in the early stage of droplet rolling, the rate of increase of velocity is
higher for large gap spacing. This demonstrates that air trapped within the gap reduces the
droplet contact area on the hydrophobized surface, which modifies both the shear effect
created over the wetted surface and the lateral component of the surface tension force
because of the reduced three-phase contact line.
In order to evaluate the velocity inside the droplet fluid when rolling over the hydrophobic
PDMS micro-post arrays surfaces, the numerical simulations are carried out adopting the
conditions used in the experiments. Figure 7 shows 3-D velocity and pressure contours
inside the rolling droplet over the micro-post arrays surface at different times. The complex

15
velocity field is created inside droplet fluid and wobbling contributes to flow complexity
in the droplet fluid. It is worth mentioning that wobbling causes variation of the maximum
droplet height and the width. Figure 8a and 8b show velocity and pressure contours inside
the cross-section of the droplet for different micro-post arrays gap spacing and plain
hydrophobized PDMS surface at various rolling durations, respectively. The circulating
flow structures are created in the droplet fluid and the center of circulations changes during
the rolling, which causes the development of a complex flow field inside the droplet fluid.
However, altering the gap spacing of the micro-post arrays, flow structure changes and the
velocity magnitude close to the interface region attains larger values as compared to the
plain PDMS surface. In addition, the maximum velocity magnitude increases for large gap
spacing (b = 50 m) and progression of rolling results in extension of high-velocity region
into the droplet fluid. In this case, increasing gap spacing of micro-post arrays can create
air cushions for the droplet fluid at the interfacial while reducing interfacial contact and
low resistance for rolling. Figure 9 shows droplet velocity predicted from the numerical
simulations and obtained from the experiment via high-speed recorded data, for different
micro-post gap spacings. The droplet velocity predicted agrees well with the experimental
data. As similar to analytical findings, increasing micro-post gap spacing results in
increased droplet velocity. Hence, the trapped air in the micro-post gaps reduces both the
droplet fluid contact area and the wetted length over micro-post array surfaces. In order to
assess the kinetic energy loss for the rolling droplet over micro-post array surface, the ratio
of a kinetic energy change over the potential energy change of the droplet (𝜑 = 𝑉𝑑22𝑔𝑙𝑠𝑖𝑛𝛿,
here Vd is instant droplet velocity, l is the instant distance covered by the droplet over the
inclined micro-post array surface, and is the inclination angle of the surface) is evaluated
over the inclined micro-post array surface for three droplet volumes. Figure 10a shows the
kinetic energy change ratio (𝜑) of the droplet with dimensionless distance along the
inclined micro-post array surface for various micro-post gap spacings and three droplet
volumes. The droplet velocity over hydrophobized plain PDMS surface is also provided for
comparison. The kinetic energy ratio increases with distance along the inclined micro-post
and plain PDMS surfaces. Hence, the kinetic energy ratio increases as the velocity of the
droplet increases (Figure 10a). This demonstrates that the loss of droplet kinetic energy,

16
due to the effect of retarding forces (pinning, shear, and air drag), becomes less as the
droplet velocity increases over the surface. This is related to droplet wobbling during
rolling, which alters advancing and receding angles of the droplet and the wetting length at
the interface; in which case the oscillation in the maximum droplet height reduces. The
gradient of kinetic energy ratio remains larger immediately after initiation of droplet rolling
and it becomes gradual as the distance covered by the rolling droplet increases. Therefore,
the rate of kinetic energy dissipation becomes less in the early rolling period over the
surface. Increasing gap spacing between the micro-posts results in an increased kinetic
energy ratio. This is related to reduced wetting diameter and interfacial area of droplet fluid
over micro-post arrays surface, i.e. increasing gap size reduces droplet fluid wetting length
and area over the micro-post array surface. Moreover, increasing droplet volume gives rise
to an increased kinetic energy ratio for all gap spacings. This indicates that the gravitational
inertia causes droplet velocity enhancement for large droplet volumes, which also gives
rise to less droplet kinetic energy loss during rolling over micro-post array surface.
Figure10b shows droplet kinetic energy dissipation ratio (𝜂 = 1 − 𝑉𝑑2𝑉𝑖𝑑𝑒𝑎𝑙2 , where Videal is the
velocity of a solid droplet having the same volume and without subjecting of the retarding
forces, i.e. rolling like a marble ) with rolling distance along micro-post array surface for
different gap spacing and droplet volumes. The kinetic energy dissipation ratio
demonstrates similar behavior to the kinetic energy ratio. In this case, increasing distance
along the micro-post surface enhances the kinetic dissipation during rolling. Similarly,
increasing micro-post gap spacing reduces the kinetic energy dissipation of the droplet;
hence, the maximum kinetic energy dissipation occurs for plain hydrophobic PDMS
surface. Increasing droplet volume lowers the kinetic energy loss despite the fact that
wetting length and contact area at the interface increase with increasing droplet volume.
This is because gravitational inertial force remains significantly larger than the retardation
forces acting over the rolling droplet.
Droplet Dynamics and Dust on Surface:
Dust is collected from PV panel surfaces via soft brushes and they are uniformly deposited
over micro-post array surfaces having a thickness of about 300 m. The droplet rolling tests

17
are carried out and the droplet motion is recorded accordingly. Dust consists of various
sizes of particles, which are composed of various elements. SEM micrographs of dust are
shown in Figure 11a and 11b. The average size of dust is about 1.2 m and its composition
consists of mainly Si, Ca, Na, K, Mg, O, Cl (Table 1). Dust composition shows that dust
has salt compounds, which can dissolve in water.38 The droplet fluid (water) infusion over
dust remains critical for dust particles to be picked up by rolling droplet fluid.39 In this case,
the coefficient of droplet liquid spreading over the dust surface needs to remain greater than
zero for droplet fluid infusion. The coefficient of liquid spreading (𝑆𝑠−𝑙) over dust surface
is governed by 𝑆𝑠−𝑙 = 𝛾𝑠 − 𝛾𝑠−𝑙 − 𝛾𝑙 , here 𝛾𝑠 is the surface free energy of dust, 𝛾𝑠−𝑙 is
interfacial tension between dust-droplet fluid, and 𝛾𝑙 is droplet fluid surface tension. The
spreading coefficient for droplet fluid (water) is estimated as S = 21.95 mJ/m2, which is
consistent with the early work.39 Hence, water droplet spreads over dust surfaces. Droplet
fluid infusion over dust takes place in two stages. Firstly, the forces created by the surface
tension of droplet fluid and interfacial shear give rise to the formation of a thin layer of
fluid over the wetted dust surface. As the infusion time progresses, the liquid spreading rate
increases in accordance with Joos’ law.40 The spreading velocity in the second stage takes
the form 𝑈𝑠 ∝ (3𝑆𝑠−𝑙/4√𝜇𝑜𝜌𝑜)1/2𝑡−1/4 ), here o and o are viscosity and density of
droplet fluid [41]. As infusion progress over dust surface, the droplet fluid kinetic energy
dissipation occurs under the shearing effect, which can be related to Ohnesorge number
(𝑂ℎ = 𝜇𝑜/√𝜌𝑜𝑎𝛾𝑙), here a represents characteristic size of the dust particle.41,16 For droplet
fluid (water) infusion over averaged size dust (1.2 m), Ohnesorge number becomes greater
than 1; hence, the kinetic energy of infusing liquid is dissipated by a large amount due to
the shearing effect. Figure 11c shows water infusion with time over a dust particle. The
dust particle of size less than 10 m can be covered by infused water within 0.26 s. Since
only the dust particles, which are infused by droplet fluid, can be picked by a rolling droplet,
the residency of droplet wetted length over the dusty surface is expected to be longer than
the total infusion time of droplet fluid covering the particle surface. The contact duration
of the wetting length of the rolling droplet over the dusty surface is estimated as 0.025 s for
droplet wetting length of 2 mm and droplet translation velocity of 80 mm/s. Consequently,
droplet fluid has sufficient time to infuse over the surface of dust during rolling on the dusty
surface. In this case, it is expected that droplet fluid picks the dust particles from the dusty

18
surface during its rolling. Figure 12 shows high speed camera images of droplet rolling
over dusty micro-post array surfaces. The dust particles are picked up by rolling droplet
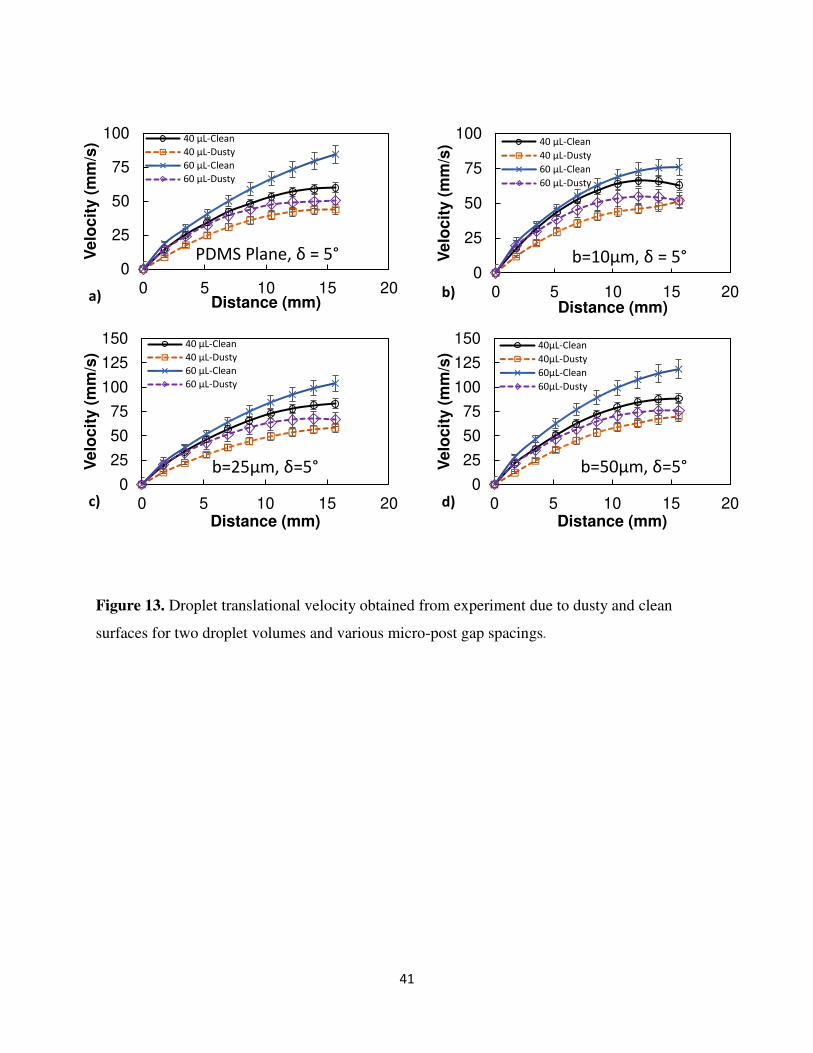
from the surface as rolling progresses. Figure 13 show droplet velocity obtained from the
experiments due to dusty and clean surfaces for two droplet volumes and various micro-
post gap spacings. Droplet velocity attains larger values for clean surface than that of dusty
surface, which is more pronounced for 50 m gap spacing of the micro-post arrays.
Moreover, as droplet volume increases, droplet velocities on the clean and dusty surfaces
become larger than those obtained for small volume droplets. Increasing gravitational force
for large droplet masses causes attainment of high droplet velocity. In addition, increasing
micro-post gap spacing lowers droplet wetting length and interfacial contact area of the
droplet fluid. This contributes to droplet velocity enhancement during rolling on both dusty
and clean surfaces. However, the presence of dust causes droplet deceleration over the
surface, i.e. dust particles act like retarding force centers lowering rolling droplet kinetic
energy. In addition, alkaline salt compounds (NaCl and KCl) in dust can be dissolved in
droplet fluid upon picked up during rolling. This changes the surface tension of droplet
fluid and modifies slightly pinning force between the rolling droplet and dusty micro-post
array surface. The change in surface tension due to the dissolution of salt compounds in
droplet fluid does not notably change droplet fluid surface tension.42 Hence, pinning force
enhancement, due to surface tension increase, does not have a considerable effect on droplet
velocity. To evaluate droplet kinetic energy dissipation over a dusty surface, the kinetic
energy ratio (𝜒) is introduced reference to a clean surface. The kinetic energy loss ratio
takes the form: 𝜁 = 𝑉𝑑−𝑐𝑙𝑒𝑎𝑛2 −𝑉𝑑−𝑑𝑢𝑠𝑡22𝑔𝑙𝑠𝑖𝑛𝛿 , where 𝑉𝑑−𝑐𝑙𝑒𝑎𝑛 and 𝑉𝑑−𝑑𝑢𝑠𝑡𝑦 are droplet velocities on
clean and dusty micro-post arrays surfaces, respectively. Figure 14 shows kinetic energy
loss ratio (𝜁) with distance for different micro-post gap spacings and two droplet volumes.
The kinetic energy loss ratio increases as the distance increases to 8 mm from the location
of initiation of droplet rolling, which is more pronounced for large micro-post spacing.
Therefore, kinetic energy loss ratio becomes larger for large gap spacings. This is because
of magnitude of droplet velocity on clean and dusty micro-post array surfaces. In this case,
increasing gap spacing enhances droplet velocity for both clean and dusty surfaces. As the
distance along the surface, the kinetic energy loss ratio reduces. This indicates that further
increase in distance taking by the rolling droplet along the surface, the kinetic energy loss

19
reduces for all spacing. In addition, the gap spacing has notable effect on the droplet kinetic
energy loss, i.e. for large gap spacing not only the droplet velocity increases, but kinetic
energy ratio also increases. Figure 15 shows optical and scanning electron microscope
images of the droplet path for micro-post gap spacing of 25 m and plain PDMS surface.
Droplet picks up dust particles along its path (Figure 15a and 15b); however, some small
dust residues are observed in gap spacings. The closed examination of dust residues
revealed that only a few small size dust particles are present within micro-post gap spacings
(Figure 15 c and 15d). The presence of the dust residues are related to one or all of the
followings: i) droplet fluid cannot completely infuse over dust surfaces while they are not
picked up by rolling droplet, and/or ii) some dust particles have sharp edges and they can
anchor over the coated micro-post array surfaces, which cannot be picked up by rolling
droplet despite that droplet fluid completely infuses over dust surfaces. Nevertheless, the
number of dust residues remains small within micro-post gap spacings.
CONCLUSION
Rolling droplet behavior over hydrophobized micro-post array surfaces is studied and the
effect of micro-post array spacing on droplet rolling kinematics is examined for clean and
dusty micro-post array surfaces. Experiments are carried out towards monitoring and
assessing droplet rolling behavior in terms of rolling and translational velocities over
hydrophobized inclined micro-post arrays. Micro-post arrays are replicated over
polydimethylsiloxane (PDMS) from initially formed micro-post arrays on silicon wafers
via lithography technique. Micro-post array surfaces are hydrophobized through the
deposition of functionalized silicon nanoparticles via dip coating. Hydrophobized PDMS
micro-post arrays have different gap spacings between the micro-posts. This arrangement
enables to examine droplet rolling behavior over micro-post array surfaces having different
gap spacings. The flow inside the rolling droplet is numerically simulated and the effect of
micro-post gap spacing on the flow structures is predicted. The findings revealed that
micro-post array spacing influences the droplet rolling velocity. In this case, micro-post
gap spacings act like air cushions at droplet interface lowering droplet wetted diameter and
droplet fluid interfacial area. Hence, increasing micro-post spacing results in increased

20
droplet rolling velocity over the surface. The droplet kinetic energy loss increases as the
micro-post spacing reduce, which is associated with an increased lateral component of
surface tension force and enhancement of interfacial shear resistance. Droplet wobbling
during rolling increases the kinetic energy loss, which becomes more apparent for large
volume droplets. The predictions reveal that a complex flow field is formed inside rolling
droplet fluid and velocity magnitude attains large values for large gap spacings. Dust on
micro-post array surfaces are picked up by rolling droplets for all micro-post gap spacings
considered. However, some dust residues are observed in micro-post spacings; provided
that dust residues are not significantly large in amount. The presence of dust contributes to
the kinetic energy dissipation of rolling droplet, which becomes notable for large gap
spacings. This becomes more pronounced for large volume droplets. The present study
explores insight of rolling droplet behavior over hydrophobized clean and dusty micro-post
array surfaces and provides details of influence of gap spacings on droplet dynamic
characteristics.
REFERENCES
1. Wijewardhana, K. R., Shen, T.-Z. & Song, J.-K. Energy harvesting using air bubbles on
hydrophobic surfaces containing embedded charges. Appl. Energy 206, 432–438 (2017).
2. Chenab, K. K., Sohrabi, B. & Rahmanzadeh, A. Superhydrophobicity: advanced
biological and biomedical applications. Biomater. Sci. 7, 3110–3137 (2019).
3. Yilbas, B. S. et al. Stretchable Hydrophobic Surfaces and Self-Cleaning Applications. Sci.
Rep. 9, 1–13 (2019).
4. Zhang, H., Zhou, M., Guo, Z., Lan, X., Zhang, L., Zhang, L. Effect of hydrophobicity on
the interfacial rheological behaviors ofnanoparticles at decane-water interface, Journal of
Molecular Liquids 294 (2019) 111618.
5. Yilbas, B. S., Al‐Sharafi, A. & Sahin, A. Z. Solar energy harvesting and a water droplet
cleaning of micropost arrays surfaces. Int. J. Energy Res. 44, 2072–2083 (2020).
6. Zhou, Y., Hang, T., Li, F. & Li, M. Anti-wetting Cu/Cr coating with micro-posts array
structure fabricated by electrochemical approaches. Appl. Surf. Sci. 271, 369–372 (2013).
7. Kim, D.-H. et al. Experimental and theoretical evaluation of wettability on micro/nano
hierarchically engineered surfaces based on robust micro-post-arrayed-and highly ordered

21
nano-rippled-structures. Appl. Surf. Sci. 257, 8985–8992 (2011).
8. Khadpekar, A. J., Khan, M., Sose, A. & Majumder, A. Low Cost and Lithography-free
stamp fabrication for Microcontact printing. Sci. Rep. 9, 1–8 (2019).
9. Al-Sharafi, A., Yilbas, B. S., Al-Qahtani, H. & Sahin, A. Z. A microchannel flow with
presence of micro-post arrays on channel top wall. Int. J. Therm. Sci. 164, 106883 (2021).
10. Kharati-Koopaee, M. & Rezaee, M. Investigation of turbulent flow through microchannels
consisting of different micropost arrangements. Eng. Comput. (2017).
11. Choudhury, D. et al. Enhanced lubricant film formation through micro-dimpled hard-on-
hard artificial hip joint: An in-situ observation of dimple shape effects. J. Mech. Behav.
Biomed. Mater. 81, 120–129 (2018).
12. Byon, C. & Kim, S. J. Study on the capillary performance of micro-post wicks with non-
homogeneous configurations. Int. J. Heat Mass Transf. 68, 415–421 (2014).
13. Zhu, X., Liao, Q., Sui, P. C. & Djilali, N. Numerical investigation of water droplet
dynamics in a low-temperature fuel cell microchannel: Effect of channel geometry. J.
Power Sources 195, 801–812 (2010).
14. Rahimian, P. et al. Investigation of time dependent water droplet dynamics on porous fuel
cell material via synchrotron based X-ray imaging technique. Exp. Therm. Fluid Sci. 97,
237–245 (2018).
15. Gopalan, P. & Kandlikar, S. G. Effect of channel materials and trapezoidal corner angles
on emerging droplet behavior in proton exchange membrane fuel cell gas channels. J.
Power Sources 248, 230–238 (2014).
16. Anand, S., Rykaczewski, K., Subramanyam, S. B., Beysens, D. & Varanasi, K. K. How
droplets nucleate and grow on liquids and liquid impregnated surfaces. Soft Matter 11,
69–80 (2015).
17. Panchanathan, D., Bourrianne, P., Varanasi, K. K. & McKinley, G. H. Reduced adhesion
of sparkling water droplets. Phys. Rev. Fluids 4, 100505 (2019).
18. Abubakar, A. A., Yilbas, B. S., Al-Qahtani, H. & Hassan, G. Carbonated Water Droplet
Can Ease Dust Mitigation from Hydrophobic Surfaces. Langmuir 36, 10504–10518
(2020).
19. Yilbas, B. S. et al. Dust removal from a hydrophobic surface by rolling fizzy water
droplets. RSC Adv. 10, 19811–19821 (2020).

22
20. Šikalo, Š., Wilhelm, H.-D., Roisman, I. V, Jakirlić, S. & Tropea, C. Dynamic contact
angle of spreading droplets: Experiments and simulations. Phys. Fluids 17, 62103 (2005).
21. Hu, J., Xiong, X., Xiao, H. & Wan, K. Effects of Contact Angle on the Dynamics of
Water Droplet Impingement. in COMSOL Conference (2015).
22. COMSOL Inc. COMSOL Multiphysics. (2017).
23. Yong, W. Y. D., Zhang, Z., Cristobal, G. & Chin, W. S. One-pot synthesis of surface
functionalized spherical silica particles. Colloids Surfaces A Physicochem. Eng. Asp. 460,
151–157 (2014).
24. Heib, F. & Schmitt, M. Statistical Contact Angle Analyses with the High-Precision Drop
Shape Analysis (HPDSA) Approach: Basic Principles and Applications. Coatings vol. 6
(2016).
25. Tracker Program. https://physlets.org/tracker.
26. Bhattacharya, S., Charonko, J. J. & Vlachos, P. P. Particle image velocimetry (PIV)
uncertainty quantification using moment of correlation (MC) plane. Meas. Sci. Technol.
29, 115301 (2018).
27. Solid surface energy data (SFE) for common polymers. http://www.surface-
tension.de/solid-surface-energy.htm.
28. Interfacial Properties of PDMS-Water Systems. https://www.osti.gov/biblio/1264508.
29. Smith, J. D. et al. Droplet mobility on lubricant-impregnated surfaces. Soft Matter 9,
1772–1780 (2013).
30. Yilbas, B. S., Yousaf, M. R., Ali, H. & Al‐Aqeeli, N. Replication of laser‐textured
alumina surfaces by polydimethylsiloxane: Improvement of surface hydrophobicity. J.
Appl. Polym. Sci. 133, (2016).
31. Van Blaaderen, A. & Kentgens, A. P. M. Particle morphology and chemical
microstructure of colloidal silica spheres made from alkoxysilanes. J. Non. Cryst. Solids
149, 161–178 (1992).
32. Abdelmagid, G., Yilbas, B. S., Al-Sharafi, A., Al-Qahtani, H. & Al-Aqeeli, N. Water
droplet on inclined dusty hydrophobic surface: influence of droplet volume on
environmental dust particles removal. RSC Adv. 9, 3582–3596 (2019).
33. Stollery, J. L. Aerodynamics, Aeronautics and Flight Mechanics. (1997).
34. Brochard-Wyart, F., Hervet, H., Redon, C. & Rondelez, F. Spreading of “heavy” droplets:

23
I. Theory. J. Colloid Interface Sci. 142, 518–527 (1991).
35. Aussillous, P. & Quéré, D. Shapes of rolling liquid drops. J. Fluid Mech. 512, 133 (2004).
36. Mahadevan, L. & Pomeau, Y. Rolling droplets. Phys. fluids 11, 2449–2453 (1999).
37. ELKINS‐TANTON, L. T., Aussillous, P., Bico, J., Quere, D. & Bush, J. W. M. A
laboratory model of splash‐form tektites. Meteorit. Planet. Sci. 38, 1331–1340 (2003).
38. Hassan, G., Yilbas, B. S., Said, S. A. M., Al-Aqeeli, N. & Matin, A. Chemo-mechanical
characteristics of mud formed from environmental dust particles in humid ambient air.
Sci. Rep. 6, 1–14 (2016).
39. Hassan, G., Yilbas, B. S. & Al-Qahtani, H. Droplet fluid infusion into a dust layer in
relation to self-cleaning. RSC Adv. 10, 32034–32042 (2020).
40. Bergeron, V. & Langevin, D. Monolayer spreading of polydimethylsiloxane oil on
surfactant solutions. Phys. Rev. Lett. 76, 3152 (1996).
41. Carlson, A., Kim, P., Amberg, G. & Stone, H. A. Short and long time drop dynamics on
lubricated substrates. EPL (Europhysics Lett. 104, 34008 (2013).
42. Al-Sharafi, A., Yilbas, B. S., Ali, H. & Sahin, A. Z. Internal fluidity of a sessile droplet
with the presence of particles on a hydrophobic surface. Numer. Heat Transf. Part A Appl.
70, 1118–1140 (2016).
Acknowledgments
The authors acknowledge the financial support of the Deanship of Scientific Research at King
Fahd University of Petroleum and Minerals (KFUPM) through Projects# DP201016 and King
Abdullah City for Atomic and Renewable Energy (K.A. CARE) to accomplish this work.
Author’s Contribution
A.A. Abubakar did the analytical, numerical and experimental works and contributed to the
writing of the manuscript.
B.S.Yilbas did the research work with the collaboration of other co-authors and wrote the
manuscript.
24
H. Al-Qahtani did some part of the analytical and experimental work and contributed to the
writing of the manuscript.
G. Hassan did some part of the experimental work and contributed to the writing of the
manuscript.
J.E. Adukwu did some part of the experimental work and contributed to the writing of the
manuscript.
Declaration of Interest
The authors declare no competing interests.

25
List of Tables
Table 1. Elemental constitute of dust particles (wt%).

26
List of Figures
Figure 1. a) Five boundary conditions are adopted for the rolling droplet down the micro-post
array surface. b) Geometrical representation of the micro-post array, c) Droplet geometrical
dimensions, d) Forces acting on droplet geometry. The pressure outlet is defined at boundaries 1,
2, and 3. Boundary 4 resembles the interface between the droplet and surrounding, which is free
to deform. Boundary 5 is the wetted wall at which the contact angle and adhesive forces are
defined.
Figure 2. (a) Cross-section of mesh used in simulations, (b) initial location of a droplet in
a 3-dimensional domain, (c) meshes used near droplet.
Figure 3. (a) centerline along which grid independence test is conducted for 40 µL droplet,
inclination angle δ=5°, gap spacing b = 50 µm and t = 0.21 s; (b) velocity magnitude, (c) gauge
pressure.
Figure 4. SEM micrographs of micro-post array surface: a) micro-post on a silicon wafer, b)
micro-post sizing, c) replicated micro-post on PDMS, c) functionalized silica nanoparticles
deposited replicated surface, e) replicated single micro-post, and f) functionalized silica
nanoparticles deposited single micro-post and surroundings.
Figure 5. High-speed camera images of a water droplet on micro-post array surface at different
durations. Droplet size is 40 L, inclination angle = 5o, and micro-post spacing is 25 m.
Figure 6. Comparison of droplet velocity obtained from experiments and analytical formulation
for various gap spacings. Droplet size is 40 L, inclination angle = 5o.
Figure 7. 3D velocity field and pressure distributions inside rolling droplet at different durations.
Droplet volume is 40 µL, the inclination angle is δ=5° and micro-post spacing is 𝑏 = 50 𝜇𝑚.
Figure 8. Velocity and pressure contours in a rolling droplet at different durations for different
micro-post spacings. Droplet volume is 40 µL, the inclination angle is δ=5°. Section cut taken at
the cross-sectional plane (𝑦 = 0).
Figure 9. Droplet translational velocity obtained from experiment and simulations for various
micro-post gap scrapings. for 40 µL droplet, δ = 5°. Droplet volume is 40 µL, the inclination
angle is δ=5°.

27
Figure 10. a) Droplet kinetic energy change ratio (𝜑) and b) droplet kinetic energy
dissipation ratio (𝜂) for various micro-post gap spacings.
Figure 11. SEM micrographs of dust and infusion velocity of water over dust particle: a) dust
particles with various sizes, b) dust particles with various shapes, and c) infusion velocity of
water over dust particle.
Figure 12. High-speed camera images of water droplets over dusty micro-post array surfaces at
different time durations.
Figure 13. Droplet translational velocity obtained from experiment due to dusty and clean
surfaces for two droplet volumes and various micro-post gap spacings.
Figure 14. Droplet kinetic energy loss ratio (𝜁) for various micro-post gap spacings.
Figure 15. Optical and SEM images of droplet path and dust residues: a) optical image of droplet
path on plain PDMS, b) optical image of droplet path on micro-post arrays with 25 m gap spacing,
c) optical image of micro-post array surface within droplet optical path (red dotted circles show
dust residues), and d) SEM micrograph of dust residues within droplet path.

28
Table 1. Elemental composition of dust particles (wt%).
Size Si Ca Na S Mg K Fe Cl O
Collected Dust 1.2 m 11.2 8.1 2.2 1.3 2.4 0.8 1.1 0.4 Balance
Collected Dust < 1.2 m 10.4 7.4 2.6 2.2 1.4 1.1 1.1 0.9 Balance

29
Figure 1. a) Five boundary conditions are adopted for the rolling droplet down the micro-post
array surface. b) Geometrical representation of the micro-post array, c) Droplet geometrical
dimensions, d) Forces acting on droplet geometry. The pressure outlet is defined at boundaries 1,
2, and 3. Boundary 4 resembles the interface between the droplet and surrounding, which is free
to deform. Boundary 5 is the wetted wall at which the contact angle and adhesive forces are
defined.

30
Figure 2. (a) Cross-section of mesh used in simulations, (b) initial location of a droplet in
a 3-dimensional domain, (c) meshes used near droplet.
(a)
(b) (c)

31
Figure 3. (a) centerline along which grid independence test is conducted for 40 µL droplet,
inclination angle δ=5°, gap spacing b = 50 µm and t = 0.21 s; (b) velocity magnitude, (c) gauge
pressure.
a)
b)
c)

32
Figure 4. SEM micrographs of micro-post array surface: a) micro-post on a silicon wafer, b)
micro-post sizing, c) replicated micro-post on PDMS, c) functionalized silica nanoparticles
deposited replicated surface, e) replicated single micro-post, and f) functionalized silica
nanoparticles deposited single micro-post and surroundings.
a) b)
c) d)
e) f)

33
Figure 5. High-speed camera images of a water droplet on micro-post array surface at different
durations. Droplet size is 40 L, inclination angle = 5o, and micro-post spacing is 25 m.
t = 0.001 s
t = 0.101 s
t = 0.240 s
t = 0.325 s
1 mm
1 mm
1 mm
1 mm

34
Figure 6. Comparison of droplet velocity obtained from experiments and analytical formulation
for various gap spacings. Droplet size is 40 L, inclination angle = 5o.
0
20
40
60
80
0 5 10 15 20
Ve
loc
ity (
mm
/s)
Distance (mm)
Plane-Exp
Plane-Pred
0
20
40
60
80
100
0 5 10 15 20
Ve
loc
ity (
mm
/s)
Distance (mm)
b=10μm-Exp
b=10μm-Pred
0
20
40
60
80
100
120
0 5 10 15 20
Ve
loc
ity (
mm
/s)
Distance (mm)
b=25μm-Exp
b=25μm-Pred
0
20
40
60
80
100
120
0 5 10 15 20
Ve
loc
ity (
mm
/s)
Distance (mm)
b=50μm-Exp
b=50μm-Pred

35
Figure 7. 3D velocity field and pressure distributions inside rolling droplet at different durations.
Droplet volume is 40 µL, the inclination angle is δ=5° and micro-post spacing is 𝑏 = 50 𝜇𝑚.

36
Figure 8. Velocity and pressure contours in a rolling droplet at different durations for different
micro-post spacings. Droplet volume is 40 µL, the inclination angle is δ=5°. Section cut taken at
the cross-sectional plane (𝑦 = 0).

37
Figure 9. Droplet translational velocity obtained from experiment and simulations for various
micro-post gap scrapings. for 40 µL droplet, δ = 5°. Droplet volume is 40 µL, the inclination
angle is δ=5°.
0
20
40
60
80
100
0 5 10 15 20
Ve
loc
ity (
mm
/s)
Distance (mm)
Plane-Experiment
Plane-Numerical
0
20
40
60
80
100
0 5 10 15 20
Ve
loc
ity (
mm
/s)
Distance (mm)
b=10μm-Experiment
b=10μm-Numerical
0
20
40
60
80
100
120
0 5 10 15 20
Ve
loc
ity (
mm
/s)
Distance (mm)
b=25μm-Experiment
b=25μm-Numerical
0
20
40
60
80
100
120
0 5 10 15 20
Ve
loc
ity (
mm
/s)
Distance (mm)
b=50μm-Experiment
b=50μm-Numerical

38
Figure 10. a) Droplet kinetic energy change ratio (𝜑) and b) droplet kinetic energy
dissipation ratio (𝜂) for various micro-post gap spacings.
0.00
0.10
0.20
0.30
0.40
0 5 10 15 20 25
φ
Distance (mm)
PDMS plane
b=10µm
b=25µm
b=50µm
0.50
0.60
0.70
0.80
0.90
1.00
0 5 10 15 20 25
η
Distance (mm)
PDMS plane
b=10µm
b=25µm
b=50µm
a)
b)

39
Figure 11. SEM micrographs of dust and infusion velocity of water over dust particle: a) dust
particles with various sizes, b) dust particles with various shapes, and c) infusion velocity of
water over dust particle.
0
100
200
300
400
0.00 0.05 0.10 0.15 0.20 0.25 0.30
Velo
cit
y (
mm
/s)
Time (s)
a) b)
c)

40
Figure 12. High-speed camera images of water droplets over dusty micro-post array surfaces at
different time durations.
t = 0.009 s
t = 0.147 s
t = 0.337 s
t = 0.457 s
1 mm
1 mm
1 mm
1 mm
41
Figure 13. Droplet translational velocity obtained from experiment due to dusty and clean
surfaces for two droplet volumes and various micro-post gap spacings.
0
25
50
75
100
0 5 10 15 20
Ve
loc
ity (
mm
/s)
Distance (mm)
40 μL-Clean
40 μL-Dusty
60 μL-Clean
60 μL-Dusty
PDMS Plane, δ = 5°0
25
50
75
100
0 5 10 15 20
Ve
loc
ity (
mm
/s)
Distance (mm)
40 μL-Clean
40 μL-Dusty
60 μL-Clean
60 μL-Dusty
b=10µm, δ = 5°
0
25
50
75
100
125
150
0 5 10 15 20
Ve
loc
ity (
mm
/s)
Distance (mm)
40 μL-Clean
40 μL-Dusty
60 μL-Clean
60 μL-Dusty
b=25µm, δ=5°0
25
50
75
100
125
150
0 5 10 15 20
Ve
loc
ity (
mm
/s)
Distance (mm)
40μL-Clean
40μL-Dusty
60μL-Clean
60μL-Dusty
b=50µm, δ=5°
a)
c)
b)
d)

42
Figure 14. Droplet kinetic energy loss ratio (𝜁) for various micro-post gap spacings.
0.0
0.1
0.2
0.3
0.4
0 5 10 15 20 25
x
Distance (mm)
b=50µm
b=25µm
b=10µm
PDMS plane

43
Figure 15. Optical and SEM images of droplet path and dust residues: a) optical image of droplet
path on plain PDMS, b) optical image of droplet path on micro-post arrays with 25 m gap spacing,
c) optical image of micro-post array surface within droplet optical path (red dotted circles show
dust residues), and d) SEM micrograph of dust residues within droplet path.
a)
b)
c) d)

Figures
Figure 1
a) Five boundary conditions are adopted for the rolling droplet down the micro-post array surface. b)Geometrical representation of the micro-post array, c) Droplet geometrical dimensions, d) Forces actingon droplet geometry. The pressure outlet is de�ned at boundaries 1, 2, and 3. Boundary 4 resembles theinterface between the droplet and surrounding, which is free to deform. Boundary 5 is the wetted wall atwhich the contact angle and adhesive forces are de�ned.

Figure 2
(a) Cross-section of mesh used in simulations, (b) initial location of a droplet in a 3-dimensional domain,(c) meshes used near droplet.

Figure 3
(a) centerline along which grid independence test is conducted for 40 µL droplet, inclination angle δ=5°,gap spacing b = 50 µm and t = 0.21 s; (b) velocity magnitude, (c) gauge pressure.

Figure 4
SEM micrographs of micro-post array surface: a) micro-post on a silicon wafer, b) micro-post sizing, c)replicated micro-post on PDMS, c) functionalized silica nanoparticles deposited replicated surface, e)replicated single micro-post, and f) functionalized silica nanoparticles deposited single micro-post andsurroundings.

Figure 5
High-speed camera images of a water droplet on micro-post array surface at different durations. Dropletsize is 40 µL, inclination angle δ=5°, and micro-post spacing is 25 µm.
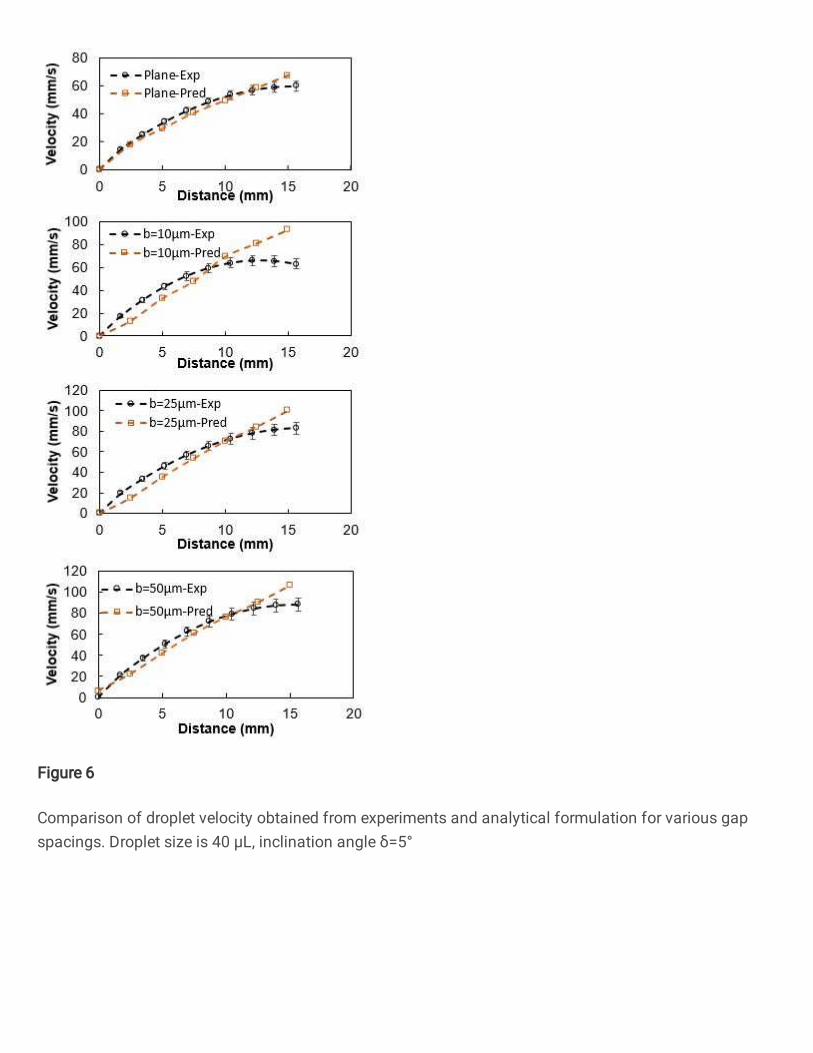
Figure 6
Comparison of droplet velocity obtained from experiments and analytical formulation for various gapspacings. Droplet size is 40 µL, inclination angle δ=5°

Figure 7
3D velocity �eld and pressure distributions inside rolling droplet at different durations. Droplet volume is40 µL, the inclination angle is δ=5° and micro-post spacing is b=50 μm.

Figure 8
Velocity and pressure contours in a rolling droplet at different durations for different micro-post spacings.Droplet volume is 40 µL, the inclination angle is δ=5°. Section cut taken at the cross-sectional plane (y=0).

Figure 9
Droplet translational velocity obtained from experiment and simulations for various micro-post gapscrapings. for 40 µL droplet, δ = 5°. Droplet volume is 40 µL, the inclination angle is δ=5°.

Figure 10
a) Droplet kinetic energy change ratio (φ) and b) droplet kinetic energy dissipation ratio (η) for variousmicro-post gap spacings.

Figure 11
SEM micrographs of dust and infusion velocity of water over dust particle: a) dust particles with varioussizes, b) dust particles with various shapes, and c) infusion velocity of water over dust particle.
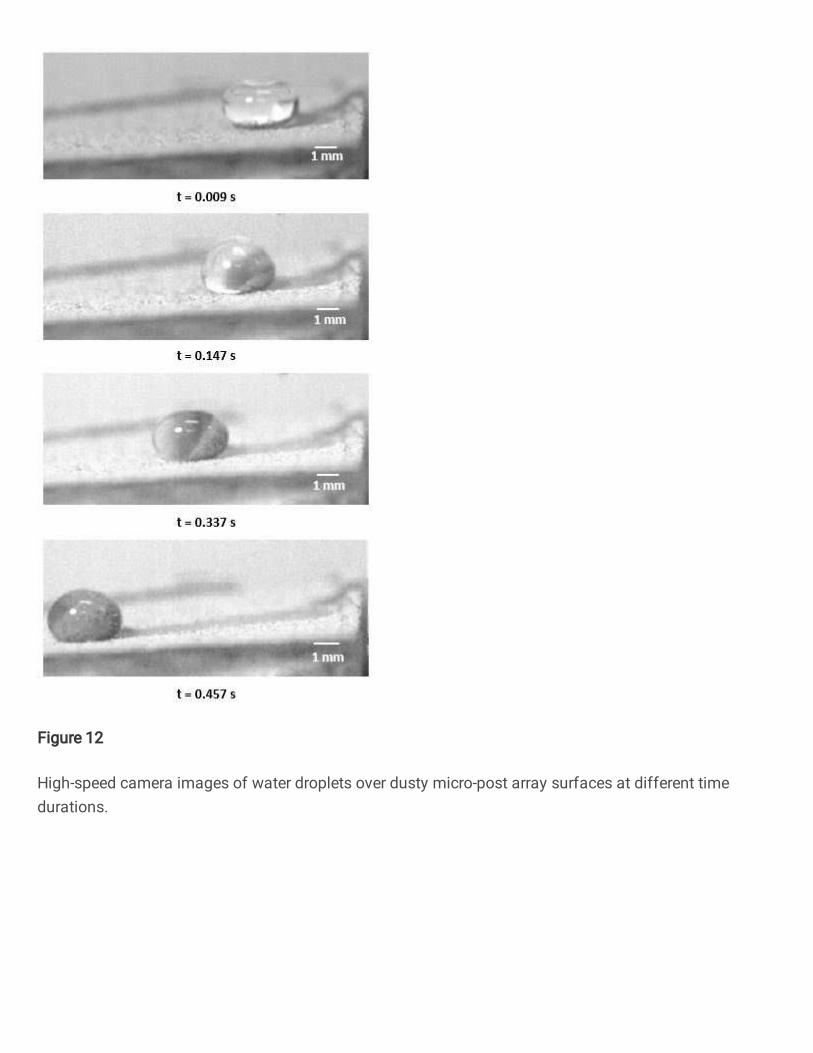
Figure 12
High-speed camera images of water droplets over dusty micro-post array surfaces at different timedurations.

Figure 13
Droplet translational velocity obtained from experiment due to dusty and clean surfaces for two dropletvolumes and various micro-post gap spacings.
Figure 14
Droplet kinetic energy loss ratio (ζ) for various micro-post gap spacings.

Figure 15
Optical and SEM images of droplet path and dust residues: a) optical image of droplet path on plainPDMS, b) optical image of droplet path on micro-post arrays with 25 µm gap spacing, c) optical image ofmicro-post array surface within droplet optical path (red dotted circles show dust residues), and d) SEMmicrograph of dust residues within droplet path.
Recommended