
Management of Voltages in LV Networks Final Report
Prepared by: Nurul Izzah Mohammad Afandi
APQRC, University of Wollongong
21 February 2020

1
1 Executive Summary
The project ‘Management of Voltages in LV Networks’ was jointly funded by Energy Networks
Australia (ENA) and the Australian Power Institute (API) to compare the efficiency of different
solutions to manage voltage issues in LV networks. This project is a collaboration between the
University of Wollongong (UOW) and a consortium of Australian Distribution Network Service
Providers (DNSPs), specifically, Energy Queensland, Jemena, SA Power Networks and United Energy.
This report describes the project progress and outcomes from conception to final completion.
The original project scope called for modelling of a finite number of ‘typical’ low voltage (LV)
distribution networks. However, LV networks are generally unique with vastly different topologies,
design/constructions and load connections. In short, determining ‘typical’ LV networks that can
broadly reflect all LV networks across Australia is an extreme challenge. Consequently, a change of
project scope was requested by the industry partners (i.e., the consortium of DNSPs). The revised
scope for the project was to develop a highly flexible modelling tool (FlexiNMT) that could simulate a
wide range of LV network topologies. This change of scope was endorsed by the industry partners and
was also approved by the ENA asset management committee.
Due to the change of scope, the revised deliverables for Milestone 3, which were agreed to by all
industry partners, are as follows:
1. Completion of modelling tool development
2. Completion of solar photovoltaic (PV) inverter testing in the laboratory
3. Validation of the modelling tool using realistic networks
4. Collation of the final report
All of the above deliverables have been achieved by the project team. An effective project team has
been established between both UOW and DNSP staff. Regular team meetings (generally monthly)
have been held to discuss project progress and roadblocks, if any. Face to face meetings have also
been held every few months to discuss important project milestones. In addition, knowledge sharing
systems have been established and efficiently used by all team members to share relevant project
related information.
In addition to addressing all deliverables, this report also outlines the project challenges,
recommendations and next steps.
2
Contents 1 Executive Summary ......................................................................................................................... 1
2 Introduction/Objectives .................................................................................................................. 3
2.1 Report Layout .......................................................................................................................... 3
2.2 Accompanying Documents ..................................................................................................... 4
3 Literature Review ............................................................................................................................ 5
3.1 Voltage Issues in LV Networks ................................................................................................ 5
3.1.1 Modelling LV Networks ................................................................................................... 5
3.2 Voltage Management in LV Networks .................................................................................... 6
3.2.1 Distribution Transformers with On-Load Tap Changer (OLTC) ....................................... 6
3.2.2 LV Regulators .................................................................................................................. 6
3.2.3 Distribution Static Var Compensation ............................................................................. 7
3.2.4 Solar PV Inverter Control ................................................................................................ 7
3.2.5 Demand Response .......................................................................................................... 8
3.2.6 Battery Energy Storage Systems ..................................................................................... 8
3.2.7 Virtual Power Plant (VPP) and Smart Grids ..................................................................... 8
4 Modelling Tool Development ....................................................................................................... 10
4.1 Modelling Tool Details .......................................................................................................... 10
4.2 Milestone 3 Deliverables/Outcomes .................................................................................... 11
4.2.1 Completion of modelling tool development ................................................................. 11
4.2.2 Validation of modelling tool using realistic networks ................................................... 11
4.2.2.1 Validation Results .............................................................................................................. 11
5 Inverter Performance Evaluation .................................................................................................. 14
6 Conclusion and Recommendations............................................................................................... 16
6.1 Recommendations for Further Refinement of Modelling Tool ............................................ 16
6.2 Next Steps ............................................................................................................................. 16
7 Acknowledgement ........................................................................................................................ 18
9 References .................................................................................................................................... 19
10 Appendix ................................................................................................................................... 21
10.1 Endorsement by Participating Members .............................................................................. 21

3
2 Introduction/Objectives
The increasing penetration of PV systems and other distributed generation sources is increasing the
‘dynamic range’ of energy flows in LV networks. In some areas of high PV penetration in distribution
networks, swings from import to export energy are exceeding the limits of existing voltage regulation
standards as well as causing incidence of reverse power flows. The voltage excursions resulting from
high penetration of distributed generation can cause a range of network and customer issues
including:
Difficulty in maintaining compliance with voltage standards or codes for DNSPs
Disconnection and associated loss of revenue for customer solar PV inverters
Adverse impacts on customer equipment, including premature failure, due to sustained
overvoltage conditions
To accommodate the forecast uptake of distributed generation, DNSPs have undertaken various
different network and non-network approaches to find the most efficient solution to manage voltage
issues in LV networks. This project aims to compile these management strategies in order to help
DNSPs study the performance of these strategies before practical implementation on realistic
networks.
The objectives of the original project scope called for the following:
Undertaking a literature review to determine current state-of-the-art with respect to DNSP
voltage management strategies as they relate to management of high penetration of distributed
generation
Modelling of a finite number of ‘typical’ low voltage (LV) distribution networks
Undertaking laboratory assessment of the capability of a range of inverter voltage management
control modes for residential scale solar PV inverters
Shortly after project commencement, it became clear that modelling a finite (small) number of
‘typical’ LV feeders would limit the applicability of the project as the wide variation in LV network
topology across DNSPs precluded effective identification of ‘typical’ LV networks. Consequently, a
change of scope was adopted with emphasis now being placed on development of a highly flexible
modelling tool that could be applied to a wide range of LV network topologies. The modelling tool
allows DNSPs to model various types of LV networks easily and offers a selection of voltage
management strategies commonly adopted in LV networks.
2.1 Report Layout
This report describes the project progress and outcomes from conception to final completion. The
report is organised as follows:
Section 3 contains the literature review that has been undertaken for the project. The literature
review examines the impacts of distributed generation (particularly solar PV) on voltage
management and investigates the current suite of techniques and technologies which are
available to assist DNSPs with mitigation of any issues related to voltage compliance caused by
distributed generation.
Section 4 describes the development of the modelling tool from implementation through to
completion. This includes verification of tool performance against a commercial software package
and using practical data supplied by DNSP partners.

4
Section 4.2.2.1 contains the outcomes of the inverter laboratory performance evaluation.
Section 6 contains conclusions as well as a range of recommendations for further development of
the modelling tool in order to increase functionality and useability.
2.2 Accompanying Documents
The following documents provide further details on project activities and deliverables and should be
read in conjunction with this report
1. FlexiNMT, Flexible LV network modelling tool - Manual
2. Inverter testing project report

5
3 Literature Review
3.1 Voltage Issues in LV Networks
In Australia, the penetration of solar PV in the LV network is amongst the highest across the world
with 29% of South Australian and 28% of Queensland properties having rooftop solar PV installed [1,
2]. A rapid increase in the number of PV installations including battery storage has been driven by
generous solar feed-in tariff schemes, government subsidies and low/no interest rate schemes being
offered by DNSPs and energy retailers [3]. The rate of installation of PV systems is expected to double
the currently installed capacity by 2030.
A typical household uses approximately 24 kWh/day, of which 8-10 kWh are consumed during the
daytime whilst the PV system will be generating depending on climatic conditions. Given this rate of
consumption, to satisfy self-consumption would require a PV system size between 2.5 and 3 kW,
however in practice, consumers are more likely to purchase systems between 3.5 - 4 kW because it is
the most economical choice for consumers under current government subsidies [4]. An oversized PV
system results in excess power being exported to the grid during times of low load. At these times it
is also likely that neighbouring systems are also self-consuming or exporting power. Depending on the
exact circumstances, export of significant amounts of energy can lead to over voltage in the grid and
increased phase unbalance in the case of single phase connections.
DNSPs in Australia have reported noticeable effects related to voltage rise due to solar PV connections
in LV networks. During high PV penetration in PV-rich networks, PV systems disconnect during
instances of overvoltage and attempt to reconnect after acceptable network conditions have been
detected [5]. This cycle of disconnection and reconnection of PV systems contributes to voltage
fluctuations, rendering the increasing installation of PV systems a significant concern.
Conversely, peak demand typically occurs later in the evening when PV systems are no longer
generating active power. The off-load tap changer at distribution transformers are traditionally set to
produce voltages at the upper end of the allowable range to cater for voltage drop during peak
demand. This design process leaves little headroom for PV penetration during the day. The mismatch
between peak demand and peak PV penetration can cause voltage levels in the distribution network
to swing between two extremes in a day. This may result in decreased asset life due to increased
operation of voltage regulation devices.
Lack of visibility in LV network by DNSPs [6-8] does not allow DNSPs to easily monitor and actively
control power quality in LV networks. The majority of voltage issues are reported via customer queries
or complaints. DNSPs are implementing varied strategies to increase visibility in the LV network, this
includes the mandatory roll out of smart meters by the Victorian Government completed in 2016 [9],
and the market based opt-in strategy implemented in New South Wales.
3.1.1 Modelling LV Networks
In comparison to high voltage (HV) and medium voltage (MV) networks, LV networks are not usually
modelled and monitored by DNSPs. This is due to various reasons including the fact that LV networks
are vastly different, have highly variable loads, inherent unbalance, different designs/constructions
and inadequate data capture. LV networks in Australia are generally designed as an untransposed,
four-wire system which includes a neutral conductor. This further complicates LV network modelling,
and as such, the neutral conductor is usually ignored in LV network models. This might result in

6
inaccurate reflection of realistic voltage issues in LV networks, especially the ones with a high level of
voltage unbalance.
3.2 Voltage Management in LV Networks
In Australia, the power quality issues identified by DNSPs associated with widespread connection of
PV systems on the LV distribution network are predominantly voltage rise. These issues have been
investigated both individually and collaboratively by DNSPs through projects such as the ARENA
Residential Solar & Storage Program [10]. The following sections detail a range of techniques and
technologies that have either been trialled or are currently in use by DNSPs to assist with management
of voltage levels in LV networks, and in particular, mitigation of voltage rise due to distributed solar
PV generation.
3.2.1 Distribution Transformers with On-Load Tap Changer (OLTC)
Traditional distribution transformers in Australia incorporate off-load tap changers, with voltage
variation managed at the MV level through a combination of OLTC transformers at the zone substation
with voltage regulators on each feeder [11]. United Energy conducted trials of pole mount and ground
mount distribution transformers with OLTC to improve the voltage regulation in networks that
regularly experience voltages nearing or exceeding prescribed limits [12]. United Energy found that
existing voltage management strategies (OLTC at the zone substation) did not react fast enough for
changing load profiles (such as sudden changes in PV penetration). Further, it was found that using
OLTC at the distribution transformer would also permit connection of additional PV systems due to
the enhanced voltage management. Preliminary results from the trial show enhanced voltage
regulation, particularly for over-voltage situations at customer premises, however technical detail is
yet to be released on the effectiveness of the trial from technical and economical standpoints.
3.2.2 LV Regulators
United Energy trialled self-automated LV regulators to address steady state voltage issues including
overvoltage, undervoltage, sags and swells [13]. Data collected from smart meters and power quality
analysers that were installed upstream and downstream of the LV regulators, and historical
parameters from the regulators are used to assess the performance of these regulators in the
network. The LV regulators will buck or boost the output voltage depending on whether the input
voltage is too low or too high, with the voltage reference set at 230 V. Findings from the trial have
shown that the regulators have been successful at voltage regulation and mitigating voltage events in
particular the local overvoltages due to high PV penetration. The trial recommendations include using
LV regulators rated at 30 kVA per phase and installing the regulators closer to supplying transformers
to include more customers in the voltage regulation as well as decrease the capital and operating
costs.
Ergon Energy conducted trials on LV regulators in single wire earth return (SWER) and remote rural
networks as the device is well-sized for the smaller loads commonly found in rural environments [14].
On the majority of occasions, the installed LV regulators improved voltage regulation, voltage
unbalance, sags and swells. However, there was a variety of scenarios where the regulator operation
could result in a notable power quality event (such as voltage unbalance at the output of the regulator
especially when the input voltage for one or two phases was outside the minimum or maximum
controllable input voltage of the regulator).

7
3.2.3 Distribution Static Var Compensation
Ergon Energy trialled a combination of 5 kvar single-phase and 20 kvar three-phase static var
compensators within representative locations in their network following comprehensive computer
modelling. The results in the field trials were comparable with the computer simulations, showing
improved voltage regulation during the evening load peak maintaining within prescribed limits [15].
An additional benefit observed from these installations was the ability to balance phase voltage by
individually controlling the amount of connected capacitance or inductance to each phase [4].
Energex trialled two three-phase 20 kvar/phase units with individual phase control alongside
15 kWh/phase battery storage designed for peak shaving on a 161 customer distribution network. The
outcomes of the trial showed a decrease in phase unbalance by 75% due to the ability to individually
control reactive capacity on each phase [15]. Improvement in power factor at the zone substation
during the test period (9:00-16:00) and improved voltage regulation for periods of both high and low
voltage were realised [7].
3.2.4 Solar PV Inverter Control
Australian Standard AS4777.2:2015 dictates the power factor of grid connected inverters must
operate within 0.95 lag to 0.95 lead at output current from 25% to 100% of maximum inverter output
unless operating in a power quality response mode (e.g. volt/var control mode) [16]. When enabled,
volt/var response mode defined in AS4777.2:2015 allows inverters with the functionality to adjust the
output power factor within 0.7 lag to 0.7 lead depending on the measured grid voltage as shown in
Table 3-1. This provides provision for the inverter to assist management of grid voltage by injecting
reactive power when the voltage is low and absorbing reactive power when the voltage is high.
Table 3-1: Volt/var response set points for reference voltages [16]
Reference Default values for VAr level
(VAr % rated VA) Minimum range
V1 30% leading 0 - 60% leading
V2 0 0
V3 0 0
V4 30% lagging 0 - 60% lagging
United Energy completed a comparison between the various power quality response modes defined
in AS4777.2:2015, investigating the ease and cost of implementation. The study concluded that
volt/var control mode should not be implemented other than under particular circumstances when
voltage levels are regularly non-compliant due to solar PV penetration. The reasons for not
implementing volt/var control mode relates to a lack of market structure to incentivise consumers to
participate in power quality management [17].
To avoid the need to create a market for customers to be incentivised for var import or export, Ergon
Energy suggested funding the cost difference and over-sizing customer owned inverters to allow the
customer to export maximum real power, whilst maintaining sufficient capacity for reactive power
import or export by adjusting the power factor with volt/var control [4]. Extensive computer
simulations and a field trial of 14 customers connected to a 100 kVA transformer; 8 customers with
volt/var control mode (32 kW) and a further 15 kW operating at unity power factor were completed.
The results showed a vast improvement in voltage regulation when operating the inverters with
volt/var control mode, with most customers able to export more real power due to the improved

8
voltage regulation, which is a contrary finding to that presented in the investigation undertaken in
[17]. The simulation results showed a 40% increase in energy output when inverters were operating
at fixed 0.9 lagging power factor which was attributed to less overvoltage disconnections when the
grid voltage reached the maximum level [18, 19].
3.2.5 Demand Response
United Energy has been at the forefront of a demand response project supported by the ARENA
Advancing Renewables Programme. The project received $5.76M in funding to deliver initiatives that
would contribute to the delivery of 200 MW of demand response capacity in Australia by 2020 [20].
The project centred on conservation voltage reduction (CVR), a proven method of reducing real power
flow during high load periods as demonstrated in [21]. The CVR philosophy is a component in the
justification for the 230 V nominal voltage change in Queensland [22]. CVR was made possible by using
the OLTC at zone substations but required upgraded voltage regulation relays that allow voltage float
settings. Smart meters at customer premises were used to trigger demand response events. This
method was proven to be effective at managing voltage within the statutory limits due to the
measuring and trigger point for demand response located at customer premises [22, 23]. An
interesting finding is that CVR was more effective in the winter months, likely due to the increased
resistive loads operating in the cooler months from heating which is more responsive to voltage
change [24]. The load sensitivity to voltage was 0.75%/% ΔP/ΔV in winter compared to 0.69%/% ΔP/ΔV
in summer.
3.2.6 Battery Energy Storage Systems
A number of Australian DNSPs have trialled battery installations at customer premises and distribution
substations. United Energy targeted installation of PV and energy storage systems in areas of the
network with a constrained distribution substation, with the objective to understand if this installation
could defer or eliminate augmentation of the supply utilising peak shaving [10]. The trial also aimed
to determine if the solution was commercially and operationally viable [9]. Based on the trial, network
augmentation deferral between 4 to 14 years can be achievable using the installed PV and energy
storage systems. This deferral period would be higher if the communication system was reliable, and
was expected to be improved by the National Broadband Network (NBN) rollout.
Energex have completed field trials using variable DSTATCOMs and energy storage systems for
volt/var control and peak shaving. The results demonstrated improved power flow through the LV
network during both high and low load cases with a high penetration of solar PV [7]. Ergon Energy
trialled two 25 kVA 100 kWh single-phase energy storage units and ten 6 kVA 20 kWh single-phase
energy storage units throughout an LV distribution network to assess the potential of these energy
storage systems to reduce peak load and avoid or delay network augmentation [4]. The energy storage
systems were operated in volt/var control mode, with the smaller units deployed at residential
premises with PV systems installed. The units were set to charge during off-peak and discharge during
peak periods throughout the day, the reactive power was controlled using a typical 4 quadrant control
algorithm. The outcomes of this trial showed the volt/var control mode had successfully improved the
voltage level during low load periods and peak load periods [25].
3.2.7 Virtual Power Plant (VPP) and Smart Grids
The AGL managed South Australian VPP project has been widely recognised as the largest VPP in
Australia to date with more than 1000 energy storage systems installed. Completion of stage 3 of the
project will form a coordinated system allowing dispatch of 5 MW on demand. The control algorithms
are co-optimised to maximise self-consumption of energy first, then power export to the grid. The

9
project has encountered a number of overvoltage issues within the distribution network the VPP
operates, which appear yet to be addressed [26]. Aggregated energy dispatch trials were completed
during evening load peaks in summer 2017, identifying a number of issues with the way power was
exported. Using a target power set point for each individual system occasionally resulted in system
overvoltage, tripping the inverter during battery discharge. The overall output was also variable during
coordinated dispatch after cloudy days due to the varied state of charge of battery systems. Positive
outcomes were the fast response, allowing the VPP to participate in South Australia’s frequency
control and ancillary services (FCAS) market, and reduced solar export (due to increased self-
consumption) which has been identified as a key enabler to increased PV penetration [1].
A project to develop a VPP structure that benefits both consumers and DNSPs, leveraging PV and
energy storage systems and demand response was initiated in 2014 by the CSIRO and funded by
ARENA under the knowledge sharing program [27]. The outcomes of the project included:
Network simulation models to assess the performance of control strategies
Development of a coordinated control system involving active management of controllable
loads, energy storage systems and reactive power
Development of aggregation control system for use by DNPSs to provide reliable and location
specific network services
Pilot scale deployment of technologies for more than a year to test the proposed solutions
Increased active power export from solar PV systems was seen during the pilot trial through the use
of inverter volt/var control mode, where grid voltage could be controlled by adjusting the power
factor. The project demonstrated a successful implementation of a VPP that benefited participants,
whilst also providing necessary support services for the DNSP. The control algorithms could
simultaneously optimise use of demand response, PV generation and energy storage systems, and is
fully scalable to larger installations across the nation.

10
4 Modelling Tool Development
4.1 Modelling Tool Details
OpenDSS was selected as the software platform for modelling tool development. A Microsoft Excel
graphical user interface (GUI) has been developed to interface with OpenDSS in order to allow user
input and provide graphical output of both the simulation results as well as a graphical representation
of the network which is being modelled.
The modelling tool has the following capabilities:
It can construct networks consisting of three-phase and single-phase conductors including the
neutral conductor (3-phase 4-wire and 1-phase 2-wire lines)
It allows users to select from a number of the most common overhead conductor and
underground cable types
It allows users to enter customised data for conductor and pole geometry
It allows users to include multiple loads, solar PV and energy storage systems at any bus in the
network
It allows users to modify the neutral grounding impedance at the distribution substation and load
connections
It can draw (i.e. provide a graphical representation) the schematic diagram of a network that the
user is building
It allows users to run either snapshot or time-series simulations with time varying loads and
generation as well as varying stiff voltage at the distribution transformer
It can export simulation results and network plots with minimal user input
It gives the option for voltage management using the following techniques:
o OLTC at the distribution substation
o LV regulators (three-phase and single-phase)
o PV inverter control (volt/var or volt/watt)
o DSTATCOM
o Energy storage inverter control
A manual for the modelling tool has been developed which contains the full details of the capabilities,
applications and limitations of the modelling tool, guidance on how to use the modelling tool and
breakdowns of each component model.

11
4.2 Milestone 3 Deliverables/Outcomes
The Milestone 3 deliverables for the modelling tool which were agreed to by all DNSP partners are as
follows:
1. Completion of the modelling tool development
2. Validation of modelling tool using realistic networks
Overall, each deliverable for Milestone 3 has been met. Specific details for each deliverable are
discussed below.
4.2.1 Completion of modelling tool development
A second beta version of the modelling tool was released to industry partners on 9th August 2019.
During the API Energy innovation Summit on 27 – 28th August 2019, the team members presented the
beta version of the modelling tool to all participants. Based on the feedback received during the
summit, the modelling tool has been updated as required in order to meet the specifications of the
project plan.
The final modelling tool update includes:
Minor bug fixes
The inclusion of voltage management strategies using DSTATCOM and energy storage inverter
Changes to low voltage regulator component model to electronic model
In addition to the feedback directly relevant to the development of the modelling tool as per
requirements in the project plan, the team members also received other valuable recommendations
beneficial to the continuous development of the modelling tool. Since the recommendations could
not be implemented in this project, these recommendations became the basis to an extension of the
project to the implementation phase (as described in Section 6.1).
4.2.2 Validation of modelling tool using realistic networks
Validation of the modelling tool involved comparison of modelling tool output with different
distribution network modelling software as well as validation against smart meter readings in a
realistic LV network. Industry partners provided several LV network models in PowerFactory. Four
different LV networks were selected based on topologies, conductor/cable types and loading
conditions. All four networks are modelled in the modelling tool and results obtained are compared
against PowerFactory models. Additionally, a realistic LV network is modelled and simulated in the
modelling tool and results obtained are compared against smart meter measurement.
4.2.2.1 Validation Results
4.2.2.1.1 Validation using PowerFactory Models
The details of four different LV networks were extracted from PowerFactory and modelled in the
modelling tool for validation purposes. In the modelling tool, the LV networks are modelled using
conductors which have the closest resistance to the conductors in PowerFactory models. The LV
networks are modelled as 3-wire systems in PowerFactory while the modelling tool uses a 4-wire
configuration. To address this issue, a default pole configuration was assumed in order to derive the
impedance of 4-wire systems in the modelling tool. Therefore, there are slight differences in the line
impedances between the LV network models.
12
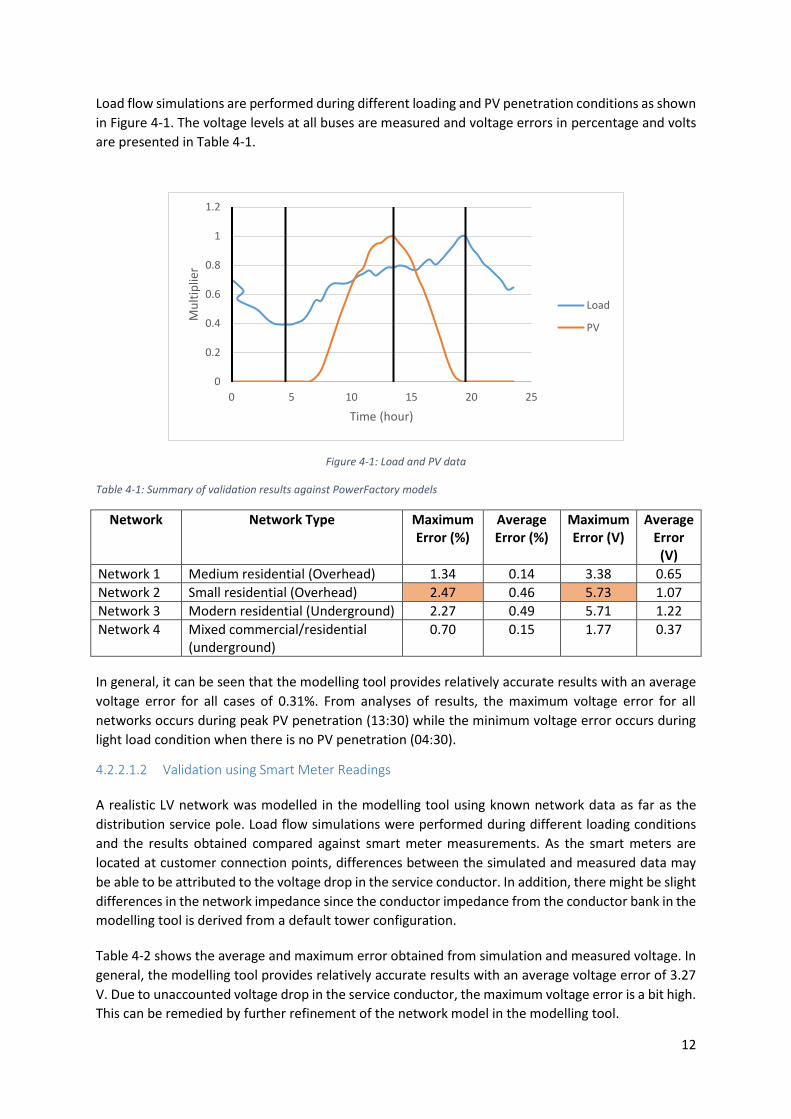
Load flow simulations are performed during different loading and PV penetration conditions as shown
in Figure 4-1. The voltage levels at all buses are measured and voltage errors in percentage and volts
are presented in Table 4-1.
Figure 4-1: Load and PV data
Table 4-1: Summary of validation results against PowerFactory models
Network Network Type Maximum Error (%)
Average Error (%)
Maximum Error (V)
Average Error (V)
Network 1 Medium residential (Overhead) 1.34 0.14 3.38 0.65
Network 2 Small residential (Overhead) 2.47 0.46 5.73 1.07
Network 3 Modern residential (Underground) 2.27 0.49 5.71 1.22
Network 4 Mixed commercial/residential (underground)
0.70 0.15 1.77 0.37
In general, it can be seen that the modelling tool provides relatively accurate results with an average
voltage error for all cases of 0.31%. From analyses of results, the maximum voltage error for all
networks occurs during peak PV penetration (13:30) while the minimum voltage error occurs during
light load condition when there is no PV penetration (04:30).
4.2.2.1.2 Validation using Smart Meter Readings
A realistic LV network was modelled in the modelling tool using known network data as far as the
distribution service pole. Load flow simulations were performed during different loading conditions
and the results obtained compared against smart meter measurements. As the smart meters are
located at customer connection points, differences between the simulated and measured data may
be able to be attributed to the voltage drop in the service conductor. In addition, there might be slight
differences in the network impedance since the conductor impedance from the conductor bank in the
modelling tool is derived from a default tower configuration.
Table 4-2 shows the average and maximum error obtained from simulation and measured voltage. In
general, the modelling tool provides relatively accurate results with an average voltage error of 3.27
V. Due to unaccounted voltage drop in the service conductor, the maximum voltage error is a bit high.
This can be remedied by further refinement of the network model in the modelling tool.
0
0.2
0.4
0.6
0.8
1
1.2
0 5 10 15 20 25
Mu
ltip
lier
Time (hour)
Load
PV

13
Table 4-2: Summary of validation results against smart meter readings
Maximum Error (%) Average Error (%) Maximum Error (V) Average Error (V)
5.87 1.4 13.42 3.27
4.2.2.1.3 Summary
Overall, the modelling tool provides accurate results for both validation studies. The average error for
validation against PowerFactory models and smart meter readings are 0.3% and 1.4% respectively.
Considering that there are discrepancies in some network impedance and simplistic load component
modelling in the modelling tool, the average errors are generally small and may be able to be rectified
through more comprehensive modelling and refined load models.
14
5 Inverter Performance Evaluation
The objective of this deliverable is to verify the practical capability of inverters to deliver the power
quality response modes implemented in the modelling tool. Four of the most commonly installed
inverter brands have been shortlisted and were tested for various functionality. The tested inverters
are:
SMA Sunny Boy 5000TL (single-phase)
Fronius Galvo 3.0-1 (single-phase)
Sungrow SG 5KTL-D (single-phase)
SMA Tripower STP5.0 (three-phase)
Performance for the following response modes was assessed:
Constant power factor mode
Different volt/var control settings
Different volt/watt control settings
Combined volt/var and volt/watt control settings
Full reactive power capability
Hunting of inverters when connected to long LV conductors
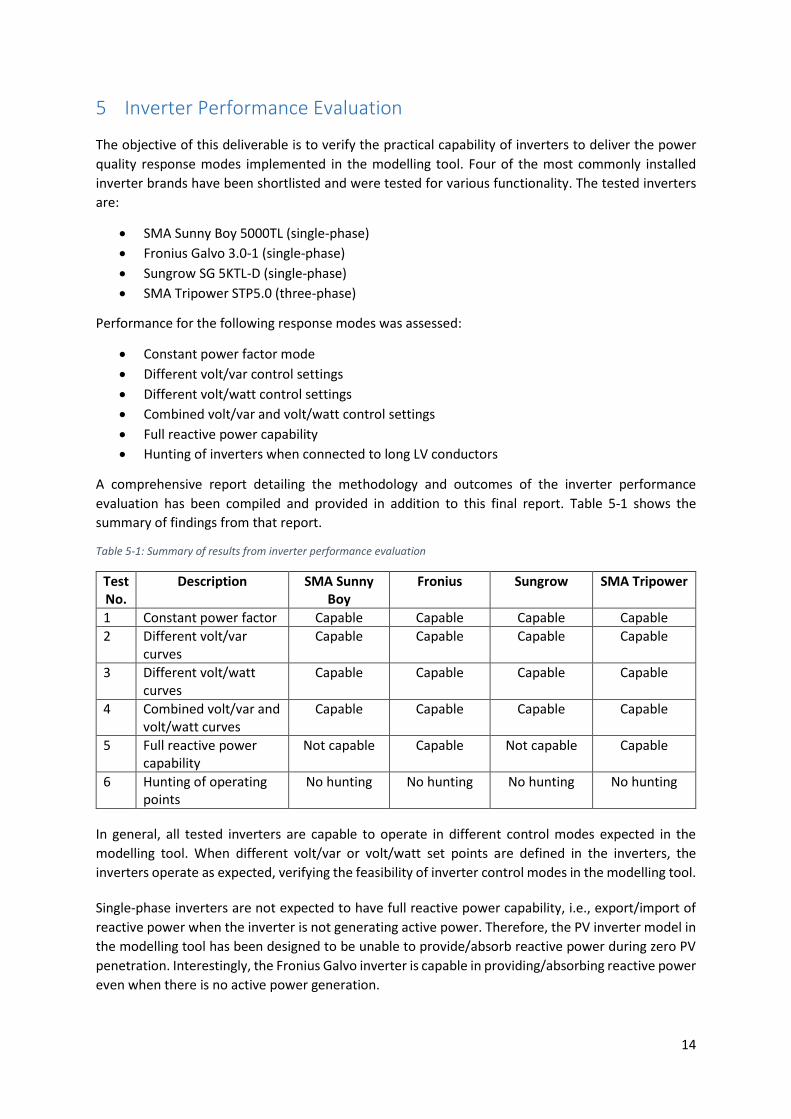
A comprehensive report detailing the methodology and outcomes of the inverter performance
evaluation has been compiled and provided in addition to this final report. Table 5-1 shows the
summary of findings from that report.
Table 5-1: Summary of results from inverter performance evaluation
Test No.
Description SMA Sunny Boy
Fronius Sungrow SMA Tripower
1 Constant power factor Capable Capable Capable Capable
2 Different volt/var curves
Capable Capable Capable Capable
3 Different volt/watt curves
Capable Capable Capable Capable
4 Combined volt/var and volt/watt curves
Capable Capable Capable Capable
5 Full reactive power capability
Not capable Capable Not capable Capable
6 Hunting of operating points
No hunting No hunting No hunting No hunting
In general, all tested inverters are capable to operate in different control modes expected in the
modelling tool. When different volt/var or volt/watt set points are defined in the inverters, the
inverters operate as expected, verifying the feasibility of inverter control modes in the modelling tool.
Single-phase inverters are not expected to have full reactive power capability, i.e., export/import of
reactive power when the inverter is not generating active power. Therefore, the PV inverter model in
the modelling tool has been designed to be unable to provide/absorb reactive power during zero PV
penetration. Interestingly, the Fronius Galvo inverter is capable in providing/absorbing reactive power
even when there is no active power generation.

15
Test number 6 is designed to ensure that the inverters will not hunt for an optimal operating point,
especially when connected through a long distribution conductor. Hunting of optimal operating point
occurs when the inverter keeps varying the output var level as the voltage level changes. From the
inverter testing, all inverters were capable of interpolating an optimal operating point on the defined
volt/var curve, which matches the volt/var control mode designed in the modelling tool.
Although combined volt/var and volt/watt mode capability has been tested for the inverters, the
actual control mode is not included in the modelling tool at this stage. This control mode may be added
in further enhancement of the modelling tool functionality.
The inverter power quality response capabilities modelled in the modelling tool include the constant
power factor, volt/var control and volt/watt control modes. Based on findings from the inverter
performance evaluation, all PV inverter response modes modelled in the tool are feasible on tested
realistic inverters available on the Australian market.

16
6 Conclusion and Recommendations
This document reports the final outcomes of the project ‘Management of Voltages in LV Networks’
undertaken by University of Wollongong in conjunction with a consortium of Australian DNSPs. This
report provides a literature review to examine the impacts of increasing penetration of distributed
generation on voltage management in LV networks in Australia. In addition, the performance of
different voltage management strategies employed by DNSPs are evaluated. The development of the
modelling tool from implementation through to completion is discussed. This includes the validation
process of the modelling tool against a commercial software package and practical data supplied by
DNSPs. The outcome of an inverter performance evaluation undertaken in the laboratory as part of
the validation process is also reported.
6.1 Recommendations for Further Refinement of Modelling Tool
The following is a recommended list of tasks to further refine the modelling tool:
Functionality enhancements – A number of technology enhancements, such as electric
vehicles, have occurred in the time since the original project was scoped. Further
enhancements may involve incorporating additional functionality into the tool to allow
modelling of these changes in technology such as simultaneous volt/var and volt/watt modes
for PV inverters, modelling of 3-phase PV and energy storage systems and provision for
AS 61000.3.100 compliance checks.
Further tool verification using comprehensive networks and refined load models –
Verification involves comprehensive modelling of a number of networks in order to verify the
accuracy of the modelling tool. Data measured in networks will be compared to the output of
the tool.
Improvement of modelling tool user experience – This improvement aims to simplify and
improve the user experience, which includes enhancements to the graphical user interface
and development of visualisation methods.
Development of guidelines for voltage management strategies – This task seeks to provide
empirical guidance for industry to use when determining the best strategy for voltage
management. This task involves development and detailed analysis of a number of case
studies in order to determine the most technically and economically robust and efficient
methods of voltage management from the suite of technologies available.
Verification of software models using laboratory assessments – Laboratory assessment of a
range of devices such as DSTATCOMs, energy storage systems and low voltage regulators to
verify that software models are accurately representing device behaviour.
The above recommendations have been included in an implementation phase paper currently under
consideration by the Asset Management Committee of the ENA.
6.2 Next Steps
The next steps in the project are the dissemination of project outcome to the wider community. As
agreed between team members and the ENA, the modelling tool will be made freely available for use

17
by all ENA members. A detailed user manual has been developed which includes guidance on how to
use the modelling tool, its capabilities and limitations, and will be released alongside the modelling
tool.
A training workshop will be organised for all ENA members in April 2020. The purpose of this training
workshop is to demonstrate the use and functions of the modelling tool to participants.

18
7 Acknowledgement
We would like to thank our industry partners from Energy Queensland, Jemena, SA Power Networks
and United Energy for their contributions to the project.
We would also like to thank Mitchell Evans for his contribution towards the literature review for the
project.
19
9 References
[1] REN21, "Renewables 2018 Global Status Report", 2018. [2] Mitchell Evans, "Technical Aspects Related to the Intergation of Distributed Energy Resources
in Distibution Networks," School of Electrical, Computer and Telecommunications Engineering, University of Wollongong, 2019.
[3] Sophie Vorrath, "Australia tipped to add 70,000 home batteries in 2019, lead global demand", Webpage, last accessed 17th January, 2020, Available: https://reneweconomy.com.au/australia-tipped-to-add-70000-home-batteries-in-2019-lead-global-demand-64414/.
[4] D. McPhail, "Strategy for Addressing Impacts from Widespread Connection of Inverter Energy Systems", Report Prepared for Ergon Energy, 2011.
[5] UTS: Institute for Sustainable Futures, "Networks Renewed Technical Analysis", Report Prepared for ARENA, 2017.
[6] P. Kilby, "Distribution Voltage Management: Transformer Tapping & LDC Proposal", Report Prepared for Energex, 2014.
[7] Energex, "Energex Smart Grid Project - STATCOM & Battery Field Trial", 2017. [8] SA Power Networks, "Current Voltage Management Strategies: Submission to ENA Voltage
Management Project", 2019. [9] Energy Networks Australia, "Smart Metering", Webpage, last accessed 1st October, 2019,
Available: https://www.energynetworks.com.au/smart-metering. [10] United Energy, "ARENA Knowledge Sharing Plan – Residential Solar and Storage Program Final
Report ", Report Prepared for ARENA, 2019. [11] Ergon Energy, Energex, "Voltage Management Guideline", 2009. [12] United Energy, "Trial of Distribution Transformer with On-Load Tap Changer", 2017. [13] United Energy, "Post Implementation Review of Low-Voltage Regulators", 2013. [14] B. E. Harvey, "3 Phase Low Voltage Regulator (LVR) Trial Progress Report 1", Report Prepared
for Ergon Energy, 2017. [15] D. Condon, D. McPhail, D. Ingram, "Application of low voltage statcom to correct voltage issues
caused by inverter energy systems", 2016 Australasian Universities Power Engineering Conference (AUPEC), 25-28 Sept. 2016, 2016, pp. 1-6.
[16] Standards Australia, "Grid connection of energy systems via inverters - Inverter requirements", AS4777.2:2015, 2015.
[17] United Energy, "Investigation of Inverter Settings Defined in AS/NZS 4777.2:2015", 2017. [18] D. Condon, D. McPhail, "Voltage regulation of distribution networks using inverter reactive
power functionality - Australian utility experience", Asia-Pacific Power and Energy Engineering Conference (APPEEC), Suzhou, China, April 15 - 17, 2016.
[19] Ergon Energy, "Inverter Energy Systems with Fixed Non-Unity Power Factor", 2013. [20] ARENA, "AEMO and ARENA demand response trial to provide 200 megawatts of emergency
reserves for extreme peaks", Webpage, last accessed 17th February, 2020, Available: https://arena.gov.au/news/aemo-arena-demand-response/.
[21] United Energy, "United Energy Demand Response Project Performance Report - Milestone 2", Report Prepared for ARENA, 2018.
[22] Queensland Department of Energy and Water Supply, "Decision Regulatory Impact Statement - Queensland's statutory voltage limits", 2017.
[23] H. Ahmadi, J. R. Martí, H. W. Dommel, "A Framework for Volt-VAR Optimization in Distribution Systems," IEEE Transactions on Smart Grid, vol. 6, no. 3, pp. 1473-1483, 2015.
[24] United Energy, "United Energy Demand Response Project Performance Report - Milestone 3", Report Prepared for ARENA, 2018.
[25] Energy Networks Association (ENA), "The Great Energy Quest: Case Studies in Australian Electricity Storage", Report Prepared for 2015.

20
[26] AGL, "Virtual Power Plant in South Australia Stage 2 Public Report", Report Prepared for ARENA, 2018.
[27] Commonwealth Scientific and Industrial Research Organisation (CSIRO), "VIRTUAL POWER STATION 2.0 Project results and lessons learnt ", Report Prepared for ARENA, 2014.

Recommended


