IZA DP No. 1766
Vocational Training and Gender: Wages andOccupational Mobility among Young Workers
Bernd FitzenbergerAstrid Kunze
DI
SC
US
SI
ON
PA
PE
R S
ER
IE
S
Forschungsinstitutzur Zukunft der ArbeitInstitute for the Studyof Labor
September 2005
Vocational Training and Gender: Wages and Occupational Mobility
among Young Workers
Bernd Fitzenberger Goethe University Frankfurt,
ZEW, IFS and IZA Bonn
Astrid Kunze Norwegian School of Economics and Business Administration
and IZA Bonn
Discussion Paper No. 1766 September 2005
IZA
P.O. Box 7240 53072 Bonn
Germany
Phone: +49-228-3894-0 Fax: +49-228-3894-180
Email: [email protected]
Any opinions expressed here are those of the author(s) and not those of the institute. Research disseminated by IZA may include views on policy, but the institute itself takes no institutional policy positions. The Institute for the Study of Labor (IZA) in Bonn is a local and virtual international research center and a place of communication between science, politics and business. IZA is an independent nonprofit company supported by Deutsche Post World Net. The center is associated with the University of Bonn and offers a stimulating research environment through its research networks, research support, and visitors and doctoral programs. IZA engages in (i) original and internationally competitive research in all fields of labor economics, (ii) development of policy concepts, and (iii) dissemination of research results and concepts to the interested public. IZA Discussion Papers often represent preliminary work and are circulated to encourage discussion. Citation of such a paper should account for its provisional character. A revised version may be available directly from the author.

IZA Discussion Paper No. 1766 September 2005
ABSTRACT
Vocational Training and Gender: Wages and Occupational Mobility among Young Workers∗
This paper investigates the relationship between the gender wage gap, the choice of training occupation, and occupational mobility. We use longitudinal data for young workers with apprenticeship training in West Germany. Workers make occupational career choices early during their careers and women and men pursue very different occupational careers. We reconsider whether through occupational segregation women are locked in low wage careers (Kunze, 2005) or whether they can move up to higher wage paths through mobility. We furthermore investigate whether patterns have changed across cohorts during the period 1975 and 2001 and whether effects vary across the distribution. The main results are: First, while there exists a persistent gender wage gap over experience, the gap has decreased over time. Second, in the lower part of the wage distribution, the gap is highest and it increases with experience. Third, occupational mobility is lower for women than for men and the wage gains due to occupational mobility are higher for men than for women, especially in the lower part of the wage distribution. We conclude that occupational mobility has reduced the gender wage gap, but lock-in effects are still stronger for women compared to men. JEL Classification: C21, J16, J24, J31, J62, J7 Keywords: gender wage gap, actual experience, occupational mobility, apprenticeship Corresponding author: Astrid Kunze Department of Economics Norwegian School of Economics and Business Administration (NHH) Helleveien 30 5035 Bergen Norway Email: [email protected]
∗ We are grateful for very helpful comments by two anonymous referees and by the editor Christian Dustmann. We thank Karsten Kohn for excellent research assistance. All errors are our sole responsibility.
1 Introduction
It is a general empirical finding that a considerable part of the gender wage gap is
related to the segregation of men and women in different occupations.1 If segrega-
tion exists from the beginning of working careers and persists, this can further be
interpreted as a lock-in effect for women in low wage occupations.2 The question
arises whether mobility, given segregation at an early stage during careers, is an
important factor which reduces gender differences. Since occupational mobility
is likely to be a form of career progression (Fitzenberger and Spitz, 2004), social
attitudes regarding gender roles could be an important reason for stronger lock-in
effects experienced by women compared to men. Based on international survey
data, Fortin (2005) emphasises the importance of social attitudes for differences
in labor market outcomes of females.
This paper investigates the relationship between the gender wage gap, the
choice of occupation, and occupational mobility. Our empirical analysis uses
a West-German sample of young workers with apprenticeship training covering
the period 1975-2001. In the following, we refer to those workers with appren-
ticeship as skilled, excluding unskilled and those with technical college or uni-
versity degrees. Typically, an apprenticeship is started after 9 or 10 years of
schooling. While in training, apprentices have an apprenticeship employment
contract. Training takes 2.5-3.5 years depending on the training scheme (occu-
pation). Firms have to follow national training curricula and apprentices attend
vocational schools during one to two days a week. The apprenticeship is com-
pleted with a certificate after successful completion of a regionally unified oral,
written, and practical exam. Exams are taken at the chamber of the industry of
the firm, as well as internally (for more details see Munch, 1992). Apprentices
receive a relatively low wage which amounts to 20-30 percent of the wage of a
skilled worker.
The advantage of focusing on this group of skilled workers is that the system-
atic occupational segregation through apprenticeship training allows us to disen-
1For evidence on European countries see (Dolado et al., 2003).2It has also been shown for German workers qualified through apprenticeship training that
early segregation has persistent effects on the gender wage gap across experience levels (Kunze,
2005).
1
tangle mobility effects during the early career from segregation. Other systems
of work based training, where mobility reflects partly accumulation of human
capital until full qualification as a skilled worker, make it more difficult to study
these effects separately. Regarding the gender wage gap, it has been shown that
it may also lead to high gender segregation and large gender wage gaps that exist
from entry into the first job and remain high throughout the early career (Kunze,
2005). Hence, it looks as if women are locked into occupational careers. These
results stem from averages across apprentices during the 1975-1990 period. In
this study, we extend this analysis by investigating whether we find the same ef-
fects for different training cohorts during the longer period 1978-2001. Instead of
focusing on averages, we also take the entire distribution of wages into account.3
Finally, we take occupational mobility into account.
Our main results are: First, while there exists a persistent gender wage gap
over experience, the gap has decreased over time. Second, in the lower part of
the wage distribution, the gap is highest and it increases with experience. Third,
occupational mobility is lower for women than for men and the wage gains due
to occupational mobility are higher for men than for women, especially in the
lower part of the wage distribution. We conclude that occupational mobility has
helped to reduce the gender wage gap, but lock–in effects are still stronger for
women compared to men.
The remainder of the paper is organised as follows: In section 2, we review the
economic background. In section 3, we describe the data and summary statistics.
In section 4, the results are presented. Section 5 concludes. The appendix dis-
cusses methodological aspects of the estimation approach and comprises tables
with information on the data and estimation results.
2 Economic Background
This section provides a short review of the literature on (a) the gender wage gap
and the choice of occupation/occupational segregation and (b) the gender wage
3Fitzenberger and Wunderlich (2002) found that the gender wage gap by age for the group
of skilled workers decreased between 1975 and 1995 and the reduction in the gap was strongest
in the lower part of the wage distribution.
2

gap and occupational mobility. We discuss how our subsequent empirical analysis
is guided by the arguments put forward in the literature.
A natural starting point for discussing occupational segregation are self-selection
models (Polachek, 1981). These models are based on human capital theory. They
assume that atrophy rates of human capital are occupation specific and that
women have better options outside of the labour market. Therefore, women have
more interruptions in their labour market careers and are less willing to bear
the costs of specific investment into their human capital. This rationalizes gen-
der differences in occupational choice. Experience profiles in wages should be
steeper for males compared to females, but the starting wages of females should
be higher right after finishing apprenticeship. Self-selection models are not con-
sistent with empirical findings showing that men earn more from entry into their
first employment (Light and Ureta, 1995; Loprest, 1992; Kunze, 2005) and that
the uncertainty about the turnover risk from the employers’ perspective is the
same for both genders (Light and Ureta, 1992). Our empirical analysis partly
reexamines these points, thereby confirming the earlier results.
A positive gap between male and female starting wages can be rationalized
if women are less attached to the labor market and show higher turnover rates.
Therefore, men are selected by firms into occupations and jobs with higher specific
training and higher wage growth even accounting for job or occupation changes
(Barron et al., 1993; Kuhn, 1993; Royalty, 1996; Altonji and Blank, 1999, section
6.2.2). These arguments imply occupational segregation, a positive gender wage
gap at entry, and a widening gap with tenure. Our empirical analysis analyses the
entry wage gap and the evolution of the gender wage gap by actual experience.
Regarding the turnover risk, we investigate occupational mobility and time spent
in non–employment during the early career phase. We focus on experience rather
than on tenure for the following reasons. First, tenure effects are also reflected in
experience effects. Second, a large number of training firms train a larger number
of apprentices than needed later as young workers. Thus, there is a lot of firm
mobility after the end of the apprenticeship with firms trying to keep the better
apprentices. Since some workers will realize the gains from their apprenticeship
in other firms, it is crucial to investigate all former apprentices. Third, as a
related point, job-to-job mobility is fairly high among young workers (Topel and
3
Ward, 1992). Thus, focussing on tenure at the training firm, we would be likely
to ignore an important part of the effects of the choice of training occupation and
we would have to deal with a difficult selection issue.
Empirical studies have shown that occupational segregation is related to the
gender wage gap (see e.g. Dolado, 2001, 2003, and Miller, 1987) as well as
differences in schooling content (see e.g. Brown and Corocoran, 1997, and Paglin
and Rufolo, 1990). In recent studies based on data for apprentices in Germany
during the time period 1975 to 1990, Kunze (2003, 2005) finds that occupational
segregation explains a large and persistent part of the gender wage gap during the
early career. Gender wage differences are large from the beginning and virtually
constant conditional on occupational segregation. While results are in contrast to
predictions from self-selection models, they are consistent with models considering
employer induced sorting mechanisms and firm specific training (Kuhn, 1993;
Barron et al., 1993). Our empirical analysis investigates whether women are
locked into low wage careers through apprenticeship training schemes. Similar to
Kunze (2005), but based on a longer data set and distinguishing between different
training cohorts, we analyse to what extent gender segregation in occupation
explains the gender wage gap.
It has been shown that mobility is a driving factor of wage growth among
young male workers in the U.S.. Topel and Ward (1992) find that young male
workers experience approximately one third of early career wage growth through
moving jobs. In a recent study for Finland, Kangasniemi (2004) finds that oc-
cupational mobility is much lower for female workers compared to male workers
and that occupational mobility is mostly associated with promotions. Having a
different focus, the study does not explicitly estimate the relationship between oc-
cupational mobility and the gender wage gap. Our subsequent empirical analysis
investigates to what extent mobility counteracts the lock–in effect through early
segregation or, put differently, whether the gender gap in occupational mobility
is crucial for the persistence of the gender wage gap.
Fitzenberger and Spitz (2004) explicitly analyse the decision to change the
occupation of work in a two period model.4 The model assumes that a change
4Occupational mobility in Germany is also analysed by Euwals and Winkelmann (2002),
Fahr (2004), and Werwatz (2002). These studies do not look at gender differences.
4
in occupation between period 1 and 2 takes only place if the random wage in-
crease in the new occupation in the second period outweighs the loss in specific
human capital accumulated in the training occupation. Workers differ by their
unobserved, innate ability which both affect the return to training and the return
to occupational change. Some implications of the model are analysed empirically
for male workers in Germany. By comparing movers (workers who have changed
their occupation) with stayers (workers who have not changed their occupation)
both for the training occupation and the occupation of work, the authors find
that occupational mobility results in a wage increase. Our empirical analysis re-
examines for a much larger database whether occupational mobility is associated
with moving to better paid occupations as part of career progression. If this is the
case, lower occupational mobility among females causes a lock-in effect resulting
in a persistent gender wage gap. Our empirical analysis also investigates to what
extent the gender wage gap would be reduced if females exhibited male patterns
in occupational choice and occupational mobility.
3 Data and Summary Statistics
We extract a sample of skilled workers from the newly released IAB employment
subsample (IABS)5 for the period 1975 to 2001. The IABS is a 1 percent random
sample drawn from the event history data file of the social security insurance
scheme, the employment statistics, collected by the German Federal Bureau of
Labour. It contains all dependent employees in the private sector, i.e. about 80
percent of total employment in Germany. Not included are: civil servants, self-
employed, unpaid family workers and people who are not eligible for benefits from
the social security system.6 The IABS contains approximately 200 000 individuals
in every cross-section.
The large longitudinal sample and the long observation window allow us to
measure education and employment histories for each worker from the same point
in the career that is from age 15. Hence, we observe complete education and
work histories up to the current employment spell. Particularly, we observe skill
5IABS in abbreviation for the Institut fur Arbeitsmarkt und Berufsforschung Sample.6For more details based on an earlier release of the data set, see Bender et al. (2000).
5

accumulation while in apprenticeship giving us information about the training
occupation, duration of training and other initial conditions. Furthermore, we can
measure wage and work histories from entry into first employment onwards. Work
histories are precisely measured by use of information on whether the employee
is working or not, as reported in the data.7
The main variables for our analysis are the wage variable, work experience,
the training occupation (apprenticeship) as well as the occupation of work. The
wage variable we use in the empirical analysis is the wage in an employment spell
after training and is defined as the logarithm of daily gross wages deflated by a
standard CPI index for Germany. The reference year is 1995. We focus on full-
time workers and, hence, exclude observations with hours of work lower than 35.
Although hours of work generally are an important explanatory factor of gender
wage gap, focusing on full time workers eliminates differences in average hours,
as Kunze (2005) has found for a similar sample of young skilled workers from the
GSOEP 1984-1997. Hence, we do not need to control for hours of work. Work
experience is precisely estimated from the rich information in the event history
data set.8 Work experience is calculated by accumulating days of full time work
for each individual. We transform it into years of work experience. Since we
7We identify skilled workers through our constructed variable measuring the duration of
training with a firm, as well as the qualification status reported in the IABS after training. The
original sample includes all workers who have only one consecutive period of training longer
than 450 days. Hence, those who take more than one apprenticeship are excluded and therefore
we do not need to deal with selection into further training. We also exclude workers who have
earned a degree after or before training, such as in technical college or university. Workers
must be employed as a skilled worker at least once after training. Furthermore, to capture the
main group of skilled workers who have gone through typical training, we drop workers who
are reported with training duration longer than 6 years, and who have started their career after
training relatively late, that is later than age 25. The average age at entry is approximately
20.5, see Kunze (2005). Finally, we restrict the sample to those who do not delay entrance
into first employment by more than 2 years. 2 years is the maximum gap that would appear
if national service applies. In Germany, national service is only compulsory for men and its
length varies throughout the period between 12 and 18 months.8Individual records in the IABS are organised in spells with the calendar date of start
and end which are not longer than one year. A spell is reported for every change related to
the employment and non-employment status. From the calendar dates and information on
employment status, we generate the variable actual experience.
6
follow workers through vocational training and work, we can observe the training
occupation that we measure in the last spell of training, and the occupation of
work afterwards. The latter may change across time for an individual reflecting
career changes or promotion. Both occupational variables are measured by the
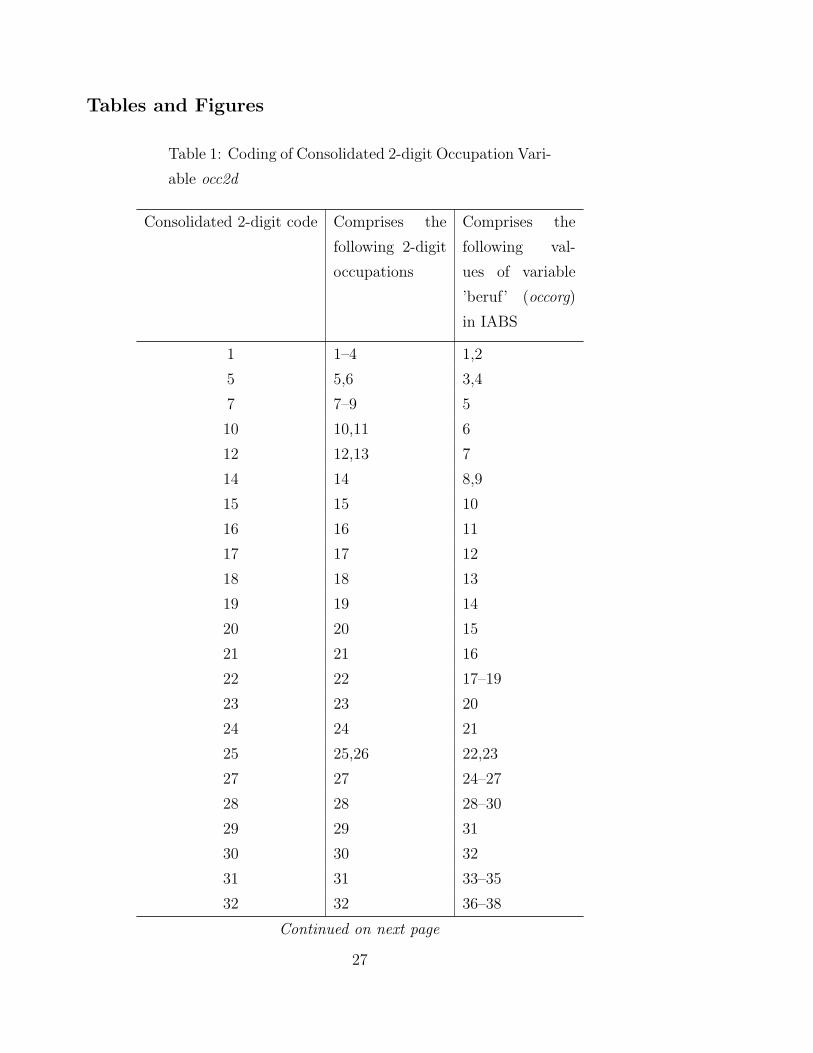
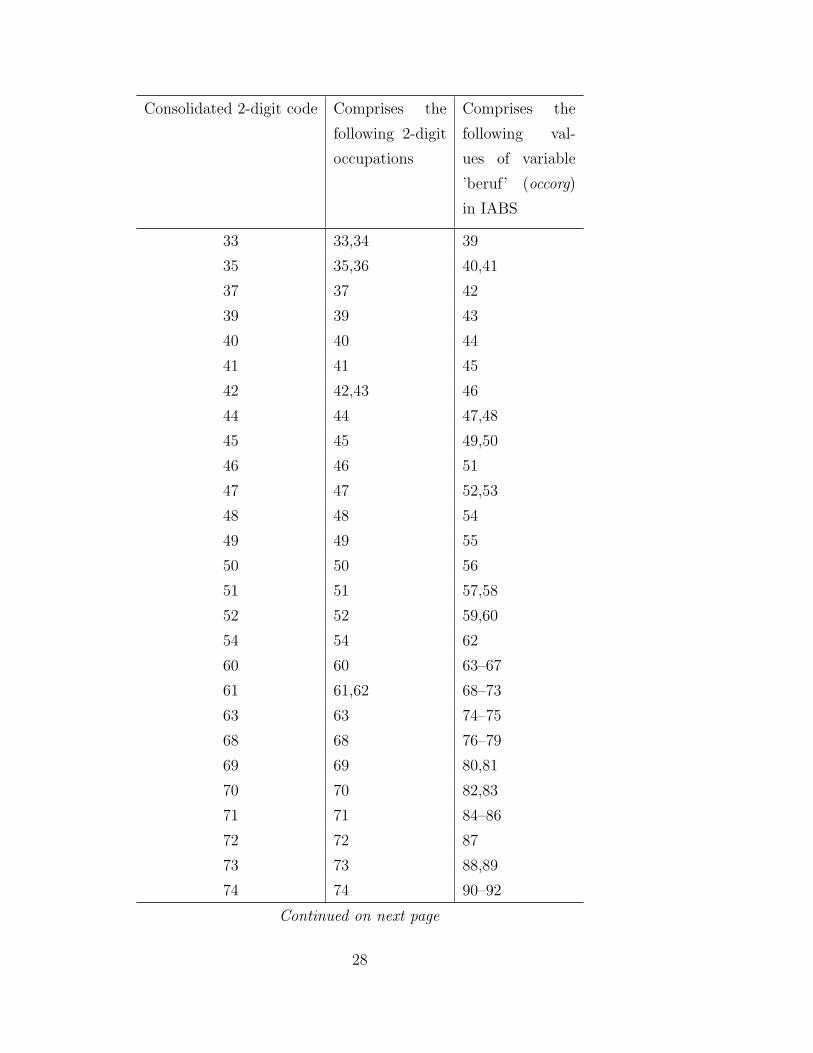
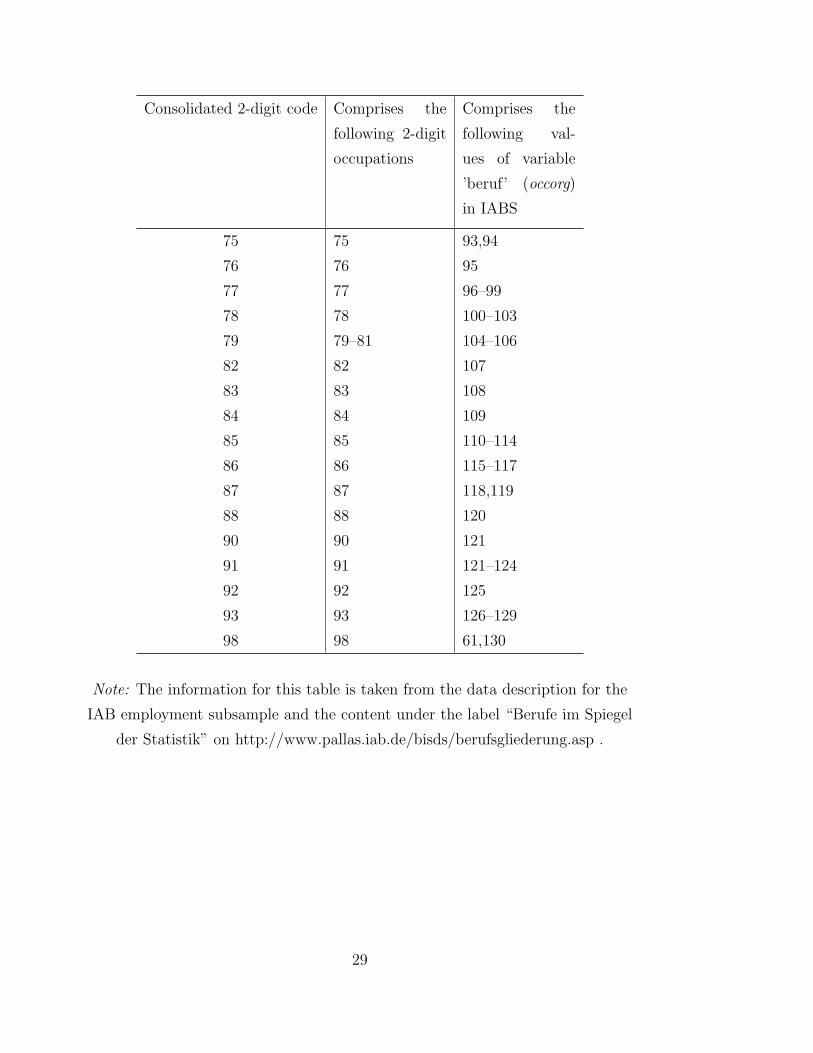
same 2-digit codes.9 We measure (occupational) mobility by the first transition
out of the occupation corresponding to the 2-digit training occupation.
< Table 1 about here >
In order to compare results across training cohorts, we construct an indicator
variable defined as the year of completing apprenticeship training.10 We construct
three cohorts capturing the developments around the apprenticeship system from
the late 1980s to the mid 1990s. We select the following three: 1978-1980, 1984-
86, and 1990-93. Pooling some of them ensures a sufficiently large sample size to
undertake detailed analysis within occupation groups. The final apprenticeship
cohort we use stops training in 1993. This ensures that we follow almost all of
them for at least 5 years of their work history after training.
In table 2 we list the number of observations in our final analysis sample
split by sex and years of work experience (integer values). We cut off records
after 10 years of work experience for the two earlier cohorts and after 5 years
for the latest cohort. This is to ensure sufficient numbers of observations to do
a statistical analysis within occupation groups. Furthermore, this is sufficient to
observe mobility following apprenticeship training during the early career.
< Table 2 about here >
In tables 3 and 4, we list summary statistics measured at the first job for
our final sample. The main route is to enter apprenticeship after 9 to 10 years
of schooling. Noteworthy, the level of schooling prior to apprenticeship training
9The orginal occupation variable occorg (variable ’BERUF’) with 130 different outcomes in
the IABS is translated into a two-digit, occ2d (with 66 different outcomes), occupation variable,
see table 1. The original variable occorg is a consolidated version of 3–digit occupation codes
due to data protection reasons. Because of this limited information, we had to consolidate a
number of categories when constructing our 2–digit variable which is coarser than the usual
2–digit classification.10Technically, it is the last year when the worker is reported to be in training.
7
increased slightly across cohorts and, within the cohort completing training in
1990-1993, 9 percent of men and 5 percent of women have the Abitur degree,
that takes usually 13 years. The duration of training increased over time from
2.51 years for the cohort in the late 1970s to 2.7 years for the cohort in the
mid 1990s. Accordingly, the age at entry into the first job increased as well.
This development captures an increase in quality of training and increase in pre-
apprenticeship education. As a final summary statistic, we present the fraction
of those who stay in the same occupation after apprenticeship. This we measure
by comparison of the training occupation and the occupation of work in the first
job. For both we use the original occupation code occorg as reported in the data
source. Both for men and women the probability to stay was extremely high,
76-77 percent. While across cohorts this probability stayed almost constant for
women, it decreased for men by 10 percentage points (ppoints). In the following,
we denote the probability to move as mobility and we investigate differences
between men and women.
< Tables 3 and 4 about here >
The Gender Wage Gap
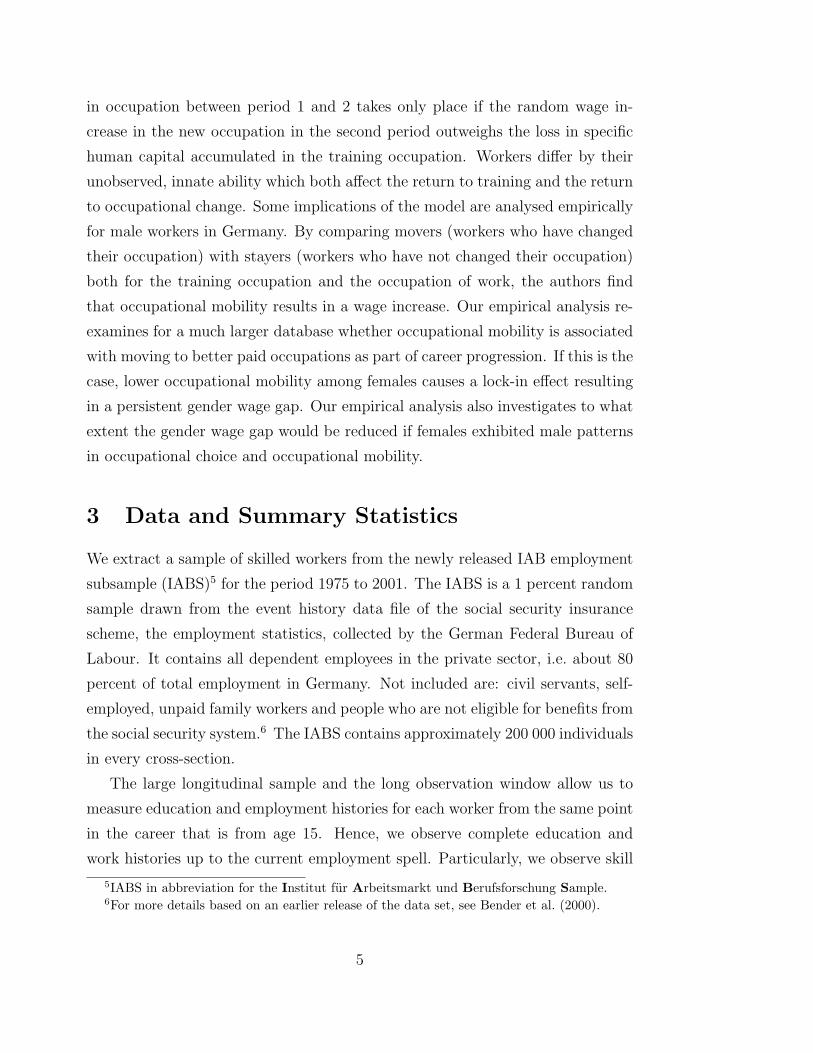
To describe the gender wage gap, we present means conditioning on experience.
Since our sample of apprentices can be followed from the beginning of their work-
ing careers we can observe the entry wage and follow them over time without
gap unless they stop working in a job subject to social security taxation, become
self-employed or a civil servant. Experience-wage profiles are presented by sex
and cohort group in Figure 1. Consistent with human capital theory, both for
men and women, we find concavely shaped profiles that first increase more steeply
and then increase at a decreasing rate. In line with previous findings, the figure
shows already at entry a large gender wage gap which persists throughout the
early career. This becomes even more clear from plotting the wage gap at the
different levels of work experience.
8
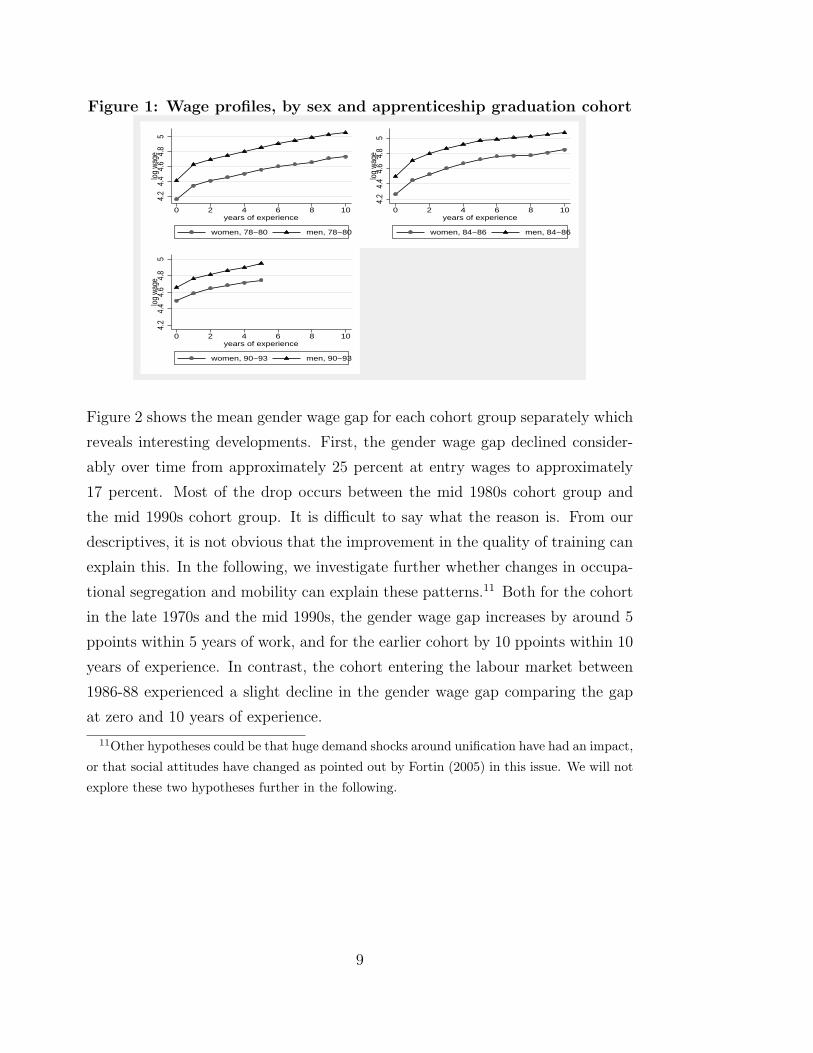
Figure 1: Wage profiles, by sex and apprenticeship graduation cohort
4.2
4.4
4.6
4.8
5lo
g w
age
0 2 4 6 8 10years of experience
women, 78−80 men, 78−80
4.2
4.4
4.6
4.8
5lo
g w
age
0 2 4 6 8 10years of experience
women, 84−86 men, 84−86
4.2
4.4
4.6
4.8
5lo
g w
age
0 2 4 6 8 10years of experience
women, 90−93 men, 90−93
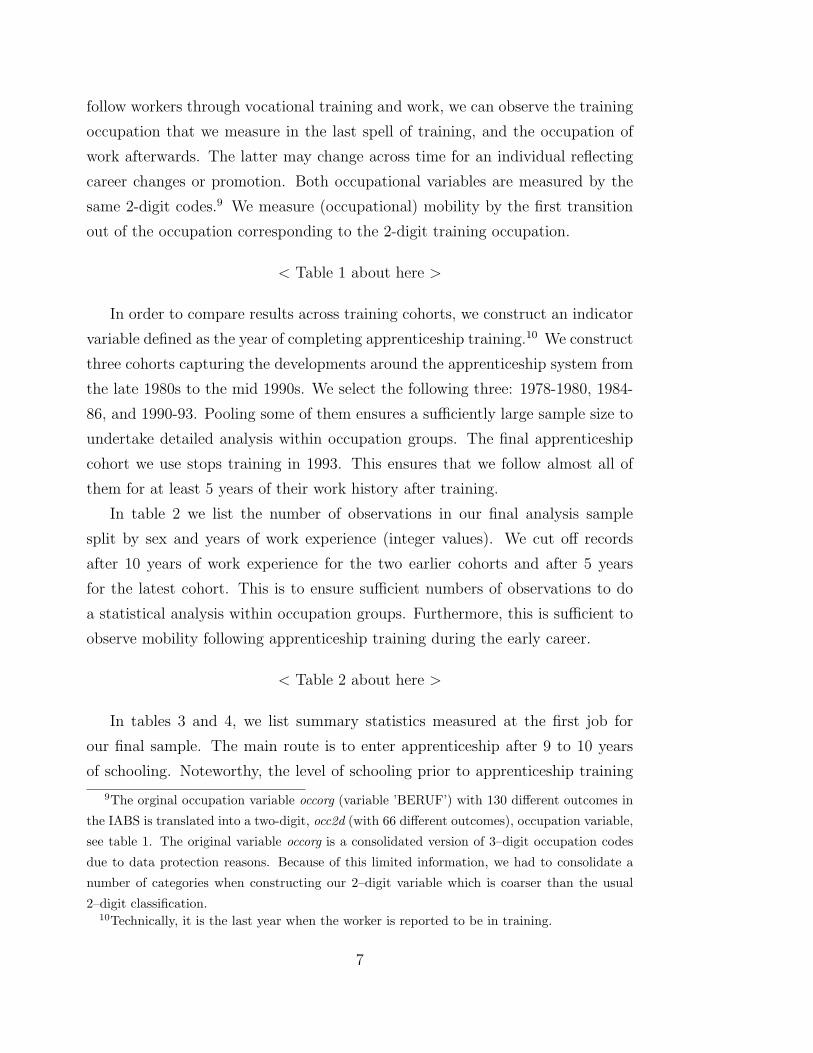
Figure 2 shows the mean gender wage gap for each cohort group separately which
reveals interesting developments. First, the gender wage gap declined consider-
ably over time from approximately 25 percent at entry wages to approximately
17 percent. Most of the drop occurs between the mid 1980s cohort group and
the mid 1990s cohort group. It is difficult to say what the reason is. From our
descriptives, it is not obvious that the improvement in the quality of training can
explain this. In the following, we investigate further whether changes in occupa-
tional segregation and mobility can explain these patterns.11 Both for the cohort
in the late 1970s and the mid 1990s, the gender wage gap increases by around 5
ppoints within 5 years of work, and for the earlier cohort by 10 ppoints within 10
years of experience. In contrast, the cohort entering the labour market between
1986-88 experienced a slight decline in the gender wage gap comparing the gap
at zero and 10 years of experience.
11Other hypotheses could be that huge demand shocks around unification have had an impact,
or that social attitudes have changed as pointed out by Fortin (2005) in this issue. We will not
explore these two hypotheses further in the following.
9
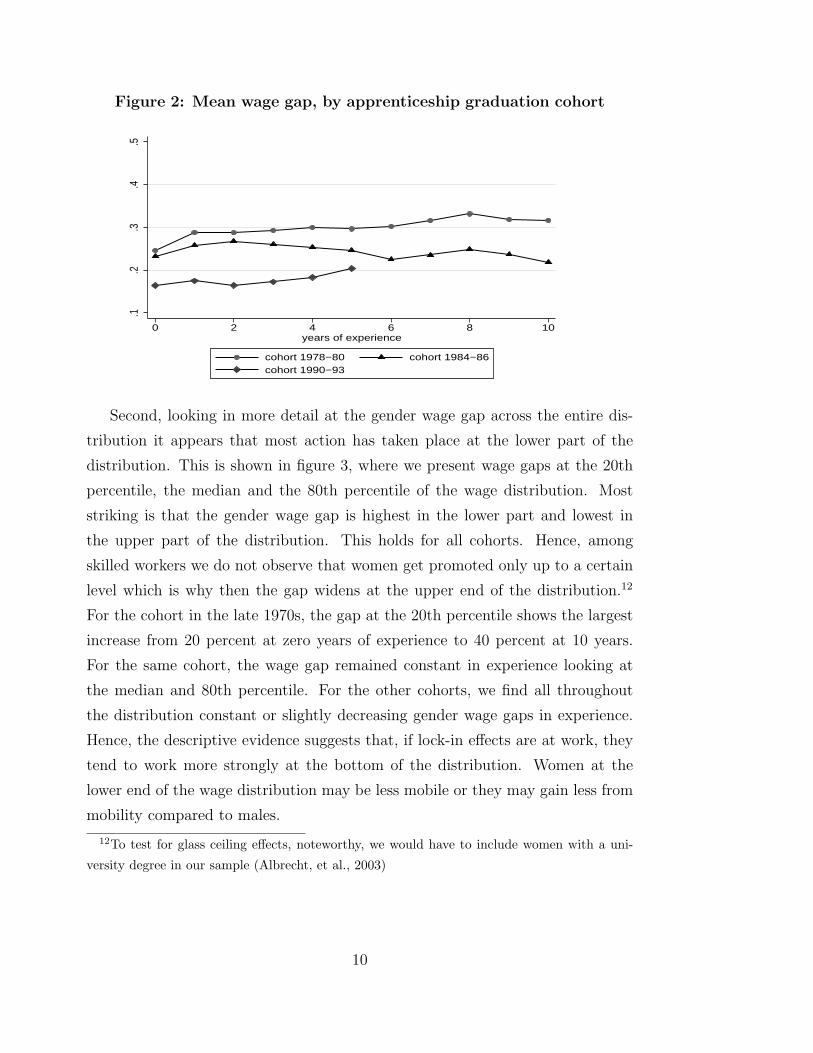
Figure 2: Mean wage gap, by apprenticeship graduation cohort
.1.2
.3.4
.5
0 2 4 6 8 10years of experience
cohort 1978−80 cohort 1984−86cohort 1990−93
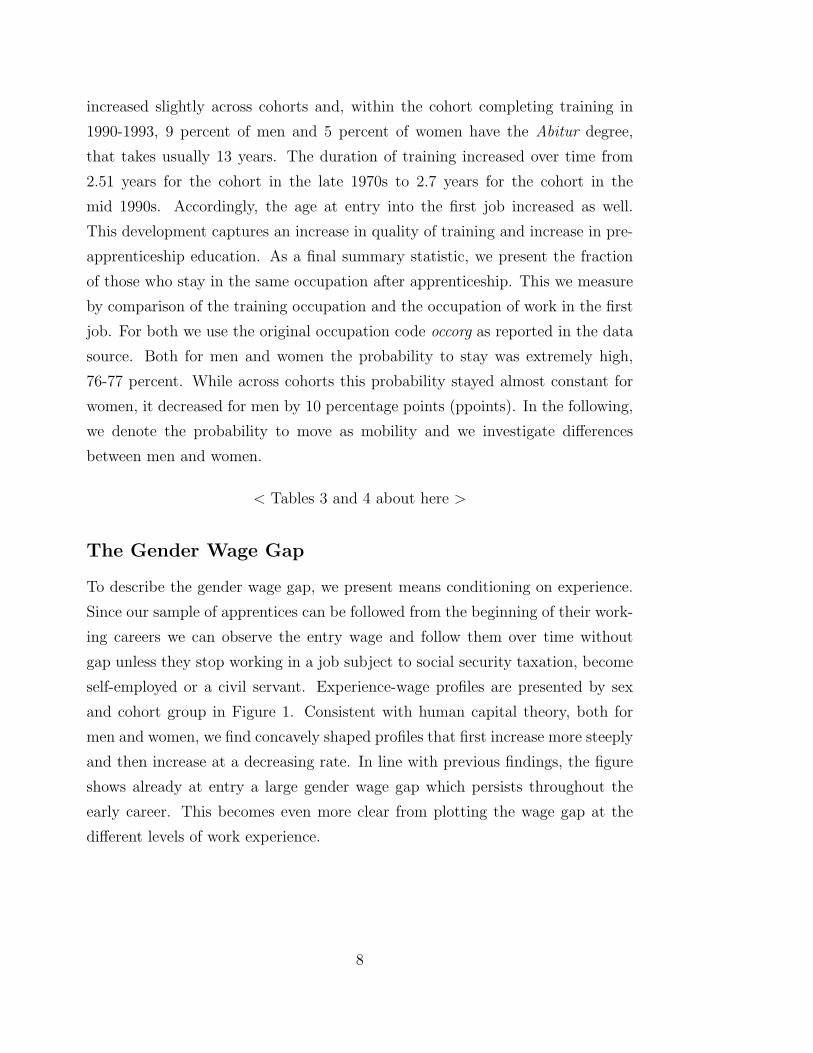
Second, looking in more detail at the gender wage gap across the entire dis-
tribution it appears that most action has taken place at the lower part of the
distribution. This is shown in figure 3, where we present wage gaps at the 20th
percentile, the median and the 80th percentile of the wage distribution. Most
striking is that the gender wage gap is highest in the lower part and lowest in
the upper part of the distribution. This holds for all cohorts. Hence, among
skilled workers we do not observe that women get promoted only up to a certain
level which is why then the gap widens at the upper end of the distribution.12
For the cohort in the late 1970s, the gap at the 20th percentile shows the largest
increase from 20 percent at zero years of experience to 40 percent at 10 years.
For the same cohort, the wage gap remained constant in experience looking at
the median and 80th percentile. For the other cohorts, we find all throughout
the distribution constant or slightly decreasing gender wage gaps in experience.
Hence, the descriptive evidence suggests that, if lock-in effects are at work, they
tend to work more strongly at the bottom of the distribution. Women at the
lower end of the wage distribution may be less mobile or they may gain less from
mobility compared to males.
12To test for glass ceiling effects, noteworthy, we would have to include women with a uni-
versity degree in our sample (Albrecht, et al., 2003)
10
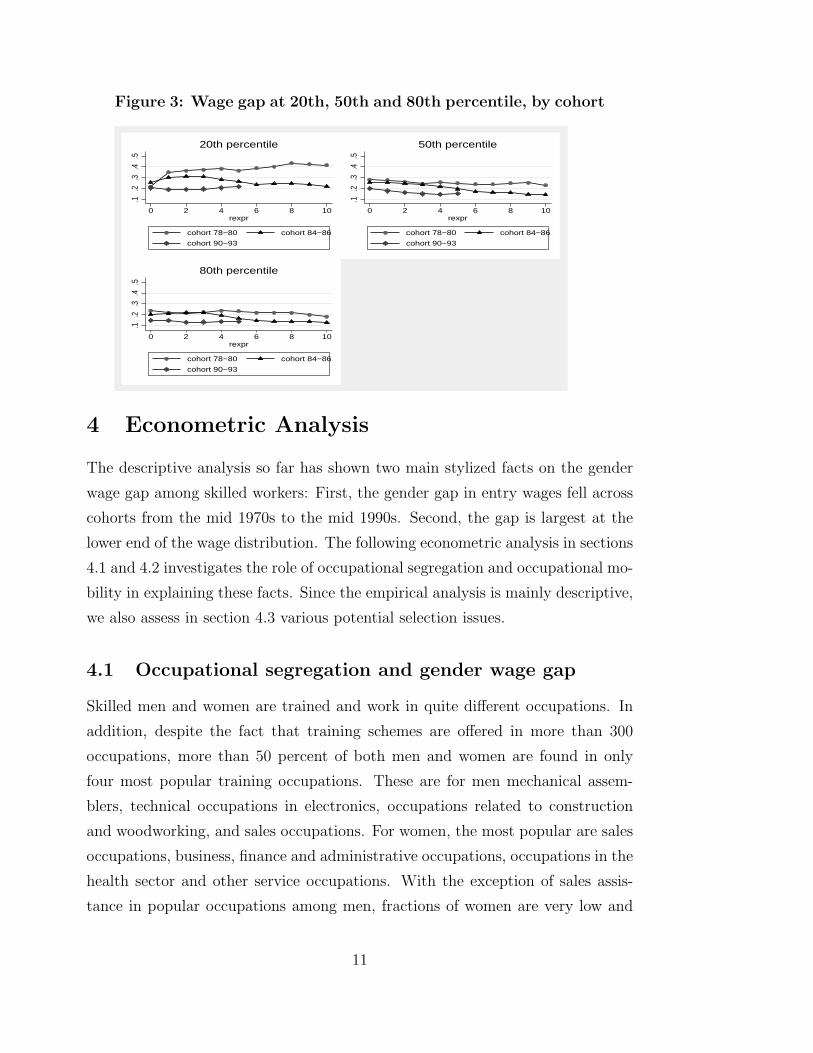
Figure 3: Wage gap at 20th, 50th and 80th percentile, by cohort
.1.2
.3.4
.5
0 2 4 6 8 10rexpr
cohort 78−80 cohort 84−86
cohort 90−93
20th percentile
.1.2
.3.4
.5
0 2 4 6 8 10rexpr
cohort 78−80 cohort 84−86
cohort 90−93
50th percentile.1
.2.3
.4.5
0 2 4 6 8 10rexpr
cohort 78−80 cohort 84−86
cohort 90−93
80th percentile
4 Econometric Analysis
The descriptive analysis so far has shown two main stylized facts on the gender
wage gap among skilled workers: First, the gender gap in entry wages fell across
cohorts from the mid 1970s to the mid 1990s. Second, the gap is largest at the
lower end of the wage distribution. The following econometric analysis in sections
4.1 and 4.2 investigates the role of occupational segregation and occupational mo-
bility in explaining these facts. Since the empirical analysis is mainly descriptive,
we also assess in section 4.3 various potential selection issues.
4.1 Occupational segregation and gender wage gap
Skilled men and women are trained and work in quite different occupations. In
addition, despite the fact that training schemes are offered in more than 300
occupations, more than 50 percent of both men and women are found in only
four most popular training occupations. These are for men mechanical assem-
blers, technical occupations in electronics, occupations related to construction
and woodworking, and sales occupations. For women, the most popular are sales
occupations, business, finance and administrative occupations, occupations in the
health sector and other service occupations. With the exception of sales assis-
tance in popular occupations among men, fractions of women are very low and
11
vice versa. Considering all occupations, we will as well see that mobility is low
and hence occupational segregation is a persistent feature of the skilled labour
market. Occupational segregation did not change across the three cohorts consid-
ered here in a way that this could explain the observed changes in the gender wage
gap. Also the femaleness of an occupation (we define this as the difference be-
tween the share among females and among males choosing a specific occupation)
did not change considerably during the period of observation (detailed results are
available upon request). At the same time, one can show that relative to the
overall gender wage gap women in the lower part of the distribution benefit from
being in a female dominated occupation while women in the upper part benefit
from being in a male dominated occupation.
4.2 Occupational mobility and gender wage gap
4.2.1 Patterns of occupational mobility
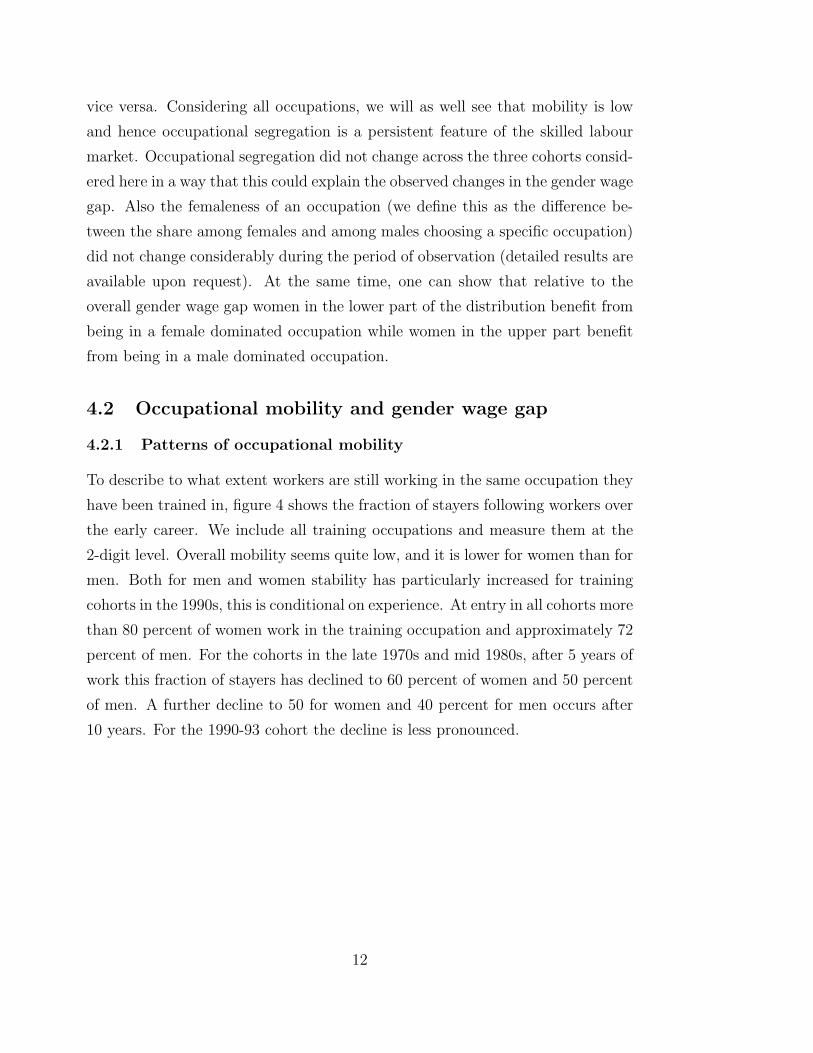
To describe to what extent workers are still working in the same occupation they
have been trained in, figure 4 shows the fraction of stayers following workers over
the early career. We include all training occupations and measure them at the
2-digit level. Overall mobility seems quite low, and it is lower for women than for
men. Both for men and women stability has particularly increased for training
cohorts in the 1990s, this is conditional on experience. At entry in all cohorts more
than 80 percent of women work in the training occupation and approximately 72
percent of men. For the cohorts in the late 1970s and mid 1980s, after 5 years of
work this fraction of stayers has declined to 60 percent of women and 50 percent
of men. A further decline to 50 for women and 40 percent for men occurs after
10 years. For the 1990-93 cohort the decline is less pronounced.
12
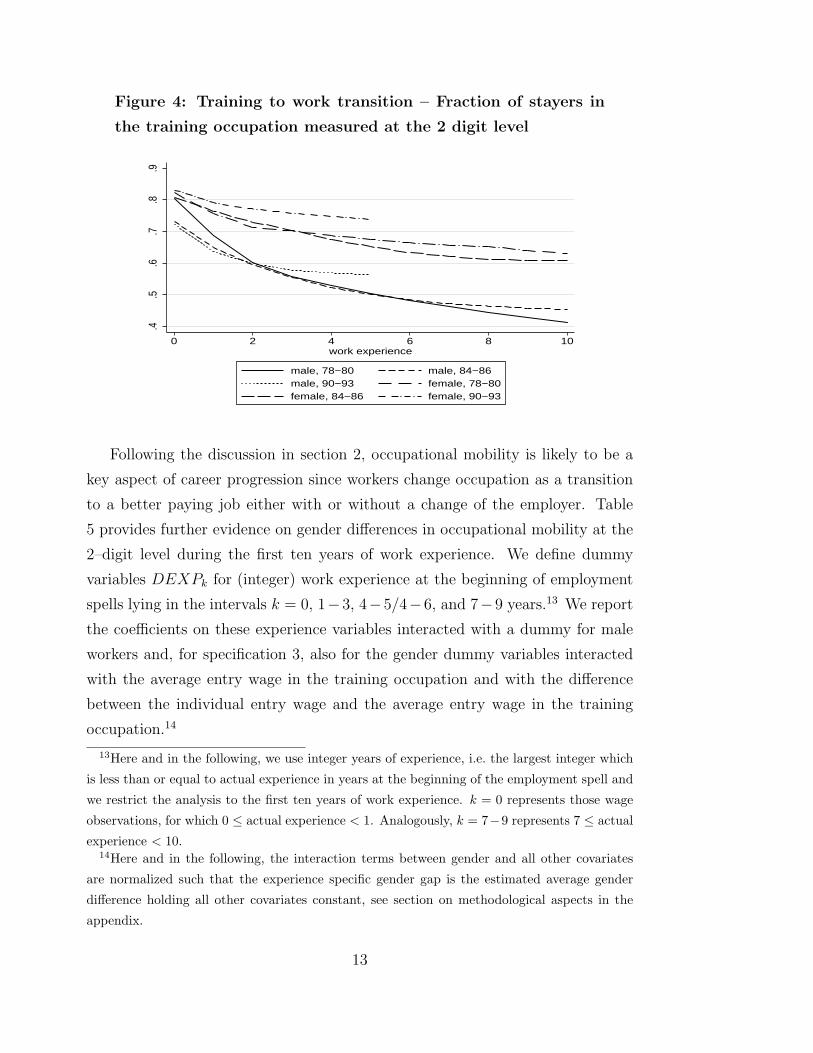
Figure 4: Training to work transition – Fraction of stayers in
the training occupation measured at the 2 digit level
.4.5
.6.7
.8.9
0 2 4 6 8 10work experience
male, 78−80 male, 84−86male, 90−93 female, 78−80female, 84−86 female, 90−93
Following the discussion in section 2, occupational mobility is likely to be a
key aspect of career progression since workers change occupation as a transition
to a better paying job either with or without a change of the employer. Table
5 provides further evidence on gender differences in occupational mobility at the
2–digit level during the first ten years of work experience. We define dummy
variables DEXPk for (integer) work experience at the beginning of employment
spells lying in the intervals k = 0, 1−3, 4−5/4−6, and 7−9 years.13 We report
the coefficients on these experience variables interacted with a dummy for male
workers and, for specification 3, also for the gender dummy variables interacted
with the average entry wage in the training occupation and with the difference
between the individual entry wage and the average entry wage in the training
occupation.14
13Here and in the following, we use integer years of experience, i.e. the largest integer which
is less than or equal to actual experience in years at the beginning of the employment spell and
we restrict the analysis to the first ten years of work experience. k = 0 represents those wage
observations, for which 0 ≤ actual experience < 1. Analogously, k = 7−9 represents 7 ≤ actual
experience < 10.14Here and in the following, the interaction terms between gender and all other covariates
are normalized such that the experience specific gender gap is the estimated average gender
difference holding all other covariates constant, see section on methodological aspects in the
appendix.
13
< Table 5 about here >
The results in table 5 show that the gender gap in occupational mobility in-
creases strongly with experience for the first cohort (specification 1). For the
later cohorts, the gender gap is higher at low experience levels but the increase
with experience is very small. Comparing males and females in the same train-
ing occupations (specification 2), the gender gap in mobility is reduced and the
reduction is stronger for the later cohorts. Thus, there is some evidence that
women are locked in training occupations with lower occupational mobility and
this effect seems to have become more important for the later cohorts. However,
one has to be careful not to relate this effect to the level of entry wages by training
occupations. We find (specification 3), that the higher the average entry wage
level the lower the mobility (except for male workers among the last cohort) and
the individual wage position at entry is positively related to mobility. Though
mostly significant, the wage variables have no impact on the estimated gender
gap in experience since the latter remains at the same level as in specification 1.
Apparently, occupational mobility does not overcome the strong segregation in
training occupations. For the later cohorts, the gender gap in mobility is mostly
related to the training occupations but this is not necessarily related to the entry
wages. Given the persistence of segregation in training occupations, this find-
ing by itself does not provide an explanation for the decline in the gender wage
gap across cohorts. However, we can conclude that, within training occupations,
female and male mobility patterns have converged for the later cohorts.
4.2.2 Gender wage gap and occupational mobility
Now, we investigate to what extent the gender wage gap is associated with the
choice of training occupation and gender differences in occupational mobility. Ta-
ble 6 provides estimates of the gender wage gap by experience intervals (DEXPk
for k = 0, 1− 3, 4− 5/4− 6, and 7 − 9 years) controlling for a number of char-
acteristics at entry. For each training cohort, one set of results also controls for
the 2–digit training occupation and gender specific dummy variables for occu-
pational mobility. We add both a dummy variable (pre move) for the fact that
an individual later experiences an occupational change during the first ten years
14
of work experience and a dummy variable (move effect) which is one after an
occupational change occured. The difference between the move and pre move
coefficient provides a conditional difference–in–differences (DID) estimate of the
wage effect of mobility. We allow for dynamic effects of these dummy variables by
interacting them with dummy variables for the experience level (DEXPMk for
k = 0, 1− 3, 4− 5/4− 6, and 7− 9 years) when occupational mobility occurred.
We obtain both OLS and quantile regression results for the three quantiles 20%,
50%, and 80%.
< Table 6 about here >
For the training cohorts 78-80 and 84-86, the gender wage gap increases
strongly between the first and the second year of experience for the mean and the
lower part of the distribution. With increasing experience, these gap measures
remain fairly constant for the first cohort and decline strongly for the second
cohort. In comparison, the gender wage gap is fairly constant at the median and
at the 80%-quantile for the first cohort and it decreases with experience for the
later cohorts. For the 90-93 cohort, the gender wage gap declines at the mean
and at all quantiles with experience. Without controlling for occupational vari-
ables the gender wage gap is generally higher in the lower part of the distribution
and it becomes smaller for later cohorts. Controlling for occupational variables,
the gender wage gap decreases strongly, except for the upper part of the wage
distribution. We find almost no reduction for the two earlier cohorts at the 80%–
quantile. However, it is not possible to relate the quantile regression results to
the previous estimates in the sense of attributing the changes in the gender wage
gap to these additional controls.15 For this purpose, we reestimate the gender
wage gap using the simulation approach of Machado and Mata (2005).
Here, we focus on the interpretation of the estimated gender gap in the mo-
bility variables. The results show that the wage gains of males from occupational
mobility are generally higher than for females, e.g. for the first cohort mobility
15The problem is that with the change in the set of covariates, it is not possible to relate the
quantiles of the different conditional distributions (“Quantiles can not be easily aggregated”).
Also, the specification reported in table 6 imposes the same coefficients for both genders except
for the experience and mobility variables.
15
in the first year results in a 4.1 ppoints (difference −0.012 + 0.053) higher av-
erage wage gain for males than for females. This gender gap increases to 11.1
ppoints during years 7 to 9. The gender gap differs strongly across the distri-
bution. Whereas males experience much higher wage gains than females in the
lower part of the distribution, the gender gap is close to zero (and even negative
for low experience) in the upper part of the wage distribution. This pattern also
applies for the second cohort, but generally the gender gap is smaller than for the
first cohort. For the last cohort, the gender gap has reversed for low experience
with wage gains being higher for females compared to males and gains which
are not significantly different from zero for higher experience. Thus, the wage
gains associated with mobility changed considerably across the three cohorts and
these changes must have contributed to the reduction in the gender wage gap by
experience, especially in the lower part of the distribution.
4.2.3 Gender wage gap if women exhibited male training occupations
and male mobility patterns
To investigate the extent to which the gender wage gap by experience can be
attributed to the gender differences in the choice of training occupations and in
the mobility pattern, we estimate quantile regressions for wages based solely on
the female sample, i.e. no coefficient is restricted to be the same for both gen-
ders. Then, applying the Machado and Mata (2005) decomposition technique
(as described in the methodological part of the appendix), we simulate the coun-
terfactual sample of wages where females exhibit male characteristics regarding
occupational covariates but are still ’paid like females’. Then, we add the actual
male sample to this simulated sample and reestimate the wage regressions with-
out occupational covariates. This way, we decompose the effects of differences in
covariates and in coefficients on the unconditional gender specific wage distribu-
tions (quantiles). Extending the method to decompose the gender wage gap by
experience levels, we determine to what extent the gender differences by experi-
ence without controlling for occupational covariates reflect gender differences in
training occupations and occupational mobility.
Table 7 provides the regression results on the gender wage gap by experience.
For all cohorts, the gender wage gap is considerably reduced compared to the
16

first set of results in table 6, except for the lower part of the distribution for the
78-80 cohort. The reduction in the gender wage gap is higher in the upper part
of the distribution which corresponds to the findings above on gender differences
in wage gains across the distribution and it tends to increase with experience
(especially in the upper part of the distribution). The reduction in the gender
wage gap increases across cohorts and this effect is also stronger in the upper
part of the distribution compared to the lower part of the distribution.
For women in the first cohort who earn low wages, copying male choices of
training occupation and male mobility patterns would not have overcome their
low wage career. The gender wage gap did persist because women with low wages
did not have the same returns on the training occupation and to occupational
mobility compared to males in the lower part of the wage distribution. Over
time, women would gain more. They would gain more in the upper part of the
wage distribution if they became more similar to male workers regarding their
choice of training occupation and mobility patterns. Put together, changes in
mobility patterns and changes in the wage gains associated with mobility have
contributed to the reduction in the gender wage gap. Yet, in the most recent
cohort, women could gain even more by copying male training occupations and
mobility patterns.
< Table 7 about here >
4.3 Potential selection issues
Our empirical analysis is mainly descriptive in analyzing the relationship between
occupational segregation, occupational mobility, and the gender wage gap. We
see three important potential problems with our analysis. First, this paper can
not explain the gender differences in the choice of training occupation. Second,
we do not attempt to model occupational mobility and wages jointly. Third,
gender differences in selection into employment might bias our results.
Regarding the first issue, our data have no information on the household con-
text (family background), on social attitudes (Fortin, 2005), or on the time in
school (except for an indicator for Abitur) before the beginning of the apprentice-
ship. In addition, the regional industry structure is likely to have an impact on
17
the supply of apprenticeship positions. These points make clear that it is close to
impossible to model jointly the decision of doing an apprenticeship at all together
with the choice of training occupation at the two–digit–level. Thus, our analysis
has to take the choice of training occupation as given and we can only provide
indirect evidence on how this choice interacts with wages and occupational mobil-
ity. Unobserved gender differences in ability could cause a spurious relationship
between occupational segregation and the entry wage gap explaining the gender
gap in entry wages. Based on the evidence that girls do not tend to do worse in
secondary school (OECD, 2004, indicator A9), we assume that on average there
are no unobserved gender differences in ability.
Second, we observe vast differences in the timing of occupational mobility af-
ter the end of the apprenticeship. We are interested in the relationship between
occupational mobility and the position in the wage distribution by experience
conditional on characteristics at entry. Modelling jointly the time path of occu-
pational mobility and wages would be extremely difficult to implement. To some
extent, we account for the simultaneity of wages and occupational choices using
the panel nature of the data. We investigate whether the entry wage explains oc-
cupational mobility and we estimate the effects of occupational mobility on wages
by a difference-in-differences estimator. This way, we address the possibility that
permanent unobserved differences, which affect both wages and occupational mo-
bility, matter for the estimated relationship between occupational mobility and
the gender wage gap.
Third, when studying the effect of experience and mobility on the gender
wage gap, one might be concerned about gender differences in selection into
employment. For instance, if females with low wages tended to leave the labor
market to a larger extent than males this might cause a spurious reduction of
the gender wage gap. Table 8 provides regression evidence on gender differences
in the accumulated non–employment time during the first eight years after the
start of the first job following after apprenticeship. Females experience less time
in non–employment than males. Without controlling for the training occupation
(specification 1), males spent between one fifth of a year (cohort 90-93) and half
a year (cohort 78-80) more time in non–employment than females.16 Similar to
16Note that this effect can be the result of the mandatory military service for males. The
18
the results by Light and Ureta (1992), young female workers after apprenticeship
do not exhibit a higher risk of quitting the labor market. Including dummies for
training occupations (specification 2) slightly reduces the gender difference. We
conclude that selection into employment is not likely to cause an important bias
for our analysis in sections 4.1 and 4.2..
Finally, note that the results in table 8 are also interesting regarding some
of the aspects discussed in section 2. Specification (2) in table 8 controls for
training occupations. The gender effect is only slightly reduced compared to
specification (1). Thus, there is no evidence that gender differences in employ-
ment interruptions are strongly associated with certain occupations allowing for
more career interruptions. The estimated wage effects (specification 3) are quite
interesting. The average entry wage in the training occupation as well as the in-
dividual position in the first job exert a significant negative effect on time spent
in non–employment. The higher the entry wage the less likely it is that outside
opportunities dominate work.
< Table 8 about here >
5 Summary and Conclusions
This paper investigates the relationship between the gender wage gap, the choice
of training occupations and occupational mobility. We use longitudinal data
on a sample of young workers with apprenticeship training (denoted as skilled
workers) in West Germany. Our analysis is also of interest to any country which
has implemented or considers implementing a formalized work based training
system with the goal to smooth the transition from school to work. Such a system
has strong effects on gender differences in labor market careers. Workers make
occupational career choices early during their careers and women and men pursue
very different occupational careers. We reconsider whether through occupational
segregation women are locked in low wage careers (Kunze, 2005) or whether they
can raise up to higher wage paths through mobility. Furthermore, our analysis
investigates whether patterns have changed across cohorts during the period 1978
effect can not be related to a gender difference in tertiary education after vocational training,
a widespread phenomenon in Germany, since our data set excludes those workers.
19
and 2001 and whether effects vary across the wage distribution. We consider the
labor market experience of three training cohorts defined by year of completion
of the apprenticeship. These are the cohorts 1978-80, 1984-84, and 1990-93.
Similar to previous results, we find a persistent gender wage gap over the first
ten years of work experience which is higher in the lower part of the wage dis-
tribution. The gender wage gap decreases over time, especially in the lower part
of the wage distribution. Occupational segregation by gender, however, persists
over time, both regarding training occupation and occupation of work. Females
exhibit less occupational mobility than males, which for the two later training
cohorts is completely explained by the training occupation. Thus, females are
concentrated in training occupations with low occupational mobility rates.
Occupational mobility is associated with positive wage gains and occupational
mobility is slightly higher for workers with lower wages in the training occupation.
The gain from mobility is lower for females than for males in the lower part of
the wage distribution, while wage gains are similar for both genders in the upper
part. Correspondingly, female workers are often locked in low wage careers, since
males are more likely to change occupation and benefit from the associated wage
gains. Occupational mobility does not overcome occupational segregation and the
reduction in the gender wage gap is not caused by a reduction in occupational
segregation itself.
Nevertheless, for the training cohorts in the 1990s, female mobility rates have
converged to male rates in the same training occupation and the wage gains due
to occupational mobility have increased for females relative to males. Both effects
have reduced the gender wage gap, compared to the late 1970s to 1980s train-
ing cohorts. However, if females exhibited the same training occupations and the
same mobility patterns as males, the gender wage gap would be reduced consider-
ably further, especially in the upper part of the distribution where the wage gains
due to mobility are higher. The evidence suggests that lock-in effects associated
with occupational segregation are very important in explaining the gender wage
gap among skilled workers in Germany. This is especially important in the upper
part of the wage distribution since there women would have gained most from
occupational mobility. However, for women with low wages, a substantial wage
disadvantage would remain even if they were similar to males regarding training
20
occupations and occupational mobility. Put differently, even with higher occu-
pational mobility, women with low wages tend to be locked in low wage careers.
Our study shows that occupational segregation and lower occupational mobility
among females explains the gender wage gap to a considerable extent but this
differs across the wage distribution.
The observed reduction in the gender wage gap across training cohorts is likely
to be related to changes in social attitudes regarding gender roles in the labor
market as discussed by Fortin (2005), an issue we could not explore here. In
further research, it would be of great interest to quantify the importance of social
attitudes for the extent of occupational segregation and the gender differences in
occupational mobility.
References
Albrecht, J., A. Bjorklund, and S. Vroman (2003) Is there a Glass Ceiling in
Sweden? Journal of Labor Economics, 21(1), 145–177.
Altonji, J.G. and R.M. Blank (1999) Race and Gender in the Labor Market, in:
Handbook of Labor Economics, Volume 3, 3143–3259.
Barron, J.M., D.A. Black, and M.A. Loewenstein (1993) Gender differences in
training, capital, and Wages. Journal of Human Resources, 28(2), 343–364.
Bender, S., A. Haas, and C. Klose (2000). “IAB employment subsample 1975–
1995”, Schmollers Jahrbuch, 120, 649–662.
Blinder, A. (1973) Wage discrimination: reduced forms and structural estimates.
Journal of Human Resources, 8(4), 436–454.
Brown, Charles, and Mary Corcoran (1997). Sex-based differences in school
content and the male-female wage gap. Journal of Labor Economics. 15(3).
pp.431-465.
Dolado, J., F. Felgueroso and J.F. Jimeno (2001) Female employment and oc-
cupational changes in the 1990s: How is the EU performing relative to the
US?, European Economic Review, 45, 875-879.
21
Dolado, J., F. Felgueroso and J.F. Jimeno (2003) Where do women work?
Analysing patterns in occupational segregation by gender, Annales d’Economie
et Statistique, 71/72, pp. 267-292.
Euwals, R. and R. Winkelmann (2002) Mobility after Apprenticeship – Evidence
from Register Data. Applied Economics Quarterly, 48(3–4), 256–278.
Fahr, R. (2003), Occupational Mobility and Occupational Match: Some Implica-
tions for Career Choice and Labor Market Policy, Dissertation, Universitat
Bonn.
Fitzenberger, B. and A. Spitz (2004): Die Anatomie des Berufswechsels: Eine
empirische Bestandsaufnahme auf Basis der BIBB/IAB-Daten 1998/1999.
In: Franz, W., Ramser, H.J. and M. Stadler, eds, ’Bildung’, J.C.B. Mohr
(Paul Siebeck) Tubingen, Schriftenreihe des wirtschaftswissenschaftlichen
Seminars Ottobeuren, 2004.
Fitzenberger, B. and G. Wunderlich (2002) Gender Wage Differences in West
Germany: A Cohort Analysis”, German Economic Review, 3(4), 379–414.
Fortin, N. (2005) Gender Role Attitudes and the Labour Market Outcomes
of Women Across OECD Countries. Oxford Review of Economic Policy
(forthcoming).
Kangasniemi, M. (2004) Occupational assignment, wage, and gender in Finnish
Manufacturing. Unpublished Manuscript, London School of Economics.
Kuhn, P. (1993) Demographic Groups and Personnel Policy. Labour Economics,
1(1), 49–70.
Kunze, A. (2003): Gender Differences in Entry Wages and Early Career Wages,
Annales d’Economie et Statistique, 71/72, pp. 245-266.
Kunze, A. (2005) The Evolution of the Gender Wage Gap, Labour Economics,
12, pp.73-97, 2005.
Light, A. and M. Ureta (1992) Panel Estimates of Male and Female Job Turnover
Behavior: Can Female Nonquitters be identified? Journal of Labor Eco-
nomics, 10, 156–181.
22
Light, Audrey, and Ureta, Manuelita (1995). Early-career work experience and
gender wage differentials. Journal of Labor Economics. 13(1). pp.121-154.
Loprest, P.J. (1992) Gender Differences in Wage Growth and Job Mobility.
American Economic Review, 82(2), 526–532.
Machado, J. and Mata, J. (2005) Counterfactual Decomposition of Changes in
Wage Distributions Using Quantile Regression. Journal of Applied Econo-
metrics (forthcoming).
Miller, P. (1987) The wage effect of occupational segregation of women in Britain.
Economic Journal, 97, 885-896.
Munch, J. (1992) Das Berufsbildungssystem in der Bundesrepublik Deutschland.
European Centre for the Development of Vocational Training (CEDEFOP),
Berlin.
OECD (2004) Education at a Glance - OECD Indicators. OECD, Paris.
Oaxaca, Ronald (1973). Male-female wage differentials in urban labor markets.
International Economic Review. 14(3). pp.693-709.
Paglin, M. and A.M. Rudolfo (1990) Heterogeneous Human Capital, Occupa-
tional Choice, and Male–Female Earnings Differences. Journal of Labor
Economics, 8(1), 123–144 (Part 1).
Polachek, S.W. (1981) Occupational Self–Selection: A Human Capital Approach
to Sex Differences in Occupational Structure. Review of Economics and
Statistics, 63(1), 60–69.
Royalty, A.B. (1996) The Effects of Job Turnover on the Training of Men and
Women. Industrial and Labor Relations Review, 49(3), 506-521.
Topel. R.H. and M.P. Ward (1992) Job Mobility and the Careers of Young Men.
The Quarterly Journal of Economics, 439–479.
Werwatz, A. (2002) Mobility after Apprenticeship: How effective is the German
Apprenticeship System? Applied Economics Quarterly, 48(3–4), 279–303.
23
Appendix
Methodological Aspects
Normalization of interaction terms to obtain average gender differences
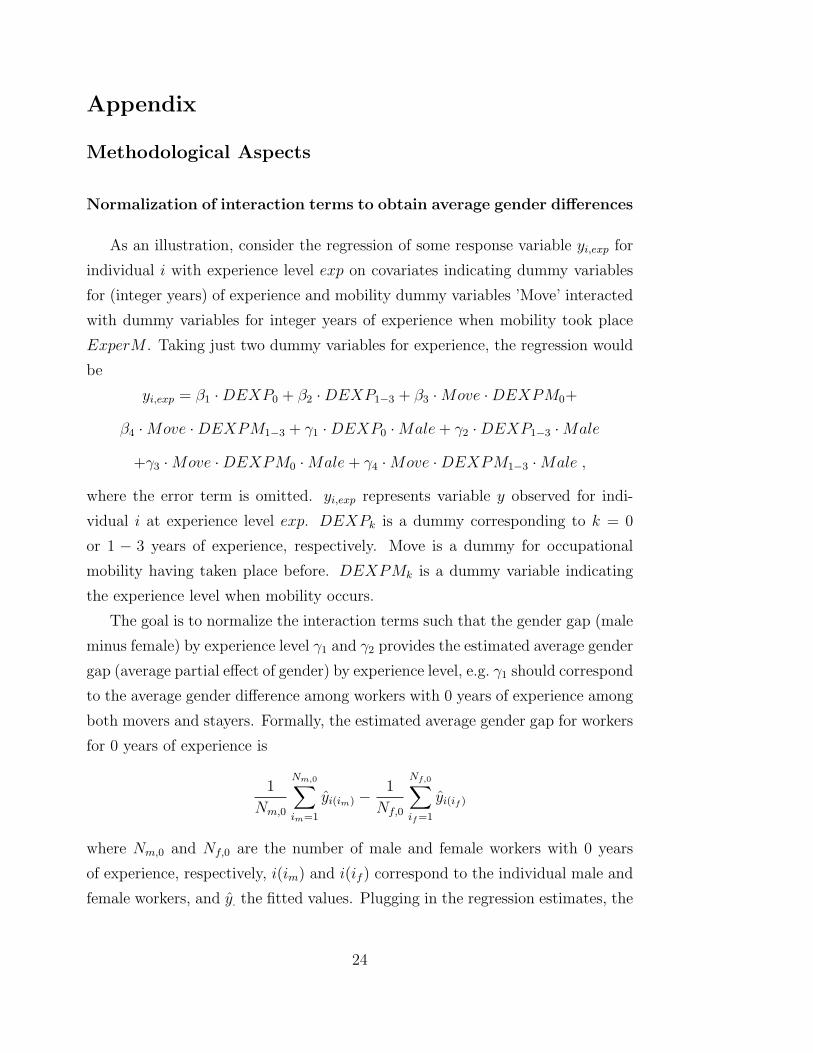
As an illustration, consider the regression of some response variable yi,exp for
individual i with experience level exp on covariates indicating dummy variables
for (integer years) of experience and mobility dummy variables ’Move’ interacted
with dummy variables for integer years of experience when mobility took place
ExperM . Taking just two dummy variables for experience, the regression would
be
yi,exp = β1 ·DEXP0 + β2 ·DEXP1−3 + β3 ·Move ·DEXPM0+
β4 ·Move ·DEXPM1−3 + γ1 ·DEXP0 ·Male + γ2 ·DEXP1−3 ·Male
+γ3 ·Move ·DEXPM0 ·Male + γ4 ·Move ·DEXPM1−3 ·Male ,
where the error term is omitted. yi,exp represents variable y observed for indi-
vidual i at experience level exp. DEXPk is a dummy corresponding to k = 0
or 1 − 3 years of experience, respectively. Move is a dummy for occupational
mobility having taken place before. DEXPMk is a dummy variable indicating
the experience level when mobility occurs.
The goal is to normalize the interaction terms such that the gender gap (male
minus female) by experience level γ1 and γ2 provides the estimated average gender
gap (average partial effect of gender) by experience level, e.g. γ1 should correspond
to the average gender difference among workers with 0 years of experience among
both movers and stayers. Formally, the estimated average gender gap for workers
for 0 years of experience is
1
Nm,0
Nm,0∑im=1
yi(im) − 1
Nf,0
Nf,0∑if=1
yi(if )
where Nm,0 and Nf,0 are the number of male and female workers with 0 years
of experience, respectively, i(im) and i(if ) correspond to the individual male and
female workers, and y. the fitted values. Plugging in the regression estimates, the
24
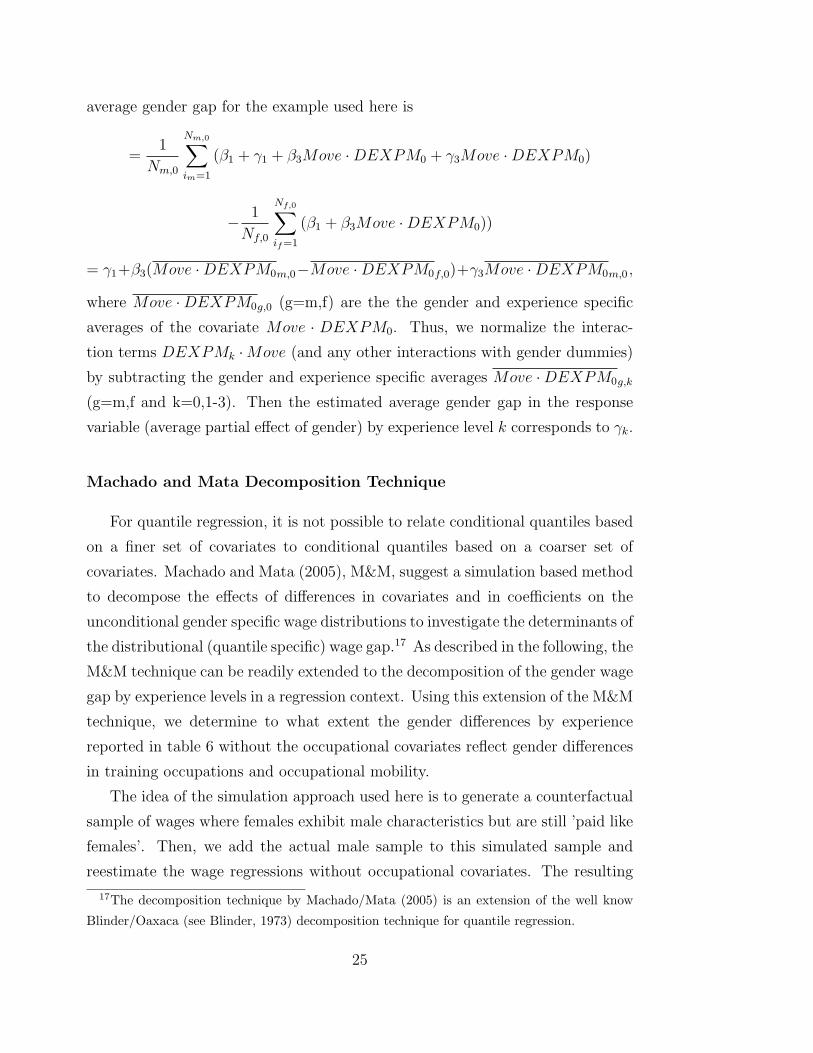
average gender gap for the example used here is
=1
Nm,0
Nm,0∑im=1
(β1 + γ1 + β3Move ·DEXPM0 + γ3Move ·DEXPM0)
− 1
Nf,0
Nf,0∑if=1
(β1 + β3Move ·DEXPM0))
= γ1+β3(Move ·DEXPM0m,0−Move ·DEXPM0f,0)+γ3Move ·DEXPM0m,0 ,
where Move ·DEXPM0g,0 (g=m,f) are the the gender and experience specific
averages of the covariate Move · DEXPM0. Thus, we normalize the interac-
tion terms DEXPMk ·Move (and any other interactions with gender dummies)
by subtracting the gender and experience specific averages Move ·DEXPM0g,k
(g=m,f and k=0,1-3). Then the estimated average gender gap in the response
variable (average partial effect of gender) by experience level k corresponds to γk.
Machado and Mata Decomposition Technique
For quantile regression, it is not possible to relate conditional quantiles based
on a finer set of covariates to conditional quantiles based on a coarser set of
covariates. Machado and Mata (2005), M&M, suggest a simulation based method
to decompose the effects of differences in covariates and in coefficients on the
unconditional gender specific wage distributions to investigate the determinants of
the distributional (quantile specific) wage gap.17 As described in the following, the
M&M technique can be readily extended to the decomposition of the gender wage
gap by experience levels in a regression context. Using this extension of the M&M
technique, we determine to what extent the gender differences by experience
reported in table 6 without the occupational covariates reflect gender differences
in training occupations and occupational mobility.
The idea of the simulation approach used here is to generate a counterfactual
sample of wages where females exhibit male characteristics but are still ’paid like
females’. Then, we add the actual male sample to this simulated sample and
reestimate the wage regressions without occupational covariates. The resulting
17The decomposition technique by Machado/Mata (2005) is an extension of the well know
Blinder/Oaxaca (see Blinder, 1973) decomposition technique for quantile regression.
25

gender wage gap by experience is corrected for differences in these occupational
covariates (and only these because we still control for experience and character-
istics at entry). The counterfactual simulation is based on coefficient estimates
based only on the female sample. In contrast, the second set of estimates in ta-
ble 6 (with occupational variables), estimates the same coefficients for males and
females for all covariates except experience and the mobility variables.
Based on the simplication of the M&M techniques suggested in Albrecht et
al. (2002), we use the following procedure to simulate the counterfactual sample
for females:
1. Using the original female data set, estimate the quantile regression coeffi-
cient vector βf (θ) for each percentile θ = .01, .02, . . . , .99.
2. Using the male sample, draw independently for each observation i in this
sample a corresponding percentile θi from the uniform, discrete distribution
on all percentiles θ = .01, .02, . . . , .99.
3. The counterfactual wages for females in the sample with the male character-
istics (the initial male sample) are then generated as {log(w∗i ) = xm
i βf (θi)}.
26
Tables and Figures
Table 1: Coding of Consolidated 2-digit Occupation Vari-
able occ2d
Consolidated 2-digit code Comprises the
following 2-digit
occupations
Comprises the
following val-
ues of variable
’beruf’ (occorg)
in IABS
1 1–4 1,2
5 5,6 3,4
7 7–9 5
10 10,11 6
12 12,13 7
14 14 8,9
15 15 10
16 16 11
17 17 12
18 18 13
19 19 14
20 20 15
21 21 16
22 22 17–19
23 23 20
24 24 21
25 25,26 22,23
27 27 24–27
28 28 28–30
29 29 31
30 30 32
31 31 33–35
32 32 36–38
Continued on next page
27
Consolidated 2-digit code Comprises the
following 2-digit
occupations
Comprises the
following val-
ues of variable
’beruf’ (occorg)
in IABS
33 33,34 39
35 35,36 40,41
37 37 42
39 39 43
40 40 44
41 41 45
42 42,43 46
44 44 47,48
45 45 49,50
46 46 51
47 47 52,53
48 48 54
49 49 55
50 50 56
51 51 57,58
52 52 59,60
54 54 62
60 60 63–67
61 61,62 68–73
63 63 74–75
68 68 76–79
69 69 80,81
70 70 82,83
71 71 84–86
72 72 87
73 73 88,89
74 74 90–92
Continued on next page
28
Consolidated 2-digit code Comprises the
following 2-digit
occupations
Comprises the
following val-
ues of variable
’beruf’ (occorg)
in IABS
75 75 93,94
76 76 95
77 77 96–99
78 78 100–103
79 79–81 104–106
82 82 107
83 83 108
84 84 109
85 85 110–114
86 86 115–117
87 87 118,119
88 88 120
90 90 121
91 91 121–124
92 92 125
93 93 126–129
98 98 61,130
Note: The information for this table is taken from the data description for the
IAB employment subsample and the content under the label “Berufe im Spiegel
der Statistik” on http://www.pallas.iab.de/bisds/berufsgliederung.asp .
29
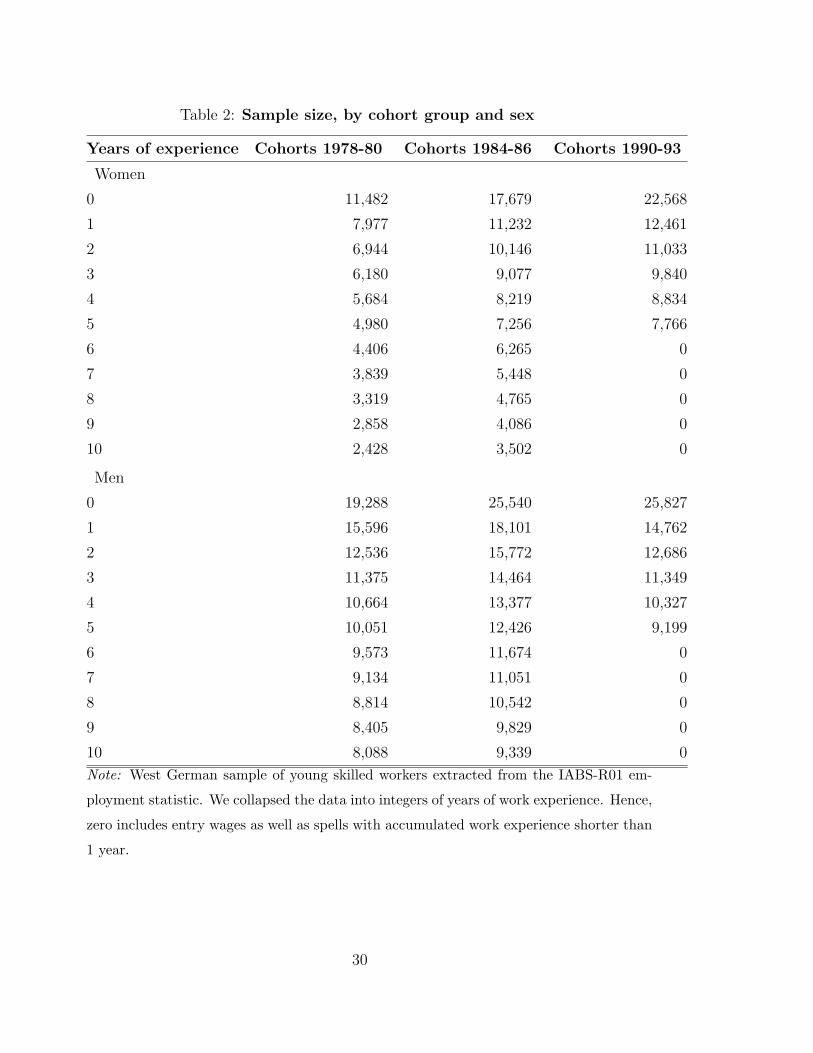
Table 2: Sample size, by cohort group and sex
Years of experience Cohorts 1978-80 Cohorts 1984-86 Cohorts 1990-93
Women
0 11,482 17,679 22,568
1 7,977 11,232 12,461
2 6,944 10,146 11,033
3 6,180 9,077 9,840
4 5,684 8,219 8,834
5 4,980 7,256 7,766
6 4,406 6,265 0
7 3,839 5,448 0
8 3,319 4,765 0
9 2,858 4,086 0
10 2,428 3,502 0
Men
0 19,288 25,540 25,827
1 15,596 18,101 14,762
2 12,536 15,772 12,686
3 11,375 14,464 11,349
4 10,664 13,377 10,327
5 10,051 12,426 9,199
6 9,573 11,674 0
7 9,134 11,051 0
8 8,814 10,542 0
9 8,405 9,829 0
10 8,088 9,339 0
Note: West German sample of young skilled workers extracted from the IABS-R01 em-
ployment statistic. We collapsed the data into integers of years of work experience. Hence,
zero includes entry wages as well as spells with accumulated work experience shorter than
1 year.
30
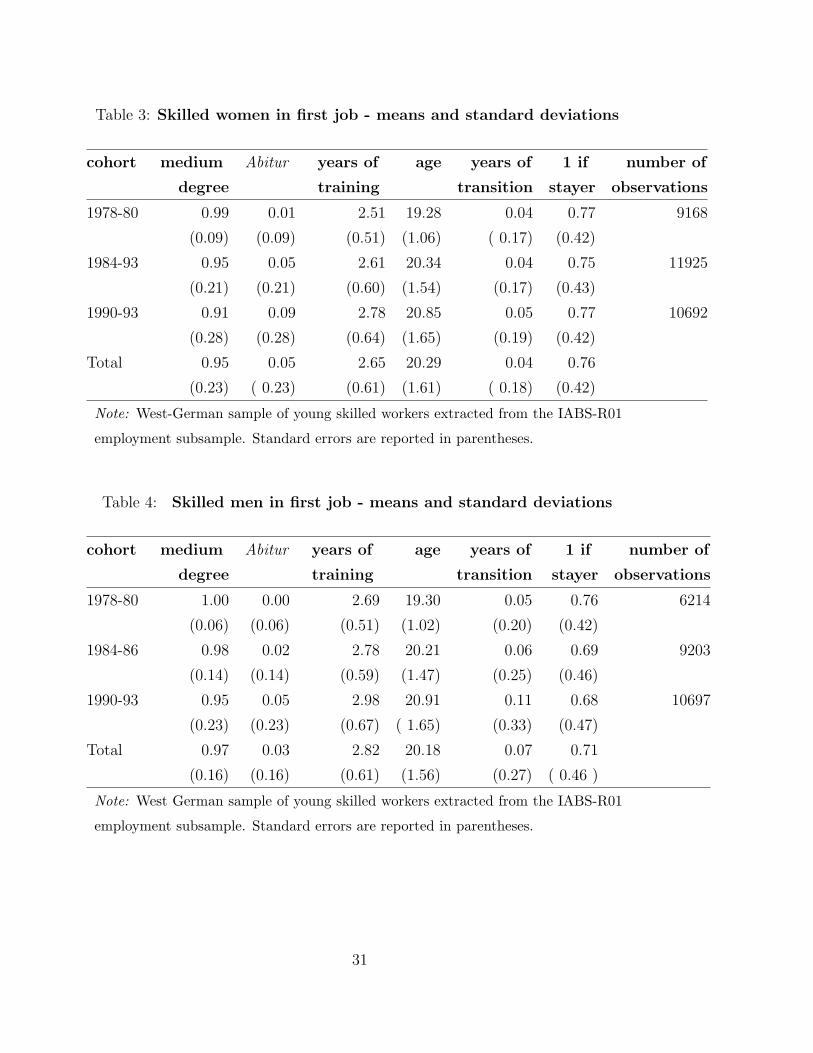
Table 3: Skilled women in first job - means and standard deviations
cohort medium Abitur years of age years of 1 if number of
degree training transition stayer observations
1978-80 0.99 0.01 2.51 19.28 0.04 0.77 9168
(0.09) (0.09) (0.51) (1.06) ( 0.17) (0.42)
1984-93 0.95 0.05 2.61 20.34 0.04 0.75 11925
(0.21) (0.21) (0.60) (1.54) (0.17) (0.43)
1990-93 0.91 0.09 2.78 20.85 0.05 0.77 10692
(0.28) (0.28) (0.64) (1.65) (0.19) (0.42)
Total 0.95 0.05 2.65 20.29 0.04 0.76
(0.23) ( 0.23) (0.61) (1.61) ( 0.18) (0.42)
Note: West-German sample of young skilled workers extracted from the IABS-R01
employment subsample. Standard errors are reported in parentheses.
Table 4: Skilled men in first job - means and standard deviations
cohort medium Abitur years of age years of 1 if number of
degree training transition stayer observations
1978-80 1.00 0.00 2.69 19.30 0.05 0.76 6214
(0.06) (0.06) (0.51) (1.02) (0.20) (0.42)
1984-86 0.98 0.02 2.78 20.21 0.06 0.69 9203
(0.14) (0.14) (0.59) (1.47) (0.25) (0.46)
1990-93 0.95 0.05 2.98 20.91 0.11 0.68 10697
(0.23) (0.23) (0.67) ( 1.65) (0.33) (0.47)
Total 0.97 0.03 2.82 20.18 0.07 0.71
(0.16) (0.16) (0.61) (1.56) (0.27) ( 0.46 )
Note: West German sample of young skilled workers extracted from the IABS-R01
employment subsample. Standard errors are reported in parentheses.
31
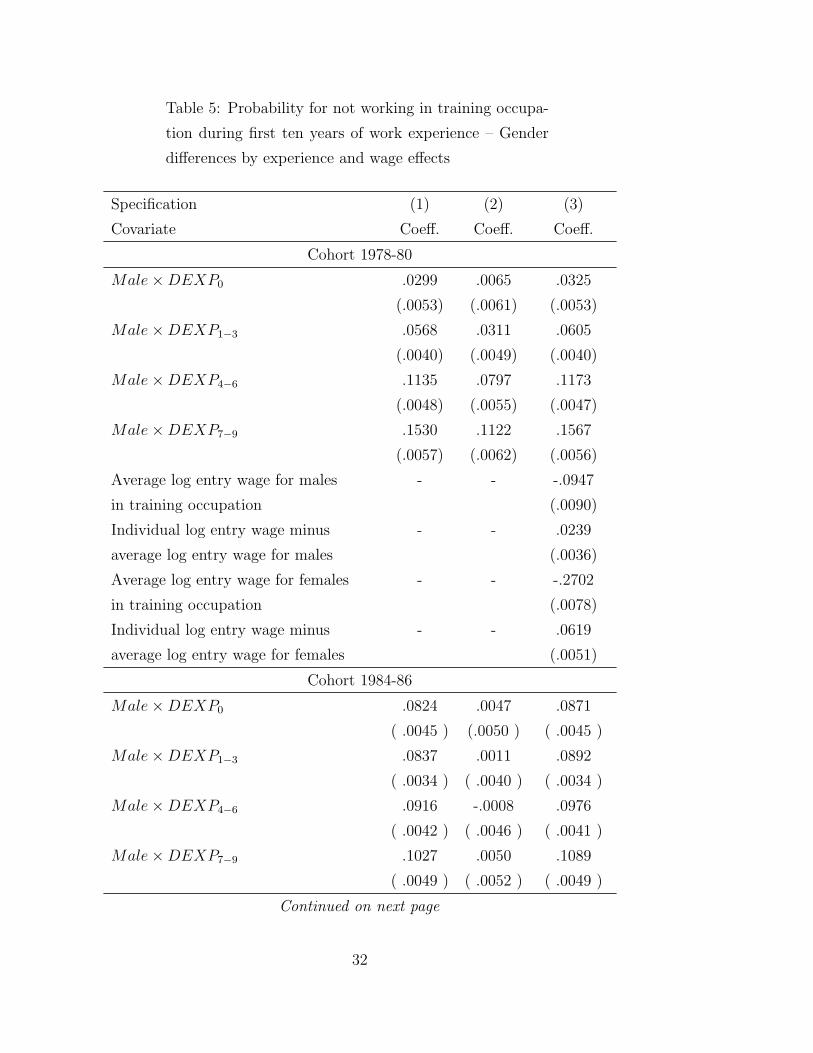
Table 5: Probability for not working in training occupa-
tion during first ten years of work experience – Gender
differences by experience and wage effects
Specification (1) (2) (3)
Covariate Coeff. Coeff. Coeff.
Cohort 1978-80
Male×DEXP0 .0299 .0065 .0325
(.0053) (.0061) (.0053)
Male×DEXP1−3 .0568 .0311 .0605
(.0040) (.0049) (.0040)
Male×DEXP4−6 .1135 .0797 .1173
(.0048) (.0055) (.0047)
Male×DEXP7−9 .1530 .1122 .1567
(.0057) (.0062) (.0056)
Average log entry wage for males - - -.0947
in training occupation (.0090)
Individual log entry wage minus - - .0239
average log entry wage for males (.0036)
Average log entry wage for females - - -.2702
in training occupation (.0078)
Individual log entry wage minus - - .0619
average log entry wage for females (.0051)
Cohort 1984-86
Male×DEXP0 .0824 .0047 .0871
( .0045 ) (.0050 ) ( .0045 )
Male×DEXP1−3 .0837 .0011 .0892
( .0034 ) ( .0040 ) ( .0034 )
Male×DEXP4−6 .0916 -.0008 .0976
( .0042 ) ( .0046 ) ( .0041 )
Male×DEXP7−9 .1027 .0050 .1089
( .0049 ) ( .0052 ) ( .0049 )
Continued on next page
32
Specification (1) (2) (3)
Covariate Coeff. Coeff. Coeff.
Average log entry wage for males - - -.1082
in training occupation ( .0084 )
Individual log entry wage minus - - .0688
average log entry wage for males ( .0034 )
Average log entry wage for females - - -.4091
in training occupation ( .0076 )
Individual log entry wage minus - - .0712
average log entry wage for females ( .0053 )
Cohort 1990-93
Male×DEXP0 .1289 .0176 .1297
( .0041 ) ( .0047 ) ( .0041 )
Male×DEXP1−3 .1491 .0360 .1501
( .0035 ) ( .0042 ) ( .0035 )
Male×DEXP4−5 .1474 .0303 .1485
( .0050 ) ( .0054 ) ( .0050 )
Average log entry wage for males - - .0053
in training occupation ( .0120 )
Individual log entry wage minus - - -.0449
average log entry wage for males ( .0051 )
Average log entry wage for females - - -.3075
in training occupation ( .0103 )
Individual log entry wage minus - - -.0261
average log entry wage for females ( .0058 )
Dummies for training occupation NO YES NOAll specifications include the following covariates: age at entry, duration of
apprenticeship, abitur, prior experience, transition, and linear time trend.
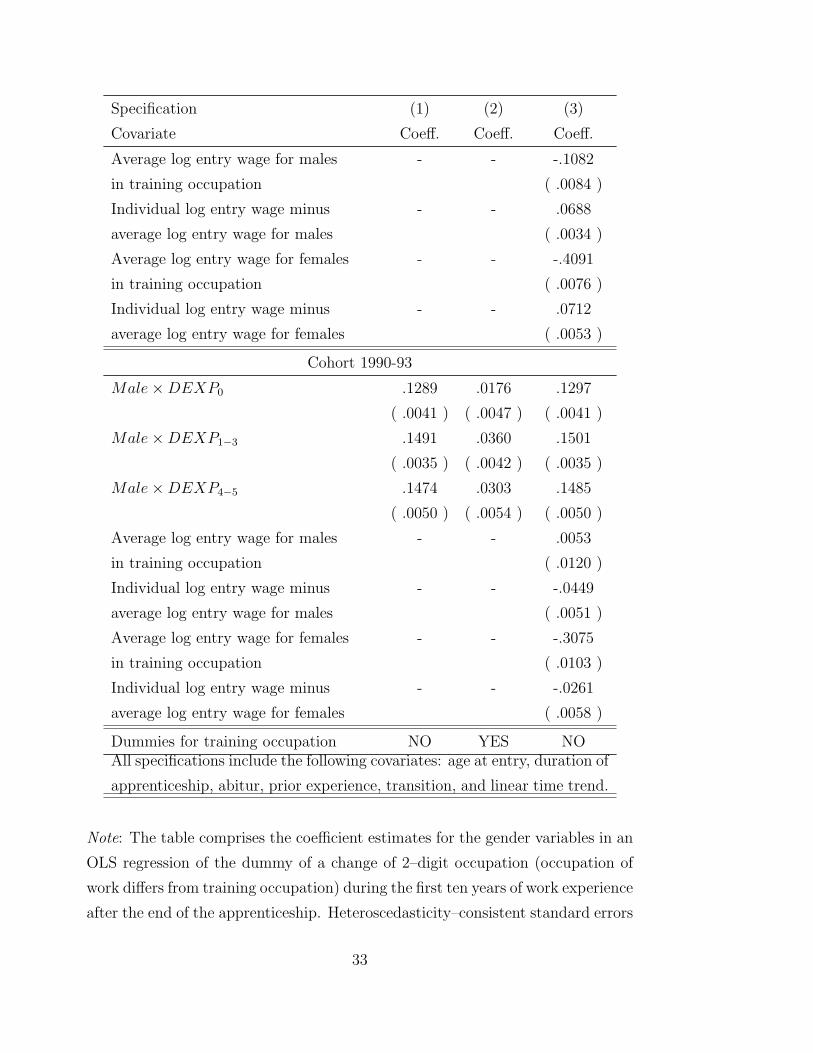
Note: The table comprises the coefficient estimates for the gender variables in an
OLS regression of the dummy of a change of 2–digit occupation (occupation of
work differs from training occupation) during the first ten years of work experience
after the end of the apprenticeship. Heteroscedasticity–consistent standard errors
33
are reported in parentheses. For the entry wage, we use the wage in the first
employment spell after the end of the apprenticeship irrespective of whether the
occupation of work is the same as the training occupation. For all interaction
terms of wage variables with gender dummies, the wage variable is normalized
such that the estimated coefficients for the gender–experience dummy variables
reflect the average gender difference for this experience level holding all other
covariates constant, see section on methodological aspects in appendix for details.
34
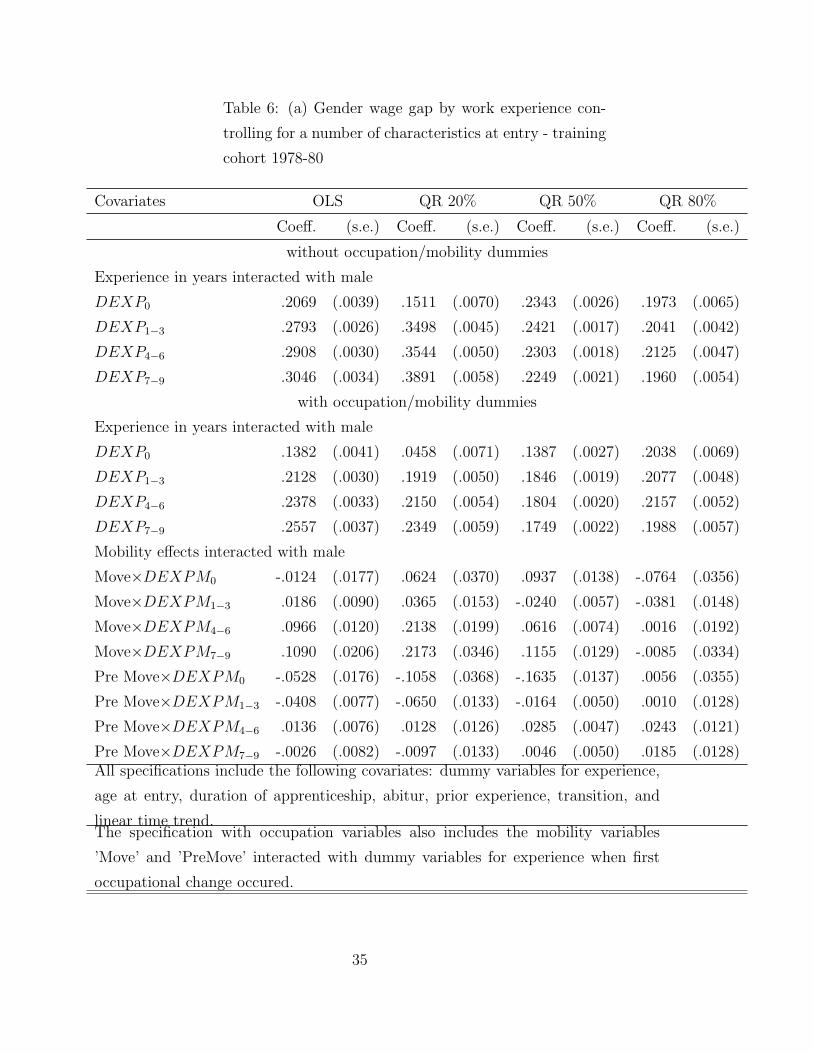
Table 6: (a) Gender wage gap by work experience con-
trolling for a number of characteristics at entry - training
cohort 1978-80
Covariates OLS QR 20% QR 50% QR 80%
Coeff. (s.e.) Coeff. (s.e.) Coeff. (s.e.) Coeff. (s.e.)
without occupation/mobility dummies
Experience in years interacted with male
DEXP0 .2069 (.0039) .1511 (.0070) .2343 (.0026) .1973 (.0065)
DEXP1−3 .2793 (.0026) .3498 (.0045) .2421 (.0017) .2041 (.0042)
DEXP4−6 .2908 (.0030) .3544 (.0050) .2303 (.0018) .2125 (.0047)
DEXP7−9 .3046 (.0034) .3891 (.0058) .2249 (.0021) .1960 (.0054)
with occupation/mobility dummies
Experience in years interacted with male
DEXP0 .1382 (.0041) .0458 (.0071) .1387 (.0027) .2038 (.0069)
DEXP1−3 .2128 (.0030) .1919 (.0050) .1846 (.0019) .2077 (.0048)
DEXP4−6 .2378 (.0033) .2150 (.0054) .1804 (.0020) .2157 (.0052)
DEXP7−9 .2557 (.0037) .2349 (.0059) .1749 (.0022) .1988 (.0057)
Mobility effects interacted with male
Move×DEXPM0 -.0124 (.0177) .0624 (.0370) .0937 (.0138) -.0764 (.0356)
Move×DEXPM1−3 .0186 (.0090) .0365 (.0153) -.0240 (.0057) -.0381 (.0148)
Move×DEXPM4−6 .0966 (.0120) .2138 (.0199) .0616 (.0074) .0016 (.0192)
Move×DEXPM7−9 .1090 (.0206) .2173 (.0346) .1155 (.0129) -.0085 (.0334)
Pre Move×DEXPM0 -.0528 (.0176) -.1058 (.0368) -.1635 (.0137) .0056 (.0355)
Pre Move×DEXPM1−3 -.0408 (.0077) -.0650 (.0133) -.0164 (.0050) .0010 (.0128)
Pre Move×DEXPM4−6 .0136 (.0076) .0128 (.0126) .0285 (.0047) .0243 (.0121)
Pre Move×DEXPM7−9 -.0026 (.0082) -.0097 (.0133) .0046 (.0050) .0185 (.0128)All specifications include the following covariates: dummy variables for experience,
age at entry, duration of apprenticeship, abitur, prior experience, transition, and
linear time trend.The specification with occupation variables also includes the mobility variables
’Move’ and ’PreMove’ interacted with dummy variables for experience when first
occupational change occured.
35

Table 6: (b) Gender wage gap by work experience con-
trolling for a number of characteristics at entry - training
cohort 1984-86
Covariates OLS QR 20% QR 50% QR 80%
Coeff. (s.e.) Coeff. (s.e.) Coeff. (s.e.) Coeff. (s.e.)
without occupation/mobility dummies
Experience in years interacted with male
DEXP0 .2144 (.0033) .1959 (.0059) .2390 (.0022) .2013 (.0056)
DEXP1−3 .2669 (.0023) .3103 (.0039) .2387 (.0014) .2248 (.0037)
DEXP4−6 .2280 (.0026) .2518 (.0043) .1881 (.0016) .1743 (.0041)
DEXP7−9 .2015 (.0030) .2117 (.0050) .1480 (.0018) .1373 (.0047)
with occupation/mobility dummies
Experience in years interacted with male
DEXP0 .1562 (.0034) .0895 (.0060) .1666 (.0022) .1947 (.0058)
DEXP1−3 .2145 (.0026) .1870 (.0042) .1860 (.0016) .2163 (.0041)
DEXP4−6 .1835 (.0028) .1480 (.0045) .1396 (.0017) .1661 (.0044)
DEXP7−9 .1609 (.0031) .1083 (.0050) .1036 (.0019) .1306 (.0049)
Mobility effects interacted with male
Move×DEXPM0 -.0079 (.0171) .0708 (.0365) .0033 (.0137) -.0554 (.0354)
Move×DEXPM1−3 .0135 (.0076) .0421 (.0128) -.0222 (.0048) -.0262 (.0124)
Move×DEXPM4−6 .0329 (.0096) .0184 (.0157) -.0283 (.0059) -.0037 (.0152)
Move×DEXPM7−9 .1150 (.0193) .0356 (.0323) .0485 (.0121) .0459 (.0313)
Pre Move×DEXPM0 -.0413 (.0170) -.1100 (.0364) -.0632 (.0136) .0083 (.0352)
Pre Move×DEXPM1−3 -.0197 (.0065) -.0481 (.0110) .0072 (.0041) .0189 (.0107)
Pre Move×DEXPM4−6 -.0033 (.0063) -.0117 (.0103) .0142 (.0039) .0199 (.0100)
Pre Move×DEXPM7−9 -.0073 (.0080) .0047 (.0130) .0152 (.0049) .0205 (.0126)All specifications include the following covariates: dummy variables for experience,
age at entry, duration of apprenticeship, abitur, prior experience, transition, and
linear time trend.The specification with occupation variables also includes the mobility variables
’Move’ and ’PreMove’ interacted with dummy variables for experience when first
occupational change occured.
36
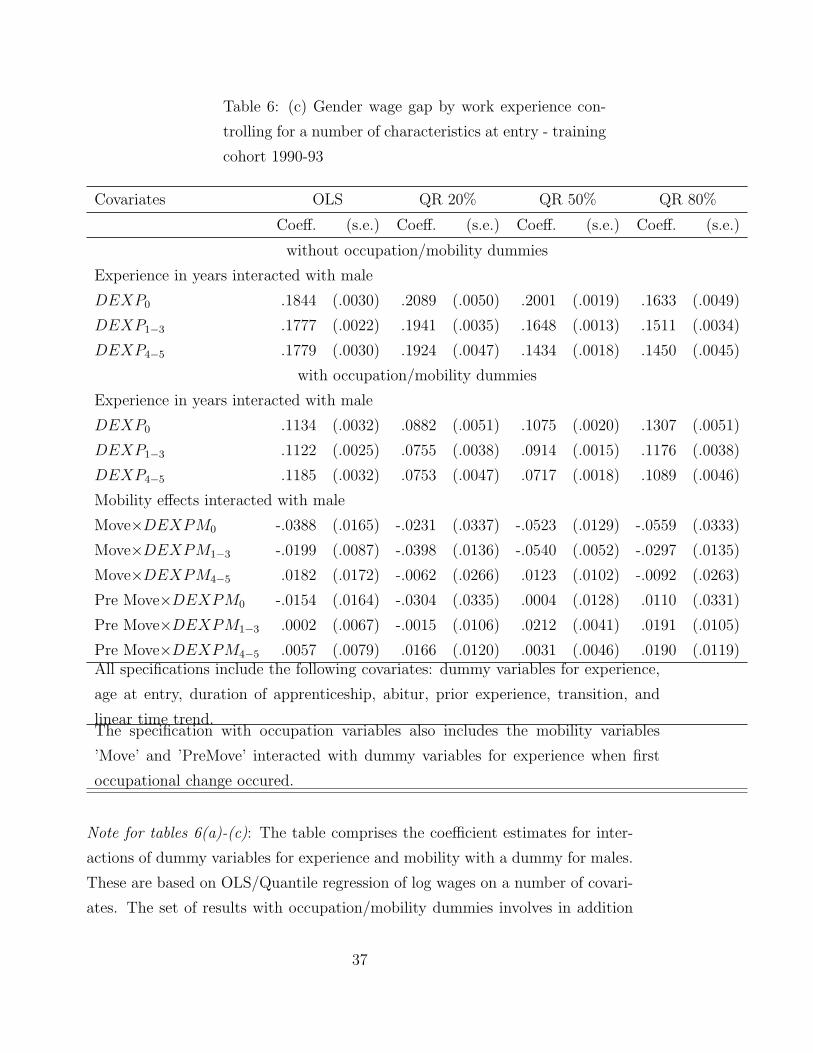
Table 6: (c) Gender wage gap by work experience con-
trolling for a number of characteristics at entry - training
cohort 1990-93
Covariates OLS QR 20% QR 50% QR 80%
Coeff. (s.e.) Coeff. (s.e.) Coeff. (s.e.) Coeff. (s.e.)
without occupation/mobility dummies
Experience in years interacted with male
DEXP0 .1844 (.0030) .2089 (.0050) .2001 (.0019) .1633 (.0049)
DEXP1−3 .1777 (.0022) .1941 (.0035) .1648 (.0013) .1511 (.0034)
DEXP4−5 .1779 (.0030) .1924 (.0047) .1434 (.0018) .1450 (.0045)
with occupation/mobility dummies
Experience in years interacted with male
DEXP0 .1134 (.0032) .0882 (.0051) .1075 (.0020) .1307 (.0051)
DEXP1−3 .1122 (.0025) .0755 (.0038) .0914 (.0015) .1176 (.0038)
DEXP4−5 .1185 (.0032) .0753 (.0047) .0717 (.0018) .1089 (.0046)
Mobility effects interacted with male
Move×DEXPM0 -.0388 (.0165) -.0231 (.0337) -.0523 (.0129) -.0559 (.0333)
Move×DEXPM1−3 -.0199 (.0087) -.0398 (.0136) -.0540 (.0052) -.0297 (.0135)
Move×DEXPM4−5 .0182 (.0172) -.0062 (.0266) .0123 (.0102) -.0092 (.0263)
Pre Move×DEXPM0 -.0154 (.0164) -.0304 (.0335) .0004 (.0128) .0110 (.0331)
Pre Move×DEXPM1−3 .0002 (.0067) -.0015 (.0106) .0212 (.0041) .0191 (.0105)
Pre Move×DEXPM4−5 .0057 (.0079) .0166 (.0120) .0031 (.0046) .0190 (.0119)All specifications include the following covariates: dummy variables for experience,
age at entry, duration of apprenticeship, abitur, prior experience, transition, and
linear time trend.The specification with occupation variables also includes the mobility variables
’Move’ and ’PreMove’ interacted with dummy variables for experience when first
occupational change occured.
Note for tables 6(a)-(c): The table comprises the coefficient estimates for inter-
actions of dummy variables for experience and mobility with a dummy for males.
These are based on OLS/Quantile regression of log wages on a number of covari-
ates. The set of results with occupation/mobility dummies involves in addition
37
dummy variables for 2–digit training occupations and gender specific dummy vari-
ables for occupational mobility (also interacted with integer years of experience
ExperM when the first occupational change occured). The ’move effect’ dummy
is one after the first occupational change has occured. The ’pre mover’ dummy
is one for all observations for individuals who report an occupational change dur-
ing the ten years of their work experience. For all interaction terms of mobility
variables with a gender dummy variable, the mobility variable is normalized such
that the estimated coefficients for the gender–experience dummy variables reflect
the average gender difference for this experience level holding all other covariates
constant, see section on methodological aspects in appendix for details.
38
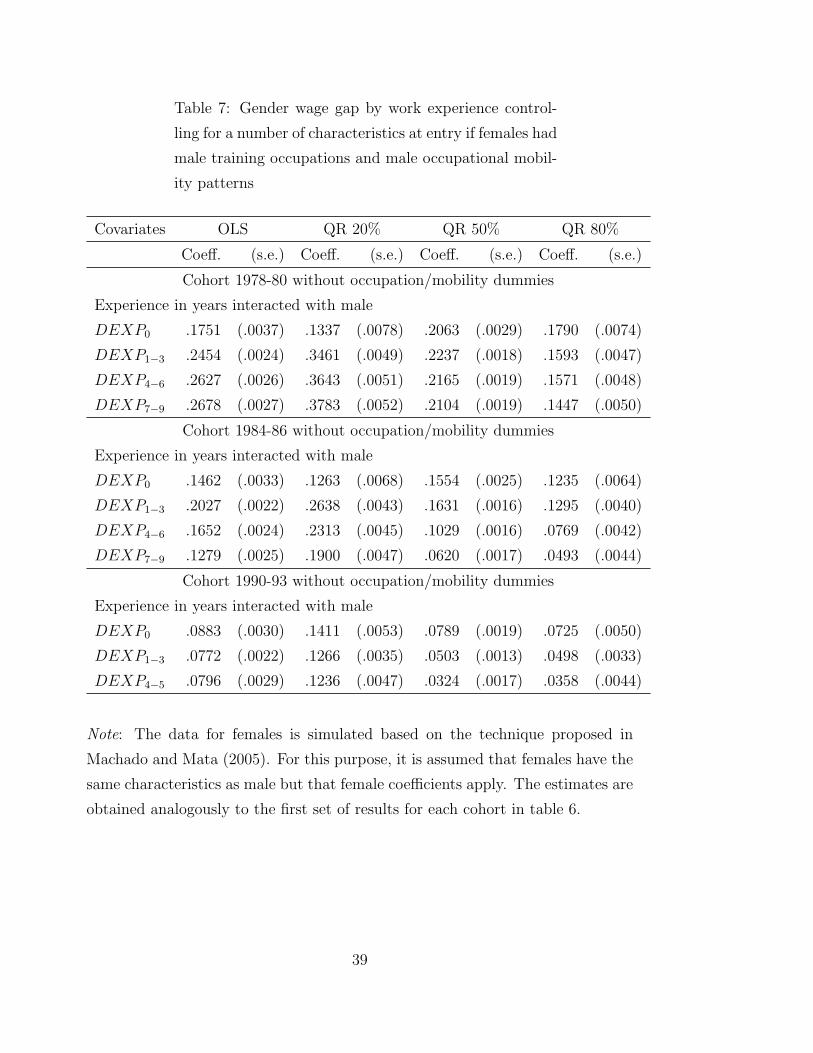
Table 7: Gender wage gap by work experience control-
ling for a number of characteristics at entry if females had
male training occupations and male occupational mobil-
ity patterns
Covariates OLS QR 20% QR 50% QR 80%
Coeff. (s.e.) Coeff. (s.e.) Coeff. (s.e.) Coeff. (s.e.)
Cohort 1978-80 without occupation/mobility dummies
Experience in years interacted with male
DEXP0 .1751 (.0037) .1337 (.0078) .2063 (.0029) .1790 (.0074)
DEXP1−3 .2454 (.0024) .3461 (.0049) .2237 (.0018) .1593 (.0047)
DEXP4−6 .2627 (.0026) .3643 (.0051) .2165 (.0019) .1571 (.0048)
DEXP7−9 .2678 (.0027) .3783 (.0052) .2104 (.0019) .1447 (.0050)
Cohort 1984-86 without occupation/mobility dummies
Experience in years interacted with male
DEXP0 .1462 (.0033) .1263 (.0068) .1554 (.0025) .1235 (.0064)
DEXP1−3 .2027 (.0022) .2638 (.0043) .1631 (.0016) .1295 (.0040)
DEXP4−6 .1652 (.0024) .2313 (.0045) .1029 (.0016) .0769 (.0042)
DEXP7−9 .1279 (.0025) .1900 (.0047) .0620 (.0017) .0493 (.0044)
Cohort 1990-93 without occupation/mobility dummies
Experience in years interacted with male
DEXP0 .0883 (.0030) .1411 (.0053) .0789 (.0019) .0725 (.0050)
DEXP1−3 .0772 (.0022) .1266 (.0035) .0503 (.0013) .0498 (.0033)
DEXP4−5 .0796 (.0029) .1236 (.0047) .0324 (.0017) .0358 (.0044)
Note: The data for females is simulated based on the technique proposed in
Machado and Mata (2005). For this purpose, it is assumed that females have the
same characteristics as male but that female coefficients apply. The estimates are
obtained analogously to the first set of results for each cohort in table 6.
39
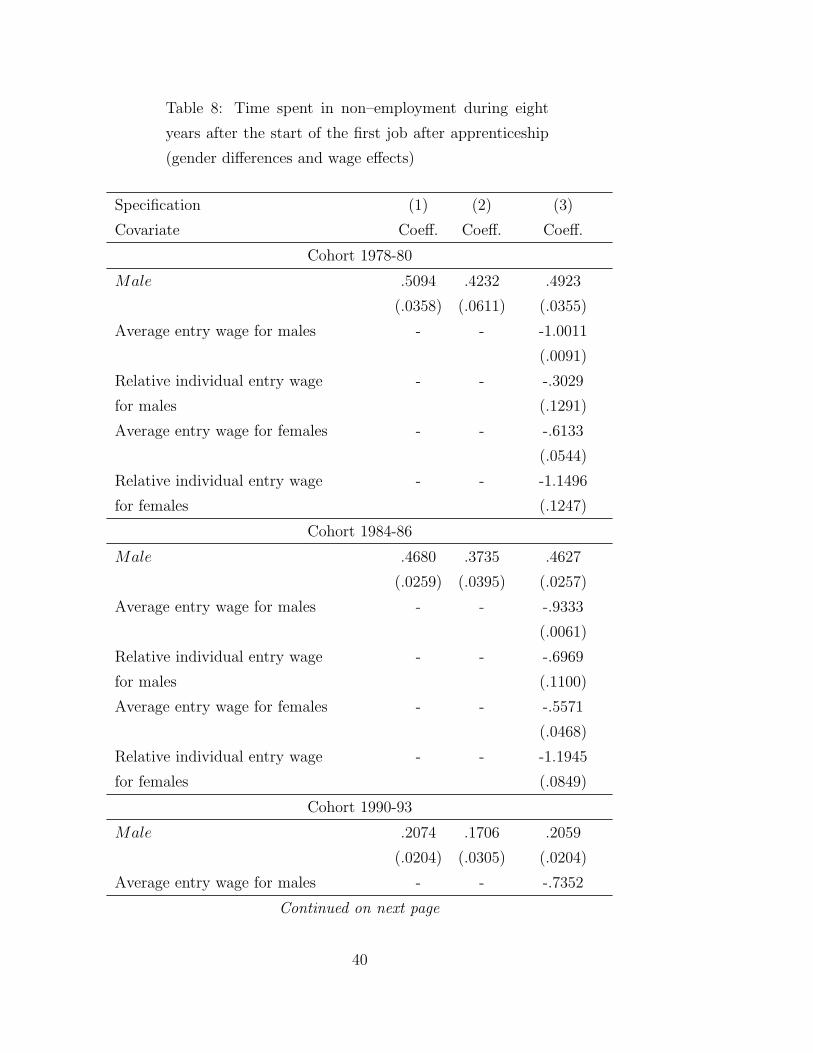
Table 8: Time spent in non–employment during eight
years after the start of the first job after apprenticeship
(gender differences and wage effects)
Specification (1) (2) (3)
Covariate Coeff. Coeff. Coeff.
Cohort 1978-80
Male .5094 .4232 .4923
(.0358) (.0611) (.0355)
Average entry wage for males - - -1.0011
(.0091)
Relative individual entry wage - - -.3029
for males (.1291)
Average entry wage for females - - -.6133
(.0544)
Relative individual entry wage - - -1.1496
for females (.1247)
Cohort 1984-86
Male .4680 .3735 .4627
(.0259) (.0395) (.0257)
Average entry wage for males - - -.9333
(.0061)
Relative individual entry wage - - -.6969
for males (.1100)
Average entry wage for females - - -.5571
(.0468)
Relative individual entry wage - - -1.1945
for females (.0849)
Cohort 1990-93
Male .2074 .1706 .2059
(.0204) (.0305) (.0204)
Average entry wage for males - - -.7352
Continued on next page
40
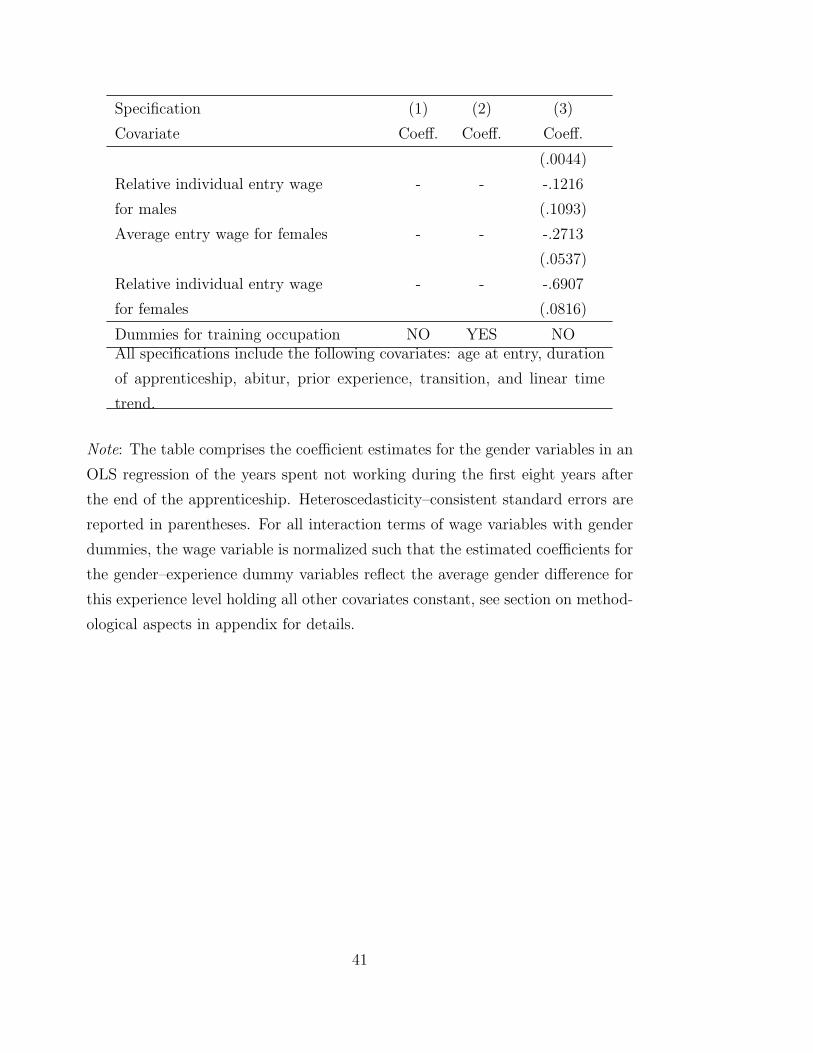
Specification (1) (2) (3)
Covariate Coeff. Coeff. Coeff.
(.0044)
Relative individual entry wage - - -.1216
for males (.1093)
Average entry wage for females - - -.2713
(.0537)
Relative individual entry wage - - -.6907
for females (.0816)
Dummies for training occupation NO YES NOAll specifications include the following covariates: age at entry, duration
of apprenticeship, abitur, prior experience, transition, and linear time
trend.
Note: The table comprises the coefficient estimates for the gender variables in an
OLS regression of the years spent not working during the first eight years after
the end of the apprenticeship. Heteroscedasticity–consistent standard errors are
reported in parentheses. For all interaction terms of wage variables with gender
dummies, the wage variable is normalized such that the estimated coefficients for
the gender–experience dummy variables reflect the average gender difference for
this experience level holding all other covariates constant, see section on method-
ological aspects in appendix for details.
41
Recommended