Martijn Tennekes
Heerlen, September 22, 2020
Visualization of origin-destination data& a generic zoning system for cities
Results a secondment at the University of Oxford and visit to the University of Leeds.

2
Executive summary
Secondment for 6 months
Output
Academic working paper on origin-destination visualization
A new visualization method, applied to commuting traffic
Collaboration with the University of Leeds on transport and mobility
First result: a zoning system for citieshttps://riseneeds.eu/

3
Visiting researcher in Oxford
Martijn Tennekes (CBS) and Min Chen (University of Oxford)
Computer Science buildingin Oxford

4
Origin-destination data
• Origin-destination (OD) data describe movements from origin to destination.
• Applications: migration, passenger transport, export of goods, movement of animals, spreading of deceases, etc.
• A raw OD dataset describes movements of individuals whereas an aggregated OD dataset describes countable flows of individuals.
• Example dataset: commuting flows between 390 Dutch municipalities.

5
Visualization of origin-destination data
World migration (Minard, 1858)Public transport (Harness, 1837)
6
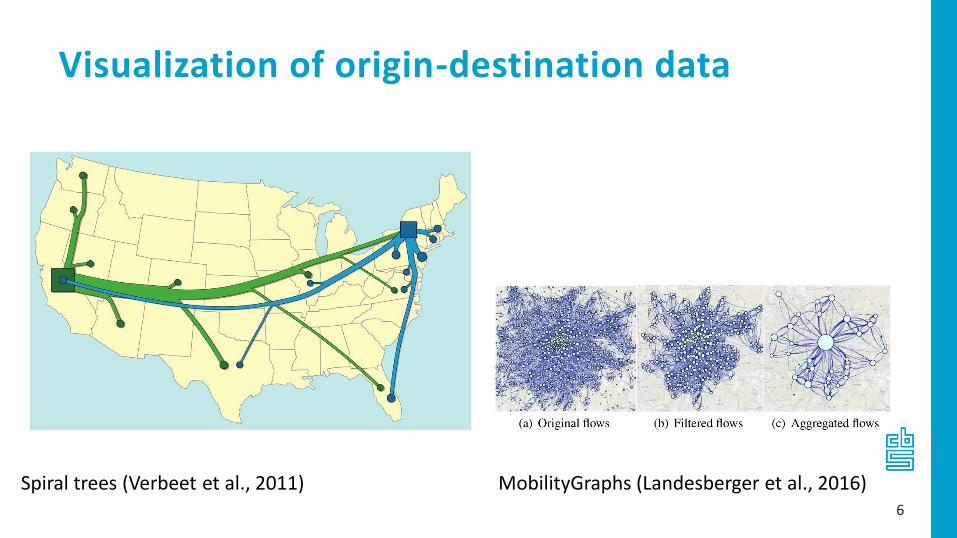
Visualization of origin-destination data
MobilityGraphs (Landesberger et al., 2016)Spiral trees (Verbeet et al., 2011)

7
Visualization of origin-destination data
OD maps (Wood et al., 2010)Circular plot (Abel et al., 2014)

8
Visualization of origin-destination data
Pattern maps (Yao et al., 2019)Flow diagrams (Adrienko et al., 2017)
9
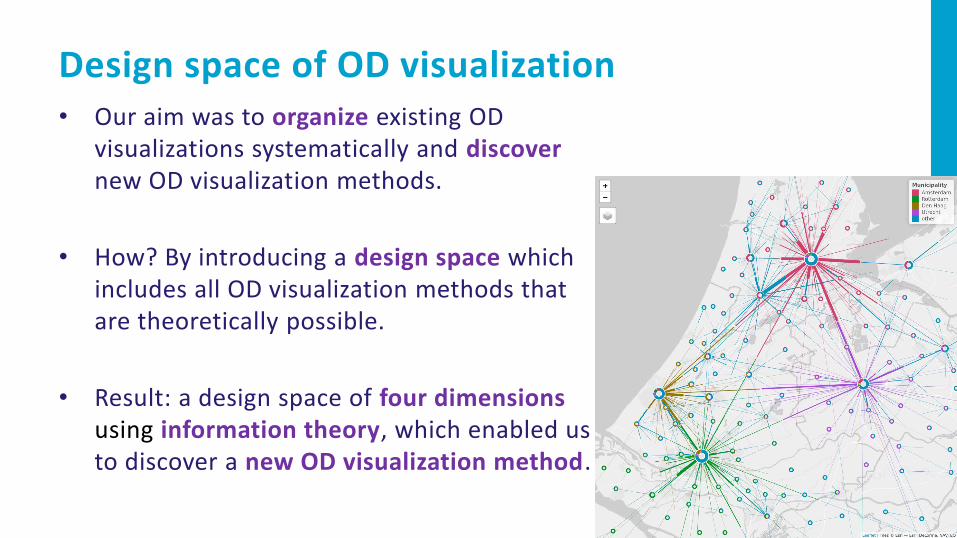
• Our aim was to organize existing OD visualizations systematically and discovernew OD visualization methods.
• How? By introducing a design space which includes all OD visualization methods that are theoretically possible.
• Result: a design space of four dimensions using information theory, which enabled us to discover a new OD visualization method.
Design space of OD visualization

10
• Information theory studies the quantification, storage and communication of information.
• It is (almost) impossible to retrieve the original datasetfrom a data visualization.
• However, visualization is often much more effective than showing raw data tables. Why?• Global overview is often more important than local details. • Showing less information helps reducing the time cost and
cognitive load.
• Information loss (entropy reduction) is key in data visualization. Central questions are: what information can be omitted and how?
Information Theory

11
Reducing information
original data(full information)
processed data(reduced information)

London Underground Map12
Is realistic always better?
Realistic locations

13
Background knowledge matters
Without knowing the locations of the cities, it is hard to use these maps

14
• An OD dataset contains of nodes and edges.
• Our design space consists of four dimensions:
1. Transformation of the node set
2. Transformation of the edge set
3. Transformation of individual nodes
4. Transformation of individual edges
• Dimensions 1 and 2 process the data structure (e.g. grouping nodes).
• Dimensions 3 and 4 process visual attributes (e.g. coordinates).
Our design space

15
Applied to exisiting OD visualizations

16
Dutch commuting
Transformations:
• F1: nodes are grouped by municipality
• F2: edges are grouped by same pair of nodes
• F4: missing arrowheads: dimension attenuation

17
Dutch commuting
Transformations:
• F2: filtering of edges
• F4: color coding: dimension enhancement

18
Dutch commuting
Transformations:
• F3: doughnuts: dimension enhancement
• F4: half-edges: dimension attenuation (length and direct path)
Link prototype:
http://www.mtennekes.nl/viz/commutingNL

19
• Information Theory has proven to be useful in visualization.
• “Less is more”: reducing information often leads to better visualizations.
• User and task dependency.
• A design space for OD visualizations enforces users to think about which information to loose and which to show.
• Doughnut map with halfway lines works well for commuting data, but not necessarily for other OD datasets.
Discussion
20
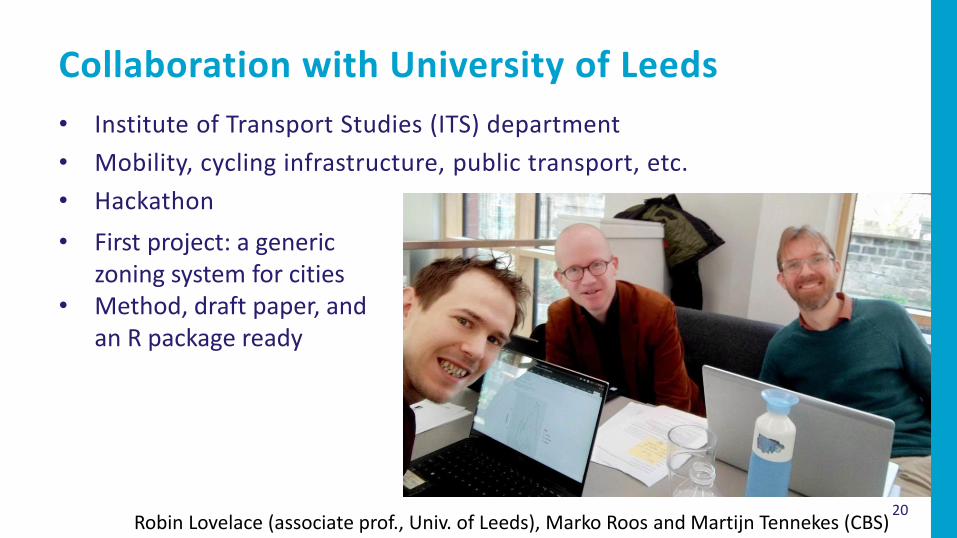
• Institute of Transport Studies (ITS) department
• Mobility, cycling infrastructure, public transport, etc.
• Hackathon
Collaboration with University of Leeds
Robin Lovelace (associate prof., Univ. of Leeds), Marko Roos and Martijn Tennekes (CBS)
• First project: a generic zoning system for cities
• Method, draft paper, and an R package ready

21
• Why? For general navigation. For statistical comparison between cities For transport modeling.
• Current administrative regions vary a lot between and within cities (e.g. postal code, neighbourhoods etc.).
• A tiling system (e.g. 100 x 100 meter tiles) is generic, but does not take the city structure into account.
• We introduce a generic zoning system for concentric cities called ClockBoard• R-package zonebuilder: https://github.com/zonebuilders/zonebuilder
A generic zoning system for cities

A: 1 km
22
ClockBoard
B: 2 km
C: 3 km
D: 4 km
E: 5 km
1 km3 km
6 km
10 km
15 km
Annulus height
Distance to centre
Letters A – G represent the rings
Numbers 1-12 represent the direction from the centre, analog to the hours of a clock.
For instance zone D06 means: • D: 6-10 km from the city centre,• 06: six o’clock = south.
London
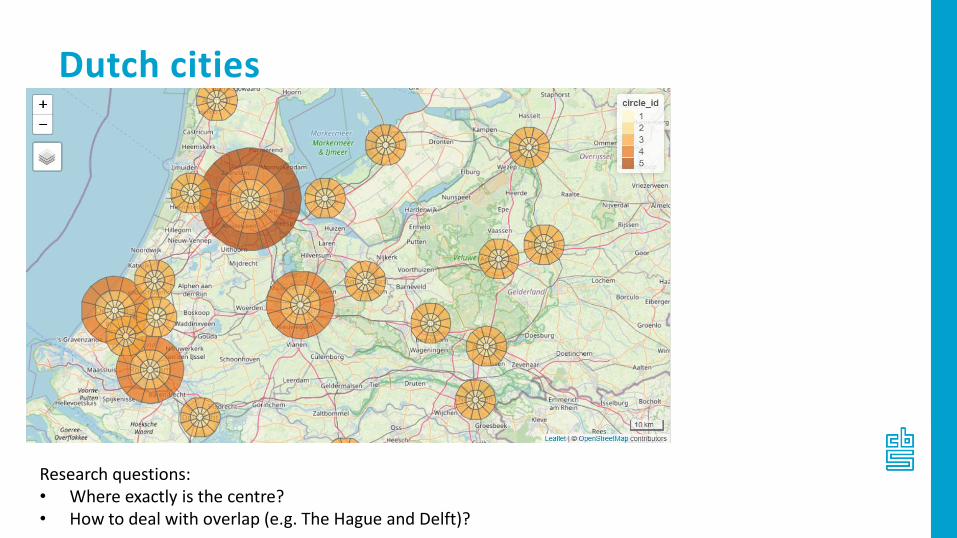
Dutch cities
Research questions:• Where exactly is the centre?• How to deal with overlap (e.g. The Hague and Delft)?

How safe are UK cities for cycling?
25
• ClockBoard: a simple yet intuitive zoning system
• Not all cities are concentric
• Some cities have two centres:
• Merged cities (e.g. Buda-pest)
• Old town and financial district
• How to deal with overlap (e.g. The Hague / Delft)?
Discussion

26
Min ChenYu ZhangJacob Wilkins
Acknowledgements
Dolores Romero MoralesLili Nottrott
Sofie de BroeMarko RoosChantal Melser
Robin LovelaceRoger Beecham
Recommended