1
Virginia Criminal Sentencing Commission
Dr. Rick Kern, Director

FY2007Number of Cases = 25,732
Compliance79.9
Mitigation9.7%
Aggravation10.4%
Mitigation48%
Aggravation
52%
Sentencing Guidelines Compliance
Overall Compliance Directions of Departures
Sentencing Guidelines C
ompliance
2
Guidelines Compliance by Circuit
Sentencing Guidelines C
ompliance
Circuit Name Circuit Compliance Mitigation Aggravation Total
Radford Area 27 91.4% 5.0% 3.7% 929
Newport News 7 86.5 6.3 7.2 968
Bristol Area 28 85.2 8.6 6.2 561
Martinsville Area 21 85.2 12.1 2.7 364
Lee Area 30 85.0 6.7 8.2 341
South Boston Area 10 85.0 8.8 6.2 581
Loudoun Area 20 84.8 7.2 8.0 512
Prince William Area 31 84.5 6.5 9.0 634
Hampton 8 82.9 9.0 8.0 697
Virginia Beach 2 82.6 8.8 8.6 1,702
Petersburg Area 11 82.4 6.3 11.3 426
Alexandria 18 81.3 13.9 4.8 396
Chesapeake 1 81.2 8.3 10.5 771
Portsmouth 3 80.8 7.5 11.7 983
Charlottesville Area 16 80.6 10.6 8.8 568
Staunton Area 25 80.5 9.5 10.0 991
Harrisonburg Area 26 80.2 10.9 8.9 1,089
Suffolk Area 5 80.1 8.0 11.9 589
Arlington Area 17 80.1 7.4 12.6 517
Henrico 14 79.8 10.1 10.1 1,282
Richmond City 13 79.7 13.2 7.0 1,308
Fairfax 19 78.5 7.7 13.8 984
Norfolk 4 78.1 14.5 7.4 1,900
Sussex Area 6 77.7 11.5 10.9 470
Danville Area 22 77.3 7.2 15.5 704
Lynchburg Area 24 77.0 13.8 9.2 991
Williamsburg Area 9 76.0 7.1 16.9 492
Chesterfield Area 12 75.8 7.2 17.0 959
Roanoke Area 23 74.5 15.4 10.1 954
Fredericksburg Area 15 71.3 10.2 18.4 1,514
Buchanan Area 29 64.1 7.8 28.1 552
Twenty-nine percent reported compliance rates between 70 and 79%. Only one circuit had a compliance rate below 70%.
More than two-thirds (68%) of the state’s 31 circuits exhibited compliance rates at or above 80%.
3
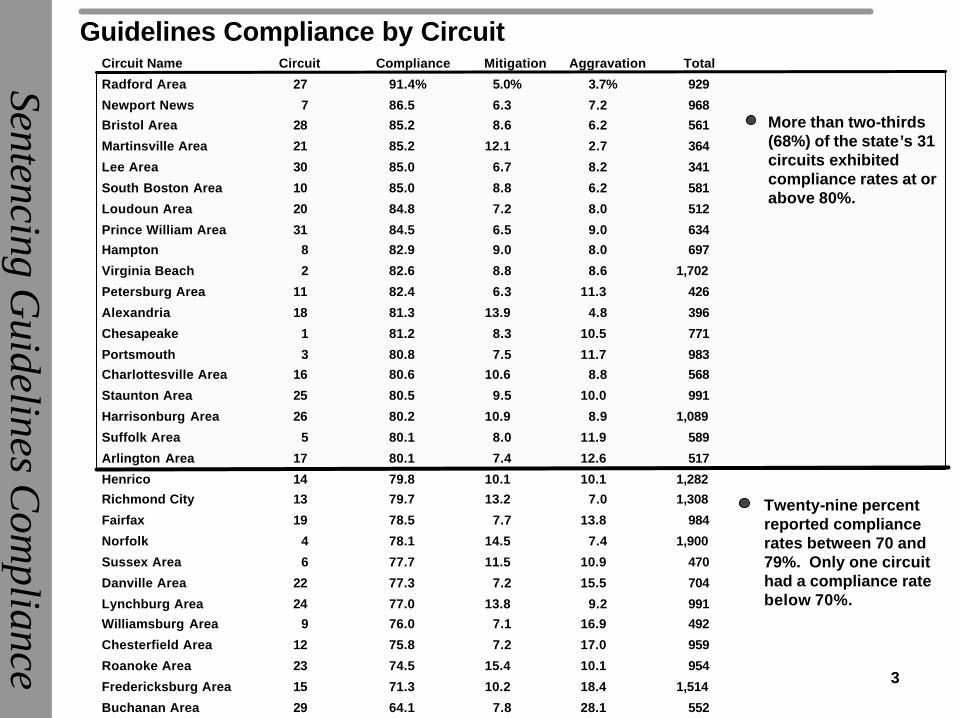
FY1986 – FY2007
Percent of Felony Convictions Adjudicated by Juries Parole v. Truth-in-Sentencing SystemSentencing G
uidelines Com
pliance
Parole System Truth-in-Sentencing
6.4 6.3 6.55.8 5.2 5.1 4.7 4.2 4.2 3.9
'86 '87 '88 '89 '90 '91 '92 '93 '94 '95
1.42.2 2.7 2.2 2.1 1.7 1.6 1.7 1.8 1.7
'95 '96 '97 '98 '99 '00 '01 '02 '03 '04
1.6
'05
4
1.4
'06
1.5
'07
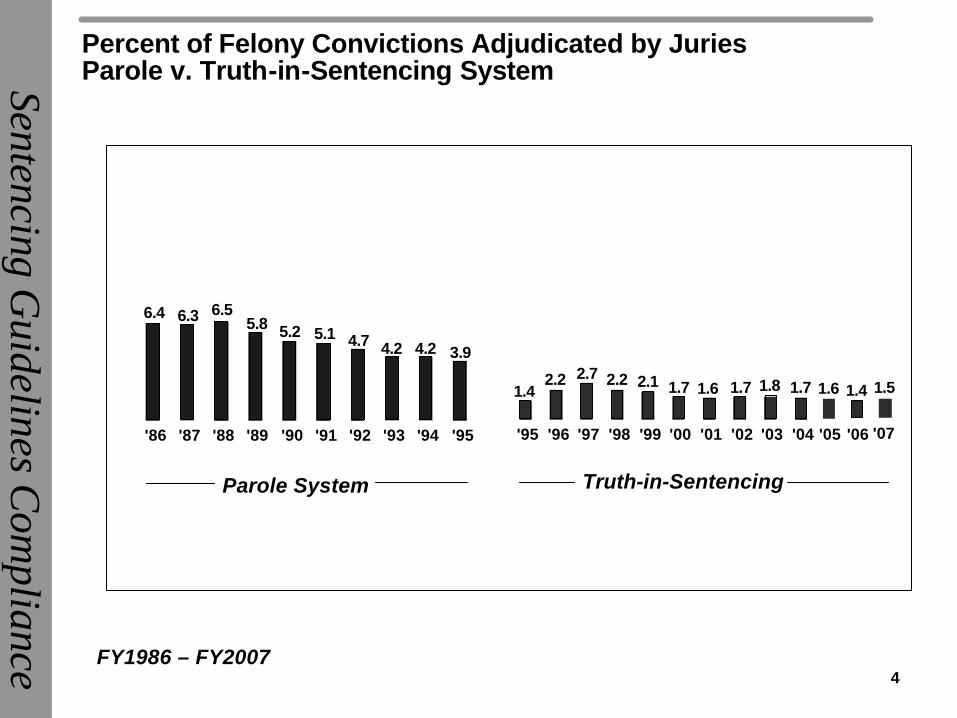
FY2007Number of Cases = 25,732
Compliance in Jury Cases and Non-Jury Cases
Sentencing Guidelines C
ompliance
Mitigation9%
Aggravation48%Compliance
43% Mitigation10%
Aggravation10%
Compliance80%
Jury CasesN=356
Non-Jury CasesN=25,376
5
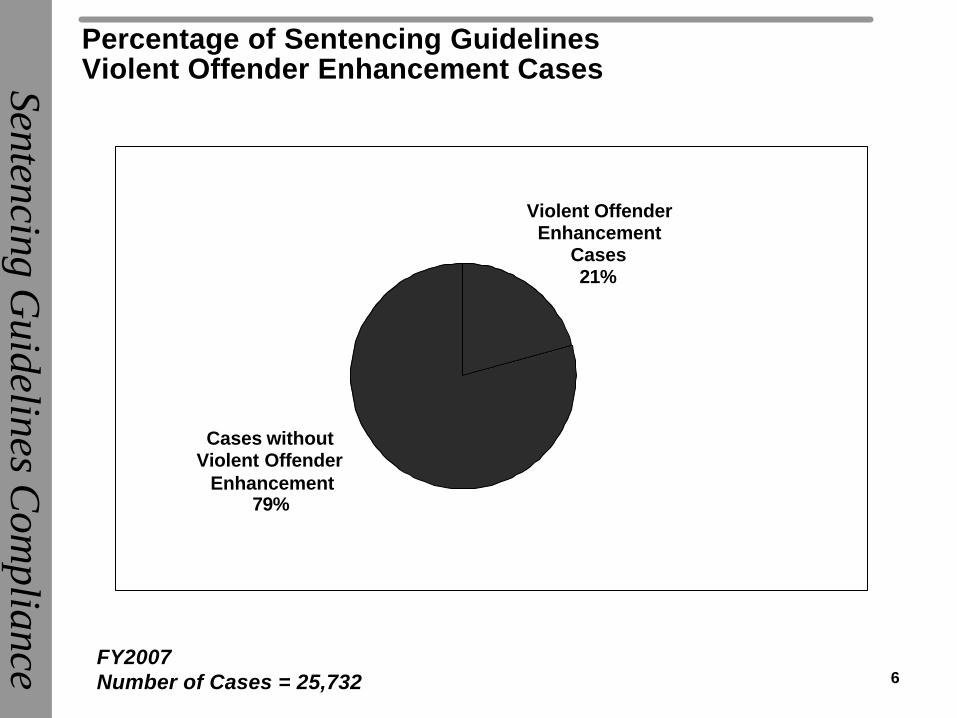
FY2007Number of Cases = 25,732
Percentage of Sentencing Guidelines Violent Offender Enhancement CasesSentencing G
uidelines Com
pliance
Violent OffenderEnhancement
Cases21%
Cases without Violent Offender
Enhancement79%
6

FY2007Number of Cases = 5,299
Type of Sentencing Guidelines Violent Offender Enhancements ReceivedSentencing G
uidelines Com
pliance
7
Instant Violent Offense
Less Serious Violent Prior
Instant Violent Offense & Less Serious Violent Prior
More Serious Violent Prior
Instant Violent Offense & More Serious Violent Prior
5.3%
3.2%
2.0%
9.3%
0.8%

Compliance by Sentencing Guidelines Violent Offender Enhancement* Sentencing G
uidelines Com
pliance
8
None 82.9% 6.0% 11.1% 20,433
More Serious Violent Prior 62.3% 33.0% 4.7% 825
Less Serious Violent Prior 73.8% 19.7% 6.5% 2,398
Instant Violent Offense 65.1% 22.9% 12.0% 1,358
Instant Violent Offense & More Serious Violent Prior 61.6% 32.4% 6.0% 216
Instant Violent Offense & Less Serious Violent Prior 64.1% 25.9% 10.0% 502
Total 25,732
*Violent Offender enhancements prescribe prison sentence recommendations for violent offenders which are significantly greater than historical time served under the parole system during the period 1988 to 1992.
ComplianceType of Enhancement Mitigation AggravationNumber of Cases
9
Integration of OffenderRecidivism RiskAssessment into Virginia SentencingGuidelines
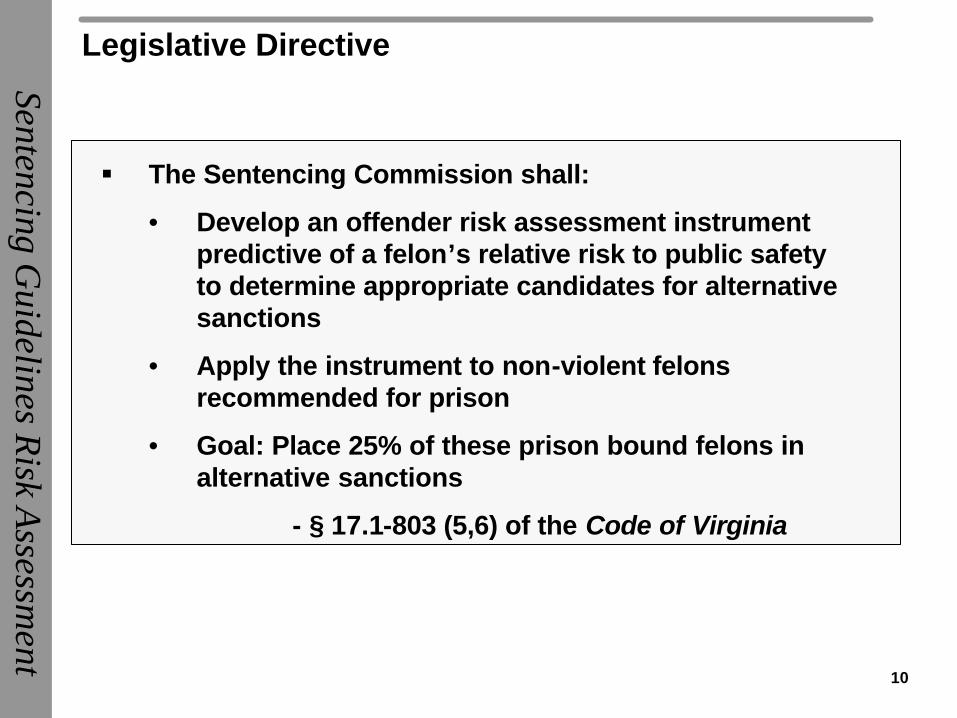
Legislative Directive
Sentencing Guidelines R
isk Assessm
ent
10
§ The Sentencing Commission shall:
• Develop an offender risk assessment instrument predictive of a felon’s relative risk to public safety to determine appropriate candidates for alternative sanctions
• Apply the instrument to non-violent felons recommended for prison
• Goal: Place 25% of these prison bound felons in alternative sanctions
- § 17.1-803 (5,6) of the Code of Virginia
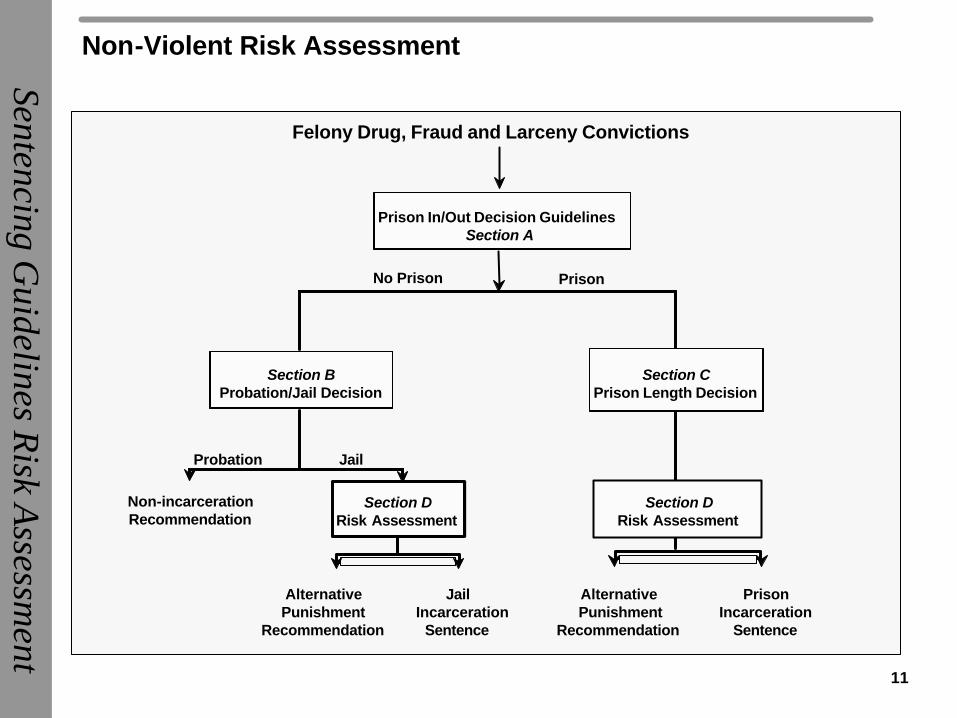
Non-Violent Risk Assessment
11
Sentencing Guidelines R
isk Assessm
ent
Felony Drug, Fraud and Larceny Convictions
Prison In/Out Decision GuidelinesSection A
No Prison Prison
Section BProbation/Jail Decision
Section CPrison Length Decision
Non-incarcerationRecommendation
Alternative Punishment
Recommendation
Jail Incarceration
Sentence
Probation Jail
Section DRisk Assessment
AlternativePunishment
Recommendation
Prison Incarceration
Sentence
Section DRisk Assessment

Significant Factors in Assessing Risk for Nonviolent Offenders
Sentencing Guidelines C
ompliance
12
By relative degree of
importance
Never Married by Age 26
Additional Offenses
Prior Arrest w/in Past 18 Mos.
Prior Adult Incarcerations
Male Offender
Not Regularly Employed
Offense Type
Prior Felony Record
Offender Age
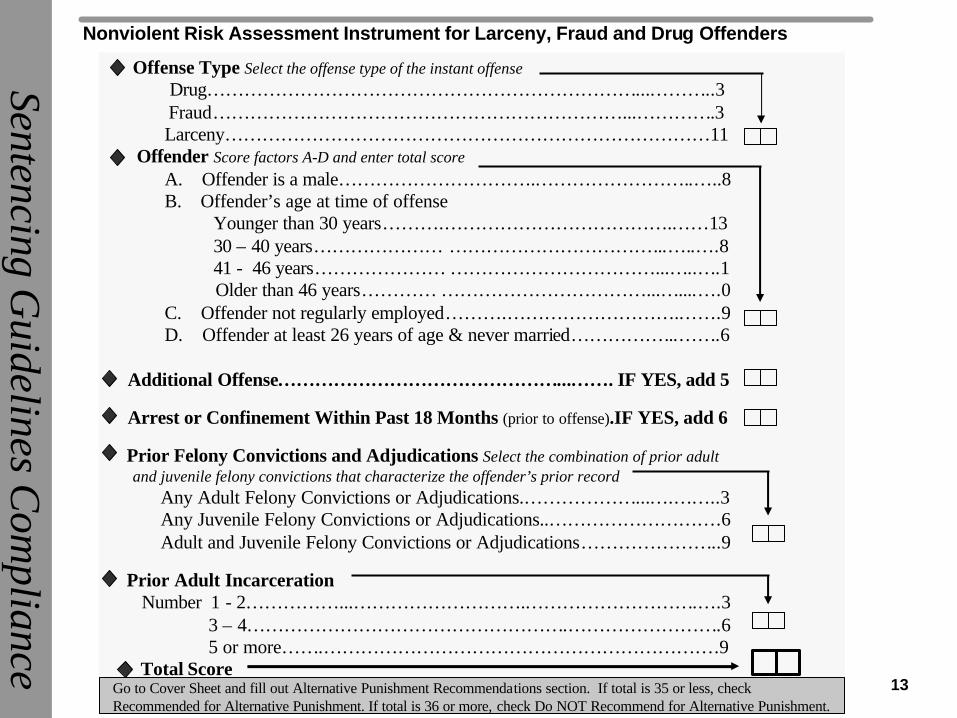
Nonviolent Risk Assessment Instrument for Larceny, Fraud and Drug Offenders
Sentencing Guidelines C
ompliance
13
Offense Type Select the offense type of the instant offenseDrug……………………………………………………………...………..3Fraud…………………………………………………………...………….3 Larceny……………………………………………………………………11
Offender Score factors A-D and enter total scoreA. Offender is a male…………………………..……………………..…..8B. Offender’s age at time of offense
Younger than 30 years……….……………………………….……1330 – 40 years………………… ……………………………...…..….841 - 46 years………………… ……………………………...…..….1Older than 46 years………… ……………………………...…....….0
C. Offender not regularly employed……….……………………….…….9D. Offender at least 26 years of age & never married……………...…….6
Additional Offense………………………………………...……. IF YES, add 5
Arrest or Confinement Within Past 18 Months (prior to offense).IF YES, add 6
Prior Felony Convictions and Adjudications Select the combination of prior adult and juvenile felony convictions that characterize the offender’s prior record
Any Adult Felony Convictions or Adjudications.………………...….……..3Any Juvenile Felony Convictions or Adjudications..……………………….6Adult and Juvenile Felony Convictions or Adjudications…………………..9
Prior Adult IncarcerationNumber 1 - 2……………...……………………….……………………….….3
3 – 4…………………………………………….…………………….65 or more…….……………………………………………………….9
Total ScoreGo to Cover Sheet and fill out Alternative Punishment Recommendations section. If total is 35 or less, check Recommended for Alternative Punishment. If total is 36 or more, check Do NOT Recommend for Alternative Punishment.

Reconviction Rates and CumulativeProportion of Affected Offenders under Risk AssessmentSentencing G
uidelines Com
pliance
14
10 15 20 25 30 35 40 45 50 55 60 65 700%
20%
40%
60%
80%
100%
Cumulative Proportion of Affected Offenders
Recommended for Alternative
Punishment
Offender Reconviction Rate25%
12%
Risk Assessment Score

Use of Nonviolent Offender Risk Assessment
Sentencing Guidelines C
ompliance
15
§ Completed in larceny, fraud and drug cases for offenders who are recommended for incarceration by the sentencing guidelines who also meet the eligibility criteria
• Excludes those with a current or prior violent felony conviction and those who sell 1 oz. or more of cocaine
§ For offenders who score 35 or less, the sentencing guidelines cover sheet indicates a dual recommendation
• Traditional incarceration
• Alternative punishment

Legislative Directive – Budget Language (2003)
Sentencing Guidelines C
ompliance
16
§ Chapter 1042 (Item 40) of the 2003 Acts of Assembly directs the Commission to:
– Identify offenders not currently recommended for alternative punishment options by the assessment instrument who nonetheless pose little risk to public safety
– Determine, with due regard for public safety, the feasibility of adjusting the assessment instrument to recommend additional low-risk nonviolent offenders for alternative punishment
– Provide findings to the 2004 Session of the General Assembly

Offender Risk Assessment Scores
Sentencing Guidelines C
ompliance
17
New Risk Assessment Threshold
Old Risk Assessment Threshold
More than 40
40
39
38
37
36
35
Score
58.7%
3.0%
5.4%
2.7%
2.2%
2.7%
2.5%
Percent of Offenders
18.8%
16.0%
13.6%
13.4%
13.9%
12.4%
Reconviction Rate for offenders scoring at or below point value
By moving the threshold to 38 points, an estimated 511 per year additional offenders would be recommended for alternative punishment, without a significant increase in the rate of recidivism among the recommended group.
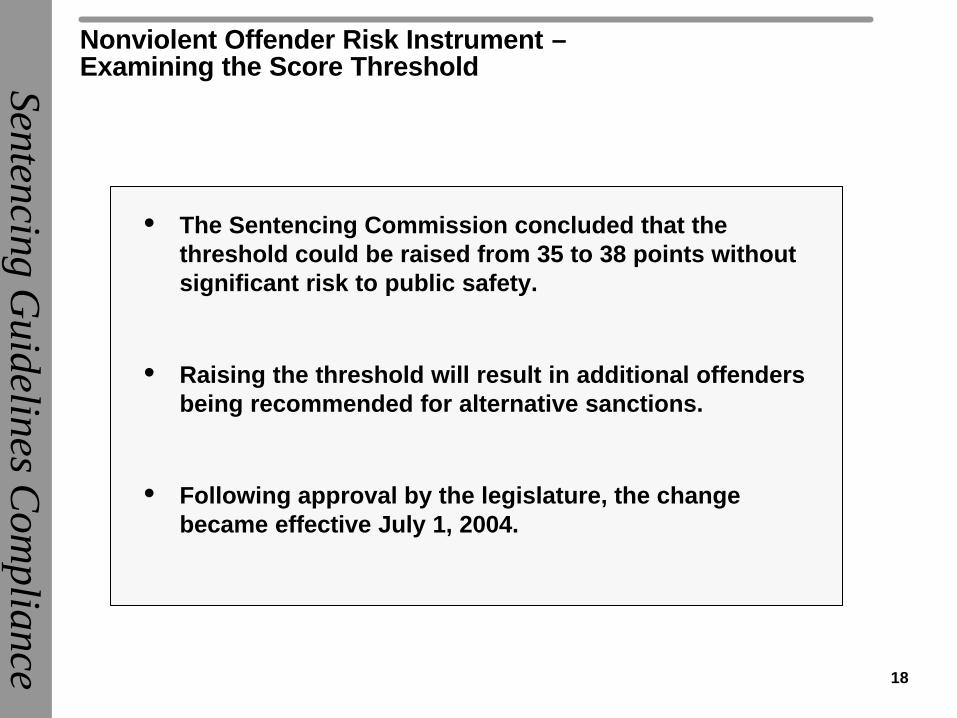
Nonviolent Offender Risk Instrument –Examining the Score ThresholdSentencing G
uidelines Com
pliance
18
• The Sentencing Commission concluded that the threshold could be raised from 35 to 38 points without significant risk to public safety.
• Raising the threshold will result in additional offenders being recommended for alternative sanctions.
• Following approval by the legislature, the change became effective July 1, 2004.
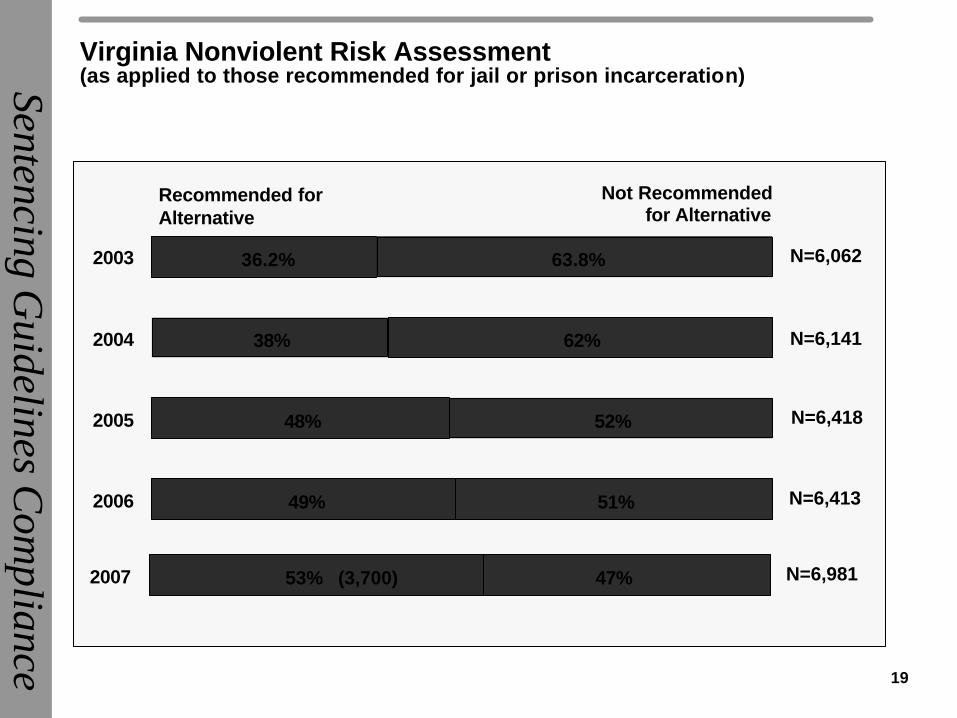
Virginia Nonviolent Risk Assessment(as applied to those recommended for jail or prison incarceration)Sentencing G
uidelines Com
pliance
19
36.2%
38%
48%
49%
63.8%
62%
52%
51%
2003
2004
2005
2006
Recommended for Alternative
Not Recommended for Alternative
N=6,062
N=6,141
N=6,418
N=6,413
53% (3,700) 47%2007 N=6,981
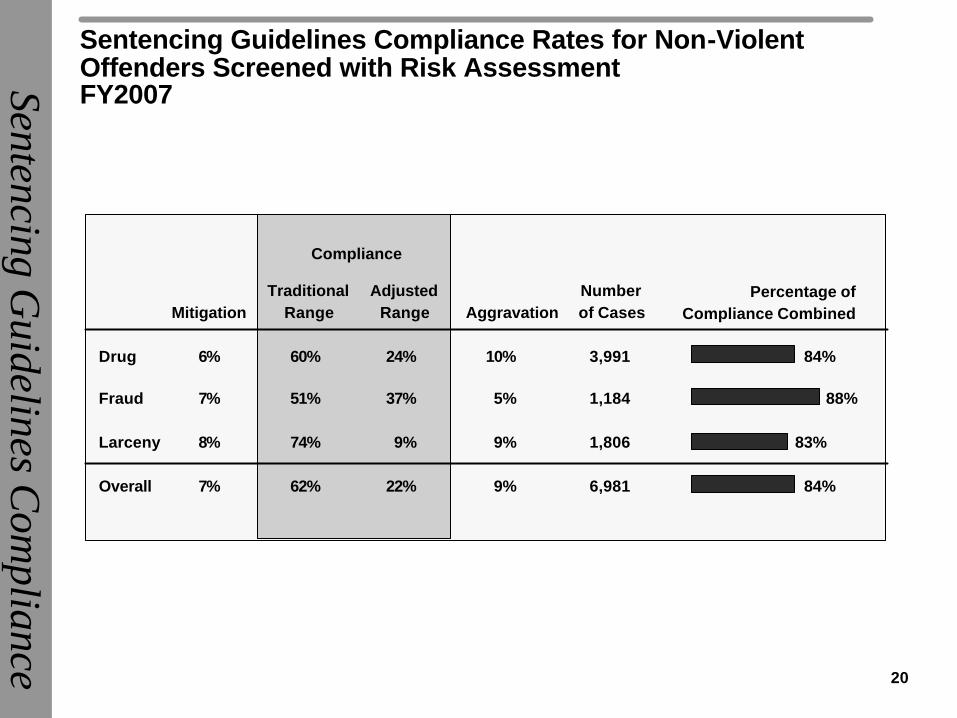
Sentencing Guidelines Compliance Rates for Non-Violent Offenders Screened with Risk Assessment FY2007Sentencing G
uidelines Com
pliance
20
Drug 6% 60% 24% 10% 3,991 84%
Fraud 7% 51% 37% 5% 1,184 88%
Larceny 8% 74% 9% 9% 1,806 83%
Overall 7% 62% 22% 9% 6,981 84%
Compliance
Mitigation AggravationNumber of Cases
AdjustedRange
TraditionalRange
Percentage of Compliance Combined

21
82%
48%
23%
22%
12%
8%8%
7%
4%
3%
3%
2%2%
2%
1%
1%
Supervised Probation
Shorter Incarceration
Indefinite Probation
Restitution
Time Served
Diversion Center
Detention Center
Unsupervised Probation
Suspended License
Substance Abuse Services
Electronic Monitoring
Day Reporting
Community Service
Intensive Supervision
Drug Court
First Offender Status
Primary Alternatives Used:
Probation
Shorter Incarceration Period
Restitution
Sentencing Guidelines C
ompliance
Less Restrictive Sanctions Utilized under Risk Assessment

22
National Center for State Courts Evaluation of Virginia’s risk assessment instrument
Concluded that our risk assessment component accurately distinguished nonviolent felons less likely to recidivate from those more likely
“Virginia's risk assessment instrument provides an objective, reliable, transparent, and more accurate alternative to assessing an offender’s potential for recidivism than the traditional reliance on judicial intuition or perceptual short hand”
“This is a workable tool for managing prison populations. It allows states the flexibility to determine how many offenders they would like to divert while balancing concerns of public safety”
23
Assessing Consistency& Fairness in Sentencing:
A Comparative Study in Three States
Final Report
National Center for State Courts

24
What is the research goal?
The degree to which a sentencing system contributes to the maintenance of justice depends in large measure on three central issues:
Consistency--- like cases are treated alike
Proportionality--- more serious offenders are punished more severely
Lack of discrimination--- age, gender and race etc. are insignificant in who goes to prison and for how long
Assessing Consistency and Fairness in Sentencing:A Comparative Study in Three States

25
Why Michigan, Minnesota and Virginia?
Assessing Consistency and Fairness in Sentencing:A Comparative Study in Three States
These states represent three distinct approaches to structuring judicial discretion
• Well-respected systems
• Alternative design strategies
• Voluntary and presumptive
• Excellent data base systems

26
Continuum of sentencing guidelines
Assessing Consistency and Fairness in Sentencing:A Comparative Study in Three States
• Enforceable rule related to guideline use
• Completion of guideline forms required
• Sentencing commission monitors compliance
• Compelling and substantial reason for departure
• Written reason required for departure
• Appellate review
Measurement Criteria
27
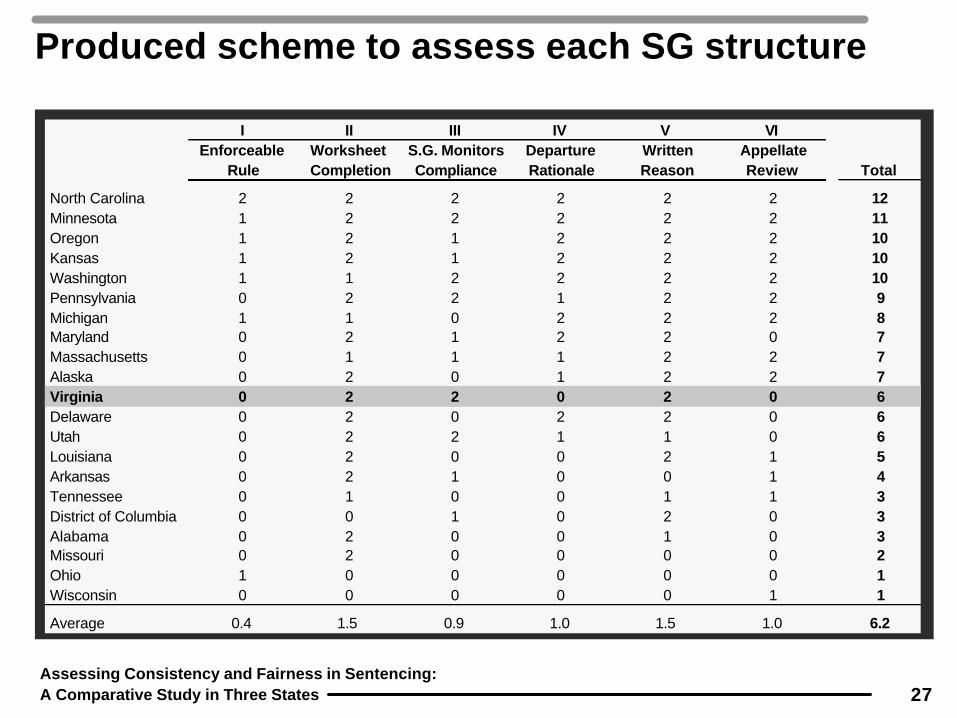
Produced scheme to assess each SG structure
Assessing Consistency and Fairness in Sentencing:A Comparative Study in Three States
I II III IV V VIEnforceable
RuleWorksheet Completion
S.G. Monitors Compliance
Departure Rationale
Written Reason
Appellate Review Total
North Carolina 2 2 2 2 2 2 12Minnesota 1 2 2 2 2 2 11Oregon 1 2 1 2 2 2 10Kansas 1 2 1 2 2 2 10Washington 1 1 2 2 2 2 10Pennsylvania 0 2 2 1 2 2 9Michigan 1 1 0 2 2 2 8Maryland 0 2 1 2 2 0 7Massachusetts 0 1 1 1 2 2 7Alaska 0 2 0 1 2 2 7Virginia 0 2 2 0 2 0 6Delaware 0 2 0 2 2 0 6Utah 0 2 2 1 1 0 6Louisiana 0 2 0 0 2 1 5Arkansas 0 2 1 0 0 1 4Tennessee 0 1 0 0 1 1 3District of Columbia 0 0 1 0 2 0 3Alabama 0 2 0 0 1 0 3Missouri 0 2 0 0 0 0 2Ohio 1 0 0 0 0 0 1Wisconsin 0 0 0 0 0 1 1
Average 0.4 1.5 0.9 1.0 1.5 1.0 6.2
28
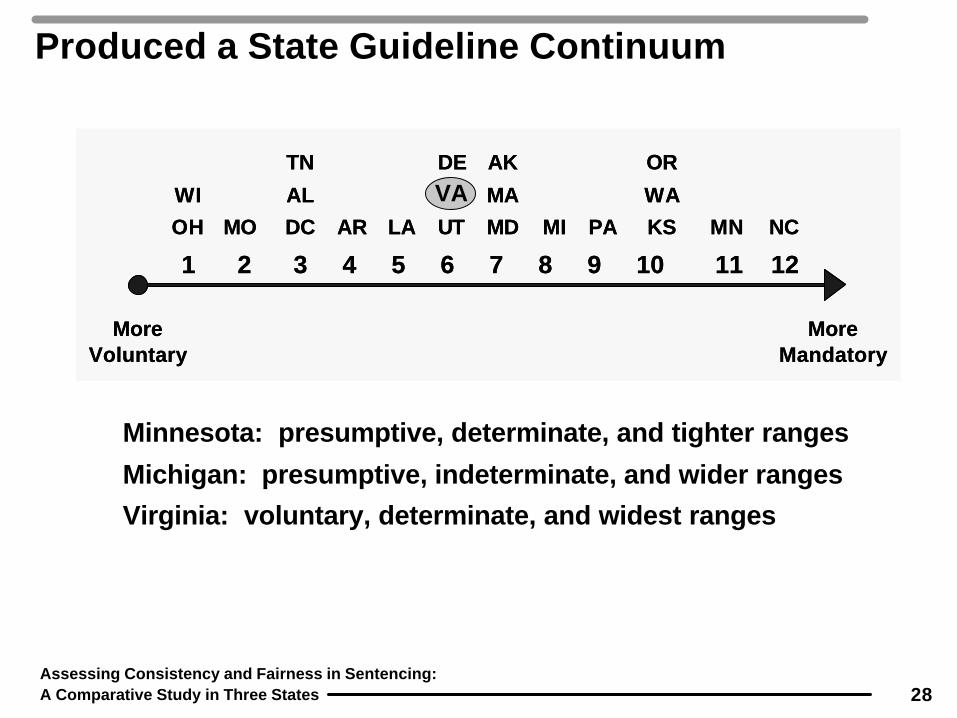
Produced a State Guideline Continuum
Assessing Consistency and Fairness in Sentencing:A Comparative Study in Three States
Minnesota: presumptive, determinate, and tighter ranges
Michigan: presumptive, indeterminate, and wider ranges
Virginia: voluntary, determinate, and widest ranges
1 2 3 4 5 6 7 8 9 10 11 12
NCMN
OR
KS
WAWI
PAMIMD
MA
AK
LAAROH MO
AL
DC
TN
More Voluntary
More Mandatory
1 2 3 4 5 6 7 8 9 10 11 12
NCMN
OR
KS
WAWI
PAMIMD
MA
AK
LAAROH MO
AL
DC
TN
More Voluntary
More Mandatory
DE
UT
VADE
UT

29
National Center for State Courts Evaluation
To what extent do sentencing guidelines contribute to consistency in the sanctioning of convicted felons?
Are similar cases treated in a similar manner?
Assessing Consistency and Fairness in Sentencing:A Comparative Study in Three States
Research Questions

30
To what extent do sentencing guidelines promote
proportionality in the sanctioning of convicted
felons?
Do the guidelines provide clear-cut and
proportional distinctions between more serious
and less serious offenders?
Assessing Consistency and Fairness in Sentencing:A Comparative Study in Three States
National Center for State Courts Evaluation
Research Questions
31
To what extent do sentencing guidelines
contribute to a lack of discrimination?
Are the characteristics of the offender’s age,
gender, and race, location of the court, identity of
the judge, etc. significant in determining who
goes to prison and for how long?
Assessing Consistency and Fairness in Sentencing:A Comparative Study in Three States
National Center for State Courts Evaluation
Research Questions

32
National Center for State Courts Evaluation
Consistency and proportionality in sentencing is being achieved in Virginia.
Similarly situated cases are being treated in similar fashions and the harshness of the sanctions are proportional to the seriousness of the felony cases
Assessing Consistency and Fairness in Sentencing:A Comparative Study in Three States
Research Findings (soon to be officially released)

33
There is no evidence of systematic discrimination in sentences imposed in Virginia’s criminal sentencing system.
Assessing Consistency and Fairness in Sentencing:A Comparative Study in Three States
National Center for State Courts Evaluation
Research Findings (soon to be officially released)
Recommended