ORIGINAL RESEARCH PAPER
Vertical tectonics of the High Plateau region, Manihiki Plateau,Western Pacific, from seismic stratigraphy
Huirong-Anita Ai Æ Joann M. Stock ÆRobert Clayton Æ Bruce Luyendyk
Received: 2 May 2006 / Accepted: 19 January 2008 / Published online: 27 February 2008
� The Author(s) 2008
Abstract The Manihiki Plateau is an elevated oceanic
volcanic plateau that was formed mostly in Early Creta-
ceous time by hotspot activity. We analyze new seismic
reflection data acquired on cruise KIWI 12 over the High
Plateau region in the southeast of the plateau, to look for
direct evidence of the location of the heat source and the
timing of uplift, subsidence and faulting. These data are
correlated with previous seismic reflection lines from
cruise CATO 3, and with the results at DSDP Site 317 at
the northern edge of the High Plateau. Seven key reflectors
are identified from the seismic reflection profiles and the
resulting isopach maps show local variations in thickness
in the southeastern part of the High Plateau, suggesting a
subsidence (cooling) event in this region during Late
Cretaceous and up to Early Eocene time. We model this as
a hotspot, active and centered on the High Plateau area
during Early Cretaceous time in a near-ridge environment.
The basement and Early Cretaceous volcaniclastic layers
were formed by subaerial and shallow-water eruption due
to the volcanic activity. After that, the plateau experienced
erosion. The cessation of hotspot activity and subsequent
heat loss by Late Cretaceous time caused the plateau to
subside rapidly. The eastern and southern portions of the
High Plateau were rifted away following the cessation of
hot spot activity. As the southeastern portion of the High
Plateau was originally higher and above the calcium car-
bonate compensation depth, it accumulated more sediments
than the surrounding plateau regions. Apparently coeval
with the rapid subsidence of the plateau are normal faults
found at the SE edge of the plateau. Since Early Eocene
time, the plateau subsided to its present depth without
significant deformation.
Keywords Cretaceous � Hotspot � Isopach map �Manihiki Plateau � Seismic reflection
Introduction and tectonic background
The Manihiki Plateau is an area of elevated ocean floor in
the Western Pacific Ocean. The water depth of the plateau
is at approximately 2.5–3 km, several kilometers shallower
than the surrounding oceanic basins (Fig. 1). Winterer
et al. (1974) divided the Manihiki Plateau into three
regions. The High Plateau, in the southeastern section of
the Manihiki Plateau, is the shallowest and flattest, with
water depths of 2.5–3.0 km (Fig. 1). Up to 1 km of pelagic
sedimentary rock covers the igneous basement. The High
Plateau is bordered by linear depressions thought to be
fault troughs (Winterer et al. 1974). The Western Plateaus
comprise smaller ridges and seamounts northwest of the
High Plateau. The North Plateau is a small and nearly
separate shallow plateau at the northern end of the region.
The edges of the High Plateau are steep and linear along
the southwest, east and northwest, where the plateau has
borders with surrounding basins (Fig. 1). The shallowest
H.-A. Ai � J. M. Stock (&) � R. Clayton
Division of Geological and Planetary Sciences, California
Institute of Technology, Pasadena, CA 91125, USA
e-mail: [email protected]
H.-A. Ai
e-mail: [email protected]
R. Clayton
e-mail: [email protected]
B. Luyendyk
Department of Geological Sciences, University of California,
Santa Barbara, CA, USA
e-mail: [email protected]
123
Mar Geophys Res (2008) 29:13–26
DOI 10.1007/s11001-008-9042-0
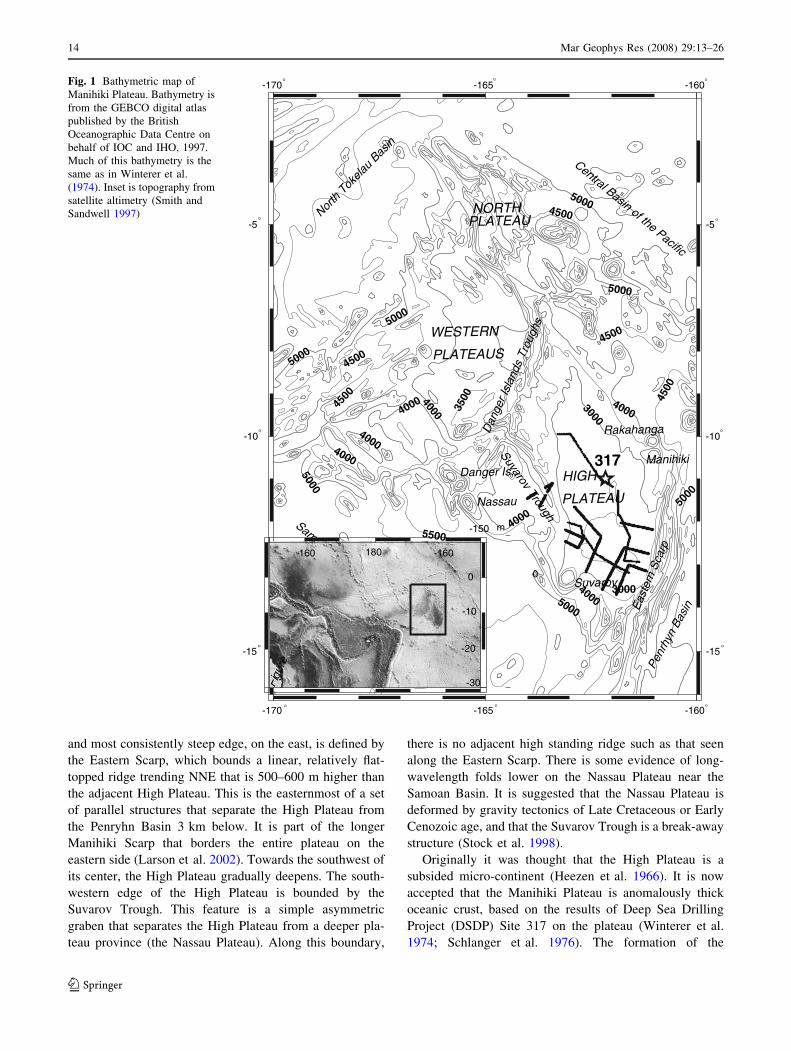
and most consistently steep edge, on the east, is defined by
the Eastern Scarp, which bounds a linear, relatively flat-
topped ridge trending NNE that is 500–600 m higher than
the adjacent High Plateau. This is the easternmost of a set
of parallel structures that separate the High Plateau from
the Penryhn Basin 3 km below. It is part of the longer
Manihiki Scarp that borders the entire plateau on the
eastern side (Larson et al. 2002). Towards the southwest of
its center, the High Plateau gradually deepens. The south-
western edge of the High Plateau is bounded by the
Suvarov Trough. This feature is a simple asymmetric
graben that separates the High Plateau from a deeper pla-
teau province (the Nassau Plateau). Along this boundary,
there is no adjacent high standing ridge such as that seen
along the Eastern Scarp. There is some evidence of long-
wavelength folds lower on the Nassau Plateau near the
Samoan Basin. It is suggested that the Nassau Plateau is
deformed by gravity tectonics of Late Cretaceous or Early
Cenozoic age, and that the Suvarov Trough is a break-away
structure (Stock et al. 1998).
Originally it was thought that the High Plateau is a
subsided micro-continent (Heezen et al. 1966). It is now
accepted that the Manihiki Plateau is anomalously thick
oceanic crust, based on the results of Deep Sea Drilling
Project (DSDP) Site 317 on the plateau (Winterer et al.
1974; Schlanger et al. 1976). The formation of the
-170
-170
-165
-165
-160
-160
-15 -15
-10 -10
-5 -5
5000
40003000
5000
3000
4000
4500
4500
5000
4500
5000
4000
5500
5000
4000
4000
40004000 3500
4500
4500
5000
5000
HIGH
PLATEAU
WESTERN
PLATEAUS
NORTHPLATEAU
Manihiki
Rakahanga
Suvarov
Danger Is.
Nassau
Penr
hyn
Basi
n
Central Basin of the Pacific
North
Tok
elau
Basin
Samoan Basin
Suvarov Trough
Dan
ger I
slan
ds T
roug
hs
317
160 180
-150
-30
0 0
m
Figu
re1
°
°
°
°°
°
°
°
° ° °
Eas
tern
Sca
rp-160
-20
-10
°
Fig. 1 Bathymetric map of
Manihiki Plateau. Bathymetry is
from the GEBCO digital atlas
published by the British
Oceanographic Data Centre on
behalf of IOC and IHO, 1997.
Much of this bathymetry is the
same as in Winterer et al.
(1974). Inset is topography from
satellite altimetry (Smith and
Sandwell 1997)
14 Mar Geophys Res (2008) 29:13–26
123
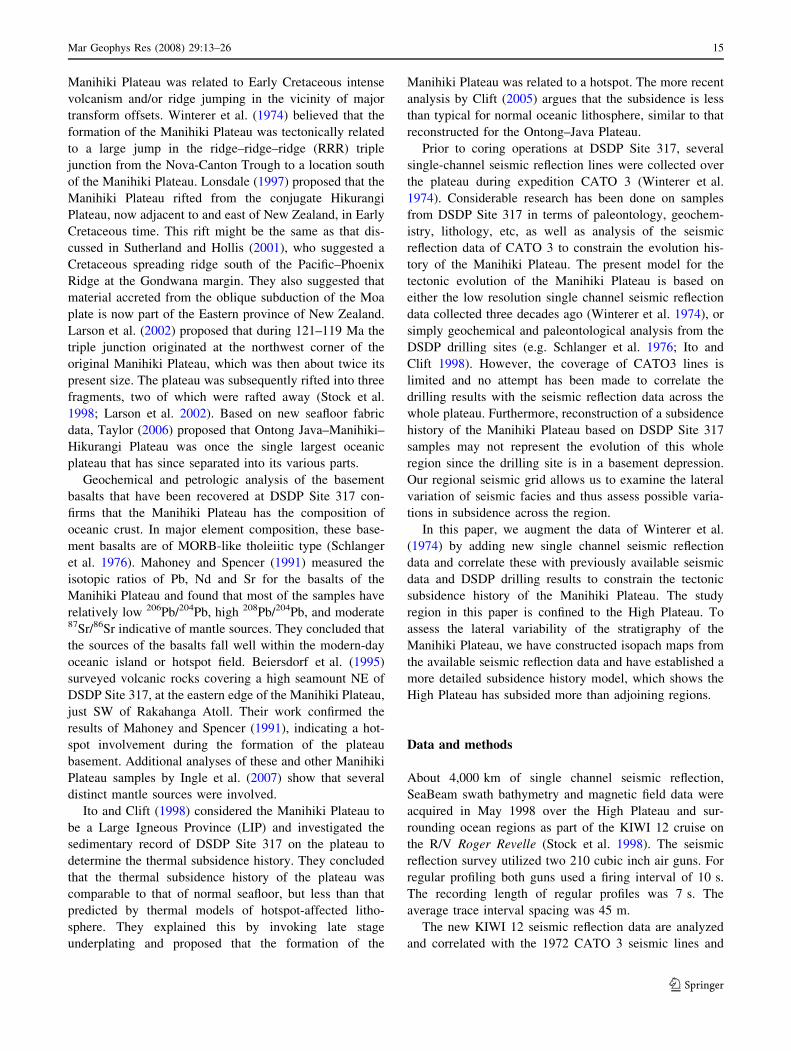
Manihiki Plateau was related to Early Cretaceous intense
volcanism and/or ridge jumping in the vicinity of major
transform offsets. Winterer et al. (1974) believed that the
formation of the Manihiki Plateau was tectonically related
to a large jump in the ridge–ridge–ridge (RRR) triple
junction from the Nova-Canton Trough to a location south
of the Manihiki Plateau. Lonsdale (1997) proposed that the
Manihiki Plateau rifted from the conjugate Hikurangi
Plateau, now adjacent to and east of New Zealand, in Early
Cretaceous time. This rift might be the same as that dis-
cussed in Sutherland and Hollis (2001), who suggested a
Cretaceous spreading ridge south of the Pacific–Phoenix
Ridge at the Gondwana margin. They also suggested that
material accreted from the oblique subduction of the Moa
plate is now part of the Eastern province of New Zealand.
Larson et al. (2002) proposed that during 121–119 Ma the
triple junction originated at the northwest corner of the
original Manihiki Plateau, which was then about twice its
present size. The plateau was subsequently rifted into three
fragments, two of which were rafted away (Stock et al.
1998; Larson et al. 2002). Based on new seafloor fabric
data, Taylor (2006) proposed that Ontong Java–Manihiki–
Hikurangi Plateau was once the single largest oceanic
plateau that has since separated into its various parts.
Geochemical and petrologic analysis of the basement
basalts that have been recovered at DSDP Site 317 con-
firms that the Manihiki Plateau has the composition of
oceanic crust. In major element composition, these base-
ment basalts are of MORB-like tholeiitic type (Schlanger
et al. 1976). Mahoney and Spencer (1991) measured the
isotopic ratios of Pb, Nd and Sr for the basalts of the
Manihiki Plateau and found that most of the samples have
relatively low 206Pb/204Pb, high 208Pb/204Pb, and moderate87Sr/86Sr indicative of mantle sources. They concluded that
the sources of the basalts fall well within the modern-day
oceanic island or hotspot field. Beiersdorf et al. (1995)
surveyed volcanic rocks covering a high seamount NE of
DSDP Site 317, at the eastern edge of the Manihiki Plateau,
just SW of Rakahanga Atoll. Their work confirmed the
results of Mahoney and Spencer (1991), indicating a hot-
spot involvement during the formation of the plateau
basement. Additional analyses of these and other Manihiki
Plateau samples by Ingle et al. (2007) show that several
distinct mantle sources were involved.
Ito and Clift (1998) considered the Manihiki Plateau to
be a Large Igneous Province (LIP) and investigated the
sedimentary record of DSDP Site 317 on the plateau to
determine the thermal subsidence history. They concluded
that the thermal subsidence history of the plateau was
comparable to that of normal seafloor, but less than that
predicted by thermal models of hotspot-affected litho-
sphere. They explained this by invoking late stage
underplating and proposed that the formation of the
Manihiki Plateau was related to a hotspot. The more recent
analysis by Clift (2005) argues that the subsidence is less
than typical for normal oceanic lithosphere, similar to that
reconstructed for the Ontong–Java Plateau.
Prior to coring operations at DSDP Site 317, several
single-channel seismic reflection lines were collected over
the plateau during expedition CATO 3 (Winterer et al.
1974). Considerable research has been done on samples
from DSDP Site 317 in terms of paleontology, geochem-
istry, lithology, etc, as well as analysis of the seismic
reflection data of CATO 3 to constrain the evolution his-
tory of the Manihiki Plateau. The present model for the
tectonic evolution of the Manihiki Plateau is based on
either the low resolution single channel seismic reflection
data collected three decades ago (Winterer et al. 1974), or
simply geochemical and paleontological analysis from the
DSDP drilling sites (e.g. Schlanger et al. 1976; Ito and
Clift 1998). However, the coverage of CATO3 lines is
limited and no attempt has been made to correlate the
drilling results with the seismic reflection data across the
whole plateau. Furthermore, reconstruction of a subsidence
history of the Manihiki Plateau based on DSDP Site 317
samples may not represent the evolution of this whole
region since the drilling site is in a basement depression.
Our regional seismic grid allows us to examine the lateral
variation of seismic facies and thus assess possible varia-
tions in subsidence across the region.
In this paper, we augment the data of Winterer et al.
(1974) by adding new single channel seismic reflection
data and correlate these with previously available seismic
data and DSDP drilling results to constrain the tectonic
subsidence history of the Manihiki Plateau. The study
region in this paper is confined to the High Plateau. To
assess the lateral variability of the stratigraphy of the
Manihiki Plateau, we have constructed isopach maps from
the available seismic reflection data and have established a
more detailed subsidence history model, which shows the
High Plateau has subsided more than adjoining regions.
Data and methods
About 4,000 km of single channel seismic reflection,
SeaBeam swath bathymetry and magnetic field data were
acquired in May 1998 over the High Plateau and sur-
rounding ocean regions as part of the KIWI 12 cruise on
the R/V Roger Revelle (Stock et al. 1998). The seismic
reflection survey utilized two 210 cubic inch air guns. For
regular profiling both guns used a firing interval of 10 s.
The recording length of regular profiles was 7 s. The
average trace interval spacing was 45 m.
The new KIWI 12 seismic reflection data are analyzed
and correlated with the 1972 CATO 3 seismic lines and
Mar Geophys Res (2008) 29:13–26 15
123

with the drilling and seismic results from DSDP Site 317
(Schlanger et al. 1976) (Fig. 2). DSDP Site 317 is located
on a CATO 3 seismic line, so its stratigraphy can be cor-
related directly with the reflection profiles. At DSDP Site
317, seven seismic units and two major unconformities U1
(Early/Late Eocene) and U2 (Late Cretaceous/Early
Eocene) were biostratigraphically dated and tied to the
CATO 3 seismic reflection profiles (Schlanger et al. 1976).
The new KIWI 12 tracks are tied to the existing CATO 3
tracks at three of four crossing points in the study area
shown in Fig. 2. The seismic reflection profiles of the
Glomar Challenger, CATO 3, and the new data, KIWI 12,
are correlated with the section drilled at DSDP Site 317
(Fig. 3). Based on the drilling results (Schlanger et al.
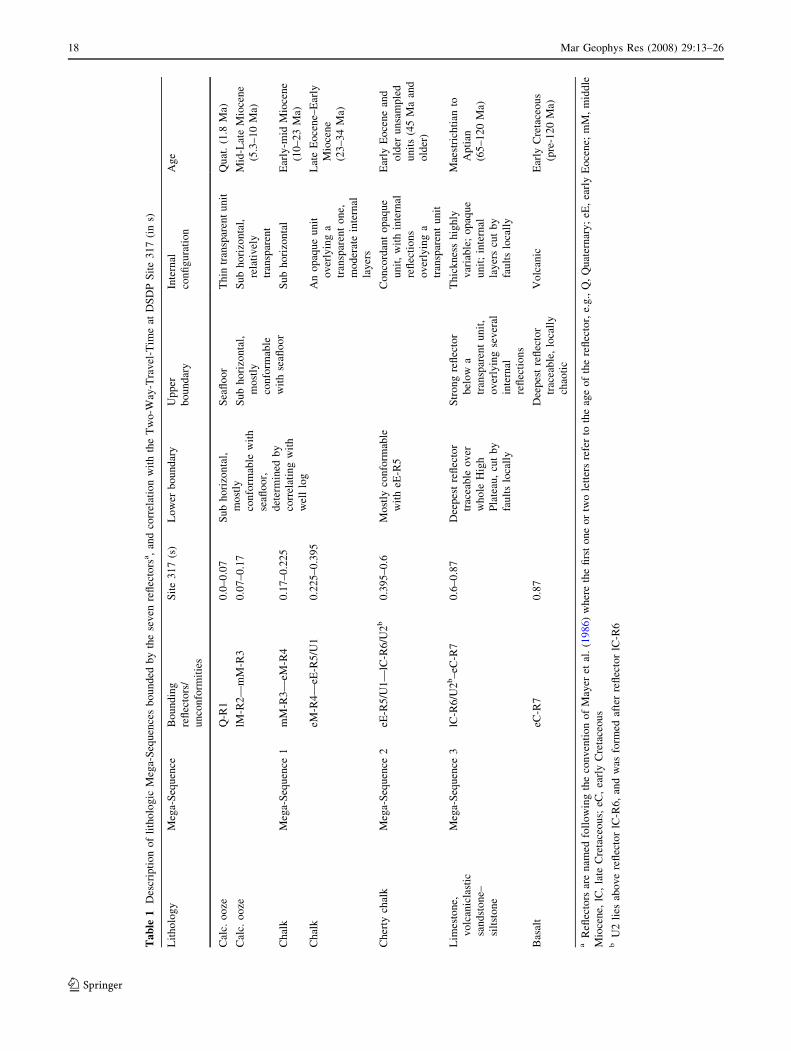
1976), three lithologic Mega-Sequences with seven units
were identified, which are bounded in the profiles by seven
reflectors Q-R1 through eC-R7, from seafloor down to the
basement (Table 1). Figure 4 is an example of the reflec-
tors picked from one of the KIWI 12 seismic profiles.
This study depends on how well the new seismic
reflection profiles are correlated with the old seismic
reflection profiles and with DSDP Site 317. The travel
times of the major reflectors correlate well at tie points E, F
and G between the KIWI 12 and CATO 3 lines (Table 2).
At other crossing points on the High Plateau no clear
reflectors are visible, either because of proximity to the
edge of the High Plateau, or else because the resolution of
the earlier seismic data, CATO3, is poor.
The seven stratigraphic reflectors were then used to
construct isopach maps (in Two-Way-Travel-Time) of
layer thickness and depth below sea surface for each
reflector. These are discussed in detail in the next section.
Discussion of isopach mapping
Previous constraints on stratigraphy and lithology
The lithologic units penetrated in DSDP Site 317 include
910 m of sedimentary rocks and 34 m of underlying
basaltic basement (Schlanger et al. 1976). The sedimentary
rocks are divided into three stratigraphic Mega-Sequences
bounded by unconformities. Mega-Sequence 1, which is
above reflector eE-R5 (U1), is upper Eocene through recent
oozes and chalks; Mega-Sequence 2 is lower Eocene cherty
chalk, underlain by a large unsampled section, and
bounded by reflectors eE-R5 (U1) and lC-R6; Mega-
Sequence 3 is largely Maestrichthian (*67 Ma) to Aptian
(*120 Ma) limestone and volcaniclastic sedimentary
rocks, bounded by reflectors lC-R6 and eC-R7 (Table 1,
Fig. 3). U2 lies at or slightly above reflector lC-R6. In
DSDP Hole 317A, the upper part of the volcaniclastic
section lies below the top of the L. cabri zone which is
dated at 120 Ma (Erba 2004). Geochemical, sedimento-
logical, and paleontological analysis of the volcaniclastic
strata and uppermost basement rocks from DSDP Site 317
shows that they were originally deposited in a shallower
water environment than at present depth, about 200 m
(Schlanger et al. 1976; Jenkyns 1976).
The top of the basalt basement is represented by
Reflector eC-R7. 40Ar/39Ar dating of the basalt from DSDP
Site 317 indicated that the basalts were erupted around
123.7 ± 1.5 Ma (Mahoney et al. 1993; Larson and Erba
1999). The vesicular character of the basalts also indicates
that the eruptions took place in shallow water (Schlanger
et al. 1976).
The seven reflectors and isopach maps
The seven reflectors are correlated across the entire High
Plateau region on the KIWI 12 and CATO 3 data. Reflector
eC-R7 is the deepest reflector identifiable and is interpreted
as the top of the basalt basement. It is traceable across most of
the High Plateau. The 0.6 s two-way-travel-time (TWT)
reflector lC-R6 is suggested to represent either sediment in
Core 33-317-4, the change from Maestrichthian chalk
(*67 Ma) to fairly hard Campanian claystone (*75 Ma)
around 70 Ma, or the hiatus between Core 33-317-6 and
Core 33-317-7, around 89 Ma, where a major lithologic
195°
195°
196°
196°
197°
197°
198°
198°
199°
199°
200°
200°
-15° -15°
-14° -14°
-13° -13°
-12° -12°
-11°° -11°
-10° -10°
-9° -9°
-200
-150
-100
-50
0
50
100
150
200
mgal
gravity
Figure 6
Figu
re
7
Figure 8
Figure 3
Figu
re 4
ManihikiPlateau
DSDPSite317
E
F
G
H
M
KIWI12(1998)CATO3(1972)
Figure 5
Fig. 2 Map of High Plateau showing seismic reflection lines
discussed in this paper, and Sandwell and Smith (1997) satellite
gravity field. Blue lines are CATO 3 collected in 1972; red lines are
KIWI 12 collected in 1998; star is DSDP Site 317, located at 11�S,
162�150W; points E, F, G, H are tie points of KIWI 12 and CATO 3
lines. White lines on top of KIWI 12 are locations of seismic profiles
in Figs. 3, 4, 6, 7 and 8. Black points on line of Fig. 4 are where faults
are picked. Black square is location for Fig. 5
16 Mar Geophys Res (2008) 29:13–26
123
change is present (Schlanger et al. 1976). This reflector is at
or slightly below unconformity U2. No previous work has
given a clear interpretation for this unconformity. For con-
venience, reflector lC-R6 and unconformity U2 are grouped
together for the rest of this paper. The lower part of the Mega-
Sequence beneath reflector lC-R6 is traceable across our
whole study area, indicating that the eruption and subsequent
reworking produced widespread volcaniclastic deposits
across the whole High Plateau. The continuity of the U1
unconformity reflector is good but not as strong as U2. It is
associated with an unconformity in the Middle Eocene rocks.
Reflectors lM-R2 through eE-R5 are sub-parallel to the
seafloor, and have only slight regional changes of sub-
bottom time, indicating a relatively stable sedimentary his-
tory since Early Eocene time. These reflectors are weak
compared to reflectors lC-R6 and eC-R7, and sometimes
unidentifiable on the seismic reflection profiles.
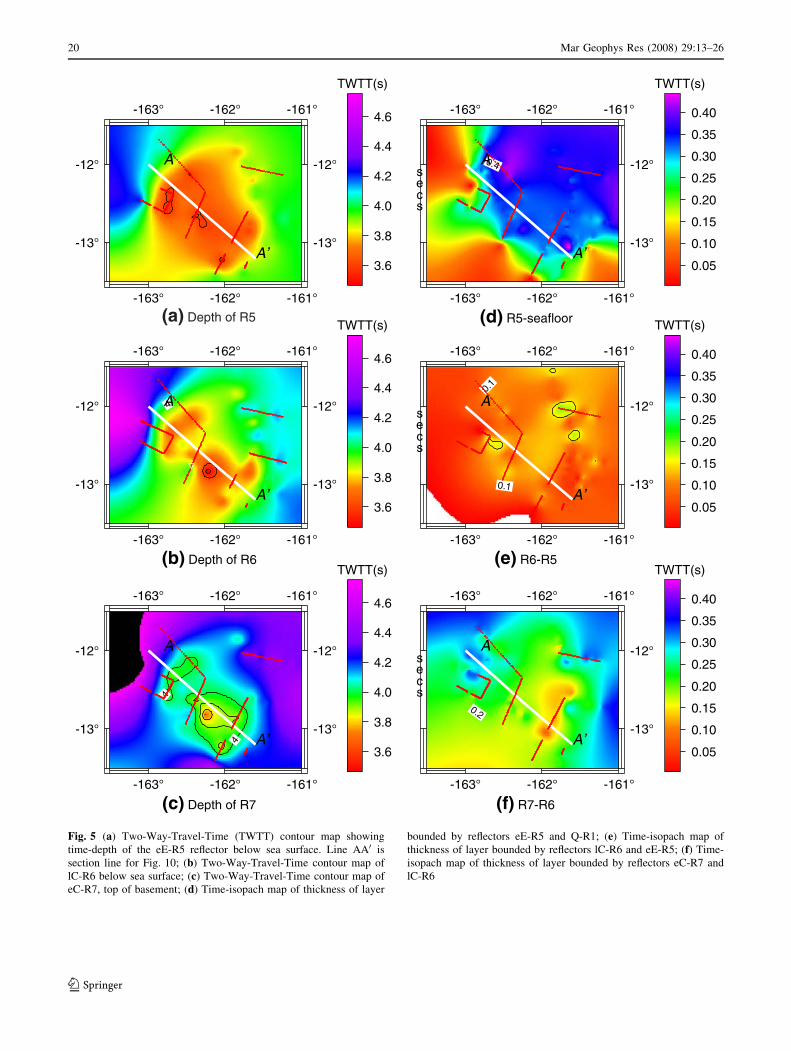
Representative Two-Way-Travel-Time contours and
time-isopach maps using the digitized seismic reflection
profiles were made for the region south of 11.5�S, where
there is adequate seismic coverage (Fig. 5). On these
contour and isopach maps we can see many of the
important features of the sedimentary Mega-Sequences.
Reflectors Q-R1 to eE-R5, Mega-Sequence 1 (above U1)
comprising Upper Eocene chalk to Quaternary calcareous
ooze, are very flat in the region bounded by 197� to
198.5�E, 12� to 13�S on the High Plateau (Fig. 5a). The flat
character of reflectors Q-R1 to eE-R5 is interpreted to
result from a relatively stable evolution history of the
Manihiki Plateau since Early Eocene time. The time iso-
pach maps of the layers bounded by reflectors Q-R1
through eE-R5 in the same small region are relatively
constant except towards the edge of the High Plateau
(Fig. 5d). This uniformity shows that the Manihiki Plateau
mainly experienced sedimentation, and possible subsi-
dence, as a whole since Early Eocene time. In contrast, the
Two-Way-Travel-Time contour map of reflector lC-R6
(U2), above the sedimentary and volcaniclastic rocks, has a
different pattern from that of the reflectors Q-R1 to eE-R5
(Fig. 5b). In Fig. 5b, the topography for the same region is
more undulating than it is on maps of reflectors Q-R1
through eE-R5. The contours have two high points; one
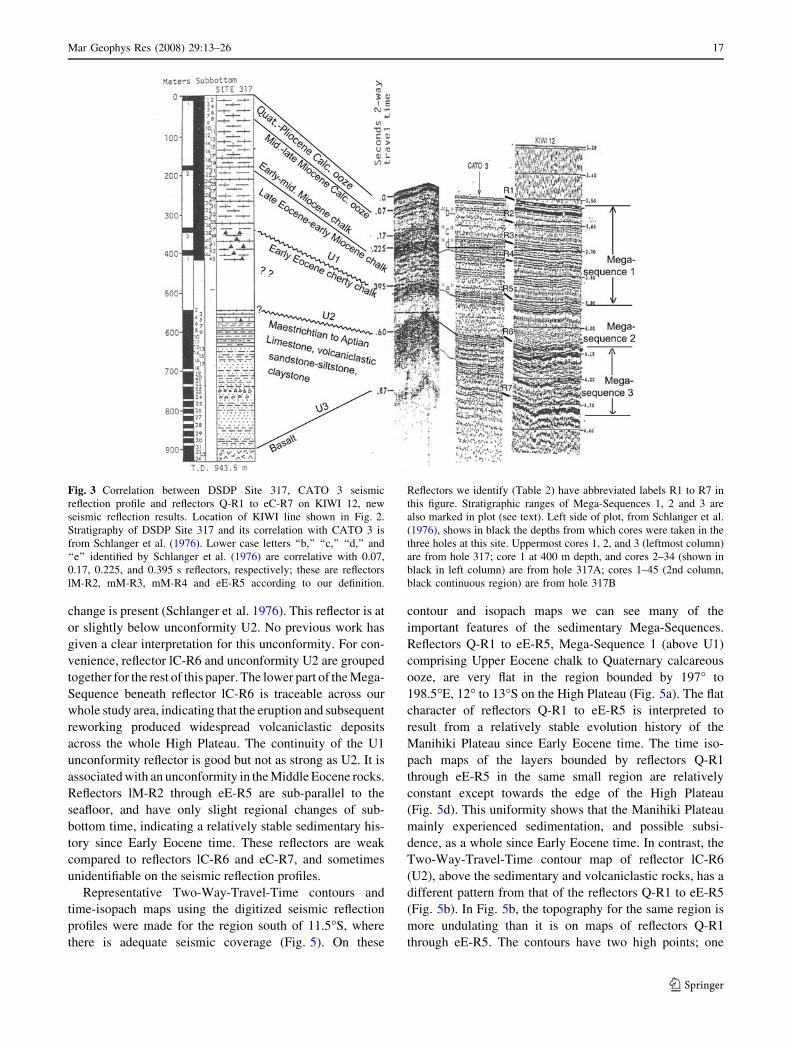
Fig. 3 Correlation between DSDP Site 317, CATO 3 seismic
reflection profile and reflectors Q-R1 to eC-R7 on KIWI 12, new
seismic reflection results. Location of KIWI line shown in Fig. 2.
Stratigraphy of DSDP Site 317 and its correlation with CATO 3 is
from Schlanger et al. (1976). Lower case letters ‘‘b,’’ ‘‘c,’’ ‘‘d,’’ and
‘‘e’’ identified by Schlanger et al. (1976) are correlative with 0.07,
0.17, 0.225, and 0.395 s reflectors, respectively; these are reflectors
lM-R2, mM-R3, mM-R4 and eE-R5 according to our definition.
Reflectors we identify (Table 2) have abbreviated labels R1 to R7 in
this figure. Stratigraphic ranges of Mega-Sequences 1, 2 and 3 are
also marked in plot (see text). Left side of plot, from Schlanger et al.
(1976), shows in black the depths from which cores were taken in the
three holes at this site. Uppermost cores 1, 2, and 3 (leftmost column)
are from hole 317; core 1 at 400 m depth, and cores 2–34 (shown in
black in left column) are from hole 317A; cores 1–45 (2nd column,
black continuous region) are from hole 317B
Mar Geophys Res (2008) 29:13–26 17
123
Ta
ble
1D
escr
ipti
on
of
lith
olo
gic
Meg
a-S
equ
ence
sb
ou
nd
edb
yth
ese
ven
refl
ecto
rsa,
and
corr
elat
ion
wit
hth
eT
wo
-Way
-Tra
vel
-Tim
eat
DS
DP
Sit
e3
17
(in
s)
Lit
ho
log
yM
ega-
Seq
uen
ceB
ou
nd
ing
refl
ecto
rs/
un
con
form
itie
s
Sit
e3
17
(s)
Lo
wer
bo
un
dar
yU
pp
er
bo
un
dar
y
Inte
rnal
con
fig
ura
tio
n
Ag
e
Cal
c.o
oze
Q-R
10
.0–
0.0
7S
ub
ho
rizo
nta
l,
mo
stly
con
form
able
wit
h
seafl
oo
r,
det
erm
ined
by
corr
elat
ing
wit
h
wel
llo
g
Sea
flo
or
Th
intr
ansp
aren
tu
nit
Qu
at.
(1.8
Ma)
Cal
c.o
oze
lM-R
2—
mM
-R3
0.0
7–
0.1
7S
ub
ho
rizo
nta
l,
mo
stly
con
form
able
wit
hse
aflo
or
Su
bh
ori
zon
tal,
rela
tiv
ely
tran
spar
ent
Mid
-Lat
eM
ioce
ne
(5.3
–1
0M
a)
Ch
alk
Meg
a-S
equ
ence
1m
M-R
3—
eM-R
40
.17
–0
.22
5S
ub
ho
rizo
nta
lE
arly
-mid
Mio
cen
e
(10
–2
3M
a)
Ch
alk
eM-R
4—
eE-R
5/U
10
.22
5–
0.3
95
An
op
aqu
eu
nit
ov
erly
ing
a
tran
spar
ent
on
e,
mo
der
ate
inte
rnal
lay
ers
Lat
eE
oce
ne–
Ear
ly
Mio
cen
e
(23
–3
4M
a)
Ch
erty
chal
kM
ega-
Seq
uen
ce2
eE-R
5/U
1—
lC-R
6/U
2b
0.3
95
–0
.6M
ost
lyco
nfo
rmab
le
wit
heE
-R5
Co
nco
rdan
to
paq
ue
un
it,
wit
hin
tern
al
refl
ecti
on
s
ov
erly
ing
a
tran
spar
ent
un
it
Ear
lyE
oce
ne
and
old
eru
nsa
mp
led
un
its
(45
Ma
and
old
er)
Lim
esto
ne,
vo
lcan
icla
stic
san
dst
on
e–
silt
sto
ne
Meg
a-S
equ
ence
3lC
-R6
/U2
b–
eC-R
70
.6–
0.8
7D
eep
est
refl
ecto
r
trac
eab
leo
ver
wh
ole
Hig
h
Pla
teau
,cu
tb
y
fau
lts
loca
lly
Str
on
gre
flec
tor
bel
ow
a
tran
spar
ent
un
it,
ov
erly
ing
sev
eral
inte
rnal
refl
ecti
on
s
Th
ick
nes
sh
igh
ly
var
iab
le;
op
aqu
e
un
it;
inte
rnal
lay
ers
cut
by
fau
lts
loca
lly
Mae
stri
chti
anto
Ap
tian
(65
–1
20
Ma)
Bas
alt
eC-R
70
.87
Dee
pes
tre
flec
tor
trac
eab
le,
loca
lly
chao
tic
Vo
lcan
icE
arly
Cre
tace
ou
s
(pre
-12
0M
a)
aR
eflec
tors
are
nam
edfo
llo
win
gth
eco
nv
enti
on
of
May
eret
al.
(19
86)
wh
ere
the
firs
to
ne
or
two
lett
ers
refe
rto
the
age
of
the
refl
ecto
r,e.
g.,
Q,
Qu
ater
nar
y;
eE,
earl
yE
oce
ne;
mM
,m
idd
le
Mio
cen
e,lC
,la
teC
reta
ceo
us;
eC,
earl
yC
reta
ceo
us
bU
2li
esab
ov
ere
flec
tor
lC-R
6,
and
was
form
edaf
ter
refl
ecto
rlC
-R6
18 Mar Geophys Res (2008) 29:13–26
123
near 197.8�E, 12.9�S, and the other to the northwest, at
197.2�E, 12.2�S. Between the two high regions there is a
depression, where the Two-Way-Travel-Time exceeds
3.8 s.
In the same region, the isopach map of Mega-Sequence
2, bounded by reflectors lC-R6 and eE-R5, is different from
that between reflectors Q-R1 and eE-R5 (Fig. 5d vs. e).
Thickness of this unit varies from 0.1 to 0.3 s (Fig. 5e).
This difference in thickness suggests that the Manihiki
Plateau was influenced by tectonic events prior to reflector
lC-R6 time.
The basement surface of the High Plateau (reflector
eC-R7) exhibits significant relief, similar to reflector lC-R6
(Fig. 5c). This has important implications for the paleo-
water depth history. At DSDP Site 317, the paleodepth near
the top of the volcaniclastic section (200 m above the
basement at this site) was about 100 m, as judged from the
molluscan fauna in recovered cores (Kaufmann 1976).
However, DSDP Site 317 was deliberately drilled in a
basement depression, which was evident on the site survey
seismic lines (Schlanger and Winterer 1976). These seis-
mic profiles, as well as our results, suggest that over much
of the High Plateau, and particularly to the SE of DSDP
Site 317, the top of the basement is more than 100 m
shallower than the volcaniclastic strata drilled at DSDP
Site 317. If this basement is the same age or older than the
basement at DSDP Site 317, and if there has not been much
subsequent tilting, it is possible that a considerable portion
of the High Plateau would have been subaerial during or
shortly after its formation. This would provide a likely
location for subaerial erosion to have contributed to the
volcaniclastic sedimentary rocks inferred to be present
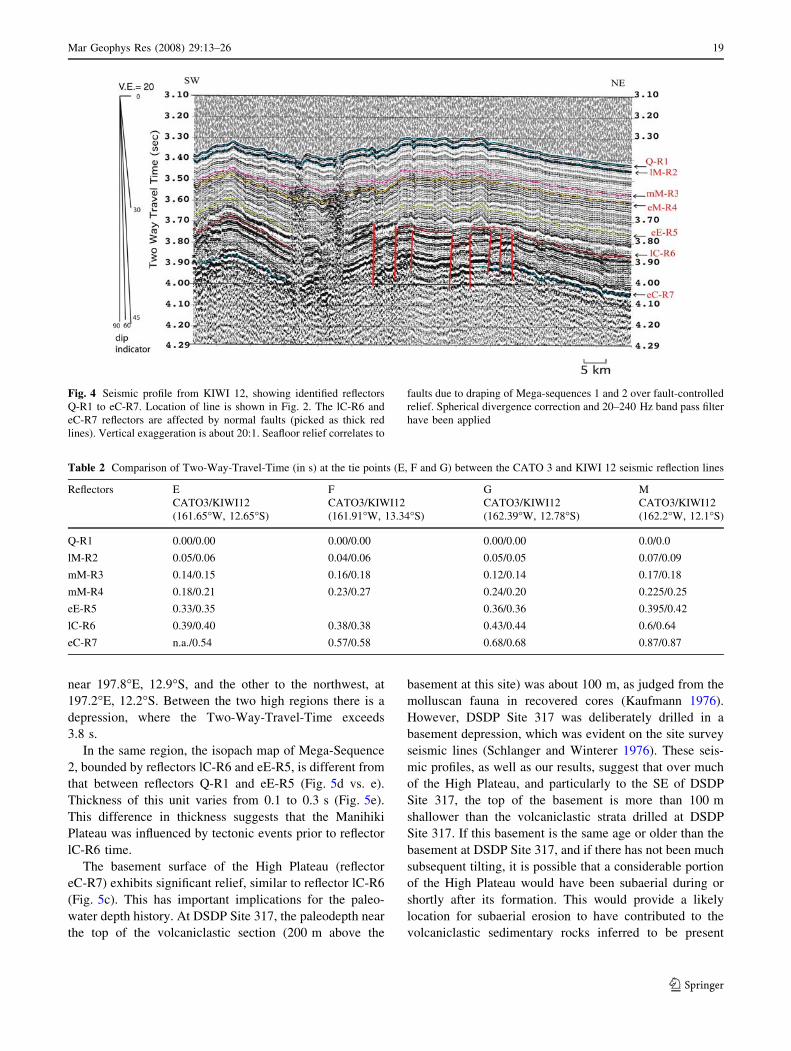
Fig. 4 Seismic profile from KIWI 12, showing identified reflectors
Q-R1 to eC-R7. Location of line is shown in Fig. 2. The lC-R6 and
eC-R7 reflectors are affected by normal faults (picked as thick red
lines). Vertical exaggeration is about 20:1. Seafloor relief correlates to
faults due to draping of Mega-sequences 1 and 2 over fault-controlled
relief. Spherical divergence correction and 20–240 Hz band pass filter
have been applied
Table 2 Comparison of Two-Way-Travel-Time (in s) at the tie points (E, F and G) between the CATO 3 and KIWI 12 seismic reflection lines
Reflectors E F G M
CATO3/KIWI12
(161.65�W, 12.65�S)
CATO3/KIWI12
(161.91�W, 13.34�S)
CATO3/KIWI12
(162.39�W, 12.78�S)
CATO3/KIWI12
(162.2�W, 12.1�S)
Q-R1 0.00/0.00 0.00/0.00 0.00/0.00 0.0/0.0
lM-R2 0.05/0.06 0.04/0.06 0.05/0.05 0.07/0.09
mM-R3 0.14/0.15 0.16/0.18 0.12/0.14 0.17/0.18
mM-R4 0.18/0.21 0.23/0.27 0.24/0.20 0.225/0.25
eE-R5 0.33/0.35 0.36/0.36 0.395/0.42
lC-R6 0.39/0.40 0.38/0.38 0.43/0.44 0.6/0.64
eC-R7 n.a./0.54 0.57/0.58 0.68/0.68 0.87/0.87
Mar Geophys Res (2008) 29:13–26 19
123
-163°
-163°
-162°
-162°
-161°
-161°
-13° -13°
-12° -12°
3.6
3.8
4.0
4.2
4.4
4.6
secs
TWTT(s)
4A
A’
-163°
-163°
-162°
-162°
-161°
-161°
-13° -13°
-12° -12°
3.6
3.8
4.0
4.2
4.4
4.6
secs
TWTT(s)
A
A’
-163°
-163°
-162°
-162°
-161°
-161°
-13° -13°
-12° -12°
3.6
3.8
4.0
4.2
4.4
4.6
secs
TWTT(s)
4
4
A
A’
-163°
-163°
-162°
-162°
-161°
-161°
-13°
-12°
0.05
0.10
0.15
0.20
0.25
0.30
0.35
0.40
TWTT(s)
0.4A
A’
-163°
-163°
-162°
-162°
-161°
-161°
-13°
-12°
0.05
0.10
0.15
0.20
0.25
0.30
0.35
0.40
TWTT(s)
0.10.
1
A
A’
-163°
-163°
-162°
-162°
-161°
-161°
-13°
-12°
0.05
0.10
0.15
0.20
0.25
0.30
0.35
0.40
TWTT(s)
0.2
A
A’
(a) Depth of R5
(b) Depth of R6
(c) Depth of R7
(d) R5-seafloor
(e) R6-R5
(f) R7-R6
Fig. 5 (a) Two-Way-Travel-Time (TWTT) contour map showing
time-depth of the eE-R5 reflector below sea surface. Line AA0 is
section line for Fig. 10; (b) Two-Way-Travel-Time contour map of
lC-R6 below sea surface; (c) Two-Way-Travel-Time contour map of
eC-R7, top of basement; (d) Time-isopach map of thickness of layer
bounded by reflectors eE-R5 and Q-R1; (e) Time-isopach map of
thickness of layer bounded by reflectors lC-R6 and eE-R5; (f) Time-
isopach map of thickness of layer bounded by reflectors eC-R7 and
lC-R6
20 Mar Geophys Res (2008) 29:13–26
123
throughout the plateau, above reflector eC-R7 (Winterer
et al. 1974). In addition to volcaniclastic material produced
in subaerial eruptions, some of the volcaniclastic strata
could be epiclastic material derived from subaerial base-
ment highs. This would provide a plausible explanation for
the otherwise puzzling occurrence of a considerable per-
centage of rounded grains in the volcaniclastic sandstones
in DSDP Site 317 (noted by Jenkyns 1976).
Boundaries of the high plateau
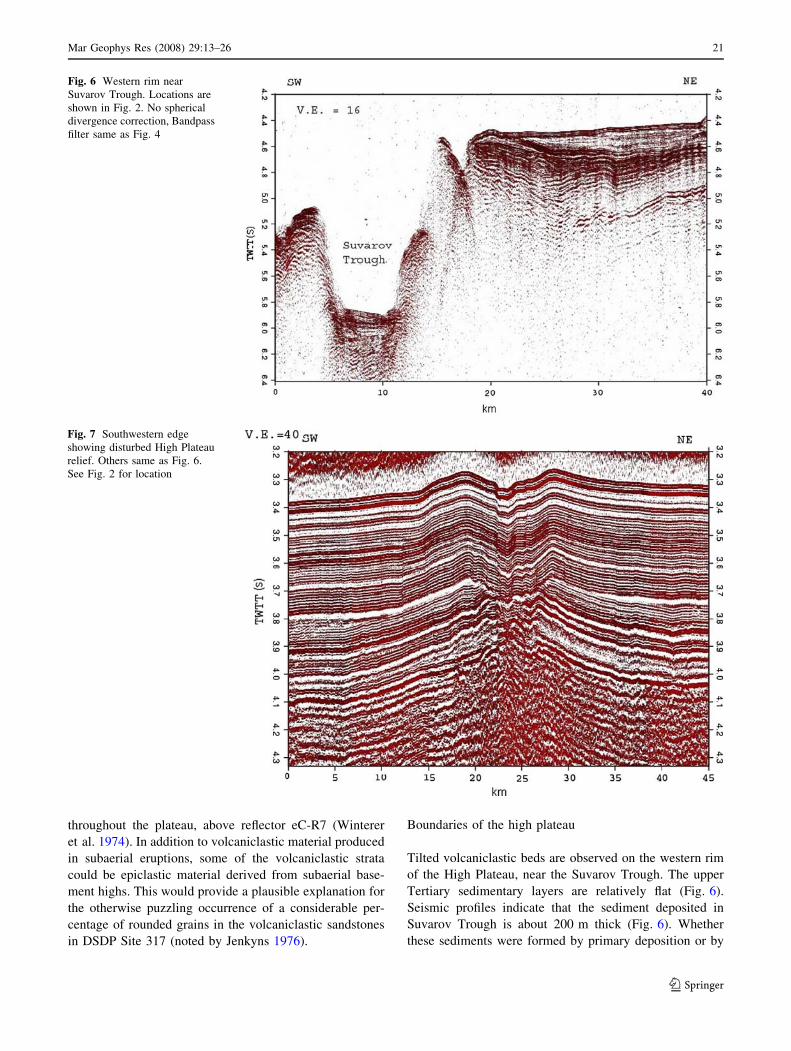
Tilted volcaniclastic beds are observed on the western rim
of the High Plateau, near the Suvarov Trough. The upper
Tertiary sedimentary layers are relatively flat (Fig. 6).
Seismic profiles indicate that the sediment deposited in
Suvarov Trough is about 200 m thick (Fig. 6). Whether
these sediments were formed by primary deposition or by
Fig. 6 Western rim near
Suvarov Trough. Locations are
shown in Fig. 2. No spherical
divergence correction, Bandpass
filter same as Fig. 4
Fig. 7 Southwestern edge
showing disturbed High Plateau
relief. Others same as Fig. 6.
See Fig. 2 for location
Mar Geophys Res (2008) 29:13–26 21
123

slumping of the sediments from the High Plateau is not
clear from the profile.
Deeply buried basement highs are clearly visible in seis-
mic reflection profiles from both the CATO 3 and KIWI 12
cruises. The reflectors Q-R1 through eE-R5 are draped over
the previously disturbed High Plateau relief (e.g. Fig. 7).
This basement high identified on the profiles is near the
southwestern edge of the High Plateau (see Fig. 2).
At the eastern edge of the High Plateau, the NNE-
trending Eastern Scarp comprises a zone (100 km wide) of
four to five parallel linear ridges and basins each with a
relief of 500–2,000 m. This ridge and trough region con-
tinues south and north of the High Plateau where it is
named the Manihiki Scarp. Stock et al. (1998) interpret this
feature as a transtensional dextral fracture zone formed
during a change in spreading direction in Late Cretaceous
time. The eastern part of the High Plateau appears trun-
cated with an adjacent block possibly sheared off and
transported away from the High Plateau (Fig. 8). As seen
in Fig. 8, younger sediments are displaced upward, sug-
gesting that the Eastern Scarp was active after these
younger sediments were deposited. On the three crossings
of the Eastern Scarp on the KIWI 12 cruise, as well as on
one crossing obtained on the NBP0304 cruise, multibeam
bathymetric data show that between 12�150S and 13�150Sthis elevated basement rim has a consistent, and relatively
flat top, at a depth of about 2,100 m (Fig. 9). It is possible,
therefore, that this linear ridge was extruded and/or uplifted
when the High Plateau was at a depth of about 700 m. In
this case the linear ridge may have then been eroded to sea
level, after which it would have experienced 2,100 m of
subsidence to bring it down to the depth at which it is found
today.
There are significant normal faults throughout and along
the margins of the High Plateau, cutting seismic reflectors.
For instance, Fig. 4 shows faults displacing reflector
eC-R7, the top of the basement, and the lC-R6 reflector, the
top of the volcaniclastic layer. The faults do not affect the
U2 unconformity. One possible explanation for the origin
of these faults is strain associated with the cooling of the
plateau, after the volcanism stopped. Another explanation
is regional rifting, as explained next.
Joseph et al. (1993) reported faults striking NW–SE on
the northeast and southwest edges of the Manihiki Plateau.
Joseph et al. (1993) related the faults to the mid-Cretaceous
reorganization of the Pacific–Farallon–Phoenix ridge–
ridge–ridge (RRR) triple junction (PAC–FAR–PHN).
Larson et al. (2002) also related the faulting of the Mani-
hiki Plateau to the tectonic evolution of this RRR triple
junction, and proposed that the Manihiki Plateau was
broken and lost two pieces that have drifted away: one
piece to the NE (on the Farallon plate) and one to the
southeast (rifted from the Eastern Scarp onto the Phoenix
plate). An additional piece containing the Hikurangi Pla-
teau rifted away to the south (Lonsdale 1997; Billen and
Stock 2000). Therefore, the widespread normal faults
throughout and along the margins of the High Plateau were
probably the joint result of younger post-volcanic cooling
and the earlier evolution of the triple junction with break-
up of the original Manihiki Plateau.
Very few minor faults cut the upper Cenozoic sedi-
mentary layers, and they are confined to steep escarpments,
Fig. 8 KIWI 12 Seismic
reflection profile records of
Eastern Scarp, High Plateau of
Manihiki Plateau
22 Mar Geophys Res (2008) 29:13–26
123

such as the western edge. These faults may be caused by
slumping near the edge of the plateau and provide little
evidence for the whole tectonic evolution history of the
plateau.
Model for Manihiki Plateau evolution
The schematic cross-section shown in Fig. 10d is derived
from the maps of Fig. 5a–f. As discussed previously, the
Q-R1 through eE-R5 (U1) reflectors are relatively flat,
while the lC-R6 and eC-R7 reflectors show more relief.
Normal faults cut through the eC-R7 and lC-R6 reflectors,
but do not affect unconformity U2 and the section above it.
As a model to explain the formation of the Manihiki
Plateau, we propose that during Early Cretaceous time, the
plateau began to form due to volcanism from a mantle
hotspot, ultimately reaching shallow depths. The presence
of a hotspot is suggested by the isotopic analysis for basalts
of the plateau done by Mahoney and Spencer (1991) and
Beiersdorf et al. (1995), who noted that basalts of the
Manihiki Plateau fall well within the category of oceanic
island or near-ridge hotspots. By 120 Ma, the activity of
the hotspot had created the basement of the original
Manihiki Plateau, and formed the top of the basement. The
uppermost basement basalts at DSDP Site 317 were
erupted in shallow water, while the region of the southeast
High Plateau was shallower and could have been subaerial.
1875 2250 2625 3000 3375 3750 4125 4500 4875 5250 5625Depth (m)
161˚ 30'W
161˚ 30'W
161˚ 15'W
161˚ 15'W
161˚ 00'W
161˚ 00'W
160˚ 45'W
160˚ 45'W
13˚ 30'S 13˚ 30'S
13˚ 15'S 13˚ 15'S
13˚ 00'S 13˚ 00'S
12˚ 45'S 12˚ 45'S
12˚ 30'S 12˚ 30'S
12˚ 15'S 12˚ 15'S
12˚ 00'S 12˚ 00'S
Fig. 9 Bathymetric contour map of SeaBeam data from KIWI 12 and
Simrad EM120 data from NBP0304 showing the relatively flat
character of the high ridge along the Eastern Scarp of the Manihiki
Plateau
Erosion Erosion
EruptionEruption
Triple junction
(a) ~120 Ma
Water
R7
Riftaway
Subside
Collapse
(b) 120~118 Ma
Water
R7
SubsideR7
(c) 118~89(?) Ma
R6
Water
U2
Subside
R7
(d) 89(?) Ma-presentWater
R6
R5
R1(seafloor)
U2
50 km
Fig. 10 Schematic sketch showing evolution of High Plateau region
of Manihiki Plateau based on cross-section AA0 in Fig. 5. Vertical
axis (not to scale) is exaggerated for clarity. (a) During Early
Cretaceous time (*120 Ma), plateau was partly above sea level due
to activity of a hotspot. Basalt basement and volcanic edifices were
formed by eruption. Volcaniclastic sedimentary layers were deposited
by erosion of subaerial basement. Original plateau might have been
near a triple junction; (b) 120–118 Ma: hotspot activity died away
and plateau began to experience cooling and subsidence, as evidenced
by the change in marine fauna. Calcareous sediments were deposited
overlying volcaniclastic layers. During this time, original plateau
might have been separated and rifted away. Normal faults were
formed either from contraction during cooling, or from separation and
rifting of plateau; (c) 118–89(?) Ma: Deposition of calcareous
sediments continued; formation of reflector lC-R6. Faults cut through
eC-R7 and lC-R6 reflectors. Plateau continued subsiding; Unconfor-
mity U2 is probably formed during this time; (d) Since Early Eocene
time, plateau subsided to its present depth
Mar Geophys Res (2008) 29:13–26 23
123

The ancient RRR triple junction would originally have
been northeast of our study area (Larson et al. 2002). The
suggested formation near a RRR triple junction is compa-
rable with the evolution history of Shatsky Rise, located
northwest of the Manihiki Plateau (Ito and Clift 1998).
Volcaniclastic sedimentary layers were deposited on top of
the basement as erosion progressed. A considerable per-
centage of grains were rounded during this erosion and
transportation (Fig. 10a). The deposition of the volcani-
clastic sediments was widespread throughout the plateau,
suggesting that the volcanic source regions were also
widespread.
The short-lived volcanism died away after 118 Ma.
Subsequent lithospheric cooling caused the Manihiki Pla-
teau to subside. Calcareous sediments began to be
deposited at this time (Fig. 10b). The ‘‘shallow-shelf’’
character of the volcaniclastic sedimentary rocks, in con-
trast with the deep water sedimentary rocks overlying the
volcaniclastic rocks, indicates rapid sinking of the plateau
at this time. Several bathymetric depressions were formed
by the rapid subsidence of the plateau. Possibly coeval with
the subsidence are the normal faults that cut through
reflector eC-R7 and the overlying volcaniclastic layers. It
seems likely that these normal faults were, at least in part,
formed during the rapid subsidence of the plateau follow-
ing the end of hotspot activity. The original plateau, which
might have been a very large subaerial volcanic province,
was separated. One section rifted away to the south (the
present Hikurangi Plateau). Another section rifted away to
the east and is now missing. Deposition of limestone and
cherts continued from 118 to *89 Ma when reflector
lC-R6 was formed (Fig. 10c). The undulating geometry of
reflector lC-R6 is the result of either irregular basement
topography, or lateral variation in cooling rates.
Since the location of reflector lC-R6, and/or the
unconformity U2, is not well defined from the present drill
hole data, there is no reliable explanation for its formation
and age. One possibility is given by Schlanger et al.
(1976), who postulated based on analysis of foraminifera in
the sedimentary rocks that an uplift event happened at the
Santonian-Turonian (*89 Ma) boundary to form the
reflector lC-R6. Although uplift of the plateau is consistent
with the paleontological data, it is difficult to explain the
driving force for this uplift. Winterer et al. (1974) sug-
gested that this unconformity was formed after Paleocene
time, but this seems to be ruled out by the results of DSDP
Site 317.
Since Early Eocene time or earlier (starting somewhere
within the sampling gap from 411 to 554 m at DSDP Site
317), thick layers of pelagic sediments were deposited on
the top of the Manihiki Plateau (Fig. 10d). Foraminifera
are very scarce in the clay-rich cherty chalk of the Lower
Eocene, referred to as Mega-Sequence 2 in this work
(Jenkyns 1976). The foraminiferal content and CaCO3
concentrations are known to be indices of carbonate dis-
solution, and the lack of foraminifera suggests a shallow
calcite compensation depth (CCD), which is related to the
productivity and dissolution rate of CaCO3 in the ocean. A
shallow calcite compensation depth is consistent with
results from ODP leg 199 to the east, which showed that
the CCD near the equator was shallower than 3,300 m in
the Paleocene and Eocene, with a sudden deepening to ca.
4,500 m at the Eocene/Oligocene boundary (Rea and Lyle
2005). A deepening of the CCD by ca. 1 km at this time is
found in various other ocean basins, suggesting a global
oceanographic event (Rea and Lyle 2005).
Mega-Sequence 1, the Late Eocene to Recent oozes and
chalks, bounded by reflectors Q-R1 and eE-R5, is charac-
terized by dominantly calcareous strata with carbonate
contents greater than 90%, consistent with deposition
above the CCD. Unconformity U1, between Mega-
Sequences 1 and 2, may be due to submarine erosion
(Jenkyns 1976). It is older than the global deepening of the
CCD that occurred near the Eocene/Oligocene boundary;
however, more drill hole studies in this part of the SW
Pacific are needed to establish its significance. The smooth
pattern of the time-isopach maps of reflectors Q-R1
through eE-R5 indicates little tectonic activity since Late
Eocene time (Fig. 10d).
Discussion
Our results allow us to revisit the conclusions of Ito and
Clift (1998) concerning the history of the Manihiki Plateau.
Ito and Clift (1998) constructed a subsidence curve for the
Manihiki Plateau based on the results of DSDP Site 317.
Our study connects the seismic stratigraphy of this hole to
the region to the southeast, the High Plateau. Although, as
Ito and Clift (1998) summarize, DSDP Site 317 may not
have been subaerial, considerable portions of the plateau to
the southeast may have been near or above the sea surface,
judging from the basement relief visible in the seismic
sections. This provides a likely explanation for the com-
mon occurrence of rounded grains in the sandstones drilled
in the volcaniclastic section at DSDP Site 317.
The plate tectonic model of Larson et al. (2002) and
Taylor (2006) would allow for the possibility that the
plateau was originally much larger. In this scenario, very
large pieces of the plateau rifted off to the east (now sub-
ducted?) and to the south to form the Hikurangi Plateau as
suggested by Lonsdale (1997). In such a case, modeling of
the load due to the hotspot volcanism and the predicted
subsidence is more complicated, because the original load
could have included a much larger mass than what
presently comprises the Manihiki Plateau. This was not
24 Mar Geophys Res (2008) 29:13–26
123

envisioned in the subsidence calculations of Ito and Clift
(1998). Areas that are now rafted away could have pro-
vided a much more extensive source of subaerial
weathering of the volcanic edifices, to produce the thick
volcaniclastic section preserved above the basement in the
High Plateau.
Recent observations of the Hikurangi Plateau adjacent
and east of New Zealand (Hoernle et al. 2004) are also
relevant to the interpretation of the Manihiki Plateau area,
because of the proposed original connection between the
two plateaus prior to rifting along the seafloor spreading
system that formed the Osbourn Trough (Lonsdale 1997;
Billen and Stock 2000). On the basis of swath bathymetry
and other underway geophysical data from the Hikurangi
Plateau, Hoernle et al. (2004) identify several major stages
of volcanism in its history: first, overall plateau growth;
second, late-stage isolated volcanic cones; third, intrusions
along normal faults that accommodated the separation of
the Hikurangi Plateau from the Manihiki Plateau. Their
model requires the surface of the Hikurangi Plateau to
subside from near sea level to about 1,500 m water depth
before the eruption of the late-stage volcanoes, and prior to
the separation of the Hikurangi and Manihiki Plateaus.
Hoernle et al. model would suggest that the Manihiki and
Hikurangi Plateaus would have been adjacent to one
another until after the 1,500 m of subsidence had occurred.
In our study area on the High Plateau of the Manihiki
Plateau, we do not see evidence for late stage seamounts of
the type identified by Hoernle et al. (2004) on the Hiku-
rangi Plateau. However, we only have swath bathymetry
coverage along our track lines, which cover a very limited
area of the High Plateau. We identify basement highs along
some of the steep bathymetric scarps on the Eastern Scarp
and the Suvarov Trough (Fig. 10). There are also some
low-relief highs within the plateau interior, which are now
nearly buried by the Tertiary sedimentary rocks. These
highs consist of unstratified, most likely igneous, material,
and in some cases we cannot rule out the possibility that
these represent a later stage of volcanism than that which
formed the major part of the plateau. The high ridge along
the Eastern Scarp could have formed by magmatism along
a marginal fault system, similar to the suggested origin of
Hoernle et al. (2004) for some of the ridges on the Hiku-
rangi Plateau. Its roughly flat-topped character, if due to
erosion at sea level, would require it to have been emplaced
after the main plateau had already sunk to depths in excess
of 700 m. At the eastern edge of the High Plateau, conical
seamounts such as Mt. Eddie and Rakahanga Atoll were
surveyed and sampled. Petrography and geochemistry
analysis of the basement samples suggest subaerial volca-
nic origin, and isotopic dating shows that age of these
seamounts is in accord with the formation of the Manihiki
Plateau (Beiersdorf et al. 1995).
We do not see a straightforward way to reconcile the
models of Larson et al. (2002) and Hoernle et al. (2004) in
terms of the timing of separation of the three hypothetical
former plateau fragments. Larson et al. (2002) suggest that
the Eastern Scarp rifted at *119 Ma, but Hoernle et al.
model would require somewhat later timing for the sepa-
ration between the Manihiki and Hikurangi Plateaus
because the plateaus would have to subside to *1,500 m
water depth prior to separation. In this case, one might
expect a continuation of the Eastern Scarp to be present on
the east side of the Hikurangi Plateau, but no such scarp is
visible in existing bathymetric data.
There is currently no precise constraint on the time of
separation of the Manihiki and Hikurangi plateaus because
the intervening seafloor formed by the Osbourn Trough
spreading system appears to have been all formed during
the Cretaceous Normal Superchron (120–84 Ma) and lacks
magnetic reversal isochrons. To have the Manihiki–Hiku-
rangi rifting be later than 119 Ma would not violate the
marine geophysical data. However, to invoke diachronous
rifting of the various plateau segments leads to geometrical
complications in the implied triple junction configurations
in the region.
Conclusions
Seven seismic reflectors are traced across the southeastern
part of the High Plateau region of the Manihiki Plateau.
Isopach maps of the time thickness of layers bounded by
pairs of reflectors indicate unequal thinning and thickening
during Early to Late Cretaceous time in the studied area. In
contrast, the thickness of layers bounded by reflectors
formed since Early Eocene time is relatively constant in the
same region. A model to explain this observation is that a
thermally elevated plateau rapidly subsided when the hot-
spot died away during Early Cretaceous time. Differential
subsidence caused the local thickening observed in the
isopach maps and may be related to the extensive set of
normal faults cutting through the basement and the Lower
Cretaceous volcanic sedimentary rocks found at the
southeast edge of this area. The activity of the hotspot was
in a near-ridge environment during the formation of the
original Manihiki Plateau. The Eastern, or Manihiki, Scarp
is related to the rearrangement of the PAC–FAR–PHN
triple junction near the Manihiki Plateau around 121–
119 Ma (Stock et al. 1998; Larson et al. 2002) and marks
where a piece of the High Plateau rifted away. The plateau
began to subside to its present depth after Early Cretaceous
and before Early Eocene time. The relatively constant
pattern of sediment deposition since Early Eocene time
indicates that the plateau experienced little tectonic evo-
lution except thermal subsidence since then.
Mar Geophys Res (2008) 29:13–26 25
123
Acknowledgments We thank Patricia Persaud for her insightful
discussion and numerous suggestions. We also thank graduate and
undergraduate students from Caltech and UC Santa Barbara for their
assistance on KIWI 12. Research supported by University of
California San Diego, Scripps Institution of Oceanography, UC Santa
Barbara, and Caltech. Nathaniel B. Palmer multibeam data collection
was supported by NSF OPP-0126334. Contribution 8945, Division of
Geological and Planetary Sciences, California Institute of Technol-
ogy. Contribution of the Institute for Crustal Studies, University of
California, Santa Barbara, number 0810.
Open Access This article is distributed under the terms of the
Creative Commons Attribution Noncommercial License which per-
mits any noncommercial use, distribution, and reproduction in any
medium, provided the original author(s) and source are credited.
References
Beiersdorf H, Bach W, Duncan R, Erzinger J, Weiss W (1995) New
evidence for the production of EM-type ocean island basalts and
large volumes of volcaniclastics during the early history of the
Manihiki Plateau. Mar Geol 122:181–205
Billen MI, Stock JM (2000) Morphology and origin of the Osbourn
Trough. J Geophys Res 105(B6):13481–13489
Clift PD (2005) Sedimentary evidence for moderate mantle temper-
ature anomalies associated with hotspot volcanism. In: Foulger
G, Natland JH, Presnall DC, Anderson DL (eds) Plumes, plates
and paradigms. Geol Soc Am Spec Pap 388, pp 279–287
Erba E (2004) Calcareous nannofossils and Mesozoic oceanic anoxic
events. Mar Micropaleontol 52:85–106
Heezen B, Glass B, Menard H (1966) The Manihiki Plateau. Deep-
Sea Res 13:445–458
Hoernle K, Hauff F, Werner R, Mortimer N (2004) New insights into
the origin and evolution of the Cretaceous Hikurangi Plateau.
Eos Trans Am Geophys Union 85(41):401
Ingle S, Mahoney JJ, Sato H, Coffin MF, Kimura JI, Hirano N,
Nakanishi M (2007) Depleted mantle wedge and sediment
fingerprint in unusual basalts from the Manihiki Plateau, central
Pacific Ocean. Geology 35:595–598. doi: 10.1130/G23741A.1
Ito G, Clift PD (1998) Subsidence and growth of Pacific Cretaceous
Plateaus. Earth Planet Sci Lett 161:85–100
Jenkyns H (1976) Sediments and sedimentary history of the Manihiki
Plateau, South Pacific Ocean. Init Rep DSDP 33:873–890
Joseph D, Taylor B, Shor AN, Yamazaki T (1993) The Nova-Canton
Trough and the Late Cretaceous evolution of the central Pacific.
In the Mesozoic Pacific: geology, tectonics and volcanism. Am
Geophys Union Monogr 77:171–185
Kauffman EG (1976) Deep-sea Cretaceous macrofossils: DSDP Site
317A, Manihiki Plateau. Init Rep DSDP 33:503–535
Larson RL, Erba E (1999) Onset of the mid-Cretaceous greenhouse in
the Barremian-Aptian: igneous events and the biological,
sedimentary, and geochemical responses. Paleoceanography
14:663–678
Larson RL, Pockalny RA, Viso RF, Erba E, Abrams LJ, Luyendyk
BP, Stock JM, Clayton RW (2002) Mid-Cretaceous tectonic
evolution of the Tongareva triple junction in the southwestern
Pacific basin. Geology 30:67–70
Lonsdale P (1997) An incomplete geologic history of the southwest
Pacific basin. GSA Abstracts with Programs, vol 29(5), p 25
Mahoney J, Spencer K (1991) Isotopic evidence for the origin of the
Manihiki and Ontong Java oceanic plateaus. Earth Planet Sci
Lett 104:196–210
Mahoney J, Storey M, Duncan RA, Spencer KJ, Pringle M (1993)
Geochemistry and age of the Ontong Java Plateau. In: Pringle
MS et al (eds) The Mesozoic Pacific: geology, tectonics, and
volcanism. Am Geophys Union Geophys Monogr 77, pp 233–
261
Mayer LA, Shipley TH, Winterer EL (1986) Equatorial Pacific
seismic reflections as indicators of global oceanographic events.
Science 233(4765):761–764
Rea DK, Lyle MW (2005) Paleogene calcite compensation depth in
the eastern subtropical Pacific: answers and questions. Paleoce-
anography 20:PA1012. doi: 10.1029/2004PA001064
Sandwell DT, Smith WHF (1997) Marine gravity-anomaly from
Geosat and ERS-1 satellite altimetry. J Geophys Res 102:10039–
10054
Schlanger SO, Winterer EL (1976) Underway geophysical data:
Navigation, bathymetry, magnetics, and seismic profiles. Init
Rep DSDP 33:655–693
Schlanger S, Jackson E et al (1976) Site 317. Init Rep DSDP 33:161–
300
Smith WHF, Sandwell DT (1997) Global sea floor topography from
satellite altimetry and ship depth soundings. Science
277(5334):1956–1962
Stock JM, Luyendyk BP, Clayton RW et al (1998) Tectonics and
structure of the Manihiki Plateau, western Pacific Ocean. Eos
Trans Am Geophys Union 79:F870
Sutherland R, Hollis C (2001) Cretaceous demise of the Moa plate
and strike-slip motion at the Gondwana margin. Geology
29(3):279–282
Taylor B (2006) The single largest oceanic plateau: Ontong Java-
Manihiki-Hikurangi. Earth Planet Sci Lett 241(3–4):372–380.
doi: 10.1016/j.epsl.2005.11.049
Winterer EL, Lonsdale PF, Mathews JL, Rosendahl BR (1974)
Structure and acoustic stratigraphy of the Manihiki Plateau.
Deep-Sea Res 21:793–814
26 Mar Geophys Res (2008) 29:13–26
123
Recommended