Vehicle Specific Power: A Useful Parameterfor Remote Sensing and Emission Studies
José L. JiménezAerodyne Research and M.I.T.Chemical Engineering
Peter McClintockApplied Analysis, Inc.
G.J. McRaeM.I.T.Chemical Engineering
David D. Nelson and Mark S. ZahniserAerodyne Research
9th CRC On-Road Vehicle Emissions Workshop
San Diego, April 21st 1999
Effect of Driving Conditions on Emissions
• Driving conditions may strongly influence emissions
– e.g. commanded enrichment at high power demand
• Problems:
– False high emitters / False clean cars in remote sensing• Texas Remote Sensing Study (CRC 98): 65% of cars at 5-6
mph/sec are high CO emitters
– Difficult to compare between RS, dyno cycles, & models
– Difficult to capture on emissions models
• MOBILE, EMFAC: EF * Speed Correction * Cycle Correction
• Modal, Neural Network: very detailed & complex

Vehicle Specific Power (VSP)
vCv)vv(m
AC
2
1 vCg vgrade g )1( av
m
vFvFvF)E E(dt
d
Mass
Power VSP
if2
wDaRi
friction ernalintcAerodynamiRollingPotential Kinetic
⋅+⋅+ρ+⋅⋅+⋅⋅+ε+⋅⋅≈
=⋅+⋅+⋅++
==
Frolling
FAerodynamicm⋅a
m⋅g ⋅ sin(grade)
Previous Work: • Specific Power = 2⋅v⋅a (EPA, 1993)• Positive Kinetic Energy = Σ pos(SPi)/ Σ distance (Watson et al., 1983)• DPWRSUM = Σ |SPi-SPi-1| (Webster and Shih, 1996)
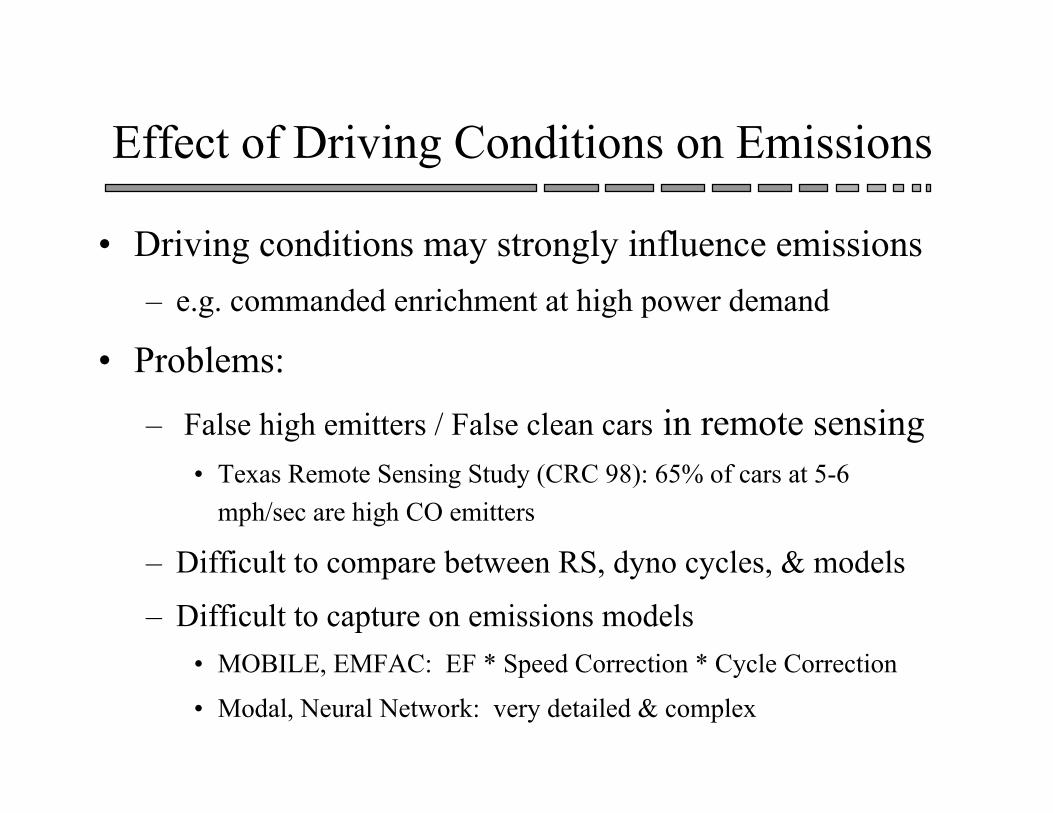
Vehicle Specific Power (II)
mph/sec)in a mph,in vand vTon, kW/Metricin (VSP
v)v(v 0.0000272v0.0954 vgrade4.39 av0.22 Mass
Power VSP
distance ontalrise/horiz verticalas defined grade ,m/sin ion)(accelerat a
m/s,in vehicle) theinto (headwind vand (speed) vTon, kW/Metricin VSPwith
v)v(v 0.000305v0.213 vgrade9.81 av1.1 Mass
Power VSP
:available) when used be should tscoefficien resistance
theof estimates(better sduty truck-light and lesduty vehic-light U.S.lFor typica
w
2w
2
w
2w
⋅+⋅+⋅+⋅⋅+⋅⋅≈=
⋅+⋅+⋅+⋅⋅+⋅⋅≈=

VSP in Emissions Certification Cycles
VSP Specified at each point
Federal Test Procedure "Bag 1"
0
20
40
60
80
100
120
140
0 40 80 120 160 200 240 280 320 360 400 440 480
Time (seconds)
Sp
eed
(m
ph
)
-30-25-20-15-10-50510152025
Sp
ecif
ic P
ow
er
(kW
/Met
ric
To
n)
Rolling Resistance Aerodynamic ResistanceKinetic Energy Change Speed
Veh
icle
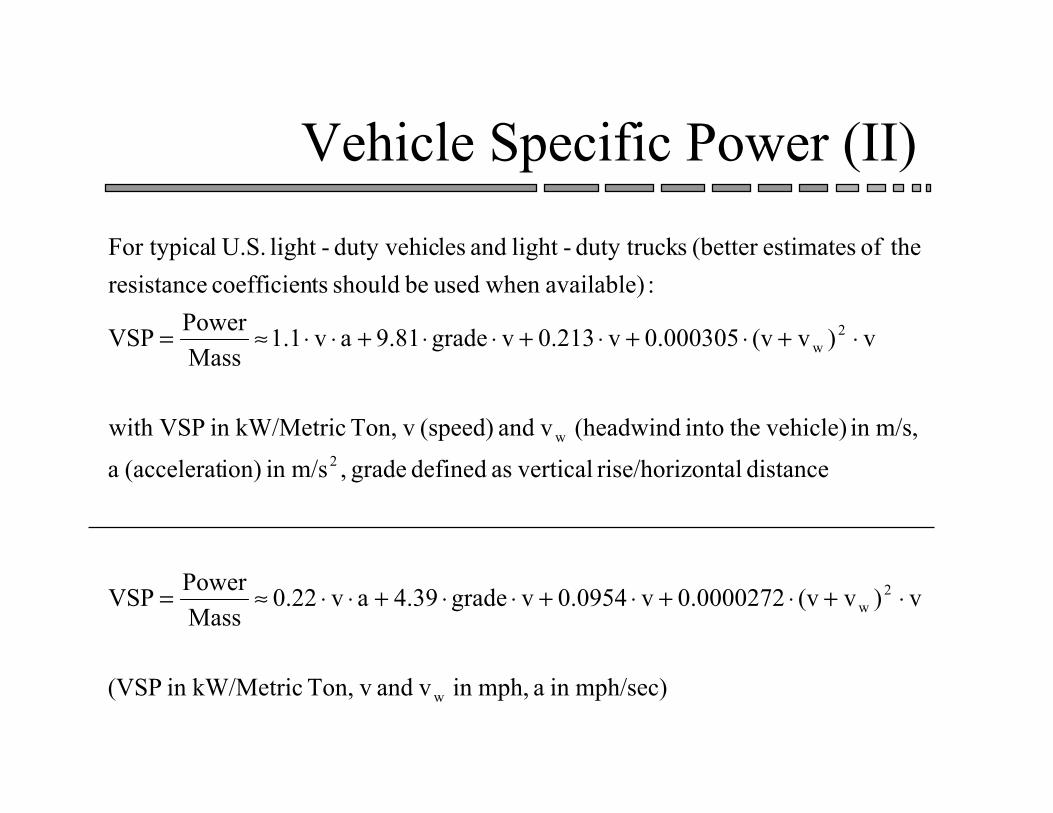
VSP in US06 Driving Cycle
0
25
50
75
100
125
150
175
200
225
0 100 200 300 400 500 600Time (sec)
Sp
eed
(m
ph
)
-60
-40
-20
0
20
40
60
Sp
ec
ific
Po
we
r (k
W/M
etri
c T
on
)
Rolling Resistance Aerodynamic Resistancev*a Speed
Max. SP on FTP
Veh
icle
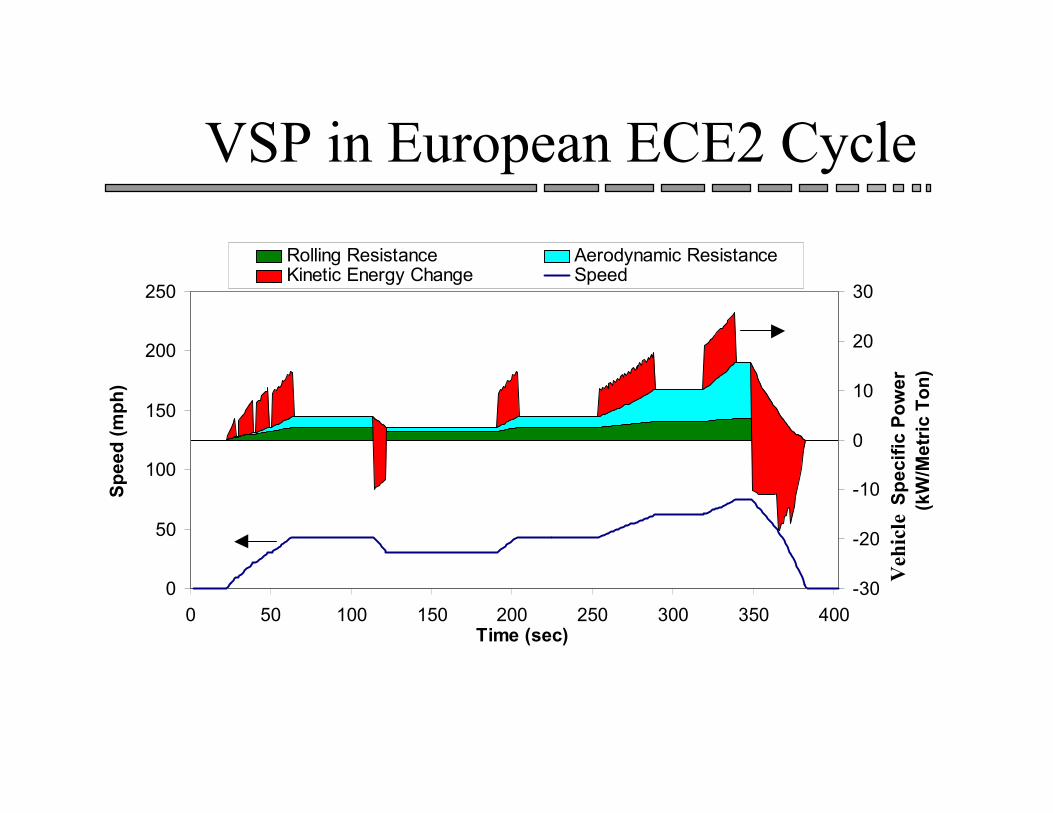
VSP in European ECE2 Cycle
0
50
100
150
200
250
0 50 100 150 200 250 300 350 400Time (sec)
Sp
eed
(m
ph
)
-30
-20
-10
0
10
20
30
Sp
ec
ific
Po
we
r (k
W/M
etri
c T
on
)
Rolling Resistance Aerodynamic ResistanceKinetic Energy Change Speed
Vehicle

VSP Levels of Various Activities
Activity VSP (kW/ Metric Ton):
• Max. Rated Powers 44 - 112
• 0 to 60 mph in 15 seconds 33
• 60 mph up a 4% grade 23
• Maximum in FTP/IM240 23
• Rem. Sensing site means 10 -15
• Average in IM240 8
• ASM 5015 6
• ASM 2525 5
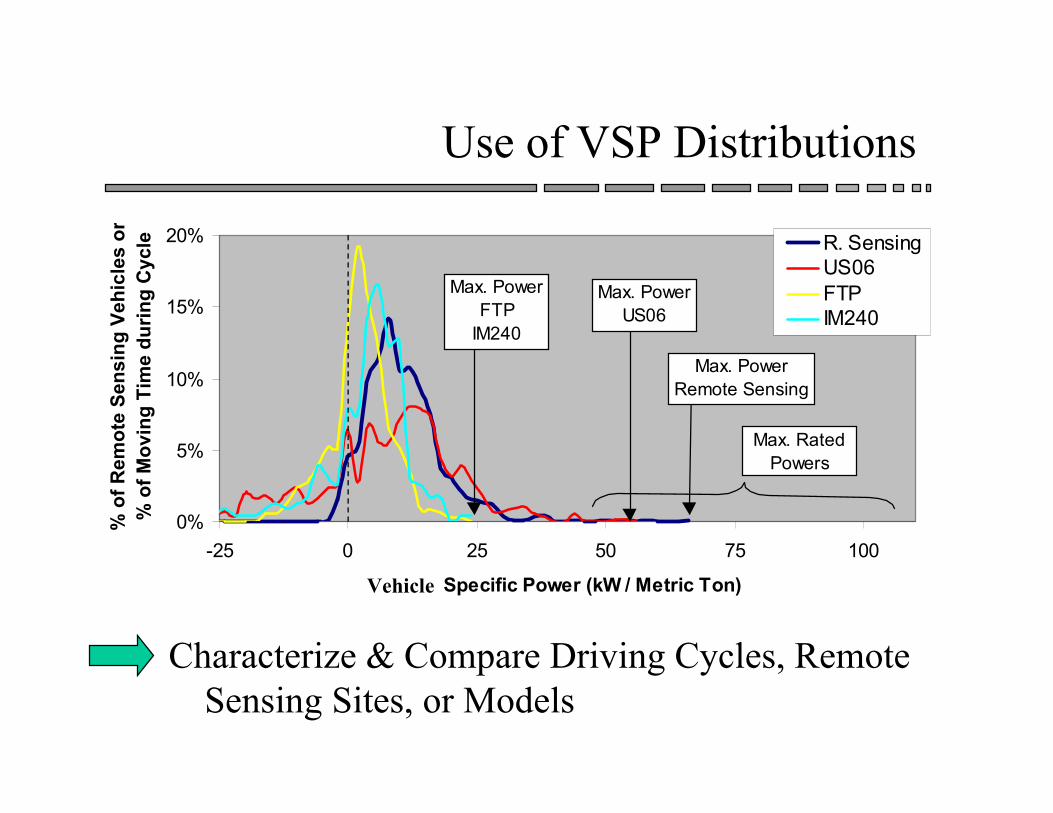
Use of VSP Distributions
Characterize & Compare Driving Cycles, RemoteSensing Sites, or Models
0%
5%
10%
15%
20%
-25 0 25 50 75 100
Total Specific Power (kW / Metric Ton)
% o
f R
emo
te S
ensi
ng
Veh
icle
s o
r%
of
Mo
vin
g T
ime
du
rin
g C
ycle R. Sensing
US06FTPIM240
Max. PowerFTP
IM240
Max. Rated Powers
Max. PowerRemote Sensing
Max. PowerUS06
Vehicle
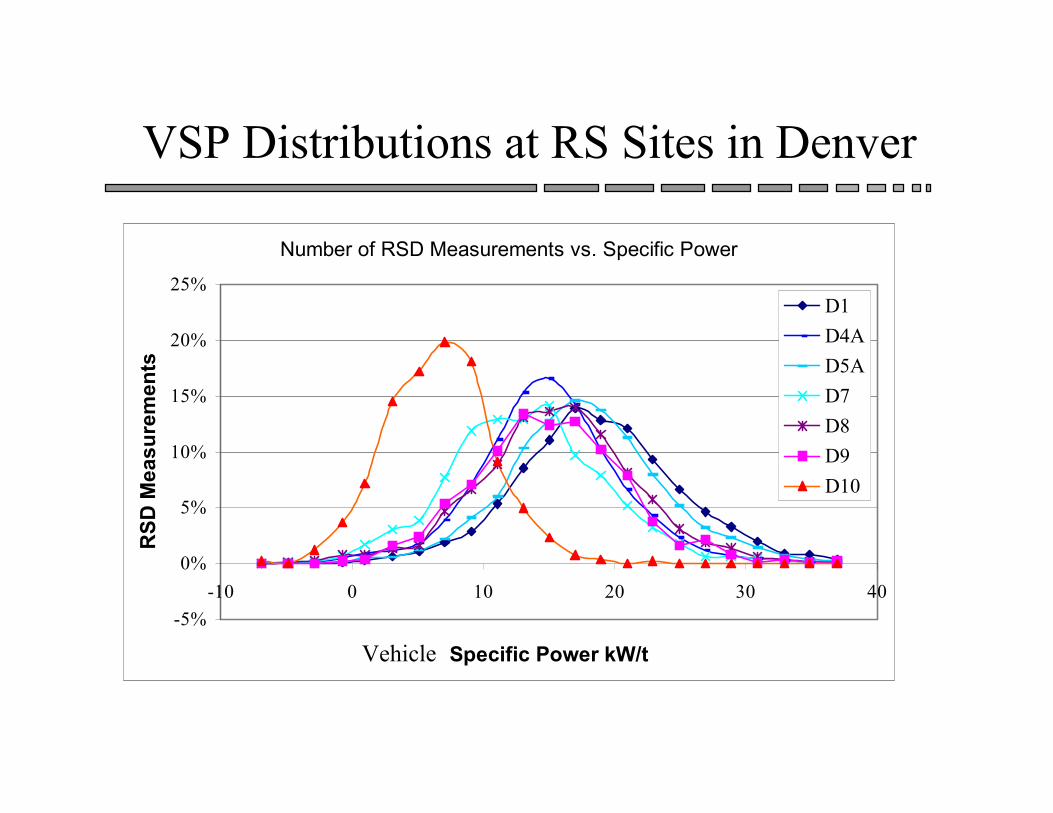
VSP Distributions at RS Sites in Denver
Number of RSD Measurements vs. Specific Power
-5%
0%
5%
10%
15%
20%
25%
-10 0 10 20 30 40
Specific Power kW/t
RS
D M
easu
rem
ents
D1
D4A
D5A
D7
D8
D9
D10
Vehicle

Advantages of VSP
• Captures dependence of emissions on power
– Directly specified in certification cycles
• Can be calculated from roadside measurements
– Mass only appears in aerodynamic term
• One-dimensional
• Direct physical interpretation
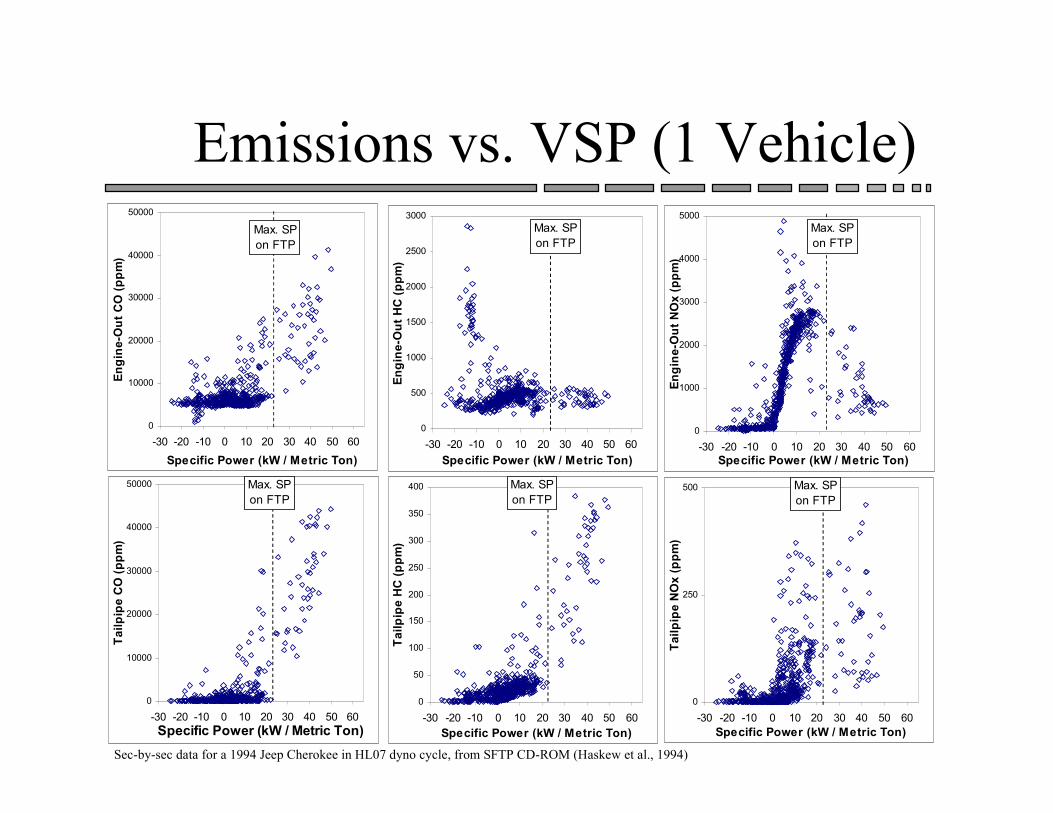
Emissions vs. VSP (1 Vehicle)
0
1000
2000
3000
4000
5000
-30 -20 -10 0 10 20 30 40 50 60Specific Power (kW / Metric Ton)
En
gin
e-O
ut
NO
x (
pp
m)
Max. SP on FTP
0
10000
20000
30000
40000
50000
-30 -20 -10 0 10 20 30 40 50 60
Specific Power (kW / Metric Ton)
En
gin
e-O
ut
CO
(p
pm
)
Max. SP on FTP
0
500
1000
1500
2000
2500
3000
-30 -20 -10 0 10 20 30 40 50 60
Specific Power (kW / Metric Ton)
En
gin
e-O
ut
HC
(p
pm
)
Max. SP on FTP
0
250
500
-30 -20 -10 0 10 20 30 40 50 60Specific Power (kW / Metric Ton)
Ta
ilp
ipe
NO
x (
pp
m)
Max. SP on FTP
0
10000
20000
30000
40000
50000
-30 -20 -10 0 10 20 30 40 50 60Specific Power (kW / Metric Ton)
Ta
ilp
ipe
CO
(p
pm
)
Max. SP on FTP
0
50
100
150
200
250
300
350
400
-30 -20 -10 0 10 20 30 40 50 60
Specific Power (kW / Metric Ton)
Ta
ilp
ipe
HC
(p
pm
)
Max. SP on FTP
Sec-by-sec data for a 1994 Jeep Cherokee in HL07 dyno cycle, from SFTP CD-ROM (Haskew et al., 1994)

Emissions vs. VSP (1 Vehicle)
0123456789
-40 -20 0 20 40Specific Power (kW / Metric Ton)
To
tal
Tai
lpip
e C
arb
on
E
mis
sio
ns
(g/s
)
ARB02 Test 1
REP05 Test 1
HL07 Test 1
FTP Test 1
0
500
1000
1500
2000
2500
3000
-40 -20 0 20 40
Specific Power Bin (kW / Metric Ton)
En
gin
e-O
ut
NO
x E
mis
sio
n
(pp
m)
ARB02 Test 1
ARB01 Test 2
REP05 Test 1
HL07 Test 1
FTP Test 1
0
5000
10000
15000
20000
25000
30000
35000
40000
-40 -30 -20 -10 0 10 20 30 40 50Vehicle Specific Power Bin (kW / Metric Ton)
En
gin
e-O
ut
CO
Em
issi
on
(p
pm
) ARB02 Test 1
ARB01 Test 2
REP05 Test 1
HL07 Test 1
FTP Test 1
0
200
400
600
800
1000
1200
1400
1600
-40 -30 -20 -10 0 10 20 30 40 50
Vehicle Specific Power Bin (kW / Metric Ton)
En
gin
e-O
ut
HC
Em
iss
ion
(p
pm
)
ARB02 Test 1
ARB01 Test 2
REP05 Test 1
HL07 Test 1
FTP Test 1
Binned Sec-by-sec data for a 1994 Jeep Cherokee, from SFTP CD-ROM (Haskew et al., 1994)
Vehicle
Vehicle

Emissions vs. VSP (1 Vehicle)
0123456789
-40 -20 0 20 40Specific Power (kW / Metric Ton)
To
tal
Tai
lpip
e C
arb
on
E
mis
sio
ns
(g/s
)
ARB02 Test 1
REP05 Test 1
HL07 Test 1
FTP Test 1
0
50
100
150
200
250
300
350
400
450
-40 -30 -20 -10 0 10 20 30 40 50
Vehicle Specific Power Bin (kW / Metric Ton)
Tai
lpip
e N
Ox
Em
issi
on
(p
pm
)
ARB02 Test 1
ARB01 Test 2
REP05 Test 1
HL07 Test 1
FTP Test 1
0
10000
20000
30000
40000
-40 -30 -20 -10 0 10 20 30 40 50
Specific Power Bin (kW / Metric Ton)
Ta
ilpip
e C
O E
mis
sio
n (p
pm
) ARB02 Test 1
ARB01 Test 2
REP05 Test 1
HL07 Test 1
FTP Test 1
0
50
100
150
200
250
300
350
400
-40 -30 -20 -10 0 10 20 30 40 50
Vehicle Specific Power Bin (kW / Metric Ton)
Ta
ilpip
e H
C E
mis
sio
n (p
pm
) ARB02 Test 1
ARB01 Test 2
REP05 Test 1
HL07 Test 1
FTP Test 1
1079
Binned Sec-by-sec data for a 1994 Jeep Cherokee, from SFTP CD-ROM (Haskew et al., 1994)
VehicleVehicle

Prediction of Commanded Enrichment
VSP > Max. VSP on FTP is good predictor of enrichment
0
10
20
30
40
50
60
70
80
90
0 100 200 300 400 500 600
Time on US06 Cycle (Sec)
Sp
ee
d (
mp
h)
1.0
1.2
1.4
Fu
el/A
ir R
elat
ive
Rat
io
Speed Predicted Enrichment Fuel/Air Rel. Ratio
HondaCivic 95

Onset of Enrichment
0%
25%
50%
75%
100%
0 10 20 30 40 50 60Specific Power (kW / Metric Ton)
Pe
rce
nta
ge
of
Tim
e
on
En
ric
hm
en
t
Cadillac Seville 94 Jeep Cherookee 94 Toyota Corolla 93Saturn 94 Chevrolet Suburban 92 Chevrolet G30 93Mercedes 420 SEL 93
0%
25%
50%
75%
100%
0 25 50 75 100 125Absolute Power (kW)
Pe
rce
nta
ge
of
Tim
e o
n
En
ric
hm
en
t
0%25%50%75%
100%
0% 10% 20% 30% 40% 50% 60% 70% 80% 90% 100%
Percentage of Maximum Engine Power Used
Pe
rce
nta
ge
of
Tim
e o
n
En
ric
hm
en
t
Binned Sec-by-sec data from chassis dynamometer tests of SFTP CD-ROM (Haskew et al., 1994)
Vehicle

CO Emissions vs. Several Parameters (6 Vehicles)
0
20000
40000
60000
-20 0 20 40 60Specific Power(kW/Metric Ton)
En
gin
e-O
ut
CO
(p
pm
)
Cadillac Seville 94 Chevrolet G30 93Jeep Cherokee 94 GM Saturn 94Chevrolet Suburban 92 Toyota Corolla 93
0
20000
40000
60000
-40 0 40 80 120Absolute Power Bin (kW)
En
gin
e-O
ut
CO
(p
pm
)
0
20000
40000
60000
0 5 10 15 20
Fuel Rate (gallon / hour)
En
gin
e-O
ut
CO
(p
pm
)
0
20000
40000
60000
-40% -20% 0% 20% 40% 60% 80% 100%Percentage of Maximum Power
En
gin
e-O
ut
CO
(p
pm
)
Binned Sec-by-sec data from chassis dynamometer tests of SFTP CD-ROM (Haskew et al., 1994)
Vehicle
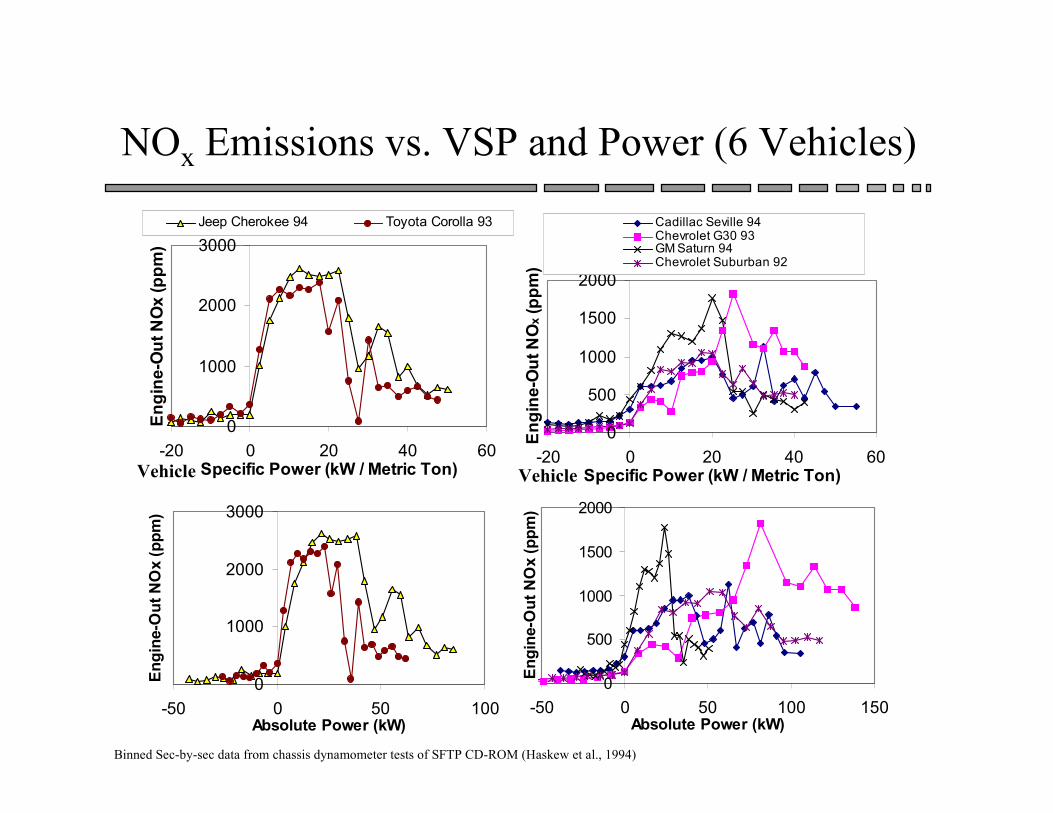
NOx Emissions vs. VSP and Power (6 Vehicles)
0
1000
2000
3000
-20 0 20 40 60Specific Power (kW / Metric Ton)
En
gin
e-O
ut N
Ox
(pp
m)
Jeep Cherokee 94 Toyota Corolla 93
0
500
1000
1500
2000
-20 0 20 40 60Specific Power (kW / Metric Ton)
En
gin
e-O
ut N
Ox
(pp
m)
Cadillac Seville 94Chevrolet G30 93GM Saturn 94Chevrolet Suburban 92
0
1000
2000
3000
-50 0 50 100Absolute Power (kW)
En
gin
e-O
ut
NO
x (p
pm
)
0
500
1000
1500
2000
-50 0 50 100 150Absolute Power (kW)
En
gin
e-O
ut
NO
x (p
pm
)
Binned Sec-by-sec data from chassis dynamometer tests of SFTP CD-ROM (Haskew et al., 1994)
Vehicle Vehicle

Effect of Payload
0
20000
40000
60000
-20 -10 0 10 20 30 40 50
Specific Power (kW/Metric Ton)
En
gin
e-O
ut
CO
Em
issi
on
s (p
pm
)
Curb Weight + 300 lbs.
1/2 Payload
0
500
1000
1500
2000
-20 0 20 40 60
Specific Power (kW/Metric Ton)
En
gin
e-O
ut
NO
x E
mis
sio
ns
(pp
m)
0
20000
40000
60000
-20 -10 0 10 20 30 40 50
Specific Power (kW/Metric Ton)
Ta
ilpip
e C
O E
mis
sio
ns
(p
pm
)
0
200
400
600
800
1000
-20 0 20 40 60
Specific Power (kW/Metric Ton)
Ta
ilpip
e N
Ox
Em
issi
on
s (p
pm
)
Binned Sec-by-sec data from chassis dynamometer tests of SFTP CD-ROM (Haskew et al., 1994) for a 1993 Ford 250
Vehicle
Vehicle Vehicle
Vehicle
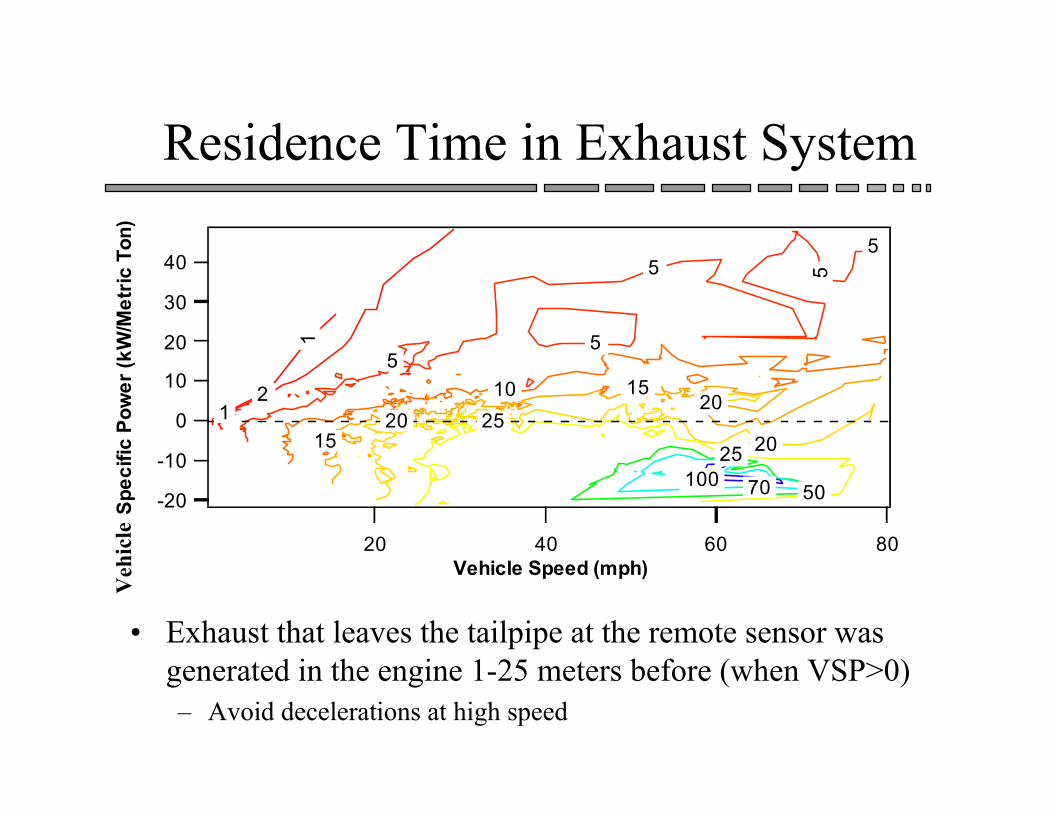
Residence Time in Exhaust System
• Exhaust that leaves the tailpipe at the remote sensor wasgenerated in the engine 1-25 meters before (when VSP>0)– Avoid decelerations at high speed
40
30
20
10
0
-10
-20
Sp
ec
ific
Po
we
r (k
W/M
etr
ic T
on
)
80604020 Vehicle Speed (mph)
100 70 50
25
25 20
20 20
15
15 10
5
5
5 5
5
2 1
1
Vehicle
VSP: Implications for Emission Research
• Remote Sensing:– Improve clean screen and high emitter detection
• Valid if 3 kW/t <VSP < 22 kW/t
• E.g. LA 96: 26% high CO emitters are suspect of enrichment
– Relate RS results to I/M test results
– Quantify real emissions at high power levels
• Compare results of:– RS sites
– Dynamometer tests
– Emission models
• Better representation of power in models– Use VSP distribution
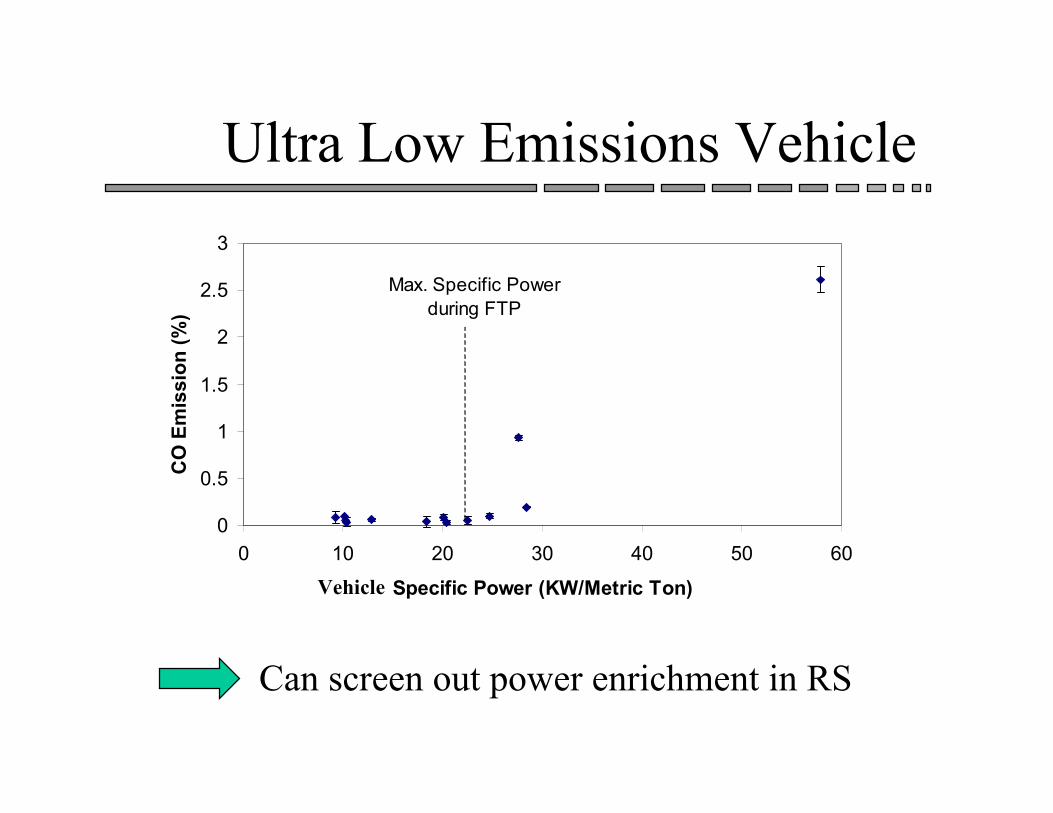
Ultra Low Emissions Vehicle
Can screen out power enrichment in RS
0
0.5
1
1.5
2
2.5
3
0 10 20 30 40 50 60
Specific Power (KW/Metric Ton)
CO
Em
issi
on
(%
)
Max. Specific Powerduring FTP
Vehicle

Remote Sensing and Dyno Data vs. VSP
Allows Comparison and Interpretation
0
0.5
1
1.5
2
2.5
3
3.5
4
4.5
-20 -10 0 10 20 30 40
Vehicle Specific Power (kW / Metric Ton)
Ave
rag
e C
O E
mis
sio
n (
%)
Engine-out for 1 vehicle
Tailpipe for 1 vehicle
Los Angeles 96 Remote Sensing
Denver 97-98 Remote Sensing

Remote Sensing and Dyno Data vs. VSP (II)
0
250
500
750
1000
1250
1500
1750
-20
-15
-10
-5 0 5 10 15 20 25 30 35 40 45
Vehicle Specific Power (kW / Metric Ton)
Ave
rag
e H
C E
mis
sio
n (
pp
m)
Los Angeles 96 Remote SensingChicago 97 Remote SensingEngine-Out HC for 1 vehicleTailpipe HC for 1 vehicle
0
200
400
600
800
1000
1200
-20 -10 0 10 20 30 40
Vehicle Specific Power (kW / Metric Ton)
Ave
rag
e N
O E
mis
sio
n (
pp
m)
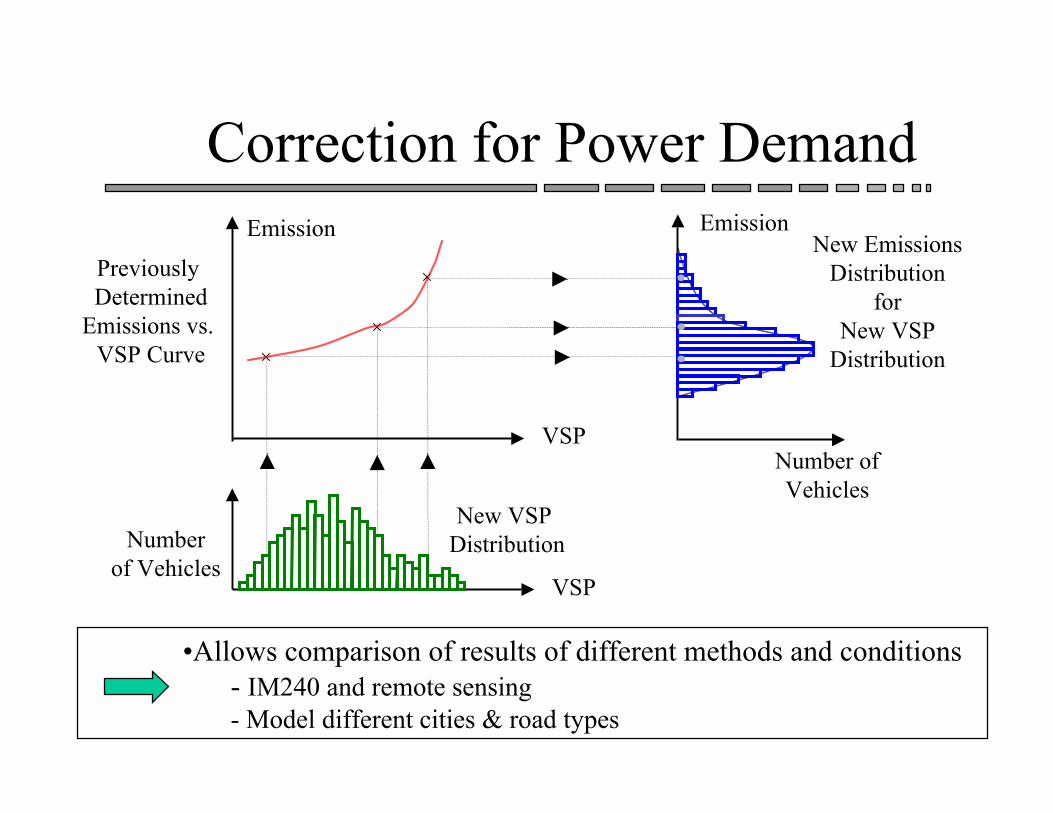
Correction for Power Demand
•Allows comparison of results of different methods and conditions- IM240 and remote sensing- Model different cities & road types
VSP
Previously Determined
Emissions vs. VSP Curve
Emission
New VSP Distribution
VSP
Numberof Vehicles
New EmissionsDistribution
forNew VSP
Distribution
Number ofVehicles
Emission

Conclusions
• Vehicle Specific Power (VSP)– Captures dependence of emissions on power
• Specified in driving cycles
– Roadside measurable
– One dimensional, physically meaningful
• Applications– Improve low and high emitter detection on RSD
– Common metric for emission studies• Compare RS, I/M tests, dyno cycles, models
– Improve emission models
Recommended