October 25, 2016
Prabhudas Lilladher Pvt. Ltd. and/or its associates (the 'Firm') does and/or seeks to do business with companies covered in its research reports. As a result investors should be aware that the Firm may have a conflict of interest that could affect the objectivity of the report. Investors should consider this report as only a single factor in making their investment decision.
Please refer to important disclosures and disclaimers at the end of the report
Varun Beverages
IPO Note
Unique Play on Beverages; listing gains unlikely
Amnish Aggarwal [email protected] +91‐22‐66322233
Gaurav Jogani [email protected] +91‐22‐66322238
Rating Subscribe
Price Band Rs440‐Rs445
IPO Fact Sheet
Opening Date Oct 26, 2016
Closing Date Oct 28, 2016
BRLMs Kotak Mahindra, Axis Capital, CLSA
Issue Size Rs11.0 to 11.1bn
Fresh Issue Rs6.6bn
Offer for Sale 10,000,000 equity shares
Objects of the Issue
Debt Repayment Rs 540mn
Issue Details Pre‐issue equity (m shares) 166.95 mn
Post‐issue equity (m shares)* 181.95 mn
Post‐issue Market Cap (Rs bn)* 80bn
Share Holding (%) Pre‐IssuePost‐Issue*
Promoters 86.3 73.7
Public & Others 12.5 40.4
*Equity issuance calculated on higher band price
Varun Beverages offers a unique play on the Beverages segment in the Indian
Consumer space. The company has 44% of PepsiCo’s India sales and we believe
that the franchisee arrangement will continue beyond 2021 given long standing
relationship with PepsiCo and global focus of players like Coke and Pepsi to
operate with asset light models. Margin expansion from current levels looks
difficult (Margins up 450bps since CY13) given that VBL has already gained from
25% reduction in concentrate prices by PepsiCo and sugar prices have seen sharp
jump in past 2 quarters. However debt repayment will curtail interest costs and
enable strong profit growth in CY17 and CY18. The stock is being offered at
30xSept’18 EPS and looks fairly valued on PE basis although it compares favorably
with Manpasand Beverages (~35.8xFY18EPS and 25xCY16 EV/EBIDTA). We
estimate that VBL is offered at 13xCY16 EV/EBIDTA which is in line with global
peers (12‐15xEV/ EBIDTA) despite higher growth prospects and probability of
franchisee area expansion. We don’t expect significant listing gains at current offer
price; however the stock can offer decent returns over medium term.
44% share of PepsiCo’s India business: VBL has 44% share of the PepsiCo’s sales
of Soft Drinks in India (franchisee agreement). VBL can not only capture secular
mid teen’s growth in Soft drinks in India and its overseas territories, but can also
gain more territories from PepsiCo in future. Players like Pepsi and Coke are
moving towards an asset light model with focus on branding, concentrate
manufacturing and supply, which augurs well for franchisees like Varun
Beverages in the long term. We expect VBL to sustain mid teens sales growth in
existing territories, addition of new territory can provide upside.
Dependence on PepsiCo and Concentrate prices: Varun Beverages is completely
dependent on PepsiCo for innovations and concentrate (26‐34% of raw material
prices). PepsiCo has reduced the prices of concentrate from Rs31.2/case in CY14
to Rs22.8/case in CY15, which along with benign sugar and packaging material
costs has boosted the gross margins by 610bps in the past 2 years from 43.3% to
49.4%. We believe further expansion in gross margins looks unlikely given recent
upsurge in sugar prices and gradual increase in concentrate prices.
Contd…2
Key financials (Y/e Dec) CY12 CY13 CY14 CY15
Revenues (Rs m) 18,000 21,151 25,024 33,941
Growth (%) NA 17.5 18.3 35.6
EBITDA (Rs m) 2,280 2,910 3,845 6,341
PAT (Rs m) 251 (396) (202) 870
EPS (Rs) 9.4 NA NA 6.5
Growth (%) NA NA NA NA
Profitability & Valuation CY12 CY13 CY14 CY15
EBITDA margin (%) 12.7 13.8 15.4 18.7
RoE (%) NA NA NA 17.1
RoCE (%) NA NA NA 9.9
PE (x) 47.4 NA NA 68.4
P / BV (x) 6.9 27.6 17.4 8.9
Source: Company Data; PL Research
October 25, 2016 2
Varun Beverages
EBIDTA margins up 490bps since CY13, further expansion difficult: VBL has
seen sharp increase in EBIDTA Margins (490bps over CY13‐CY15) as steady sales
growth, lower material prices (concentrate, sugar and PET) and benefits of
adding significant territory in existing areas of North India provided economies
of scale and expanded margins. However we believe that the scope to increase
margins from the current levels seems limited. We believe that addition of new
territories beyond its existing catchments areas can be a risk to margins.
International Business turnaround to take time: VBL has international
operations in some of the high growth markets of Nepal, Sri Lanka, and Morocco
and has recently started in Mozambique, Zambia and Zimbabwe. IBD has EBIDTA
of Rs591mn but is losing money at PAT Level. We expect gradual increase in
sales and margins, although PAT breakeven is sometime away.
PAT growth to accelerate; ROE and ROCE to improve: Varun Beverages has high
capital intensity with sales/ Gross Block and Intangibles being 0.78. VBL is
looking at increasing the same to 2x over the coming few years, but it looks
unlikely given high competition and seasonal nature of business. VBL plans to
retire debt of Rs5.4b which will curtail interest cost at <Rs2b over the coming
couple of years thus accelerating PAT growth. We expect ROE and ROCE to
improve from 8.5% and 9.8% in CY16 to ~13.8% and 15% respectively by CY18.
Exhibit 1: Issue Details
Launch Date 25thth of October
Issue Period Opening date: 26th October; Closing date: 28th October 2016
Exchange Listing on both NSE and BSE
Issuer Varun Beverages Limited (“VBL”)
Offer Type Initial Public Offering / Reg S
Net offer Fresh issue of 15mn equity shares+ Offer for sale upto 10mn shares
Price Band Rs440 ‐445
Issue Split (No. of shares)
QIB Portion: Not more than 50% of the issue
Non‐Institutional portion: Upto 15% of the issue
Retail Portion: Upto 35% of the issue
Use of proceeds
Prepayment or scheduled repayment of a portion of outstanding indebtedness availed by the company
General Corporate Purpose
Current Shareholding Pre‐Offer Post‐Offer
Promoter & Promoter group 86.30% 73.70%
SCPE 7.70% 7.10%
AION 4.90% 4.50%
Others 1.16% 14.70%
Offer Structure (No of shares in mn)
Fresh issue 15
Offer for sale 10
Net offer for Public 25
BRLM's Kotak Mahindra Capital company ltd, Axis capital Ltd, CLSA India Pvt Ltd, Yes Securities
Source: RHP, PL Research

October 25, 2016 3
Varun Beverages
Varun Beverages: Leading PepsiCo franchisee globally
Varun Beverages Ltd (VBL) headquartered in Gurgaon and has emerged as one of the
largest franchisee in the world (outside USA) of carbonated soft drinks (CSDs), non‐
carbonated beverages (NCBs) and packaged drinking water sold under trademarks
owned by PepsiCo in India and internationally.
VBL produces and distributes a range of CSDs under the brands of Pepsi, Diet Pepsi,
Seven‐Up, Mirinda Orange, Mirinda Lemon, Mountain Dew, Seven‐Up Nimbooz
Masala Soda, Seven‐Up Revive, and Evervess. It also produces and distributes NCBs
under the brands of Tropicana Slice; Tropicana Frutz (Lychee, Apple and Mango); and
Nimbooz, as well as packaged drinking water under the brand Aquafina.
Exhibit 2: PepsiCo faces stiff competition from Coke across segments
PepsiCo Competition
CSD
Pepsi, 7‐Up, Mountain Dew, Mirinda, Evervess Coca‐Cola, Thumps Up, Limca, Sprite, Fanta
NCD
Slice, Nimbooz, Tropicana Mazaa, Frooti, Real
Water
Aquafina Bisleri, Kinley, Others,
Source: RHP, PL Research

October 25, 2016 4
Varun Beverages
VBL is associated with Pepsi Co since the 1990’s and has been consistently increasing
the number of licensed and sub‐licensed territories covered. As of June 30, 2016,
VBL has been granted franchises for various PepsiCo products across 17 States and
two Union Territories in India and also has franchise for various PepsiCo products for
the territories of Nepal, Sri Lanka, Morocco, Mozambique and Zambia. It is setting up
a Greenfield capacity in Zimbabwe in anticipation of Franchisee rights being granted
by PepsiCo Inc
Low utilisation due to seasonal business: As of June 30, 2016, VBL operated 16
production facilities across India and 5 production facilities in international licensed
territories. VBL has an estimated aggregate annual production capacity of 3,438.38
million litres (equivalent to 605.56 million unit cases) in India and an estimated
aggregate annual production capacity of 991.57 million litres (equivalent to 174.63
million unit cases) in our international production facilities.
Exhibit 3: Capacity Utilisation is low due to recent capex and seasonal business
Category Production in CY15 (in mn unit cases)
Capacity as of Jun'16 (In mn
unit cases)Capacity Utilization
CSD 195.8 646.6 30%
NCB 14.5 61.3 24%
Packaged Drinking water 29.5 72.3 41%
Total 239.7 780.2 31%
Source: RHP, PL Research
VBL capacities are underutilized to a great extent and with the acquisition of the
additional territories in Feb 2015, this will help it to achieve economies of scale and
also gain in operational efficiencies. VBL has backward integration facilities located
at Jaipur and Alwar which manufacture crowns, plastic shells, corrugated boxes and
pads and shrink wrap film. Backward Integration has enabled the company to
maintain uniformity in quality and reduce costs.
Creating last mile distribution a major challenge in Soft Drinks: As of June 30, 2016
VBL’s distribution network in India included 60 depots and 1,438 delivery vehicles
covering urban, semi‐urban and rural markets it also had 562 primary distributors
(i.e., distributors that recorded sales in excess of 0.5 million litres of PepsiCo
beverages in the 12 months ended June 30, 2016) in India. Its International
distribution included 20 depots and 518 delivery vehicles and 415 distributors.
It sells its products to retail outlets, including e‐commerce, supermarkets,
hypermarkets, convenience stores, bars, and restaurants, as well as to grocery stores
through distributors. We believe that last mile distribution is a big challenge in soft
drinks and would require steady investments for expanding reach and Visi Coolers
infrastructure in the coming years.

October 25, 2016 5
Varun Beverages
VBL: Carbonated Soft Drinks are 82% of the overall sales
VBL’s derived 82% of its CY15 volumes from CSD (Carbonated Soft Drinks), the
contribution over the last 5 years has remained in the same range (82‐84%); volumes
have grown at a CAGR of 10.7% during CY10‐15. Packaged drinking water
contributed 12% volume sales followed by Juices with 6% volume sales.
Exhibit 4: CSD volume sales has remained in the range of 82‐84%
84 83 84 82
8 7 7 6
9 10 9 12
0%
20%
40%
60%
80%
100%
CY12 CY13 CY14 CY15
CSD NCB Packaged Drinking water
Source: RHP, PL Research
VBL has reported sharp improvement in both Gross profit/ case due to reduction in
concentrate prices by PepsiCo and lower prices of Sugar and PET. However the costs
have bottomed out and sugar prices have started rising, any meaningful gross
margin expansion looks unlikely. EBIDTA margin expansion will be driven by rising
scale and economies and will come at a snail’s pace only.
Exhibit 5: Profit/case up sharply due to lower concentrate, sugar and Packaging costs
56.8 59.666.3
70.0
16.8 19.022.7
26.4
0.0
10.0
20.0
30.0
40.0
50.0
60.0
70.0
80.0
CY12 CY13 CY14 CY15
Gross Margin/Case EBITDA/Case
Source: PL Research

October 25, 2016 6
Varun Beverages
India is 84% of business; overseas business loss making at PAT Level
India accounts for 83.8% of sales even though VBL is adding new territories overseas.
It entered high growth markets of Nepal, Srilanka and Morocco post the
amalgamation of VBIL (Varun beverages International Ltd.) from 1st January 2016.
The contribution from India increased to 84% in CY15 due to the additional of new
territories in North India from 28th Feb 2015. Mozambique and Zambia have started
contribution from 1st January 2016, Zimbabwe territory has also been consolidated
with effect from 1st April 2016.
Exhibit 6: 80%+ of overall sales continues to be contributed by Indian region
100.0%
80.4% 82.0% 80.1% 83.8%
0.0%
19.6% 18.0% 19.9% 16.2%
0%
20%
40%
60%
80%
100%
CY11 CY12 CY13 CY14 CY15
India International
Source: RHP, PL Research
Exhibit 7: Overseas business is profitable at EBIDTA level
CY12 CY13 CY14 CY15
Net Sales 3,388 3,705 4,836 5,301
Growth (%) 9.4 30.5 9.6
Gross Profit 1,705 2,056 2,776 3,012
Growth (%) 21 35 9
Gross Margin (%) 50.3 55.5 57.4 56.8
EBITDA 389 635 638 591
Growth (%) 63.3 0.4 ‐7.4
EBITDA Margin (%) 11.5 17.1 13.2 11.1
Interest & Finance Charges 180 218 291 299
Financial Other Income 63 74 ‐67 0
Depreciation 389 499 580 548
Profit Before Taxation (117) (9) (301) (256)
Source: RHP, PL Research
While the International subsidiaries are profitable at the EBITDA level, they remain
loss making at the PAT level given high interest and depreciation charges. We believe
that the business will take time for full turnaround given high interest, depreciation
and lack of scale.

October 25, 2016 7
Varun Beverages
Soft Drinks; market moving away from carbonated drinks
The overall soft drinks market in India saw aggregate sales of 12,081 million litres,
worth Rs 524.3 billion in the year 2015. The main segments constituting the soft
drinks market in India are carbonates, juices and bottled water, which together
accounted for over 99% of the total volumes sold in 2015. The remaining is divided
among products such as ready‐to‐drink coffee and tea, concentrates and sports and
energy drinks.
Exhibit 8: Value share of CSD is highest, Water has high volume share
37.9%
14.9%
46.4%
0.8%
47.9%
25.1% 23.1%
3.9%
0%
10%
20%
30%
40%
50%
60%
CSD NCB Packaged
drinking water
Others
CY15
Volume Value
Source: RHP, PL Research
Exhibit 9: NCB and bottled water are expected to gain share in CY20
26.5%19.0%
54.0%
0.6%
34.6% 35.5%
26.8%
3.1%
0%
10%
20%
30%
40%
50%
60%
CSD NCB Packaged
drinking water
Others
CY20
Volume Value
Source: RHP, PL Research
CSD has the highest value share, but slowing growth
In the Indian soft drinks market CSD commands the Value leadership with 47.9%
share followed by NCB and packaged drinking water with 25.1% and 23.1% share
respectively. In volume terms however packaged drinking water has the highest
market share of 46.4% followed by CSD with 37.9% share and NCB with 14.9%.
Overall volumes in the soft drink market has grown at a CAGR of 17.9% during CY10‐
15, while the CAGR volume growth in CSD was only 10.7% during the same period,
Other category CAGR volume growth was 25% majorly contributed by packaged
drinking water which grew by 25.4% during the same period.
In value terms the soft drink market grew at CAGR of 18.7% during CY10‐15, even
here the growth in the CSD segment was the lowest with CAGR of 12.5%. Value
CAGR growth in Packaged drinking water has been the highest with 31.5% growth
followed by NCB with 26.3% growth during the same period

October 25, 2016 8
Varun Beverages
Exhibit 10: Volume growth across categories slowing down
13.1
8.6
24.019.7
29.0
22.8
0.0
5.0
10.0
15.0
20.0
25.0
30.0
35.0
CY11 CY12 CY13 CY14 CY15
CSD NCB Others
Source: RHP, PL Research
Exhibit 11: Value growth is above 20% in CSD and NCB category
13.7
10.9
26.3 25.1
27.9
23.1
0.0
5.0
10.0
15.0
20.0
25.0
30.0
35.0
CY11 CY12 CY13 CY14 CY15
CSD NCB Others
Source: RHP, PL Research
Average price increase during CY10‐15 in the CSD segment has been quite tepid at
1.75%, while in the NCB segment we saw average price increase to the tune of 4.5%
and 2.5% in the packaged drinking water segment. We believe that high competitive
intensity in the segment restricts the pricing power of the players in the category.
The price increase in all the 3 categories have been below the average inflation rate
VBL’s areas in East/ North east have low consumption
VBL has bottling rights for North, East (ex Bihar) and some parts of Maharashtra and
Madhya Pradesh, these are having low consumption levels and constitute 44% share
of overall PepsiCo’s sales volume in India. Growth rate across these regions have
been quite the same with North and East markets growing at CAGR of 18.2% and
16.2% respectively during CY10‐15
Exhibit 12: Consumption of Soft drinks is the lowest in East and North markets
9.4% 9.2% 9.0% 8.9% 8.8% 8.7%
33.5% 33.6% 33.7% 33.8% 33.8% 34.0%
23.0% 22.9% 22.7% 22.7% 22.7% 22.7%
34.1% 34.3% 34.5% 34.6% 34.7% 34.6%
0%
20%
40%
60%
80%
100%
1 2 3 4 5 6
East and North East North South West
Source: RHP, PL Research
October 25, 2016 9
Varun Beverages
The penetration in the states of East and North east is weaker and also the per
capita consumption is lower providing scope for VBL to increase distribution and
increase volumes however it will entail lot of investments in setting up the required
infrastructure and distribution network as the terrain in these regions is difficult
making transportation a cumbersome process.
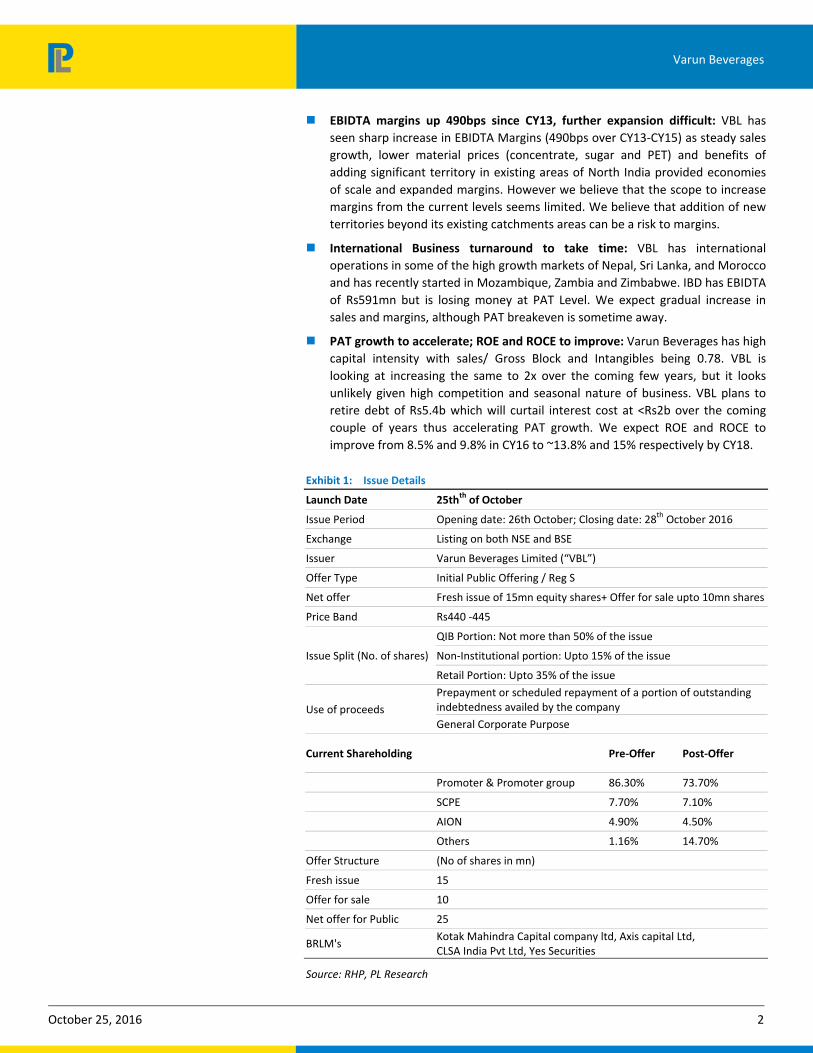
The Coca Cola Co has the highest market share in CSD and Juices
The Coca Cola Co has enjoyed the highest Volume and value market of 56.5% and
59.9% in respectively in the CSD segment. Pepsi Co Inc has remained no.2 player in
the CSD segment with 31.1% Volume share and 33.2% value share. Over the last few
years Pepsi Co inc has lost ~300bps market share
In the Juices segment however Pepsi Co has been able to gain both Volume and
Value market share, Its volume share has increased from 22.8% in CY10 to 26.4%
while Value share has increased only from to 22.8% to 24.2%
Exhibit 13: Coca Cola is the market leader in CSD space
56.5 59.9
31.1 33.2
12.4 6.9
0%
20%
40%
60%
80%
100%
Volume Value
The Coca Cola Co PepsiCo Inc others
Source: RHP, PL Research
Exhibit 14: Pepsi Co has been gaining market share in Juices
30.1 22.3
26.424.2
15.112.1
8.413.6
20 27.8
0%
20%
40%
60%
80%
100%
Volume Value
The Coca Cola Co PepsiCo Inc Parle Real Others
Source: RHP, PL Research

October 25, 2016 10
Varun Beverages
Financials
Exhibit 15: Income Statement: 1HCY16 numbers can’t be extrapolated due to seasonal business; 2H usually has a loss
CY12 CY13 CY14 CY15 H1CY16
Revenue
Revenue from operations (gross) 19,861 23,512 28,111 39,059 30,110
Less : Excise duty 1,861 2,360 3,087 5,117 4,813
Excise duty % 9.4 10.0 11.0 13.1 16.0
Revenue from operations (net) 18,000 21,151 25,024 33,941 25,297
Expenses
Cost of materials consumed 9,732 11,503 13,162 14,253 12,041
Purchases of stock in trade 513 574 597 3,202 684
Changes in inventories 33 (85) 2 (290) (746)
Gross profit 7,722 9,159 11,263 16,777 13,318
Gross margin (%) 42.9 43.3 45.0 49.4 52.6
Employee benefits expense 1,524 1,830 2,168 3,238 2,108
Other expenses 3,917 4,418 5,250 7,199 5,168
Total 15,720 18,240 21,179 27,601 19,255
EBITDA 2,280 2,911 3,845 6,341 6,042
EBITDA margin (%) 12.7 13.8 15.4 18.7 23.9
Depreciation and amortisation 1,358 1,844 2,101 3,174 1,895
Finance costs 1,156 1,697 1,854 1,688 1,112
Other income 442 174 147 143 97
PBT 208 ‐456 38 1,621 3,132
Tax expense:
Current tax 102 59 187 530 734
Minimum alternate tax credit entitlement (89) 0 (121) (468) (516)
Deferred tax expense/(credit) (56) (111) 181 704 779
Net profit/(loss), as restated 251 (404) (210) 855 2,134
Add: Share of profit in associate 8.41 8.81 15.17 15.38
Less : Share of (loss)/profit transferred to minority interest 0 ‐0.01 0 52.16
Profit/(Loss) after tax 251 (395) (202) 870 2,097
Source: RHP

October 25, 2016 11
Varun Beverages
Exhibit 16: Balance Sheet (Rs m); High capital intensity and acquisitions have bloated debt
CY12 CY13 CY14 CY15 H1CY16
Equities and Liabilities
Shareholders’ funds
Share capital 268 1,338 3,338 5,838 5,857
Reserves and surplus 1,449 416 93 885 3,258
Total Networth (A) 1,716 1,754 3,431 6,723 9,115
Share application money pending allotment ‐ 400 ‐ ‐ ‐
Minority Interest 0 0 ‐ ‐ 0
Non‐current liabilities
Long‐term borrowings 13,628 16,952 16,302 15,795 18,375
Deferred tax liabilities (net) 725 638 812 1,512 2,292
Other long ‐ term liabilities 352 314 111 6,363 3,151
Long‐term provisions 138 176 259 440 533
Total (B) 14,843 18,080 17,484 24,110 24,351
Current liabilities
Short‐term borrowings 3,384 3,376 5,085 2,524 3,004
Trade payables 907 1,392 1,806 1,846 3,297
Other current liabilities 4,633 4,829 4,967 8,798 12,407
Short‐term provisions 65 63 176 374 781
Total (C) 8,988 9,660 12,035 13,542 19,490
Total (A+B+C) 25,548 29,894 32,950 44,375 52,955
Assets
Non‐current assets
Fixed assets
Tangible assets 16,838 22,157 22,132 31,057 34,405
Intangible assets 194 1,493 1,321 3,839 3,609
Capital work‐in‐progress 1,893 274 248 379 192
Goodwill on consolidation 95 95 95 95 2,367
Non‐current investments 0 9 18 33 48
Deferred tax assets (net) 13 38 34 27 28
Long‐term loans and advances 644 369 446 1,190 1,846
Other non‐current assets 25 21 68 50 53
Total (A) 19,704 24,457 24,361 36,670 42,547
Current assets
Current investments 0 0 3,020 0 0
Inventories 2,306 2,464 2,893 4,247 5,592
Trade receivables 907 652 973 979 1,479
Cash and bank balances 384 509 344 581 1,155
Short‐term loans and advances 2,198 1,709 1,251 1,804 2,024
Other current assets 50 102 108 94 159
Total (B) 5,844 5,436 8,589 7,704 10,408
Total (A + B) 25,548 29,894 32,950 44,375 52,955
Source: RHP

October 25, 2016 12
Varun Beverages
Exhibit 17: Cash Flow (Rs m); VBL has cash flow from operations of ~Rs10b in last 2 years
CY12 CY13 CY14 CY15 H1CY16
Operating profit before working capital changes 2,714 3,132 3,971 6,444 6,160
Cash generated from operations 2,911 3,013 4,416 6,031 7,641
Net cash generated from operating activities 2,804 2,971 4,309 5,598 7,329
Net cash used in investing activities (5,066) (5,736) (5,000) (2,916) (8,215)
Net cash (generated from)/used in financing activities 2,292 2,743 577 (2,490) 1,466
Net increase/(decrease) in cash and cash equivalents 31 (22) (114) 191 581
Cash and cash equivalents at the beginning of the year 157 187 165 52 243
Cash and cash equivalents at the end of the year 187 165 52 243 824
Source: RHP

October 25, 2016 13
Varun Beverages
Prabhudas Lilladher Pvt. Ltd.
3rd Floor, Sadhana House, 570, P. B. Marg, Worli, Mumbai‐400 018, India
Tel: (91 22) 6632 2222 Fax: (91 22) 6632 2209
Rating Distribution of Research Coverage PL’s Recommendation Nomenclature
26.1%
58.3%
15.7%
0.0%0%
10%
20%
30%
40%
50%
60%
70%
BUY Accumulate Reduce Sell
% of Total Coverage
BUY : Over 15% Outperformance to Sensex over 12‐months
Accumulate : Outperformance to Sensex over 12‐months
Reduce : Underperformance to Sensex over 12‐months
Sell : Over 15% underperformance to Sensex over 12‐months
Trading Buy : Over 10% absolute upside in 1‐month
Trading Sell : Over 10% absolute decline in 1‐month
Not Rated (NR) : No specific call on the stock
Under Review (UR) : Rating likely to change shortly
DISCLAIMER/DISCLOSURES
ANALYST CERTIFICATION
We/I, Mr. Amnish Aggarwal (MBA, CFA), Mr. Gaurav Jogani (MBA, Bcom), Research Analysts, authors and the names subscribed to this report, hereby certify that all of the views expressed in this research report accurately reflect our views about the subject issuer(s) or securities. We also certify that no part of our compensation was, is, or will be directly or indirectly related to the specific recommendation(s) or view(s) in this report.
Terms & conditions and other disclosures:
Prabhudas Lilladher Pvt. Ltd, Mumbai, India (hereinafter referred to as “PL”) is engaged in the business of Stock Broking, Portfolio Manager, Depository Participant and distribution for third party financial products. PL is a subsidiary of Prabhudas Lilladher Advisory Services Pvt Ltd. which has its various subsidiaries engaged in business of commodity broking, investment banking, financial services (margin funding) and distribution of third party financial/other products, details in respect of which are available at www.plindia.com
This document has been prepared by the Research Division of PL and is meant for use by the recipient only as information and is not for circulation. This document is not to be reported or copied or made available to others without prior permission of PL. It should not be considered or taken as an offer to sell or a solicitation to buy or sell any security.
The information contained in this report has been obtained from sources that are considered to be reliable. However, PL has not independently verified the accuracy or completeness of the same. Neither PL nor any of its affiliates, its directors or its employees accepts any responsibility of whatsoever nature for the information, statements and opinion given, made available or expressed herein or for any omission therein.
Recipients of this report should be aware that past performance is not necessarily a guide to future performance and value of investments can go down as well. The suitability or otherwise of any investments will depend upon the recipient's particular circumstances and, in case of doubt, advice should be sought from an independent expert/advisor.
Either PL or its affiliates or its directors or its employees or its representatives or its clients or their relatives may have position(s), make market, act as principal or engage in transactions of securities of companies referred to in this report and they may have used the research material prior to publication.
PL may from time to time solicit or perform investment banking or other services for any company mentioned in this document.
PL is in the process of applying for certificate of registration as Research Analyst under Securities and Exchange Board of India (Research Analysts) Regulations, 2014
PL submits that no material disciplinary action has been taken on us by any Regulatory Authority impacting Equity Research Analysis activities.
PL or its research analysts or its associates or his relatives do not have any financial interest in the subject company.
PL or its research analysts or its associates or his relatives do not have actual/beneficial ownership of one per cent or more securities of the subject company at the end of the month immediately preceding the date of publication of the research report.
PL or its research analysts or its associates or his relatives do not have any material conflict of interest at the time of publication of the research report.
PL or its associates might have received compensation from the subject company in the past twelve months.
PL or its associates might have managed or co‐managed public offering of securities for the subject company in the past twelve months or mandated by the subject company for any other assignment in the past twelve months.
PL or its associates might have received any compensation for investment banking or merchant banking or brokerage services from the subject company in the past twelve months.
PL or its associates might have received any compensation for products or services other than investment banking or merchant banking or brokerage services from the subject company in the past twelve months
PL or its associates might have received any compensation or other benefits from the subject company or third party in connection with the research report.
PL encourages independence in research report preparation and strives to minimize conflict in preparation of research report. PL or its analysts did not receive any compensation or other benefits from the subject Company or third party in connection with the preparation of the research report. PL or its Research Analysts do not have any material conflict of interest at the time of publication of this report.
It is confirmed that Mr. Amnish Aggarwal (MBA, CFA), Mr. Gaurav Jogani (MBA, Bcom), Research Analysts of this report have not received any compensation from the companies mentioned in the report in the preceding twelve months
Compensation of our Research Analysts is not based on any specific merchant banking, investment banking or brokerage service transactions.
The Research analysts for this report certifies that all of the views expressed in this report accurately reflect his or her personal views about the subject company or companies and its or their securities, and no part of his or her compensation was, is or will be, directly or indirectly related to specific recommendations or views expressed in this report.
The research analysts for this report has not served as an officer, director or employee of the subject company PL or its research analysts have not engaged in market making activity for the subject company
Our sales people, traders, and other professionals or affiliates may provide oral or written market commentary or trading strategies to our clients that reflect opinions that are contrary to the opinions expressed herein, and our proprietary trading and investing businesses may make investment decisions that are inconsistent with the recommendations expressed herein. In reviewing these materials, you should be aware that any or all o the foregoing, among other things, may give rise to real or potential conflicts of interest.
PL and its associates, their directors and employees may (a) from time to time, have a long or short position in, and buy or sell the securities of the subject company or (b) be engaged in any other transaction involving such securities and earn brokerage or other compensation or act as a market maker in the financial instruments of the subject company or act as an advisor or lender/borrower to the subject company or may have any other potential conflict of interests with respect to any recommendation and other related information and opinions.
DISCLAIMER/DISCLOSURES (FOR US CLIENTS)
ANALYST CERTIFICATION
The research analysts, with respect to each issuer and its securities covered by them in this research report, certify that: All of the views expressed in this research report accurately reflect his or her or their personal views about all of the issuers and their securities; and No part of his or her or their compensation was, is or will be directly related to the specific recommendation or views expressed in this research report
Terms & conditions and other disclosures:
This research report is a product of Prabhudas Lilladher Pvt. Ltd., which is the employer of the research analyst(s) who has prepared the research report. The research analyst(s) preparing the research report is/are resident outside the United States (U.S.) and are not associated persons of any U.S. regulated broker‐dealer and therefore the analyst(s) is/are not subject to supervision by a U.S. broker‐dealer, and is/are not required to satisfy the regulatory licensing requirements of FINRA or required to otherwise comply with U.S. rules or regulations regarding, among other things, communications with a subject company, public appearances and trading securities held by a research analyst account.
This report is intended for distribution by Prabhudas Lilladher Pvt. Ltd. only to "Major Institutional Investors" as defined by Rule 15a‐6(b)(4) of the U.S. Securities and Exchange Act, 1934 (the Exchange Act) and interpretations thereof by U.S. Securities and Exchange Commission (SEC) in reliance on Rule 15a 6(a)(2). If the recipient of this report is not a Major Institutional Investor as specified above, then it should not act upon this report and return the same to the sender. Further, this report may not be copied, duplicated and/or transmitted onward to any U.S. person, which is not the Major Institutional Investor.
In reliance on the exemption from registration provided by Rule 15a‐6 of the Exchange Act and interpretations thereof by the SEC in order to conduct certain business with Major Institutional Investors, Prabhudas Lilladher Pvt. Ltd. has entered into an agreement with a U.S. registered broker‐dealer, Marco Polo Securities Inc. ("Marco Polo").
Transactions in securities discussed in this research report should be effected through Marco Polo or another U.S. registered broker dealer.
Recommended


![[C-0942] · 2020. 1. 20. · Miscellaneous Order No. 129- 15 of 12 October 2015 granted the request for an extension of four months. (Page 1,438- 1,441, Volume III). Page 1,443, Volume](https://img.dokumen.tips/doc/110x75/614169b0a2f84929c3045fa3/c-0942-2020-1-20-miscellaneous-order-no-129-15-of-12-october-2015-granted.jpg)