Valuing Securities
Stocks and Bonds
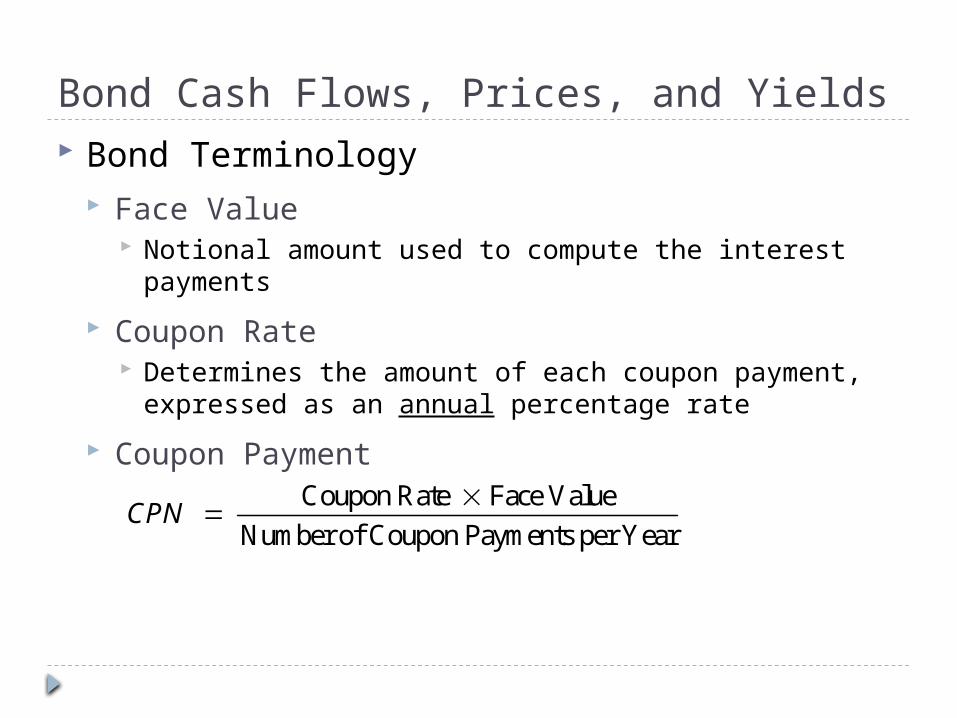
Bond Cash Flows, Prices, and Yields Bond Terminology
Face Value Notional amount used to compute the interest
payments
Coupon Rate Determines the amount of each coupon payment,
expressed as an annual percentage rate
Coupon PaymentCoupon Rate Face Value
Number of Coupon Payments per Year
CPN

Zero-Coupon Bonds Zero-Coupon Bond (Zero)
Does not make coupon payments
Always (almost always) sells at a discount (a price lower than face value), so they are also called pure discount bonds
Treasury Bills are U.S. government zero-coupon bonds with a maturity of up to one year.
“Strips”

Zero-Coupon Bonds Suppose that a one-year, risk-free, zero-
coupon bond with a $100,000 face value has an initial price of $97,323.60. The cash flows would be:
Although the bond pays no “coupon,” your compensation is the difference between the initial price and the face value.
0 1
$100,000-$97,323.60
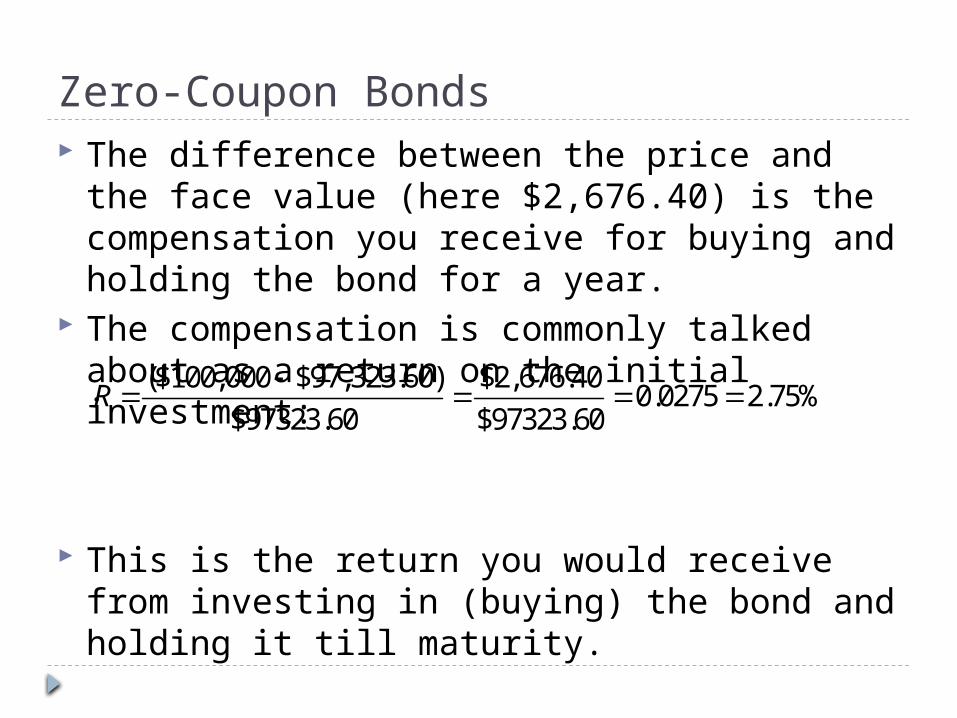
Zero-Coupon Bonds The difference between the price and the face
value (here $2,676.40) is the compensation you receive for buying and holding the bond for a year.
The compensation is commonly talked about as a return on the initial investment:
This is the return you would receive from investing in (buying) the bond and holding it till maturity.
($100,000 $97,323.60) $2,676.400.0275 2.75%
$97323.60 $97323.60R

Zero-Coupon Bonds Yield to Maturity
The single discount rate that sets the present value of the remaining promised bond payments equal to the current market price of the bond. For a Zero-Coupon bond:
For a zero, this is also the actual annualized return (actual spot rate).
(1 )
n
n
FVP
YTM

Zero-Coupon Bonds Yield to Maturity
For the risk free one-year zero coupon bond presented above:
Thus, the YTM is 2.75%. In bond markets the standard presumption is that a
“period” is six months.
Why must this equal the one year risk free rate?
1
100,00097,323.60
(1 )YTM
1
100,0001 1.0275
97,323.60YTM

Example Suppose the following three zero-coupon
bonds are trading at the prices shown. Each has a face value of $1,000 and the time
to maturity shown in the table. What is the yield to maturity for each bond?
Maturity 1 Year 2 Years 3 years
Price 980.39 942.60 901.94

Example The general formula is found by re-arranging
the present value equation:
The specific solutions in our example are:
This is how the spot rates on the yield curve are found.
1)1(
1
n
P
FVYTM
YTM
FVP nn
n
1 Year – YTM $1,000/$980.39 -1 2.0%
2 Years – YTM ($1,000/$942.60)1/2 - 1
3.0%
3 Years – YTM ($1,000/$901.94)1/3 - 1
3.5%

Coupon Bonds Yield to Maturity
The YTM is the single discount rate that equates the present value of the bond’s remaining cash flows to its current price.
Yield to Maturity of a Coupon Bond
For a coupon bond the YTM is an artificial yield intrinsic to the bond itself. An IRR for the bond.
1 1 1
(1 ) (1 )
N N
FVP CPN
y y y

YTM – Example On 9/1/95, PG&E bonds with a maturity
date of 3/01/25 and a coupon rate of 7.25% were selling for 92.847% of par, or $928.47 per $1,000 of face value. What is their YTM?
Semiannual coupon payment = 0.0725*$1,000/2 = $36.25.
Number of semiannual periods to maturity = 30*2 – 1 = 59.
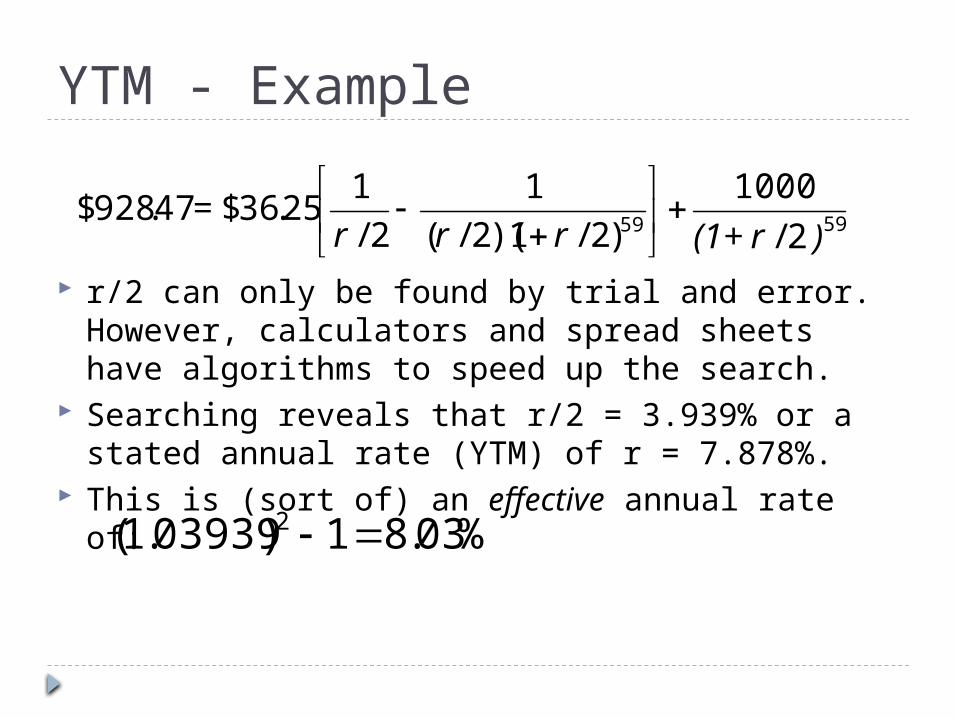
YTM - Example
r/2 can only be found by trial and error. However, calculators and spread sheets have algorithms to speed up the search.
Searching reveals that r/2 = 3.939% or a stated annual rate (YTM) of r = 7.878%.
This is (sort of) an effective annual rate of:
)r+(1rrr = 5959 2/
1000
)2/1)(2/(
1
2/
125.36$47.928$
%03.81)03939.1( 2

Example Suppose that now the yield to maturity for
the PG&E bonds has changed to 7% (on a stated annual basis, APR, with semi-annual compounding).
What must be the current price of the bond? Note that the bond itself has not changed
(assume for simplicity that the change occurs instantaneously) only its pricing.

Example We find the price using the present value of
the bond payments discounted at the YTM.
Does it make sense that the price changed like this?
)+(1
)+(1 =
5959
5959
2/07.
1000
)2/07.1)(2/07(.
1
2/07.
125.36$02.1031$
2/07.
1000
)2/07.1)(2/07(.
1
2/07.
125.36$Price

Discounts and Premiums If a coupon bond trades at a discount, an investor will
earn a return both from receiving the coupons and from receiving a face value that exceeds the price paid for the bond. If a bond trades at a discount, its yield to maturity will exceed
its coupon rate.
If a coupon bond trades at a premium it will earn a return from receiving the coupons but this return will be diminished by receiving a face value less than the price paid for the bond. If a bond trades at a premium, its coupon rate will exceed its
yield to maturity.
Most coupon bonds have a coupon rate set so that the bonds will initially trade at, or very close to, par.

Interest Rate Changes and Bond Prices The sensitivity of a bond’s price to changes in
interest rates is measured by the bond’s duration. The prices of bonds with high durations are highly
sensitive to interest rate changes.
The prices of bonds with low durations are less sensitive to interest rate changes.
A bond’s term or time to maturity is a major determinant of duration. All else equal, the longer the term the more sensitive to changes in the interest rates is bond’s price.
However, that is not the whole story:

Interest Rate Changes and Bond Prices Duration is essentially a weighted average of
the times to receipt of cash flows from the bond.
The face value is usually a comparatively very large cash flow making the maturity date a very important “time to receipt” of cash.
However if the coupons are large they will also play an important role in lowering the duration of a long-term coupon bond.
The Yield Curve and Bond Arbitrage Using the Law of One Price and the yields of
default-free zero-coupon bonds, one can determine the price and yield of any other default-free bond.
The yield curve provides sufficient information
to evaluate (price) all such bonds.
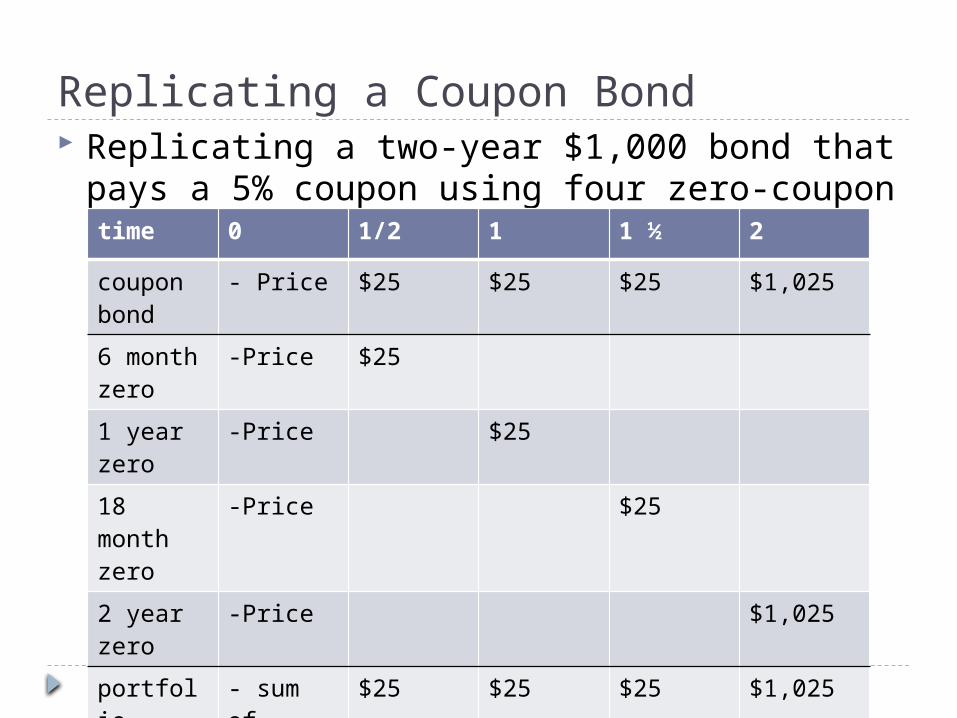
Replicating a Coupon Bond Replicating a two-year $1,000 bond that pays
a 5% coupon using four zero-coupon bonds:time 0 1/2 1 1 ½ 2
couponbond
- Price $25 $25 $25 $1,025
6 monthzero
-Price $25
1 yearzero
-Price $25
18 month zero
-Price $25
2 yearzero
-Price $1,025
portfolio - sum of prices
$25 $25 $25 $1,025
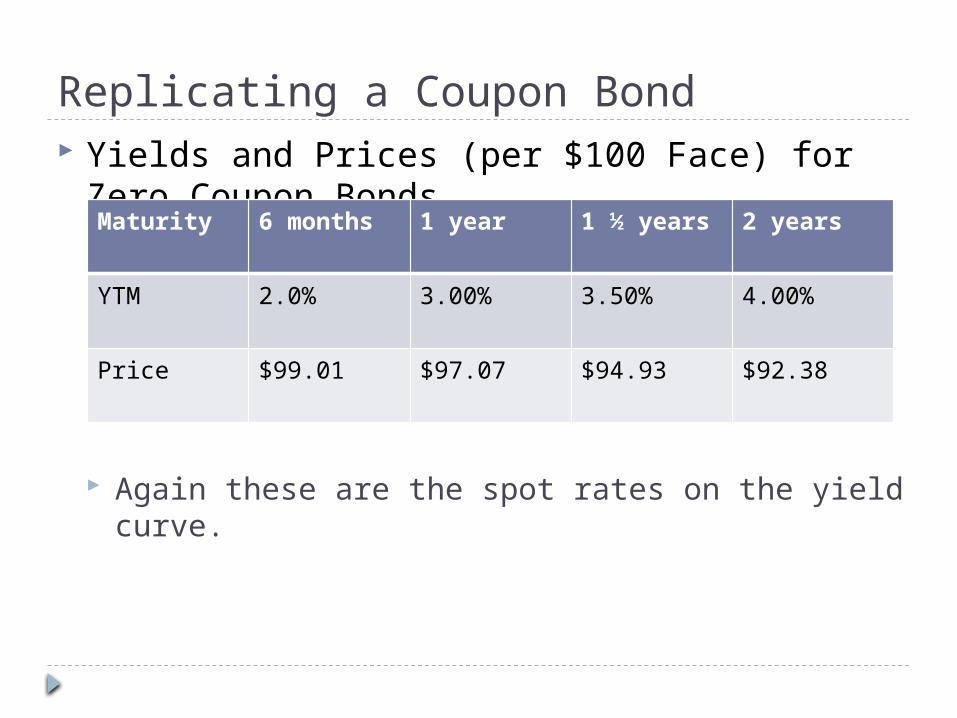
Replicating a Coupon Bond Yields and Prices (per $100 Face) for Zero
Coupon Bonds
Again these are the spot rates on the yield curve.
Maturity 6 months 1 year 1 ½ years 2 years
YTM 2.0% 3.00% 3.50% 4.00%
Price $99.01 $97.07 $94.93 $92.38
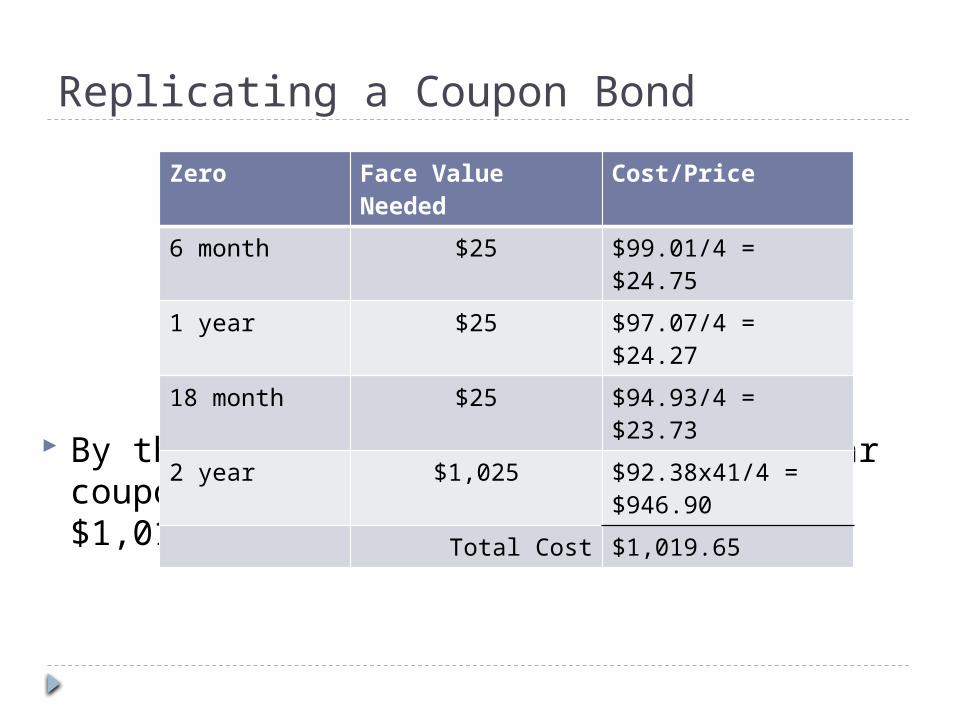
Replicating a Coupon Bond
By the Law of One Price, the three-year coupon bond must trade for a price of $1,019.65.
Zero Face Value Needed
Cost/Price
6 month $25 $99.01/4 = $24.75
1 year $25 $97.07/4 = $24.27
18 month $25 $94.93/4 = $23.73
2 year $1,025 $92.38x41/4 = $946.90
Total Cost $1,019.65
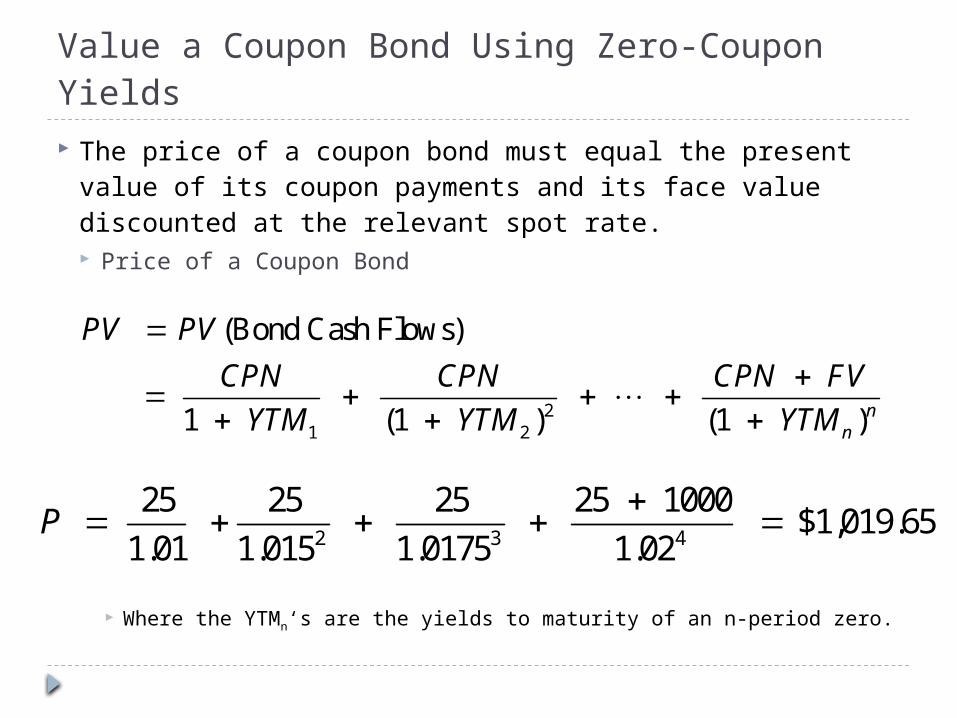
Value a Coupon Bond Using Zero-Coupon Yields The price of a coupon bond must equal the
present value of its coupon payments and its face value discounted at the relevant spot rate. Price of a Coupon Bond
Where the YTMn‘s are the yields to maturity of an n-period zero.
21 2
(Bond Cash Flows)
1 (1 ) (1 )n
n
PV PV
CPN CPN CPN FV
YTM YTM YTM
2 3 4
25 25 25 25 1000 $1,019.65
1.01 1.015 1.0175 1.02P

Coupon Bond Yield to Maturity Knowing the price we can of course also find
the yield to maturity of the coupon bond.
Annualized this is 3.968%, compare this to the zero-coupon yields.
2 3 4
25 25 25 25 1000 $1,019.65
(1 ) (1 ) (1 ) (1 )P
y y y y
2 3 4
25 25 25 25 1000 $1,019.65
1.0198 1.0198 1.0198 1.0198P

3M is expected to pay a dividend of $1.92 per share in the coming year.
You expect the stock price to be $85 per share at the end of the year.
Investments with equivalent risk have an expected return of 11% (the cost of equity capital, rE).
What is the most you would pay today for 3M stock?
What dividend yield and capital gain rate would you expect at this price?
Stock Valuation: An Example

1 10
E
$1.92 $85 $78.31
(1 ) (1 .11)
Div P
Pr
Example Solution: the law of one price implies that to value a
security we must determine the discounted expected cash flow associated owning it.
Total Return = 2.45% + 8.54% = 11% (but for rounding) so at this price the investor is receiving an appropriate return.
1
0
$1.92Dividend Yield 2.45%
$78.31
Div
P
1 0
0
$85.00 $78.31Capital Gains Yield 8.54%
$78.31
P P
P

What is the price if we plan on holding the stock for two years?
Again the price must be the present value of the future cash flows or one side (i.e. either the buyer or the seller) will refuse to trade.
A Multi-Year Investor
1 2 20 2
E E
1 (1 )
Div Div P
Pr r

What is the price if we plan on holding the stock for N years?
This is known as the Dividend Discount Model. Note that the above equation holds for any horizon. Thus
all investors (with the same beliefs) will attach the same value to the stock, independent of their investment horizons.
The price of any stock is equal to the present value of all of the expected future dividends it will pay.
A Multi-Year Investor
1 20 2
E E E E
1 (1 ) (1 ) (1 )
N NN N
Div PDiv DivP
r r r r
31 20 2 3
1E E E E
1 (1 ) (1 ) (1 )
n
nn
Div DivDiv DivP
r r r r

Constant Dividend Growth The simplest forecast for the firm’s future dividends
states that they will grow at a constant rate, g, forever.
The value of the firm depends on the current dividend level, the cost of equity, and the growth rate. The expected return is from dividend yield and the expected capital gain (g by assumption).
The Dividend-Discount Model
10
E
,
DivP
r g
1
E0
Div
r gP

Problem AT&T plans to pay $1.44 per share in dividends in
the coming year.
Its equity cost of capital is 8%.
Dividends are expected to grow by 4% per year in the future.
Estimate the value of AT&T’s stock.
Example

10
E
$1.44 $36.00
.08 .04
Div
Pr g
Example
Solution
Note that its price after one year is expected to be:
The expected capital gain equals the dividend growth rate, g.
1 021
0
$1.44(1.04)$37.44 0.04 4%
0.08 0.04E
P PDivP
r g P

We cannot use the constant dividend growth model to value a stock if the growth rate is not constant. For example, young firms often have very high
initial earnings growth rates. During this period of high growth, these firms often retain 100% of their earnings to exploit profitable investment opportunities.
As they mature, their growth slows. At some point, their earnings exceed their investment needs and they begin to pay dividends.
Changing Growth Rates

Dividend-Discount Model with Constant Long-Term Growth
Changing Growth Rates
1
E
N
N
DivP
r g
11 20 2
E E E E E
1
1 (1 ) (1 ) (1 )
N N
N N
Div DivDiv DivP
r r r r r g

Example Batesco Inc. just paid a dividend of $1.
The dividends of Batesco are expected to grow by 50% next year (time 1) and 25% the year after that (year 2). Subsequently, Batesco’s dividends are expected to grow at 6% in perpetuity.
The proper discount rate for Batesco is 13%.
What is the fair price for a share of Batesco stock?

Example cont… First, determine the dividends. Draw the
timeline! D0 = $1 g1 = 50% D1 = $1(1.50) = $1.50 g2 =
25% D2 = $1.50(1.25) = $1.875 g3 =
6% D3 = $1.875(1.06) = $1.98750 321 4
......
1.50 1.875 1.9875 2.107
g1=50% g2=25% g3=6% g4=6%

Example cont…
Supernormal growth period:
Constant growth period. Value at time 2:
Discount Pc to time 0 and add to Ps:
What if supernormal growth lasted 8 yrs at 50%?
2.7961 2s 2 2
E E
1.50 1.875D D = + = + = $P(1+ ) (1.13)(1+ (1.13) )r r
3c
E 3
1.9875D = = = $28.393P- 0.13 -0.06gr
2.796 5 03c0 s 2 2
E
28.393P = + = + = $2 .P P(1+ (1.13) )r
There is a tremendous amount of uncertainty associated with forecasting a firm’s dividend growth rate and its future dividends (particularly those many periods from now). Compounding the issue, dividends are
discretionary.
Small changes in the assumed dividend growth rate can lead to large changes in the estimated stock price.
Many firms pay no dividends (especially true recently).
Limitations of the Dividend-Discount Model

The Discounted Free Cash Flow Model Determines the value of the firm to all investors,
including both equity and debt holders
The enterprise value can be interpreted as the net cost of acquiring control of the firm, buying its equity, taking its excess cash, paying off all debt, and owning the then unlevered business or “enterprise”.
Discounted Free Cash Flow Model
Enterprise Value Market Value of Equity Debt Cash

Valuing the Enterprise
Free Cash Flow Cash flow available to pay both debt holders and
equity holders
Discounted Free Cash Flow Model
Discounted Free Cash Flow Model
Unlevered Net Income
Free Cash Flow (1 ) Depreciation
Capital Expenditures Increases in Net Working Capital
cEBIT
0 (Future Free Cash Flow of Firm)V PV
0 0 00
0
Excess Cash Debt
Shares Outstanding
VP

Implementing the Model Since we are discounting cash flows to both equity
holders and debt holders, the free cash flows should be discounted at the firm’s weighted average cost of capital, rwacc. If the firm has no debt, rwacc = rE.
Discounted Free Cash Flow Model
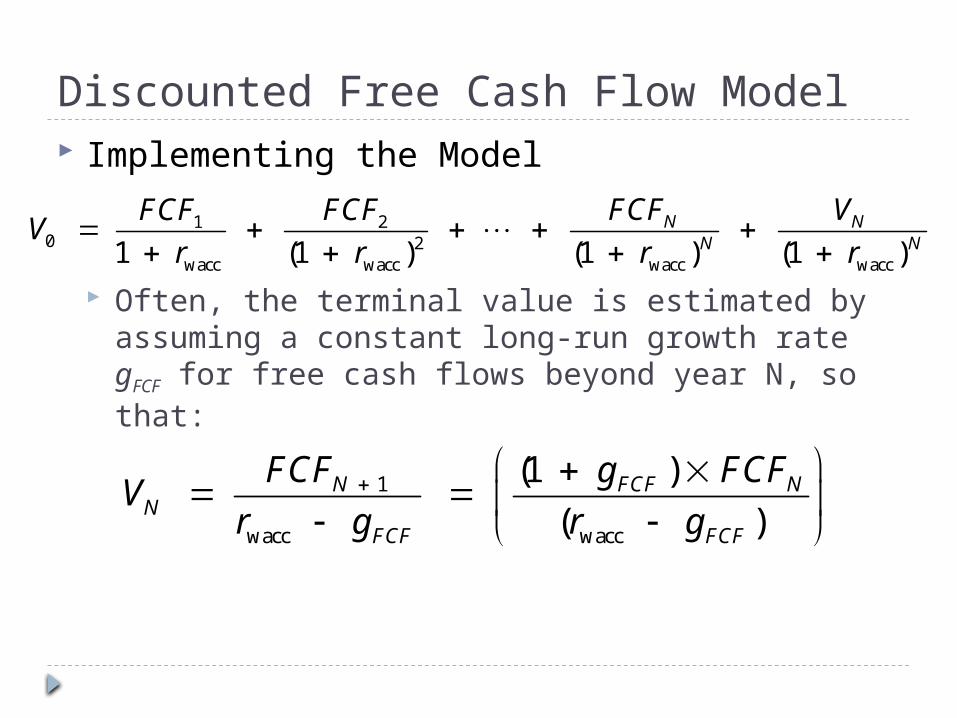
Implementing the Model
Often, the terminal value is estimated by assuming a constant long-run growth rate gFCF for free cash flows beyond year N, so that:
Discounted Free Cash Flow Model
1 20 2
wacc wacc wacc wacc
1 (1 ) (1 ) (1 )
N NN N
FCF VFCF FCFV
r r r r
1
wacc wacc
(1 )
( )N FCF N
NFCF FCF
FCF g FCFV
r g r g
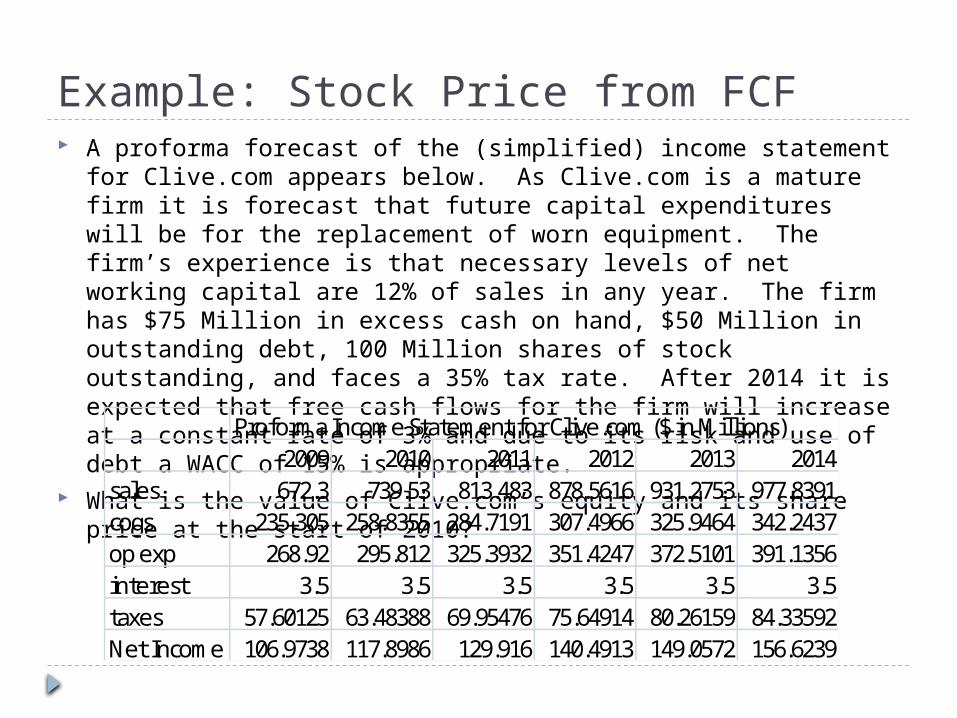
Example: Stock Price from FCF A proforma forecast of the (simplified) income statement for
Clive.com appears below. As Clive.com is a mature firm it is forecast that future capital expenditures will be for the replacement of worn equipment. The firm’s experience is that necessary levels of net working capital are 12% of sales in any year. The firm has $75 Million in excess cash on hand, $50 Million in outstanding debt, 100 Million shares of stock outstanding, and faces a 35% tax rate. After 2014 it is expected that free cash flows for the firm will increase at a constant rate of 3% and due to its risk and use of debt a WACC of 15% is appropriate.
What is the value of Clive.com’s equity and its share price at the start of 2010?
Proforma Income Statement for Clive.com ($ in Millions)2009 2010 2011 2012 2013 2014
sales 672.3 739.53 813.483 878.5616 931.2753 977.8391cogs 235.305 258.8355 284.7191 307.4966 325.9464 342.2437op exp 268.92 295.812 325.3932 351.4247 372.5101 391.1356interest 3.5 3.5 3.5 3.5 3.5 3.5taxes 57.60125 63.48388 69.95476 75.64914 80.26159 84.33592Net Income 106.9738 117.8986 129.916 140.4913 149.0572 156.6239
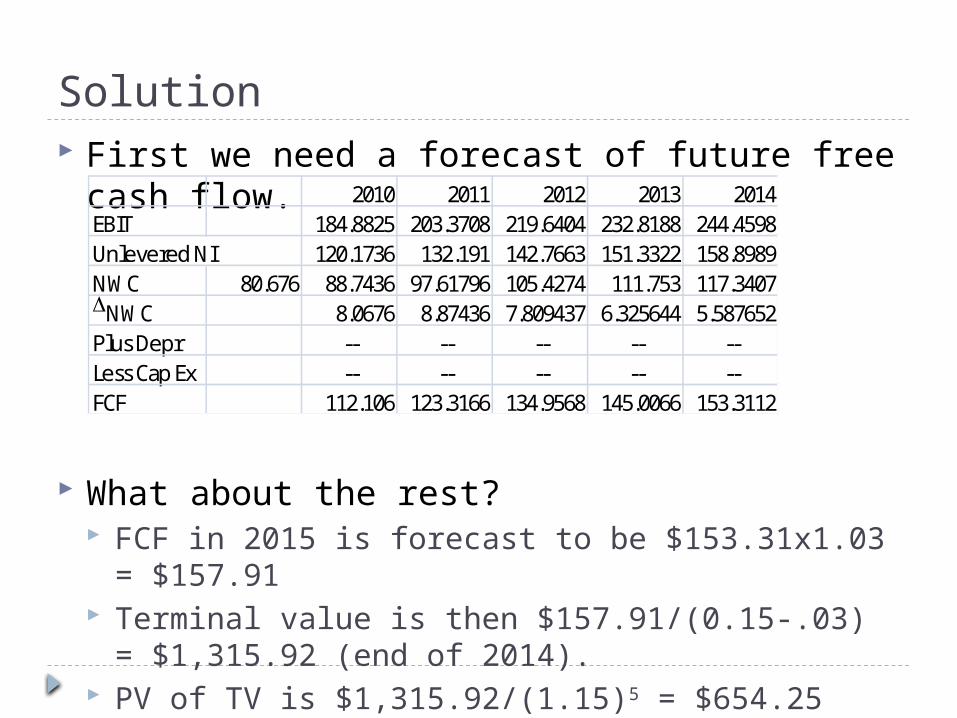
Solution First we need a forecast of future free cash
flow.
What about the rest? FCF in 2015 is forecast to be $153.31x1.03 =
$157.91 Terminal value is then $157.91/(0.15-.03) =
$1,315.92 (end of 2014). PV of TV is $1,315.92/(1.15)5 = $654.25
2010 2011 2012 2013 2014EBIT 184.8825 203.3708 219.6404 232.8188 244.4598Unlevered NI 120.1736 132.191 142.7663 151.3322 158.8989NWC 80.676 88.7436 97.61796 105.4274 111.753 117.3407DNWC 8.0676 8.87436 7.809437 6.325644 5.587652Plus Depr -- -- -- -- --Less Cap Ex -- -- -- -- --FCF 112.106 123.3166 134.9568 145.0066 153.3112
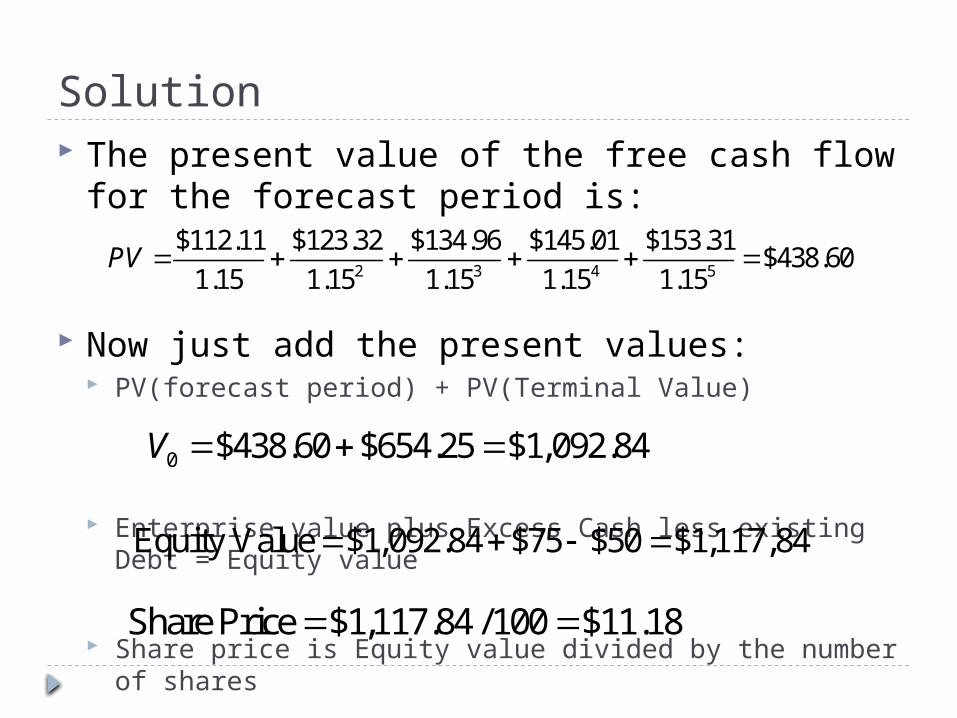
Solution The present value of the free cash flow for the
forecast period is:
Now just add the present values: PV(forecast period) + PV(Terminal Value)
Enterprise value plus Excess Cash less existing Debt = Equity value
Share price is Equity value divided by the number of shares
2 3 4 5
$112.11 $123.32 $134.96 $145.01 $153.31$438.60
1.15 1.15 1.15 1.15 1.15PV
0 $438.60 $654.25 $1,092.84V
Equity Value $1,092.84 $75 $50 $1,117,84
Share Price $1,117.84 /100 $11.18
Recommended