
Value of Insect Pollinators to Himalayan Agricultural Economies

About ICIMOD
The International Centre for Integrated Mountain Development, ICIMOD, is a regional knowledge
development and learning centre serving the eight regional member countries of the Hindu Kush
Himalayas – Afghanistan, Bangladesh, Bhutan, China, India, Myanmar, Nepal, and Pakistan – and
based in Kathmandu, Nepal. Globalization and climate change have an increasing influence on
the stability of fragile mountain ecosystems and the livelihoods of mountain people. ICIMOD aims
to assist mountain people to understand these changes, adapt to them, and make the most of new
opportunities, while addressing upstream-downstream issues. We support regional transboundary
programmes through partnership with regional partner institutions, facilitate the exchange of
experience, and serve as a regional knowledge hub. We strengthen networking among regional
and global centres of excellence. Overall, we are working to develop an economically and
environmentally sound mountain ecosystem to improve the living standards of mountain populations
and to sustain vital ecosystem services for the billions of people living downstream – now, and for
the future.
ICIMOD gratefully acknowledges the support of its core and programme donors:
the Governments of Afghanistan, Austria, Bangladesh, Bhutan, China, Germany, India, Myanmar,
Nepal, Norway, Pakistan, Sweden, and Switzerland, and the International Fund for Agricultural
Development (IFAD).

i
Value of Insect Pollinators to Himalayan Agricultural Economies
International Centre for Integrated Mountain Development, Kathmandu, 2012
Uma PartapTej PartapHarish K SharmaPushkin PhartiyalAungsathwi MarmaNar B TamangTan KenMuhammad Siddique Munawar

ii
Published byInternational Centre for Integrated Mountain Development GPO Box 3226, Kathmandu, Nepal
Copyright © 2012
International Centre for Integrated Mountain Development (ICIMOD)
All rights reserved. Published 2012
ISBN 978 92 9115 260 5 (printed)
978 92 9115 261 2 (electronic)
LCCN 2012-323207
Cover photo: Nabin Baral
Printed and bound in Nepal by
Hill Side (P) Ltd., Kathmandu, Nepal
Production team
Susan Sellers-Shrestha (Consultant editor) Andrea Perlis (Senior editor) Amy Sellmyer (Proofreader) Dharma R Maharjan (Layout and design) Asha Kaji Thaku (Editorial assistant)
Note
This publication may be reproduced in whole or in part and in any form for educational or non-profit purposes without special permission from the copyright holder, provided acknowledgement of the source is made. ICIMOD would appreciate receiving a copy of any publication that uses this publication as a source. No use of this publication may be made for resale or for any other commercial purpose whatsoever without prior permission in writing from ICIMOD.
The views and interpretations in this publication are those of the author(s). They are not attributable to ICIMOD and do not imply the expression of any opinion concerning the legal status of any country, territory, city or area of its authorities, or concerning the delimitation of its frontiers or boundaries, or the endorsement of any product.
This publication is available in electronic form at www.icimod.org/publications
Citation: Partap, U; Partap, T; Sharma, HK; Phartiyal, P; Marma, A; Tamang, NB; Ken, T; Munawar MS (2012) Value of insect pollinators to Himalayan agricultural economies. Kathmandu: ICIMOD

iii
Contents
Foreword vPreface viAcknowledgements viiAcronyms and Abbreviations viiiExecutive Summary ix
1 Introduction 1Crop Pollinators 1
Role of Crop Pollination 2
Decline in Crop Pollinators 2
Effects of Decline in Pollinators 6
ICIMOD Research Leading to this Study 6
Objectives of the Study 8
2 Methodology 9Revealed and Stated Preference Methods 9
Methodology Used in this Study 9
Study Areas 11
Crop Selection 11
Data Requirements 12
3 Findings: The Economic Value of Insect Pollination 17Chittagong Hill Tracts of Bangladesh 17
Bhutan 18
Chinese Himalayan Provinces 19
Himachal Pradesh, India 19
Kashmir, India 21
Uttarakhand, India 21
Himalayan Region of Pakistan 22
4 Analysis: Value and Vulnerability 24Overview of Findings 24
Direct and Indirect Value of Insect Pollination 24
Vulnerability of Agricultural Economy 25
Consumer Surplus Loss 27
Cost of Alternatives to Pollinators 29

iv
5 Managing Insect Pollination for Mountain Agriculture 30Small Farmers’ Dependence on Pollination 30
Research Needs 30
Development of Pollination Enterprises and Extension Services 31
Maintaining, Managing, and Conserving Pollinators 32
Promoting the Use of Manageable Species 34
Institutional Aspects 35
Replicating Success Stories: The Role of Regional and International Organizations 36
Conclusion and Key Findings 36
References 38
Annex: Economic Contribution of Insect Pollination to Individual Crops 41Chittagong Hill Tracts, Bangladesh 42
Bhutan 44
Chinese Himalayan Provinces (Sichuan, Yunnan, Qinghai, and the Tibetan Autonomous Region) 46
Himachal Pradesh, India 48
Kashmir, India 50
Uttarakhand, India 52
Himalayan Region of Pakistan 54

v
Foreword
Cash crop farming (e.g. fruits, seasonal and off-seasonal vegetables, floriculture) has increased in almost all mountain areas across the Hindu Kush Himalayan (HKH) region as small mountain farmers have pursued economic security and their opportunities have expanded through economic liberalization, increasing road accessibility, and greater access to farm inputs and markets. The economic benefits from cash crop farming have transformed the agricultural economy of many mountainous or hilly states, provinces, and districts of the region.
However, declining productivity has recently been reported for many of these cash crops, and it has been attributed in part to pollination failures due to a decline in insect pollinators. Yet in the absence of quantitative facts about the scale of the losses caused by this problem, there has been little recognition of the economic value of pollinators and their pollination services by academic institutions, land managers, farmers, and policy makers in the countries of the HKH region.
ICIMOD, with financial support from the Austrian Development Agency (ADA), has worked for more than two decades with its regional partner agencies on indigenous Himalayan bees and beekeeping for biodiversity conservation and poverty alleviation. Within the project ‘Improving Livelihoods through Knowledge Partnerships and Value Chains of Bee Products and Services in the Himalayas’ one of the key activities has been documenting and sharing information to raise awareness of the importance of pollination in enhancing agricultural productivity and conserving biodiversity.
The current publication presents the findings of a study carried out under this project to assess the economic value of pollination services, especially by insect pollinators, to agriculture in the countries of the HKH region. The study estimated that the total economic value of insect pollination for the crops and areas covered by the study – the Chittagong Hill Tracts of Bangladesh, Bhutan, the Chinese Himalayan provinces, Himachal Pradesh and Kashmir in the northwestern Indian Himalayas, Uttarakhand in the central Indian Himalayas, and the Himalayan region of Pakistan – is nearly USD 2.7 billion dollars annually.
The study findings highlight the importance of pollinators and pollination services in the HKH region. The study supports the conclusion that the countries of the HKH region must include provisions for management and conservation of pollinators as a vital part of their agricultural policies and plans so as to improve the food security and livelihoods of mountain farmers. Similarly, it highlights the need to give due place to pollinators and pollination in investment for agricultural research and development, so as to ensure sustained pollination services to mountain agriculture.
David Molden Director General, ICIMOD

vi
Preface
In 1991, my experiments on the pollination ecology of crops showed that honeybee pollination could enhance both the quality and productivity of vegetable crops, and that failure to pollinate could seriously hinder production. These experiments raised several questions: If pollination is a vital need of many crops then what is happening with pollination across the Hindu Kush Himalayan (HKH) region? And why is there so little understanding about the importance of pollination and the consequences of pollination failure? This led to a policy paper called Managed Pollination: The Missing Dimension of Mountain Agricultural Productivity. This paper, supported by experimental results, raised the issue outside scientific circles, but it was not enough to establish whether or not pollination failure was affecting the agricultural economy in mountain areas of the Hindu Kush Himalayan region, or if it had the potential to paralyse the region’s economies in the future. Nor was it clear which farming systems are most at risk and what strategies could be employed to protect production.
To answer these questions, between 1999 and 2002, an intercountry field study was launched by ICIMOD to assess the extent of problems with the pollination of apples and ascertain what adaptive strategies were being used by farmers. Apples were selected because they are the number one crop in terms of sustaining household and farm economies in several countries of the HKH region. The study covered parts of Baluchistan and Azad Kashmir in Pakistan, the state of Himachal Pradesh in India, Maoxian County in Sichuan province of China, the Jumla District of Nepal, and the Thimphu and Paro valleys of Bhutan. The findings were astounding: across the Himalayan valleys, farmers were facing serious problems with crop pollination failure because of the declining diversity and abundance of insect pollinators.
The findings, published in 2002 as Warning Signals from the Apple Valleys of the HKH Region: Pollination Problems and Farmers’ Management Efforts, were meant to draw the attention of the public and concerned agencies to this problem. However, it was necessary to quantify the potential loss to the agricultural economy of an area, state or nation to convince policy makers, researchers, and development agencies of the potential danger for governments and farmers of pollination failure in the cash crop economy of the HKH region.
Since 2002, I have searched for ways to quantify this potential loss by scouring the literature for methodologies and interacting with experts in the field. This study is the result of this search and applies a methodology developed to assess the economic value of insect pollination to the agricultural economies of selected mountain areas in the Hindu Kush Himalayan region.
Uma Partap Coordinator, Beekeeping Project ICIMOD

vii
Acknowledgements
In selection of the right methodology, communication with a number of experts in the field of pollination ecology and environmental economics was immensely beneficial. Thanks are due to expert teams linked to pollinator initiatives around the world guided by the Food and Agriculture Organization of the United Nations (FAO). Under the auspices of FAO, two reputed scientists, environmental economist Dr Nicola Gallai, Laboratory for Theoretical and Applied Economics, University of Montpellier, France, and pollination ecologist Dr Bernard E Vaissière, Professor at the Laboratoire de Pollinisation et Ecologie des Abeilles at the French National Institute for Agricultural Research (INRA), Avignon, France, developed a methodology to calculate the value of pollination services of insect pollinators in agriculture in 2009. These experts have also provided guidelines and information on how to use this methodology to assess the economic value of pollination in agricultural production. This method is based on the hypothesis that the economic impact of pollinators on agricultural output is measurable through the use of dependence ratios quantifying the impact of a lack of insect pollinators on crop production value. In addition, these experts also examined the vulnerability of different crop categories to pollinator decline. FAO is gratefully acknowledged for providing access to this methodology for use in the present study. Dr Bernard E Vaissière and Dr Barbara Herren, FAO, Coordinator of the Global Pollination Project on ‘Conservation and Management of Pollinators for Sustainable Agriculture, through an Ecosystem Approach’, were especially helpful in this regard.
The authors would like to thank our colleagues in the ICIMOD beekeeping project partner organizations who helped in the collection of data. The authors would particularly like to thank Dr Michael Kollmair, former Programme Manager, Sustainable Livelihoods and Poverty Reduction; Dr Giridhar Kinhal, former Action Area Team Leader for High Value Products and Value Chains; Dr Golam Rasul, Acting Programme Manager; Dr Dyutiman Chaudhary, Acting Team Leader for High Value Products and Value Chains; Min Bahadur Gurung, Institutional Development Officer; Anu Joshi Shrestha, Value Chain Specialist; and Shova Bhandari, Programme Assistant of High Value Products and Value Chains. Gratitude is also due to Dr David Molden, Director General of ICIMOD and Dr Andreas Schild, former Director General; Dr Madhav B Karki, Deputy Director General; and Dr Eklabya Sharma, Director Programme Operations, for their support and guidance. The editorial and publication team at ICIMOD is also acknowledged for bringing the document into its final form.
The authors are indebted to the Federal Chancellery of Austria’s Ministry of Foreign Affairs for its financial support through the Austrian Coordination Office (ACO)/Austrian Development Agency (ADA), which enabled us to conduct this study.

viii
Acronyms and Abbreviations
CGIAR Consultative Group on International Agricultural Research
CSL Consumer surplus loss
D Dependence ratio
EVIP Economic value of insect pollination
FAO Food and Agriculture Organization of the United Nations
HKH Hindu Kush Himalayas
ICIMOD International Centre for Integrated Mountain Development
masl Metres above sea level
RV Ratio of vulnerability
TVC Total value of crop
UNDP United Nations Development Programme
UNEP United Nations Environment Programme
WTA Willingness to accept
WTP Willingness to pay

ix
Executive Summary
The need of small farmers for livelihood security, combined with economic liberalization, improved road accessibility, and access to agricultural inputs and markets, has resulted in an increase in cash crop farming in the mountains of the Hindu Kush Himalayan (HKH) region. Fruit and vegetable crops, off-season vegetable crops, and floriculture are presenting new opportunities for farmers to earn cash income. The economic benefits from cash crop farming have transformed the agricultural economies of several of the mountain areas in the region. However, there have been reports of declining productivity for many of these cash crops, especially apples, which has been attributed to a failure of pollination services. In the absence of quantitative facts on the scale of this loss there has been little appreciation of the seriousness of the issue.
Pollinators provide pollination services that are crucial for the productivity of agricultural and natural ecosystems. It has been estimated that over three quarters of the world’s crops and over 80% of all flowering plants depend on animal pollinators, especially bees. Globally, the annual contribution of pollinators to agricultural crops has been estimated at about USD 200 billion. However, pollinators are currently under threat with declines in pollinator populations and diversity occurring worldwide. This presents a serious threat to agricultural production affecting the livelihoods of farmers, national agricultural economies, and food security. Key factors behind this are loss of pollinator habitats and modern agricultural practices, which are dominated by the excessive and indiscriminate use of pesticides and other agrochemicals. There is global concern that if the decline continues it could have an adverse impact on sustainable agricultural production.
Recognition of the economic value of insect pollinators and their pollination services by farmers, land managers, academic institutions, policy makers, and governments has been limited, especially in the countries in the HKH region. One reason for this may be that there is so little information available on the economic value of insect pollination to agriculture in the region. This study assesses the economic value of pollination services, especially by insect pollinators, to agriculture in the selected areas of the HKH region to highlight the need for initiatives to address the problem. The study uses the methodology of Gallai and Vaissière (2009) and the FAO array of crop categories; this methodology is based on the hypothesis that the economic impact of pollinators on agricultural output is measurable through the use of dependence ratios that quantify the impact of a lack of insect pollinators on crop production value. It also looks at the vulnerability of different crop categories to pollinator decline.
The study was undertaken in sub-regional economies of the HKH, namely, the Chittagong Hill Tracts of Bangladesh; four Chinese Himalayan provinces (Sichuan, Yunnan, Qinghai, and Tibet Autonomous Region); the states of Himachal Pradesh and Uttarakhand in India; the Himalayan region of Pakistan (Khyber Pakhtunkhwa, parts of Balochistan and Azad Kashmir, and Gilgit Baltistan); and Bhutan.
The study estimated that the annual economic value of insect pollinators to agricultural productivity for the major crops cultivated in the study areas in the HKH region was USD 2.7 billion: USD 53.8 million for the Chittagong Hill Tracts of Bangladesh, USD 17.9 million for Bhutan, USD 676.8 million for the Chinese Himalayan provinces, USD 365 million for Himachal Pradesh and USD 426.8 for Kashmir in the northwestern Indian Himalayas, USD 166.8 million for Uttarakhand in the central Indian Himalayas, and USD 954.6 million for the Himalayan region of Pakistan. The total value of insect pollinators to crop production would be even higher if indirect benefits, such as enhanced soil fertility and soil conservation through the pollination of various nitrogen fixing legumes and replenishing soil nutrients, were taken into account; and it would be higher still if data were available for all insect-pollinated crops cultivated in the region. The economic value of insect pollinators for the entire HKH region (including Afghanistan, the northeastern Indian Himalayas, Myanmar, and Nepal) could be up to twice as high as the value in the study area.
By crop category, the study estimates the annual economic value of insect pollination for fruit crops at USD 2.3 billion, for oilseed crops at USD 233.1 million, for pulses at USD 2.7 million, for spices at USD 5.5 million, for

x
tree nut crops at USD 50.5 million, and for vegetable crops at USD 78.5 million. The economic value of insect pollination is also estimated for individual crops and crop categories in the individual study areas.
The decline in pollinator populations and diversity is reducing agricultural productivity. There are examples in Himachal Pradesh, the mountain areas of Pakistan, and parts of the Chinese Himalayan provinces where, despite all agronomic inputs, the production of fruit crops such as apples, almonds, cherries, and pears is declining. Farmers in Maoxian County, China are forced to pollinate their apple and pear trees by hand – a costly alternative.
The findings of this study point to a need for more research on pollinators and their value. This will improve our understanding of the economic value of insect pollinators and the vulnerability of agricultural economies to loss of pollinators. The scale of the economic value of insect pollination services reveals that managing and conserving pollinators needs to be included as a vital part of the agricultural development policies and plans of the countries of the HKH region to improve the livelihoods of mountain farmers, mountain and national agricultural economies, and food security in the region.

1
1 Introduction
1 Introduction
Increasing pressure on small mountain farmers to find ways to ensure economic security for their livelihoods and the opportunities opened by economic liberalization, improved road accessibility, and access to farm inputs and markets have led to an increase in cash crop farming in almost all mountain areas of the Hindu Kush Himalayan (HKH) region. Fruit, vegetables, off-season vegetables, and floriculture are now found in many places in the region. The economic benefits from cash crop farming have transformed the agricultural economy of several areas in this region. However, there have been reports of declining productivity in relation to many of these cash crops, especially apples, over the last decade. This decline has been attributed to failure in pollination, but in the absence of quantitative facts on the scale of the loss, there has been little appreciation of the seriousness of the issue. This chapter looks at the types and roles of crop pollinators, factors in their decline, and the impact of this decline. It also outlines previous research undertaken on this topic and the objectives of this research.
Crop PollinatorsCrop pollinators are external agents that help in the pollination of crops. There are two types of crop pollinators found in nature: abiotic and biotic. Examples of abiotic pollinating agents are wind, water, and gravity. Many agricultural crops, especially those that produce dry pollen such as rice, wheat, maize, millet, chestnuts, pecan nuts, and walnuts are successfully pollinated by wind. Biotic pollination agents (animal pollinators) include insects, birds, and various mammals. Biotic pollination (also called zoophily) occurs when animals visit flowers to obtain their food (nectar and pollen) and incidentally pollinate them by transferring pollen grains from one flower to another of the same or another plant of the same crop or plant species. A strong relationship exists between the pollen vectors (pollinators) and the flowers of the plants that they pollinate. Prescott-Allen and Prescott-Allen (1990) have reported that over 75% of the world’s crops depend on biotic pollinators. Morse and Calderone (2001) estimate that in the United States alone honeybee pollinators provide pollination services to agriculture worth USD 14.6 billion every year. Gallai et al. (2009) estimates the annual economic value of pollination services provided by insect pollinators to agriculture worldwide at EUR 153 billion (USD 193 billion).
Klein et al. (2007) evaluated the extent of the reliance of agriculture on animal pollinators in 200 countries and recorded that about 70% of crops (87 of the 124 main crops) used globally for human consumption are dependent on animal pollinators. Looking at all crops traded on the world market and setting aside those that are self-pollinated, wind-pollinated, or parthenocarpic (reproducing asexually), they found that pollinators are essential for 13 crops and that production is highly pollinator dependent for 30 crops, moderately for 27, slightly for 21, unimportant for 7, and of unknown significance for the remaining 9 crops.
Many species of insects, birds, bats, and some non-flying mammals play an important role in the pollination of various plants, including cultivated crops. Birds and flying foxes are important pollinators of some plants (Proctor et al. 1996; Buchmann and Nabhan 1996). Buchmann and Nabhan (1996) identified 92 genera of plants belonging to 50 families that depend on flying foxes for pollination. These authors documented 1,500 species of birds, 500 species of flower thrips, 10,000 to 15,000 species of wasps, 16 families of butterflies, 45 families of flies, 30 families of beetles, over 86 species of bats, one species of lemur, and 56 to 59 species of flying foxes as important pollinators of various plants.
Among insects, bees, flies, beetles, butterflies, midges, moths, wasps, and weevils are important pollinators of many crops. Agricultural and horticultural crops, forage crops, ornamental plants, and wild plants are all effectively pollinated by insects that visit flowers for nectar or pollen. McGregor (1976) held the view that “perhaps one-third of our total diet is dependent, directly or indirectly, upon insect pollinated crops”. In the world of insects, different species of bees including honeybees, bumble-bees, stingless bees, and solitary bees are the most effective pollinators of crops. Over 25,000 species of bees are reported to pollinate over 70% of the world’s cultivated crops. About 15% of the world’s 100 principal crops are pollinated by manageable species of

2
Value of Insect Pollinators to Himalayan Agricultural Economies
honeybees, bumble-bees, and solitary bees, while at least 80% are pollinated by other naturally occurring insect pollinators (Nabhan and Buchmann 1997).
Role of Crop PollinationAn ecosystem is a dynamic complex of living beings – plants, animals, microorganisms, human beings – and their non-living environment. It contributes to human wellbeing both directly, as human beings are part of the ecosystem, and indirectly, by providing a range of benefits called ecosystem services. The Millennium Ecosystem Assessment (2005) classified ecosystem services into four categories: provisioning services such as food and fresh water; regulating services such as flood and disease control; cultural services such as spiritual, recreational, and cultural benefits that directly impact on peoples lives; and supporting services such as the nutrient cycling needed to maintain other services. This categorization holds true for an agroecosystem.
Within the overall framework of agroecosystem services, pollination is recognized as a regulating service, as it is essential to the regulation of the gene flow in many crops and for natural and wild flora. It is also essential to fertilization and for fruit and seed set. The pollination process is based on the ecological principle of species’ interrelationship or interaction, known as ‘proto-cooperation’, between plants and their pollinating agents (‘pollinators’). Pollinators visit the flowers of plants to obtain their food, i.e., nectar and pollen, and in return pollinate them. The reduction or loss of the result of this intricate relationship between plants and their pollinators affects the survival of both. Pollination services are vital for the production of a wide range of agricultural crops, as well as for the maintenance of surrounding natural ecosystems (De Groot et al. 2002; Eardley et al. 2006; Hein et al. 2006).
Pollination as an ecosystem service is vital to the completion of the life cycle of plants. It is the third dimension among the factors that control agricultural productivity. It is as important as soil, water, and agricultural inputs such as fertilizers and pesticides. Most crops would produce no fruit or seed without the pollination of their flowers. Poor pollination often results in reduced agricultural yields and deformed fruit. In natural ecosystems, the visual clues of insufficient pollination are more subtle than in agriculture, but the consequences can be as severe as the local extinction of a plant species, a noticeable decline in fruit and seed-eating animals, and the loss of vegetation cover. If keystone species are involved, it leads to the deterioration of the health of the ecosystem. It is for these reasons that the Convention on Biological Diversity (CBD) has recognized pollination as a key driver in the maintenance of biodiversity and ecosystem function.
Pollination benefits society by increasing food security and improving livelihoods through enhancing the yield and quality of many agricultural and horticultural crops and conserving biological diversity in agroecosystems. It helps in soil conservation and improves the fertility of the soil by enhancing the replenishment of soil nutrients, thus contributing to the conservation of the environment and biodiversity (Figure 1).
Decline in Crop Pollinators In recent years, crop pollination services are being hampered by a decline in the number and diversity of pollinator populations throughout the HKH region (Ahmad et al. 2003; Partap 2010a,b; Partap and Partap 1997, 2002; Partap et al. 2001). Researchers have listed human activities and practices as primary factors in the loss of habitats of pollinators leading to a decrease in their food supplies, nectar, and pollen. Other major factors contributing to pollinator decline include an increase in monoculture-dominated agriculture and the negative impacts of modern agricultural interventions such as the use of pesticides (Ahmad et al. 2003; Aizen and Feinsinger 1994; Allen-Wardell et al. 1998; Partap 2010a,b, 2011; Partap and Partap 1997, 2002; Verma and Partap 1993). In the HKH region, evidence of the decline in pollinator numbers has been reported from apple farming areas such as Maoxian County in China, Himachal Pradesh in India, Balochistan Province in Pakistan, the Thimphu and the Paro valleys in Bhutan, and Jumla District in Nepal. Surveys in these areas have revealed that inadequate pollination has severely affected apple production (Partap 2001; Partap and Partap 2002). Yields have decreased and the quality of fruit is deteriorating. The reason for this inadequate pollination in apples is largely attributed to declining populations of natural pollinators. This is forcing farmers to find

3
1 Introduction
different ways of managing the pollination of their apple orchards (Partap 2001; Partap and Partap 2002). Studies in the mountain areas of the HKH region have revealed that agricultural practices are a key factor in the continuing decline of the populations of insect pollinators such as honeybees. Some of the possible factors in pollinator decline are discussed here.
Shrinking habitats
The continuing increase in farmland area, at the cost of forests and grasslands, is apparently leading to the loss of nesting sites and food sources of pollinators. This has been clearly revealed by the studies carried out in mountain areas of China, India, and Pakistan where apple orchards are expanding into forests and grasslands (Partap 2001; Partap and Partap 2002). In the past decade alone, the area under apple cultivation in the countries of the HKH region has increased by about 60%, from 367,000 ha in 1998 to 594,000 ha in 2008. The same is true for vegetables and other crops. As an example, in addition to the expansion of apple orchards, Himachal Pradesh also saw an increase of 135% in the area under vegetable crops (i.e., from 25,000 ha in 1996 to 58,700 ha in 2009). Incidentally, climate change is enhancing opportunities for cash crop farming in high mountain areas that used to be permanent grasslands until a decade ago. Farmers in the high mountain areas of Himachal Pradesh, China, Bhutan, Nepal, and elsewhere are busy planting apples in their pasture lands. For decades, China has adopted the concept of economic forests farmed for fruit. The negative impact of agricultural intensification on the abundance of natural insect pollinators has been shown by studies conducted by many scientists. Farmers’ surveys in the countries of the HKH region reveal that both the diversity of insect pollinators and their numbers on crops have seriously declined in areas where cash crop farming has increased. Klein et al. (2007) reported that agricultural intensification jeopardizes wild bee communities and their stabilizing effect on pollination services and the landscape on a continental scale.
Manageable species of insects (honeybees – Apis cerana and Apis mellifera, bumble-bees, solitary bees) and humans (e.g., hand pollination in China)
Naturally occurring insects (honeybees, bumble-bees, solitary bees, flies, butterflies, beetles, wasps, etc.), birds, mammals, and wind, water, etc.
Managed pollination
Natural pollination
Increased income and food security of farmers
Improved livelihoods of farmers
Environment conservation and maintenance of biodiversity
Soil conservation and soil fertility improvement
Increased agricultural productivity
Pollination
Source: Partap 2003a, 2003b, 2011
Figure 1: How pollination contributes to agricultural productivity and rural livelihoods

4
Value of Insect Pollinators to Himalayan Agricultural Economies
Increase in monoculture
Increasing cash crop farming based on monocultures in the mountains has contributed to the reduction in the diversity of plants that provide food for pollinators. In the past, mountain farmers grew a variety of crops, which bloomed at different times of the year and provided food for a number of natural insect pollinators. The transformation of agriculture from traditional mixed crop farming to high value cash crop farming in recent years has led to an increase in monocrop agriculture, reducing the food sources for natural insect pollinators. Reports from several mountain areas indicate that mountain farmers are switching on a large scale to the cultivation of cash income-generating fruit crops and off-seasonal vegetables (Partap 1998, 2001, 2010b; Partap and Partap 2002).
Pesticides
The problem with cash crop farming is that farmers use insecticides and pesticides indiscriminately, contributing to the decline in natural insect pollinators. Studies carried out in the HKH region (Partap 2001, 2010b; Partap and Partap 2001, 2002) revealed a serious lack of pollinators in apple farming areas because of the excessive and indiscriminate use of pesticides on apples and other cash crops. Apple farmers spray different pesticides (including insecticides) as many as 10 times in a season, and in Himachal Pradesh almost 30% of farmers spray during the flowering period (Table 1). Agricultural pesticides kill not only the foraging insects, they also kill Apis dorsata and Apis florea colonies in surrounding areas. In addition, they kill Apis dorsata colonies that are on their migratory route.
Forest fires
Forests provide habitats for nesting and hibernation and food sources for a variety of pollinator species. Studies have revealed that there are more insect pollinators in apple orchards situated near forests than those that are far from forests (Sharma and Gupta 2010). Therefore, a decline in forest area either by its conversion to farmland or destruction in other ways (such as forest fires) has a negative impact on pollinator abundance. Forest fires in summer, largely engineered by farmers for fresh growth of grass on forest floors, is a key factor
Table 1: Use of pesticides by farmers on apple crops
Pesticide use Thimphu and Paro valleys, Bhutan
Maoxian County, China
Himachal Pradesh, India
Jumla District, Nepal
Balochistan, Pakistan
Number of pesticide sprays on apples in a season
2–3 sprays (100% of farmers)
8–10 sprays (100% of farmers)
6–7 sprays (100% of farmers) in Kullu district; 9–10 (100% of farmers) in Shimla hills
1–2 sprays (only 33% of farmers use pesticides)
4–5 sprays (49% of farmers)
Use of pesticides during flowering
Nil Over 60% of farmers spray during flowering
29% of farmers spray during flowering
Nil 32% of farmers spray during flowering
Use of insecticides and fungicides
100% of farmers use insecticides and fungicides
100% of farmers use insecticides and fungicides
100% of farmers use insecticides and fungicides
Both insecticides and fungicides used
100% of farmers use insecticides and fungicides
Commonly used pesticides
Melathion, captan
Metacid, metasystox, diethane M-45, thiodan, monocrotophos, fenitrothion, melathion
Metacid, metasystox, diethane M-45, thiodan, monocrotophos, fenitrothion, melathion
Metacid, melathion, thiodan
Metacid, metasystox, diethane M-45, thiodan, monocrotophos, fenitrothion, melathion
Source: Partap and Partap 2002

5
1 Introduction
affecting pollinator populations in some areas. Forest fires not only destroy the nesting places and food sources of pollinators, they also kill pollinators hibernating or nesting in the area. Using fire to clear forests for agriculture is a common practice among communities practising shifting cultivation in the northeastern Himalayas. For example, in Nepal, over 8,000 plants were destroyed in a forest fire in 2010. The large-scale pine plantations in the mid hills of the Indian Himalayas pose a fire hazard in summer because of the falling of dried pine needles. It is common practice for farmers in the Himalayan region to use fire in the fields and grasslands to control weeds and to improve the quality of grass the following year. The removal of weeds reduces the diversity of food sources available to pollinating insects. Afraid of being stung, farmers also burn and poison Apis dorsata colonies and other pollinators in Nepal and India.
Honey hunting
An increase in honey hunting and the ruthless hunting of the nests of wild honeybees is contributing to the decline in the population of indigenous honeybees (Partap 2010b). In a recent study, Ahmad et al. (2003) recorded evidence of pollinator decline at eight sites in Kaski District in Nepal. They reported a decline in the number of Apis laboriosa nests from 182 nests in 1986 to 48 in 2002. They found that the number of nests had declined substantially at three sites and four sites had been completely deserted. The cliffs that, according to local honey hunters, had previously contained a large number of bee nests, now had only the remnants of abandoned nests. The population of Apis laboriosa, a high-altitude species of honeybee that plays an important role in the pollination of several mountain crops, is shrinking rapidly.
While in the past, honey hunting formed a part of the culture and tradition of honey-hunting communities and provided them with a source of income it is now being commercialized and exploited by big contractors and companies. In Nepal, the government has leased the forests and cliffs to private companies and contactors for the harvesting of honey from wild colonies of Apis dorsata and Apis laboriosa that nest on these cliffs and in the forests. These companies and the contractors hire trained honey hunters and extract honey from the nests by destroying all the combs (without leaving any combs and food for the bees); they even destroy the bees. Apis laboriosa honey hunting is also being encouraged in the name of ecotourism. There are trekking companies in Kathmandu that charge tourists hefty fees to see honey hunting. This is tempting honey hunters to hunt outside the usual honey flow season, which adds to the threat of decline and extinction of Apis laboriosa populations.
Exotic honeybees and local honeybees
The introduction of exotic honeybee species can adversely affect populations of native bee species. This may be because of competition for food, the transfer of pests and diseases from one species to another, or economic preference for exotic species. The introduction of Apis mellifera to increase honey production has led to a decline in beekeeping with indigenous Apis cerana in several countries of the HKH region (Box 1) (Partap and Partap 1997).
Climate change and other factors
Climate change may be affecting insect numbers, as changes in local weather conditions, such as continuous drop in temperature and rainfall, affect the emergence of natural pollinators (Partap and Partap 2001, 2002). Other factors such as lack of focus and capacity of national institutions in a changing economic and social landscape may be impacting on the decline in the populations of some common pollinators, such as indigenous honeybees, throughout the Himalayan mountains and valleys.
Box 1: Decline of native Apis cerana as a result of the introduction of Apis mellifera
Beekeeping with the native hive bee Apis cerana is a traditional household activity in several mountain communities of the HKH. But the promotion of Apis mellifera over the past few decades has adversely affected indigenous Apis cerana beekeeping and led to the replacement of Apis cerana with Apis mellifera in many mountain areas in the HKH region. Studies carried out at ICIMOD caution that there are only a few areas left in the mountain districts of Nepal, India, China, and Pakistan where Apis cerana is surviving with beekeepers and farmers. Reports call for urgent efforts to save Apis cerana from extinction in several of these areas.
Source: Partap and Partap 1997, 2002
6
Value of Insect Pollinators to Himalayan Agricultural Economies
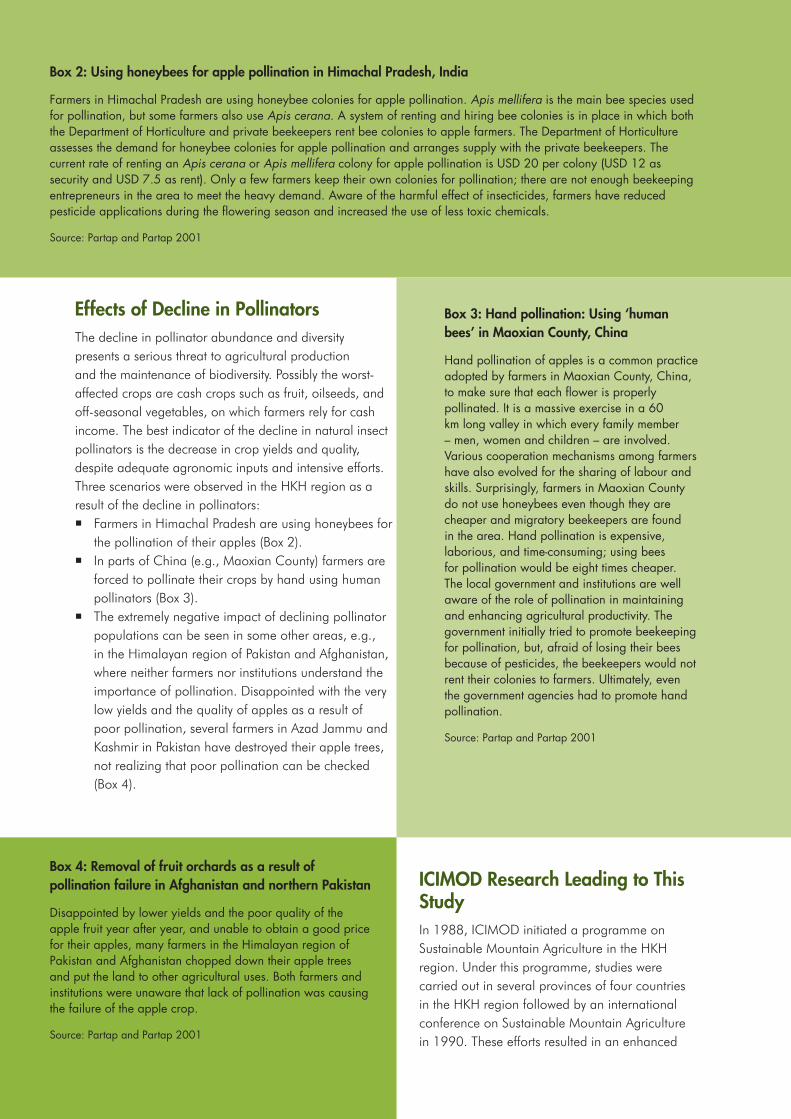
Effects of Decline in PollinatorsThe decline in pollinator abundance and diversity presents a serious threat to agricultural production and the maintenance of biodiversity. Possibly the worst-affected crops are cash crops such as fruit, oilseeds, and off-seasonal vegetables, on which farmers rely for cash income. The best indicator of the decline in natural insect pollinators is the decrease in crop yields and quality, despite adequate agronomic inputs and intensive efforts. Three scenarios were observed in the HKH region as a result of the decline in pollinators: � Farmers in Himachal Pradesh are using honeybees for
the pollination of their apples (Box 2). � In parts of China (e.g., Maoxian County) farmers are
forced to pollinate their crops by hand using human pollinators (Box 3).
� The extremely negative impact of declining pollinator populations can be seen in some other areas, e.g., in the Himalayan region of Pakistan and Afghanistan, where neither farmers nor institutions understand the importance of pollination. Disappointed with the very low yields and the quality of apples as a result of poor pollination, several farmers in Azad Jammu and Kashmir in Pakistan have destroyed their apple trees, not realizing that poor pollination can be checked (Box 4).
ICIMOD Research Leading to This StudyIn 1988, ICIMOD initiated a programme on Sustainable Mountain Agriculture in the HKH region. Under this programme, studies were carried out in several provinces of four countries in the HKH region followed by an international conference on Sustainable Mountain Agriculture in 1990. These efforts resulted in an enhanced
Box 2: Using honeybees for apple pollination in Himachal Pradesh, India
Farmers in Himachal Pradesh are using honeybee colonies for apple pollination. Apis mellifera is the main bee species used for pollination, but some farmers also use Apis cerana. A system of renting and hiring bee colonies is in place in which both the Department of Horticulture and private beekeepers rent bee colonies to apple farmers. The Department of Horticulture assesses the demand for honeybee colonies for apple pollination and arranges supply with the private beekeepers. The current rate of renting an Apis cerana or Apis mellifera colony for apple pollination is USD 20 per colony (USD 12 as security and USD 7.5 as rent). Only a few farmers keep their own colonies for pollination; there are not enough beekeeping entrepreneurs in the area to meet the heavy demand. Aware of the harmful effect of insecticides, farmers have reduced pesticide applications during the flowering season and increased the use of less toxic chemicals.
Source: Partap and Partap 2001
Box 4: Removal of fruit orchards as a result of pollination failure in Afghanistan and northern Pakistan
Disappointed by lower yields and the poor quality of the apple fruit year after year, and unable to obtain a good price for their apples, many farmers in the Himalayan region of Pakistan and Afghanistan chopped down their apple trees and put the land to other agricultural uses. Both farmers and institutions were unaware that lack of pollination was causing the failure of the apple crop.
Source: Partap and Partap 2001
Box 3: Hand pollination: Using ‘human bees’ in Maoxian County, China
Hand pollination of apples is a common practice adopted by farmers in Maoxian County, China, to make sure that each flower is properly pollinated. It is a massive exercise in a 60 km long valley in which every family member – men, women and children – are involved. Various cooperation mechanisms among farmers have also evolved for the sharing of labour and skills. Surprisingly, farmers in Maoxian County do not use honeybees even though they are cheaper and migratory beekeepers are found in the area. Hand pollination is expensive, laborious, and time-consuming; using bees for pollination would be eight times cheaper. The local government and institutions are well aware of the role of pollination in maintaining and enhancing agricultural productivity. The government initially tried to promote beekeeping for pollination, but, afraid of losing their bees because of pesticides, the beekeepers would not rent their colonies to farmers. Ultimately, even the government agencies had to promote hand pollination.
Source: Partap and Partap 2001

7
1 Introduction
understanding of the transformation of mountain agriculture from a subsistence to a cash crop economy, largely driven by the small and marginal mountain farmers. The tools of transformation were vegetable and fruit farming, especially apples. The areas benefitting from cash crop farming included Himachal Pradesh in India, Balochistan in Pakistan, and Aba Prefecture in Sichuan, China. These were the ‘hot spots’ – the cash crop success stories. Follow-up programmes to enhance understanding about the transformation of mountain agriculture were conceived.
A small team of scientists at ICIMOD conceived of the idea of using honeybees through beekeeping as a way to improve the productivity of fruit and vegetable crops. The initial work was based on experiments to study the effect of using honeybees, especially the indigenous honeybee (Apis cerana) to pollinate fruit and vegetable crops. As part of this research, field experiments were conducted on the impact of Apis cerana pollination on vegetable seed production in the Kathmandu valley of Nepal. The results revealed that Apis cerana pollination could enhance seed production and the quality of seeds in vegetable crops, including cabbage, cauliflower, radish, lettuce, and broadleaf mustard, and that pollination failure could cause serious production and quality problems. This work was published by ICIMOD in The Asian Hive Bee, Apis cerana as Pollinator in Vegetable Seed Production: An Awareness Handbook (Verma and Partap 1993). Similar experiments conducted on fruit crops found that honeybee pollination increased fruit set and reduced fruit drop in apple, peach, plum, citrus, and strawberry crops (Partap 2000a, 2000b; Partap et al. 2000). Results also showed an increase in the fruit juice and sugar content of citrus and a reduction in the percentage of misshapen fruit in strawberries.
The questions raised by this research led to an in-depth review of the status of pollination research and development in countries of the HKH region. The outcome was more work on synthesizing the information, which was presented as a policy concept paper. This work was published by ICIMOD as, Managed Pollination: The Missing Dimension of Mountain Agricultural Productivity (Partap and Partap 1997). This experimental research emphasized the need for managed crop pollination in mountain areas. It presented an alternative perspective on the significance of beekeeping and discussed managing honeybees and other pollinating insects for the pollination of different crops cultivated in mountain areas. The efficiency and usefulness of the indigenous honeybee Apis cerana and the introduced Apis mellifera in pollinating mountain crops were also compared, leading to the conclusion that, while Apis cerana is the more efficient pollinator of crops in the climatic conditions of mountain areas, both species complement each other in the task of pollinating mountain crops. The paper also discussed the role of managed pollination in food security, biodiversity conservation, and overall agricultural development.
While this paper raised the issue, it did not convince mainstream agricultural development institutions and policy makers of the need for action. They needed concrete evidence of whether pollination failure was eroding the agricultural economies of mountain areas and countries in the Himalayan region, and whether a loss of pollination services could paralyse mountain agricultural economies in future. If pollination is essential to many crops, then what is happening to the fruit, vegetables, oilseeds, and other crops being cultivated across the HKH region, and why there is no concern about the loss of pollinators? An issue was framed for further research: If pollination was so effective in enhancing both the quality and productivity of fruit and seeds, then pollinator deficiency in any area should lead to pollination failure, causing serious production problems and a decline in farmers’ incomes. Farmers would surely find ways to manage this problem. What are these ways? What is happening in the fields of mountain farmers across the HKH region? Are there enough pollinators to produce good crops, and if cash crop farming is expanding along with the use of insecticides and pesticides, which kill the pollinators, how can farmers manage pollination services? These questions led to another field study and its findings were published in Warning Signals from the Apple Valleys of the Hindu Kush-Himalayas: Productivity Concerns and Pollination Problems (Partap and Partap 2002).
For this study, field surveys were carried out in apple farming areas of five countries in the HKH region: Himachal Pradesh in India, Maoxian County in China, Balochistan and the Himalayan region of Pakistan, the Thimphu and Paro valleys of Bhutan, and Jumla District in Nepal. The surveys focused on investigating pollination-related productivity problems in apple crops, farmers’ understanding of the pollination problem and their management practices, and institutional responses to this problem. Apple crop was selected for this study because it is the number one crop in terms of sustaining household and provincial agricultural economies in several countries

8
Value of Insect Pollinators to Himalayan Agricultural Economies
in the HKH region. The findings were astonishing: across the Himalayan valleys, farmers were facing serious problems with crop pollination failure because of the declining diversity and abundance of populations of insect pollinators. The declining number of pollinators should be a cause of concern to the farmers and governments of the region. The scale of the problem and farmers’ management strategies varied in all five countries studied. The study also highlighted the weak institutional capacities of provincial and national governments of the region to handle this challenge.
However, some questions remained: How much economic loss can pollination failure cause to the agricultural economy of an area, state, or nation? This information is necessary to convince policy makers, researchers, and development agencies of the danger to farmers and governments if the cash crop economy of the HKH region is destroyed. A new study was needed to determine if the decline in insect pollination services is causing a decline in crop productivity, and, if so, how serious is the decline? The present study aims to fill this knowledge gap.
Objectives of the StudyThe main objectives of this study were to assess the economic value of insect pollination and quantify the potential economic loss resulting from its failure in sub-regional economies in the HKH region to highlight the need for initiatives to address the issue. Assigning a monetary value to the economic contribution of insect pollination to agriculture may encourage farmers and institutions to integrate pollination as an input to agricultural development. It is hoped that this paper will inform policy and decision makers of the need to give due place to pollinators and pollination in the agricultural policies and research and development investment plans of mountain states and nations in the HKH region. The specific objectives of this study were: � to assess the economic value of insect pollination to agriculture and quantify the loss resulting from its
failure; � to enhance wider understanding of the economic value of crop pollinators to the mountain agricultural
economy and assess the interventions needed to manage crop pollination; � to strengthen the understanding in regional institutions about the significance of pollination services to the
farmers in their provinces/sub-regions and countries through partnership in this study; and � to create opportunities for initiating steps to promote managed pollination through honeybees and other
manageable bee species in areas where natural pollinators have declined in numbers.
9
2 Methodology
2 Methodology
Scientists have developed different methodologies to value the economic contribution of ecosystem services such as pollination. This chapter discusses these methods, and outlines the method chosen for the economic valuation of insect pollination in this study and its data requirements.
Revealed and Stated Preference Methods There are two types of methods for valuing ecosystem services: revealed preference methods and stated preference methods. Revealed preference methods infer value based on certain physical parameters, references, or data, whereas stated preference methods involve asking people how much they are willing to pay or willing to accept for a particular environmental service. Commonly used revealed preference methods include calculation or estimation of replacement cost, avoided cost, change in productivity, hedonic pricing (related to pleasure/ recreational value), and travel cost. Among these, three methods – replacement cost, avoided cost, and change in productivity – have been used to assess the value of pollination services to agriculture.
The replacement cost method, proposed by Allsopp et al. (2008), relates the value of an ecosystem service to the cost of an alternative way of obtaining the same benefit (Pearce and Turner 1990). For example, the value of insect pollinators can be estimated based on the cost of hiring colonies of honeybees or other manageable species to pollinate crops. The value of pollination as a whole can be calculated based on the cost of hand pollinating crops. However, this method is inappropriate for calculating the value of insect pollinators in the mountain areas of the HKH as managed pollination using honeybees is only practised in Himachal Pradesh in India and only for one crop, apples, and hand pollination is only practised in Maoxian County in China and, again, only with apples, so it is not possible to obtain data on the replacement cost across the HKH region.
Change in productivity is another method used to assess the value of pollination services to agriculture. This approach traces the impact of the change in ecosystem services on production, e.g., the impact of pollination services provided by pollinators on fruit production. This method can be applied where any impact affects produced goods and requires data on the change in service and its impact on production. Its limitation is that it is expensive and time consuming to obtain or generate such data.
The avoided cost method looks at the costs that would have been incurred in the absence of pollination services. It also includes the value of change in productivity, e.g., the decrease in agricultural productivity resulting from the reduction in pollination services as a result of pollinator decline. This method is also limited by the high cost of obtaining or generating data.
A commonly-used stated preference method is the contingent valuation method (CVM). This method involves asking respondents how much they would be willing to pay or accept for a particular service. This method can be used to evaluate any ecosystem service, including pollination services. It requires conducting a survey to elicit the willingness to pay (WTP) or willingness to accept (WTA) payment for a specified service. The limitations of this method include response bias. Also, in a hypothetical question, respondents do not face an actual situation, therefore their stated preference may be different from in a real situation. Another way of applying the stated preference method is to conduct a group valuation or discourse-based valuation of a service. This method can be applied to value any service, including a pollination service, and would require several rounds of consultation. Its main limitation is that it is difficult to reach a consensus on value.
Methodology Used in This StudyThe economic value of the contribution of insect pollination to agriculture and its impact on agricultural production in the selected study areas has been assessed using a bioeconomic approach developed by Gallai

10
Value of Insect Pollinators to Himalayan Agricultural Economies
and Vaissière (2009) and the FAO array of crop categories (http//faostat.fao.org). This method was developed by Dr Nicola Gallai, environmental economist, and Dr Bernard E. Vaissière, pollination ecologist, under the auspices of FAO. It is based on the hypothesis that the economic impact of pollinators on agricultural output is measurable through the use of dependence ratios that quantify the impact of a lack of insect pollinators on crop production value. In addition to looking at the individual crops, these experts examined the vulnerability of different crop categories to pollinator decline.
This approach also allows the calculation of an economic measure of vulnerability in terms of consumer surplus, which can help in understanding the meaning of the vulnerability ratio. This assessment is based on the calculation of the loss in terms of agricultural production for each crop. The results are transformed into economic surplus loss for consumers, which enables researchers to obtain an assessment of the social cost of pollinator decline.
This method is user friendly and employs data that are relatively easy to collect. It requires information on the dependence of crops on insect pollinators for fruit seed production, as well as data on total production and producers’ price for a crop in a given area.
Guidelines and information on how to use the methodology for assessing the economic value of pollination to agricultural production are provided in Gallai and Vaissière (2009).
Terminology and calculation of values
The Gallai and Vaissière (2009) method requires the calculation of certain values: the average value per tonne of the crop, total value of the crop (TVC), dependence ratio of the crop on insect pollinators (D), economic value of insect pollination (EVIP), and consumer surplus loss (CSL) for each crop and crop category cultivated in the study areas. The ratio of vulnerability of crops to pollinator decline (RV) was also calculated for different crop categories. These terms and how they are calculated are explained here.
Average value per tonne of the crop was calculated for each crop category by averaging the producers’ price values for all individual crops under individual crop categories.
Total value of crop (TVC) gives an estimate of the economic importance of the crop in the agricultural economy and is calculated by multiplying the price per unit (tonne) of the crop by its total production (tonnes). In the present study, TVC is calculated for each individual crop and crop category.
Dependence ratio (D) is the level of dependence of a crop on pollinators for the production of fruit or seed. It is used to assess the impact of insect pollinators on crop production
Economic value of insect pollination (EVIP) is the economic value of the crop obtained as a result of the increase in production for a crop because of insect pollination. It is calculated by multiplying the total value of a crop and its dependence ratio on pollinators. In the present study, EVIP is calculated for each individual crop and crop category.
Ratio of vulnerability (RV) is the ratio of economic value of insect pollination to the current total value of the crop. It is the dependence ratio that enables calculation of the production loss in the face of the loss in pollination services resulting from the loss of pollinators. RV is calculated for each crop category to see how vulnerable the crops/crop categories are to the loss of insect pollinators.
Consumer surplus is the surplus received by a consumer in a market, i.e., if the market price is below what a consumer is willing to pay the purchase will result in a consumer surplus. It is the difference between the price that a consumer is willing to pay and the market price that a consumer actually pays. The total consumer surplus is the sum of all consumer surpluses gained by all buyers of a good in the market. Consumer surplus has been defined as “the excess of the price which the consumer would be willing to pay rather than to go without the thing, over that what s/he actually pays” (Willig 1976). The consumer surplus generated by an ecosystem service equals the aggregated utility gained by all consumers of the service minus the aggregated costs or efforts involved in obtaining the ecosystem service (Hueting 1980).
11
2 Methodology
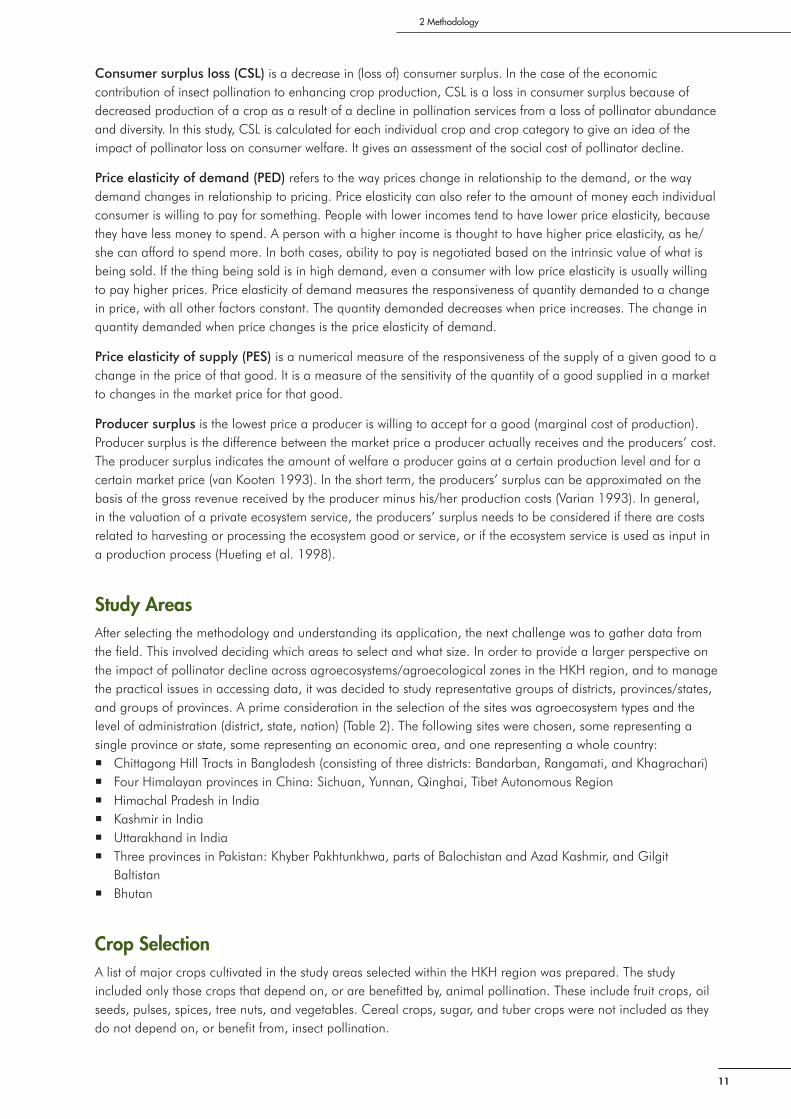
Consumer surplus loss (CSL) is a decrease in (loss of) consumer surplus. In the case of the economic contribution of insect pollination to enhancing crop production, CSL is a loss in consumer surplus because of decreased production of a crop as a result of a decline in pollination services from a loss of pollinator abundance and diversity. In this study, CSL is calculated for each individual crop and crop category to give an idea of the impact of pollinator loss on consumer welfare. It gives an assessment of the social cost of pollinator decline.
Price elasticity of demand (PED) refers to the way prices change in relationship to the demand, or the way demand changes in relationship to pricing. Price elasticity can also refer to the amount of money each individual consumer is willing to pay for something. People with lower incomes tend to have lower price elasticity, because they have less money to spend. A person with a higher income is thought to have higher price elasticity, as he/she can afford to spend more. In both cases, ability to pay is negotiated based on the intrinsic value of what is being sold. If the thing being sold is in high demand, even a consumer with low price elasticity is usually willing to pay higher prices. Price elasticity of demand measures the responsiveness of quantity demanded to a change in price, with all other factors constant. The quantity demanded decreases when price increases. The change in quantity demanded when price changes is the price elasticity of demand.
Price elasticity of supply (PES) is a numerical measure of the responsiveness of the supply of a given good to a change in the price of that good. It is a measure of the sensitivity of the quantity of a good supplied in a market to changes in the market price for that good.
Producer surplus is the lowest price a producer is willing to accept for a good (marginal cost of production). Producer surplus is the difference between the market price a producer actually receives and the producers’ cost. The producer surplus indicates the amount of welfare a producer gains at a certain production level and for a certain market price (van Kooten 1993). In the short term, the producers’ surplus can be approximated on the basis of the gross revenue received by the producer minus his/her production costs (Varian 1993). In general, in the valuation of a private ecosystem service, the producers’ surplus needs to be considered if there are costs related to harvesting or processing the ecosystem good or service, or if the ecosystem service is used as input in a production process (Hueting et al. 1998).
Study AreasAfter selecting the methodology and understanding its application, the next challenge was to gather data from the field. This involved deciding which areas to select and what size. In order to provide a larger perspective on the impact of pollinator decline across agroecosystems/agroecological zones in the HKH region, and to manage the practical issues in accessing data, it was decided to study representative groups of districts, provinces/states, and groups of provinces. A prime consideration in the selection of the sites was agroecosystem types and the level of administration (district, state, nation) (Table 2). The following sites were chosen, some representing a single province or state, some representing an economic area, and one representing a whole country: � Chittagong Hill Tracts in Bangladesh (consisting of three districts: Bandarban, Rangamati, and Khagrachari) � Four Himalayan provinces in China: Sichuan, Yunnan, Qinghai, Tibet Autonomous Region � Himachal Pradesh in India � Kashmir in India � Uttarakhand in India � Three provinces in Pakistan: Khyber Pakhtunkhwa, parts of Balochistan and Azad Kashmir, and Gilgit
Baltistan � Bhutan
Crop SelectionA list of major crops cultivated in the study areas selected within the HKH region was prepared. The study included only those crops that depend on, or are benefitted by, animal pollination. These include fruit crops, oil seeds, pulses, spices, tree nuts, and vegetables. Cereal crops, sugar, and tuber crops were not included as they do not depend on, or benefit from, insect pollination.

12
Value of Insect Pollinators to Himalayan Agricultural Economies
Data Requirements The methodology of Gallai and Vaissière (2009) requires data on: � Dependence of crops on insect pollinators � Price received by producers for crops � Production level of crops
Dependence level of crops on insect pollinators
Depending on their pollination requirements, plant species are either self-fertile (self-compatible) or self-infertile (self-sterile or self-incompatible). Self-fertile or self-compatible plants are fertilized by their own pollen and can produce seed and fruit, whereas self-sterile or self-incompatible plants cannot be fertilized by their own pollen and need pollen from another plant of the same species. Commercial varieties of many fruit crops, e.g., almonds, apples, plums, and cherries, and various vegetable crops such as cabbage, cauliflower, broccoli, and radish, are self-sterile or self-incompatible and require cross-pollination to produce seeds and fruit (McGregor 1976; Free 1993). They cannot produce seeds and fruit unless cross-pollination takes place. It is not only self-sterile varieties that benefit from cross-pollination; self-fertile varieties also produce more and better quality seeds/fruit if they are cross-pollinated (Free 1993).
Table 3 shows the reported pollination requirements of various crops and their dependence on insect pollinators. These values were used in calculating the economic valuation of insect pollination in the present study. The data on dependence of various crops on insect pollination (as reported by Klein et al. 2007) are available in Excel spreadsheet format on the FAO website on Global Action on Pollination Services for Sustainable Agriculture (www.internationalpollinatorsinitiative.org).
Table 2: Study sites and their characteristics
Country Study site Administrative status of area
Agroecosystem and key crops Agroecological zone
Bangladesh Chittagong Hill Tracts (districts of Bandarban, Rangamati, and Khagrachari)
Chittagong Hill Area Development Council – sub-region
Subsistence farming; cash crops include subtropical fruit and vegetables
Hilly subtropical zone
Bhutan Whole country Mixed farming dominated by food grains; cash crops include apples, oranges, and vegetables
Subtropical to wet temperate hilly and mountain zone
China Provinces of Sichuan, Yunnan, Qinghai, Tibet Autonomous Region
Four provinces
Fruit crops dominated cash crop farming
Subtropical to temperate
India Himachal Pradesh Mountain state in the Indian Himalayas
Cash crop farming dominated by subtropical and temperate fruit (mainly apple) and vegetable crops
Subtropical to temperate
India Kashmir Mountain state in the north Indian Himalayas
Cash crop farming dominated by subtropical and temperate fruit (mainly apple) and vegetable crops
Subtropical to temperate
India Uttarakhand A mountain state in the Indian Himalayas
Mixed farming – mainly subsistence based; cash crop farming (fruit and vegetable based) is increasing
Subtropical to temperate
Pakistan Himalayan region of Pakistan (Khyber Pakhtunkhwa, Parts of Balochistan, Gilgit Baltistan, and Azad Kashmir
Two provinces and three isolated mountain districts
Cash crops (fruit) dominate Subtropical to temperate

13
2 Methodology
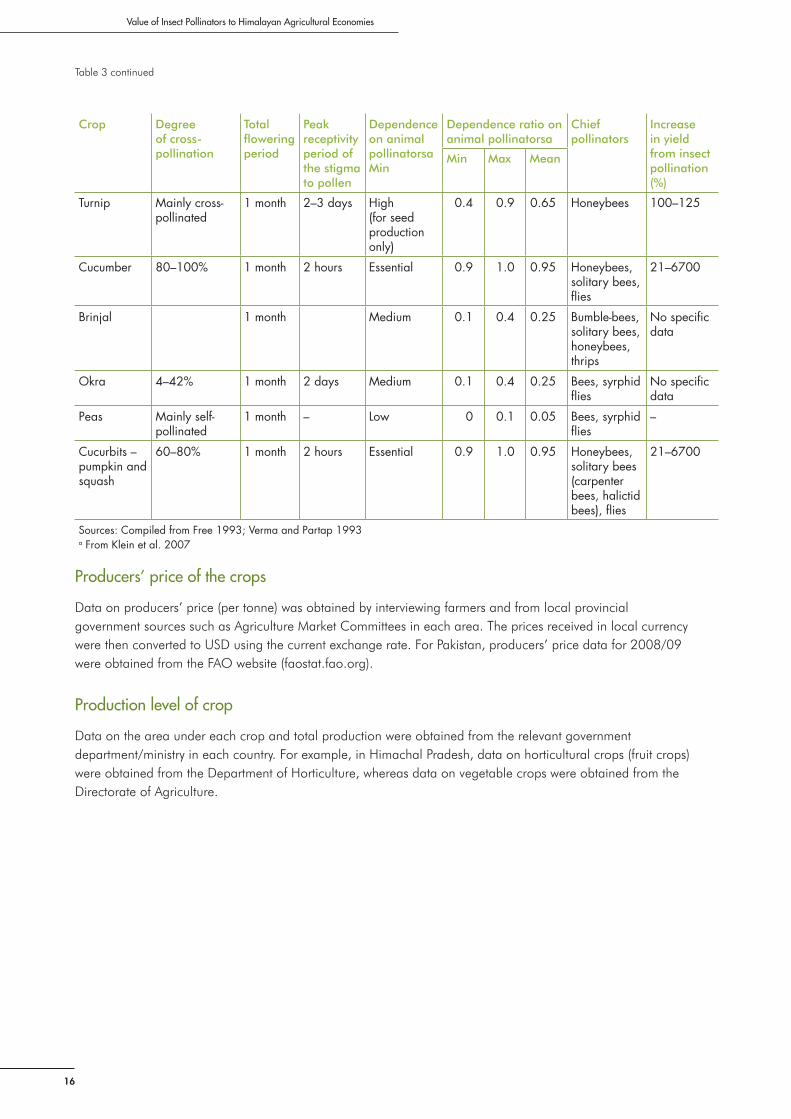
Table 3: Pollination requirements of crops, their dependence on animal pollinators, and the principal pollinators of major crops cultivated in selected mountain areas of the HKH
Crop Degree of cross-pollination
Total flowering period
Peak receptivity period of the stigma to pollen
Dependence on animal pollinatorsa
Dependence ratio on animal pollinatorsa
Chief pollinators
Increase in yield from insect pollination (%)
Min. Max. Mean
Fresh fruit
Apple All commercial varieties require cross-pollination
10–15 days
2–3 days High 0.4 0.9 0.65 Honeybees, bumble-bees, halictid bees, Eristalis flies
180–6,950
Apricot Cross-pollination beneficial; for some cultivars it is essential
15–20 days
4–5 days High 0.4 0.9 0.65 Honeybees, wild bees
5–10
Cherry Cross-pollination essential
7–8 days 2 days High 0.4 0.9 0.65 Honeybees, wild bees
56–1,000
Citrus Varies from self-fertile to self-sterile varieties
1 month 6–8 days Low 0 0.1 0.05 Honeybees, bumble-bees, wild bees, flies
7–233
Gooseberry/kiwi fruit
Cross-pollination essential
20–25 days
2–3 days Essential 0.9 1.0 0.95 Honeybees 29–300
Grape Generally self-fertile
20–25 days
3 days 0 0 0 0 Honeybees, halictid bees
23–54
Guava Cross-pollination beneficial
20–25 days
1–2 days Medium 0.1 0.4 0.25 Honeybees, bumble-bees, wild bees
–
Jackfruit – 8–10 days
Unknown – – – – –
Litchi Cross-pollination beneficial
25–30 days
3 days High 0.4 0.9 0.65 Honeybees, flies, ants
4,538–10,240
Mango Cross-pollination highly beneficial
2–3 weeks
Few hours to 5 days
High 0.4 0.9 0.65 Flies, honeybees, butterflies, moths, beetles
–
Papaya Cross-pollination essential
1 month – Low 0 0.1 0.05 Thrips, honeybees, butterflies, hawkmoths
–
Peach Most varieties self-fertile; few self-sterile
20–25 days
3 days High 0.4 0.9 0.65 Honeybees 7–3,788
Pear Partially or entirely self-sterile
7–10 days
4–5 days High 0.4 0.9 0.65 Honeybees, flies, beetles
240–6,014
Persimmon Mainly self-fertile
25–30 days
3–4 days High 0.4 0.9 0.65 Honeybees, bumble-bees
21
Plum Varies from self-fertile to self-sterile varieties
1 week 2 days High 0.4 0.9 0.65 Honeybees, bumble-bees, blow flies
5–10
Continues

14
Value of Insect Pollinators to Himalayan Agricultural Economies
Strawberry Cross-pollination beneficial
30–35 days
3 days High 0.4 0.9 0.65 Honeybees, wild bees
5–10
Pomegranate – Medium 0.1 0.4 0.25 Honeybees, wild bees
–
Pulses
Beans Almost entirely self-pollinated, but are benefited by cross-pollination
2–3 weeks
1 day Low 0 0.1 0.05 Thrips –
Peas Almost entirely self- pollinated, but are benefited by cross-pollination
2–3 weeks
1 day Low 0 0.1 0.05 Thrips, bumble-bees, Megachile spp.
39
Butter beans (Rajmah)
Almost entirely self- pollinated, but are benefited by cross-pollination
2–3 weeks
– Low 0 0.1 0.05 Thrips –
Pigeon peas Almost entirely self-pollinated, but are benefited by cross-pollination
2–3 weeks
1–2 days Low 0 0.1 0.05 Honeybees, solitary bees
10–15
Oilseed crops
Mustard Mainly cross-pollinated
1 month 2–3 days Medium 0.1 0.4 0.25 Honeybees, halictid bees, solitary bees, Megachile spp., Eristalis spp.
13–222
Rapeseed Mainly cross-pollinated
1 month to 45 days
2–3 days Medium 0.1 0.4 0.25 Honeybees, halictid bees, solitary bees, Megachile spp., Eristalis spp.
100–133
Sesame 5–65% 3–4 weeks
10–12 hours
Medium 0.1 0.4 0.25 Honeybees, Megachile spp., Eristalis spp.
180–360
Groundnuts Mainly self-pollinated
Few hours Low 0 0.1 0.05 Honeybees, solitary bees, flies
20–30
Soybeans Mainly self-pollinated
1–2 weeks
1 day Medium 0.1 0.4 0.25 Honeybees, solitary bees, flies
–
Sunflower 20–75% 15–20 days
Medium 0.1 0.4 0.25 Honeybees, bumble-bees
21–3400
Crop Degree of cross-pollination
Total flowering period
Peak receptivity period of the stigma to pollen
Dependence on animal pollinatorsa
Dependence ratio on animal pollinatorsa
Chief pollinators
Increase in yield from insect pollination (%)
Min. Max. Mean
Table 3 continued

15
2 Methodology
Linseed Mainly self-pollinated
2–3 weeks
Few hours Low 0 0.1 0.05 20–50
Forage crops
Barseem and lucerne
Cross-pollination essential
1 month to 45 days
Medium 0.1 0.4 0.25 Honeybees, bumble-bees, solitary bees
Very high
Spice crops
Chilli – black pepper, chilli pepper
7–37% 2–3 weeks
2 days Low 0 0.1 0.05 Honeybees, ants
No specific data
Coriander Self-pollinated, but are greatly benefited by cross-pollination
3–4 weeks
– Medium 0.1 0.4 0.25 Honeybees, halictid bees, syrphid flies
187
Fennel Self-pollinated, but are greatly benefited by cross-pollination
2–3 weeks
– Medium 0.1 0.4 0.25 Honeybees, halictid bees, syrphid flies
100
Cardamom Self-pollinated, but are greatly benefited by cross-pollination
3–4 weeks
1 day Medium 0.1 0.4 0.25 Honeybees, bumble-bees
66–600
Tree nut (dry fruit) crops
Almonds Cross-pollination essential
1 month 3–4 days Essential 0.4 0.9 0.65 Honeybees, wild bees
50–75
Areca nuts – – – Low 0 0.1 0.05 – –
Walnuts Wind pollinated
10–15 days
– None 0 0 0 – –
Pine nuts Wind pollinated
10–15 days
– None 0 0 0 – –
Fresh vegetables
Tomato 7–36% 12–15 days
4–8 days Low 0 0.1 0.05 Bumble-bees, solitary bees, honeybees, thrips
No specific data
Cole crops – cabbage, cauliflower, broccoli, etc.
72–95% 1 month 3–4 days High (for seed production only)
0.4 0.9 0.65 Honeybees, solitary bees, flies
100–300
Carrot 85% 1 month 1 week High (for seed production only)
0.4 0.9 0.65 Honeybees, house flies
9–135
Radish Mainly cross-pollinated
22–30 days
3–4 days High (for seed production only)
0.4 0.9 0.65 Honeybees 22–100
Crop Degree of cross-pollination
Total flowering period
Peak receptivity period of the stigma to pollen
Dependence on animal pollinatorsa
Dependence ratio on animal pollinatorsa
Chief pollinators
Increase in yield from insect pollination (%)
Min. Max. Mean
Continues
Table 3 continued
16
Value of Insect Pollinators to Himalayan Agricultural Economies
Turnip Mainly cross-pollinated
1 month 2–3 days High (for seed production only)
0.4 0.9 0.65 Honeybees 100–125
Cucumber 80–100% 1 month 2 hours Essential 0.9 1.0 0.95 Honeybees, solitary bees, flies
21–6700
Brinjal 1 month Medium 0.1 0.4 0.25 Bumble-bees, solitary bees, honeybees, thrips
No specific data
Okra 4–42% 1 month 2 days Medium 0.1 0.4 0.25 Bees, syrphid flies
No specific data
Peas Mainly self-pollinated
1 month – Low 0 0.1 0.05 Bees, syrphid flies
–
Cucurbits –pumpkin and squash
60–80% 1 month 2 hours Essential 0.9 1.0 0.95 Honeybees, solitary bees (carpenter bees, halictid bees), flies
21–6700
Sources: Compiled from Free 1993; Verma and Partap 1993a From Klein et al. 2007
Crop Degree of cross-pollination
Total flowering period
Peak receptivity period of the stigma to pollen
Dependence on animal pollinatorsaMin
Dependence ratio on animal pollinatorsa
Chief pollinators
Increase in yield from insect pollination (%)
Min Max Mean
Producers’ price of the crops
Data on producers’ price (per tonne) was obtained by interviewing farmers and from local provincial government sources such as Agriculture Market Committees in each area. The prices received in local currency were then converted to USD using the current exchange rate. For Pakistan, producers’ price data for 2008/09 were obtained from the FAO website (faostat.fao.org).
Production level of crop
Data on the area under each crop and total production were obtained from the relevant government department/ministry in each country. For example, in Himachal Pradesh, data on horticultural crops (fruit crops) were obtained from the Department of Horticulture, whereas data on vegetable crops were obtained from the Directorate of Agriculture.
Table 3 continued

17
3 Findings: The Economic Value of Insect Pollination
3 Findings: The Economic Value of Insect Pollination
The findings of the study including the economic value of insect pollination to the different categories of crops and individual crops in the study areas of the countries in the HKH region are presented in this chapter. For each study area the crops are listed according to the six main crop categories (following FAO): fruit, oilseeds, pulses, spices, tree nuts, and vegetables. The number of crops studied under each category varies depending on the study area. Full information for individual crops in each of the study areas is given in the Annex.
Chittagong Hill Tracts of BangladeshThe Chittagong Hill Tracts of Bangladesh consist of three districts, Bandarban, Rangamati, and Khagrachari, located in the southeast of the country near the Myanmar and Indian borders. These districts make up 10% of the total land area (13,180 km2) of the country, but contain only 1% of the population. The estimated population in the Chittagong Hill Tracts is 1.3 million, of which 90% live in rural areas. This region is home to different indigenous/ethnic tribal groups including Chakma, Marma, Tripura, Tenchungya, Chak, Murung, Bawm, Lushai, Khyang, Gurkha, Assamese, Pankhua, and Khumi. Shifting cultivation is a traditional agricultural system in the Chittagong Hill Tracts.
Although shifting cultivation dominates remote hilly areas, in the more accessible valleys where irrigation is available farmers grow rice, fruit crops (bananas, guavas, jujube, lemons, oranges, litchis, mangoes), vegetables (cucurbits, beans, leafy vegetables, root crops such as ginger, turmeric, sweet potato [Ipomoea batatas] and simul-alu [Manihot esculenta]) (see Annex). In some areas, these crops are being replaced by more intensive cash crop farming of vegetables and fruit. With increasing market access, the area under cultivation of these vegetables and root crops is constantly increasing.
In the Chittagong Hill Tracts of Bangladesh, the economic contribution of pollination was evaluated for 42 major crops: 10 fruit crops, 5 oilseeds, 5 pulses, 2 spices, 2 tree nuts, and 18 vegetables (Table 4). The total value of crop (TVC) for all 42 crops is USD 255.2 million and the economic value of insect pollination (EVIP) is USD 53.8 million, and the ratio of vulnerability (RV) is 22.7%; that is, one could expect a loss of 22.7% (or USD 53.8 million) in total crop value with a total loss in pollinator population.
Table 4: Economic contribution of insect pollination to the agricultural economy in the Chittagong Hill Tracts, Bangladesh
Crop category Average value per tonne (USD)
Total value of crop (TVC) = price x production(million USD)
Economic value of insect pollination (EVIP) = TVC x D(million USD)
Ratio of vulnerability (RV) = EVIP/TVC(%)
Consumer surplus loss (CSL) with elasticity =(million USD)
-0.8 -1.2
Fruit 236 186.56 33.08 19.3 58.39 47.91
Oilseeds 1,030 5.62 0.97 17.3 1.34 1.08
Pulses 797 0.4 0.00 0.9 0.00 0.00
Spices 830 2.26 0.09 4.0 0.09 0.09
Tree nuts 1,139 13.96 3.29 25.1 3.91 3.61
Vegetables 305 46.37 16.34 38.3 57.65 33.66
Total 255.17 53.77 22.7% 121.39 86.36
Note: D = Dependence ratio of animal pollination

18
Value of Insect Pollinators to Himalayan Agricultural Economies
Even though the EVIP is much less for vegetable crops (only USD 16.3 million) than for fruit crops (USD 33.1 million), vegetables are most vulnerable to pollinator loss. This is because most vegetables cultivated in the Chittagong Hill Tracts belong to the Cucurbitaceae family, which all depend entirely on insect pollination to produce fruit. For many major fruit crops cultivated in the Chittagong Hill Tracts, such as banana, jackfruit, oranges, papaya, pineapple, insect pollinators have only subsidiary role to play.
In terms of social welfare, the CSL for all crops is USD 121.4 and 86.4 million, with average price elasticity values equal to -0.8 and -1.2 respectively.
BhutanBhutan is a mountainous country located on the southern slopes of the Eastern Himalayas. With an area of 40,077 km2, its altitude varies from 200 m to 7,500 m. The forests in Bhutan, the natural habitat of pollinators, occupy 72.5% of the area of the country. Bhutan’s economy is based on agriculture, forestry, tourism, and hydroelectricity. Agriculture provides the main livelihood for more than 80% of the population. Agricultural practices consist largely of subsistence farming and animal husbandry. The country has three broad agro-climatic zones: the great Himalayan zone in the north is about 30 km wide and lies above 4,000 masl; the central inner Himalayan zone is about 70 km wide and lies at 1,000 to 4,000 masl – it has most of the forests and apple orchards of the country; and the largely inhabited southern subtropical Himalayan foothills form a 50 km wide zone from 160 to 2,000 masl.
The main food crops are rice, wheat, maize, and potatoes. Cash crops include fresh vegetables such as asparagus, chilli, potato, and cardamom (see Annex). The main fruit crops are apples and oranges. Bhutan’s agricultural policy encourages the planting of apples and citrus on marginal sloping lands, unsuitable for the cultivation of other food crops. Valley land is used for rice or wheat farming. The policy does not permit the conversion of paddy land for fruit farming, or for any other non-farming purpose.
In Bhutan, the economic contribution of pollination was evaluated for 31 crops: 11 fruit crops, 2 oilseeds, 5 pulses, 1 spice crop, 2 tree nuts, and 10 vegetables. The TVC for all 31 crops is USD 123.2 million, the EVIP is USD 17.9 million, and the RV is 14.5% (Table 5).
Bhutan grows cucurbitaceous vegetables such as cucumber, pumpkin, and squash which require insect pollinators to produce fruit. Most fruit crops grown in the country do not require insects for their pollination. Regarding oilseed crops, Bhutan grows mustard and soybeans, and both these crops benefit greatly from insect pollination. Tree nut crops in Bhutan are the least dependent on insect pollinators for the production of fruit or seed.
The CSL for all crops is USD 35.1 and 26.4 million, with average price elasticity values equal to -0.8 and -1.2, respectively.
Table 5: Economic contribution of insect pollination to the agricultural economy in Bhutan
Crop category Average value per tonne(USD)
Total value of crop (TVC) = price x production(million USD)
Economic value of insect pollination (EVIP) = TVC x D(million USD)
Ratio of vulnerability (RV) = EVIP/TVC(%)
Consumer surplus loss (CSL) with elasticity =(million USD)
-0.8 -1.2
Fruit 558 52.84 10.92 20.7 18.29 15.15
Oilseeds 684 3.28 0.82 25.0 0.97 0.92
Pulses 1,050 6.23 0.31 5.0 0.32 0.32
Spices 1,609 13.46 0.67 5.0 0.69 0.69
Tree nuts 2,801 20.70 0.96 4.6 0.99 0.98
Vegetables 613 26.70 4.21 15.8 13.86 8.35
Total 123.21 17.88 14.5% 35.12 26.41
Note: D = Dependence ratio of animal pollination

19
3 Findings: The Economic Value of Insect Pollination
Chinese Himalayan ProvincesThe Chinese Himalayan provinces include Sichuan, Yunnan, Qinghai, and the Tibet Autonomous Region. Most of the area of these provinces is mountainous, and they are home to over 50% of China’s plant and animal species. Agriculture is the main occupation of over 90% of the population. Farms are mostly small or marginal, with an average of less than half a hectare of land per family. Basic food crops include rice, maize, wheat, potatoes, sorghum, peanuts, tea, millet, barley, cotton, oilseed, soybeans, and horse beans.
Cash crops grown in the Himalayan areas of China include apples, Chinese prickly ash, and off-season vegetables such as tomatoes, capsicum, and cabbage (see Annex). Other fruit crops planted to a limited extent include plums, peaches, pears, and grapes.
In the Chinese Himalayan provinces (Sichuan, Yunnan, Qinghai, and the Tibetan Autonomous Region) the economic contribution of pollination was evaluated for 26 crops: 11 fruit crops, 2 oilseed crops, 4 pulses, 1 spice crop, 1 tree nut, and 7 vegetables. The TVC for all major crops is USD 11.1 billion, the EVIP is USD 676.8 million, and the RV is 6.1% (Table 6).
In the Chinese Himalayas, the productivity of fruit crops would be most affected by the local loss of pollinators, followed by oilseed crops, and, to a much lesser degree, by spices and vegetables. The only tree nut crop cultivated in the Chinese Himalayan region (walnut) does not depend on or benefit from insect pollinators. Four types of pulses (butter beans, horse gram, mung beans, and peas) are cultivated in the Chinese Himalayan provinces; however, producers’ price data are not available for pulses, except for peas, and as peas are mainly self-pollinated the RV and EVIP for pulses has been conservatively set at zero.
The CSL for all crops is USD 1.1 billion and 901.5 million, with average price elasticity values equal to -0.8 and -1.2, respectively.
Himachal Pradesh, IndiaHimachal Pradesh is a mountainous state covering an area of nearly 55,000 km2 in the northwestern Indian Himalayas. Its six million people inhabit valleys and marginal sloping lands on hills, mountains, and highlands, with an altitudinal range from 350 m to 6,975 m. The climate varies from hot to severely cold. Agriculture is the main source of income and provides employment for about three-quarters of the total rural population of the state. Agriculture contributes nearly 45% of the net state domestic product.
The average size of landholdings is 1.62 ha, and a large number of holdings are less than 1 ha (Partap and Partap 2002). The main agricultural crops are wheat, maize, and rice. At higher elevations, crops such as
Table 6: Economic contribution of insect pollination to the agricultural economy of the Chinese Himalayan provinces (Sichuan, Yunnan, Qinghai, and the Tibetan Autonomous Region)
Crop category Average value per tonne(USD)
Total value of crop (TVC) = price x production(million USD)
Economic value of insect pollination (EVIP) = TVC x D(million USD)
Ratio of vulnerability (RV) = EVIP/TVC(%)
Consumer surplus loss (CSL) with elasticity =(million USD)
-0.8 -1.2
Fruit 577 915.26 445.82 46.4 795.79 646.38
Oilseeds 737 751.84 187.96 25.0 222.63 210.19
Pulses 137 115.89 0 0 0 0
Spices 2,687 80.6 4.03 5.0 4.16 4.11
Tree nuts 3,731 3,134.29 0 0. 0 0
Vegetables 289 6,119.99 38.95 0.8 41.88 40.85
Total 11,117.87 676.76 6.1% 1,064.46 901.53
Notes: D= Dependence ratio of animal pollination; EVIP, RV, and CSL for pulses have been conservatively set at zero as producers’ price data is not available, except for peas, which are mainly self-pollinated.

20
Value of Insect Pollinators to Himalayan Agricultural Economies
buckwheat, barley, and potatoes are grown in place of rice. Agricultural development in the state has certain limitations, particularly in the production of food grains. This is because the area under cultivation can’t be extended. The mountain farmers of Himachal Pradesh have benefitted immensely from the cultivation of cash crops. Himachal Pradesh is known as the ‘Fruit State’ and the ‘Apple State’ of India. Out of 614,000 ha of arable land, 32% is under cultivation of horticultural crops. At present, about 196,000 ha are under fruit cultivation. Apples are the main cash crop, accounting for 42% of the total area under fruit cultivation and about 90% of total fruit production. About 97,438 ha are planted with apples; there are about 150,000 apple growers and annual production is about 510,161 tonnes (Department of Horticulture, 2009). Apple orchards dominate the agricultural economy in the districts of Kinnaur, Kullu, Shimla, and parts of Chamba, Lahaul and Spiti, Mandi, Sirmaur, and Solan. The vegetables grown here include cabbage, cauliflower, potatoes, pulses, beans, and tomatoes. Besides apples, several other fruits are grown here: almonds, peaches, plums, pears, cherries, and pine nuts in the mountains and citrus fruit, mangoes, litchis, guavas, and loquat in the foothills and valleys near the plains (see Annex).
Apple farming plays a major role in the economy of Himachal Pradesh. Its present contribution to the state economy is estimated at about USD 1.7 billion per year, with about USD 150 million to USD 170 million contributed directly, and about USD 1.5 billion contributed indirectly through the provision of jobs for thousands of people, not only in Himachal Pradesh, but also in Asia’s biggest fruit market in Delhi during the six-month apple-selling season.
In Himachal Pradesh, the economic contribution of pollination was evaluated for 32 crops: 13 fruit crops, 5 oilseeds, 1 pulse crop, 2 spices, 2 tree nuts, and 9 vegetables. The TVC for all selected crops is USD 815.1 million, the EVIP is USD 365 million, and the RV is 44.8% (Table 7).
Most of the crops and varieties cultivated in Himachal Pradesh are mainly cross-pollinated and either depend on, or are greatly benefited by, insect pollination. Among the different crop categories, fruit crops are highly vulnerable to pollinator loss. It is estimated that a loss in local insect pollinators would result in a two-thirds reduction in fruit crop production. Oilseed crops are the next most vulnerable, followed to a much lesser degree by pulses, spices, and vegetables. Tree nut crops such as pecan nuts, pine nuts, and walnuts mostly do not depend on, or benefit from insect pollinators.
The CSL for all major crops is USD 648.2 million and 527.3 million, with average price elasticity values equal to -0.8 and -1.2, respectively.
Table 7: Economic contribution of insect pollination to the agricultural economy of Himachal Pradesh, India
Crop category Average value per tonne(USD)
Total value of crop (TVC) = price x production(million USD)
Economic value of insect pollination (EVIP) = TVC x D(million USD)
Ratio of vulnerability (RV) = EVIP/TVC(%)
Consumer surplus loss (CSL) with elasticity =(million USD)
-0.8 -1.2
Fruit 882 562.74 354.49 63.0 636.7 516.14
Oilseeds 672 4.49 1.06 23.5 1.25 1.18
Pulses 1,609 31.53 1.58 5.0 1.63 1.61
Spices 1,544 1.36 0.02 1.6 0.02 0.02
Tree nuts 1,507 2.87 0.05 1.9 0.10 0.10
Vegetables 337 212.14 7.84 3.7 8.5 8.27
Total 815.13 365.04 44.8% 648.2 527.3
Note: D= Dependence ratio of animal pollination
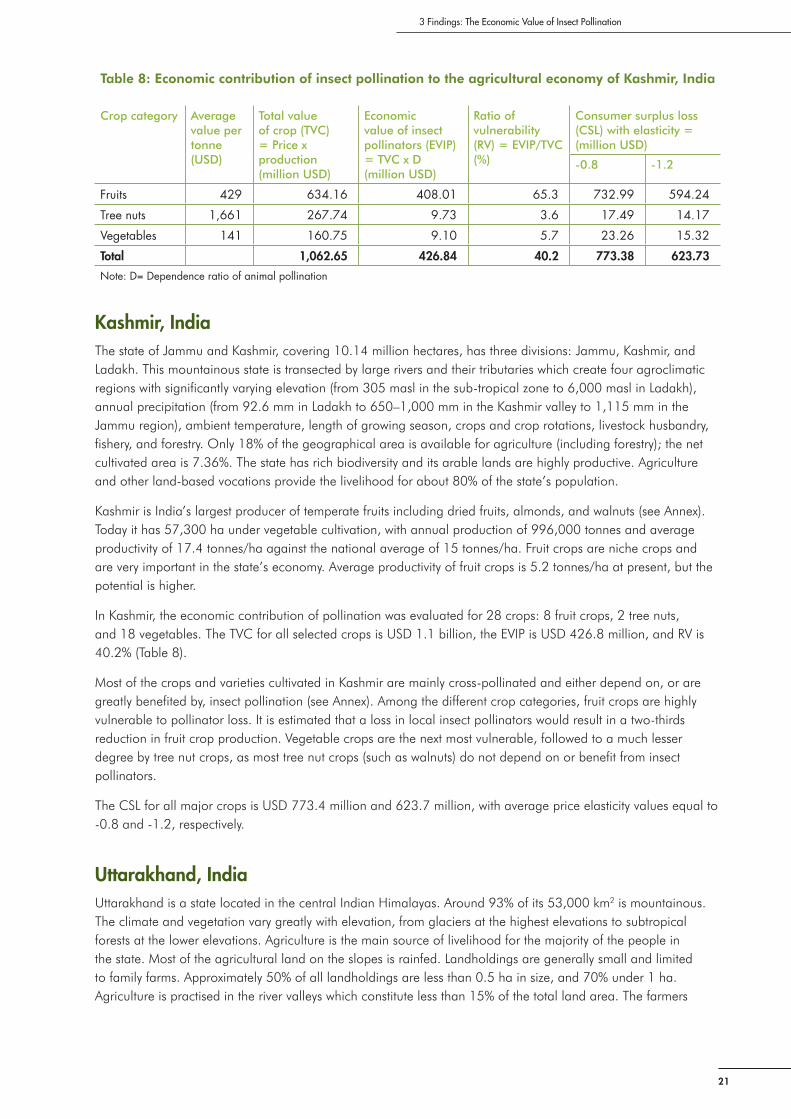
21
3 Findings: The Economic Value of Insect Pollination
Kashmir, IndiaThe state of Jammu and Kashmir, covering 10.14 million hectares, has three divisions: Jammu, Kashmir, and Ladakh. This mountainous state is transected by large rivers and their tributaries which create four agroclimatic regions with significantly varying elevation (from 305 masl in the sub-tropical zone to 6,000 masl in Ladakh), annual precipitation (from 92.6 mm in Ladakh to 650–1,000 mm in the Kashmir valley to 1,115 mm in the Jammu region), ambient temperature, length of growing season, crops and crop rotations, livestock husbandry, fishery, and forestry. Only 18% of the geographical area is available for agriculture (including forestry); the net cultivated area is 7.36%. The state has rich biodiversity and its arable lands are highly productive. Agriculture and other land-based vocations provide the livelihood for about 80% of the state’s population.
Kashmir is India’s largest producer of temperate fruits including dried fruits, almonds, and walnuts (see Annex). Today it has 57,300 ha under vegetable cultivation, with annual production of 996,000 tonnes and average productivity of 17.4 tonnes/ha against the national average of 15 tonnes/ha. Fruit crops are niche crops and are very important in the state’s economy. Average productivity of fruit crops is 5.2 tonnes/ha at present, but the potential is higher.
In Kashmir, the economic contribution of pollination was evaluated for 28 crops: 8 fruit crops, 2 tree nuts, and 18 vegetables. The TVC for all selected crops is USD 1.1 billion, the EVIP is USD 426.8 million, and RV is 40.2% (Table 8).
Most of the crops and varieties cultivated in Kashmir are mainly cross-pollinated and either depend on, or are greatly benefited by, insect pollination (see Annex). Among the different crop categories, fruit crops are highly vulnerable to pollinator loss. It is estimated that a loss in local insect pollinators would result in a two-thirds reduction in fruit crop production. Vegetable crops are the next most vulnerable, followed to a much lesser degree by tree nut crops, as most tree nut crops (such as walnuts) do not depend on or benefit from insect pollinators.
The CSL for all major crops is USD 773.4 million and 623.7 million, with average price elasticity values equal to -0.8 and -1.2, respectively.
Uttarakhand, IndiaUttarakhand is a state located in the central Indian Himalayas. Around 93% of its 53,000 km2 is mountainous. The climate and vegetation vary greatly with elevation, from glaciers at the highest elevations to subtropical forests at the lower elevations. Agriculture is the main source of livelihood for the majority of the people in the state. Most of the agricultural land on the slopes is rainfed. Landholdings are generally small and limited to family farms. Approximately 50% of all landholdings are less than 0.5 ha in size, and 70% under 1 ha. Agriculture is practised in the river valleys which constitute less than 15% of the total land area. The farmers
Table 8: Economic contribution of insect pollination to the agricultural economy of Kashmir, India
Crop category Average value per tonne(USD)
Total value of crop (TVC) = Price x production(million USD)
Economic value of insect pollinators (EVIP) = TVC x D (million USD)
Ratio of vulnerability (RV) = EVIP/TVC(%)
Consumer surplus loss (CSL) with elasticity =(million USD)
-0.8 -1.2
Fruits 429 634.16 408.01 65.3 732.99 594.24
Tree nuts 1,661 267.74 9.73 3.6 17.49 14.17
Vegetables 141 160.75 9.10 5.7 23.26 15.32
Total 1,062.65 426.84 40.2 773.38 623.73
Note: D= Dependence ratio of animal pollination

22
Value of Insect Pollinators to Himalayan Agricultural Economies
largely practise organic manuring, crop rotation, and intercropping. The main crops grown are finger millet (Eleusine coracana), another millet locally called ‘jhingora’ (Echinochloa sp.), and amaranth (Amaranthus polygamous, Amaranthus blitum). On the hillsides, fields are permanently terraced and rainfed and farmers grow millets and amaranth. In the valleys, the major crops are wheat, rice, and sugarcane.
Pulses, e.g., lentils (Ervum lens) and horse gram (Dolichos biflorus), are intercropped during the two harvest seasons. Other crops include dry and wet rice, taro, pumpkin, beans, corn, ginger, chilli, cucumber, leafy vegetables, and tobacco (see Annex). Potatoes are an important cash crop.
In Uttarakhand, the economic contribution of pollination was evaluated for 31 crops: 9 fruit crops, 5 oilseeds, 4 pulses, 4 spices, 1 tree nut, and 8 vegetables. The TVC for all major crops is USD 575.07 million, the EVIP is USD 166.79 million, and the RV is 29% (Table 9).
Most crops, particularly fruit crops, in Uttarakhand are mainly cross-pollinated. Fruit crops in Uttarakhand are highly vulnerable to pollinator loss; it is estimated that a loss in pollinators would reduce fruit crop production to a little more than half. Oilseeds, spices, pulses, and vegetables are also vulnerable, but to a much lesser extent. If the aim is not seed production, vegetable crops are least vulnerable to pollinator loss. The types of tree nut crop cultivated in Uttarakhand do not require insect pollinators to set their fruit.
The CSL for all major crops is USD 292.2 million and 238.7 million, with average price elasticity values equal to -0.8 and -1.2, respectively.
Himalayan Region of PakistanThe Hindu Kush Himalayan region of Pakistan encompasses mainly the northern parts of the country including Khyber Pakhtunkhwa, Gilgit Baltistan, Azad Kashmir, and parts of Balochistan.
About 25% of Pakistan’s total land area is under cultivation. The country has one of the world’s largest irrigated systems. Agriculture accounts for about 23% of gross domestic product (GDP) and employs about 44% of the labour force. Pakistan is one of the world’s largest producers and suppliers of a number of crops (see Annex). It ranks second in production of chickpeas, fourth in apricot, cotton, and sugarcane, fifth in onion, sixth in date palm, seventh in mango, and eighth in the production of various citrus fruits; these crops together account for more than 75% of the value of total crop output. The largest food crop in the country is wheat.
In the Himalayan region of Pakistan, the economic contribution of pollination was evaluated for 25 crops: 10 fruit crops, 10 oilseeds, 1 pulse crop, 2 tree nuts, and 2 vegetables. The TVC for all crops is USD 2.2 billion, the EVIP is USD 954.6 million, and the RV is 44.2% (Table 10).
Table 9: Economic contribution of insect pollination to the agricultural economy of Uttarakhand, India
Crop category Average value per tonne(USD)
Total value of crop (TVC) = price x production(million USD)
Economic value of insect pollination (EVIP) = TVC x D(million USD)
Ratio of vulnerability (RV) = EVIP/TVC(%)
Consumer surplus loss (CSL) with elasticity =(million USD)
-0.8 -1.2
Fruit 572 306.02 159.43 52.1 284.01 230.83
Oilseeds 657 39.37 3.85 9.8 4.55 4.29
Pulses 1,430 37.08 0.79 2.1 0.82 0.81
Spices 1,603 11.83 0.68 5.8 0.59 0.58
Tree nuts 2,458 51.72 0 0 0 0
Vegetables 340 129.05 2.04 1.6 2.27 2.19
Total 575.07 166.79 29.0 292.24 238.7
Note: D= Dependence ratio of animal pollination

23
3 Findings: The Economic Value of Insect Pollination
In the Himalayan region of Pakistan, the vulnerability to pollinator loss is the highest for tree nut crops and fruit crops; one could expect nearly two-thirds loss in total value of tree nut crops and fruit crops with a total loss in local pollinator populations. There was no producers’ price data available for vegetables or spices, so the value for RV and EVIP for these crops was conservatively set at zero. Pulse crops grown in the Himalayan region of Pakistan (beans and peas) are self-pollinated and do not benefit from insect pollination.
The CSL for all major crops is USD 1.7 billion and 1.4 billion, with average price elasticity equal to -0.8 and -1.2, respectively.
Table 10: Economic contribution of insect pollination to the agricultural economy of the Himalayan region of Pakistan
Crop category Average value per tonneUSD
Total value of crop (TVC) = price x production(million USD)
Economic value of insect pollination (EVIP) = TVC x D(million USD)
Ratio of vulnerability (RV) = EVIP/TVC(%)
Consumer surplus loss (CSL) with elasticity =(million USD)
-0.8 -1.2
Fruit 428 1,627.26 879.74 54.1 1,579.86 1,280.95
Oilseeds 351 155.89 38.41 24.6 45.47 42.93
Pulses 347 22.13 0 0 0 0
Tree nuts 1,706 66.93 36.44 54.4 65.49 53.09
Vegetables 162 286.85 0 0 0 0
Total 2,159.06 954.59 44.2 1,690.82 1,376.97
Notes: D= Dependence ratio of animal pollination; the EVIP, RV and CSL for pulses and vegetables has been conservatively set at zero as producers’ price data is not available.

24
Value of Insect Pollinators to Himalayan Agricultural Economies
4 Analysis: Value and Vulnerability
This chapter analyses the findings in Chapter 3 in terms of the direct and indirect value of insect pollination, the vulnerability of the agricultural economy to pollinator loss, the consumer surplus loss, and the cost of alternatives to pollination. This analysis forms the basis of the discussion in Chapter 5 on how to manage insect pollination for mountain agriculture.
Overview of FindingsThe results of the economic evaluation in Chapter 3 indicate that both individual crops and certain crop categories across the HKH region benefit from insect pollination. However, the economic contribution of insect pollinators to crop production varies depending on the pollination requirements of the crop and the dependence of crops on insect pollinators. Fruit crops, oilseed crops, and vegetable crops benefit the most from insect pollination, followed by pulses and tree nuts. However, in some study areas, such as Himalayan region of Pakistan, it is the tree nut crops that depend most on insect pollinators and are thus highly vulnerable to pollinator loss.
The most pollinator-dependent crop categories ranked by decreasing economic value of insect pollination are fruit, vegetables, tree nuts, oilseeds, spices, and pulses in Chittagong Hill Tracts and Bhutan; fruit, vegetables, oilseeds, and spices in the Chinese Himalayan provinces; fruit, vegetables, oilseeds, pulses, tree nuts, and spices in Himachal Pradesh; fruit, oilseeds, vegetables, pulses, spices, and tree nuts in Uttarakhand; and fruit, oilseeds, and tree nuts in the Himalayan region of Pakistan.
For the selected areas in the HKH region as a whole, the most pollinator-dependent crop categories ranked by decreasing economic value of insect pollination are fruit, tree nuts, oilseeds, vegetables, pulses, and spices. Generally, most pulse crops are self-pollinated and depend little on insect pollinators for crop production.
Direct and Indirect Value of Insect PollinationInsect pollinators make a direct economic contribution to different crop categories in the mountains of the HKH (Table 11). They also contribute indirectly to crop and food production. By pollinating various nitrogen-fixing legumes, insect pollinators help to improve soil health by enhancing soil fertility, thereby increasing crop productivity. Similarly, insect pollinators enhance soil fertility through replenishing soil nutrients and help in soil conservation. Through their pollination services, insect pollinators help produce more fruits and more seeds, which produce more plants, adding more biomass to the soil (see Figure 1 in Chapter 1). All of this helps to enhance crop productivity (Partap 2003a,b, 2011). The value of insect pollinators to crop production would be much higher if we take into account their indirect contributions. In the United States and Canada, insect pollinators are reported to enhance the production of animal food products such as beef and dairy products by pollinating forage legumes (Martin 1975, Richards and Kevan 2006).
Of the different crop categories, fruit crops have the highest EVIP in all study areas, estimated at USD 2.3 billion in total. Oilseed crops have the second highest EVIP (USD 233.1 million), followed by vegetable crops (USD 78.5 million). Pulses, tree nut crops, and spice crops have significantly lower EVIP values (Table 11).
The EVIP for pulse crops in the Chittagong Hill Tracts, Chinese Himalayan provinces, and Himalayan region of Pakistan are valued at zero, either because these countries grow pulses that do not benefit at all from insect pollinators or because production figures and producers’ price data were not available so they were conservatively set at zero. The same is true for tree nut crops in the Chinese Himalayan provinces where only walnuts are grown and in Uttarakhand where pecan nuts are grown. Neither of these crops benefits from insect pollination.

25
4 Analysis: Value and Vulnerability
The agricultural economies of the mountain areas studied in the HKH region are based on fruit crops. Farmers grow a variety of fruit crops such as apples, almonds, cherries, peaches, pears, and plums in the hills and valleys and mangoes, litchis, oranges, and guava in the low hills and plains. Most of these crops and varieties benefit greatly from insect pollination (Partap and Partap 2002). Vegetables are the next most important cash crop and are planted in several mountain hills and valleys. However, many of these crops, such as beans, cabbage, cauliflower, garlic, onions, peas, and spinach, do not require insect pollination to produce the parts that we consume. Only vegetable crops such as brinjal, okra, tomato, capsicum, and chillies benefit from insect pollination. But there are vegetables, such as those belonging to the Cucurbitaceae family (including cucumbers, gourds, pumpkins, and squash), that depend entirely on insect pollinators (McGregor 1976, Free 1993, Partap 1999). Insect pollinators are very important in vegetable seed production, but at present there are not many farmers engaged in vegetable seed production in the region. Most pulse crops are self-pollinated and insect pollinators have only a small role in their pollination. Similarly, many tree nut crops (except for almonds) in the region do not require insect pollination for fruit production.
Vulnerability of Agricultural EconomyThe ratio of vulnerability of agricultural crops is highest (44.8%) in Himachal Pradesh, followed closely by the mountain areas of Pakistan (44.2%) and Kashmir (40.2%), and lowest in the Chinese Himalayan provinces (only 6.1%) (Table 12). This indicates that, if there is a total loss of pollinators, the Himalayan region of Pakistan and Himachal Pradesh in India would lose nearly half of their farm production, whereas the Chinese Himalayan provinces would face a loss of only 6% of agricultural production. If these values were to be calculated for the whole HKH region (including Afghanistan, Myanmar, Nepal, and the northeastern Indian Himalayas) they would be much higher.
In the study areas, vegetable crops have the overall highest total crop value but one of the lowest RVs. Fruit crops have the second highest total crop value and the highest RV.
A look at the economic vulnerability ratios of different crop categories indicates that in each area there is a crop category that is highly vulnerable to pollinator loss or decline in pollination services. RV ranges from as high as
Table 11: Economic value of insect pollination in the study areas by crop category (in million USD, with total value of crop in parentheses)
Study areas Fruit crops Oilseed crops
Pulse crops Spice crops
Tree nut crops
Vegetable crops
All crops
Chittagong Hill Tracts, Bangladesh
33.08(186.56)
0.97(5.62)
0(0.40)
0.09(2.26)
3.29(13.96)
16.34(46.37)
53.77(255.17)
Bhutan 10.92 (52.85)
0.82(3.28)
0.31(6.23)
0.67(13.46)
0.96(20.7)
4.20(26.7)
17.88(123.22)
Chinese Himalayan provinces
445.82(915.26)
187.96 (751.84)
0(115.89)
4.03 (80.6)
0(3,134.29)
38.95(6,119.99)
676.76(11,117.87)
Himachal Pradesh, India
354.49(562.74)
1.06(4.49)
1.58(31.53)
0.02(1.36)
0.05(2.87)
7.84(212.14)
365.04(815.13)
Kashmir 408.01(634.16)
– – – 9.73(267.74)
9.10(160.75)
426.84(1,062.65)
Uttarakhand, India 159.43(306.02)
3.85(39.37)
0.79(37.08)
0.68(11.83)
0(51.72)
2.04(129.05)
166.79(575.07)
Himalayan region of Pakistan
879.74(1,627.26)
38.41(155.89)
0a
(22.13)– 36.44
(66.93)–
(286.85)954.59
(2,159.06)
All study areas 2,291.49(4,284.85)
233.07(960.49)
2.68(213.26)
5.49(109.51)
50.47(3,558.21)
78.47(6,981.85)
2,661.67(16,108.17)
Notes: The highest value for EVIP is highlighted in colour and the lowest underlined. For explanation of values set at 0, see text. – = No data.a Crops/varieties entirely self-pollinated.

26
Value of Insect Pollinators to Himalayan Agricultural Economies
65.3% for fruit crops in Kashmir, 63% for fruit crops in Himachal Pradesh, and 54.1% for tree nut crops in the mountain areas of Pakistan to as low as 0.9% for pulses in the Chittagong Hill Tracts (Table 13). This means that the production of fruit crops in Kashmir and Himachal Pradesh could drop to one-third if local populations of insect pollinators were insufficient. The same would happen in the Himalayan region of Pakistan, where production of nut crops could drop to less than half.
Crop vulnerability to pollinator loss varies from area to area and crop to crop. In the Chittagong Hill Tracts vegetable crops have the highest vulnerability ratio (RV = 38.3%), followed by tree nuts (RV = 25.1%), fruit (RV = 19.3%), and oilseeds (RV = 17.3%). In Bhutan, oilseed crops have highest vulnerability ratio (RV = 25%), followed closely by fruits (RV = 20.7%) and vegetables (RV = 15.8%). In the Chinese Himalayan provinces, Himachal Pradesh, Kashmir, and Uttarakhand the vulnerability ratio is highest for fruit crops (RV = 46.4%,
Table 12: Total value of crop, economic value of insect pollination, and ratio of vulnerability in the study areas
Study areas Total value of crop (TVC)(million USD)
Economic value of insect pollination (EVIP)(million USD)
Ratio of vulnerability (RV)(%)
Chittagong Hill Tracts, Bangladesh 255.17 53.77 22.7
Bhutan 123.22 17.88 14.5
Chinese Himalayan provinces 11,117.87 676.76 6.1
Himachal Pradesh, India 815.13 365.04 44.8
Kashmir 1,062.65 426.84 40.2
Uttarakhand, India 575.07 166.79 29.0
Himalayan region of Pakistan 2,159.06 954.59 44.2
All study areas 16,108.17 2,661.67 15.3
Note: Areas with vulnerability ratios of more than 25% are highlighted in colour.
Table 13: Vulnerability ratio for pollinator-dependent crop categories in the study areas (%, with production in parentheses in thousand tonnes)
Study areas Fruit crops Oilseed crops
Pulse crops Spice crops
Tree nut crops
Vegetable crops
All crops
Chittagong Hill Tracts, Bangladesh
19.3(897.96)
17.3(5.46)
0.9(0.66)
4.0(2.72)
25.1(11.5)
38.3(166.38)
22.7
Bhutan 20.7(94.73)
25(4.80)
5(10.27)
5(8.37)
4.6(7.40)
15.8(31.18)
14.5
Chinese Himalayan provinces
46.4(1,612.99)
25(1,020)
0(848.75)
5(30)
0(840)
0.8(21,465)
6.1
Himachal Pradesh, India
63.0(638.38)
23.5(8.68)
5(19.60)
1.6(0.88)
1.9(1.19)
3.7(851.66)
44.8
Kashmir 65.3(1,478.78)
– – – 3.6(161.18)
5.7(1,196.18)
40.2
Uttarakhand, India 52.1(550.35)
9.8(59.97)
2.1(25.93)
5.8(13.99)
0(21.04)
1.6(453.05)
29
Himalayan region of Pakistan
54.1(3,797.81)
24.6(444.45)
0(63.80)
– 54.4(39.24)
0(1,771.35)
44.2
Production, all study areas
9,071.00 1,543.36 969.01 55.96 1,081.55 25,934.80
Notes: The highest values for RV in each study area are highlighted in colour. – = No data.

27
4 Analysis: Value and Vulnerability
63%, 65.3%, and 52.1%, respectively), followed by oilseeds. In the Himalayan region of Pakistan, nuts are most vulnerable (RV = 54.4%), followed by other fruit crops (RV = 54.1%) and oilseed crops (RV = 24.6%). Similar findings are reported for global level agricultural production by Gallai et al. (2009), who found that the vulnerability ratio varied considerably between different crop categories and that there is a positive correlation between the ratio of vulnerability to pollinator decline in a crop category and its value per production unit.
The study findings reveal that agricultural production is highly dependent on pollination (and highly vulnerable to a loss of local pollinators) in the Himalayan region of Pakistan, equally vulnerable in Himachal Pradesh, followed by Uttarakhand, the Chittagong Hill Tracts, and Bhutan, with the Chinese Himalayan provinces being least vulnerable. In the Himalayan region of Pakistan and in Himachal Pradesh and Kashmir in India, crop production would decline by nearly half, and in Uttarakhand, India, by approximately a third in the face of pollinator loss (Table 12). Thus it is important for the governments of these countries to develop appropriate policies and programmes for maintaining an adequate abundance and diversity of pollinators. The EVIP for all study areas is estimated at 15.3% of the total value of crop production, or USD 2.7 billion.
Consumer Surplus LossPollination is an ecosystem service that occurs at the level of a plant community, such as a crop in a field. However, sustaining pollination services depends on the functioning and characteristics of the agroecosystem/ecosystem that provides the food source and the habitat for hibernation and nesting for the pollinators. The primary beneficiaries of pollination services are the farmers, but, at a higher level, beneficiaries also include local and national consumers of pollinated crops (Hein 2009) and the provincial and national governments that have a stake in a healthy agricultural economy. The welfare generated by an ecosystem service such as pollination is determined by the weighted utility gained by all individuals as a result of that particular ecosystem service (Hein 2009). This welfare resulting from the supply of an ecosystem service depends upon the generated consumer and producer surpluses (Box 5) (Freeman 1993).
With regard to consumer surplus, where the farmer is producing for the international market, a local loss of pollination services will generally not lead to a change in food prices or affect the consumer surplus. However, local consumers may be affected, particularly if the markets are relatively isolated or if the production of specific local varieties is affected. If pollination services decline on a larger scale (national or continental) – for example,
Box 5: The concept of consumer and producer surpluses
Consumer surplus
Consumer surplus has been defined as “the excess of the price which the consumer would be willing to pay rather than to go without the thing, over that what s/he actually pays” (Willig 1976). The consumer surplus generated by an ecosystem service equals the aggregated utility gained by all consumers of the service minus the aggregated cost or effort involved in obtaining the ecosystem service (Hueting 1980).
Producer surplus
Producer surplus is the amount of economic benefit a producer gains at a certain production level and for a certain market price (van Kooten 1993). In the short term, the producer surplus can be approximated on the basis of the difference between the gross revenue received by the producer and his/her production costs (Varian 1993). In general, in the valuation of ecosystem services, the producer surplus needs to be considered if there are costs related to harvesting or processing the ecosystem good or service, or the ecosystem service is used as input in a production process (Hueting et al. 1998).
The concept of consumer and producer surplus, and how they depend on the demand and supply curve, indicates that a decline in pollination services will reduce agricultural production. This means that farmers will obtain a lower harvest at a relatively higher production cost. Consequently, food prices will be higher and the quantity traded in market will be less. This leads to a decline in consumer surplus. Changes in producer surplus are moderated by the fact that producers are generally not all affected by a decline in pollination services and may benefit by obtaining a higher price for their crops.
Source: Hein 2009

28
Value of Insect Pollinators to Himalayan Agricultural Economies
if there is a total loss of pollinators – there will be fewer alternative sources of supply and price effects become likely. Consequently, larger-scale ecological impacts are increasingly likely to result in price effects and are likely to affect consumer surpluses (Hein 2009). With regards to the producer surplus generated by pollination services, it is clear that local farmers will experience a cost when they (partly) lose pollination in their fields. This cost may relate to reduced production, the need to switch over to alternative crops with lower returns or requiring new investments, or, in extreme cases, the carrying out of pollination by other means such as hand pollination or using managed colonies of honeybees (Eardley et al. 2006; Partap and Partap 2002; Partap et al. 2001). If other producers are able to supply the same crop, they may benefit from higher market prices resulting from the increasing scarcity of the crop. Hence their gain may partly compensate for the loss to producers elsewhere. This price impact has to be accounted for when the pollination services are affected on a larger scale (province or country).
The present study also looks at what would happen to crop production and markets after a decline of pollinators where pollination is necessary to crops. The first consequence would be a decrease in production for the same inputs and effort. This would mean that the cost of production of crops per unit would increase. This would result in a decrease in the consumer surplus loss. Gallai et al. (2009) developed a formula to calculate the consumer surplus loss. Using this formula, the consumer surplus loss for individual crops and crop categories was calculated using price elasticity values -0.8 and -1.2 for the different study areas and for study areas of the HKH region as a whole. Using this formula the CSL was estimated for individual crops and crop categories. The values by category are given in Table 14, and those for individual crops are given in the Annex.
The results are as expected: CSL values are higher with average price elasticity value -0.8 and lower at elasticity value -1.2 for all crops (Table 14). The values further depend on the total crop production and their dependence on insect pollinators. For the Chittagong Hills Tracts, at elasticity value of -0.8 the highest value of CSL is for fruit crops and the lowest for pulses. For Bhutan, the highest value of CSL is for vegetable crops, the second highest for fruit crops, and the lowest for pulses at -0.8 elasticity. This could be because Bhutan grows many cucurbitaceous vegetable crops (such as pumpkins, squash, and cucumbers), which are entirely dependent on insect pollinators. Similarly, in the study areas of the Chinese Himalayan provinces, the highest CSL value is for fruit crops and the lowest for pulses and tree nut crops (nil for both). The CSL for spices is also very low. In the case of the Indian Himalayas and the mountain areas of Pakistan, the highest CSL values are for fruit crops.
Table 14: Consumer surplus loss from pollinator decline (with values of elasticity at -0.8 and -1.2)
Study area Consumer surplus loss (in million USD)(values with elasticity –1.2 are given in parenthesis)
Fruit crops Oilseed crops
Pulses Spices crops
Tree nut crops
Vegetable crops
All crops
Chittagong Hill Tracts, Bangladesh
58.39(47.91)
1.34 (1.08)
0(0.004)
0.093(0.092)
3.91(3.61)
57.65(33.66)
121.39(86.36)
Bhutan 18.29(15.15)
0.97(0.92)
0.32(0.32)
0.69(0.69)
0.99(0.98)
13.86(8.35)
35.12(26.41)
Chinese Himalayan provinces
795.79(646.38)
222.63(210.19)
0 4.16(4.11)
0 41.88(40.85)
1,064.46(901.53)
Himachal Pradesh, India
636.7(516.14)
1.25(1.18)
1.63(1.61)
0.023(0.023)
0.10(0.08)
8.5(8.27)
648.2(527.3)
Kashmir 732.99(594.24)
– – – 17.49(14.17)
23.26(15.32)
773.38(623.73)
Uttarakhand, India 284.01(230.83)
4.55(4.29)
0.82(0.81)
0.59(0.58)
0 2.27(2.19)
292.24(238.7)
Himalayan region of Pakistan
1,579.9(1,280.9)
45.47(42.93)
0 -– 65.50(53.1)
0 1,690.80(1,376.97)
All study areas 3,968.5(3,219.6)
275.8(260.5)
2.8(2.8)
5.6(5.5)
88.2(72.13)
147.42(108.64)
4,625.59(3,780.9)
Note: The highest value for CSL for each country is highlighted in colour, while the lowest is underlined.

29
4 Analysis: Value and Vulnerability
The lowest CSL values in Himachal Pradesh and Uttarakhand are for tree nut crops. In the Himalayan region of Pakistan, the lowest value (zero) is for spices and vegetable crops, but this is because of the lack of producers’ price data for these crops in Pakistan. For all study areas together, the CSL value is highest for fruit crops followed by oilseed, vegetable, tree nut and pulses crops, and lowest is for spices at the elasticity value of -0.8.
Cost of Alternatives to PollinatorsThe present study also looks at the opportunity cost of using alternatives to pollinators. The opportunity cost of using alternatives to pollinators depends on price elasticity values (see definitions of price elasticity of demand and price elasticity of supply in Chapter 2). Assuming that price elasticity values are constant for all crops, Gallai and Vaissière (2009) used price elasticity values of -0.8 and -1.2 to calculate CSL values.
If the elasticity value is low, the opportunity cost of switching to alternatives is high (Hein 2009). Alternatives to pollination include hand pollination, managed pollination, and even changing the type of crop planted, which can have a high cost. In the study areas in the HKH region, fruit farming dominates. The majority of the fruit crops in the region require cross-pollination by insect pollinators. The opportunity cost of using alternatives can be very high to farmers and the agricultural economies of these areas.
The opportunity cost can be area specific – in some areas it may be low, while in other areas it may be very high – because pollinator populations (types and abundance) are different in different areas. And there could be a differential decline in pollinator populations in different areas. For example, in intensively cultivated cash crop areas where the use of agrochemicals, particularly pesticides, is high, such as in apple farming areas of Himachal Pradesh, Maoxian County, China, and the Himalayan region of Pakistan, pollinator decline is also high (Partap and Partap 2001, 2002; Partap et al. 2001) compared to areas where traditional mixed-crop subsistence agriculture is practised. In areas where apple farming is extensive, farmers may have to arrange the supply of insect pollinators by renting or buying honeybee colonies or hiring skilled labour services for the hand pollination of apple crops. Obviously, the cost of these alternatives is higher than natural pollination services by insect pollinators. A few examples of alternatives are the use of honeybees for managed pollination in Himachal Pradesh and the use of human labour used for pollination in Maoxian, China. In some areas, such as in Balochistan, farming is limited to a few valleys that are surrounded by large areas of rangelands, pastures, and forests, which provide habitat for insect pollinators. These areas help maintain high populations of pollinators during the active season (Partap and Partap 2001, 2002). As an initial step towards the conservation and management of insect pollinators, local farmers and governments should maintain these areas as nature reserves; this may be less costly than buying or renting pollinators or replacing crops.
The findings of this study reveal that the pollination services provided by insect pollinators are an essential input to maintain or enhance production in mountain agriculture. The economic value of insect pollinators to the agricultural productivity of major mountain crops is enormous. The loss of pollinators would represent a significant economic loss to the mountain economies. If there is a total loss of pollinators, every year farmers would lose an estimated USD 53.77 million in the Chittagong Hill Tracts, USD 17.88 million in Bhutan, USD 676.76 million in the Chinese Himalayan provinces, USD 365.04 million in Himachal Pradesh, USD 426.84 million in Kashmir, USD 166.79 million in Uttarakhand, and USD 954.59 million in the Himalayan region of Pakistan (see tables in Chapter 3). Collectively, the mountain farmers in the study areas would incur a loss of USD 2.66 billion dollars every year in relation to the major crops cultivated.

30
Value of Insect Pollinators to Himalayan Agricultural Economies
5 Managing Insect Pollination for Mountain Agriculture
In view of the indispensable role of pollinators in enhancing crop productivity and their enormous economic contribution to the agricultural economy, efforts must be made at the research, extension, and policy level to conserve pollinators and protect them from the harmful impact of various agrochemicals and other factors causing their decline. Such efforts are necessary to maintain the continuous supply of pollination services to agriculture. This chapter outlines some of the areas needing attention.
Small Farmers’ Dependence on PollinationOver 80% of rural people in the HKH region depend on agriculture for their livelihoods. As many as 90% of the farmers in this region cultivate less than 1 ha of land each (Partap and Partap 1997). Governments face challenges in improving the livelihoods of poor mountain farmers. Therefore, everything contributing to agriculture production needs to be tapped to enhance production and income. Pollination is a key factor in mountain agricultural production in the study areas, but its value as an essential input has not receive sufficient attention. This calls for new thinking by mountain farmers and provincial and national government agencies concerned with agriculture and horticulture in the HKH region.
Farmers in the region have traditionally cultivated cereal crops such as wheat, rice, and maize; millet and pseudo millet such as finger millet, buckwheat, and amaranth; pulses such as butter beans (rajmah beans), black gram, soybeans, and peas; vegetable crops such as potatoes; oilseed crops such as mustard and sesame; and spices such as coriander, fenugreek, and chillies. However, mountain agriculture does not have the comparative advantages of the plains in terms of cultivating food crops (Jodha and Shrestha 1993; Partap 1998). To take advantage of mountain niche opportunities farmers are growing a variety of fruit crops such as apples, peaches, pears, plums, almonds, apricots, grapes, and cherries and seasonal and off-seasonal vegetables such as peas, tomatoes, cabbages, cauliflower, okra, brinjal, carrots, onion, garlic, chillies, and cardamom, which generate cash income for farmers.
Many varieties of these fruit and vegetables are self-sterile and require cross-pollination to produce fruit or seeds. Many produce sticky pollen grains that need a pollinator to transfer them from one flower to another. Therefore, pollinators play an essential role in enhancing the production and quality of these mountain crops. However, crops vary in their pollination requirements. Roots and tubers such as carrots, potatoes, radishes, and turnips do not require insect pollination for the production of their edible parts, but do need insect pollination for seed production. Pollinators are also not required for the production of the edible parts of vegetable crops such as cabbages, cauliflowers, garlic, leeks, lettuce, onions, and spinach, but they are needed for seed production. Cucurbitaceous vegetables such as cucumber, gourds, pumpkin, and squash need cross-pollination by bees or other insects to produce fruit (the parts that we eat). Other vegetables such as brinjal, chillies, and okra greatly benefit from insect pollination. Many pulse crops are self-pollinated, although there are reports that some of these crops benefit from insect pollination (McGregor 1976; Free 1993; Partap 1999). Oilseed and spice crops also benefit greatly from insect pollination. In the case of tree nut crops, insect pollinators play an important role in the pollination of almonds and a moderate role in the pollination of areca nuts and chestnuts, while pecan nuts, pine nuts, and walnuts are mainly wind pollinated and do not benefit from insect pollination.
Research NeedsUnderstand the causes of pollinator decline
Clear-cut evidence as to the main factors contributing to insect pollinator decline in the mountain areas of the HKH is lacking. Research is needed to monitor the decline in pollinator populations and identify and understand

31
5 Managing Insect Pollination for Mountain Agriculture
the factors causing this decline in the HKH region. A good understanding of each of these factors is required to develop meaningful strategies for managing insect pollination for mountain agricultural development. For example, if loss of habitat resulting from conversion of forest areas into farmland is identified as a cause of pollinator decline, then the need will be to evolve institutional interventions that discourage farming on forests and grasslands. There are examples of such affirmative action within the HKH region. Since 1999, provincial governments in Sichuan and Yunnan provinces in China have been encouraging farmers to convert their croplands back to forest and grassland, with great success. This will help to restore pollinator populations and improve the ecological conditions in the area. However, if the cause of pollinator decline is overuse of pesticides/insecticides, then it is imperative to invest in developing alternative methods of pest control, such as organic agriculture practices.
Assess the ecological and economic value of pollinators
A recent analysis of global inventories of biodiversity by Buchmann and Nabhan (1996) and Ingram et al. (2003) indicated that more than 100,000 different animal species play a role in pollinating over 250,000 species of flowering plants on this planet. In addition to bees, wasps, moths, butterflies, flies, beetles, and other invertebrates, and perhaps 1,500 species of vertebrates such as birds and mammals, serve as pollinators. Hummingbirds are the best-known wildlife pollinators in the Americas, but perching birds, flying foxes, fruit bats, possums, and lemurs also function as effective pollinators. How many of these are reliable and effective pollinators is not known (Buchmann and Nabhan 1996). Little information is available in the HKH region about the types of pollinators and their importance in the pollination of agricultural crops. Therefore, an assessment of the status of pollinator populations in the HKH and their economic and ecological importance is a priority research area.
Economic assessments indicate that the value of honeybee pollination in enhancing crop yields through cross-pollination is much higher than their value as producers of honey and beeswax. For example, Morse and Calderone (2001) estimated the annual value of honeybee pollination in the United States at USD 14.6 billion. Similar annual estimates have been made for other countries: e.g., USD 1.2 billion for Canada (Winston and Scott 1984), USD 3 billion for the European Union (Williams 1992), USD 2.3 billion for New Zealand (Matheson and Schrader 1987), and USD 150 million for the United Kingdom (Carreck and Williams 1998). Cadoret (1992) estimated the direct annual contribution of honeybee pollination to farm production in 20 Mediterranean countries at USD 5.2 billion. In the HKH region, such estimates of the economic value of honeybee pollination have only been made for China for four crops, namely rapeseed, cotton, sunflower seeds, and tea, and the annual value of pollination to these crops has been estimated to be more than 6 billion yuan (USD 0.7 billion), which is six to seven times more than the income from bee products (Chen 1993).
Pimentel et al. (1997), Richards (1993), and Gallai et al. (2009) have estimated the value of insect pollination services at the global level to be approximately USD 200 billion.
Such studies are necessary to enhance our understanding of the economic importance of pollinators. Continuous monitoring of the decline in pollinator populations and assessment of the ecological and economic impact of this decline is necessary to maintain their populations and ensure the provision of sustained pollination services to agricultural systems.
Development of Pollination Enterprises and Extension ServicesAwareness and understanding of the value of pollination services provided by pollinators can help make agriculture more sustainable and improve the productivity of agricultural ecosystems (Eardley et al. 2006). Globally, two scenarios exist: In developed countries such as North America, Europe, and Japan, where farmers and concerned agencies are well informed about the importance of pollinators and the pollination services they render to crops and other plants, bees are used extensively to pollinate fruit and vegetable crops. Pollination in these countries is considered as one of the inputs to agriculture and well-organized systems are in place for renting/buying honeybees or other manageable bees for pollination.

32
Value of Insect Pollinators to Himalayan Agricultural Economies
The second scenario is that of the developing world, including the mountain areas of the HKH, where farmers and concerned agencies have little knowledge of the value of pollinators and pollination services to agriculture. Those who possess some knowledge about pollinators think that honeybees are the only insect species that pollinate crops. Honeybees are mainly known as producers of honey, not as pollinators. There are rare examples of managed pollination systems in orchards. In Himachal Pradesh in India less than 5% of apple farmers use colonies of honeybees for the pollination of apples. The rearing and managing of other pollinators is not even considered and farmers are unaware of the role of other insects in crop pollination. This could be because there has never been institutional efforts in these countries to promote the role of pollinators and pollination in crop production. The production and use of insects for pollination services, other than hive bees, would require major research and extension efforts.
There are only a few institutions in the HKH region with an explicit mandate for, or expertise in, research and extension in pollination. Most institutions work only with beekeeping and promote it as a cottage industry to increase family income through the sale of honey. Promoting honeybees as reliable pollinators and maintaining populations and the diversity of other pollinators requires a special effort to strengthen research and extension systems. In Himachal Pradesh, where honeybees are being used for apple pollination, only a few beekeepers rent colonies of honeybees to farmers for pollination and the number of colonies available for pollination is limited; the requirement for bee colonies is about 250,000 colonies every year, but less than 10,000 colonies (4%) are available for pollination. Hence, there is huge scope for the development of pollination enterprises in the state.
Maintaining, Managing, and Conserving PollinatorsThere are many species of pollinators (such as honeybees, bumble-bees, flies, butterflies, beetles, wasps, birds, bats, and mammals) that play an important role in the pollination of various crops and other plants. Today, agricultural activities are contributing to a decline in the abundance and diversity of these pollinators. Pollination services have been taken for granted. Farmers use pesticides and other harmful agrochemicals liberally, without realizing that these pesticides kill pollinators and the natural enemies of various pests.
The production and supply of insect pollinators would promote their wider use. Pollination as an input to agricultural production remains a missing dimension in agriculture research and development strategies in the HKH. Farmers and governments will need to make a collective effort to strengthen pollinator supply chains, and maintain, manage, and conserve native pollinators. As pollinators add value to agricultural production – both in terms of yield and the quality of produce – pollinators should be considered a commodity, or an essential agricultural input. Developed countries have established supply chains of these pollinators; companies produce or rear insect pollinators and supply them to farmers, who pay to use them for pollination services.
After identifying potential pollinator species and the causes of their decline, it is essential to devise appropriate strategies for their conservation. For example, the Himalayan cliff bee (Apis laboriosa) is a valuable pollinator of high mountain crops and other plants. Populations of this bee are threatened by the increase in honey hunting and promotion of honey-hunting based tourism (Ahmad et al. 2003). To save this pollinator species and maintain its populations, there is need for awareness and other institutional efforts (regulatory mechanisms/incentives) to discourage honey hunting and the overharvesting of nests for recreation. Conservation efforts should focus on addressing the factors responsible for their decline. Similarly, beekeeping with Apis cerana is a common tradition in many mountain communities. This bee is indigenous to the region, produces a good amount of honey, and pollinates various crops and other plants. Apis cerana is excellent pollinator of early blooming mountain crops (Partap and Verma 1992, 1994; Verma and Partap 1993, 1994; Partap and Partap 1997; Sharma and Partap 2010). However, the populations of this bee have been threatened in several mountain areas as a result of the introduction of exotic Apis mellifera. Strategies for the conservation and promotion of Apis cerana may require developing regulatory mechanisms to demarcate beekeeping zones: plains and low hill areas for beekeeping with Apis mellifera, and mountain areas for Apis cerana (Partap 1999; Ahmad et al. 2002).

33
5 Managing Insect Pollination for Mountain Agriculture
There is also good scope and potential for the conservation and use of non-Apis pollinators in the countries of the HKH region. A variety of crops are grown in different areas and they need different pollinators. For example, in the Chittagong Hill Tracts of Bangladesh and in Bhutan cucurbit crops such as cucumbers, pumpkins, and squashes, and various gourds such as bitter gourd, bottle gourd, snake gourd, teasel gourd, pumpkin, and squash are cultivated. These crops require insect pollinators for fruit production. There are areas in the Chittagong Hill Tracts and Bhutan where pollinators exist, nest, hibernate, and source food. The need is to identify potential pollinators, their habitats, and food sources, and take appropriate initiatives to conserve and maintain their populations in these habitats. One way of achieving this is by adopting pollinator-friendly agricultural practices, such as leaving space around fields and orchards for nesting and food sources for pollinators, and using alternative methods of pest control. This would help conserve pollinators while also enhancing agricultural productivity through their pollination services – a win-win situation.
Maintaining and managing non-honeybee pollinators such as bumble-bees and solitary bees could be another way of ensuring the pollination of crops in cold and arid areas. In general, interventions that help conserve pollinators include conserving and restoring habitat, protecting forest areas, rehabilitating degraded lands through afforestation, managing plants preferred by pollinators, promoting mixed farming systems including bee plants in various forestry and other plantation programmes, encouraging integrated pest management, and discouraging the use of pesticides. Raising awareness about the importance of pollinators and educating and training communities in conservation practices may also be required. At the same time, bringing conservation and development organizations (government and non-governmental organizations and community-based organizations) together in a common platform to formulate strategies and action plans is also necessary (Figure 2). A balance between policy formulation and conservation action would yield better results. Intensively cultivated areas may need ready solutions such as the promotion of manageable pollinators such as honeybees and stingless bees.
Figure 2: Integrating services of insect pollinators into agricultural economy
Raise awareness and influence thinking
Integrate pollinator concerns into policies
Develop human resources and build capacity
Promote honeybees for managed pollination
Enhanced yield and quality of agricultural produce
Strong pollination services to agriculture
Improved pollination of natural flora
Mainstream pollinator concerns into research and development
Integration of pollination into
agriculture
Improved food security and income of
farmers
Enhanced populations of
pollinators1. Invest in creating an enabling
environment for wider use of indigenous insect pollinators.
2. Promote the judicious use of pesticides to avoid mass killing of insect pollinators.
3. Conserve habitat for nesting and food sources for pollinators in all seasons.
Diverse and healthy habitats for insect pollinators
Develop strategies to maintain diversity and abundance of pollinators for better pollination services to agriculture

34
Value of Insect Pollinators to Himalayan Agricultural Economies
Promoting the Use of Manageable Species For areas where there are declining pollinator numbers, the use of manageable species of honeybees, bumble-bees, solitary bees, and stingless bees may be the easiest and most readily available way to ensure crop pollination, especially of cash crops. Although only 15% of the world’s principal food crops are pollinated by manageable bee species (e.g., honeybees, bumble-bees, alfalfa leaf cutter bees, and alkali bees), these crops make an immense contribution to food security and improved livelihoods through cash income.
Promoting manageable species of pollinators such as honeybees is important in areas where it is difficult to restore or revive natural pollinator populations. In the HKH region this situation exists in Himachal Pradesh, Maoxian County in Sichuan Province of China, the mountain areas of Pakistan, and Afghanistan. Here farmers have extended their orchards to nearby forest and grasslands leaving little or no space for pollinators to nest and hibernate. In valleys, vegetable farming dominates. Farmers make excessive use of pesticides in both fruit and vegetable crops, leading to pollinator decline. More research needs to be conducted in this area.
Honeybees
Among the different species of manageable bees, honeybees are the most efficient pollinators of cultivated crops (Box 6). This is because their body parts are especially modified to pick up pollen grains, they can work for long hours, show flower constancy, and are adapted to different climates (McGregor 1976; Free 1993). Most importantly, some honeybee species can be managed and transported to fields to pollinate crops. Beekeeping is a tradition in several areas as keeping honeybees also produces honey and other bee products. The technology for managing honeybees and for the production of honey and pollination is available in the HKH region.
Several studies have been undertaken to show the impact of honeybees, particularly Apis cerana, in enhancing the productivity levels of various crops such as fruits and nuts, vegetables, pulses, oilseeds, spices, and fibre and forage crops. These studies have shown that the quality of pollination is determined by the number of colonies per unit of area, strength of the bee colonies, placement of colonies in the field, time of placement of the bee colonies, and weather conditions. Pilot studies have shown that the best results are achieved by placing strong bee colonies free of disease with large amounts of unsealed brood when the crop is at 5 to 10% flowering (Free 1993; Verma and Partap 1993).
Research has shown that honeybee pollination has increased the yield and quality of apples in the Shimla hills of Himachal Pradesh (Dulta and Verma 1987; Gupta et al. 1993, 2000), of peach, plum, citrus, and strawberries in the Kathmandu valley of Nepal (Partap 2000a, 2000b, 2011; Partap et al. 2000; Sharma et al. 2010), and kiwi fruit in the Shimla hills of Himachal Pradesh, India (Gupta et al. 2000). These studies also found that honeybee pollination increased fruit set and reduced fruit drop in apple, peach, plum, and citrus crops. The results further showed an increase in the fruit juice and sugar content in citrus and a reduction in the percentage of misshapen fruit in strawberries. Studies conducted in the Kathmandu valley of Nepal have shown that honeybee pollination enhances seed production and the quality of seed in vegetable crops such as cabbage, cauliflower, radish, broadleaf mustard, and lettuce (Partap and Verma 1992, 1994; Verma and Partap 1993, 1994). When pollinated by Apis cerana, these crops produced more and heavier seeds, with a higher percentage of germination than the control plants. These results confirm the role of bees in increasing crop productivity and improving the quality of fruit and seeds. Other studies have confirmed that bee pollination improves the yield and quality of other fruit, vegetable, oilseed, and spice crops including asparagus, carrots, onions, and turnips (Deodikar and Suryanarayana 1977; Free 1993; McGregor 1976). Honeybee pollination has been reported to increase seed production in oilseed, rapeseed, and sunflower seed, as well as the oil
Box 6: Pollination role of honeybees
Pollination by honeybees increases crop yield and the quality of various fruit and vegetables. It increases fruit and seed set, enhances the quality of fruit (shape, size, weight, colour, and taste) and seeds, and reduces premature fruit drop. It has been reported that the main significance of honeybees and beekeeping is pollination; hive products are of secondary value. This needs to be valued in economic terms to encourage the development of policies and plans for integrating pollination into agricultural policies and practices.

35
5 Managing Insect Pollination for Mountain Agriculture
content in the seed, in Manipur, India (Singh et. al. 2000). In other crops, such as buckwheat, soybean, and cotton, production increased from 23.8% to 77.7% (Kozin 1976).
Bumble-bees and solitary bees
Bumblebees and solitary bees are the other types of bees receiving research and development attention for managed pollination. These bees are suitable and efficient pollinators of some crops that are not as efficiently pollinated by honeybees. Bumblebees are efficient pollinators of potatoes, tomatoes, strawberries, and other crops grown in greenhouses, whereas solitary bees such as alkali bees and alfalfa leaf-cutter bees pollinate alfalfa much more efficiently than honeybees.
Many species of bumble-bee (Bombus spp.) and solitary bees – Amegilla, Andrena, Anthophora, Ceratina, Halictus, Lasioglossum (Evylaeus), Megachile, Nomia, Osmia, Pithis, and Xylocopa species – can be reared on a large scale and managed for crop pollination. The technology to rear and manage them for pollination has been developed and, in many developed countries, bumble-bees and solitary bees are being reared and managed commercially to pollinate various crops. There are companies in Europe, Canada, and the United States that rear these bees on a commercial scale and sell them to farmers for the pollination of crops (Partap and Partap 1997, 2000). In Japan, the solitary bee Osmia cornifrons is being reared and managed on a large scale to pollinate about 30% of the country’s apple crops (Sekita 2001). Many species of bumble-bee are being reared and managed commercially to pollinate crops such as potatoes, tomatoes, strawberries, and other crops grown in greenhouses in Europe and North America.
Even though both the need and potential exist, the practice of rearing and managing natural pollinators is virtually absent in developing countries, because most institutions do not have the mandate or necessary expertise in this field. A research group in Dr YS Parmar University of Horticulture and Forestry, Solan, Himachal Pradesh recently initiated research on rearing and managing bumble-bees for crop pollination (Thakur and Kashyap 2010; Chauhan and Thakur 2010). The development and use of these insects in the region will take a long time. Unless research efforts are supported, rearing and managing non-Apis insect pollinators for pollination will be difficult.
Stingless bees
Stingless bees (species of Melipona and Trigona) are also being kept in hives for honey production. In the HKH region, species of the stingless bee, Trigona, occur in the Eastern Himalayas and beekeeping with these bees is a common practice in the northeastern Indian Himalayas, Bhutan, and parts of Nepal. There is potential to study the pollination role of these bees and promote them for the pollination of agricultural crops. Stingless bees are important pollinators of various fruit, vegetables, and other tropical crops including sugar apple (custard apple), papaya, citrus, mango, guava, melons, pumpkins, sweet potato, cassava, chayote, coffee, cocoa, and macadamia nut. Although quantitative data on the impact of pollination by stingless bees is scarce, there is information that these bees are very efficient and effective pollinators of crops grown in the open and in greenhouses. Vithanage (1986) reported that in Australia, native species of Trigona are more effective pollinators of macadamia than Apis mellifera. However, research and development efforts are needed to mainstream the use of stingless bees as pollinators of mountain agricultural systems in the HKH region.
Institutional Aspects The economic and ecological importance of pollinators, the issue of their decline, and ways to maintain them have not been brought into the mainstream of research and development efforts. The general public is ignorant of the significance of insect pollinators. Governments and policy makers in the region have given no recognition to the value of pollinators. Pollination has been overlooked in agricultural development strategies and is not included as a technological input in agricultural development plans. To effectively address this, it is necessary to bring pollinator concerns to the mainstream of research and development. As pollination is essential for the production of fruit and seeds, crop pollination management should be included in agricultural development

36
Value of Insect Pollinators to Himalayan Agricultural Economies
plans in the region. It is possible to achieve this by creating an enabling environment for the integration of pollination as an essential input to agriculture. Changes in research and development investment policies may be needed to encourage this. This will also mean developing area-based approaches and making full use of the existing diversity of pollinators including honeybees.
Replicating Success Stories: The Role of Regional and International OrganizationsThe developed countries of the world have a lot of knowledge about pollinators and pollination. The United States, Japan, Canada, and Europe have developed knowledge and experience in rearing and using different species of bees for the pollination of crops. They have developed technologies for rearing various pollinators and have companies that rear and sell these pollinators. However, developing countries, including the countries in the HKH region, lag far behind in using even honeybees for pollination. The experience and success stories of developed countries can be collected, tested, and replicated in developing countries. For this, there is a need to gather information on success stories in the conservation of pollinators and their management and use in developed countries for replication in developing countries. A variety of institutions can play a meaningful role in this transfer of knowledge and information.
International organizations like FAO, the Consultative Group on International Agricultural Research (CGIAR), International Union for Conservation of Nature (IUCN), United Nations Development Programme (UNDP), and the United Nations Environment Programme (UNEP) are well positioned to play an important role in the transfer of knowledge and expertise for institutional capacity building in developing countries. Organizations like FAO and UNDP are particularly well positioned for this purpose because of their focus on development issues and the fact that they work through governments and institutions in the field. CGIAR centres can also play a major role by supporting national agricultural research systems (NARS) to conduct collaborative research on ways to maintain the level of pollinator abundance and diversity required for the pollination of target crops. Recognizing the urgent need to address the worldwide decline of pollinator diversity, FAO has taken the lead by facilitating and coordinating the International Pollinator Initiative (IPI), established by the Convention on Biological Diversity in close cooperation with national governments and other relevant organizations. In partnership with the Global Environment Facility (GEF)-UNEP and government institutions, FAO has recently started implementing a global project to identify ways to promote the conservation and sustainable use of pollinators.
ICIMOD has been involved in pollination research in the HKH region for the past decade – reviewing pollination issues, conducting case studies, documenting and disseminating information on pollination problems, and promoting good management practices across the HKH region. Further efforts in institutional capacity building for promoting the wider use of pollination services and the conservation of insect pollinators in the region would be a step in the right direction.
Keeping in mind the differences in farming systems, environment, and pollinators in different regions, the International Pollinator Initiative of FAO has created regional initiatives for the purpose of sharing knowledge and experience. Some examples of these Regional Pollinator Initiatives (RPIs) are the African Pollinator Initiative (API), Brazilian Pollinator Initiative (BPI), and European Pollinator Initiative (EPI). In view of the rapid decline in pollinator populations worldwide there is need for similar initiatives in other areas. Organizations like ICIMOD could lead the way in establishing a Hindu Kush Himalayan Pollinator Initiative (HKH-PI).
Conclusion and Key FindingsThe continuing decline in pollinators (both in number and diversity) is a major concern in the HKH region. It presents a serious threat to agricultural production, the livelihoods of mountain farmers, mountain and national agricultural economies, and food security. It is hoped that the findings of the study will help in promoting the use of honeybees for pollination in the HKH region and in formulating policies for the conservation of pollinators and the integration of pollination as an essential input to agriculture. The key findings of the study are summarized here:

37
5 Managing Insect Pollination for Mountain Agriculture
� The economic value of insect pollinators to agricultural productivity for the major crops cultivated in the study areas in the HKH region is an enormous USD 2.7 billion every year: USD 53.8 million in the Chittagong Hill Tracts, USD 17.9 million in Bhutan, USD 676.76 million in the four Chinese Himalayan provinces, USD 365 million in Himachal Pradesh, USD 426.8 in Kashmir, USD 166.8 million in Uttarakhand, and USD 954.6 million in the mountain areas of Pakistan. The regional value could be twice as high as this if Afghanistan, the northeastern Indian states, Myanmar, and Nepal were included and data were available for all insect-pollinated crops cultivated in the region.
� Insect pollinators also provide indirect benefits; they enhance soil fertility and soil conservation by pollinating various nitrogen fixing legumes and replenishing soil nutrients, thus increasing the productivity of various crops. If these indirect benefits are taken into account, the total value of insect pollinators to crop production is even higher.
� The decline in pollinator population numbers and diversity is reducing agricultural productivity. There are examples in Himachal Pradesh, the mountain areas of Pakistan, and parts of the Chinese Himalayan provinces where, despite all agronomic inputs, the production of fruit crops such as apples, almonds, cherries, and pears is declining. Farmers in Maoxian County, China, are forced to pollinate their apple and pear trees by hand, a high-cost alternative.
The findings point to a need for more research on pollinators and their value. This will improve our understanding of the economic value of insect pollinators and the vulnerability of agricultural economies to loss of pollinators. It will also raise awareness among farmers, land managers, academic institutions, policy makers, and governments of the need to include crop pollination management in agricultural development plans in the region, and for the development of pollination enterprises to provide managed bee colonies for crop pollination. Regional and international institutions also have a role to play in replicating the successful practices in countries already using insect pollinators for pollination.

38
Value of Insect Pollinators to Himalayan Agricultural Economies
References
Agricultural Directorate (2009) Agricultural statistics. Dehradun: Government of Uttarakhand
Ahmad, F; Partap, U; Joshi, SR; Gurung MB (2002) Why the HKH region needs the Himalayan honeybee Apis cerana, Briefing Paper. Kathmandu, Nepal: ICIMOD
Ahmad, F; Joshi, SR; Gurung, MB (2003) The Himalayan cliff bee Apis laboriosa and the honey hunters of the Himalayas, Volume 1. Kathmandu, Nepal: ICIMOD
Aizen, MA; Fiensinger, P (1994) ‘Habitat fragmentation, native insect pollinators, and feral honeybees in Argentine Chaco Serrano.’ Ecological Applications 4: 378–392
Allen-Wardell, GP; Bernhardt, R; Bitner, A (1998) ‘The potential consequences of pollinator declines on conservation of biodiversity and stability of food crop yields.’ Conservation Biology 12(1): 8–17
Allsopp, MH; de Lange, WJ; Veldtman, R (2008) ‘Valuing insect pollination services with cost of replacement.’ Plos ONE 3 (10 September 2008). http://www.plosone.org (accessed on 31 August 2012)
Buchmann, SE; Nabhan, GP (1996) The forgotten pollinators. Washington, DC, USA: Island Press
Cadoret, JP (1992) ‘Doorway doses help to defeat honeybee’s vampire enemy.’ Ceres: The FAO Review 24: 8-9
Carreck, N; Williams, IH (1998) ‘The economic value of bees in the UK.’ Bee World 79: 115–123
Chauhan, A; Thakur, RK (2010) ‘Nest architecture studies of bumble-bee, Bombus haemorrhoidalis Smith.’ In National Symposium on Perspectives and Challenges of Integrated Pest Management for Sustainable Agriculture, 19–21 November 2010, pp 84. Solan, India: Indian Society of Pest Management and Economic Zoology; Dr YS Parmar University of Horticulture and Forestry
Chen, YC (1993) Apiculture in China. Peoples’ Beijing, China: Agriculture Publishing House
Costanza, R; D’Arge, R; De Groot, R; Farber, S; Grasso, M; Hannon, B; Limburg, K; Naeem, S; O’Neil, RV; Paruelo, J; Raskin, P; van der Belt, M (1997) ‘The value of the world’s ecosystem services.’ Nature 387: 253–260
De Groot, RS; Wilson,M; Boumans, R (2002) ‘A typology for the description, classification and valuation of ecosystem functions, goods and services.’ Ecological Economics 41: 393–408
Deodikar, GB; Suryanarayana, MC (1977) ‘Pollination in the services of increasing farm production in India.’ In Nair, PKK (ed), Advances in pollen spore research, pp 60–82. New Delhi, India: Today and Tomorrow Printers and Publishers
Department of Agriculture (2009) Agricultural statistics, Vols I and II. Thimphu, Bhutan: Ministry of Agriculture and Forests, Royal Government of Bhutan. www.moaf.gov.bt/moaf/?p=33&wpfb.cat=5 (accessed on 29 August 2012)
Department of Horticulture (2009) Annual Report. Shimla, India: Government of Himachal Pradesh
Dulta, PC; Verma, LR (1987) ‘Role of insect pollinators on yield and quality of apple fruit.’ Indian Journal of Horticulture 44: 274–279
Eardley, C; Roth, D; Clarke, C; Buchmann, S; Gemmill, B (2006) Pollinators and pollination: A resource book for policy and practice. Pretoria: African Pollinator Initiative
Free, JB (1993) Insect pollination of crops, (2nd edn). London, UK: Academic Press
Freeman, AM III (1993) The measurement of environmental and resource values: Theory and methods. Washington, DC, USA: Resources for the Future
Gallai, N; Salles, J-M; Settele, J; Vaissière, BE (2009) ‘Economic valuation of the vulnerability of world agriculture confronted with pollinator decline.’ Ecological Economics 68: 810–821
Gallai, N; Vaissière, BE (2009) Guidelines for the economic valuation of pollination services at a national scale. Rome, Italy: FAO
Government of Pakistan (2009) Agricultural statistics of Pakistan 2008–09. Islamabad, Pakistan: Ministry of Food, Agriculture and Livestock, Government of Pakistan
Gupta, JK; Goyal, NP; Sharma, JP; Gautam, DR (1993) ‘The effect of placement of varying numbers of Apis mellifera colonies on the fruit set in apple orchards having different proportions of pollinisers.’ In Veeresh, GK; Uma Shankar, R; Ganeshaiah, KN (eds), Proceedings of the International Symposium on Pollination in the Tropics. Bangalore, India: International Union for Studies on Social Insects
Gupta, JK; Rana, BS; Sharma, HK (2000) ‘Pollination of kiwi fruit in Himachal Pradesh.’ In Matsuka, M; Verma, LR; Wongsiri, S; Shrestha, KK; Partap, U (eds), Asian bees and beekeeping: Progress of research and development, pp 169–170. New Delhi, India: Oxford; IBH
Hein, L (2009) ‘The economic value of the pollination service, a review across scales.’ The Open Ecology Journal 2: 74–82

39
References
Hein, L; van Koppen, K; de Groot, RS; van Ierland, EC (2006) ‘Spatial scales, stakeholders and the valuation of ecosystem services.’ Ecological Economics 57: 209–228
Hueting, R (1980) New scarcity and economic growth. New York, USA: Agon-Elsevier
Hueting, R; Reijnders, B; de Boer, J; Lambooy, J; Jensen, H (1998) ‘The concept of environmental function and its valuation.’ Ecological Economics 25: 31–35
Ingram, M; Nabhan, G; Buchmann, S (2003) Our forgotten pollinators: Protecting birds and bees. www.pmac.net/birdbee.htm (accessed 23 April 2003)
Klein, AM; Vaissière, BE; Cane, JH; Steffan-Dewenter, I; Cunningham, SA; Kremen C; Tscharntke, T (2007) ‘Importance of pollinators in changing landscape for world crops.’ In Proceedings of Royal Society of London Series B–Biological Sciences 274: 303–313
Kozin, RB (1976) Pollination of entomophilous agricultural crops by bees. New Delhi, India: Amerind Printers and Publishers
Millennium Ecosystem Assessment (2005) Ecosystems and human well being: Synthesis. Washington, DC, USA: Island Press
Martin, EC (1975) ‘The use of bees for crop pollination.’ In Dadant and Sons (eds), The hive and the honey bee, pp 579–614. Hamilton, Canada: Illinois
Matheson, AG; Schrader, M (1987) The value of honeybees to New Zealand’s primary production. Nelson, New Zealand: Ministry of Agriculture and Fisheries
McGregor, SE (1976) Insect pollination of cultivated crop plants. Washington, DC, USA: United States Department of Agriculture (USDA)
Morse, RA; Calderone, NW (2001) ‘The value of honey bees as pollinators of US crops in 2000.’ Bee Culture 128: 1–15
Nabhan, GP; Buchmann, SE (1997) ‘Services provided by pollinators.’ In GC Daily (ed), Nature’s services: Societal dependence on natural ecosystems, pp 133–150. Washington, DC, USA: Island Press
Partap, U (1998) ‘Successful pollination of apples in Himachal Pradesh.’ Beekeeping and Development 48: 6–7
Partap, U (1999) Pollination management of mountain crops through beekeeping: Trainers’ resource manual.’ Kathmandu, Nepal: ICIMOD
Partap, U (2000a) ‘Foraging behaviour of Apis cerana on sweet orange (Citrus sinensis var. Red Junar) and its impact on fruit production.’ In Matsuka, M; Verma, LR; Wongsiri, S; Shrestha, KK; Partap, U (eds), Asian bees and beekeeping: Progress of research and development, pp 174–177. New Delhi, India: Oxford; IBH
Partap, U (2000b) ‘Pollination of strawberry by the Asian hive bee, Apis cerana F.’ In Matsuka, M; Verma, LR; Wongsiri, S; Shrestha, KK; Partap, U (eds), Asian bees and beekeeping: Progress of research and development, pp 178–182. New Delhi, India: Oxford; IBH
Partap, U (2001) Warning signals from the apple valleys. Video Film, 31 minutes and 7 seconds, VHS Format. Kathmandu, Nepal: ICIMOD
Partap, U (2003a) ‘Improving agricultural productivity and livelihoods through pollination: Some issues and challenges.’ In Waliyar, F; Collette, L; Kenmore, PE (eds), Beyond the Gene Horizon, pp118–135. Hyderabad, India: International Crop Research Institute for the Semi Arid Tropics (ICRISAT); Rome, Italy: FAO
Partap, U (2003b) ‘Cash crop farming in the Himalayas: The importance on pollinator management and managed pollination.’ In Biodiversity and the ecosystem approach in agriculture, forestry and fisheries, pp 224–247. Rome, Italy: FAO
Partap, U (2010a) ‘Honeybees and ecosystem services in the Himalayas.’ In Spehn, EM; Rudmann-Maurer, K; Körner, C; Maselli, D (eds), Mountain biodiversity and global change, pp 21–21. Basel, Switzerland: Global Mountain Biodiversity Assessment (GMBA) of DIVERSITAS
Partap, U (2010b) ‘Innovations in revival strategies for declining pollinators with particular reference to the indigenous honeybees: Experiences of ICIMOD’s initiatives in the Hindu Kush-Himalayan region.’ Pest Management and Economic Zoology 18: 85–95
Partap, U (2011) ‘The pollination role of honeybees.’ In Hepburn, HR; Radloff, S (eds), Honeybees of Asia, pp 227–255. Berlin, Germany: Springer-Verlag
Partap, U; Partap, T (1997) Managed crop pollination: The missing dimension of mountain agricultural productivity, Mountain Farming Systems’ Discussion Paper Series No MFS 97/1. Kathmandu, Nepal: ICIMOD
Partap, U; Partap, T (2000) ‘Pollination of apples in China.’ Beekeeping and Development 54: 6–7
Partap, U; Partap, T (2001) Declining apple production and worried Himalayan farmers: Promotion of honeybees for pollination, Issues in Mountain Development (IMD) 2001/1. Kathmandu, Nepal: ICIMOD
Partap, U; Partap, T (2002) Warning signals from apple valleys of the HKH region: Pollination problems and farmers’ management efforts. Kathmandu, Nepal: ICIMOD.
Partap, U; Partap, T; Yoghua, H (2001) ‘Pollination failure in apple crop and farmers’ management strategies in Hengduan, China.’ Acta Horticulturae 561: 225–229

40
Value of Insect Pollinators to Himalayan Agricultural Economies
Partap, U; Shukla, AN; Verma, LR (2000) ‘Pollination of peach and plum by Apis cerana.’ In Matsuka, M; Verma, LR; Wongsiri, S; Shrestha, KK; Partap, U (eds), Asian bees and beekeeping: Progress of research and development, pp 171–173. New Delhi, India: Oxford; IBH
Partap, U; Verma, LR (1992) ‘Floral biology and foraging behaviour of Apis cerana on lettuce crop and its impact on seed production.’ Progressive Horticulture 24: 42–47
Partap, U; Verma; LR (1994) ‘Pollination of radish by Apis cerana.’ Journal of Apicultural Research 33: 237–241
Pearce, DW; Turner, RK (1990) ‘Economics of natural resources and the environment.’ Hemel Hempstead, UK: Harvester Wheatsheaf
Pimentel, D; Wilson, C; McCullum, C; Huang, R; Dwen, P; Flack, J; Tran, Q; Saltman, T; Cliff, B (1997) ‘Economic and environmental benefits of biodiversity.’ Bioscience 47: 747–757
Prescott-Allen, R; Prescott-Allen, C (1990) ‘How many plants feed the world?’ Conservation Biology 4: 365–374
Proctor, M; Yeo, P; Lack, A (1996) The natural history of pollination. London, UK: Harper Collins
Richards, KW (1993) ‘Non Apis bees as crop pollinators.’ Revue Suisse de Zoologie 100: 807–822
Richards, KW; Kevan, P (2006) ‘Aspects of bee biodiversity, crop pollination, and conservation in Canada.’ In Kevan, PG; Imperatriz-Fonseca, VL (eds), Pollinating bees: The conservation link between agriculture and nature, pp 83–101. Brazil: Ministry of Environment, Secretariat for Biodiversity and Forests
Sekita, N (2001) ‘Managing Osmia cornifrons to pollinate apples in Aomori Prefecture, Japan.’ Acta Horticulturae 561: 303–308
Sharma, HK; Partap, U; Bisht, K; Tiwari, P; Phartyal, P (2010) ‘Impact of honeybee pollination in enhancing apple production in Nainital District of Uttarakhand.’ In National Symposium on Perspectives and Challenges of Integrated Pest Management for Sustainable Agriculture, 19–21 November 2010, pp 83. Solan, India: Indian Society of Pest Management and Economic Zoology; Dr YS Parmar University of Horticulture and Forestry
Sharma, HK; Partap, U (2010) ‘Needs and strategies to conserve indigenous honeybees.’ In International Workshop on Mountain Biodiversity and Impacts of Climate Change with Special Reference to Himalayan Biodiversity Hotspot, 6–8 December 2010, pp 123–126. Almora, India: GB Pant Institute of Himalayan Environment and Development
Sharma, R; Gupta, JK (2010) ‘Effect of changing landscape on the density and diversity of insect pollinators on apple crop in Kullu valley of Himachal Pradesh.’ In National Symposium on Perspectives and Challenges of Integrated Pest Management for Sustainable Agriculture, 19–21 November 2010, pp 94. Solan, India: Indian Society of Pest Management and Economic Zoology; Dr YS Parmar University of Horticulture and Forestry
Singh, MP; Singh, KI; Devi, CS (2000) ‘Role of Apis cerana pollination on yield and quality of rapeseed and sunflower crops.’ In Matsuka, M; Verma, LR; Wongsiri, S; Shrestha, KK; Partap, U (eds), Asian bees and beekeeping: Progress of research and development, pp 199–202. New Delhi, India: Oxford; IBH
Thakur, RK; Kashyap, L (2010) ‘Domestication and acclimatization of the bumble-bee, Bombus (Orientalibombus) haemorrhoidalis Smith, on cucumber crop grown under polyhouses in Himachal Pradesh.’ In National Symposium on Perspectives and Challenges of Integrated Pest Management for Sustainable Agriculture, 19–21 November 2010, pp 65–66. Solan, India: Indian Society of Pest Management and Economic Zoology; Dr YS Parmar University of Horticulture and Forestry
van Kooten, GC (1993) Land resource economics and sustainable development: Economic policies and the common good. Vancouver, Canada: UBC Press
Varian, HR (1993) Intermediate micro economics, (3rd edn). New York, USA: WW Norton and Company
Verma, LR; Partap, U (1993) The Asian hive bee, Apis cerana as a pollinator in vegetable seed production. Kathmandu, Nepal: ICIMOD
Verma, LR; Partap, U (1994) ‘Foraging behaviour of Apis cerana on cabbage and cauliflower and its impact on seed production.’ Journal of Apicultural Research 33: 231–236
Vithanage (1986) ‘Insect pollination of avocado and macadamia.’ Acta Horiculturae 175: 97–102
Williams, IH (1992) ‘Apiculture for agriculture.’ In British Beekeepers’ Association, Spring Convention, Stone Leigh, UK, pp 14–18
Willig, R (1976) ‘Consumer’s surplus without apology.’ American Economic Review 66: 589–597
Winston, ML; Scott, CD (1984) ‘The value of bee pollination to Canadian agriculture.’ Canadian Beekeeping 11: 134

41
Annexes
Annex: Economic Contribution of Insect Pollination to Individual Crops
Notes on the Annex tables:
The data in the second column, on dependence of various crops on insect pollination, are from Klein et al. (2007) and are available in Excel spreadsheet format on FAO’s website on Global Action on Pollination Services for Sustainable Agriculture (www.internationalpollinatorsinitiative.org).
All calculations are based on the methodology of Gallai and Vaissière (2009).

42
Value of Insect Pollinators to Himalayan Agricultural Economies
Chittagong Hill Tracts, Bangladesh
Crop Dependence on insect pollinators
Dependence ratio (D)
Producer price per tonne(USD)
Production(tonnes)
Total value of crop (TVC) = price x production(million USD)
Economic value of insect pollination (EVIP) = TVC x D(million USD)
Consumer surplus loss (CSL) with elasticity =(million USD)
–0.8 –1.2
Fruit crops
Banana Unknown – 199.7 362,732 72.44 – – –
Guava High 0.65 237.8 14,548 3.46 2.25 4.04 3.28
Jackfruit Unknown – 85.6 170,828 14.69 – – –
Jujube High 0.65 665.9 8,060 5.37 3.49 6.27 5.08
Lemons Low 0.05 285.3 25,125 7.17 0.36 0.37 0.37
Litchi High 0.65 1,664.3 10,545 17.55 11.41 20.50 16.62
Mango High 0.65 332.8 67,255 22.38 14.55 26.15 21.19
Oranges Low 0.05 642.0 18,389 11.81 0.59 0.61 0.60
Papaya Low 0.05 147.4 60,087 8.85 0.44 0.46 0.45
Pineapple For breeding – 142.7 160,393 22.84 – – –
Oilseed crops
Groundnuts Low 0.05 1,107.0 1,491 1.65 0.08 0.09 0.08
Mustard seed Medium 0.25 1,355.2 1,442 1.95 0.49 0.58 0.55
Seed cotton Medium 0.25 855.9 1,656 1.42 0.35 0.42 0.39
Sesame seed Medium 0.25 570.6 144 0.08 0.02 0.02 0.02
Linseed Low 0.05 713.3 728 0.52 0.03 0.03 0.03
Pulse crops
Black gram Low 0.05 557.1 74 0.04 0 0 0
Mung beans Low 0.05 713.1 107 0.08 0.08 0 0
Lentils None 0 1,569.2 99 0.16 0 0 0
Peas None 0 618.2 369 0.23 0 0 0
Pigeon peas Low 0.05 713.3 15 0.01 0 0 0
Spice crops
Coriander Mixed response – 2,392.7 189 0.45 – – –
Chillies Low 0.05 713.3 2,528 1.80 0.09 0.09 0.09
Tree nut crops
Almonds High 0.65 713.3 64 0.19 0.12 0.05 0.04
Chestnuts None 0.25 1,141.2 11,436 13.05 3.26 3.86 3.65
Vegetable crops
Beans Low 0.05 285.2 3,593 1.02 0.05 0.053 0.052
Cabbage For seed production
– 190.2 26,473 5.04 – – –
Carrots For seed production
– 427.9 40 0.02 – – –
Cauliflower For seed production
– 332.9 8,874 2.95 – – –
Cucumber High 0.65 214.0 5,650 1.21 0.79 1.41 1.14
Eggplant (aubergine)
Medium 0.25 356.6 28,041 9.99 2.50 2.96 2.79
GarlicFor seed production
– 1,925.8 276 0.53 – – –

43
Annexes
Long yard beans
Low 0.05 285.2 3,595 1.03 0.05 0.05 0.05
Okra Medium 0.25 283.3 8,553 2.42 0.61 0.72 0.68
OnionFor seed production
– 570.6 623 0.36 – – –
Bitter gourd Essential 0.95 380.4 16,584 6.31 5.99 25.88 14.22
RadishFor seed production
– 156.9 22,044 3.46 – – –
Ribbed gourd Essential 0.95 254.2 2,747 0.7 0.66 2.86 1.57
Snake gourd Essential 0.95 261.5 4,760 1.24 1.18 5.11 2.81
Sweet gourd Essential 0.95 285.3 14,373 4.1 3.89 16.82 9.24
Teasel gourd Essential 0.95 142.7 2,568 0.37 0.35 1.5 0.83
Tomato Low 0.05 380.5 16,628 6.33 0.32 0.33 0.32
TurnipsFor seed production
– 285.3 960 0.27 0 0 0
Total 255.17 53.77 121.39 86.36
Sources: Production figures from Bandarban Hill District Council, Bandarban, October 2010, unpublished; Khagrachari Hill District Council, Khagrachari, October 2010, unpublished; Rangamati Hill District Council, Rangamati, October 2010, unpublished. Data on producers’ price is an average value of data received from different districts (Bandarban, Khagrachari, and Rangamati). Producers’ price data were collected in Bangladeshi Taka (BDT) and converted to US dollars (USD 1 = BDT 70.1).
5
6 6
12
3
7
1
2
0
2
4
6
8
10
12
14
Essential High Medium Low None Forvegetable
seedproduction
Forbreeding
Unknown
Level of dependence of crops cultivated in the Chittagong Hill Tracts of Bangladesh on insect pollinators
Dependence on insect pollinators
Num
ber o
f cro
ps
Crop Dependence on insect pollinators
Dependence ratio (D)
Producer price per tonne(USD)
Production(tonnes)
Total value of crop (TVC) = price x production(million USD)
Economic value of insect pollination (EVIP) = TVC x D(million USD)
Consumer surplus loss (CSL) with elasticity =(million USD)
–0.8 –1.2

44
Value of Insect Pollinators to Himalayan Agricultural Economies
Bhutan
Crop Dependence on insect pollinators
Dependence ratio (D)
Producer price per tonne(USD)
Production(tonnes)
Total value of crop (TVC) = price x production(million USD)
Economic value of insect pollination (EVIP) = TVC x D(million USD)
Consumer surplus loss (CSL) with elasticity =(million USD)
–0.8 –1.2
Fruit crops
Apples High 0.65 984 7,076 6.96 4.53 8.13 6.59
Banana Unknown – 1,006 3,974 3.99 – – –
Guava High 0.65 626 2,213 1.39 0.90 1.62 1.31
Jackfruit Unknown – 1,118 2,025 2.63 – – –
Mango High 0.65 1,520 670 1.02 0.66 1.19 0.96
Oranges Low 0.05 447 72,071 32.21 1.61 1.66 1.64
Papaya Low 0.05 1,095 207 0.23 0.01 0.01 0.01
Peaches High 0.65 715 3,136 2.24 1.46 2.62 2.12
Pears High 0.65 850 2,203 1.87 1.22 2.19 1.77
Plums High 0.65 626 1,039 0.65 0.42 0.76 0.62
Pomegranate Unknown – 1,118 120 0.13 – – –
Oilseed crops
Mustard seed Medium 0.25 559 3,385 1.89 0.47 0.56 0.53
Soybeans Medium 0.25 984 1,413 1.39 0.35 0.41 0.39
Pulse crops
Beans, dry Low 0.05 1,028 3,946 4.06 0.20 0.21 0.21
Butter beans Low 0.05 1,095 1,198 2.17 0.11 0.11 0.11
Mung beans Low 0.05 1,185 1,988 2.36 0.12 0.12 0.12
Black gram Low 0.05 1,252 1,153 1.44 0.07 0.07 0.07
String beans Low 0.05 1,095 1,988 2.18 0.11 0.11 0.11
Spice crops
Chillies Low 0.05 1,609 8,368 13.46 0.67 0.69 0.69
Tree nut crops
Areca nut Low 0.05 2,928 6,569 19.23 0.96 0.99 0.98
Walnuts None – 1,783 820 1.46 – – –
Vegetable crops
Cabbage For seed production – 738 4,462 3.29 – – –
Carrots For seed production – 1,050 668 0.70 – – –
Cauliflower For seed production – 1,185 649 0.77 – – –
Cucumber High 0.65 984 1,700 1.67 1.09 1.95 1.58
Eggplant (aubergine)
Medium 0.25 872 644 0.56 0.14 0.17 0.16
Pumpkin Essential 0.95 336 3,696 1.24 1.18 5.09 2.79
Radish For seed production – 447 10,539 4.71 – – –
Squash Essential 0.95 537 2,858 1.53 1.46 6.29 3.46
Tomato Low 0.05 872 952 0.83 0.04 0.04 0.04
Turnip For seed production – 358 15,104 5.41 – – –
Total 123.21 17.88 35.12 26.41
Source: Department of Agriculture 2009. Producers’ price data were collected in Bhutanese ngultrum (BTN) and converted to US dollars (USD 1 = BTN 44.25).

45
Annexes
2
7
3
10
5
1
3
0
2
4
6
8
10
12
Essential High Medium Low None For vegetableseed
production
Unknown
Level of dependence of crops cultivated in Bhutan on insect pollinators
Dependence on insect pollinators
Num
ber o
f cro
ps
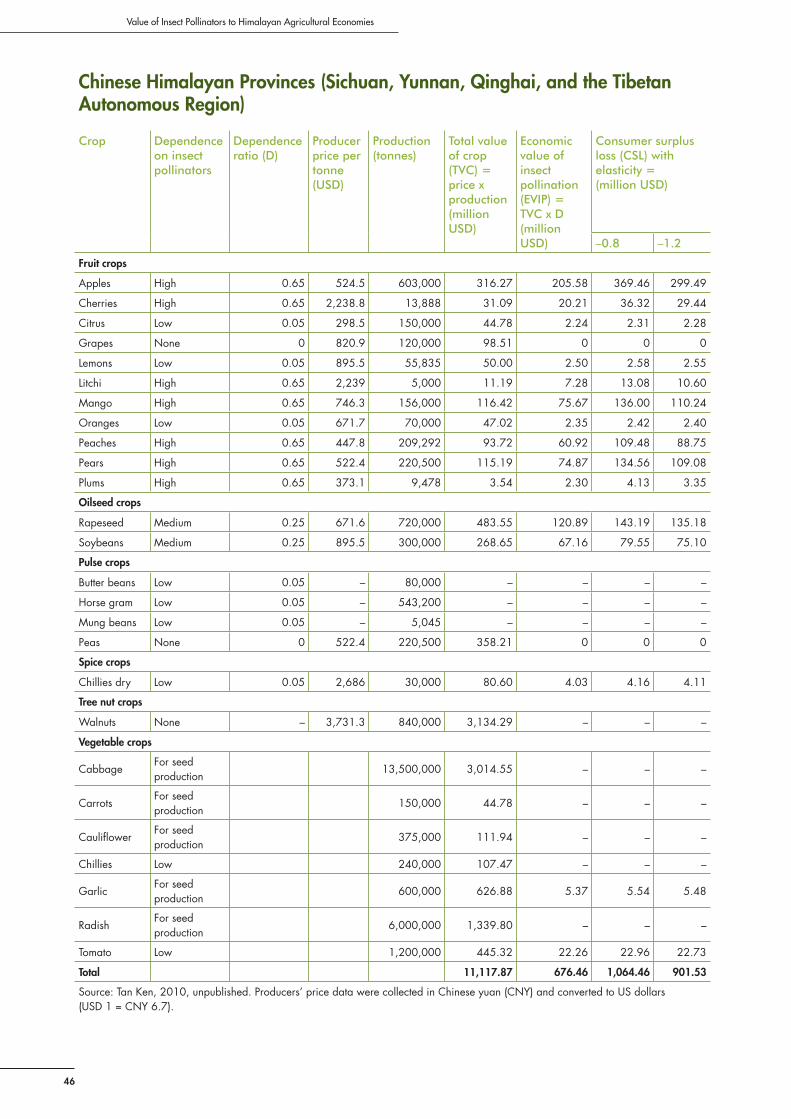
46
Value of Insect Pollinators to Himalayan Agricultural Economies
Chinese Himalayan Provinces (Sichuan, Yunnan, Qinghai, and the Tibetan Autonomous Region)
Crop Dependence on insect pollinators
Dependence ratio (D)
Producer price per tonne(USD)
Production(tonnes)
Total value of crop (TVC) = price x production(million USD)
Economic value of insect pollination (EVIP) = TVC x D(million USD)
Consumer surplus loss (CSL) with elasticity =(million USD)
–0.8 –1.2
Fruit crops
Apples High 0.65 524.5 603,000 316.27 205.58 369.46 299.49
Cherries High 0.65 2,238.8 13,888 31.09 20.21 36.32 29.44
Citrus Low 0.05 298.5 150,000 44.78 2.24 2.31 2.28
Grapes None 0 820.9 120,000 98.51 0 0 0
Lemons Low 0.05 895.5 55,835 50.00 2.50 2.58 2.55
Litchi High 0.65 2,239 5,000 11.19 7.28 13.08 10.60
Mango High 0.65 746.3 156,000 116.42 75.67 136.00 110.24
Oranges Low 0.05 671.7 70,000 47.02 2.35 2.42 2.40
Peaches High 0.65 447.8 209,292 93.72 60.92 109.48 88.75
Pears High 0.65 522.4 220,500 115.19 74.87 134.56 109.08
Plums High 0.65 373.1 9,478 3.54 2.30 4.13 3.35
Oilseed crops
Rapeseed Medium 0.25 671.6 720,000 483.55 120.89 143.19 135.18
Soybeans Medium 0.25 895.5 300,000 268.65 67.16 79.55 75.10
Pulse crops
Butter beans Low 0.05 – 80,000 – – – –
Horse gram Low 0.05 – 543,200 – – – –
Mung beans Low 0.05 – 5,045 – – – –
Peas None 0 522.4 220,500 358.21 0 0 0
Spice crops
Chillies dry Low 0.05 2,686 30,000 80.60 4.03 4.16 4.11
Tree nut crops
Walnuts None – 3,731.3 840,000 3,134.29 – – –
Vegetable crops
CabbageFor seed production
13,500,000 3,014.55 – – –
CarrotsFor seed production
150,000 44.78 – – –
CauliflowerFor seed production
375,000 111.94 – – –
Chillies Low 240,000 107.47 – – –
GarlicFor seed production
600,000 626.88 5.37 5.54 5.48
RadishFor seed production
6,000,000 1,339.80 – – –
Tomato Low 1,200,000 445.32 22.26 22.96 22.73
Total 11,117.87 676.46 1,064.46 901.53
Source: Tan Ken, 2010, unpublished. Producers’ price data were collected in Chinese yuan (CNY) and converted to US dollars (USD 1 = CNY 6.7).
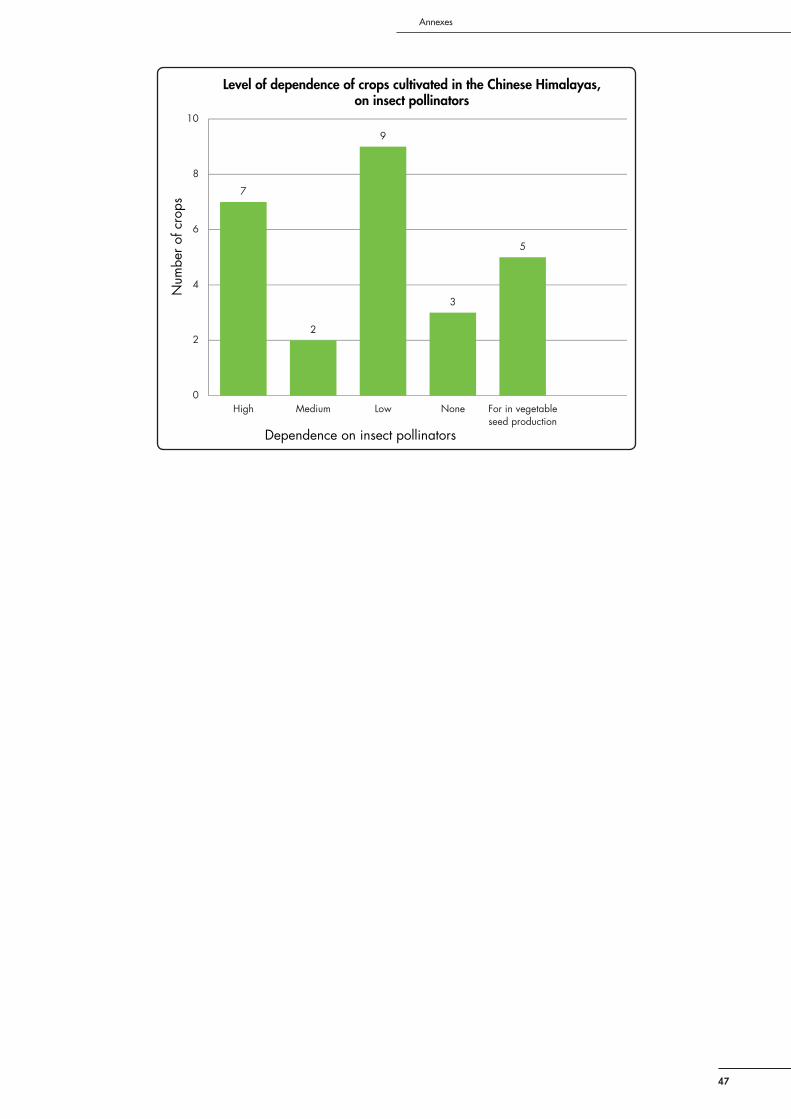
47
Annexes
7
2
9
3
5
0
2
4
6
8
10
High Medium Low None For in vegetableseed production
Level of dependence of crops cultivated in the Chinese Himalayas, on insect pollinators
Dependence on insect pollinators
Num
ber o
f cro
ps

48
Value of Insect Pollinators to Himalayan Agricultural Economies
Himachal Pradesh, India
Crop Dependence on insect pollinators
Dependence ratio (D)
Producer price per tonne(USD)
Production(tonnes)
Total value of crop (TVC) = price x production(million USD)
Economic value of insect pollination (EVIP) = TVC x D(million USD)
Consumer surplus loss (CSL) with elasticity =(million USD)
–0.8 –1.2
Fruit crops
Apples High 0.65 1,005.58 510,161 513.01 333.46 599.28 485.78
Apricots High 0.65 558.66 3,224 1.80 1.17 2.10 1.71
Cherries High 0.65 1,787.71 453 O.81 0.53 0.95 0.77
Citrus fruit Low 0.05 446.9 24,711 11.04 0.55 0.57 0.56
Guava High 0.65 625.7 2,426 1.52 0.99 1.77 1.44
Kiwi fruit Essential 0.95 1,229.05 118 .15 0.14 0.60 0.33
Lemons and limes
Low 0.05 558.66 4,839 2.70 0.14 0.14 0.14
Litchi High 0.65 670.4 3,363 2.25 1.47 2.63 2.13
Mango High 0.65 178.77 38,751 6.93 4.50 8.09 6.56
Oranges Low 0.05 335.19 15,360 5.15 0.26 0.27 0.26
Peaches High 0.65 558.66 9,935 5.55 3.61 6.48 5.26
Pears High 0.65 446.9 15,450 6.90 4.49 8.06 6.54
Plums High 0.65 513.9 9,591 4.93 3.20 5.76 4.67
Oilseed crops
Groundnuts Low 0.05 1,050.28 60 0.06 0 0 0
Linseed Low 0.05 782.12 339 0.27 0.01 0.01 0.01
Mustard seed Medium 0.25 562.43 4,374 2.46 0.62 0.73 0.69
Sesame seed Medium 0.25 893.86 1,904 1.70 0.43 0.50 0.48
Soybeans Medium 0.25 446.93 2,000 0.89 0.22 0.26 0.25
Pulse crops
Beans Low 0.05 1,608.9 19,600 31.53 1.58 1.63 1.61
Chillies Low 0.05 2,234.6 200 0.45 0.02 0.02 0.02
Coriander Mixed response 1,340.0 680 0.91 – – –
Tree nut crops
Almonds High 0.65 60.4 124 0.083 0.05 0.10 0.08
Walnuts None – 1,564.25 1,776 2.78 – – –
Vegetable crops
Beans, green Low 0.05 502.79 33,110 16.65 0.83 0.86 0.85
Cabbage For seed production – 89.39 128,333 11.47 – – –
Carrots For seed production – 134.01 40,373 5.41 – – –
Cauliflower For seed production – 134.01 53,226 7.13 – – –
Eggplant (aubergine)
Medium 0.25 201.12 16,767 3.37 0.84 0.99 0.94
Garlic For seed production – 782.12 42,875 33.53 – – –
Okra Medium 0.25 335.19 22,474 7.53 1.88 2.23 2.11
Peas None 0 335.19 195,282 65.46 0 0 0
Tomato Low 0.05 268.16 319,217 85.60 4.28 4.41 4.37
Total 815.13 365.04 648.20 527.30
Source: Production figures from Department of Horticulture 2009. Notes: Data on producer prices were collected from individual farmers; they were collected in Indian rupees (INR) and converted to US dollars (USD 1 = INR 44.25).

49
Annexes
1
10
5
9
2
4
1
0
2
4
6
8
10
12
Essential High Medium Low None Forvegetable
seedproduction
Mixedresponse
Level of dependence of crops cultivated in Himachal Pradesh, India, on insect pollinators
Dependence on insect pollinators
Num
ber o
f cro
ps

50
Value of Insect Pollinators to Himalayan Agricultural Economies
Kashmir, India
Crop Dependence on insect pollinators
Dependence ratio (D)
Producer price per tonne(USD)
Production(tonnes)
Total value of crop (TVC) = price x production(million USD)
Economic value of insect pollination (EVIP) = TVC x D(million USD)
Consumer surplus loss (CSL) with elasticity =(million USD)
–0.8 –1.2
Fruit crops
Apples High 0.65 440.9 1,332,811 587.64 381.96 686.46 556.45
Apricots High 0.65 168.4 13,491 2.27 1.48 2.65 2.15
Cherries High 0.65 655.4 10,574 6.93 4.5 8.09 6.56
Citrus Low 0.05 372.9 18,778 7.00 0.35 0.36 0.35
Jujube High 0.65 110.7 1,633 0.18 0.12 0.21 0.17
Mangoes High 0.65 219.7 49,797 10.94 7.11 12.78 10.36
Peaches High 0.65 226.0 4,400 0.99 0.65 1.16 0.94
Pears High 0.65 384.2 47,392 18.21 11.84 21.27 17.24
Tree nut crops
Almonds High 0.65 1,242.9 12,043 14.97 9.73 17.49 14.17
Walnuts None – 1694.9 149,135 252.77 – – –
Vegetable crops
Beans Low 0.05 132.2 77,017 10.18 0.51 0.52 0.52
Bitter gourd Essential 0.95 162.9 8,814 1.44 1.36 5.89 3.24
Bottle gourd Essential 0.95 148.9 15,995 2.38 2.26 9.77 5.37
Cabbages For seed production
– 124.5 66,666 8.3 – – –
CarrotsFor seed production
– 122.9 27,189 3.34 – – –
CauliflowersFor seed production
– 126.3 111,927 14.14 – – –
Chillies Low 0.05 157.3 18,333 2.88 0.14 0.15 0.15
Capsicum Low 0.05 143.5 11,128 1.6 0.08 0.08 0.08
Cucumbers High 0.65 142.4 24,143 3.44 2.23 4.02 3.26
Eggplants Medium 0.25 154.5 40,582 6.27 1.57 1.86 1.75
KaleFor seed production
– 138.3 94,458 13.06 – – –
KnolkholFor seed production
– 109.4 118,594 12.97 – – –
Peas None 0 155.5 231,887 36.06 0 0 0
PotatoesFor seed production
– 136.0 45,000 6.12 – – –
RadishFor seed production
– 109.2 72,208 7.89 – – –
Spinach None 0 127.0 31,771 4.03 0 0 0
Tomatoes Low 0.05 153.7 122,125 18.77 0.94 0.96 0.96
TurnipFor seed production
– 100.3 78,341 7.86 – – –
Total 1,062.65 426.84 773.74 623.73
Sources: MH Wani, 2011, unpublished. Data on producer prices were collected from individual farmers (field survey 2009–2010) (MH Wani 2011, unpublished); they were collected in Indian rupees (INR) and converted to US dollars (USD 1 = INR 44.25).

51
Annexes
2
9
1
4 4
8
0
2
4
6
8
10
Essential High Medium Low Non For vegetableseed
production
Level of dependence of crops cultivated in Kashmir, India, on insect pollinators
Dependence on insect pollinators
Num
ber o
f cro
ps

52
Value of Insect Pollinators to Himalayan Agricultural Economies
Uttarakhand, India
Crop Dependence on insect pollinators
Dependence ratio (D)
Producer price per tonne(USD)
Production(tonnes)
Total value of crop (TVC) = price x production(million USD)
Economic value of insect pollination (EVIP) = TVC x D(million USD)
Consumer surplus loss (CSL) with elasticity =(million USD)
–0.8 –1.2
Fruit crops
Apples High 0.65 782.12 130,630 102.17 66.41 119.35 96.75
Apricots High 0.65 614.53 31,180 19.16 12.45 22.38 18.14
Guava High 0.65 625.70 2,426 1.52 0.99 1.77 1.44
Lemons and limes
Low 0.05 502.79 130,875 65.80 3.29 3.39 3.36
Litchi High 0.65 726.30 15,646 11.36 7.38 13.27 10.76
Mango High 0.65 502.79 46,655 23.46 15.25 27.40 22.21
Peaches High 0.65 558.66 48,122 26.88 17.47 31.40 25.46
Pears High 0.65 446.93 103,517 46.26 30.07 54.04 43.81
Plums High 0.65 502.79 41,303 20.77 13.49 24.26 19.66
Oilseed crops
Groundnuts Low 0.05 1,050.28 1,645 1.73 0.09 0.09 0.09
Mustard seed Medium 0.25 562.43 8,880 4.99 1.25 1.48 1.39
Other oilseeds Mixed response – 783.29 28,845 22.59 – – –
Sesame Medium 0.25 893.86 1,904 1.70 0.43 0.50 0.48
Soybeans Medium 0.25 446.93 18,693 8.35 2.09 2.47 2.34
Pulse crops
Black gram Low 0.05 1,430.17 11,124 15.91 0.79 0.82 0.81
Chick peas None 0 1,430.17 758 1.08 0 0 0
Lentils None 0 1,430.16 5,320 7.61 0 0 0
Peas None 0 1,430.16 8,725 12.48 0 0 0
Spice Crops
Cardamom High 0.65 4,022.00 115 0.46 0.12 0.14 0.13
Chillies dry Low 0.05 1,564.25 7,270 11.37 0.57 0.59 0.58
Coriander Mixed response – 1,787.70 4,065 7.26 – – –
Fenugreek Unknown – 223.50 2,540 0.57 – – –
Tree nut crops
Pecan nuts None – 2,458.10 21,040 51.72 – – –
Vegetable crops
Cabbage For seed production – 223.46 65,859 147.17 – – –
Cauliflower For seed production – 402.24 36,129 14.49 – – –
Eggplant (aubergine)
Medium 0.25 170.77 25,266 4.31 1.08 1.28 1.21
Garlic For breeding – 782.12 42,875 33.53 – – –
Onions (including shallots), green
For seed production – 245.81 40,725 10.01 – – –
Peas, green None 0 446.93 73,174 32.70 0 0 0
Radish For seed production – 178.80 55,186 10.36 – – –
Tomato Low 0.05 201.12 95,833 19.27 0.96 0.99 0.98
Total 575.08 166.80 292.24 238.7
Source: Agricultural Directorate 2009. Data on producer prices were collected from individual farmers; they were collected in Indian rupees (INR) and converted to US dollars (USD 1 = INR 44.25).

53
Annexes
9
4
5 5
4
1
2
1
0
2
4
6
8
10
High Medium Low None Forvegetable
seedproduction
For breeding Mixedresponse
Unknown
Level of dependence of crops cultivated in Uttarakhand, India, on insect pollinators
Dependence on insect pollinators
Num
ber o
f cro
ps

54
Value of Insect Pollinators to Himalayan Agricultural Economies
Himalayan Region of Pakistan
Crop Dependence on insect pollinators
Dependence ratio (D)
Producer price per tonne(USD)
Production(tonnes)
Total value of crop (TVC) = price x production(million USD)
Economic value of insect pollination (EVIP) = TVC x D(million USD)
Consumer surplus loss (CSL) with elasticity =(million USD)
–0.8 –1.2
Fruit crops
Apples High 0.65 596.5 441,062 263.09 171.01 307.34 249.13
Apricots High 0.65 461.6 325,789 150.38 97.75 175.67 142.40
Banana Unknown – 156.2 159,378 24.89 – – –
Dates None 0 681.7 248,594 0.17 0 0 0
Grapes None 0 662.1 76,094 50.38 0 0 0
Mango High 0.65 397.7 2,239,687 890.72 578.97 1.04 843.46
Oranges Low 0.05 238 132,276 31.48 1.57 1.62 1.61
Peaches High 0.65 51.1 83,670 4.28 2.78 4.99 4.05
Pears High 0.65 248.6 24,376 6.06 3.94 7.08 5.74
Plums High 0.65 545.7 66,881 36.49 23.72 42.63 34.56
Oilseed crops
Castor seed Low 0.05 323.8 4,033 1.31 0.07 0.07 0.07
Groundnuts Low 0.05 539.7 93 0.05 0 0 0
Linseed Low 0.05 394.4 3,656 1.44 0.07 0.07 0.07
Mustard seed
Medium 0.25 358.9 199 0.071 0.02 0.02 0.02
Rapeseed Medium 0.25 323.8 4,023 1.3 0.33 0.38 0.36
Safflower seed
Low 0.05 207.4 65 0.01 0 0 0
Seed cotton Medium 0.25 198.8 11,819 2.35 0.59 0.69 0.66
Sesame Medium 0.25 624.9 41 0.026 0.01 0.01 0.01
Soybeans Medium 0.25 369.3 32 0.01 0 0 0
Sunflower seed
Medium 0.25 355.1 420,487 149.31 37.33 44.22 41.74
Pulse crops
Peas, dry No increase – 246.9 63,800 15.75 0 0 0
Tree nut crops
Almonds High 0.65 2,116.6 26,487 56.06 36.44 65.49 53.09
Walnuts None – 852.2 12,749 10.86 0 0 0
Vegetable crops
GarlicFor seed production
– 738.6 67,204 49.64 – – –
OnionsFor seed production
– 139.2 1,704,143 237.22 – – –
Total 2,159.06 954.59 1,690.82 1,376.97
Sources: Government of Pakistan 2009. Producer prices from http://faostat.fao.org

55
Annexes
7
6
5
4
2
1
0
2
4
6
8
High Medium Low None For vegetableseed production
Unknown
Level of dependence of crops cultivated in the Himalayan region of Pakistan, on insect pollinators
Dependence on insect pollinators
Num
ber o
f cro
ps


58
Value of Insect Pollinators to Himalayan Agricultural Economies
© ICIMOD 2012International Centre for Integrated Mountain DevelopmentGPO Box 3226, Kathmandu, NepalTel +977-1-5003222 Fax +977-1-5003299Email [email protected] Web www.icimod.orgISBN 978 92 9115 260 5
Recommended


![[Day 2] Center Presentation: ICIMOD (2/2)](https://img.dokumen.tips/doc/110x75/5552cfc6b4c905920f8b53a0/day-2-center-presentation-icimod-22.jpg)


![[Day 2] Center Presentation: ICIMOD (1/2)](https://img.dokumen.tips/doc/110x75/5552d083b4c90581158b51f4/day-2-center-presentation-icimod-12.jpg)

