1/27/2014
1
Susan Ruby, Ph.D., NCSP
Eastern Washington University
Washington State Association of School
Psychologists
Wsasp.org
National Center on Response to Intervention
Think-Pair-Share
What is RTI?
2
National Center on Response to Intervention
Why RTI?
Sustained improvements in academic performance
Decreased expulsion, behavioral referral and suspension rates
Decreased inappropriate special education referral and placement rates
3

1/27/2014
2
National Center on Response to Intervention 4
Response to intervention (RTI) integrates assessment and intervention within a school-wide, multi-level prevention system to maximize student achievement and reduce behavior problems.
Defining RTI
(National Center on Response to Intervention)
National Center on Response to Intervention 5
With RTI, schools identify students at-risk for poor learning outcomes, monitor student progress, provide evidence-based interventions and adjust the intensity and nature of those interventions based on a student’s responsiveness, and RTI may be used as part of the determination process for identifying students with specific learning disabilities or other disabilities.
Defining RTI
(National Center on Response to Intervention)
National Center on Response to Intervention
RTI as a Preventive Framework
RTI is a multi-level instructional framework aimed at improving outcomes for ALL students.
RTI is preventive and provides immediate support to students who are at-risk for poor learning outcomes.
RTI may be a component of a comprehensive evaluation for students with learning disabilities.
6

1/27/2014
3
National Center on Response to Intervention
Essential RTI Components
Screening
Progress Monitoring
School-wide, Multi-level Prevention System
• Primary Level (a.k.a. Level 1, Core instruction for all)
• Secondary Level (a.k.a. Level 2, Strategic instruction)
• Tertiary Level (a.k.a. Level 3, Intensive instruction)
Data-Based Decision Making for:
• Instruction
• Movement within the multi-level system
• Disability identification (in accordance with state law)
7
National Center on Response to Intervention
Essential Components of RTI
8
National Center on Response to Intervention
SCREENING
Essential Component
9

1/27/2014
4
National Center on Response to Intervention
Screening
PURPOSE: identify students who are at-risk for poor learning outcomes
FOCUS: all students
TOOLS: brief assessments that are valid, reliable, and demonstrate Classification Accuracy for predicting learning or behavioral problems
TIMEFRAME: administered more than one time per year (e.g., Fall, Winter, Spring )
10
National Center on Response to Intervention
Screening
Answers the questions:
Is our core curriculum and instruction effective?
Which students need additional assessment and instruction?
11
National Center on Response to Intervention
Questions to ask: Screening Tools
What tools do you use for screening?
What evidence do you have that supports the reliability of your screening tools?
What evidence do you have that supports the validity of your screening tools?
What do you think about the accuracy of your screening tools in predict students’ risk status?
12

1/27/2014
5
National Center on Response to Intervention
Questions to ask: Screening Process
Which students participate in screening (grade levels and groups)?
How often is screening conducted?
What procedures do you use to ensure implementation accuracy (i.e. universal, accurate administration, scoring, and accurate use of cut points to identify students)?
13
National Center on Response to Intervention
Resources for Screening
Ratings of Screening Tools:
http://www.rti4success.org/screeningTools
Self-Paced Training Modules:
http://www.rti4success.org/rti-implementer-series-self-paced-learning-modules/screening.
14
National Center on Response to Intervention
The NCRTI Screening Tool Chart User Guide
15

1/27/2014
6
National Center on Response to Intervention
Essential Components of RTI
16
National Center on Response to Intervention
PROGRESS MONITORING
Essential Component
17
National Center on Response to Intervention
Progress Monitoring PURPOSE: monitor students’ response to primary, secondary, or
tertiary instruction in order to estimate rates of improvement, identify students who are not demonstrating adequate progress, and compare the efficacy of different forms of instruction
FOCUS: students identified through screening as at-risk for poor learning outcomes
TOOLS: brief assessments that are valid, reliable, and evidence-based
TIMEFRAME: students are assessed at regular intervals (e.g., weekly, biweekly, or monthly)
18
1/27/2014
7
National Center on Response to Intervention
Progress Monitoring
Answers the questions:
Are students meeting short- and long-term performance goals?
Are students making progress at an acceptable rate?
Does the instruction need to be adjusted or changed?
19
National Center on Response to Intervention
Progress Monitoring
Progress Monitoring Tools
Frequency of Monitoring
Administration Process
National Center on Response to Intervention
Progress Monitoring Tools Progress Monitoring
21
• What tools do you use to monitor student progress? • How many alternate forms (of equal and controlled
difficulty) are available? • How do you determine minimum acceptable
growth? • How do you determine acceptable end of the year
performance? • What evidence do you have to suggest that
performance level data are reliable?

1/27/2014
8
National Center on Response to Intervention
Frequency of Monitoring Progress Monitoring
22
How often are students at the primary level progress monitored? How often are students at the secondary level progress monitored? How often are students at the tertiary level progress monitored?
National Center on Response to Intervention
Administration Process Progress Monitoring
23
Describe the process used for administering progress monitoring. How do you ensure that progress monitoring probes are administered using a standard procedure?
National Center on Response to Intervention
SCHOOL-WIDE, MULTI-LEVEL PREVENTION SYSTEM
Essential Component
24

1/27/2014
9
National Center on Response to Intervention 25
Multi-level Prevention System
~15%
~5%
Tertiary Level:
Specialized Individualized
Systems for Students with
Intensive Needs
Secondary Level:
Supplemental Group
Systems for Students with
At-Risk Response to
Primary Level
Primary Level:
School-/Classroom-
Wide Instruction for
All Students,
Including
Differentiated
Instruction
~80% of Students
National Center on Response to Intervention
Primary Level
FOCUS: all students
INSTRUCTION: District curriculum and instructional practices that are research based; aligned with state or district standards; incorporate differentiated instruction
SETTING: general education classroom
ASSESSMENTS: screening, continuous progress monitoring, and outcome measures
26
National Center on Response to Intervention
Multi-level prevention system
The framework includes a school-wide, multi-level system for preventing school failure.
Primary Level Research-Based Curriculum Materials
Fidelity
Articulation of Teaching and Learning (in and across grade levels)
Instruction
School-based PD
27

1/27/2014
10
the degree to which a planned intervention is implemented as designed (Gresham, 1989). intervention adherence - degree to which an interventionist is committed to implement a specific treatment and actively demonstrates intervention-related behaviors (Meichenbaum & Turk, 1987; Telzrow & Beebe, 2002).
28
January 31, 2014
Characteristics Factors that facilitate integrity
Factors that discourage integrity
Intervention •Acceptability of intervention •Rate of behavior change produced by intervention
•Complexity •Multiple resources required •Time required for implementation
Educator •Level of training/education •Motivation
•Resistance •Diversity of students worked with •Familiarity with other interventions that address the same problem
Student •Motivation •Cooperation
•Difficult behavior or anger/hostility •Severity or duration of problem.
Address all main components of RTI, (i.e., universal screening, high-quality instruction, progress monitoring, and data-based decision making). Although school personnel might implement one component (e.g., high-quality instruction) correctly, it is possible that they might not implement another component (e.g., progress monitoring) with fidelity. Also important to monitor the fidelity of implementation in each of the three tiers.
http://iris.peabody.vanderbilt.edu/rti_leaders/rti_leaders_18.html
January 31, 2014

1/27/2014
11
January 31, 2014
Direct assessment occurs when a qualified individual (e.g., RTI coach, principal) observes a staff member and records his or her behavior (instructional, assessment-related, or decision-making) on a standard checklist. Indirect assessment can take place through a variety of means, including self-reports, interviews, student work samples, and an interpretation of existing data (e.g., universal screening results).
http://iris.peabody.vanderbilt.edu/rti_leaders/rti_leaders_18.html
January 31, 2014
Most programs have observation checklists.
Handout: Lane, K.L. & Beebe-Frankenberger, M. (2003). School-based interventions: The tools you need to succeed. Allyn & Bacon
January 31, 2014
1/27/2014
12
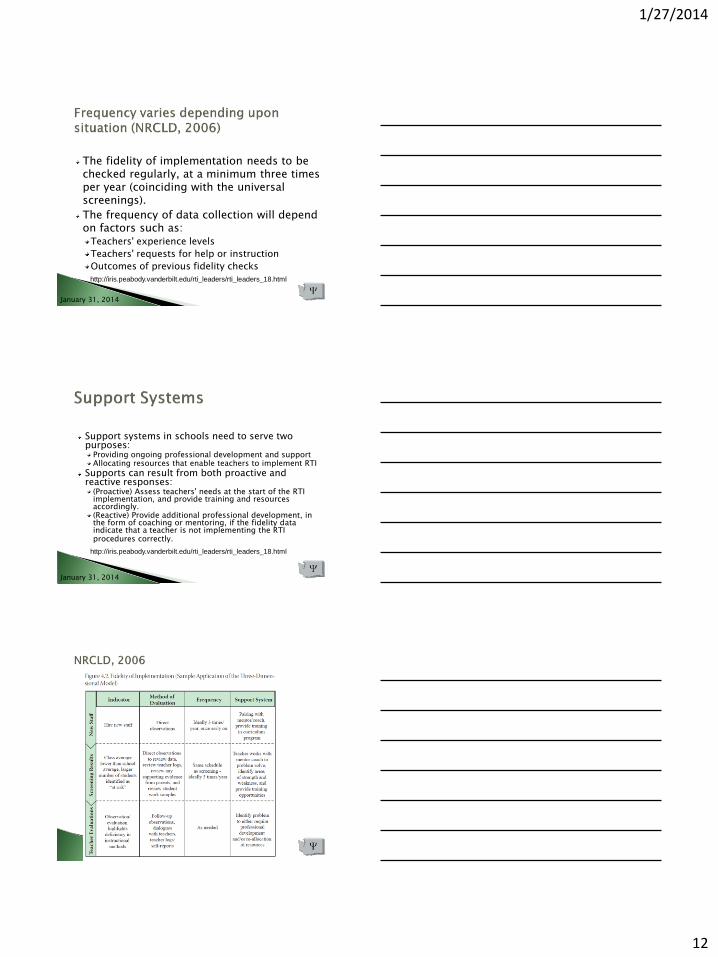
The fidelity of implementation needs to be checked regularly, at a minimum three times per year (coinciding with the universal screenings).
The frequency of data collection will depend on factors such as:
Teachers' experience levels
Teachers' requests for help or instruction
Outcomes of previous fidelity checks
http://iris.peabody.vanderbilt.edu/rti_leaders/rti_leaders_18.html
January 31, 2014
Support systems in schools need to serve two purposes:
Providing ongoing professional development and support Allocating resources that enable teachers to implement RTI
Supports can result from both proactive and reactive responses:
(Proactive) Assess teachers' needs at the start of the RTI implementation, and provide training and resources accordingly. (Reactive) Provide additional professional development, in the form of coaching or mentoring, if the fidelity data indicate that a teacher is not implementing the RTI procedures correctly.
http://iris.peabody.vanderbilt.edu/rti_leaders/rti_leaders_18.html
January 31, 2014

1/27/2014
13
National Center on Response to Intervention
Primary Level Prevention: Articulation of Teaching and Learning
(1) Teaching and learning is well articulated from one grade to another;
(2) Teaching and learning is well articulated within grade levels so that students have highly similar experiences, regardless of their assigned teacher.
37
National Center on Response to Intervention
Articulation of Teaching and Learning
Means:
PLCs
Shared Data Meetings
Permanent Products
Link between Fidelity Checks and Planned Professional Development
38
National Center on Response to Intervention
What Are Differentiated Learning Activities?
Offers students in the same class different teaching and learning strategies based on
• Student assessment data and knowledge of student readiness
• Learning preferences,
• Language and culture
39
1/27/2014
14
National Center on Response to Intervention
What Are Differentiated Learning Activities? Involves
• Mixed instructional groupings,
• Team teaching,
• Peer tutoring,
• Learning centers, and
• Accommodations to ensure that all students have access to the instructional program
Is NOT the same as providing more intensive interventions to students with low achievement or learning disabilities. See “High Quality Math Instruction” in link below.
40 http://iris.peabody.vanderbilt.edu/resources.html
WAC 392-172A-03060 states that schools must show that “the student's general education core curriculum instruction provided the student the opportunity to increase her or his rate of learning.”
Consider how PLC documentation and connection to Articulation of Teaching and Learning may help.
January 31, 2014
National Center on Response to Intervention
Secondary Level
FOCUS: students identified through screening as at-risk for poor learning outcomes
INSTRUCTION: targeted, supplemental evidence-based instruction delivered to small groups
SETTING: general education classroom or other general education location within the school
ASSESSMENTS: progress monitoring, diagnostic
42
1/27/2014
15
National Center on Response to Intervention
Secondary Level Instruction Evidence based
Aligns with and supports core instruction
Implementation fidelity based on developer guidelines.
Delivered by well-trained staff in optimal group sizes
Decisions are based on valid and reliable data and criteria are implemented accurately.
Supplements core instruction
See NCRTI
Integrity
Rubric
43
National Center on Response to Intervention
Tertiary Level
FOCUS: students who have not responded to primary or secondary level prevention
INSTRUCTION: intensive, supplemental evidence-based instruction delivered to small groups or individually
SETTING: general education classroom or other general education location within the school
ASSESSMENTS: progress monitoring, diagnostic
44
National Center on Response to Intervention
Tertiary Level Instruction Evidence based or based on validated progress
monitoring methods for individualizing instruction
More intense than secondary
Implementation fidelity
Delivered by well-trained staff in optimal group sizes
Decisions are based on valid and reliable data, and criteria are implemented accurately.
Address general education curriculum in appropriate manner for students.
See NCRTI
Integrity
Rubric
45

1/27/2014
16
National Center on Response to Intervention
Changing the Intensity and Nature of Instruction
Intervention
Duration
Frequency
Interventionist
Group size
46
National Center on Response to Intervention
DATA-BASED DECISION MAKING
Essential Component
47
National Center on Response to Intervention
Data-Based Decision Making: The Basics Analyze data at all levels of RTI implementation (e.g.,
state, district, school, grade level) as well as all levels of prevention (e.g., primary, secondary, tertiary)
Establish routines and procedures for making decisions
Set explicit decision rules for assessing student progress (e.g., state and district benchmarks, level and/or rate)
Use data to compare and contrast the adequacy of the core curriculum and the effectiveness of different instructional and behavioral strategies
48
1/27/2014
17
National Center on Response to Intervention
Data-Based Decision Making: Types of Decisions
Instruction
Movement within the multi-level prevention system
Disability identification (in accordance with state law)
49
National Center on Response to Intervention
Leadership Team Questions for RTI 1. Is our core program sufficient?
2. If the core program is not sufficient, what led to this?
3. How will the needs identified in the core program be addressed?
4. How will the sufficiency and effectiveness of the core program be monitored over time?
5. Have improvements to the core program been effective?
50
National Center on Response to Intervention
Leadership Questions (continued) 6. For which students is the core instruction sufficient or
not sufficient? Why or why not?
7. What specific supplemental and intensive instructions are needed?
8. How will specific supplemental and intensive instruction be delivered?
9. How will the effectiveness of supplemental and intensive instruction be monitored?
10. How will you determine which students need to move to a different level of instruction?
51

1/27/2014
18
National Center on Response to Intervention
Overarching Factors
Preventive Focus
Leadership
Professional Development
Partnering with Parents
Culturally Responsive Practice
52
Three Year Implementation Data
Cohort One (3 years, consistent implementation)
10.5 % increase in scores from beginning of year
District (Cohort One factored out)
6.83 % increase in scores from beginning of year
January 31, 2014

1/27/2014
19
Combined Grade Level RTI % improvement over non-
RTI
MSP Reading 1.31%
MSP Math 2.72%
DIBELS 3.67%
January 31, 2014
Title Schools: Spring 2012
RTI vs. Non-RTI with Similar Demographics
Test: Non-RTI RTI RTI Difference
MSP Reading 52.31% 58.43% 6.12%
MSP Math 49.88% 53.97% 4.09%
DIBELS 57.40% 60.27% 2.87%
Demographics considered free/reduced lunch levels, ELL, Special education, and size of school using 3 control schools and 3 RTI schools
January 31, 2014
0.00%
10.00%
20.00%
30.00%
40.00%
50.00%
60.00%
70.00%
80.00%
90.00%
100.00%
Non-RTI RTI RTI Difference
MSP Reading
MSP Math
DIBELS
Spring Benchmarking, 2012 Title Schools
with Similar Demographics
January 31, 2014
1/27/2014
20
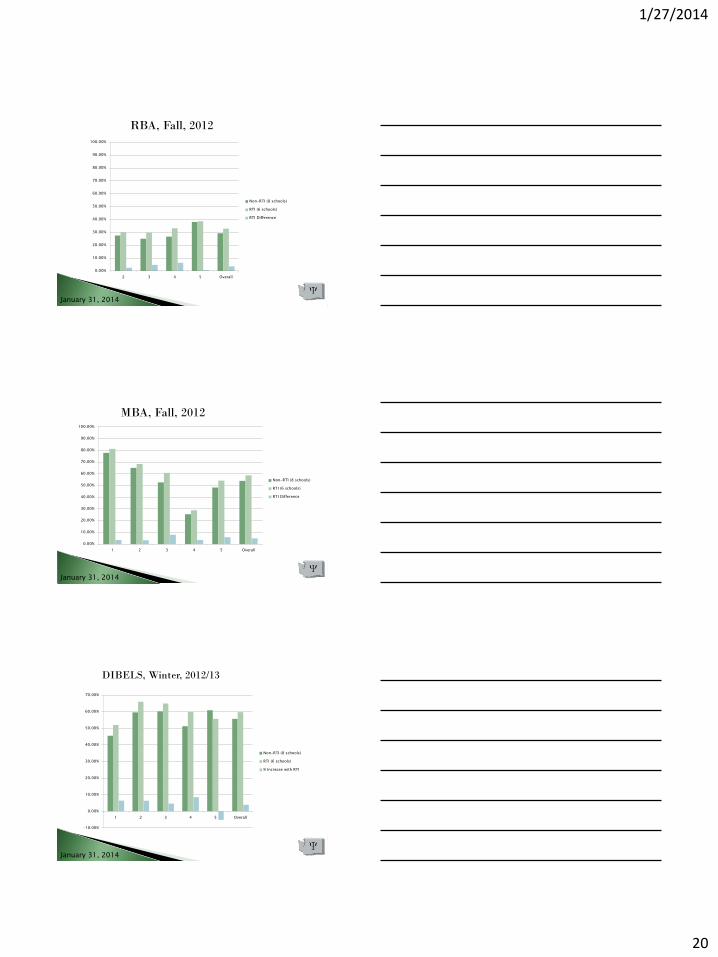
RBA, Fall, 2012
0.00%
10.00%
20.00%
30.00%
40.00%
50.00%
60.00%
70.00%
80.00%
90.00%
100.00%
2 3 4 5 Overall
Non-RTI (8 schools)
RTI (6 schools)
RTI Difference
January 31, 2014
0.00%
10.00%
20.00%
30.00%
40.00%
50.00%
60.00%
70.00%
80.00%
90.00%
100.00%
1 2 3 4 5 Overall
Non-RTI (8 schools)
RTI (6 schools)
RTI Difference
MBA, Fall, 2012
January 31, 2014
-10.00%
0.00%
10.00%
20.00%
30.00%
40.00%
50.00%
60.00%
70.00%
1 2 3 4 5 Overall
Non-RTI (8 schools)
RTI (6 schools)
% Increase with RTI
DIBELS, Winter, 2012/13
January 31, 2014
1/27/2014
21
National Center on Response to Intervention
OVERVIEW & PURPOSE OF PROGRESS MONITORING
61
National Center on Response to Intervention
Progress Monitoring
Standardized type of formative assessment
Allows you evaluate progress over time to determine:
Student response to instruction/intervention
Instructional effectiveness for groups & individuals
SLD eligibility (in accordance with law)
62
National Center on Response to Intervention
Screening v. Progress Monitoring “Close Cousins”
Often the same measures used
In some publications, you may see screening described as a type of progress monitoring.
Within RTI it is important to differentiate:
Universal Screening, which is for all students from
Progress Monitoring, which is for some students who have been identified as at-risk for poor academic or behavioral outcomes.
1/27/2014
22
National Center on Response to Intervention
Progress monitoring research has been conducted over the past 30 years
Research has demonstrated that when teachers use progress monitoring for instructional decision making:
• Students learn more
• Teacher decision making improves
• Students are more aware of their performance
Why Progress Monitoring?
64
National Center on Response to Intervention
Progress Monitoring
PURPOSE: monitor students’ response to primary, secondary, or tertiary instruction in order to estimate rates of improvement, identify students who are not demonstrating adequate progress, and compare the efficacy of different forms of instruction
FOCUS: students identified through screening as at risk for poor learning outcomes
TOOLS: brief assessments that are valid, reliable, and evidence based
TIMEFRAME: students are assessed at regular intervals (e.g., weekly, biweekly, or monthly)
65
National Center on Response to Intervention
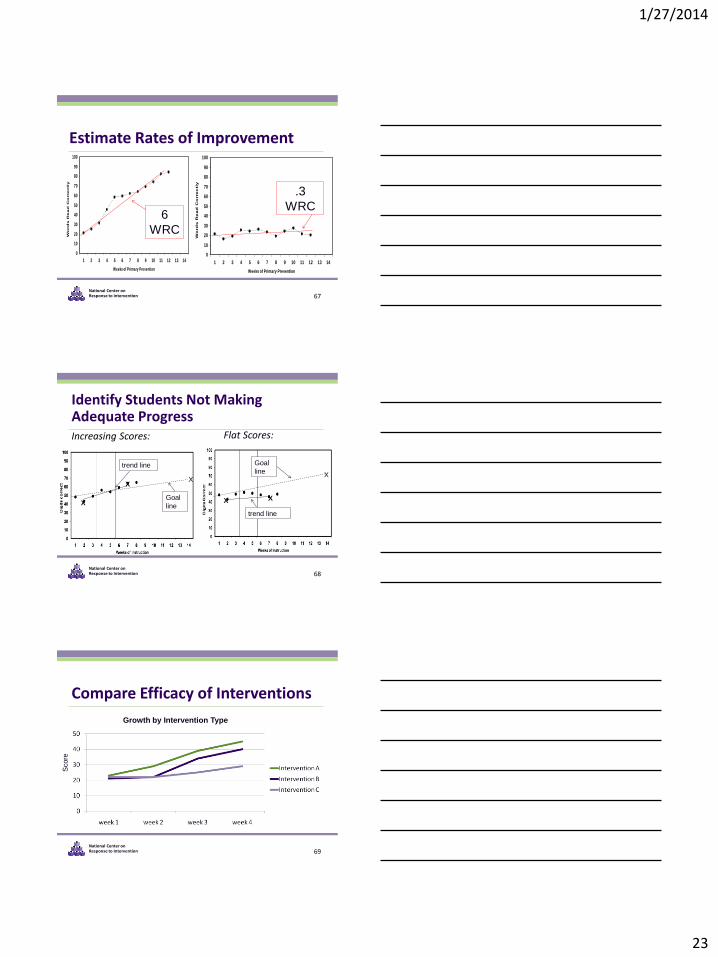
Purpose of Progress Monitoring
Allows practitioners to…
Estimate rates of improvement
Identify students who are not demonstrating adequate progress
Compare the efficacy of different forms of instruction in order to design more effective, individualized instruction
66
1/27/2014
23
National Center on Response to Intervention
0
10
20
30
40
50
60
70
80
90
100
1 2 3 4 5 6 7 8 9 10 11 12 13 14
Weeks of Primary Prevention
Wo
rd
s R
ea
d C
orre
ctly
Estimate Rates of Improvement
0
10
20
30
40
50
60
70
80
90
100
1 2 3 4 5 6 7 8 9 10 11 12 13 14
Weeks of Primary Prevention
Wo
rd
s R
ea
d C
orre
ctly
6
WRC
.3
WRC
67
National Center on Response to Intervention
Identify Students Not Making Adequate Progress Increasing Scores:
X
Goal
line
trend line
X
Goal
line
trend line
Flat Scores:
X
X
X X
68
National Center on Response to Intervention
Compare Efficacy of Interventions
Growth by Intervention Type
Score
69
1/27/2014
24
National Center on Response to Intervention
Thus, Progress Monitoring Tools Should…
Be valid and reliable for both:
Level (i.e., that performance at a specific time point is stable and predicts end-end-of year achievement)
AND
Growth (i.e., that rate of improvement is also stable and predictive of end-of-year achievement)
Use standardized administration & scoring procedures
Have alternate forms of comparable difficulty
70
National Center on Response to Intervention
When appropriate measures are used, progress monitoring can help determine…
Are students making progress at an acceptable rate?
Are students meeting short- and long-term performance goals?
Does the instruction or intervention need to be adjusted or changed?
71
National Center on Response to Intervention
THINK-PAIR-SHARE
How is progress monitoring being used in your district?
72

1/27/2014
25
National Center on Response to Intervention
Should my assessment tool be used for progress monitoring?
Although a many assessments provide useful information and may be part of your broad approach to formative assessment, consider the following when deciding whether a tool should be used for progress monitoring within your RTI system...
• Are there standardized administration & scoring instructions?
• Are parallel/alternate forms available to allow for repeated assessment?
• Is there evidence of reliability & validity of performance level?
• Is there evidence or reliability & validity of the slope (i.e., growth rate)?
The Progress Monitoring Tools Chart can help you answer these questions!
73
National Center on Response to Intervention 74
NCRTI Progress Monitoring Tools Chart
www.rti4success.org
National Center on Response to Intervention
The NCRTI Progress Monitoring Tools Chart Users Guide
75

1/27/2014
26
National Center on Response to Intervention
Planning for Progress Monitoring
Timeframe
Throughout instruction at regular intervals (e.g., weekly, bi-weekly, monthly)
Teachers use student data to quantify short- and long-term goals that will meet end-of-year goals
76
National Center on Response to Intervention
Making Decisions with Progress Monitoring Data
1. Establish Data Review Team
2. Determine Frequency of Data Collection
3. Establish Baseline and Progress Monitoring Level
4. Establish Goal
5. Collect and Graph Data
6. Analyze Data & Make Instructional Decisions
7. Continue Progress Monitoring
77
National Center on Response to Intervention
Steps in the Decision Making Process 1. Establish Data Review Team
2. Determine Frequency of Data Collection
3. Establish Baseline and Progress Monitoring Level
4. Establish Goal
5. Collect and Graph Frequent Data
6. Analyze and Make Instructional Decisions
7. Continue Progress Monitoring
78
1/27/2014
27
National Center on Response to Intervention
Data Review Teams
• Include at least three members
• Plan meetings to regularly review PM data (e.g., every four to six weeks)
• Follow established systemic data review procedures
• Many schools have established agendas
• Resources are available online
79
National Center on Response to Intervention
Roles and Responsibilities of Team Members Ensure progress monitoring data are accurate
Administration & scoring training
Monitor fidelity of implementation
Provide additional training as needed
Review progress monitoring data regularly
Identify students in need of supplemental interventions
Evaluate efficacy of supplemental interventions
80
National Center on Response to Intervention
Plan to Regularly Review Progress Monitoring Data
Conduct at logical, predetermined intervals
Schedule prior to the beginning of instruction
Involve relevant team members
Use established meeting structures
Standard Agenda
Minutes assigned to each section to be covered
Rules about individual student v. group discussions
81
1/27/2014
28
National Center on Response to Intervention
Establish Systematic Data Review Procedures
Articulate routines and procedures in writing
Implement established routines and procedures with integrity
Ensure routines and procedures are culturally and linguistically responsive
Limit time spent “admiring data”
Discuss intervention/accommodation options that school staff have at their disposal
82
National Center on Response to Intervention
Establish Systematic Data Review Procedures
Consider clarifying the following in writing:
What you are looking for?
How will you look for it?
How will you know if you found it?
83
National Center on Response to Intervention
Think-Pair-Share
In your school sites…
• Who should be involved in the review of progress monitoring data?
• What data review schedule is available?
• How should meetings be facilitated?
84

1/27/2014
29
National Center on Response to Intervention
Steps in the Decision Making Process 1. Establish Data Review Team
2. Determine Frequency of Data Collection
3. Establish Baseline and Progress Monitoring Level
4. Establish Goal
5. Collect and Graph Frequent Data
6. Analyze and Make Instructional Decisions
7. Continue Progress Monitoring
85
National Center on Response to Intervention
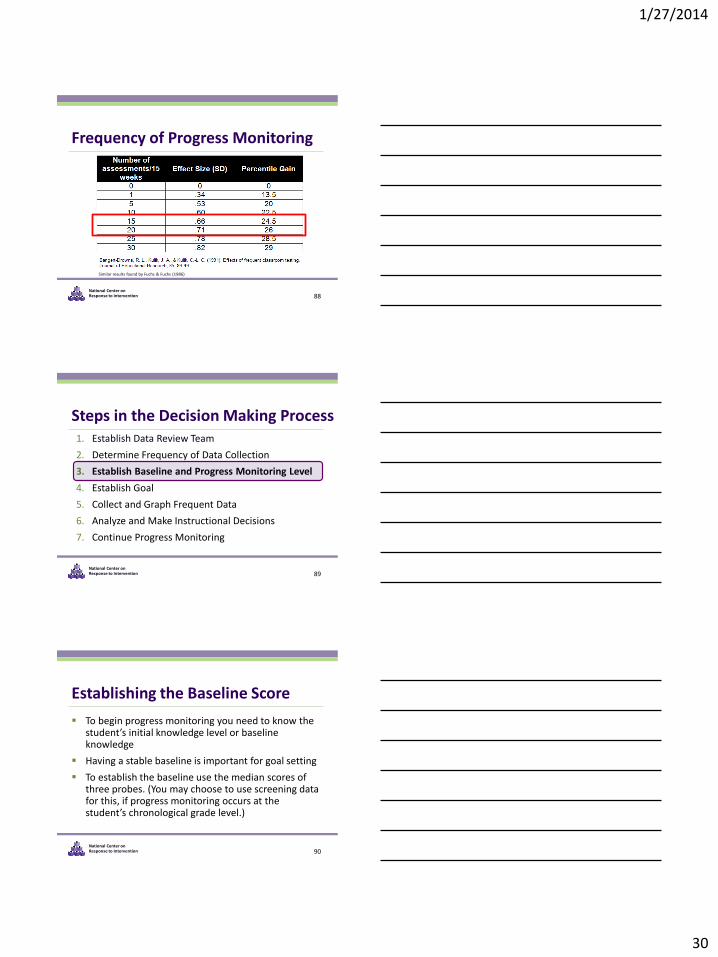
Frequency of Progress Monitoring
IDEAL
FEASIBLE vs.
86
National Center on Response to Intervention
Frequency of Progress Monitoring Should occur at least monthly.
Ideal: 2x per month at secondary level
Ideal: 1-2 x per week at tertiary level
As the number of data points increases, the effects of measurement error on the trend line decreases.
Christ & Silberglitt (2007) recommended six to nine data points.
87
1/27/2014
30
National Center on Response to Intervention
Frequency of Progress Monitoring
Similar results found by Fuchs & Fuchs (1986)
88
National Center on Response to Intervention
Steps in the Decision Making Process 1. Establish Data Review Team
2. Determine Frequency of Data Collection
3. Establish Baseline and Progress Monitoring Level
4. Establish Goal
5. Collect and Graph Frequent Data
6. Analyze and Make Instructional Decisions
7. Continue Progress Monitoring
89
National Center on Response to Intervention
Establishing the Baseline Score
To begin progress monitoring you need to know the student’s initial knowledge level or baseline knowledge
Having a stable baseline is important for goal setting
To establish the baseline use the median scores of three probes. (You may choose to use screening data for this, if progress monitoring occurs at the student’s chronological grade level.)
90

1/27/2014
31
National Center on Response to Intervention
Example: Finding the Baseline Score
Median is preferred to a measure of the average score because averages are susceptible to outliers when dealing with small number sets. Stable baselines are important in goal setting.
83 / 2 wrc 72 / 7 wrc 79 / 6 wrc
91
National Center on Response to Intervention
THINK-PAIR-SHARE
What is Billy’s baseline score?
• 97/3 wrc
• 88/2 wrc
• 96/6wrc
92
National Center on Response to Intervention
Other Approaches
Monitor student over time (e.g., three data points over three weeks) to establish stable baseline. Take the average of the scores.
93
0
5
10
15
20
25
30
35
40
45
50
1 2 3 4 5 6 7 8 9 10 11 12 13 14
Weeks of Instruction
Dig
its C
orr
ect
Baseline Average 8 +9+10 / 3 = 9 WRC

1/27/2014
32
National Center on Response to Intervention
Progress Monitoring Grade Level
When possible, assess students at their chronological grade level
The goal should be set where you expect the student to perform at the end of the intervention period
Off grade-level assessment may be used with students performing below grade level.
Many PM tools have specific procedures for appropriately placing students.
Screening data should still be collected at grade level, however.
94
National Center on Response to Intervention
Steps in the Decision Making Process 1. Establish Data Review Team
2. Determine Frequency of Data Collection
3. Establish Baseline Data and Progress Monitoring Level
4. Establish Goal
5. Collect and Graph Frequent Data
6. Analyze and Make Instructional Decisions
7. Continue Progress Monitoring
95
National Center on Response to Intervention
Set Goals Based on Logical & Research-Based Practices
Stakeholders should know…
Why and how the goal was set
How long the student has to achieve the goal
What the student is expected to do when the goal is met
96

1/27/2014
33
National Center on Response to Intervention
Trend Line, Slope, and ROI
Trend Line – a line through the scores that visually represents the performance trend
Rate of Improvement (ROI) - specifies the improvement, or average weekly increases, based on a line of best fit through the student’s scores.
Slope – quantification of the trend line, or the rate of improvement (ROI)
97
National Center on Response to Intervention
End-of-year benchmarking steps:
Identify appropriate grade-level benchmark
Mark benchmark on student graph with an X
Draw goal line from first three CBM scores to X
Option 1: Using Benchmarks
98
National Center on Response to Intervention
Goal Setting Approaches
Three options for setting goals:
1. End-of-year benchmarking
2. National norms for weekly rate of improvement (slope)
3. Intra-individual framework (Tertiary)
99
1/27/2014
34
National Center on Response to Intervention 100
End of Year Benchmark
0
5
10
15
20
25
30
35
40
45
50
0 1 2 3 4 5 6 7 8 9 10 11 12 13 14 15 16 17 18
Dig
its
Co
rre
ct
Weeks of Instruction
Grade Level Norms
Baseline Intervention
Goal Line
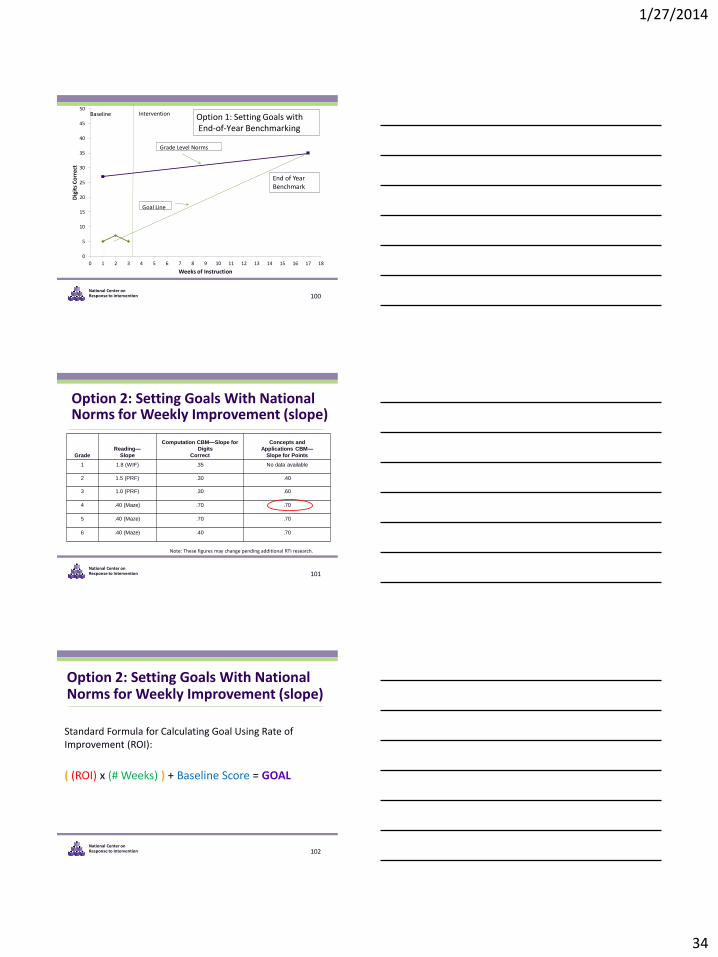
Option 1: Setting Goals with End-of-Year Benchmarking
National Center on Response to Intervention
Option 2: Setting Goals With National Norms for Weekly Improvement (slope)
Grade
Reading—
Slope
Computation CBM—Slope for
Digits
Correct
Concepts and
Applications CBM—
Slope for Points
1 1.8 (WIF) .35 No data available
2 1.5 (PRF) .30 .40
3 1.0 (PRF) .30 .60
4 .40 (Maze) .70 .70
5 .40 (Maze) .70 .70
6 .40 (Maze) .40 .70
Note: These figures may change pending additional RTI research.
101
National Center on Response to Intervention
Option 2: Setting Goals With National Norms for Weekly Improvement (slope)
Standard Formula for Calculating Goal Using Rate of Improvement (ROI):
( (ROI) x (# Weeks) ) + Baseline Score = GOAL
102
1/27/2014
35
National Center on Response to Intervention
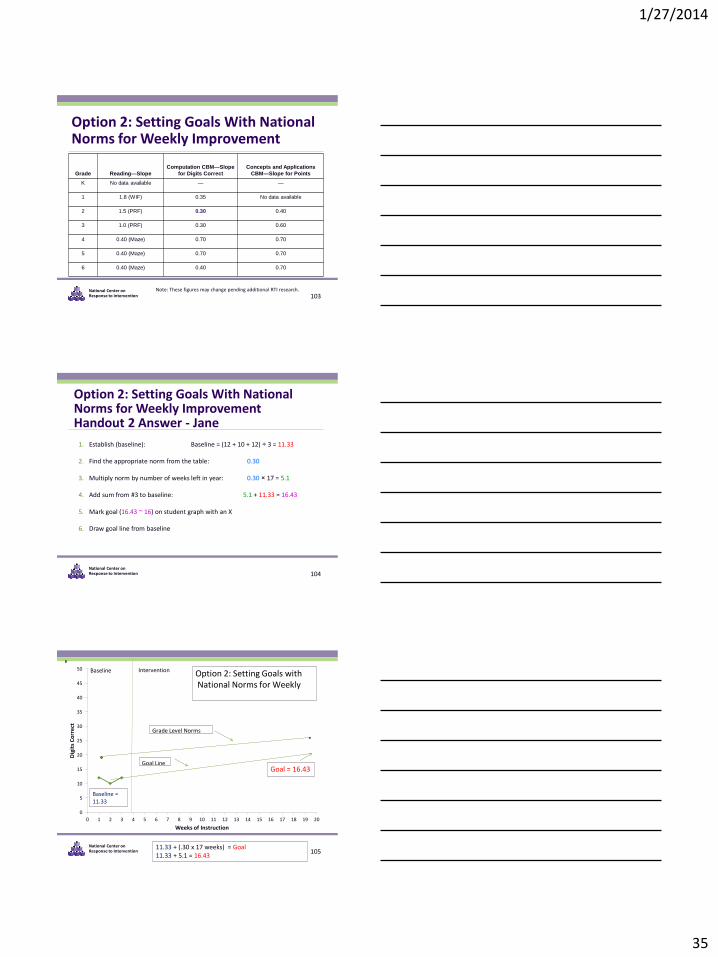
Option 2: Setting Goals With National Norms for Weekly Improvement
Grade Reading—Slope
Computation CBM—Slope
for Digits Correct
Concepts and Applications
CBM—Slope for Points
K No data available — —
1 1.8 (WIF) 0.35 No data available
2 1.5 (PRF) 0.30 0.40
3 1.0 (PRF) 0.30 0.60
4 0.40 (Maze) 0.70 0.70
5 0.40 (Maze) 0.70 0.70
6 0.40 (Maze) 0.40 0.70
Note: These figures may change pending additional RTI research.
103
National Center on Response to Intervention
1. Establish (baseline): Baseline = (12 + 10 + 12) ÷ 3 = 11.33
2. Find the appropriate norm from the table: 0.30
3. Multiply norm by number of weeks left in year: 0.30 × 17 = 5.1
4. Add sum from #3 to baseline: 5.1 + 11.33 = 16.43
5. Mark goal (16.43 ~ 16) on student graph with an X
6. Draw goal line from baseline
Option 2: Setting Goals With National Norms for Weekly Improvement Handout 2 Answer - Jane
104
National Center on Response to Intervention 105
0
5
10
15
20
25
30
35
40
45
50
0 1 2 3 4 5 6 7 8 9 10 11 12 13 14 15 16 17 18 19 20
Dig
its
Co
rre
ct
Weeks of Instruction
Grade Level Norms
Baseline Intervention
Goal Line
Option 2: Setting Goals with National Norms for Weekly
Goal = 16.43
Baseline = 11.33
11.33 + (.30 x 17 weeks) = Goal 11.33 + 5.1 = 16.43

1/27/2014
36
National Center on Response to Intervention
Rates of Weekly Improvement
Three things to keep in mind when using ROI for goal setting:
1. What research says are “realistic” and “ambitious” growth rates
2. What norms indicate about “good” growth rates
3. Local versus national norms
106
National Center on Response to Intervention
Rates of Weekly Improvement
Three things to keep in mind when using ROI for goal setting:
1. What research says are “realistic” and “ambitious” growth rates
2. What norms indicate about “good” growth rates
3. Local versus national norms
107
National Center on Response to Intervention
Option 3: Setting Goals With Intra-Individual Framework (Tertiary)
Intra-individual framework
Identify weekly rate of improvement (slope) using at least eight data points
Multiply slope by 1.5
Multiply by number of weeks until end of year
Add to student’s baseline score
This is the end-of-year goal
108

1/27/2014
37
National Center on Response to Intervention
Considerations for using the Intra-Individual Framework
Typically used for setting IEP goals and is not very appropriate for students performing at or near grade level.
Since the student’s performance is being compared to his/her previous performance (not a national or local norm) we need to have enough data to demonstrate the existing performance level or rate, which is why at least 8 data points are needed.
Recommended data collection 2x per week to obtain sufficient data points when this option is used.
109
National Center on Response to Intervention
Progress Monitoring Data May Inform Specific Learning Disability Eligibility
Criteria Related to Progress Monitoring
To ensure that underachievement in a child suspected of having a specific learning disability is not due to lack of appropriate instruction in reading or math, the group must consider, as part of the evaluation described in 34 CFR 300.304 through 300.306:
Data that demonstrate that prior to, or as a part of, the referral process, the child was provided appropriate instruction in regular education settings, delivered by qualified personnel; and
Data-based documentation of repeated assessments of achievement at reasonable intervals, reflecting formal assessment of student progress during instruction, which was provided to the child’s parents.
110
(www.idea.ed.gov)
National Center on Response to Intervention
Decision Rules Based on Four-Point Method If three weeks of instruction have occurred AND
at least six data points have been collected, examine the four most recent data points.
• If all four are above goal line, increase goal.
• If all four are below goal line, make an instructional change.
• If the four data points are both above and below the goal line, keep collecting data until trend line rule or four- point rule can be applied.
111

1/27/2014
38
National Center on Response to Intervention
Decision Rules Based on the Trend Line
If four weeks of instruction have occurred AND at least eight data points have been collected, figure trend of current performance and compare to goal line.
Calculate by hand or by computer.
Like with the four-point method, more frequent data collection will allow for more timely decisions!
112
National Center on Response to Intervention
Decision Rules Based on Four-Point Method If three weeks of instruction have occurred AND
at least six data points have been collected, examine the four most recent data points.
• If all four are above goal line, increase goal.
• If all four are below goal line, make an instructional change.
• If the four data points are both above and below the goal line, keep collecting data until trend line rule or four- point rule can be applied.
113
Consider < 10th percentile in Grade Level Norms for Level: R-CBM (ORF), MAZE
Consider <10th percentile in Grade Level Norms for ROI (Slope): R-CBM, MAZE
114
January 31, 2014
1/27/2014
39
National Center on Response to Intervention
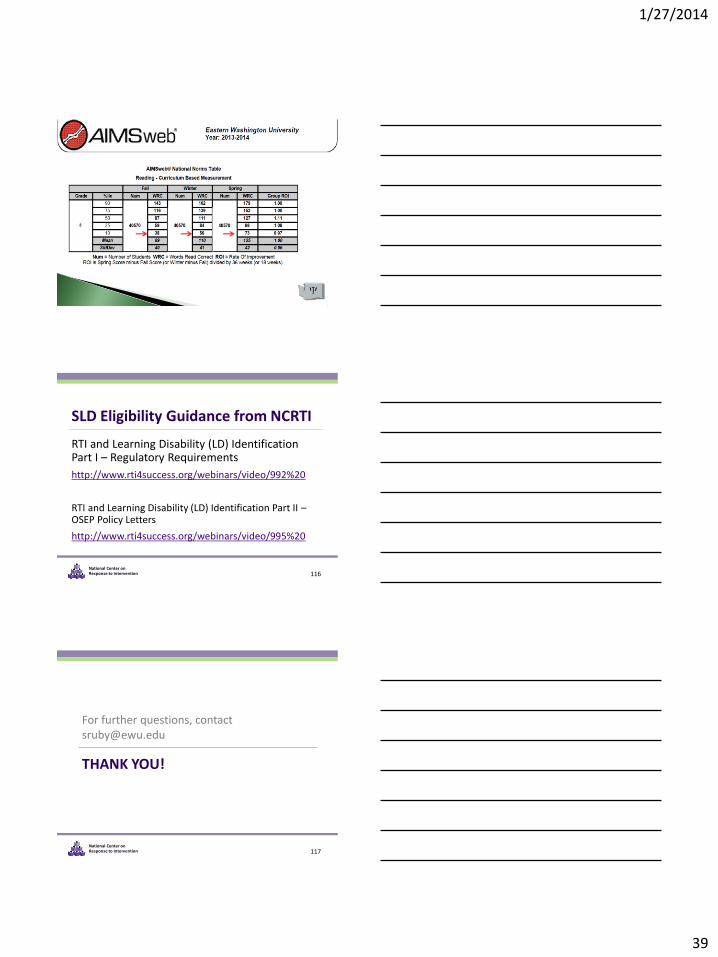
SLD Eligibility Guidance from NCRTI
RTI and Learning Disability (LD) Identification Part I – Regulatory Requirements
http://www.rti4success.org/webinars/video/992%20
RTI and Learning Disability (LD) Identification Part II – OSEP Policy Letters
http://www.rti4success.org/webinars/video/995%20
116
National Center on Response to Intervention
THANK YOU!
For further questions, contact [email protected]
117
Recommended