Carter RalphSouthern Research Institute
Birmingham, AL
SMTA HuntsvilleMarch 24, 2016
Using Acoustic Emission to Detect Solder Joint Cracks

Team Members
Elizabeth BenedettoHP
Keith Newman and Aileen Allen Hewlett Packard Enterprise
Greg MorscherUniversity of Akron
Julie Silk Keysight Technologies
2

Acknowledgements
• HP Global Lab Services for failure analysis• HP Shock Lab, David Moore, John Vijil• Keysight ‐ loan of oscilloscope• Josh Vijayam – SRI intern• Attorneys: Sue Ferst and Bill Layter
Personal IntroductionCarter Ralph• Husband and father of four boys• Mechanical Engineer at Southern Research• Mechanics experimentalist• Graduate of Auburn and Georgia Tech
4
Intro to Southern Research• Established in 1941 as an independent, not-for-profit
(501-c-3) center for scientific research and development
• Headquartered in Birmingham, Alabama• Revenues of $63M in 2015• Composed of ~450 employees organized into four
divisions:‒ Engineering‒ Environment and Energy‒ Drug Discovery‒ Drug Development (pre-clinical)
5
Thomas Martin, Founder
ENGINEERING (AL)

My work at Southern Research
• High temperature physical, mechanical, and thermal material characterization
• Ground testing
• Electronics testing
6

Tonight’s Topic
• Using acoustic emission to detect solder joint cracks– Short history– Brief explanation of how acoustic emission detection works– The problem of pad cratering– Spherical bend project– Mechanical shock project– Conclusions
• This work has been previously presented and published in pieces at SEM, ECTC, and SMTAI.
7

Key Points
• Acoustic emission detection is a non‐destructive method of damage detection that is useful for both mechanical shock and bending tests.
• It is very sensitive to pad crater initiation and agrees well with destructive failure analysis.
• It has the potential to decrease cost, decrease throughput time, and increase the sensitivity of these tests.
• This technique may be able to be extended to other tests and to fully‐populated boards.
8

A Short History
9

Map of how this got started
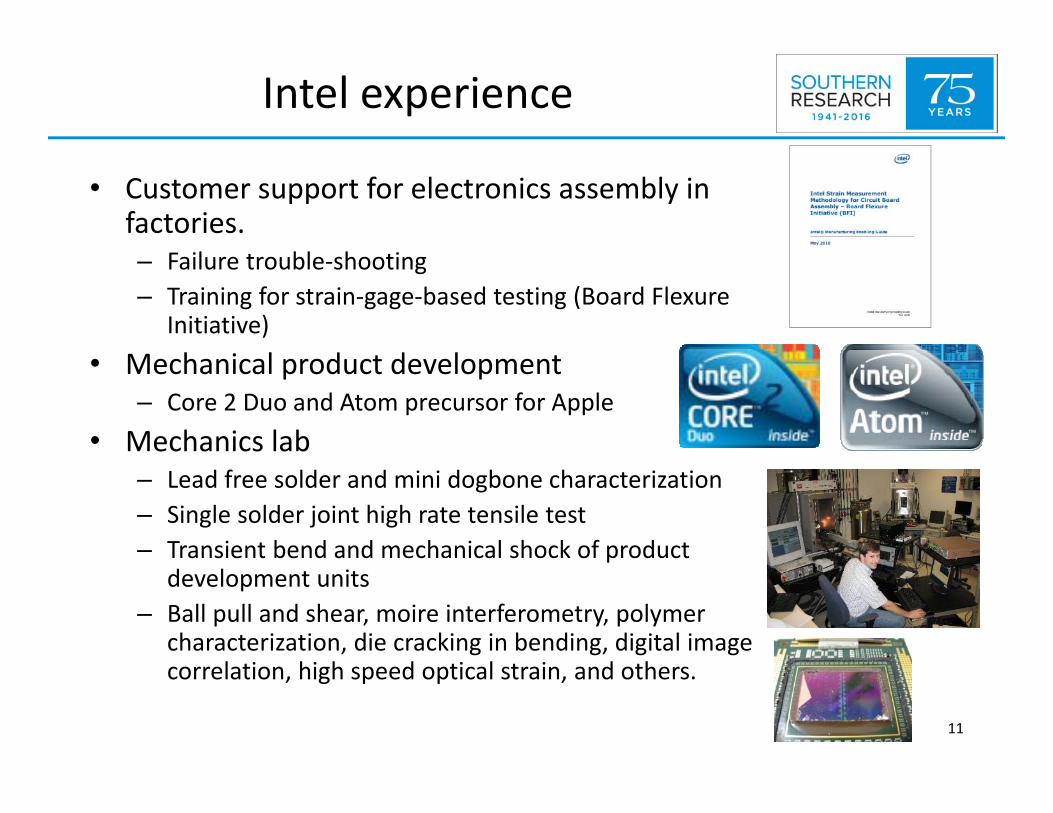
Intel experience
• Customer support for electronics assembly in factories.– Failure trouble‐shooting– Training for strain‐gage‐based testing (Board Flexure
Initiative)• Mechanical product development
– Core 2 Duo and Atom precursor for Apple• Mechanics lab
– Lead free solder and mini dogbone characterization– Single solder joint high rate tensile test– Transient bend and mechanical shock of product
development units– Ball pull and shear, moire interferometry, polymer
characterization, die cracking in bending, digital image correlation, high speed optical strain, and others.
11

Acoustics at SRI
• Southern Research has been using acoustic for decades for non‐destructive inspection.– Ultrasonic velocity for qualitative material inspection– Single frequency pulse echo for flaw detection– Scanning acoustics for flaw mapping– UltraSpec (broad‐band frequency transmission) for flaw detection
– High temperature modal acoustic emission detection on mechanical tests
12

First application of AE to electronics
• Anurag Bansal at Cisco led study in 2011‐2012
• Four point quasi‐static bend• Conventional acoustic emission
detection• Two transducers = event locating
in one dimension• Study indicated that acoustic
emission could detect solder joint cracks
• Development stopped• IPC Industry guideline published
13
Cisco Image (IPC APEX 2011)
Pieces of the puzzle
Cisco study+ HP interest+ Carter’s experience+ Southern Research’s background= Development team
• First goal was to use acoustic emission detection with spherical bend test
14
Explanation of Acoustic Emission Detection
15
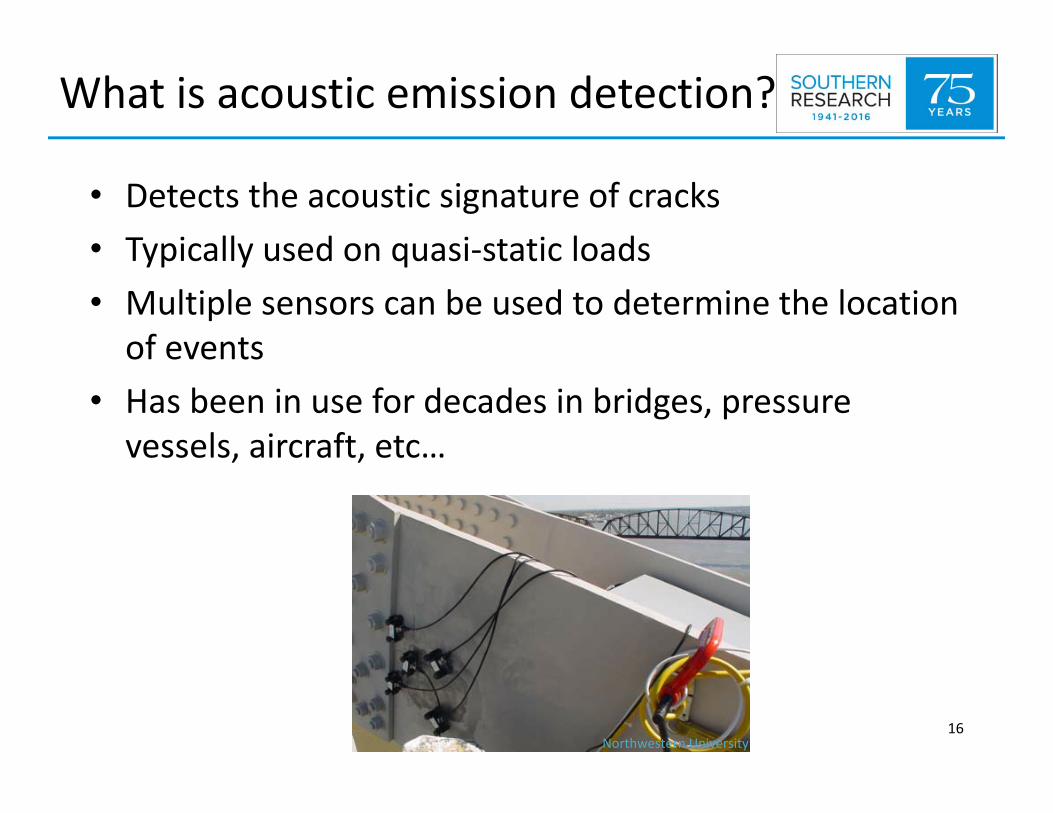
What is acoustic emission detection?
• Detects the acoustic signature of cracks• Typically used on quasi‐static loads • Multiple sensors can be used to determine the location of events
• Has been in use for decades in bridges, pressure vessels, aircraft, etc…
16Northwestern University
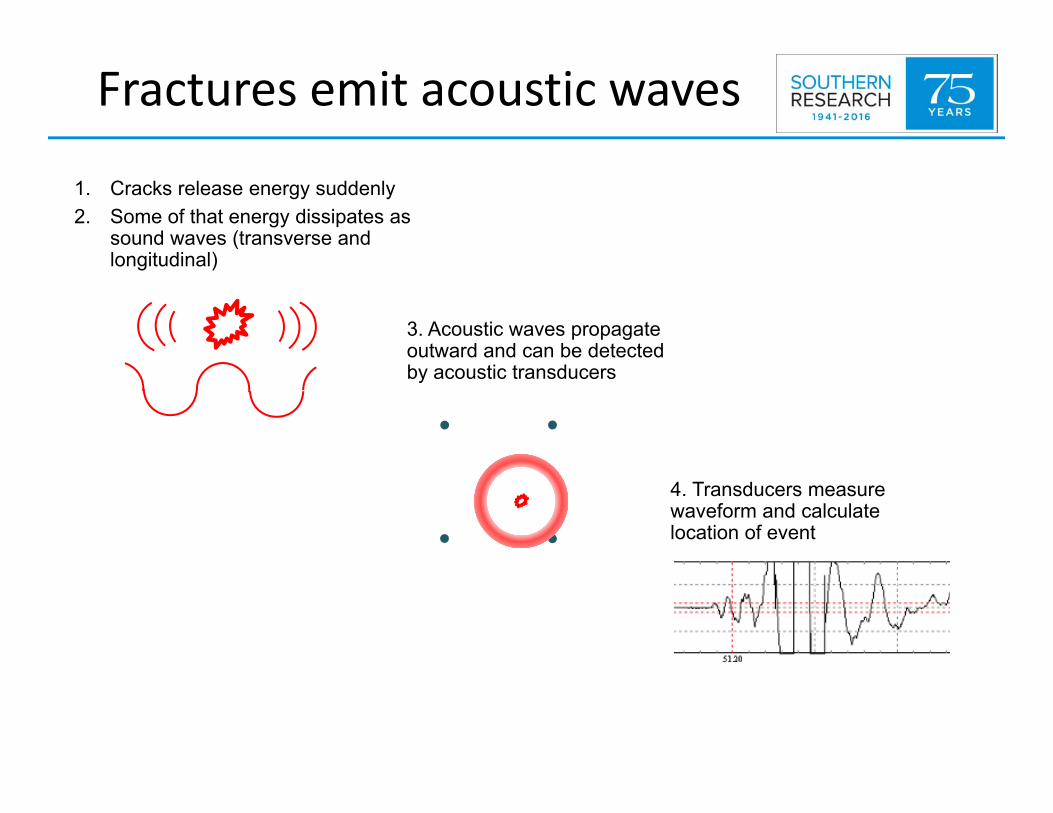
Fractures emit acoustic waves
1. Cracks release energy suddenly2. Some of that energy dissipates as
sound waves (transverse and longitudinal)
3. Acoustic waves propagate outward and can be detected by acoustic transducers
4. Transducers measure waveform and calculate location of event

Types of acoustic detection• Conventional acoustic emission detection records the time of each acoustic peak. The waveform can be approximated from this data.
• Modal acoustic emission detection records the waveform, much like an oscilloscope, giving more qualitative information. – Allows for investigation into the characteristics of the wave, which can often be
used to determine the type of fracture that initiated the event.– Waveform effective energy can be calculated by integrating the area under the
wave.

The Problem of Pad Cratering
19
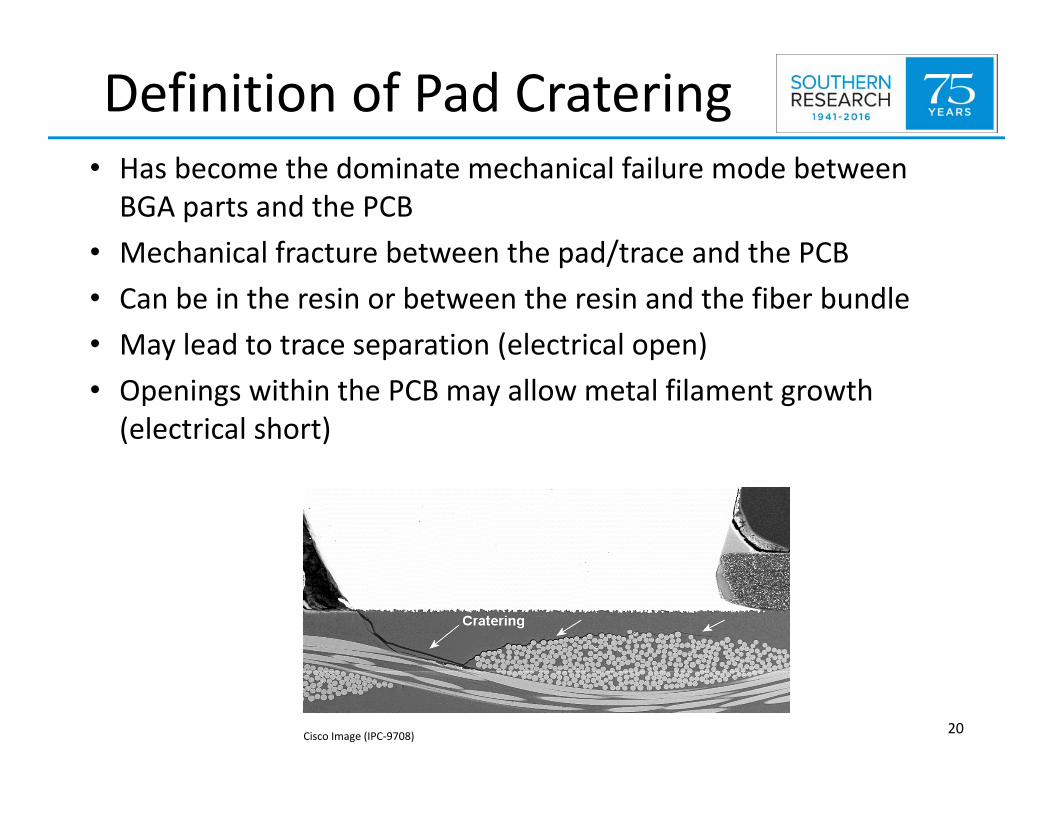
Definition of Pad Cratering• Has become the dominate mechanical failure mode between BGA parts and the PCB
• Mechanical fracture between the pad/trace and the PCB • Can be in the resin or between the resin and the fiber bundle• May lead to trace separation (electrical open)• Openings within the PCB may allow metal filament growth (electrical short)
20Cisco Image (IPC‐9708)

It is difficult to detect fracture
• Electrical monitoring usually does not detect damage until it has become severe
• Strain gauges only provide a relative indication of failure risk
• Failure analysis is time‐consuming and may miss cracks
©2015 Ralph, Morscher, Benedetto, Newman, Silk, and Allen
Strain gage
Electrical lead
21

The effects of pad craters
• Product fallout in ICT and functional tests• Damaged but functional products can pass inspection and fail after they leave the factory
• Field return data doesn’t get down to that detail– Failing component is replaced– Replacement can remove pad completely without being obvious
– Product is scrapped
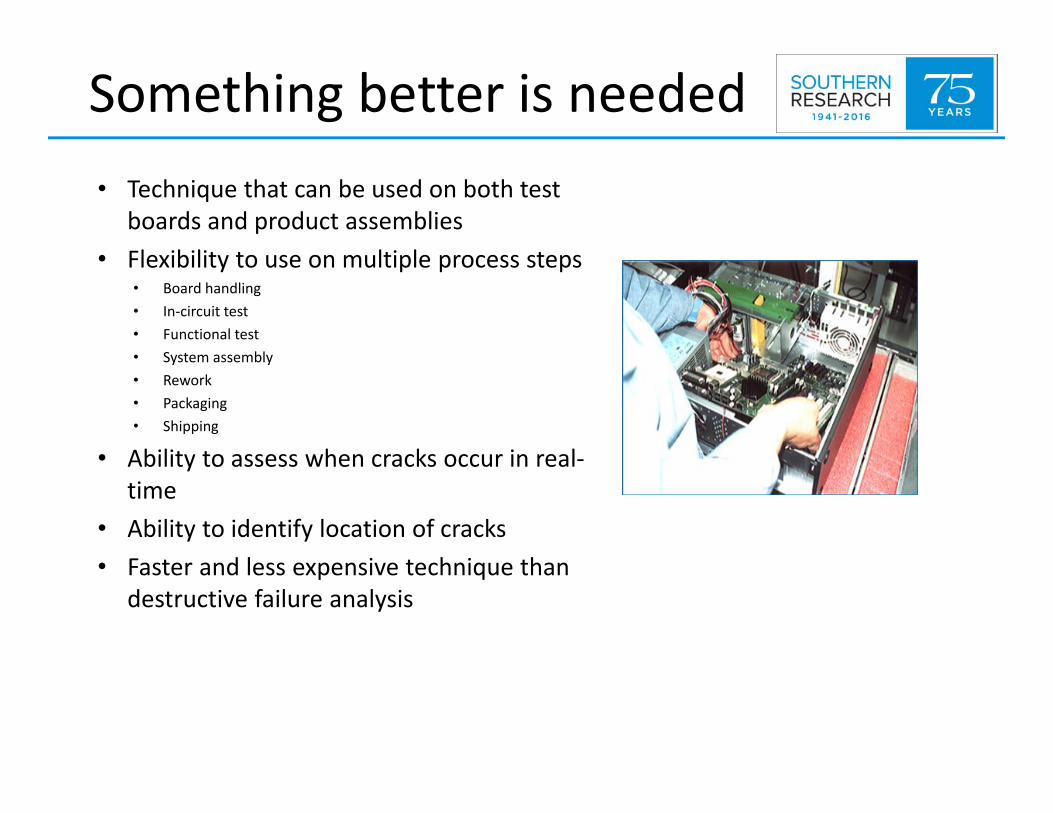
Something better is needed• Technique that can be used on both test
boards and product assemblies• Flexibility to use on multiple process steps
• Board handling• In‐circuit test• Functional test• System assembly• Rework• Packaging • Shipping
• Ability to assess when cracks occur in real‐time
• Ability to identify location of cracks• Faster and less expensive technique than
destructive failure analysis

Board Flexure Project
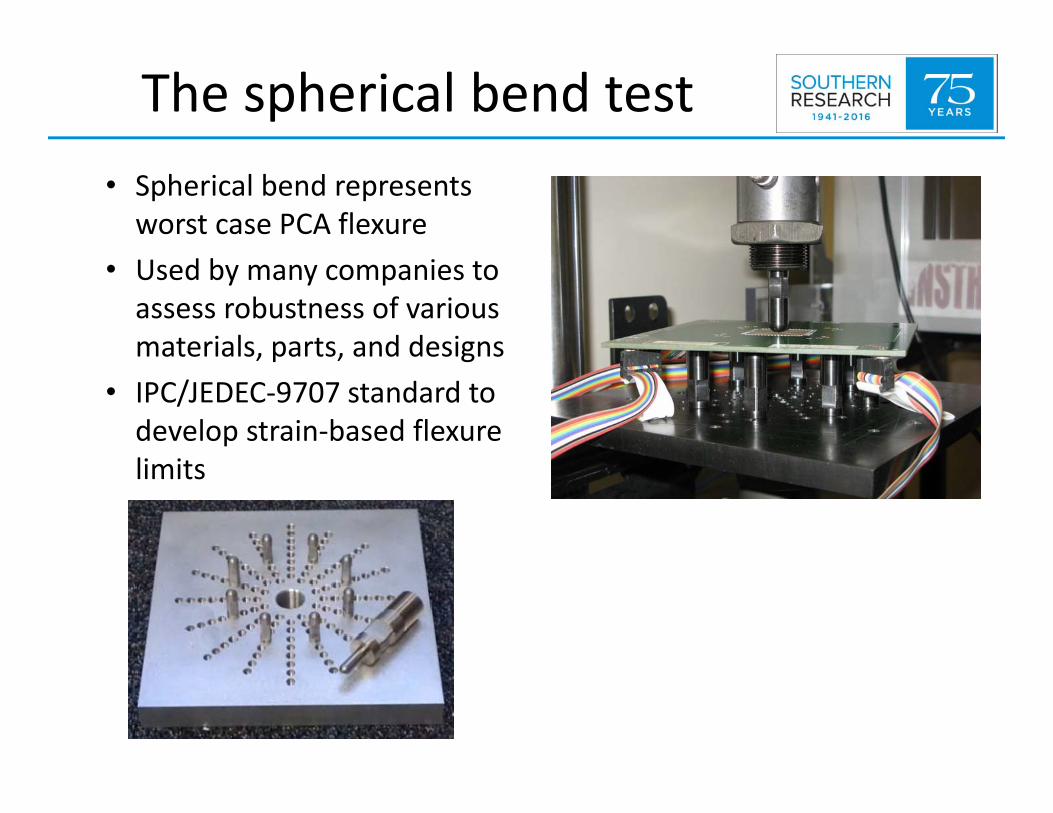
The spherical bend test• Spherical bend represents worst case PCA flexure
• Used by many companies to assess robustness of various materials, parts, and designs
• IPC/JEDEC‐9707 standard to develop strain‐based flexure limits

• Pencil lead breaks (PLBs) are performed at known locations• Pre-test system check• Velocity is calculated from time of arrival delay
PLB reference test

Spherical bend test setup• Performed by Southern Research and HP in 2012‐2013• Spherical bend test with four AE transducers for 2D event locating
• Quasi‐static and quasi‐dynamic bend rates
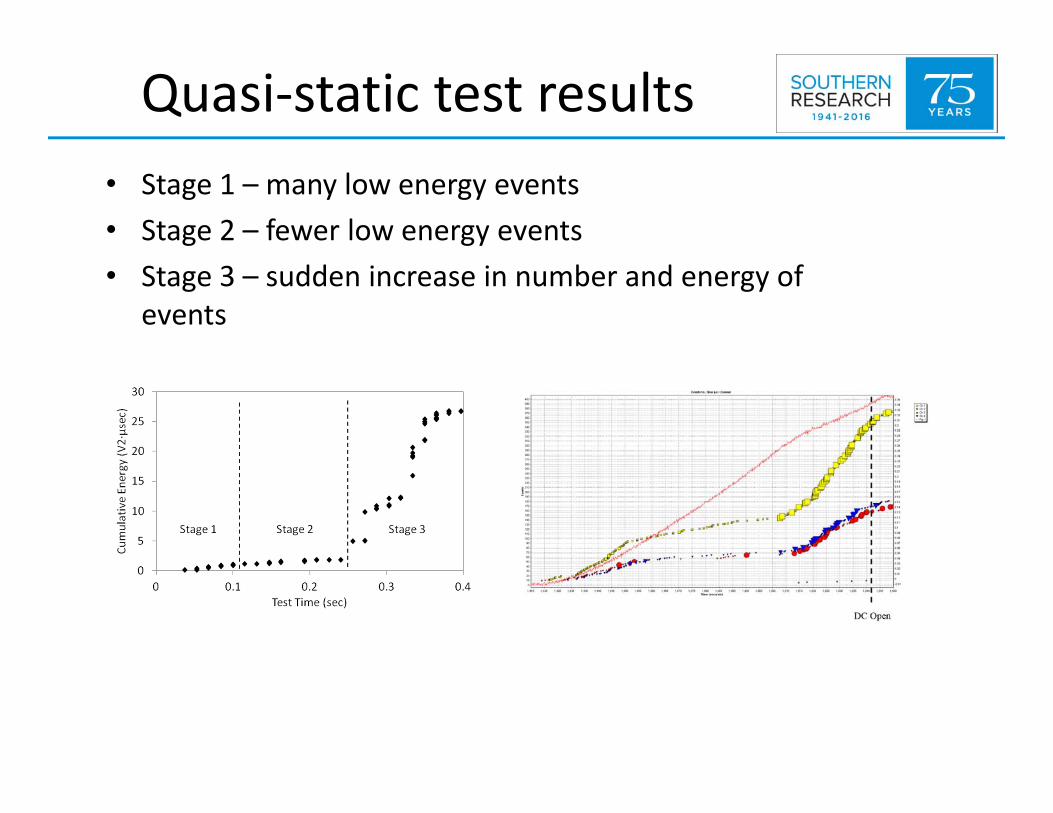
Quasi‐static test results• Stage 1 – many low energy events• Stage 2 – fewer low energy events• Stage 3 – sudden increase in number and energy of
events

Data analysis
• Effective energy of event (area under the curve)
• Color represents quadrant where event was located
• Can see same three stages as previous slide

Data analysis
• Map of component on board
• Transducers ‐ black circles
• Supports ‐ white circles• Events colored
according to time of occurrence, sized according to effective energy
• We still see events after daisy chain open –unlike electrical testing
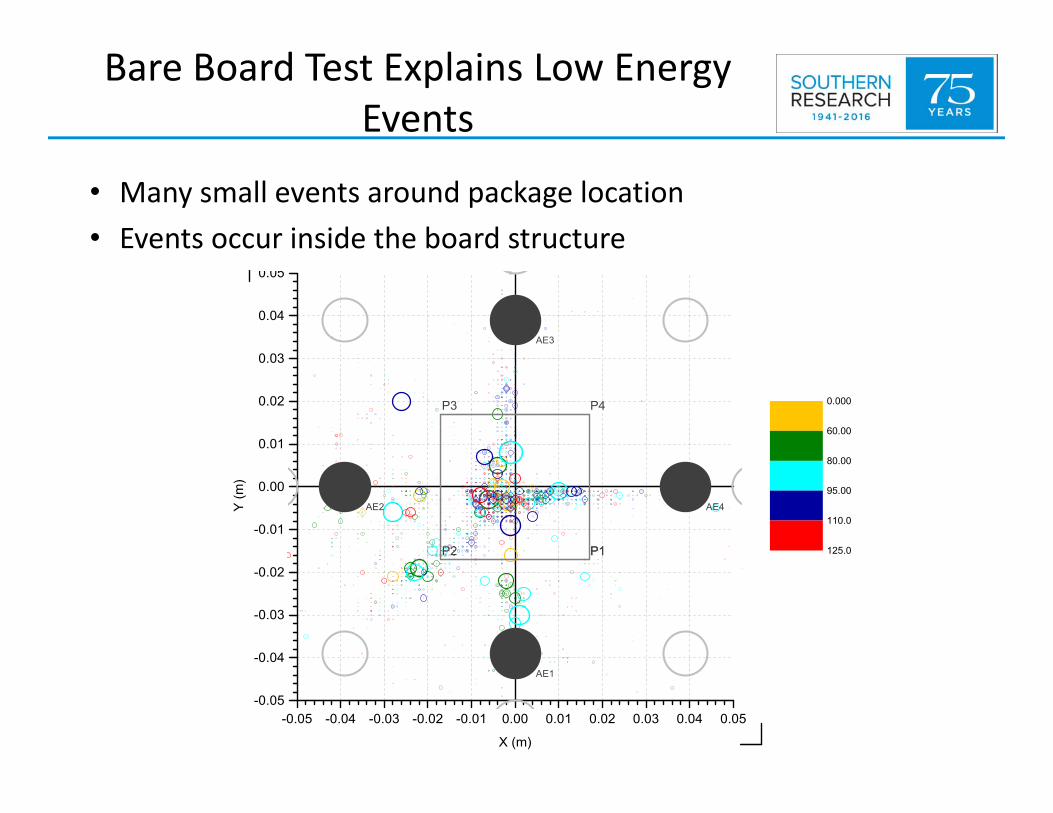
Bare Board Test Explains Low Energy Events
• Many small events around package location• Events occur inside the board structure
-0.05 -0.04 -0.03 -0.02 -0.01 0.00 0.01 0.02 0.03 0.04 0.05-0.05
-0.04
-0.03
-0.02
-0.01
0.00
0.01
0.02
0.03
0.04
0.05
P1P2
P3 P4
P1
AE1
AE2
AE3
AE4Y (m
)
X (m)
0.000
60.00
80.00
95.00
110.0
125.0
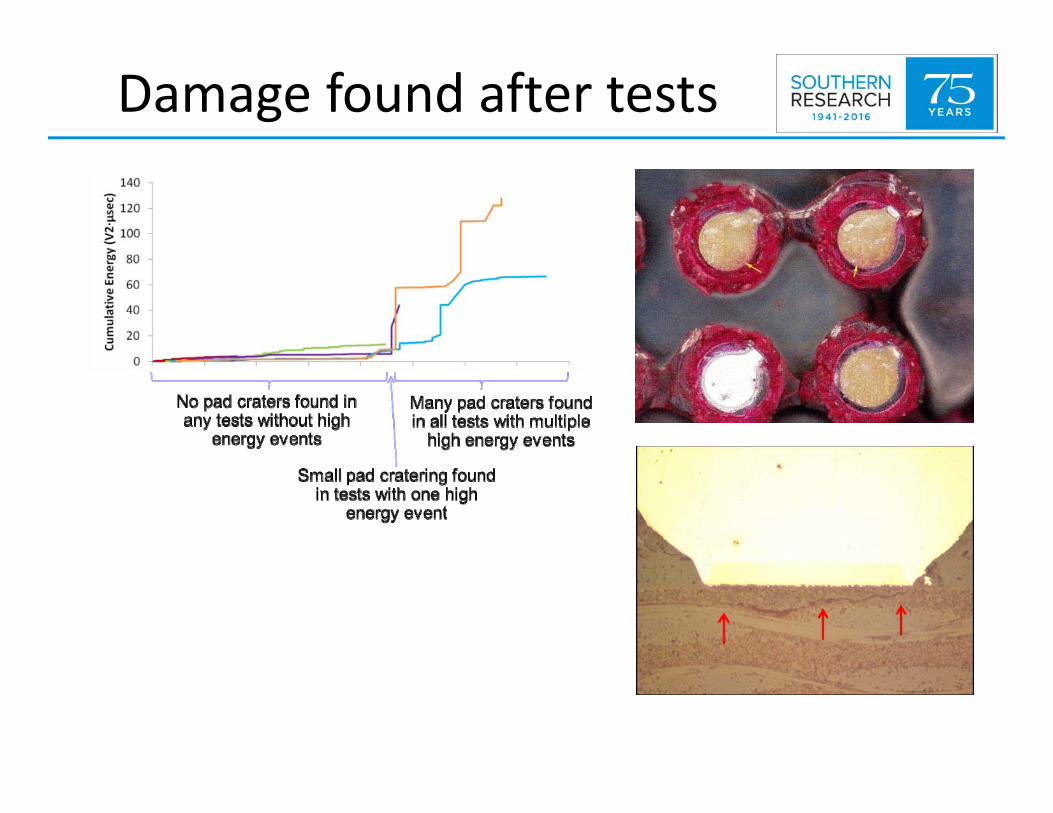
Damage found after tests

Dye stain correlation
• We did see a correlation between locations of failures in dye stain and high energy acoustic events
• Still not as precise as we’d like (1‐3mm), but precision is improving with data analysis

Mechanical Shock Project

Challenges of applying to shock
• Faster mechanical event could lead to overlapping acoustic events
• Potential for other emission sources: impact, fixtures, wires, etc.
• Echoes could produce additional overlapping acoustic events
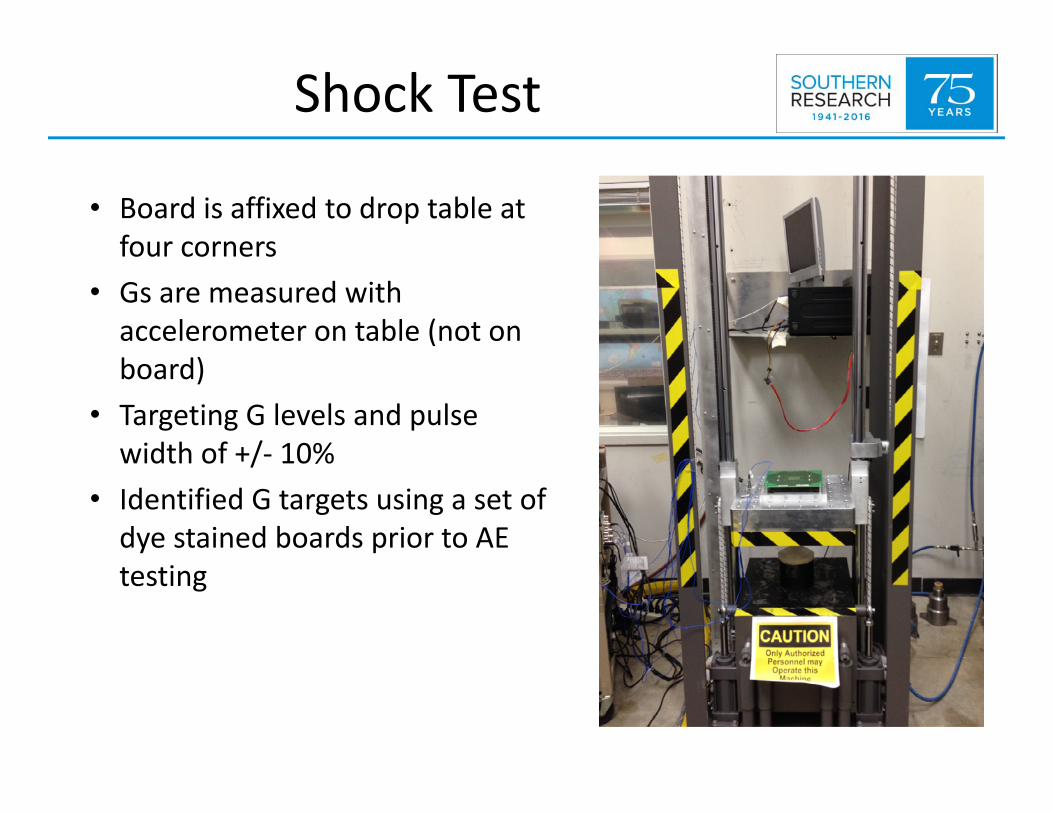
Shock Test
• Board is affixed to drop table at four corners
• Gs are measured with accelerometer on table (not on board)
• Targeting G levels and pulse width of +/‐ 10%
• Identified G targets using a set of dye stained boards prior to AE testing

Shock test setup
Accelerometer
Acoustic transducers
Oscilloscope transducers
High speed camera

Lessons from drop shock test• Everything needs to be secured to avoid superfluous events
• Affixing transducers to board is not trivial
• Separating out “events of interest” is where the real work lies
• Conservative measurement window (time) may be cutting off relevant data

AE waveform interpretation
• Classic fracture
• Impact event
Transverse wave
Longitudinal wave
Time (μsec)
Multiple acoustic events
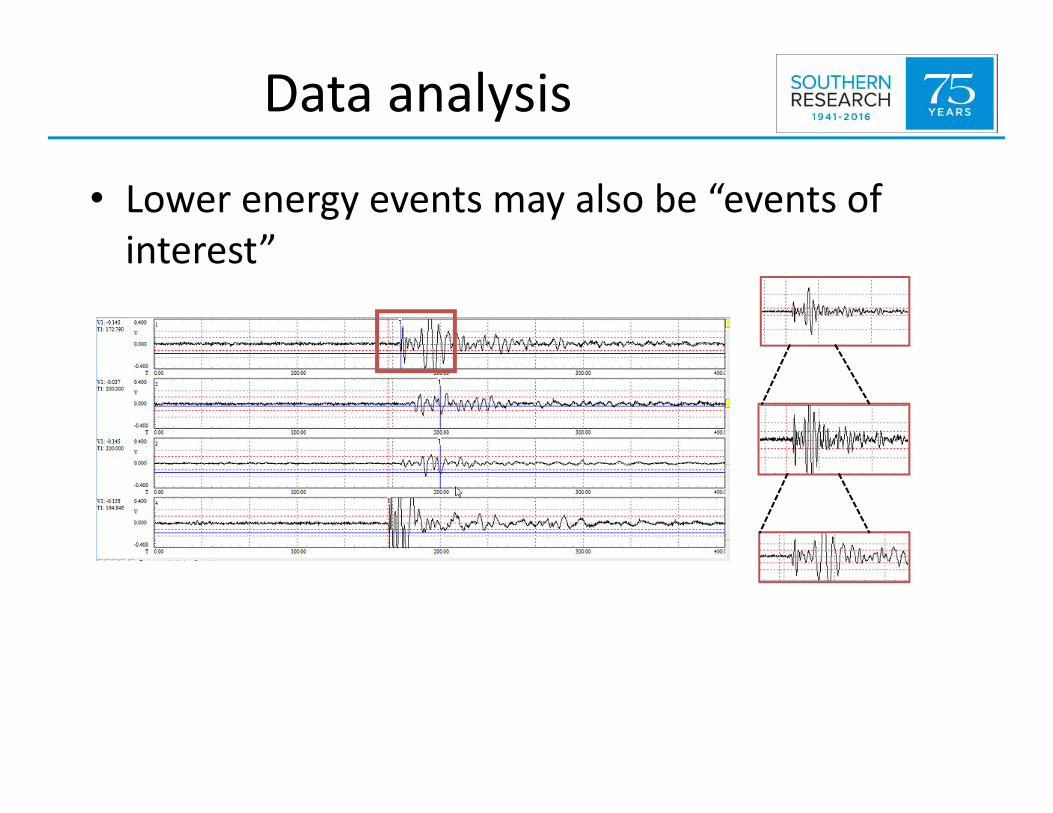
Data analysis
• Lower energy events may also be “events of interest”
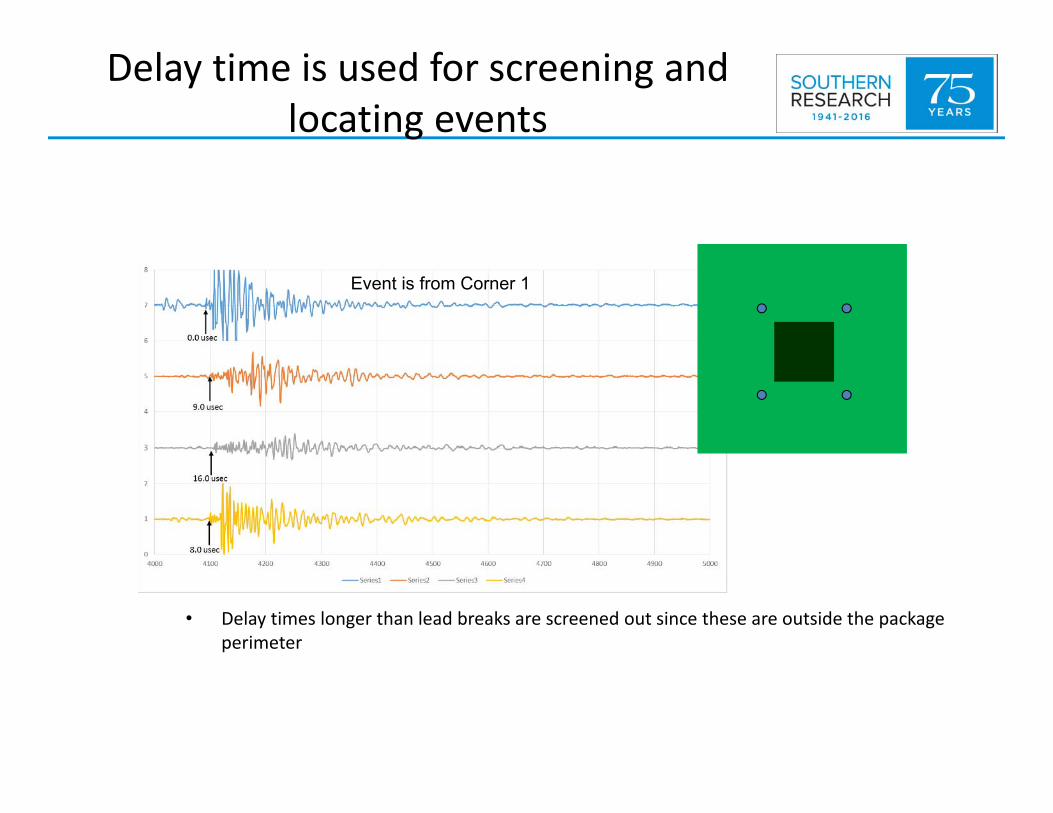
Delay time is used for screening and locating events
• Delay times longer than lead breaks are screened out since these are outside the package perimeter
Event is from Corner 1
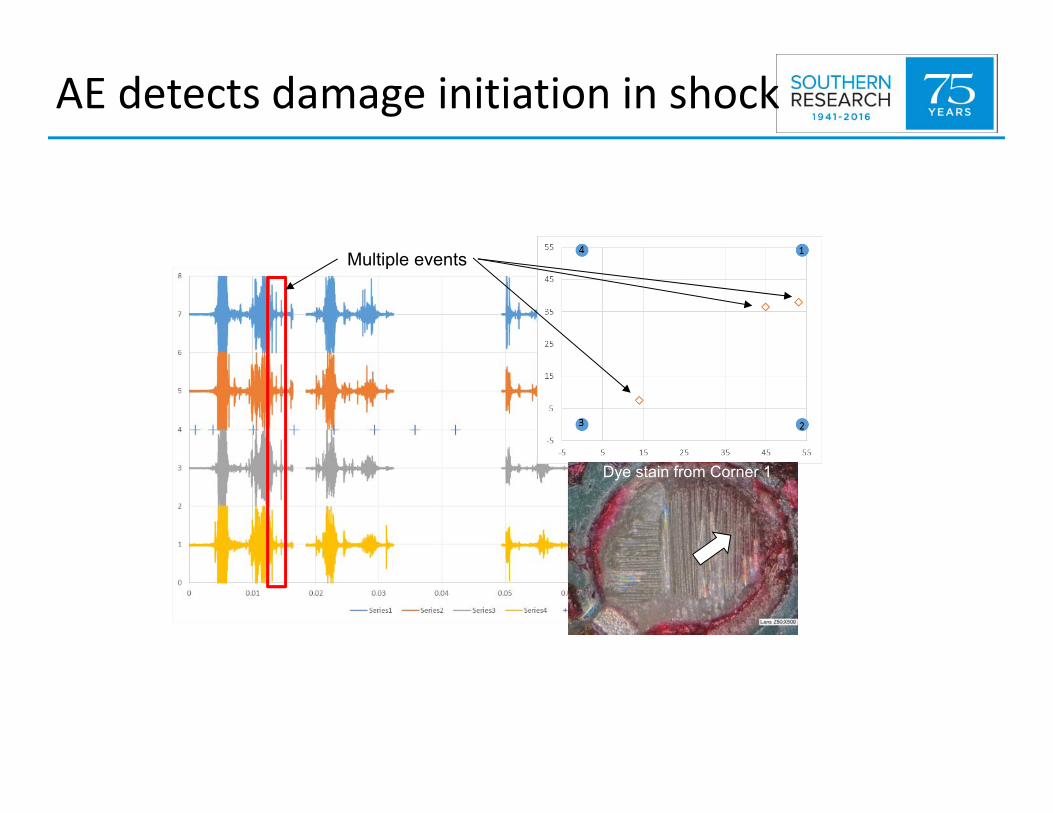
AE detects damage initiation in shock
Multiple events
Dye stain from Corner 1
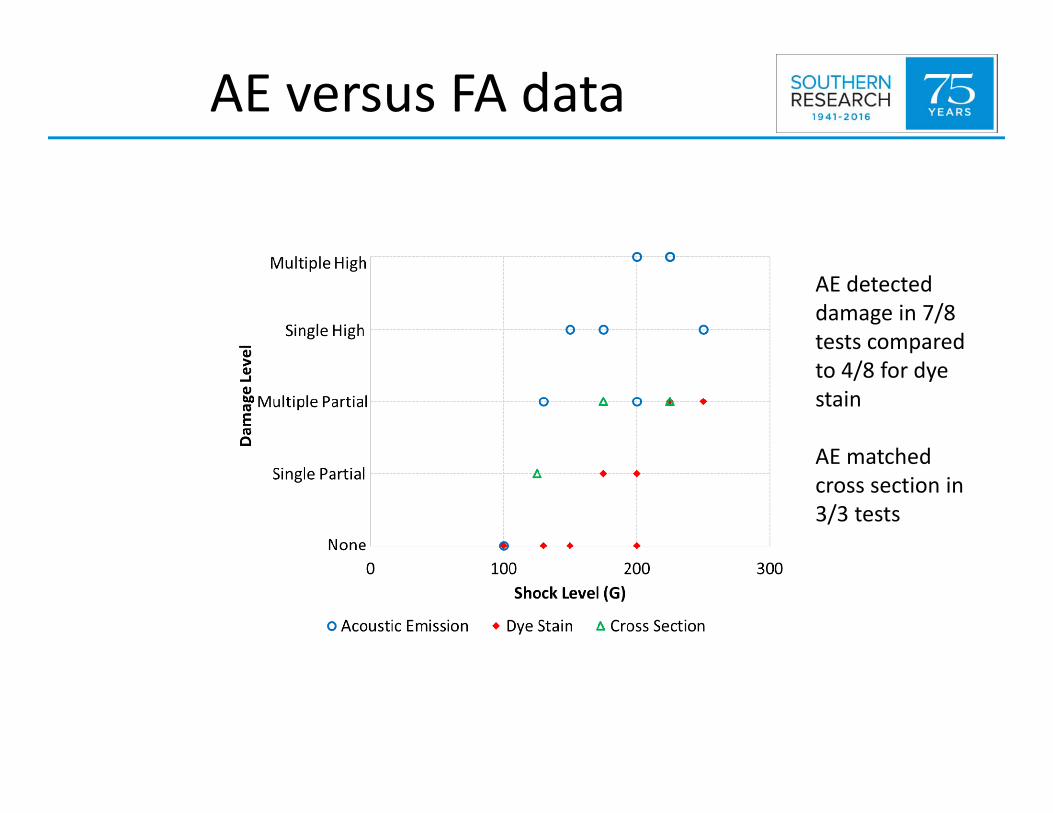
AE versus FA data
AE detected damage in 7/8 tests compared to 4/8 for dye stain
AE matched cross section in 3/3 tests

AE versus FA data
Dye stain less sensitive
Acoustic emission and cross section follow a similar trend

High speed camera clarifies events of interest
Conclusion
46
Key Points• AE is useful in both transient bend and shock situations
• Can detect damage initiation without destructive failure analysis• Can discriminate between events based on energy and location
• Suggests better sensitivity compared to dye stain for identifying pad cratering
• Can identify smaller cracks• Can identify subsurface cracks
• AE can also lower cost, decrease throughput time, and increase inspection coverage
• AE has a lot of potential—a solution in search of problems
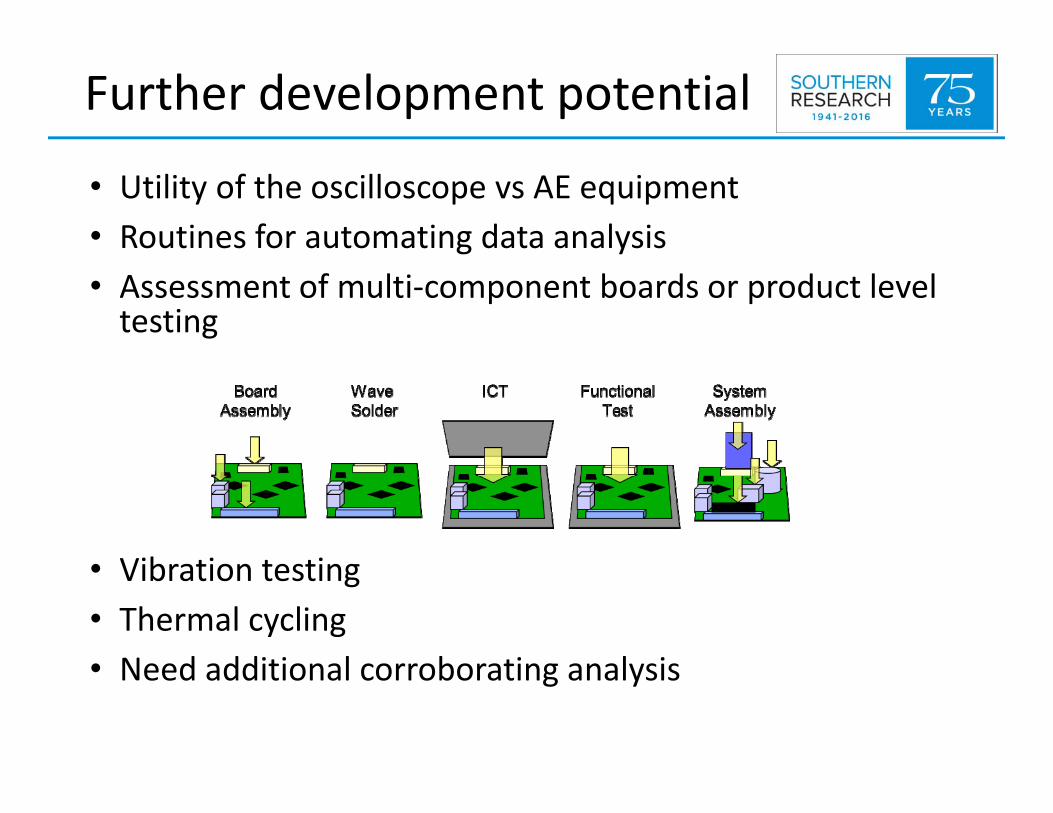
Further development potential
• Utility of the oscilloscope vs AE equipment• Routines for automating data analysis• Assessment of multi‐component boards or product level testing
• Vibration testing• Thermal cycling• Need additional corroborating analysis

Questions
49
Recommended