metabolites
H
OH
OH
Article
Untargeted NMR Spectroscopic Analysis of theMetabolic Variety of New Apple Cultivars
Philipp Eisenmann 1, Mona Ehlers 2, Christoph H. Weinert 2, Pavleta Tzvetkova 1,3, Mara Silber 1,Manuela J. Rist 4, Burkhard Luy 1,3 and Claudia Muhle-Goll 1,3,*
1 Institute of Organic Chemistry, Karlsruhe Institute of Technology, Fritz-Haber-Weg 6,76131 Karlsruhe, Germany; [email protected] (P.E.); [email protected] (P.T.);[email protected] (M.S.); [email protected] (B.L.)
2 Department of Safety and Quality of Fruit and Vegetables, Max Rubner-Institut, Haid-und-Neu-Straße 9,76131 Karlsruhe, Germany; [email protected] (M.E.); [email protected] (C.H.W.)
3 Institute for Biological Interfaces 4, Karlsruhe Institute of Technology, P.O. Box 3640,76021 Karlsruhe, Germany
4 Department of Physiology and Biochemistry of Nutrition, Max Rubner-Institut, Haid-und-Neu-Straße 9,76131 Karlsruhe, Germany; [email protected]
* Correspondence: [email protected]; Tel.: +49-721-608-45344
Academic Editor: Peter MeikleReceived: 31 May 2016; Accepted: 13 September 2016; Published: 19 September 2016
Abstract: Metabolome analyses by NMR spectroscopy can be used in quality control by generatingunique fingerprints of different species. Hundreds of components and their variation betweendifferent samples can be analyzed in a few minutes/hours with high accuracy and low cost of samplepreparation. Here, apple peel and pulp extracts of a variety of apple cultivars were studied to assesstheir suitability to discriminate between the different varieties. The cultivars comprised mainly newlybred varieties or ones that were brought onto the market in recent years. Multivariate analysesof peel and pulp extracts were able to unambiguously identify all cultivars, with peel extractsshowing a higher discriminative power. The latter was increased if the highly concentrated sugarmetabolites were omitted from the analysis. Whereas sugar concentrations lay within a narrowrange, polyphenols, discussed as potential health promoting substances, and acids varied remarkablybetween the cultivars.
Keywords: metabolomics; multivariate analysis; quality control; malus domestica
1. Introduction
Apples are among the most cultivated fruit crops and their metabolic profile has already beenextensively characterized. The metabolome, the sum of all metabolites, varies with many factors likethe genetic species, environment, or disease. Metabolomic studies on crops often address questionslike species identification in quality control [1], influence of cultivation [2], or storage conditions [3].Untargeted approaches using mass spectrometry or NMR techniques detect and quantify severalsubstance classes simultaneously. High resolution NMR spectroscopy shows resonances of all solublecompounds exceeding a concentration threshold of approximately 5–10 µM.
Most studies on apples published so far were targeted analyses that focused on specific metaboliteclasses with substance specific analytical techniques [2,4,5]. Untargeted analysis methods giving a morecomprehensive view on the metabolome have also been applied but to a lesser extent. Tomita et al. [6]compared pulp and juice of five established commercial cultivars grown in Japan or New Zealandby high resolution liquid state NMR spectroscopy. They could clearly distinguish the differentgeographic origins by multistep principal component analysis (PCA). Vermathen and coworkersassessed the suitability of high resolution magic angle spinning NMR spectroscopy to distinguish
Metabolites 2016, 6, 29; doi:10.3390/metabo6030029 www.mdpi.com/journal/metabolites

Metabolites 2016, 6, 29 2 of 12
apple tissue derived from three common cultivars: Braeburn, Golden Delicious, and Rubens [7,8].Cuthbertson et al. [9] employed gas chromatography coupled to mass spectrometry of pulp andpeel to distinguish six cultivars (Golden Delicious, Red Delicious, Gala, Fuji, and Granny Smith).They performed PCA, cluster analysis, and correlation analysis to identify metabolites specificfor certain traits such as antioxidant activity, total phenolic compounds, and total anthocyanins.De Paepe et al. performed an LC–MS study that focused on the analyses of known phenoliccompounds [10]. Forty-seven cultivars belonging to classic/new, heritage, or red-flesh cultivarswere analyzed and could be unambiguously identified in PCA. Furthermore, heritage apples thatwere mainly grown under organic agricultural practice showed a remarkably distinct phenolic pattern.LC–MS was also used for authenticity measurement of fruit juice [11]. Farneti et al. investigated thevolatile organic compounds of a large variety (190) of old and new cultivars by proton transfer reactiontime-of-flight mass spectrometry, on the basis of which they separated the cultivars in two majorgroups, characterized by their content in esters and alcohols [12].
Modern apples have been developed from a handful of ancestors that are quite susceptible toa number of fungal and bacterial diseases. To minimize the use of chemicals and employ, for example,organic farming, breeding programs focus their research activities on the development of resistanceagainst common apple diseases. Between 1984 and 2004 more than 1000 new cultivars have beenregistered for Europe [13]. The examples given above show that analysis of the metabolome allowsidentification of different species by providing unique fingerprints. Thus, analyses of the apple fruitmetabolome may assist in the selection of desired traits. In apples these can be a high content inpolyphenolic compounds discussed as antioxidative agents [14], or resistance against prevalent applecrop pests like scab or mildew caused by Venturia inaequalis and Podosphaera leucotricha, respectively.Sciubba et al. recently correlated higher concentrations of known antifungal activity conferringmetabolites with scab resistance, but the study comprised only two cultivars [15].
Here, we have performed an untargeted NMR-based metabolome analysis of 14 apple cultivarsharvested in 2014 (Table 1). The cultivars analyzed in this screening study were selected froman on-farm evaluation program aiming to compare the basic agronomic characteristics (especially timeof harvest, yield, and average fruit weight) of the newly bred cultivars with established referencecultivars like Elstar in a pesticide-reduced growing system. These cultivars were already selected froma larger range of cultivars because they all proved to have favorable properties concerning cultivationand consumer expectations beforehand. More precisely, they all were predominantly red-skinnedbecause this meets consumer expectations best, at least in Germany. Likewise, all of these cultivarswere a priori known to have an attractive sensory profile. Further, most of the cultivars were resistantagainst scab and mildew and also did not show any symptoms of other diseases at the point of harvest.We deliberately selected phenotypically rather similar cultivars because they all had—from the growers’and the consumers’ perspective—favorable properties and have therefore been introduced into themarket recently or have a potential to appear on the market within the next years. Both pulp and peelextracts were analyzed to look for specific marker patterns that characterize the individual cultivars.
Table 1. Apple cultivars used in this study.
Cultivar Characteristics
Galiwa Scab mildew resistant (SMR)Pinova Evelina Established cultivar, colour mutant
Elstar v. d. Zalm Established cultivarLadina SMR
Red Topaz SMRPRI 037 SMR, bred in WageningenGemini Scab resistant, from Italy
Zari from BelgiumPRI 010 SMR
Crimson Crisp SMR, established cultivar from USA

Metabolites 2016, 6, 29 3 of 12
Table 1. Cont.
Cultivar Characteristics
Isaaq Scab resistant, from ItalyAllurel SMRNatyra SMRLubera red-fleshed
2. Results
2.1. Metabolite Extraction and Identification
The chemical shifts of several metabolites occurring in apple are highly influenced by thepH value of the buffer. Even small changes can shift the resonances of compounds with solventexchanging hydrogens, mainly organic acids. This affects the efficiency of automated bucketing andthus the feasibility of NMR-monitored quality control is highly dependent on a tight control of the pH.To aggravate the problem, 1H NMR spectroscopy requires that the buffer contains no or as few aspossible hydrogens that would otherwise dominate the spectrum. This excludes many commonbiological buffers like HEPES or TRIS-HCL. Finally, the buffer concentration should be moderate,as high salt concentrations impair the required high homogeneity of the magnetic field. For thesereasons, we chose 200 mM phosphate buffer, pH 3.04 to extract apple pulp and 200 mM deuteratedacetate buffer, pH 4.08 for peel extracts. Although this buffer choice drew near to the natural pH ofapples, it was not fully sufficient as apples are rich in organic acids. After extraction, the pH of pulpextracts varied between 2.7 and 3.3 and that of peel extracts between 3.8 and 4.3. This variability didnot affect the spectra of pulp extracts, however the aromatic region (Figure S1) in peel extracts showeda certain degree of resonance shifts due to small pH changes. To avoid problems with the statisticalanalysis, larger bucket sizes were chosen for these areas.
Ten different samples for each cultivar were collected to assess the variability within a cultivar,where each sample combined material from five fruits each. This approach was chosen to reduceobvious effects stemming, e.g., from different exposures to sunlight.
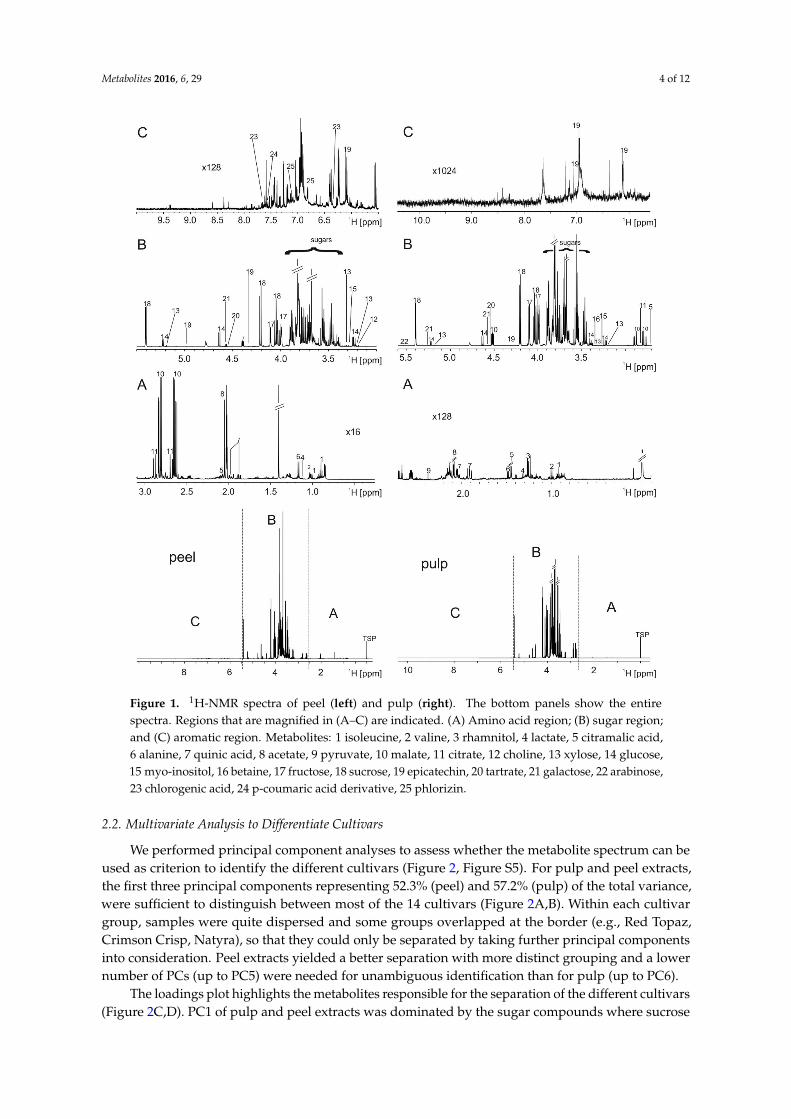
Figure S2 shows that pulp extracts were highly comparable within the 10 samples. Peel extractsshowed the abovementioned slight variations in peak position in some areas due to minor pH variancesobserved. Spectra of pulp and peel extracts were dominated by sugars resonances (glucose, sucrose,fructose), which comprised 96%–98% of the intensity in pulp extracts and still >94% in peel (Figure 1).The second highest concentration was found for the organic acids malate and citrate, which rangedbetween 2% and 4%. All other components had markedly lower intensities. Peak assignmentwas achieved from databases and spiking (Figure S4). Spectra of pulp and peel extracts showeda predominantly similar composition for metabolites resonating between 5.5 and 0.8 ppm like sugarsand aliphatic compounds (e.g., the amino acids), yet a few resonances were found only in respectivesubsets of cultivars (Figure S4).
Pulp and peel extracts differed, however, considerably in the aromatic area from 6.5 to 9 ppm,where resonances of polyphenolic compounds are found. These were low in fruit extracts, but enrichedin peel extracts, where they comprised up to 1% of the total intensity. Strikingly, the NMR studyof Tomita et al. [6] on juice or fruit extracts showed a considerably lower amount of polyphenoliccompounds. Whether this is an inherent feature of the cultivars investigated or due to cultivationconditions or year of growth cannot be answered on the basis of our data.
The entire bucket list comprised 116 buckets. Twenty-five compounds were identified (Figure 1,Table S1), of which many have several resonances. Thus approximately 42% of all resonances in thespectra could be assigned.
Metabolites 2016, 6, 29 4 of 12Metabolites 2016, 6, 29 4 of 12
Figure 1. 1H-NMR spectra of peel (left) and pulp (right). The bottom panels show the entire spectra. Regions that are magnified in (A–C) are indicated. (A) Amino acid region; (B) sugar region; and (C) aromatic region. Metabolites: 1 isoleucine, 2 valine, 3 rhamnitol, 4 lactate, 5 citramalic acid, 6 alanine, 7 quinic acid, 8 acetate, 9 pyruvate, 10 malate, 11 citrate, 12 choline, 13 xylose, 14 glucose, 15 myo-inositol, 16 betaine, 17 fructose, 18 sucrose, 19 epicatechin, 20 tartrate, 21 galactose, 22 arabinose, 23 chlorogenic acid, 24 p-coumaric acid derivative, 25 phlorizin
2.2. Multivariate Analysis to Differentiate Cultivars
We performed principal component analyses to assess whether the metabolite spectrum can be used as criterion to identify the different cultivars (Figure 2, Figure S5). For pulp and peel extracts, the first three principal components representing 52.3% (peel) and 57.2% (pulp) of the total variance, were sufficient to distinguish between most of the 14 cultivars (Figure 2A,B). Within each cultivar group, samples were quite dispersed and some groups overlapped at the border (e.g., Red Topaz, Crimson Crisp, Natyra), so that they could only be separated by taking further principal components into consideration. Peel extracts yielded a better separation with more distinct grouping and a lower number of PCs (up to PC5) were needed for unambiguous identification than for pulp (up to PC6).
Figure 1. 1H-NMR spectra of peel (left) and pulp (right). The bottom panels show the entirespectra. Regions that are magnified in (A–C) are indicated. (A) Amino acid region; (B) sugar region;and (C) aromatic region. Metabolites: 1 isoleucine, 2 valine, 3 rhamnitol, 4 lactate, 5 citramalic acid,6 alanine, 7 quinic acid, 8 acetate, 9 pyruvate, 10 malate, 11 citrate, 12 choline, 13 xylose, 14 glucose,15 myo-inositol, 16 betaine, 17 fructose, 18 sucrose, 19 epicatechin, 20 tartrate, 21 galactose, 22 arabinose,23 chlorogenic acid, 24 p-coumaric acid derivative, 25 phlorizin.
2.2. Multivariate Analysis to Differentiate Cultivars
We performed principal component analyses to assess whether the metabolite spectrum can beused as criterion to identify the different cultivars (Figure 2, Figure S5). For pulp and peel extracts,the first three principal components representing 52.3% (peel) and 57.2% (pulp) of the total variance,were sufficient to distinguish between most of the 14 cultivars (Figure 2A,B). Within each cultivargroup, samples were quite dispersed and some groups overlapped at the border (e.g., Red Topaz,Crimson Crisp, Natyra), so that they could only be separated by taking further principal componentsinto consideration. Peel extracts yielded a better separation with more distinct grouping and a lowernumber of PCs (up to PC5) were needed for unambiguous identification than for pulp (up to PC6).
The loadings plot highlights the metabolites responsible for the separation of the different cultivars(Figure 2C,D). PC1 of pulp and peel extracts was dominated by the sugar compounds where sucrose

Metabolites 2016, 6, 29 5 of 12
and malate were negatively correlated with glucose and fructose. PC2 was influenced differentlyin pulp and peel. In pulp, xylose was negatively correlated myo-inositol and epicatechin. In peel,polyphenolic compounds (ppm values > 6.2 ppm) also contributed to the distinction of the varieties.
The 14 quality control samples generated from a pool of all cultivars lay at the coordinate origin ina narrow area indicative of the high reproducibility of the method (Figure S6). Standard deviations forwell-resolved compounds in pulp extracts lay in the range of 0.4% for medium to highly concentratedcompounds like glucose, malate or citrate.
Metabolites 2016, 6, 29 5 of 12
The loadings plot highlights the metabolites responsible for the separation of the different cultivars (Figure 2C,D). PC1 of pulp and peel extracts was dominated by the sugar compounds where sucrose and malate were negatively correlated with glucose and fructose. PC2 was influenced differently in pulp and peel. In pulp, xylose was negatively correlated myo-inositol and epicatechin. In peel, polyphenolic compounds (ppm values > 6.2 ppm) also contributed to the distinction of the varieties.
The 14 quality control samples generated from a pool of all cultivars lay at the coordinate origin in a narrow area indicative of the high reproducibility of the method (Figure S6). Standard deviations for well-resolved compounds in pulp extracts lay in the range of 0.4% for medium to highly concentrated compounds like glucose, malate or citrate.
Figure 2. Principal component analysis (PCA) of peel (A) and pulp (B). (A,B) Scores plot showing three PCs (principal component) with their respective variation. Peel: R2X (PC1) = 24.1%, R2X (PC2) = 14.5%, R2X (PC3) = 11.7%, Q2 (PC1) = 21.4%, Q2 (PC2) = 15.3, Q2 (PC3) = 1.7. Pulp: R2X (PC1) = 30.7%, R2X (PC2) = 14.6%, R2X (PC3) = 11.9%, Q2 (PC1) = 28.9%, Q2 (PC2) = 12.1, Q2 (PC3) = 11.0. (C,D) Corresponding loadings plot. Loadings are labeled with substance name or ppm value. In case of overlapped resonances, only the ppm value is given.
Less concentrated metabolites like rhamnitol or galactose had standard deviations around 3%–4%. A similar value was also achieved for myo-inositol that is partially overlapping with glucose.
Figure 2. Principal component analysis (PCA) of peel (A) and pulp (B). (A, B) Scores plotshowing three PCs (principal component) with their respective variation. Peel: R2X (PC1) = 24.1%,R2X (PC2) = 14.5%, R2X (PC3) = 11.7%, Q2 (PC1) = 21.4%, Q2 (PC2) = 15.3, Q2 (PC3) = 1.7.Pulp: R2X (PC1) = 30.7%, R2X (PC2) = 14.6%, R2X (PC3) = 11.9%, Q2 (PC1) = 28.9%, Q2 (PC2) = 12.1,Q2 (PC3) = 11.0. (C, D) Corresponding loadings plot. Loadings are labeled with substance name orppm value. In case of overlapped resonances, only the ppm value is given.
Less concentrated metabolites like rhamnitol or galactose had standard deviations around3%–4%. A similar value was also achieved for myo-inositol that is partially overlapping with glucose.Even compounds like pyruvate or epicatechin, that were barely above noise level could be quantifiedbut with a comparably high standard deviation of 28% or 27%, respectively.
Metabolites 2016, 6, 29 6 of 12
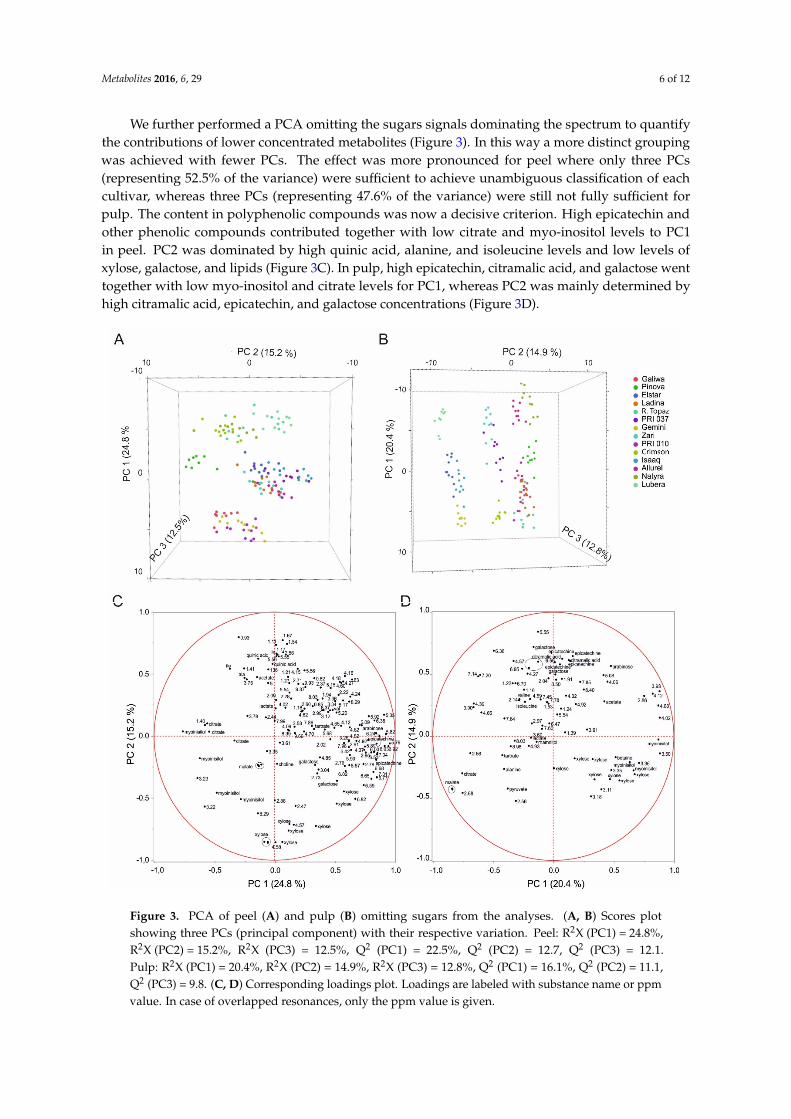
We further performed a PCA omitting the sugars signals dominating the spectrum to quantifythe contributions of lower concentrated metabolites (Figure 3). In this way a more distinct groupingwas achieved with fewer PCs. The effect was more pronounced for peel where only three PCs(representing 52.5% of the variance) were sufficient to achieve unambiguous classification of eachcultivar, whereas three PCs (representing 47.6% of the variance) were still not fully sufficient forpulp. The content in polyphenolic compounds was now a decisive criterion. High epicatechin andother phenolic compounds contributed together with low citrate and myo-inositol levels to PC1in peel. PC2 was dominated by high quinic acid, alanine, and isoleucine levels and low levels ofxylose, galactose, and lipids (Figure 3C). In pulp, high epicatechin, citramalic acid, and galactose wenttogether with low myo-inositol and citrate levels for PC1, whereas PC2 was mainly determined byhigh citramalic acid, epicatechin, and galactose concentrations (Figure 3D).
Metabolites 2016, 6, 29 6 of 12
Even compounds like pyruvate or epicatechin, that were barely above noise level could be quantified but with a comparably high standard deviation of 28% or 27%, respectively.
We further performed a PCA omitting the sugars signals dominating the spectrum to quantify the contributions of lower concentrated metabolites (Figure 3). In this way a more distinct grouping was achieved with fewer PCs. The effect was more pronounced for peel where only three PCs (representing 52.5% of the variance) were sufficient to achieve unambiguous classification of each cultivar, whereas three PCs (representing 47.6% of the variance) were still not fully sufficient for pulp. The content in polyphenolic compounds was now a decisive criterion. High epicatechin and other phenolic compounds contributed together with low citrate and myo-inositol levels to PC1 in peel. PC2 was dominated by high quinic acid, alanine, and isoleucine levels and low levels of xylose, galactose, and lipids (Figure 3C). In pulp, high epicatechin, citramalic acid, and galactose went together with low myo-inositol and citrate levels for PC1, whereas PC2 was mainly determined by high citramalic acid, epicatechin, and galactose concentrations (Figure 3D).
Figure 3. PCA of peel (A) and pulp (B) omitting sugars from the analyses. (A,B) Scores plot showing three PCs (principal component) with their respective variation. Peel: R2X (PC1) = 24.8%, R2X (PC2) = 15.2%, R2X (PC3) = 12.5%, Q2 (PC1) = 22.5%, Q2 (PC2) = 12.7, Q2 (PC3) = 12.1. Pulp: R2X (PC1) = 20.4%, R2X (PC2) = 14.9%, R2X (PC3) = 12.8%, Q2 (PC1) = 16.1%, Q2 (PC2) = 11.1, Q2 (PC3) = 9.8. (C,D) Corresponding loadings plot. Loadings are labeled with substance name or ppm value. In case of overlapped resonances, only the ppm value is given.
Figure 3. PCA of peel (A) and pulp (B) omitting sugars from the analyses. (A, B) Scores plotshowing three PCs (principal component) with their respective variation. Peel: R2X (PC1) = 24.8%,R2X (PC2) = 15.2%, R2X (PC3) = 12.5%, Q2 (PC1) = 22.5%, Q2 (PC2) = 12.7, Q2 (PC3) = 12.1.Pulp: R2X (PC1) = 20.4%, R2X (PC2) = 14.9%, R2X (PC3) = 12.8%, Q2 (PC1) = 16.1%, Q2 (PC2) = 11.1,Q2 (PC3) = 9.8. (C, D) Corresponding loadings plot. Loadings are labeled with substance name or ppmvalue. In case of overlapped resonances, only the ppm value is given.

Metabolites 2016, 6, 29 7 of 12
2.3. Cluster Analysis
The high number of cultivars precludes an easy analysis of the relationships between the cultivars.Therefore, we performed a hierarchical cluster analysis (Figure 4). All samples from a given cultivarclustered together regardless of whether sugars were included or omitted from the analysis. The onlyexception was one sample of Galiwa that clustered together with Pinova Evelina, but the reason forthat was not clear. Omitting the sugars, however, changed the relationship between the cultivars.Cultivars that are related like red Topaz and Ladina (parent and offspring) or Elstar v.d. Zalm andZari (parent and offspring) or Allurel and Natyra (the latter share a common parent: Elise) did notnecessarily cluster together.
Metabolites 2016, 6, 29 7 of 12
2.3. Cluster Analysis
The high number of cultivars precludes an easy analysis of the relationships between the cultivars. Therefore, we performed a hierarchical cluster analysis (Figure 4). All samples from a given cultivar clustered together regardless of whether sugars were included or omitted from the analysis. The only exception was one sample of Galiwa that clustered together with Pinova Evelina, but the reason for that was not clear. Omitting the sugars, however, changed the relationship between the cultivars. Cultivars that are related like red Topaz and Ladina (parent and offspring) or Elstar v.d. Zalm and Zari (parent and offspring) or Allurel and Natyra (the latter share a common parent: Elise) did not necessarily cluster together.
Figure 4. Hierarchical clustering of peel (A,C) and pulp (B,D) extracts. (A,B) All metabolites were used for analysis; (C,D) sugars were omitted from the analysis.
Figure 4. Hierarchical clustering of peel (A,C) and pulp (B,D) extracts. (A,B) All metabolites were usedfor analysis; (C,D) sugars were omitted from the analysis.

Metabolites 2016, 6, 29 8 of 12
We also performed partial least squares (PLS)/canonical analysis (CA), separating the cultivarsinto scab mildew resistant (SMR) and non-SMR. Although the groups could be separated, the variationin concentration for those metabolites, that were supposed to be responsible for the separation, was notsignificant. As a PLS–CA with randomized assignment of the cultivars to either of the groups achieveda seemingly as good separation, we concluded that the fruit metabolome variation within the currentset of cultivars does not allow for the investigation of disease susceptibility.
3. Discussion
Since modern apples have been developed from a handful of ancestors [16,17], it was not tobe expected a priori that their fruit metabolomes would be sufficient for discrimination between thesometimes closely related cultivars of this study. Of the 14 cultivars used in this study at least 6 descendfrom Golden Delicious either as direct offspring (Pinova Evelina, Crimson Crisp, and Elstar) orone breeding generation later (Zari, Galiwa, Gemini). Yet, all cultivars could be identified by untargetedanalyses both in PCA and in hierarchical cluster analyses. Previous NMR analyses had already shownsimilar results, but had been performed with lower numbers of and/or a more diverse relationshipbetween the cultivars [6–8]. In comparison, the discriminative power of peel extracts was substantiallyhigher than that of pulp extracts. This was mainly due to the presence of aromatic and polyphenolicmetabolites that are enriched in peel, but are only present to a low extent in pulp. Omitting highlyconcentrated sugars resonances from the analysis helped in the discrimination of the cultivars.
Intensities observed in the NMR spectra directly correlate with relative concentrations ofsubstances and thus can be used for analysis of key compounds. Figure 5 shows an analysis ofthe total content in metabolite classes, aromatics, sugars, acids and amino acids. Aromatic compoundscomprised the region between 6 and 10 ppm, where the resonances of polyphenols, but alsocompounds with single aromatic rings like chlorogenic acid and coumaric acid or their derivativesoccur. Sugars were taken from the intensities of the area between 3.2 and 5.5 ppm, where mainlyglucose, fructose, and sucrose resonances are found. The term acids in Figure 5 comprises citrate andmalate, and the term amino acids summarizes the resonances between 0.8 and 1.5 ppm. The intensitiesdetermined in this way can only be an indication for the respective concentrations as neither thenumber of compounds in the spectral region nor the number hydrogens giving rise to the signals wastaken into account. Figure 5 reveals that the sugar content was quite comparable over all 14 cultivars,probably reflecting the selection criteria for newly bred cultivars with good market potential. Acids andaromatic compounds of peel extracts, however, were more diverse among the cultivars.
Cuthbertson et al. were able to cluster Red Delicious, Golden Delicious, Cox’s Orange Pippin,Gala, Fuji, and Granny Smith according to their genealogy based on the fruit metabolome [9].The set of cultivars presented here comprised several pairs of closely related cultivars and thus waswell-suited to test the discriminative power of the fruit metabolome in terms of genetic relationship.Hierarchical clustering grouped the cultivars into two main groups (Figure 4). The grouping, however,only roughly correlated with genetic relationship, contrary to the previous observation [9]. Allurel andNatyra, which share a parent, formed neighboring clusters. Topaz and Ladina (parent and offspring)grouped together in peel extracts’ analyses, but only when the dominating sugars were not considered.Elstar and Zari (parent and offspring), on the other hand, did not even belong to the same main cluster.
Since eight of the investigated cultivars were scab and mildew resistant and another two scabresistant (Table 1) we also reassessed the predictive potential of the fruit metabolome for this purpose.A positive outcome of such an analysis would be very interesting for breeding purposes and waspostulated in a recent publication where a high fruit content in polyphenolic compounds was discussedas potentially effective against pests [15]. In our analysis, however, we failed to detect a connectionbetween the fruit metabolome and SMR. Resistant cultivars were equally distributed between thetwo main cluster groups and no grouping within the subgroups was discernible that could be relatedto scab or mildew resistance.

Metabolites 2016, 6, 29 9 of 12
Metabolites 2016, 6, 29 9 of 12
between the two main cluster groups and no grouping within the subgroups was discernible that could be related to scab or mildew resistance.
Figure 5. Relative intensities compound classes for all cultivars. Mean intensities and their standard deviation are shown for peel on the left and for pulp on the right where available.
In summary, NMR-based metabolomics analyses of apple varieties can provide a simple non-targeted and straightforward method to give a comprehensive view on the metabolomics variety of all medium to highly concentrated analytes. Cultivar-specific differences in the profiles of nonvolatile metabolites allowed even within a set of rather similar cultivars a correct and easy classification. We are convinced that this approach will prove its high potential for identification and validation in view of food authenticity applications.
4. Materials and Methods
4.1. Plant Material and Sampling
Apples were cultivated in a pesticide-reduced system at the Competence Center of DLR Rheinpfalz, Klein-Altendorf, Germany. In total, 14 cultivars were investigated of which 13 (“Allurel”, “Crimson Crisp”, “Galiwa”, “Gemini”, “Isaaq”, “Ladina”, “Lubera”, “Natyra”, “Pinova Evelina”, “PRI010”, “PRI037”, “Roter Topaz”, and “Zari” ) were newly bred or brought onto the market in recent years. “Elstar van der Zalm” served as a reference cultivar. Fruits were harvested at commercial maturity in August or September 2014, randomized and stored at 2–3 °C until transport
Figure 5. Relative intensities compound classes for all cultivars. Mean intensities and their standarddeviation are shown for peel on the left and for pulp on the right where available.
In summary, NMR-based metabolomics analyses of apple varieties can provide a simplenon-targeted and straightforward method to give a comprehensive view on the metabolomics variety ofall medium to highly concentrated analytes. Cultivar-specific differences in the profiles of nonvolatilemetabolites allowed even within a set of rather similar cultivars a correct and easy classification. We areconvinced that this approach will prove its high potential for identification and validation in view offood authenticity applications.
4. Materials and Methods
4.1. Plant Material and Sampling
Apples were cultivated in a pesticide-reduced system at the Competence Center of DLRRheinpfalz, Klein-Altendorf, Germany. In total, 14 cultivars were investigated of which 13(“Allurel”, “Crimson Crisp”, “Galiwa”, “Gemini”, “Isaaq”, “Ladina”, “Lubera”, “Natyra”,“Pinova Evelina”, “PRI010”, “PRI037”, “Roter Topaz”, and “Zari” ) were newly bred or broughtonto the market in recent years. “Elstar van der Zalm” served as a reference cultivar. Fruits wereharvested at commercial maturity in August or September 2014, randomized and stored at 2–3 ◦Cuntil transport to the lab in Karlsruhe. Apples were stored at 1 ◦C and a humidity of 95% until sampleswere probed in October 2014.

Metabolites 2016, 6, 29 10 of 12
For each cultivar, 10 samples were collected, combining material from five fruits each. Peel andpulp samples were taken separately. Peel was sampled by cutting two longitudinal thin strips fromopposite sides with a ceramic scalpel. After immediate freezing in liquid nitrogen, the peel was groundand transferred to 20 mL screw-cap glasses. After removing the surrounding peel, fruit pulp wassampled at the same spot as the peel by cutting off small pieces with a ceramic knife. Pulp samples werefurther treated as the peel samples. The frozen material was lyophilised for 72–84 h (Alpha 2–4 LSC,Christ, Osterode, Germany). As the dried peel samples of the different cultivars had a different firmness,the grinding procedure was done in a cultivar-specific way in order to obtain a comparable grindingresult. Usually, peel samples were first ground with a knife mill (A11 basic, IKA GmbH & Co., KG,Staufen, Germany) for 1 min (if necessary) and finally milled with a ball mill (MM200, Retsch GmbH,Haan, Germany) for 2–4 min at 25 Hz. In case of pulp samples, milling with the ball mill for 1 min at25 Hz was always sufficient. All samples were stored until further analysis in 2 mL Eppendorf tubesat −80 ◦C.
4.2. Sample Preparation
Samples were extracted with 10 mg/200 µL buffer. Acetate-d4 buffer (200 mM acetate-d4, pH 4.08,1 mM TSP, 0.2 mM EDTA, 9:1 H2O/D2O) was used for peel, and phosphate buffer (200 mM, pH 3.04,1 mM TSP, 0.2 mM EDTA, 9:1 H2O/D2O) for pulp. Samples were resuspended and then incubatedat room temperature for 20 min. Thereafter, the samples were centrifuged at 11,000 g for 30 min(apple pulp) and 45 min (apple peel). Six hundred microliters of the supernatant were transferred to5 mm NMR tubes (Duran group) and were measured within 24 h. Quality control samples consistedof samples pooled from all cultivars.
4.3. 1H-NMR Spectroscopy
An 1H-NMR (NOESYGPPR1D) and a 2D J resolved spectrum was recorded for each sample at300 K on a 600 MHz Avance II spectrometer (Bruker Biospin, Rheinstetten, Germany) using a doubleresonance 5 mm BBI probe with actively shielded z-gradients. Data acquisition and processingwere carried out with Topspin 3.2. The water signal was suppressed using a presaturation pulse witha bandwidth of 25 Hz. Spectra were acquired with 32 scans, 96 k data points, a spectral width of 30 ppmand a relaxation delay of 10 s. Spectra were automatically processed, phase- and baseline-correctedusing an exponential window function with a line-broadening factor of 0.3 Hz. They were calibratedsetting the TSP signal to 0 ppm. Quality control samples were regularly measured (1 quality controlsample per 10 samples) to control the reproducibility of the measurements with time.
4.4. Data Processing of the NMR Spectra and Multivariate Pattern Recognition
NMR spectra data were normalized to total intensity between 0.6 and 9.7 ppm and integratedfollowing a variable sized bucketing pattern in AMIX 3.9.9 (Bruker Biospin, Rheinstetten, Germany),excluding the regions corresponding to noise and water/HOD (δ 4.73–4.83 ppm). Chemical shiftassignment was achieved by comparison with database entries (FOODB [18], HMDB [19]), literature,or through spiking with pure substances (Figure S3). Bucket tables were imported in JMP genomicsversion 12.2.0 (SAS, Cary, NC, USA) for multivariate analysis. Data were scaled to unit variance to takeinto account also small signals. Principal components analysis (PCA) was used as an unsupervisedpattern recognition method. In addition, the data were analyzed by hierarchical clustering algorithms(complete linkage and Pearson’s correlation distance methods).
5. Conclusions
We could show that for a set of apple cultivars correct classification can be achieved by principlecomponent analysis of peel or pulp extracts. Further in-depth analysis failed to correlate theextracted metabolites with the genetic relationship between cultivars, contrary to previous studies.

Metabolites 2016, 6, 29 11 of 12
Likewise, we had to reject the hypothesis that fruit metabolites’ analyses can yield easy criteria toidentify scab or mildew resistance, at least for our selection of cultivars. We therefore conclude that theuntargeted NMR analysis of peel or pulp extracts presents an efficient tool to differentiate betweenclosely related species and/or for quality control, however it may not be a priori suitable to be used inmore advanced applications.
Supplementary Materials: The following are available online at www.mdpi.com/2218-1989/6/3/29/s1,Figure S1: pH shifts observed for peel extracts exemplified for four different cultivars; Figure S2: sample variabilitywithin pulp extracts; Figure S3: Spiking with pure substances to identify polyphenolic compounds; Figure S4:Sample variability between the cultivars; Figure S5: PCA two-dimensional views; Figure S6: Reproducibility ofthe method; Table S1: List of identified compounds.
Acknowledgments: B.L. and C. M.-G. thank the Deutsche Forschungsgemeinschaft, the Open Access PublishingFund of Karlsruhe Institute of Technology, and the HGF program BIFTM for financial support. Measurements wereperformed at the DFG instrumentation facility Pro2NMR.
Author Contributions: P.E., C.H.W., P.T., B.L., and C.M.-G. conceived and designed the experiments; P.E., P.T.,M.J.R., and M.S. performed the experiments; P.E., M.S., and C.M.-G. analyzed the data; M.E. contributed materials;C.M.-G. wrote the paper.
Conflicts of Interest: The authors declare no conflict of interest. The founding sponsors had no role in the designof the study; in the collection, analyses, or interpretation of data; in the writing of the manuscript, and in thedecision to publish the results.
References
1. Monakhova, Y.B.; Godelmann, R.; Hermann, A.; Kuballa, T.; Cannet, C.; Schafer, H.; Spraul, M.;Rutledge, D.N. Synergistic effect of the simultaneous chemometric analysis of 1H-NMR spectroscopicand stable isotope (SNIF-NMR, 18O, 13C) data: Application to wine analysis. Anal. Chim. Acta 2014, 833,29–39. [CrossRef] [PubMed]
2. Vanzo, A.; Jenko, M.; Vrhovsek, U.; Stopar, M. Metabolomic profiling and sensorial quality of‘Golden Delicious’, ‘Liberty’, ‘Santana’, and ‘Topaz’ apples grown using organic and integrated productionsystems. J. Agric. Food Chem. 2013, 61, 6580–6587. [CrossRef] [PubMed]
3. Troggio, M.; Gleave, A.; Salvi, S.; Chagné, D.; Cestaro, A.; Kumar, S.; Crowhurst, R.N.; Gardiner, S.E.Apple, from genome to breeding. Tree Genet. Genomes 2012, 8, 509–529. [CrossRef]
4. Aprea, E.; Gika, H.; Carlin, S.; Theodoridis, G.; Vrhovsek, U.; Mattivi, F. Metabolite profiling on apple volatilecontent based on solid phase microextraction and gas-chromatography time of flight mass spectrometry.J. Chromatogr. A 2011, 1218, 4517–4524. [CrossRef] [PubMed]
5. Schmidt, J.S.; Lauridsen, M.B.; Dragsted, L.O.; Nielsen, J.; Staerk, D. Development of a bioassay-coupledHPLC-SPE-ttNMR platform for identification of alpha-glucosidase inhibitors in apple peel (Malus xdomesticaBorkh.). Food Chem. 2012, 135, 1692–1699. [CrossRef] [PubMed]
6. Tomita, S.; Nemoto, T.; Matsuo, Y.; Shoji, T.; Tanaka, F.; Nakagawa, H.; Ono, H.; Kikuchi, J.;Ohnishi-Kameyama, M.; Sekiyama, Y. A NMR-based, non-targeted multistep metabolic profiling revealedL-rhamnitol as a metabolite that characterised apples from different geographic origins. Food Chem. 2015,174, 163–172. [CrossRef] [PubMed]
7. Vermathen, M.; Marzorati, M.; Baumgartner, D.; Good, C.; Vermathen, P. Investigation of different applecultivars by high resolution magic angle spinning NMR. A feasibility study. J. Agric. Food Chem. 2011, 59,12784–12793. [CrossRef] [PubMed]
8. Vermathen, M.; Marzorati, M.; Vermathen, P. Exploring high-resolution magic angle spinning (HR-MAS)NMR spectroscopy for metabonomic analysis of apples. Chimia 2012, 66, 747–751. [CrossRef] [PubMed]
9. Cuthbertson, D.; Andrews, P.K.; Reganold, J.P.; Davies, N.M.; Lange, B.M. Utility of metabolomics towardassessing the metabolic basis of quality traits in apple fruit with an emphasis on antioxidants. J. Agric.Food Chem. 2012, 60, 8552–8560. [CrossRef] [PubMed]
10. De Paepe, D.; Valkenborg, D.; Noten, B.; Servaes, K.; Diels, L.; de Loose, M.; Van Droogenbroeck, B.;Voorspoels, S. Variability of the phenolic profiles in the fruits from old, recent and new apple cultivarscultivated in Belgium. Metabolomics 2015, 11, 739–752. [CrossRef]

Metabolites 2016, 6, 29 12 of 12
11. Vaclavik, L.; Schreiber, A.; Lacina, O.; Cajka, T.; Hajslova, J. Liquid chromatography–massspectrometry-based metabolomics for authenticity assessment of fruit juices. Metabolomics 2012, 8, 793–803.[CrossRef]
12. Farneti, B.; Khomenko, I.; Cappellin, L.; Ting, V.; Romano, A.; Biasioli, F.; Costa, G.; Costa, F.Comprehensive VOC profiling of an apple germplasm collection by PTR-ToF-MS. Metabolomics 2015, 11,838–850. [CrossRef]
13. Sansavini, S.; Donati, F.; Costa, F.; Tartarini, S. Advances in apple breeding for enhanced fruit quality andresistance to biotic stresses: New varieties for the European market. J. Fruit Ornam. Plant Res. 2004, 12, 13–52.
14. Wolfe, K.; Wu, X.; Liu, R.H. Antioxidant activity of apple peels. J. Agric. Food Chem. 2003, 51, 609–614.[CrossRef] [PubMed]
15. Sciubba, F.; di Cocco, M.E.; Gianferri, R.; Capuani, G.; de Salvador, F.R.; Fontanari, M.; Gorietti, D.; Delfini, M.Nuclear Magnetic Resonance-Based Metabolic Comparative Analysis of Two Apple Varieties with DifferentResistances to Apple Scab Attacks. J. Agric. Food Chem. 2015, 63, 8339–8347. [CrossRef] [PubMed]
16. Noiton, D.A.M.; Alspach, P.A. Founding Clones, Inbreeding, Coancestry, and Status Number of ModernApple Cultivars. J. Am. Soc. Hortic. Sci. 1996, 121, 773–782.
17. Patzak, J.; Paprstein, F.; Henychova, A.; Sedlak, J. Genetic diversity of Czech apple cultivars inferred frommicrosatellite markers analysis. Hortic. Sci. 2012, 39, 149–157.
18. Wishart, D.S.; Tzur, D.; Knox, C.; Eisner, R.; Guo, A.C.; Young, N.; Cheng, D.; Jewell, K.; Arndt, D.;Sawhney, S.; et al. HMDB: The Human Metabolome Database. Nucleic Acids Res. 2007, 35, D521–D526.[CrossRef] [PubMed]
19. Wishart, D.S. Metabolomics: Applications to food science and nutrition research. Trends Food Sci. Technol.2008, 19, 482–493. [CrossRef]
© 2016 by the authors; licensee MDPI, Basel, Switzerland. This article is an open accessarticle distributed under the terms and conditions of the Creative Commons Attribution(CC-BY) license (http://creativecommons.org/licenses/by/4.0/).
Recommended