Univers
ity of
Cap
e Tow
n
UNIVERSITY OF CAPE TOWN
DEPARTMENT OF MECHANICAL ENGINEERING
UTILIZATION OF MECHANICAL
ENGINEERING MANPOWER IN SOUTH AFRICA
BY
OSWALD SCHWEITZER WESLEY FRANKS
Pr Eng B.Sc.(Eng) (U.C.T.),
Grad~ Dipl.Ind.Ad.min.,
.Govt. Cert. of Competency (Mines and Works).
Submitted to the University of Cape Town in Partial fulfilment of the requirements for the degree of Master in Industrial Ad.ministration.
OCTOBER 1989
-------~iY'..ftfli~.JI~. The University of Cape Town has been given the right to reproriuce this thesis In whole or in part. Copyright is held l.iy the author.
The copyright of this thesis vests in the author. No quotation from it or information derived from it is to be published without full acknowledgement of the source. The thesis is to be used for private study or non-commercial research purposes only.
Published by the University of Cape Town (UCT) in terms of the non-exclusive license granted to UCT by the author.
Univers
ity of
Cap
e Tow
n

Univers
ity of
Cap
e Tow
n
ABSTRACT
The South African eco~omy is currently experiencing a slow growth
rate as a result of amongst other things, a shortage of engineers
and technicians.
This study sets out to investigate the present utilization and
shortage of mechanical engineers. It was felt that with a
comprehensive knowledge of the utilization of mechanical engineers,
industrialists would be better equipped to improve productivity by
taking the necessary steps to ensure effective utilization of
engineering manpower.
The study gathered empirical data, by means of a survey, from seven
hundred and sixty seven (767) respondents located throughout South
Africa.
The study established that the present utilization of mechanical
engineers is about sixty (60) percent and that the most probable
cause of the poor utilization is a lack of sufficient technical
support staff for the engineer.
Various methods of improving the utilization of mechanical
engineers were examined.
',i;
The supply-and demand for mechanical engineers was reviewed and it
was established that the shortage of engineers is very sensitive
to variations in utilization.
(i)

Univers
ity of
Cap
e Tow
n
(
I, Oswald Schweitzer Wesley Franks, submit this
thesis for the degree of Master in Industrial
Administration. I clai~ that this is my original
work and that it has not been submitted in this or
similar form for a degree at any university.
Univers
ity of
Cap
e Tow
n
ACKNOWLEDGMENTS
I acknowledge the encouragement and guidance given
by Mr G Lister of the Department of Mechanical
Engineering, University of Cape Town.
I also owe a debt of gratitude to the respondents
who, by their participation, made this study
possible.
Finally, I wish to express my gratitude to the
Academic Board of Peninsula Technikon for
approving the financial support I required to
undertake this study.
(ii)

Univers
ity of
Cap
e Tow
n
'
TABLE OF CONTENTS
ABSTRACT
ACKNOWLEDGEMENTS
TABLE OF CONTENTS
CHAPTER 1 - INTRODUCTION
1.1 The Problem
1. 2 The Aim and Scope of the Study
1.3 The Concept of Utilization
1.4 The Personnel in Engineering: Definitions
1.5 The Structure of Engineering Manpower
CHAPTER 2 - LITERATURE SURVEY
2.2
2.3
2.4
The Applicability of Foreign Research
Literature on the South African Situation
A Brief Review of Foreign studies Conducted
on the Utilization of Mechanical Engineers
A Review of Studies Conducted in South Africa
on the Utilization of Mechanical Engineers
General Comments
'
, . (iii)
i
ii
iii
1
1
3
6
10
13
17
17
18
26
34
Univers
ity of
Cap
e Tow
n
CHAPTER 3 - THE RELATION OF UTILIZATION TO THE
SHORTAGE OF MECHANICAL ENGINEERS
3.1 A Review of Supply and Demand for Engineers
3.2. Factors Indicating Manpower Shortages
3.3 The Model Used to Quantify the "Shortage"
3.4 The Utilization Model
CHAPTER 4 - THE RESEARCH METHOD
4.1 The survey Sample
4 •. 2 Procedure for the Study
4.3 Validity of the Survey Sample
4.4 The Objective and Structure of the
Questionnaire
4.5 Analysis of Results
CHAPTER 5 - RESULTS
5.1 A Profile of the Survey Group
5.2
5.3
5.4
Utilization of Mechanical Engineers
Factors Causing Poor Utilization
Training Requirements of a Mechanical Technician
(iv)
36
36
38
41
44
51
51
52
54
56
58
59
59
72
82
85

Univers
ity of
Cap
e Tow
n
CHAPTER 6 - DISCUSSION
Introduction
Utilization in Practice
Causes of Poor Utilization
6.1
6.2
6.3
6.4
6.5
Support Personnel for Mechanical Engineers
Changing Work Patterns with Increasing
Experience
6.6 Engineering Education for Improved Utilization
CHAPTER 7 - CONCLUSIONS AND RECOMMENDATIONS
7.1
7.2
7.3
Introduction
Conclusions
Recommendations
COMBINED REFERENCE LIST AND BIBLIOGRAPHY
APPENDICES
APPENDIX I - Determination of Professionally
Qualified Immigrants
APPENDIX II - Supply and Demand Data
APPENDIX III - Questionnaire for Engineers
APPENDIX IV - Questionnaire for Companies
APPENDIX v - Survey Letter
APPENDIX VI - DBaseIII Program
APPENDIX VII - Calculation of Manpower Savings
(v)
PAGE
87
87
88
94
96
98
102
106
106
106
110
113
119
121
122
124
125
126
129
Univers
ity of
Cap
e Tow
n
LIST OF TABLES
Table 1 - Per Cent of Time devoted to Activities 19
Table 2 - Per Cent of Time in Utilization Categories 21
Table 3 - Per Cent of Time Devoted to Efficient and 21
Table 4
Table 5
Table 6
Table 7
Table 8
Table 9
Inefficient Utilization
- Discipline of Respondents
- Ratio of Technicians to Engineers
- Functions Performed by Mechanical Engineers
- Analysis of Replies
- Age Structure of Survey Group
- Occupational Structure of Survey Group
32
33
47
52
61
63
Table 10 - Management Structure of Survey Group 66
Table 11 - Academic Qualifications 67
Table 12 - Qualification Level of survey Group 69
Table 13 Remuneration Structure of Survey Group 70
Table 14 - Sex Classification of Respondents 71
Table 15 - Percentage of Time Devoted to Functions 73
Table 16 - Average Percentage of Time Spent on each 74
Job Function by Survey Group
Table 17 - Percentage of Working Time Spent on a 76
Function that could be Performed by a
Person with a Lower Qualification
(vi)

Univers
ity of
Cap
e Tow
n
Table 18 - Hours Worked per Annum 78
Table 19 - Annual Manpower savings 80
Table 20 - Qualification Requirements of Technicians 84
Table 21 - Contribution of Various Factors to
Poor Utilization
Table 22 - Variation in Time Spent on Activities
with Increasing Experience
LIST OF FIGURES
Figure 1 - supply and Demand of Mechanical Engineers
Figure 2 - Cillier's Utilization Model
Figure 3 - The Utilization Model
Figure 4 - Age Structure of Survey Group
Figure 5 - Occupational Structure
Figure 6 Management Structure
Figure 7 - Variation in Time Spent on Activities
with Increasing Experience
(vii)
86
99
43
45
46
60
64
65
100

Univers
ity of
Cap
e Tow
n
CHAPTER 1
INTRODUCTION
1.1 THE PROBLEM
For more than two decades there has been great international
concern over the shortage and utilization of engineering
manpower the quality and quantity of this important
segment of the labour force and the methods to ensure their
most efficient use< 1>.
In South Africa these concerns have manifested themselves in
various research studies, conferences and surveys as
indicated below:
Independent research studies conducted by Ebersohn( 2 ),
Terblanche< 3 > and Cilliers< 4 > revealed that despite
the shortage of engineers in all disciplines, engineers
frequently perform activities which could
adequately performed by less qualified personnel such
as technicians.
be
Annual manpower surveys conducted by the Department of
Manpower, and more recently by the Central Statistical
services, have indicated shortages of all types of
engineers for more than a decadeC 5>.
1
Univers
ity of
Cap
e Tow
n
A recent study undertaken by the Human Sciences Research
Council (HSRC) projected that the shortage of engineers
in South Africa is most likely to continue to the turn
of the twentieth centuryC6).
As early as July 1965 a national conference held in
Pretoria "expressed concern at the shortage of
professional engineers" and resolved amongst other
things "that all steps be taken to ensure optimal
utilization of our technological manpower"(?).
The concerns over the shortage and utilization of
engineering manpower are not confined to South Africa.
In the United States of America, the July 1983
publication of the Scientific Manpower Commission
stated "Following a two year investigation, the
Business Higher Education forum found that a high
demand for engineers in USA will continue through the
1980's".
The utilization of engineering manpower was given high
. l·evel attention in America in the early 1960 • s and in
his article Torpey< 8 > spells out policies adopted by
the President of the United States of America in order
2
Univers
ity of
Cap
e Tow
n
to bring about improved utilization of Engineers and
Scientists. Hirsch< 9 ) suggested that the problems of
"shortage" and "utilization" of engineering manpower
are interrelated and that the "shortage" of scientific
manpower· may be due primarily to the inefficient and
wasteful use of the present supply.
More specifically, research conducted by Terblanche in
1982 found that in a sample of 1172 civil engineers
about 27% of the work performed by civil engineers
could be performed
qualification< 10>. by persons with a lower
1.2 THE AIM AND SCOPE OP THB STUDY
The aim of the study was to empirically establish:
( i) the present utilization of mechanical engineers in
South Africa and to determine the extent to which
improved utilization could contribute to solving the
problem of "shortage" of mechanical engineers,
c iir the extent to which five preselected factors
contribute to poor utilization of mechanical
engineers, and
3
Univers
ity of
Cap
e Tow
n
(iii) the nature (administrative or technical) and the level
of academic training required by the personnel who
could perform certain tasks currently being executed
by mechanical engineers.
With the aforementioned aims in mind, the study examined, by
means of a literature survey, other relevant aspects which
included:
the historical development of mechanical engineering
in South Africa;
the structure of manpower requirements in engineering
and
supply and demand for engineers.
The study examined the work patterns of mechanical
engineers, and the activities they performed were
categorised into the following groups:
Preliminary Investigation
Development of Design
Detail Design documentation
Communications
Measurement and Estimating
4

Univers
ity of
Cap
e Tow
n
Investigation and Evaluation
Project Management
Maintenance
Management
Administration
Marketing, Promotion and Sales
Education and Training
Travel
Other.
Empirical data made it possible to determine:
the average time mechanical
different activities ie. the
apportion their time,
engineers devote to
manner in which they
the extent to which the activities performed by
mechanical engineers could be performed by less
qualified persons,
• the saving of mechanical engineers that could possibly
be attained if they were more effectively utilized,
5

Univers
ity of
Cap
e Tow
n
. the nature (technical or administrative) and level of
training required by the person performing a portion of
the engineers' activities,
areas of poor utilization, and
reasons for poor utilization.
A total of 767 respondents participated in the study. It
should, however, be emphasized that the survey was confined
to mechanical engineers registered with the South African
Institution of Mechanical Engineers (SAI Mech E). Therefore,
the survey might be biased due to the type of engineers who
join SAI Mech E. This study should be considered a pilot
study, for further research into similar topics associated
with the other engineering disciplines.
1.3 THE CONCEPT OP UTILIZATION
In a study of the utilization of engineering manpower it is
necessary to examine exactly what is meant by the term
"utilization". The term "utilization" does not embrace a
single concept. Hirsch contends that good utilization
involves at least two thingsCll):
(1) Employing engineering manpower in occupations for which
it is well suited by virtue of its ability, experience
and education.
6

Univers
ity of
Cap
e Tow
n
(2) Employing engineering manpower so that it is able to
make a useful contribution to society.
Any time an engineer carries a piece of test equipment from
one location to another, he or she is performing work. This
may represent useful work if the instrument is needed at the
second location and not at the first, so in a sense,
productive work has been performed. However, it is equally
obvious that to perform work of the type described, the
engineers training was unnecessary. Hence productive
utilization could be defined as the performance of that work
for which the engineer has had unique training and/or
experience.
It is recognised that it would be desirable to discuss
present and potential future utilization of engineers in
quantitative rather th.an qualitative terms. When trying to
employ such quantitative values however, it is difficult to
determine exactly what should be measured, how to perform
the measurement,· and finally how to validate the
measurements. By comparison, in manufacturing terms, if a
man is to produce X units of a predefined minimum acceptable
quality, in a unit time, his actual output can be compared
to X, and efficiency and other rating data can be
obtained. Since the output of an engineer mainly comprises
the discovery of new facts, the invention of new methods of
7
Univers
ity of
Cap
e Tow
n
doing things, or the combination of known concepts to create
new devices and mechariisms, against what standard do we
measure? Is it correct to say that the engineer who works
for forty-five (45) hours per week but rarely produces new
ideas is better utilized than one who is absent half the
time but makes valuable inventions? What output is to be
measured - is it the number of inventions, the number of
technical reports, or any one of the many other possible
· items or forms .of output?
The literature on topics related to manpower utilization
frequently refers to the benefits which could accrue if
improved utilization could be attained< 12 ). However, no
previous ·research, has determined the order of magnitude of
improved utilization which might be expected.
Hence, no scientifically established datum for full or 100
percent utilization is known to exist. Realistically, one
could not expect to obtain 100 percent utilization of
engineers or any other type of human resource.
As opposed to examining the term "utilization" in respect of
qualitative or quantitative considerations, utilization may
alternatively be viewed from the perspective of labour
economics< 13 >. Labour economists have examined the term ,
"utilization" as it is perceived by employers and employees.
8

Univers
ity of
Cap
e Tow
n
Firstly, from the point of view of employers, the term
"utilization" refers to the role of engineers in producing
an output at minimum cost.
A second point of view regarding utilization is that of the
employees. Here, the worker asks "How can I use this
occupation to achieve my goals in life?" obviously, the
interest of the employer in cost minimization will not
coincide with the goals of the employee who seeks to
maximize his or her remuneration.
Having considered utilization from the labour economics view
the concept of utilization of manpower remains clouded
because of the different underlying interests of employers
and employees< 14 >.
The context in which the term "utilization" has been used in
this study requires elucidation. In an attempt to establish
a quantitative measure of utilization the manner in which
the engineer spends his or her working time was examined.
The total time an engineer spends at work was taken to be
100 percent. An analysis of the activities performed by an
engineer revealed that certain activities performed by the
engineer could be performed by a person with less formal
education or training than an engineer. Thus for example
if .it was established that for 30 percent of his working
9

Univers
ity of
Cap
e Tow
n
time an engineer performed activities which did not require
his level of education or experience then his or her
utilization would be reflected as 70 percent. The
utilization thus measured could also be referred to as 70
percent efficient utilization as opposed to a 30 percent
inefficient utilization.
1.4 THE PERSONNEL IN ENGINEERING ~ DEFINITIONS
(i) ENGINEER
Commonly the term "engineer" is loosely used in referring
to a wide range of engineering personnel who have something
to do with electromechanical equipment.
In this study the term "engineer" refers to a person who is
competent by virtue of his fundamental academic training,
which is normally a Bachelor of Science degree in
Engineering (B.Sc Eng) or an equivalent qualification. He
applies the scientific method and approach to the analysis
and solution of engineering problems with particular
emphasis on the development and application of engineering
science and knowledge, notably in research, design,
construction, manufacturing, administration, management and
engineering education.
10

Univers
ity of
Cap
e Tow
n
(ii) PROFESSIONAL ENGINEER
A professional engineer is an engineering graduate who is
registered with the South African Council for Professional
Engineers (SACPE) and in terms of such a registration is
certified to be capable of performing engineering work in
accordance with the' Professional Engineers Act No. 81 of
1968.
(iii) ENGINEERING TECHNOLOGIST
Chamber's Technical Dictionary defines a technologist as
"one skilled in technology, which is the practice,
description and terminology of any or all of the applied
sciences which have commercial value". The main aspect in
which this diff~rs somewhat from the definition of the
engineer is that the activity of the technologist is
centered mainly on industrial processes while that of the
engineer embraces engineering sciences and its applications
in all directions. The difference is one of specialized
direction rather than one of the level of qualification,
and, for this reason, the status of the technologist and the
professional engineer is taken to be the same.
Basically his training will also be similar as far as the
.fundamental aspects are concerned, but it may differ
somewhat on the applied side.
11

Univers
ity of
Cap
e Tow
n
The academic qualification associated with the technologist
is generally that of the Masters Diploma in Engineering (TS)
or a National Higher Diploma (T4) supplemented with
appropriate practical experience.
(iv) ENGINEERING TECHNICIAN
An engineering technician is one who is qualified by
specialist technical and practical training to work under
the general direction of an engineer or technologist.
Consequently his academic training, whilst not as broad or
as fundamental as that of an engineer or technologist,
includes an adequate knowledge of mathematics and applied
science related to his own speciality.
The techniques employed demand acquired experience and
knowledge of a particular branch of engineering, combined
with the ability to work out the details of a task, and he
should be competent to instruct and supervise skilled
artisans when necessary.
The work of technicians, therefore, includes any of the
specialized categories of 'technical work between those of
the artisan and the engineer.
12

Univers
ity of
Cap
e Tow
n
• •
-•
The basic academic qualification of an engineering
technician is that of a National Diploma in Engineering
(T3) or an equivalent qualification.
1.5 THE STRUCTURE OF ENGINEERING MANPOWER
The historical development of the mechanical engineering
manpower structure in South Africa is closely related to the
mining industry. The discovery of diamonds in 1866 and the
subsequent discovery of gold led to the establishment of
mines in the Northern Cape and Transvaal regions.
It was from these early mineral discoveries that there
sprang the apparently unending
manpower.
demand for engineering
Initially the mechanical engineering functions associated
with the installation, operation and repair of imported
mining equipment could be performed by a mechanical
engineering technician< 15 >. As the size and layout of plant
increased, organizing skill and sounder technical knowledge
were required of the person in charge, who also had to
assume responsibility for the safe operation of the
equipment •
13
Univers
ity of
Cap
e Tow
n
The rapid development towards industrialization after the
last war presented new challenges for the mechanical
engineer. Whereas in the past they had little need for
designing equipment on their own, as such designs were
generally forthcoming from overseas, they were now faced to
an increasing extent with the problem of having to produce
their own solutions and of creating new designs to suit
conditions unique to this country. · The new equipment so
designed had now to be manufactured in the country, and this
led to the quick expansion of the manufacturing industry.
All this activity called for new qualities in the mechanical
engineer which lifted him above the level of the technician,
who could, in the early days, cope with most of the problems
of operation and maintenance< 16 >.
In the manufacturing industry, the management and
administrative abilities of the engineers in charge became
just as important to the job as engineering knowledge and
the demand for specialized engineers developed.
Mechanical Engineering in the mining industry was
characterised by the emergence of the consulting mechanical
engineer, attached to a specific mining house, who was
responsible for the top-level work, while the practical
issues were attended to by mine section engineers< 17 >.
14

Univers
ity of
Cap
e Tow
n
These at first came up through the ranks, but in many cases
they were replaced later by more widely trained university
graduates. While their work was first carried out on an
empirical basis, a scientific approach became more and more
necessary as demands for greater outputs at ever greater
mining depths, and increased mechanization, became more
imperative.
The engineering sector in South Africa is today characterised
by the following groups of engineering personne1< 18 ):
(i) engineers,
(ii) technologists,
(iii) technicians,
(iv) artisans,
(v) operatives, and
(vi) labourers.
The relationship which exists between the various groups of
engineering personnel can best be understood by considering
the concept of the "engineering team".
The engineering team of the 1980's consists essentially of
the engineer, technologist, technician, artisan, operatives
15
Univers
ity of
Cap
e Tow
n
and labourers but with no internationally accepted and
clearly distinguishable level of education or activity
between each.
While it is relatively easy to define a clear boundary
between the last three categories, it becomes a little more
difficult between the first three i.e. between engineers,
technologists and technicians. Reference to the definitions
of the functions performed by each category clearly
indicates that the functions performed by each group are
different< 19 >.
The technician is seen to be performing a supportive role to
the engineer thus relieving the engineer from having to
perform work which could well be performed by less trained
personnel.
16
Univers
ity of
Cap
e Tow
n
CHAPTER 2
LITERATURE SURVEY
2.1 THE APPLICABILITY OP OVERSEAS RESEARCH LITERATURE ON
THE SOUTH AFRICAN SITUATION
From the extensive literature survey conducted it has become
apparent that the bulk of documented research literature on
the utilization of mechanical engineers, available in South
Africa, is to a large extent based on findings of studies
conducted in America and Europe.
Due to the nature of the research studies conducted in USA
and Europe, much of the findings can be of value to South
African industrialists and manpower planners. It can expand
the knowledge of utilization of mechanical engineers and
provide general guidelines as to how the utilization of
mechanical engineers may be improved.
The findings of research studies conducted by the Americans,
John Merril and. Hirsch, et al, have largely been confirmed
by South African research work conducted by researchers, s s
Terblanche and G Cilliers under the auspices of the Human
Sciences Research Council (HSRC).
17

Univers
ity of
Cap
e Tow
n
It is thus safe to assume that much of the research work
conducted by American and European researchers has direct
relevance to the South African situation with regards to the
utilization of mechanical engineers, and an overview of
studies conducted locally and abroad would provide
significant insight to the research work undertaken by this
study.
2.2 A BRIEF REVIEW OP FOREIGN STUDIES CONDUCTED ON THE
UTILIZATION OP MECHANICAL ENGINEERS
Hirsch C 2 O) , et al, have compiled several tables based on
their survey which brought to light the work patterns and
time utilization of the engineering personnel included in
the survey. In this study which was conducted in the United
States of America, 165 questionnaires were sent out to a
random sample of engineers who were members of the Institute
of Aeronautical Engineers (IAE) and the Institute of Radio
Engineers (IRE). The over-all return of questionnaires was
148, representing 89,7 percent of those sent out.
Table I is a breakdown of engineer time expenditure based on
the questionnaire.
18

Univers
ity of
Cap
e Tow
n
TABLE 1
PER CENT OF TOTAL TIME DEVOTED TO VARIOUS ACTIVITIES
ACTIVITY PER CENT -
Supervision 26.3 Conferences 14.0 Routine technical work 11. 7 Nonroutine technical work 11. 7 Report writing 10.3 Nonroutine designing 8.6 Routine designing 3.7 Drafting 3.3 Personal 2.0 Teaching 1.8 Miscellaneous nontechnical work 1. 5 Routine laboratory work 0.9 Data searching 0.5 Others and uncertain 3.7
100.0
The fourteen ltems in Table I were compiled from various answers
to the question of what percent of time was devoted to the various
activities.,
When the wor:: performed by the engineer requires use of his
training or experience, the efficiency of his utilization is high.
Hirsch suggested that some activities which do not utilize the
unique training of the engineer include:
Drafting
Routine calculations
Routine experimenting or testing
Routine assembly work
19

Univers
ity of
Cap
e Tow
n
Plotting graphs
Routine maintenance
Running errands
Purchasing
Conducting tours
Sales activities
Editing
Recruiting new employees
Formulating routine-type reports
Routine administrative work.
Tables II and III are composites, using data from the
questionnaire, providing a positive and negative aspect of
how the engineer's time and energies are expended.
Accepting the validity of the information contained in Table
II, the gross inefficiency of 64, 2 per cent indicated in
Table III creates a shortage of engineers by requiring three
engineers where one properly utilized engineer would be
adequate. This reduction of the existing manpower by about
two thirds is significant and greatly contributes to any
shortage of engineers which may exist.
The employment of engineering technicians who are efficient
when they are performing activities in the engineer's low
efficiency areas would greatly enhance the availability of
engineering manpower.
20

Univers
ity of
Cap
e Tow
n
illkLl
PER CENT OF TOTAL TIME SPENT IJORKING IN
UTILIZATION CATEGORIES
I ---,
Utilization Category ~ Activity
I Per Cent Per Cent Per Cent I I Efficient Uncertain I Inefficient
I Supervision I
26.3
I I Conferences 14.0 Routine technical work 11. 7 Nonroutine technical work 11. 7
I Report writing 10.3 Nonroutine de~igning 8.6 Routine designing 3.7 Drafting 3.3 Personal 2.0 Teaching 1.8 Miscellaneous nontechnical 1.5 I Routine laboratory work 0.9 Data searching 0.5 Others 3.7
-- -- --Total 20.8 56.1 23.1
-
TABLE 3
PER CENT OF TOTAL TIME DEVOTED TO EFFICIENT
ANO INEFFICIENT UTILIZATION
Utilization Category Activity
Per Cent Per Cent Efficient Inefficient
Supervision 6.6 19.7 Conferences 3.5 10.5 Routine technical work 11. 7 Nonroutine technical work 11.7
i Report writing 2.6 7.7 I Nonroutine designing 8.6 I Routine designing 3.7 I Drafting 3.3
Personal 2.0 TeacMng 0.5 1.3 Miscellaneous nontechnical 1.5 Routine laboratory work 0.9
I Data searching 0.5
I Others 1.8 1.9
-- --Total 35.8 64.2
21
i

Univers
ity of
Cap
e Tow
n
In their study Hirsch< 21 >, et al, refer to the concept of
manpower substitution by suggesting that technicians should
perform certain activities which engineers perform
inefficiently.
Manpower substitution is taken to mean substitution between
different types of labour, defined according to ~orker
traits, abilities, education and training.
In an empirical Canadian study undertaken by Skolnik( 22) in
1968, he concluded "that the extent of substitution between
engineers and technicians is substantial". The findings of
the Skolnik study serves to substantiate Hirsch's proposal
with regard to substitution between engineers and
technicians.
In addition to the 64 percent inefficiency of engineers,
there are other problem areas, some of which are directly
related to management and others which are in part due to
the nature of engineering as it is accomplished in the
United States.
In some cases engineers are used to their fullest
capabilities in carrying out a task of work, but there may
be no no good reason for the work they are performing.
Reasons for the limited value of work performed have been
suggested by Hirsch <23 ) and include poor planning on the
part of management or supervisors, or from the deliberate
22

Univers
ity of
Cap
e Tow
n
stocking of engineering manpower for some economic reason.
In some instances, the qualification of a company for a
part~cular contract is dependent upon the number of
engineers immediately available.
Another area of inefficient use of engineering manpower
results from duplication of effort. This refers to the
efforts expended on the same activities when the duplication
is unknown to the parties concerned.
Significant among the reasons for this difficulty is the
problem of dissemination and collection of information.
Hirsch< 24 ) indicated that of those returning the
questionnaires, 44 per cent found their activities
duplicated at some time in their own companies, and 47 per
cent found their activities duplicated elsewhere. It is
Hirsch's estimate that from 30 to 85 per cent of scientific
time is lost due to duplication of efforts.
According to the engineer profile based on the survey
results, the average engineer changes jobs once in every 3,3
years. This would mean a 30 percent turnover per year in an
average engineering organization. Besides inordinate
expense and company lQss of trained personnel, turnover
represents a decrease in output by t.he engineer both at his
old and new places of employment. It is not unreasonable to
assume that if engineers had an adequate number of
23

Univers
ity of
Cap
e Tow
n
engineering technicians to assist them in carrying out their
responsibilities, the nec~ssity of job-changing might be
reduced in some instances with gains on all sides. This
adequate engineer back-up is only speculation, because in
many companies technical help or assistance is scarce or
unknown.
Seymour Herwald( 25 ) of the Westinghouse Electric Corporation
makes the following cornnient about technicians, "There are
two types of technicians. One group will remain technicians
all their lives. They will never attain a professional
engineering status. The second group will attend school or
will otherwise progress in their profession and may
eventually become engineers".
That technicians can and do become engineers is further
s;ubstantiated in an article entitled "Make Your own
Engineers". This article ( 26 ) answers the question of
whether ability and exceptional experience can be accepted
as substitutes for formal education in engineering. The
basis of this particular article was observations made over
a six year period of a company plan to take care of a two
sided problem, that of helping to satisfy the desires of
capable and ambitious technicians and simultaneously
enhancing the number of proven
company. For this company, such
24
engineers within the
a method of upgrading

Univers
ity of
Cap
e Tow
n
technicians proved satisfactory. The company which
achieved this particular solution to the shortage problem is
the Airborne Instrument Laboratory, a highly respected and
capable company on Long Island, New York, now a division of
Cutler-Hammer of Milwaukee. The plan is simply that
ambitious and competent technicians are carefully observed,
screened, and gradually given additional opportunity for
professional recognition within the company and on occasion,
during their own time, to attend professional-level courses
to round off their technical development.
This article comes to grips with one of the most important
aspects of the entire technician program - that in many
cases the technician job is only a "stepping stone".
As a result of conferences of engineering management held
under the auspices of the u. s. President' s Committee on
Scientists and Engineers, an effort toward improving
engineering manpower utilization has been made <27 ). The
importance of the quality of first-line supervisors of
engineers has been emphasized. Accordingly, a re-
examination of the supervisory selection method is planned.
The conferees were also impressed by the desirability of
greater utilization of technicians on the engineering team.
Because of these conferences, companies delegated non-
professional duties to technicians and clerical employees,
25

Univers
ity of
Cap
e Tow
n
trained technicians and recruited more technicians. Without
supporting technicians, the engineer defeats the purpose for
which he received a particular type of education.
In the supervisory structure of engineering organizations,
about 25 percen,t of all the engineers in a laboratory are
required to supervise. Supervisors are frequently selected
on the basis of engineering competence, thus decreasing
engineering productivity. Engineering competence as the
most important criterion for supervision is undesirable.
2.3 A REVIEW OP STUDIES CONDUCTED IN SOUTH APRICA ON TRB
UTILIZATION OP MECHANICAL ENGINEERS
It has previously been pointed out that very little
scientific research has been carried out on the utilization
of engineering manpower in this country.
Research work conducted in South Africa and which has
relevance to the study of utilization of mechanical
engineers is essentially confined to two published studies
undertaken by the Human Sciences Research Council, papers
delivered at conferences and a few articles expressing
individual opinions on the topic.
However, notwithstanding the limitations of these studies,
they do provide a degree of insight to the question of
26

Univers
ity of
Cap
e Tow
n
utilization of mechanical engineers and as such have made a
very valuable contr~bution to the present knowledge available.
It is for this reason that the important findings of these
studies will now be briefly reviewed.
2.3.1 § § TERBLANCHE - 11THE IDEAL SKILL MIX IN THE CIVIL
ENGINEERING INDUSTRY" HSRC 1982 (REPORT NO MR .!ll
This study was carried out within the civil engineering
industry on a total number of 1750 respondents consisting of
1172 engineers (67%), 476 technicians (27%) and 102
personnel categorized as "other".
In addition 103 companies in the civil engineering industry
supplied data with regards to the structure of their
technical personnel.
The main objectives of this study were to determine by means
of questionnaire data,
(a) the extent to which technicians could perform the
functions of an engineer in the civil engineering
industry {i.e. the percentage under utilization of
engineers),
27

Univers
ity of
Cap
e Tow
n
(b) the actual ratio of technicians to engineers as
depicted by the technical personnel structure of
participating companies,
(c) the "ideal" ratio of technicians to engineers and
( d) the factors which contribute to the actual ratio of
technicians to engineers varying from the "ideal"
ratio.
Terblanche made the following remarks on the findings of his
study:
Engineers clearly felt that they were spending time on
functions that could be performed efficiently by
technicians.
Engineers indicated that the non-availability of
technicians was an important contributory factor to
the inefficient performance of engineers.
Companies should attempt to increase the training of
technicians.
Respondents generally felt that management did not play
an important role in contributing towards the
underutilization, of civil engineers, however,
management shoula nevertheless take a careful look at '
the way they employ their scarce human resources.
28
Univers
ity of
Cap
e Tow
n
With regards to the efficient utilization, engineers felt
that they were efficiently utilized for 73 percent of their
time i.e. the inefficiency of engineers was 27 percent. The
study clearly indicates that for about 27 percent of, their
time, civil engineers are engaged in activities which could
be performed by technicians with a National Diploma
qualification. These results do not fully correspond with
the findings of the study conducted by Hirsch, et al, where
the efficiency of a group of Aeronautical engineers and
Radio engineers was found to be 36 percent efficient or 64
percent inefficient.
Possible reasons for this rather large. variation in
efficiency are:
(1) the level of academic qualification of the technicians
may not be the same in each of the studies i.e. in the
one case we may be dealing with technicians with a 4
year academic qualification while in the other case
the technicians have a 3 year academic qualification.
(2) the
the
perceptions
capabilities
of the respondents with regards to
of technicians may be very different
given the fact that we are considering studies
conducted in different countries with different
educational systems and different cultures.
29

Univers
ity of
Cap
e Tow
n
The ideal ratio of technicians to engineers as determined by
Terblanche in the Civil Engineering industry was 2, 4
compared to an actual ratio of 1.
With specific reference to the ratio of technicians to
engineers Cambell Pitt <28 ) wrote that
"from time to time an attempt has been
made to estimate the desired ratio of
technicians to professional engineers.
I find this an unprofitable task because
there are so many factors that influence
the ratio".
Pitt's remarks are still valid in so far as the factors
which influence the ratio are in-numerable and to a great
extent extremely difficult to quantify.
The study identified the following items which could have an
influence on the ratio:
(1) The availability of personnel
Here the following factors were identified:
(a) No suitable personnel available in the company
(b) Insufficient suitable personnel available
(c) Impractical for another person to perform part of
the job
30

Univers
ity of
Cap
e Tow
n
(d) Poor management
(e) Not sufficient work to keep a person fully
occupied.
(2) Technology
The use of latest technology also has implications for
saving time. .However, few respondents were of the
opinion that any significant time saving could be made
by using technology not available to them. Typical of
the types of technology ref erred to here are computer
draughting and plotting equipment, mini computers and
computerised administrative systems.
2.3.2 g CILLIERS - "BENUTTING VAN ELEKTRIESE, ELEKTRONIESE
EN MEGANIESE INGENIEURS11 RSRC 1985
(REPORT NO MN - 112)
This study was commissioned on representation by the
National Manpower Commission in 1984.
The study was based on data provided by 968 respondents
drawn from the electrical, electronic and mechanical
engineering disciplines.
An analysis of respondents from each discipline is as
follows:
31

Univers
ity of
Cap
e Tow
n
TABLE 4
DISCIPLINE OF RESPONDENTS
Engineering Discipline Respondents
Number ~ 0
Electrical 334 35 Electronic 284 29 Mechanical 350 36
Total 968 100
The main objectives of this study was to establish:
(a) the actual ratio of technicians to engineers in the
electrical, electronic and mechanical engineering
industries;
(b) the utilization of engineers in each of these
industries, and
(c) the availability of the different categories of
engineering manpower i.e. engineers and technicians.
The data for ~his study was obtained by means of a questionnaire.
The data was provided by both engineers and employers and ·it is
accepted that an element of subjectivity is built into the results
since engineers were providing data with regard to their own
activities. However, the main findings of the study applicable to
mechanical engineers is reflected below:
32

Univers
ity of
Cap
e Tow
n
(1) Ratio of technicians to engineers
The actual ratio determined by the study was different for the
government and private sector.
TABLE 5
RATIO OF TECHNICIANS TO ENGINEERS
Sector Ratio technicians/engineers
Government 18:1
Private 6:1
These ratio's are surprisingly high and particularly so in the
case of the government sector. However, a reason for the higher
ratio in the case of the government sector may well be the fact
that the nature of the work undertaken by the government sector
lends itself to being executed by technicians. The fact that the
government sector is engaged in a rather large amount of
maintenance work contributes to the high ratio of technicians to
engineers since technicians perform associated tasks very
efficiently.
)
33
Univers
ity of
Cap
e Tow
n
(2) Availability of technical personnel
The study found that the government sector experienced
greater problems in attracting professional engineers than
the private sector. This finding can be accepted and
appreciated given the fact that the government sector has a
very rigid salary structure whilst more flexibility exists
in the private sector.
(3) Utilization Qf mechanical engineers
The study determined that mechanical engineers are
underutilized or inefficiently utilized for 30 percent of
. their time. This figure corresponds very well with the
value of 27 percent obtained by Terblanche in his study on
civil engineers. This value is significantly lower than the
value of 64 percent obtained by the American study conducted
by Hirsch< 29 ) et al, on Aeronautical and Radio engineers.
2.4 GENERAL COMMENTS
Published literature dealing with the topic of utilization
of engineering manpower is particularly difficult to obtain.
However, this does not necessarily imply a lack of research
work on the subject. It might well be the case that studies
conducted have never been published. However, the conclu-
sions which can be drawn from the 1 i terature surveys
34
Univers
ity of
Cap
e Tow
n
conducted are presented below:
( i) engineers are underutilized by ·an amount which may l
vary between 27 and 64 percent
(ii) the efficiency of engineers would be greatly enhanced
if sufficient support personnel are available to the
engineer
(iii) the factors which contribute to poor utilization of
engineers are:
lack of sufficient support personnel,
duplication of activities and
ineffective use of engineering technicians.
35
Univers
ity of
Cap
e Tow
n
CHAPTER 3
THE RELATION OF UTILIZATION TO THB SHORTAGE OF ENGINEERS
3.1 A REVIEW OF SUPPLY AND DBXAND FOR ENGINEERS
The primary objective of this chapter is to examine the
relation of utilization ~o the shortage of mechanical
engineers. This objective will be attained by considering
the following aspects:
a review of supply and demand for engineers
the model used to quantify the "shortage" and
the utilization model.
In order to determine the extent to which inefficient
utilization contributes to the shortage of mechanical
engineers, it is necessary to examine the manner in which
both the "shortage" and the efficiency of utilization are
determined.
When the supply and demand for manpower is not in balance
then depending on the direction of the imbalance either a
"shortage" or a "surplus" is said to exist.
concerned with, amongst other things,
36
This study is
the case when

Univers
ity of
Cap
e Tow
n
imbalance in supply and demand for mechanical engineers
indicates a "shortage".
Manpower shortages, specifically highly skilled manpower,
have the effect of constraining economic growth and
contributing extensively to inflation(30}.
The extent of the "shortage" of engineers in South Africa
has been the subject of wide-spread discussion and
controversy for at least the last decade. Much of the
disagreement over the issue stems from the variety of
meanings attached to the term "shortage" and the model or
method used to establish the extent of the shortage.
Blank and StiglerC3 1 ) defined a "shortage" and provided an
empirical test for establishing the existence of a
·"shortage". Their definition of a "shortage" is:
"a shortage exists when the number of workers available
(the supply) increases less rapidly than the number
demanded at the salaries paid in the recent past".
Rephrasing this definition one, could state that a manpower
shortage exists when an excess demand for manpower leads to
an increase in wages. However, several problems arise from
such a definition. For instance, as a result of the
"shortage", less trained manpower such as technicians may be
appointed to perform, activities which were once performed
37

Univers
ity of
Cap
e Tow
n
by engineers. Since technicians generally command a lower·
salary than engineers there will be no increase in wages.
Thus according to the Blank and Stingler definition no
shortage of engineers exists.
Furthermore, Baker< 32 ) showed that this definition does not
apply in a monopsonistic market. If there is a
monopsonistic situation (or in fact an oligopsonistic
situation) in any part of the South African labour market,
for instance for certain categories of workers in the civil
service, "shortages" may exist without there being any
upward pressure on wages.
3.2 FACTORS INDICATING MANPOWER SHORTAGES
Manpower shortages may be indirectly indicated by the
following factors:
(i) overtime worked - although overtime generally occurs
when the increased demand for manpower is expected to
be temporary and is not necessarily an indication of
a manpower shortage in the true sense of the word.
(ii) Labour turnover - is another indicator but not a very
satisfactory one since different factors cause
turnover to be both higher or lower during labour
shortages< 33 ).
38

Univers
ity of
Cap
e Tow
n
(iii) Advertised vacancies - may also indicate a manpower
shortage. However, advertised vacancies are not good
indicators since posts in certain occupations are
seldom advertised and also because it is difficult to
determine the extent of the shortage when
advertisements are of different sizes or the number
of vacancies is not indicated in the advertisement.
(iv) Immigration, and finally,
(v) Money spent on recruitment of personnel.
Baker C34 > specifies vacancies and relative changes in
earnings to be the most important indicators of manpower
shortages. Furthermore, Baker contends that manpower
shortages and job vacancies are not identical and,
therefore, various shortcomings arise when vacancy
statistics are used.as an indicator of manpower shortages.
In the first instance employers may set unrealistic demands
regarding the type of worker required or the wage or salary
that is being offered. Vacancies might also exist solely
due to normal labour turnover and thus be filled quickly and
easily. In these cases a shortage in the true sense of the
word does not exist. 'Another shortcoming is that the
shortage might be so serious that employers have ceased to
search for workers for a certain occupation and might have
39

Univers
ity of
Cap
e Tow
n
taken other measures, e.g. introduced technological changes
or applied abnormal and undesirable amounts of overtime.
Finally, vacancy data give no indication of shortages which
exist as a result of the inferior quality of employees.
In the U.K. and U.S.A. vacancies are determined against the
following criteria( 35):
(i) the position must be vacant;
(ii) it should be available immediately;
(iii) some specific recruiting action must have taken
place to fill the position;
(iv) it should be available to workers from outside the
establishment.
In South Africa, the manpower surveys of the Department of
Manpower and more recently by Central Statistical Services
are the most important source of vacancy statistics. In the
survey, employers are requested to indicate the number of
people in their employ in various occupations and also to
indicate the number of vacancies that exist in the various
occupations.
40
Univers
ity of
Cap
e Tow
n
3.3 THE MODEL USED TO QUANTIFY THE "SHORTAGE" -Models used to determine the shortage of a specific type of
manpower generally focuses on quantitative data with regards
to the manpower sector being analysed. Qualitative factors
also contribute to a "shortage", however, for purposes of
this research qualitative factors were not considered in the
1 ight of their relative complexity. Thus essentially two
models used to determine the "shortage" of mechanical
engineers will be discussed.
Firstly, the Federation of Societies of Professional
Engineers have conducted .annual professional engineering
manpower surveys for a period of about eight years ( 1981-
1988) . The model employed for determining the demand for
engineers is based on the key assumption that vacancies are
the result· of the difference between demand and supply.
Thus if the supply and the vacancies are determined, then
the demand is simply the sum of the supply and the
vacancies. Hence algebraically stated:
D = V + s or by rearrangement
V = D - S where v = Vacancies
D = Demand and
S = Supply
41

Univers
ity of
Cap
e Tow
n
The annual supply of engineers is determined in even
numbered years from the sum of the following:
(i) the number of engineers graduating at South African
universities
(ii) the number of engineers passing or gaining exemption
from Part III of the examinations of SACPE, and
(iii) the estimated number of immigrant engineers who are
professionally qualified.
The numbers for ( i) and (ii) above are obtained directly
from universities and SACPE respectively whilst the number
of immigrants who are professionally qualified is determined
as indicated in Appendix I.
The vacancies are determined in April of the odd - numbered
years by a survey carried out by central Statistical
services. It is assumed that by April the supply of the
previous year will have found work.
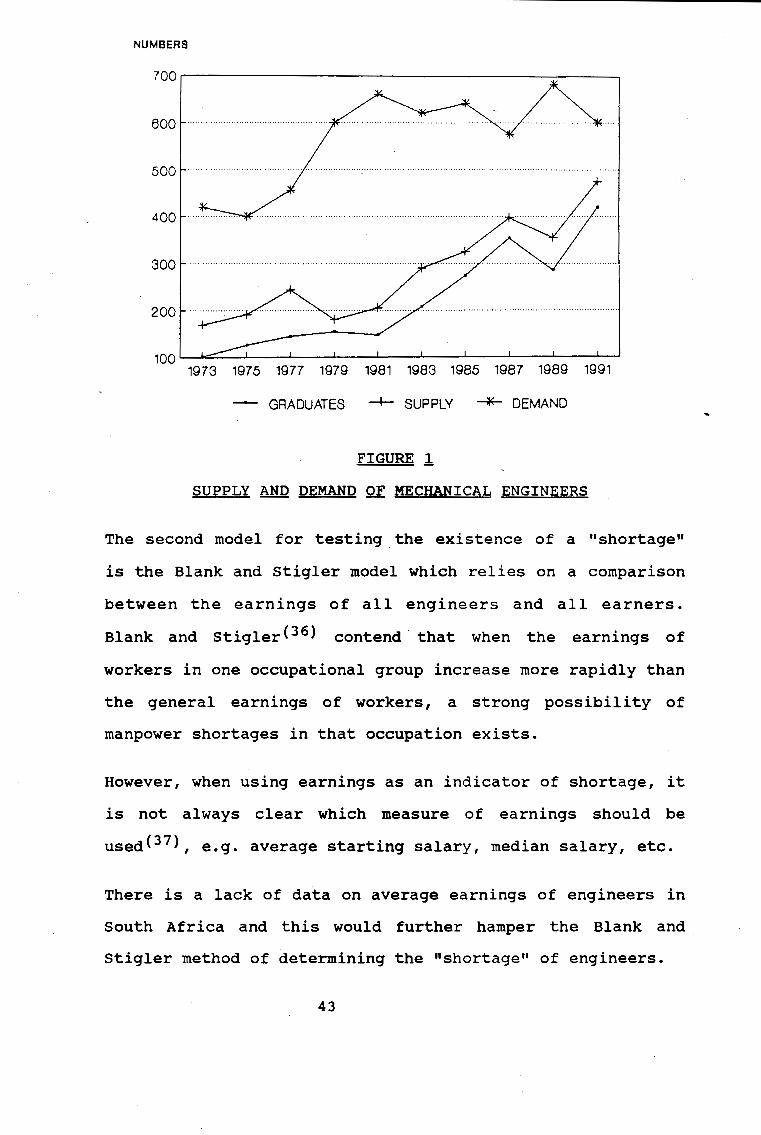
Figure 1 is a graphical representation of the supply and
demand for mechanical engineers for the period 1973 to .1987.
The numerical data is contained in Appendix II. Values for
1989 and 1991 were forecasted by the Federation of Societies
of Professional Engineers. Figure 1 reflects a shortage of
178 mechanical engineers in 1987.
42
Univers
ity of
Cap
e Tow
n
NUMBERS
eoo
500
400
300
200
100'--..a.:::::;;.._-L..~~-'-~~~~'--~-'-~--'~~-'-~__.~~~~
1973 1975 1977 1979 1981 1983 1985 1987 1989 1991
- GRADUATES --+- SUPPLY --*- DEMAND
FIGURE .l
SUPPLY AND DEMAND OF MECHANICAL ENGINEERS
The second model for testing. the existence of a "shortage"
is the Blank and Stigler model which relies on a comparison
between the earnings of all engineers and all earners.
Blank and Stigler ( 3 6 ) contend · that when the earnings of
workers in one occupational group increase more rapidly than
the general earnings of workers, a strong possibility of
manpower shortages in that occupation exists.
However, when using earnings as an indicator of shortage, it
is not always clear which measure of earnings should be
used< 37 ), e.g. average starting salary, median salary, etc.
There is a lack of data on average earnings of engineers in
South Africa and this would further hamper the Blank and .
Stigler method of determining the "shortage" of engineers.
43

Univers
ity of
Cap
e Tow
n
'
Both the above models of determining the "shortage" of
engineers do not give an indication of the extent to which
quality deficiencies are experienced. ·
3.4 THE UTILIZATION MODEL
Hirsch <38 ) indicated that the problem associated with
developing a model to quantifying utilization of engineers
lies in determining what should be measured, how to perform
the measurement and how to validate the measurement.
In order to develop an acceptable model for carrying-out
this research project it was decided that the model should:
take account of previous utilization models and
measure the actual manpower saving that could result
from improved utilization of mechanical engineers.
Cillier used a model which lends itself to easy
quantification in that utilization is expressed as a
function of time devoted to activities which requires the
unique training of engineers divided by the total time
devoted to work activities by engineers. This model is
indicated in figure 2.
44

Univers
ity of
Cap
e Tow
n
UTILIZATION = Time spent on activities which employ the unique training of engineers
Total time devoted to work activities by the engineer
FIGURE 2
CILLIER'S UTILIZATION MODEL
Hirsch<39> used the term "utilization" with reference to time
consuming activities which do not employ the unique training of
engineers. Hirsch regards such activities as ineffective
utilization.
The elements comprising the model used to determine the utilization
of mechanical engineers in this study are indicated diagramatically
in figure 3.
\
45

Univers
ity of
Cap
e Tow
n
Determine activities performed by mechanical engineers
I I
Determine % time spent on each activity
Determine the % time spent on each activity which could be done by a less qualified person
I Determine
utilization
I Determine the total savings in terms of number of engineers that could be incurred by improved utilization
FIGURE 3
THE UTILIZATION MODEL
I
3.4.1 ACTIVITIES OR JOB FUNCTIONS PERFORMED BY
MECHANICAL ENGINEERS
In order to determine the utilization of mechanical engineers it
is necessary to analyse the functions,or activities they perform
in the normal course of their professional duties. For the purpose
of this study the
46
Univers
ity of
Cap
e Tow
n
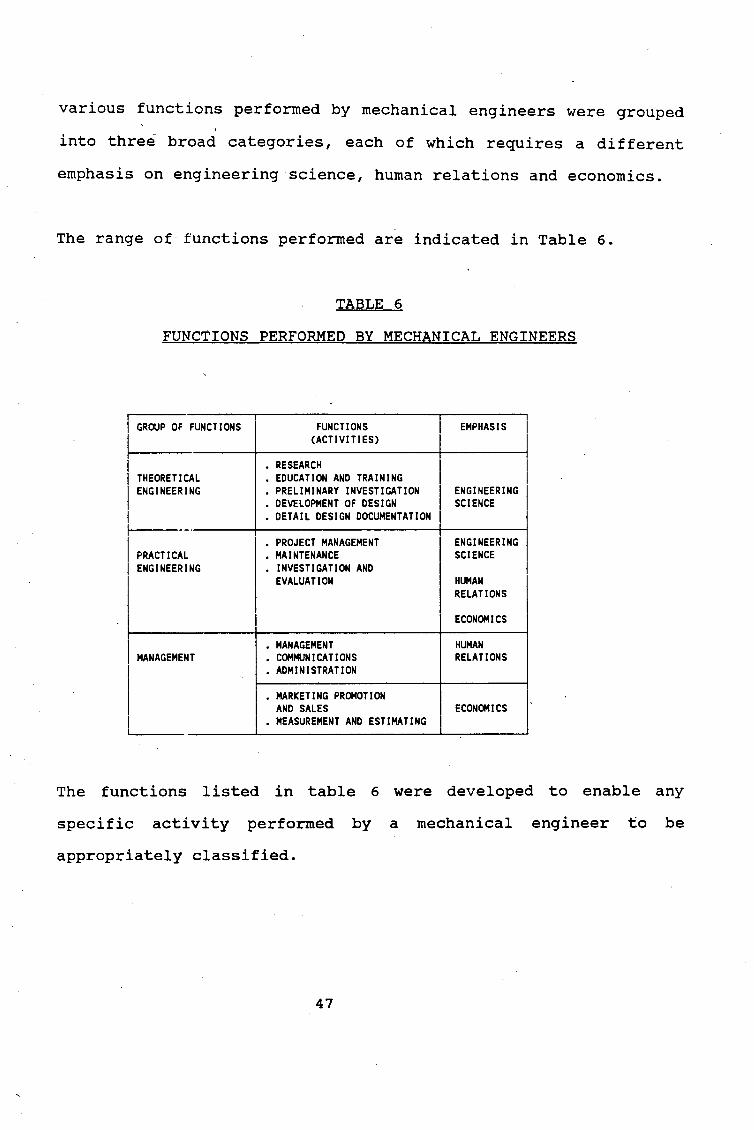
various functions performed by mechanical engineers were grouped
into three broad categories, each of which requires a different
emphasis on engineering science, human relations and economics.
The range of· functions performed are indicated in Table 6.
TABLE 6
FUNCTIONS PERFORMED BY MECHANICAL ENGINEERS
I GROUP OF FUNCTIONS FUNCTIONS EMPHASIS (ACTIVITIES)
I • RESEARCH I I THEORETICAL • EDUCATION AND TRAINING
I ENGINEERING • PRELIMINARY INVESTIGATION ENGINEERING
• DEVELOPMENT OF DESIGN SCIENCE • DETAIL DESIGN DOCUMENTATION
--· • PROJECT MANAGEMENT ENGINEERING
PRACTICAL • MAINTENANCE SCIENCE ENGINEERING • INVESTIGATION AND
EVALUATION HUMAN RELATIONS
ECONOMICS
I MANAGEMENT • MANAGEMENT HUMAN • COMMUNICATIONS RELATIONS • ADMINISTRATION
• MARKETING PROMOTION I· AND SALES ECONOMICS
! • MEASUREMENT AND ESTIMATING I
The functions listed in table 6 were developed to enable any
specific activity performed by a mechanical engineer to be
appropriately classified.
47
Univers
ity of
Cap
e Tow
n
3.4.2 DISTRIBUTION OF WORKING TIME BY MECHANICAL
ENGINEERS
Respondents indicated the percentage of their working time
they devoted to each activity as well as the percentage of
time devoted to each activity or job function that could be
performed by a person with a lesser qualification.
Cognisance should, however, be taken of the fact that
percentages supplied by respondents were in many cases given
in multiples of five or ten thus indicating that they were
estimates rather than exactly determined values.
3.4.3 LENGTH OF WORKING WEEK AND NUMBER OF WEEKS
WORKED PER YEAR
Additional information required from respondents to
establish the time spent on each job function is the actual
time devoted to these functions and hence it was necessary
to determine the following:
number of weeks worked per annum and
the number of hours worked per week.
The product of the above two quantities yields the number of
man hours worked per annum.
48

Univers
ity of
Cap
e Tow
n
3.4.4 WORKING TIME DEVOTED BY MECHANICAL ENGINEERS
TO FUNCTIONS THAT PERSONS WITH A LESSER QUALIFICATION
COULD PERFORM
The time devoted to work which could be performed by persons
with a lesser qualification is presented in number of man
years and is calculated as follows:
Let a = number of weeks worked per annum
b = number of hours worked per week
a x b = number of man hours worked per annum
If xi = % time devoted to a specific job function i,
yi = % time of a function i, that a person with a
lesser qualification could perform.
mh = man hours
The amount of time that could be saved when a person with a
lesser qualification performs a portion of the engineers
function is determined as follows:
xi Yi the number of man hours that (a x b) x -x =
100 100 could be saved if another person
performed a portion of the
engineers functions
= mh
49
Univers
ity of
Cap
e Tow
n
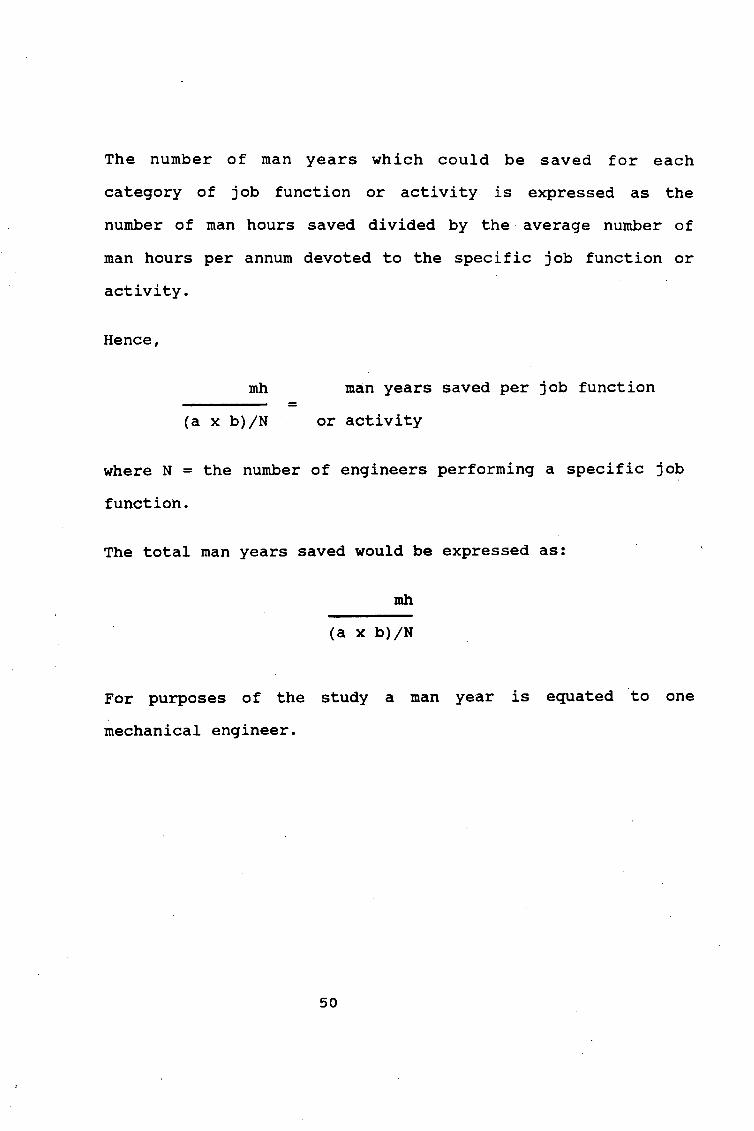
The number of man years which could be saved for each
category of job function or activity is expressed as the
number of man hours saved divided by the average number of
man hours per annum devoted to the specific job function or
activity.
Hence,
mh man years saved per job function =
(a x b)/N or activity
where N = the number of engineers performing a specific job
function.
The total man years saved would be expressed as:
mh
(a x b)/N
For purposes of the study a man year is equated to one
mechanical engineer.
50

Univers
ity of
Cap
e Tow
n
CHAPTER 4
THE RESEARCH METHOD
4.1 THE SURVEY SAMPLE
A survey, by means of a questionnaire ( appendix III) was
conducted of mechanical engineers in South Africa. The
survey was made to obtain data which would essentially
indicate how engineers are being utilized and how this
utilization might be increased.
The total population of mechanical engineers registered with
the South African Institution of Mechanical Engineers
(SAI Mech E) numbers approximately three thousand and five
hundred (3500).
Due to economic constraints, a random sample of two thousand -
five hundred (2500) mechanical engineers registered with
SAI Mech E were sent questionnaires to provide data for the
study.
Geographical locations of the questionnaire recipients were
limited to the borders of the Republic of South Africa and
Namibia.
51

Univers
ity of
Cap
e Tow
n
The final return of questionnaires numbered seven hundred and
sixty seven (767) i.e. a return rate of 31 percent. However, not
all respondents provided data for each section of the
questionnaire and consequently the total responses in these
sections of the questionnaire is less than seven hundred and
sixty seven (767).
Table 7 provides a complete analysis of replies to the
questionnaire.
TABLE 7
ANALYSIS OF REPLIES
REPLIES
Satisfactorily Completed
Unsatisfactorily Completed
Retired or ill persons
Not Returned 1
Total questionnaires 2
4.2 PROCEDURE FOR THE STUDY
NUMBER PERCENT(%)
767 30,7
32 1,3
24 1,0
677 67,0
500 100
Information and data for ·the study was obtained by both a
literature survey and an empirical investigation. The empirical
data which formed the basis of this study was essentially gathered
by questionnaire. The questionnaire was selected rather than the
structured interview method for reasons of economics.
52

Univers
ity of
Cap
e Tow
n
However, it should be pointed out that while the
questionnaire may be more cost effective than the structured
interview it is also regrettably more subjective.
Consequently, the structured interview was used on a very
limited scale only to substantiate some of the main trends
indicated by the questionnaire.
The study, as initially envisaged, was to be two fold with
one questionnaire being sent to mechanical engineers
registered with SAI Mech E, and another questionnaire being
sent to the management of larger companies employing
mechanical engineers.
To this end, two separate questionnaires were prepared. A
copy of the questionnaire sent to mechanical engineers is
included in Appendix III.
The questionnaire to management was not sent, after many
representatives of management indicated that the answers
would be difficult to obtain and might be biased to give a
good impression of the responding company. However, the
questionnaire is included in Appendix IV for information.
The data supplied by respondents to the questionnaire formed
the basis of the results of the study.
53

Univers
ity of
Cap
e Tow
n
A random sample of 2500 mechanical engineers were selected
from the mailing list of SAI Mech E. The mailing list used,
consisted of computer printed stickers which contained the
name and postal address of each member.
Each member selected was posted a questionnaire, self
addressed envelope and a letter of explanation as contained
in Appendix v.
Arrangements were made with the General Post Office (G.P.O.)
to have the cost of return post paid for by the researcher.
Questionnaires were sent out during the first week of July
1988 and approximately 60 percent of the response was
received by the end of July 1988 (i.e. within three weeks).
Only responses received before 1st October 1988 were used in
the results. The over-all return of 767 ( 31%)
questionnaires was gratifying.
4.3 VALIDITY OF THE SURVBY SAMPLB
There is always doubt expressed as to the validity and
accuracy of expanding a relatively small sample, like the
survey discussed here, to cover an entire population or
universe. What indications does one have that this sample
of 767 is representative of the mechanical engineers working
in South Africa and Namibia?
54

Univers
ity of
Cap
e Tow
n
The universe is here taken to mean all professional
mechanical engineers employed in South Africa and Namibia.
No technically valid comparison can be inferred that this
sample is indicative of the entire population of mechanical
engineers in South Africa and Namibia. This is unfortunate,
but unavoidable, since firstly no complete listing defining
the entire population was available from which to obtain a ·
random sample and secondly the research was undertaken with
very limited finance.
It should be noted that there might be items in the survey
which indicate a skewed result when comparing the results
with the entire population of mechanical engineers in South
Africa and Namibia. However, despite this, the survey
provided appreciably significant results
information.
and useful
statisticians state that there is no precise mathematical
measure -of how well the universe is represented when only
one small sample of the universe is available.
An important reason for believing that the 767 response
sample obtained in this survey is indicative of the universe
considered is the relatively high ratio of responders to
those questioned (31 percent). Since the determination of
the sample was random, such a high response indicates that
55

Univers
ity of
Cap
e Tow
n
any other random sample response will produce approximately
the same results.
4.4 THE OBJECTIVE AND STRUCTURE OP THE QUESTIONNAIRE
The study was undertaken to obtain data which would indicate
how mechanical engineers are being utilized and how this
utilization might be increased. The broad objectives of the
questionnaire were to:
obtain statistical information about mechanical engineers
determine the mechanical engineers opinion of his/her
utilization by the company or employer.
In the formulation of the questionnaire, several successive
attempts were made to present it in a form that would be
most helpful when analyzing the utilizatio~ of mechanical
engineering personnel.
Data specifically requested by the questionnaire could be
classified into the following five groups:
(i) personal
(ii) professional status
(iii) job functions performed
56

Univers
ity of
Cap
e Tow
n
(iv) time utilization and
(v) causal factors of poor utilization.
The empirical data obtained in groups (i) and (ii) enabled
the development of an accurate profile of the survey group.
The profile of the survey group include aspects such as its
age structure, management structure and academic
qualification structure.
The empirical data contained in the remaining three groups
is considered to be the essence of the study. The data
contained in groups (iii) and (iv) enabled the establishment
of work patterns (i.e. total time spent on performing
professional activities annually), time devoted to different
activities or job functions (i.e. time utilization),
variations in time devoted to job functions with years of
experience and the efficiency of time utilization . by
mechanical engineers.
The empirical data contained in group (v) enabled the
establishment of the relative importance of factors which
. result in under utilization or inefficient utilization of
the mechanical engineer's time.
Finally, the data contained in groups (iii), (iv) and (v)
enabled an evaluation to be made of the impact which
57

Univers
ity of
Cap
e Tow
n
inefficient utilization of mechanical engineers has had on
the limited engineering manpower of the country.
4.5 ANALYSIS OF RESULTS
According to the literature on analysis techniques, the
method of analysis is dependent on the method of inquiry.
Statistical analysis techniques for example are said to work
successfully in cases where ~he data has been gathered by
means of multiple item questionnaires.
The approach adopted to using the large amount of data
collected in the study, was to apply conventional
statistical methods to establish whether any definite trends
could be discovered.
The counting of opinions was used as the basic method of
analysing the information.
The first step in this direction was to get the replies into
some form suitable for manipulation by computer.
A computer programme {Appendix VI) was developed using the
DBase III Software package.
Data contained on the 767 replies were manually fed into the
computer.
58
Univers
ity of
Cap
e Tow
n
CHAPTER 5
RESULTS
The results on utilization of mechanical engineers expressed
in the questionnaire of this study are presented under four
general headings, namely:
(i) A profile of the survey group
(ii) Utilization of mechanical engineers
(iii) Factors causing poor utilization
(iv) Training requirements of a typical mechanical technician.
5.1 A PROFILE OF THE SURVEY GROUP
The result presented here serves to define the profile of a
typical group of mechanical engineers. The survey group
provided data related to the following aspects:
age structure;
occupational structure;
m~nagement structure;
academic qualification level;
remuneration structure, and
sex classification.
59
Univers
ity of
Cap
e Tow
n
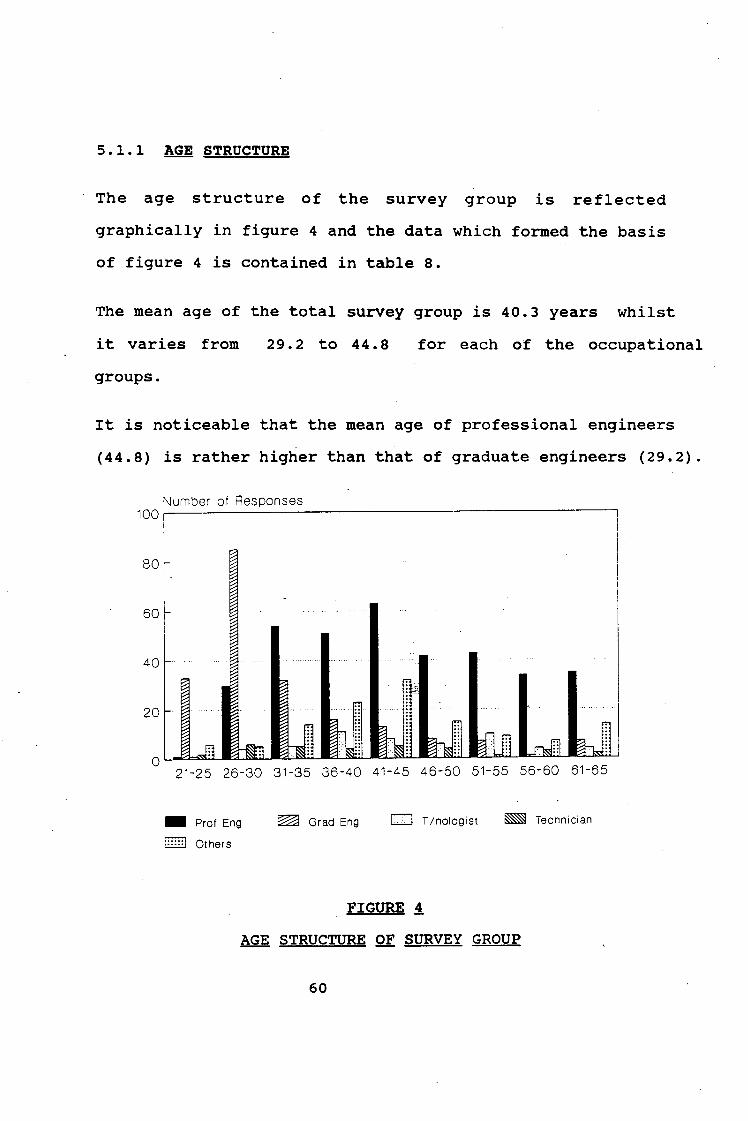
5.1.1 AGE STRUCTURE
The age structure of the survey group is reflected
graphically in figure 4 and the data which formed the basis
of figure 4 is contained in table 8.
The mean age of the total survey group is 40.3 years whilst
it varies from 29. 2 to 44. 8 for each of the occupational
groups.
It is noticeable that the mean age of professional engineers
(44.8) is rather higher than that of graduate engineers (29.2).
80
60
40
20
OL.,j;~iL:LJIE:1....sst..:JL.11:~iil11:a..~L&~~m::::;i..~L.m::<L.h::i;W_lmz::L..=;.;JL....-"'-""'LL.l
21-25 26-30 31-35 36-40 41-45 46-50 51-55 56-60 61-65
- Prof Eng
§ Others
~ Grad Eng D T /nologist
FIGURE 4
~ Technician
AGE STRUCTURE OF SURVEY GROUP
60

Univers
ity of
Cap
e Tow
n
TABLE 8
AGE STRUCTURE OF SURVEY GROUP
i i OCCUPATION i I i
I I AGE PROFESSIONAL GRADUATE TECHNOLOGIST TECHNICIAN OTHER TOTAL
! I N % N % N % N % I N I % N i % i i i I
I 21 - 25 I 2 0.6 33 16.3 1 1.9 2 6.3 6 4.8 44 5.7
I ! I 26 - 30 30 I 8.5 85 41.9 4 7.5 6 18.8 5 4.0 130 16.9 I 31 - 35 54 15.3 32 15.8 5 9.4 5 15.6 14 11.2 110 14.3
36 - 40 51 i 14.4 16 7.9 11 20.9 4 12.5 I 23 18.4 105 13.7 i
41 - 45 63 17.8 13 6.4 8 15. 1 5 15.6 32 25.6 121 15.8
I 46 - 50 I 42 I 11.9 8 3.9 6 I 11.3 4 12.5 15 12.0 75 9.8 I i i I
51 - 55 43 I 12.1 I
7 3.4 10 18.9 1 3.1 9 7.2 70 9.1
I 56 - 60 34 I 9.6 1 0.5 4 7.5 3 9.3 7 5.6 49 !
6.5 I I
65+ 35 9.8 7 3.9 4 7.5 2 6.3 14 11.2 63 8.2 ! I 100 I TOTAL 354 I 100 203 100 53 100 32 125 100 767 100 i i
ME;IAN I 45.8
I 26.5
I 6.9 4.2 16.6 100
I 44.8 29.2 44.5 39.5 43.7 40.3 i
This difference is to be expected since graduate engineers
may only qualify as professional engineers upon· completion
of at least three years of approved postgraduate engineering
experience.
However, many graduates apply for professional status after
having gained significantly more than three years of
61

Univers
ity of
Cap
e Tow
n
postgraduate engineering experience.
It is also significant to note that 8, 2 percent of all
mechanical engineers are older than 65 years. Normally 65
years is considered to be the retirement age. It is,
however, possible that many of the engineers in the 65
years plus age group have already retired but returned to
the labour market.
5.1.2 OCCUPATIONAL STRUCTURB
The occupational structure of the survey group by sector is
indicated in tabular and graphical form in table 9 and
figure 5 respectively.
Table 9 indicates that 46 percent of the respondents are
registered professional engineers whilst 26 percent are
graduate engineers. Of the remaining 28 percent of
respondents the category "other" represents 17 percent of
mechanical engineers while "technologists" and "technicians"
represent 11 percent.
Thus, in total, 72 percent of all respondents are either
classified as professional or graduate engineers who possess
the basic academic qualification to obtain professional
engineer status on completion of satisfactory engineering
work experience.
62
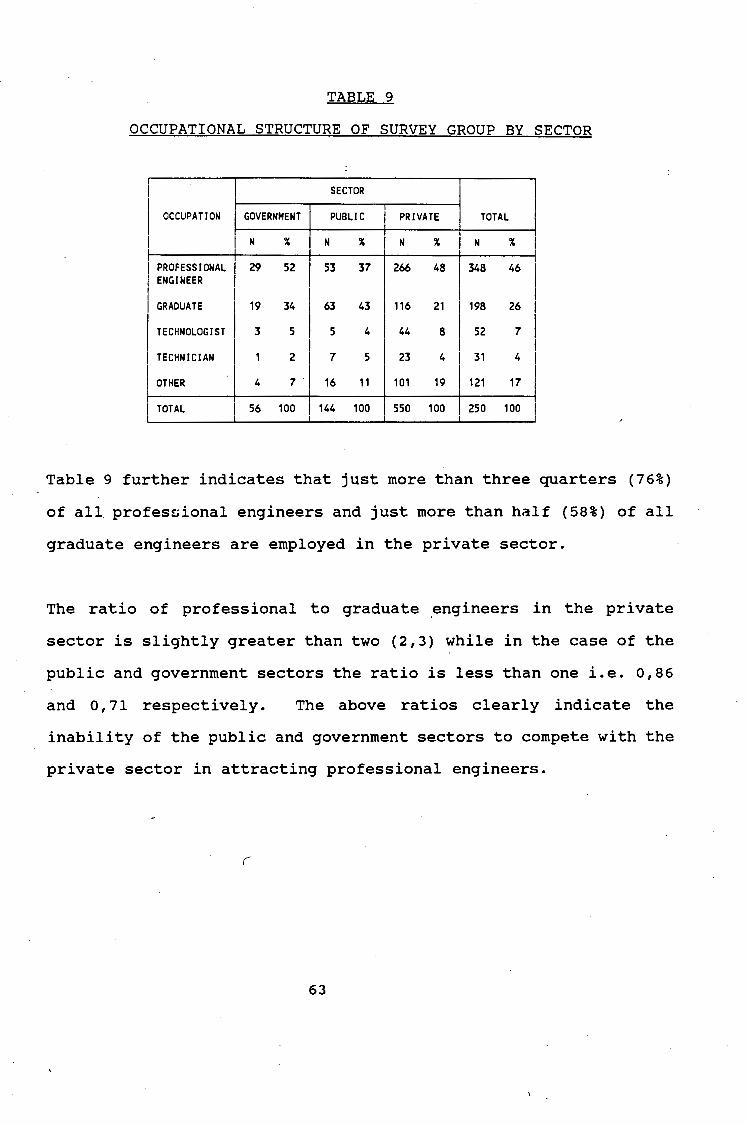
Univers
ity of
Cap
e Tow
n
TABLE 9
OCCUPATIONAL STRUCTURE OF SURVEY GROUP BY SECTOR
SECTOR I i
I OCCUPATION GOVERNMENT PUBLIC PRIVATE TOTAL I
i I I
! N % N % N % I N % I ! I I PROFESSIONAL 29 52 53 37 266 48 348 46
I ENGINEER I
GRADUATE I 19 34 63 43 116 21 198 26 I TECHNOLOGIST I 3 5 5 4 44 8 52 7 I
I I TECHNICIAN 1 2 7 5 23 4 31 4 I I OTHER 4 7· 16 11 101 19 121 17 I i I I
TOTAL 56 100 144 100 I 550 100 250 100 I
Table 9 further indicates that just more than three quarters (76%)
of all profesoional engineers and just more than half (58%) of all
graduate engineers are employed in the private sector.
The ratio of professional to graduate .engineers in the private
sector is slightly greater than two (2,3) while in the case of the
public and government sectors the ratio is less than one i.e. 0,86
and O, 71 respectively. The above ratios clearly indicate the
inability of the public and government sectors to compete with the
private sector in attracting professional engineers.
r
63

Univers
ity of
Cap
e Tow
n
Percentage oor-~~~~~~~~~~~~~~~~~~~~~~~~-
50
40
30
20 = I ..... : : : : ~
10 , ...... ::::: :::::
nm 0
GOVT. SECTOR PUBLIC SECTOR PRIVATE SECTOR TOTAL
- PROF ENG ~ GRADUATE 0 T/NOLOGIST ~ TECHNICIAN
lliillJ OTHER
FIGURE .2
OCCUPATIONAL STRUCTURE
The occupational category "other" in the private sector
made up 19 percent of private sector engineers. Self
employed engineers are indicated in the category "other"
hence the relatively large percentage (19%) of this
occupational category.
5.1.3 MANAGEMENT STRUCTURB
An analysis of the management structure is indicated in
table 10 and figure 6.
The respondents indicated that the following management
structure exists:
64

Univers
ity of
Cap
e Tow
n
top management 37%
middle management 43%
industrial management 6%
other 14%
100%
An analysis .of the private sector indicates a ratio of top
management to middle management of 1, 13. This ratio is
markedly different from the ratio of 0,27 and 0,41 obtained
for the public and government sectors. The ratios less than
1 obtained in the case of the public and government sector
is in accordance with expectations since the number of top
managers is normally less than that of middle managers.
Percentage 50.--~~~~~~~~~~~~~~~~~~~~~~~---,
50
40
30
20
10
0 GOVT. SECTOR PUBLIC SECTOR PRIVATE SECTOR TOTAL
- TOP ~ MIDDLE CJ INDUSTRIAL ~ OTHER
MANAGEMENT STRUCTURE
FIGURE §.
65
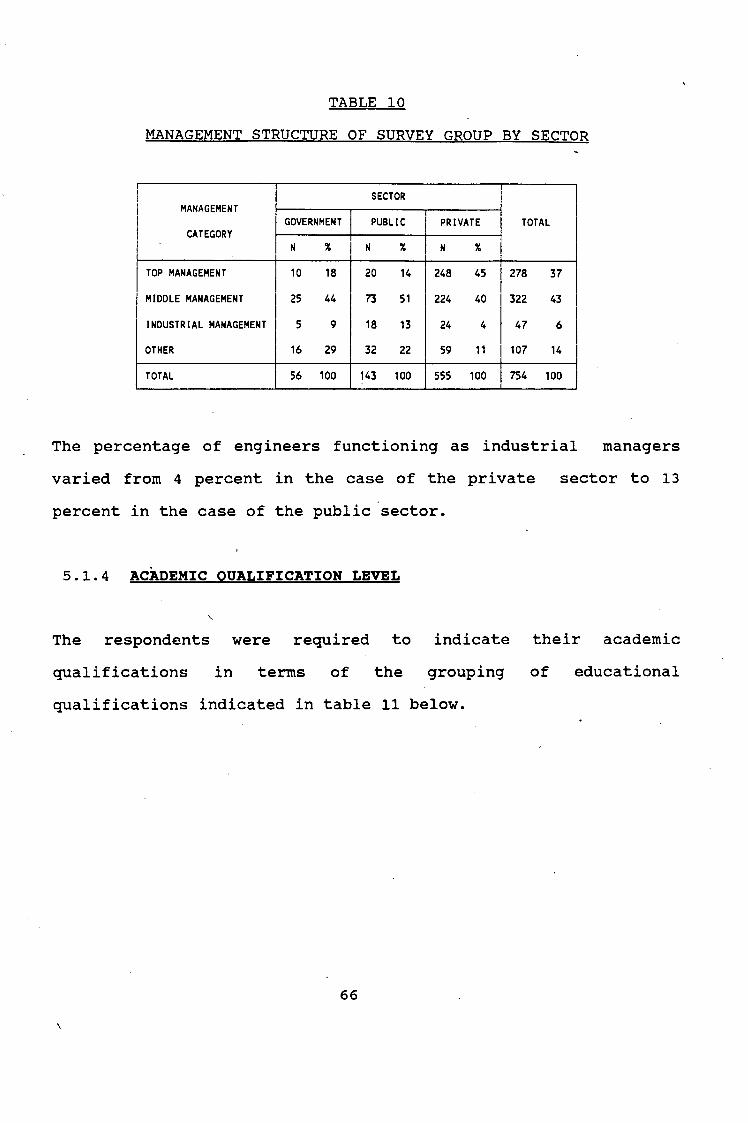
Univers
ity of
Cap
e Tow
n
TABLE 10
MANAGEMENT STRUCTURE OF SURVEY GROUP BY SECTOR
I SECTOR I i I MANAGEMENT i I I
GOVERNMENT PUBLIC PRIVATE TOTAL
I CATEGORY
i I I I N x N x N x j i
TOP MANAGEMENT I
10 18
I 20 14 248 4S 1278 37
I MIDDLE MANAGEMENT 2S 44 73 S1 224 40 322 43 I
I INDUSTRIAL MANAGEMENT s 9 18 13 24 4 47 6
I OTHER 16 29 32 22 S9 11 107 14
TOTAL S6 100 143 100 SSS 100 754 100
The percentage of engineers functioning as industrial managers
varied from 4 percent in the case of the private sector to 13
percent in the case of the public sector.
5.1.4 ACADEMIC QUALIFICATION LEVEL
The respondents were required to indicate their academic
qualifications in terms of the grouping of educational
qualifications indicated in table 11 below.
66

Univers
ity of
Cap
e Tow
n
It should
I
I GROUP i
I 2
I I
I I 3
I 4
5
6
be
I I
TABLE 11
ACADEMIC QUALIFICATIONS
EDUCATIONAL QUALIFICATIONS I N % I STD 10, (NTC Ill) NATIONAL TECHNICAL 3 0,43 CERTIFICATE
NATIONAL TECHNICAL CERTIFICATE IV OR V ADVANCE TECHNICAL CERTIFICATE (ATC I & II) NATIONAL CERTIFICATE FOR TECHNICIANS 0 0 NATIONAL HIGHER CERTIFICATE FOR I I TECHNICIANS (NCT) I I INTERMEDIATE DIPLOMA FOR TECHNICIANS (IDT)
NATIONAL TECHNICAL DIPLOMA (NTD) NATIONAL ENGINEERING DIPLOMA 6 0,87 HIGHER NATIONAL CERTIFICATE FOR TECHNICIANS (IDT)
NATIONAL DIPLOMA FOR TECHNICIANS (NOT) HIGHER NATIONAL DIPLOMA FOR TECHNICIANS GOVERNMENT CERTIFICATE OF COMPETENCY 136 19,6 NATIONAL DIPLOMA NATIONAL HIGHER DIPLOMA
BACHELORS DEGREE IN ENGINEERING 374 54,0 MASTERS DIPLOMA IN TECHNOLOGY
POST GRADUATE QUALIFICATION 174 25,1
693 100
understood that the grouping of academic
qualifications as per table 11 is not intended to equate the
different qualifications, however, the grouping is merely an
attempt, for purposes of this research, to evaluate the different
qualifications in terms of number of years of study.
67

Univers
ity of
Cap
e Tow
n
Table 11 indicates that a quarter of the respondents are
holders of an academic qualification which is evaluated as ~
post graduate qualification i.e. a qualification evaluated
as matric plus five or six years of _study.
Respondents who indicated their qualification as a
Baccalaurus degree in Engineering (or an equivalent
qualification) formed 54 percent of the survey group whilst
the holders of a three year post matric qualification made
up 19,6 percent.
Hence just under 80 percent of respondents are holders of
an academic qualification which is, for purposes of this
study, considered to be equivalent to a B.Sc Eng or a
higher level qualification.
Table 12 gives a comprehensive analysis of the educational
qualification of the survey group for each sector (private,
public and government).
Table 12 further indicates that the bulk of the more highly
qualified mechanical engineers are to be found in the
private sector.
68

Univers
ity of
Cap
e Tow
n
TABLE 12
QUALIFICATION LEVEL OF SURVEY.GROUP BY OCCUPATION
QUALIFICATION LEVEL I OCCUPATION I
! 1 2 3 4 5
I 6
j TOTAL
N % N % N % N % N % N % N % i
!
I I j GOVERNMENT SECTOR I I I I PROFESSIONAL ENGINEER 3 50.0 14 42.0 I 11 92.0
I 28 53.0 I I GRADUATE ENGINEER 16 46.0 1 8.0 17 32.0 I TECHNOLOGIST . 1 16.6 2 6.0 I 3 5.6 I I TECHNICIAN 1 16.6
I 1 1.8 I OTHER 1 100 1 16.6 2 6.0 4 7.6
i - I ! I I TOTAL 1 100 6 100 34 100 I 12 100 53 100
I ;UBLIC SECTOR
I PROFESSIONAL ENGINEER 3 16.0 30 35.0 17 57.0 50 37.0 I GRADUATE ENGINEER 1 100 52 60.0 9 30.0 62 46.0
TECHNOLOGIST 3 16.0 1 1.2 4 2.9 I TECHNICIAN 4 21.0 1 1.2 5 3.6 I OTHER 9 47.0 2 2.8 4 13.0 15 10.5 I
TOTAL 1 100 19 100 86 100 30 100 136 100 !
I I I I I I PRIVATE SECTOR
PROFESSIONAL ENGINEER 19 25.0 1141 55.0 87 66.0 j257 50.4 I GRADUATE ENGINEER 9 8~o 80 31.0 34 18.0 1113 22.2 TECHNOLOGIST
I 1 20.0 I 26 23.0 6 2.3 2 1.5 35 6.8
TECHNICIAN 2 40.0 13 22.0 2 0.8 17 3.3 OTHER 2 100 2 40.0 34 32.0 25 14.5 19 14.5 88 17.3
i
I TOTAL 2 100 5 100 !111 100 254 100 132 100 510 100
ALL SECTORS
PROFESSIONAL ENGINEER 35 . 25.7 185 49.5 115 66.1 335 48.5 GRADUATE ENGINEER 1 33 9 6.6 148 39.6 34 19.5 192 27.7 TECHNOLOGIST 1 17.0 30 22.1 9 2.4 2 1.2 42 6.1 TECHNICIAN 2 33.0 18 13.2 3 0.8 23 3.3 OTHER 2 67 3 50.0 44 32.4 29 7.7 23 13.2 101 14.6
TOTAL N 3 100 1 100 136 100 374 100 174 100 693 100 % 0.43 0 0.87 19.6 54.0 25.1 100
69

Univers
ity of
Cap
e Tow
n
5.1.5 REMUNERATION STRUCTURE
The remuneration structure of the total survey group is indicated
in table 13.
The analysis of remuneration indicates that more than 77 percent
of mechanical engineers are remunerated in excess of R40 ooo per
annum.
The distribution of salary as indicated by the data is not a
normal distribution and is rather heavily skewed to the upper
limit of the remuneration scale.
TABLE 13
REMUNERATION STRUCTURE OF SURVEY GROUP BY OCCUPATION
REMUNERATION (RANDS x 1000) TOTAL OCCUPATION
<20 20-25 26-30 31-35 36-40 >40 N x N x N x N x N x N x N x
I PROF. ENGINEER 3 16.6 4 19.0 3 10.7 10 22.2 16 26.2 312 54.21348 46.7
17.71197 GRAD. ENGINEER 9 50.0 13 62.0 20 71.5 26 57.7 27 44.3 102 26.4
TECHNOLOGIST 1 4.8 1 2.2 9 14.8 40 6.9 51 6.8
TECHNICIAN 2 11.1 1 4.8 3 10.7 5 11.3 2 3.2 18 3.1 31 3.8
OTHER 4 22.3 2 9.4 2 7.1 3 6.6 7 11.5 103 18.1 121 16.3
TOTAL 18 100 21 100 28 100 45 100 61 100 575 100 748 100
70

Univers
ity of
Cap
e Tow
n
Professional engineers are the more highly remunerated occupation
sector with about 90 percent being remunerated in excess of R40 ooo
per annum.
5.1.6 SEX CLASSIFICATION OF SURVEY GROUP
The classification of the survey group according to sex is
indicated in Table 14 below.
TABLE 14
SEX CLASSIFICATION OF RESPONDENTS
SEXUAL N % CLASSIFICATION
MALE 753 98,2
FEMALE 14 1,8
767 100
Females make up just under 2 percent of all respondents whilst
males form just more than 98 percent.
71

Univers
ity of
Cap
e Tow
n
5.2 UTILIZATION OF MECHANICAL ENGINEERS
The results of this section of the .study deals essentially
with the quantification of "utilization" of mechanical
engineers and is presented under the following four
headings:
Percentage time devoted to various activities
Time devoted to inefficient activities
Actual time devoted to each activity per annum and
Total saving of time and manpower.
5.2.1 PERCENTAGE TIME DEVOTED TO VARIOUS ACTIVITIES
The work patterns of mechanical engineers was analysed on
the basis of time devoted to various activities or job
functions. For purposes of this study a list of twelve (12)
activities were used as a basis of the analysis. The
activities are listed in table 16. The twelve (12)
activities were further classified into three (3) broad
groups of functions (viz practical engineering, theoretical
engineering and management) as per table 15.
Mechanical engineers were requested by question lOA of the
questionnaire to indicate the average percentage of working
time which they devote to each of the activities or job
functions indicated in table 16. Using the information
contained in table 16 and classifying each activity into a
72
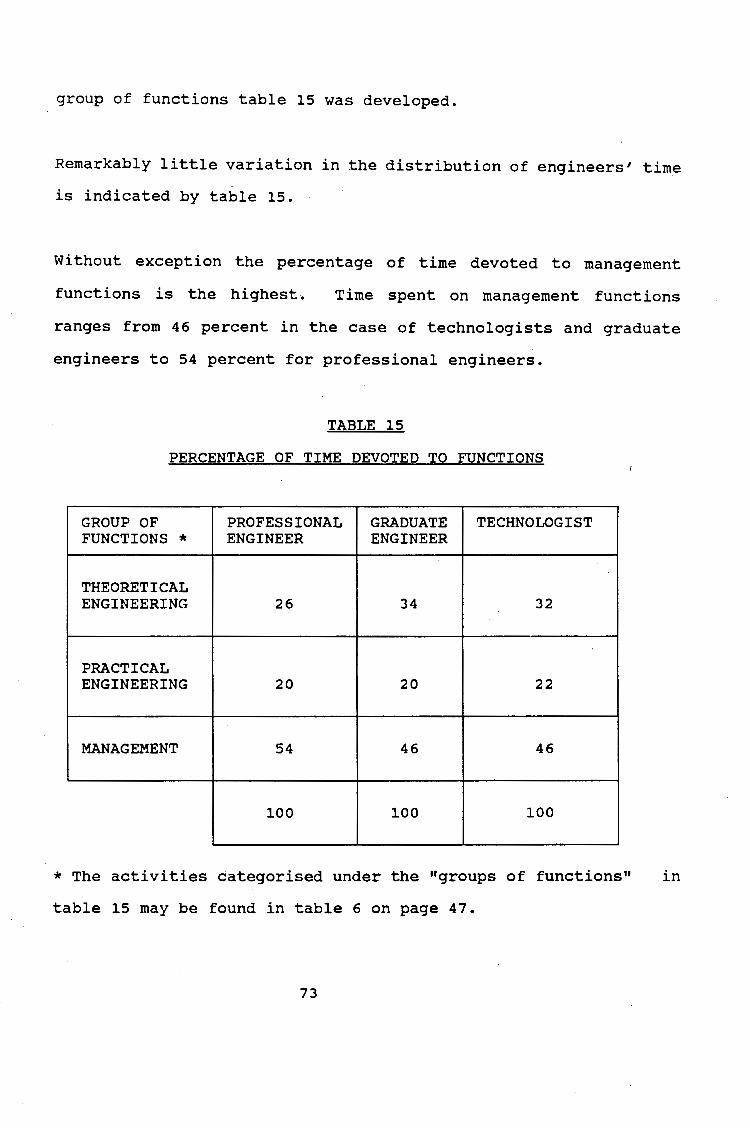
Univers
ity of
Cap
e Tow
n
group of functions table 15 was developed.
Remarkably little variation in the distribution of engineers' time
is indicated by table 15.
Without exception the percentage of time devoted to management
functions is the highest-. Time spent on management functions
ranges from 46 percent in the case of technologists and graduate
engineers to 54 percent for professional engineers.
TABLE 15
PERCENTAGE OF TIME DEVOTED TO FUNCTIONS
GROUP OF PROFESSIONAL GRADUATE TECHNOLOGIST FUNCTIONS * ENGINEER ENGINEER
THEORETICAL ENGINEERING 26 34 32
PRACTICAL ENGINEERING 20 20 22
MANAGEMENT 54 46 46
100 100 100
* The activities dategorised under the "groups of functions" in
table 15 may be found in table 6 on page 47.
73

Univers
ity of
Cap
e Tow
n
Practical engineering demands 20 percent of the time of both
graduate and professional engineers whilst in the case of
technologists it is 22 percent.
TABLE 16
AVERAGE PERCENT OF WORKING TIME SPENT ON EACH
JOB FUNCTION BY SURVEY GROUP
I !
PROFESSIONAL GRADUATE TECHNOLOGIST I ENGINEER ENGINEER
I JOB FUNCTION
N=351 N = 199 N = 52
x x x
1. PRELIMINARY 8 8 8 INVESTIGATION
2. DEVELOPMENT 8 12 10 OF DESIGN
3. DETAIL DESIGN 4 7 8
I DOCUMENTATION
4. COMMUNICATION . 9 10 10 I I
5. MEASURING AND 3 4 6 ESTIMATING
6. INVESTIGATION 4 4 6 ' AND EVALUATION
7. PROJECT MANAGEMENT 11 10 9
8. MAINTENANCE 5 6 7 I
9. MANAGEMENT 23 13 12
10. ADMINISTRATION 8 7 8
11. MARKETING SALES 5 5 13
12. EDUCATION AND 6 7 6 TRAINING
13. TRAVEL 3 3 3
74
Univers
ity of
Cap
e Tow
n
Management is clearly the single activity to which engineers
allocate the highest perce?tage of their time. Time devoted
to the management activity varies from 2 3 percent for
professional engineers to 13 and 12 percent for graduate
engineers and technologists respectively. By inspection of
Table 16 it is evident that other activities to which the
mechanical engineer devotes a high percentage of time
includes marketing and sales, project management,
communication, administration, development of design and
preliminary investigation.
5.2.2 TIME DEVOTED TO INBPPICIBNT ACTIVITIES
The respondents were requested to indicate what percentage
of their work could be performed just as effectively by
persons '1ith a lower qualification (Appendix III, Question
lOB). If. part of the activity performed by engineers could
be done by personnel with a lower qualification it would
mean that the engineer was devoting time to an inefficient
activity i.e. the engineer was being under utilized or
inefficiently utilized.
The extent of under utilization is indicated in table 17
below.
75

Univers
ity of
Cap
e Tow
n
TABLE 17
PERCENTAGE OF WORKING TIME SPENT ON A FUNCTION THAT COULD BE
PERFORMED BY A PERSON WITH A LOWER-QUALIFICATION
I
I
I PROFESSIONAL GRADUATE TECHNOLOGIST ENGINEER ENGINEER
JOB FUNCTION
I N=351 I N = 199 N = 52
x x x
1. PRELIMINARY 31.2 15.9 14.1 I INVESTIGATION
2. DEVELOPMENT 35.2 18.5 15.3 : OF DESIGN
I I
I 3. DETAIL DESIGN 41.6 23.3 15.0
DOCUMENTATION I
4. COMMUNICATION 49.0 32.6 14.0
5. MEASURING AND 52.3 36.8 15.2 ESTIMATING
I 6. INVESTIGATION 57.8 33.4 11.2
AND EVALUATION
7. PROJECT MANAGEMENT 69.2 56.6 15.8
8. MAINTENANCE 62.7 49.7 15.2
9. MANAGEMENT 34.2 12.5 22.0
10. ADMINISTRATION 57.6 30.4 11.4
11. MARKETING SALES 59.1 54.2 23.0
12. EDUCATION AND 53.8 12.6 7.7 TRAINING
76
•

Univers
ity of
Cap
e Tow
n
In the case of professional engineers it is significant to
note that under utilization or inefficient utilization
varies according to activity from a minimum of 3.1 percent to
a maximum of 69,2 percent.
Amongst the activities or job functions which stand out as
tasks in which a considerable amount of work can be done by
personnel with a lower qualification are:
measuring and estimating
maintenance
administration
project management and
detail design documentation.
There is of course an interrelationship between the
percentage of the work that can be perf armed by less
qualified personnel and the percentage of time devoted to a
job function or activity. Table 16 indicates that 11 percent
of the working time of professional engineers is devoted to
"project management". However, table 17 indicates that 69,2
percent of the time professional engineers devote to
"project management" could be saved by having less qualified
persons perform these activities. It thus means that
roughly 7,6 percent of the working time devoted to project
management by professional engineers could be saved since
the activities could be performed by personnel with a lower
qualification.
77
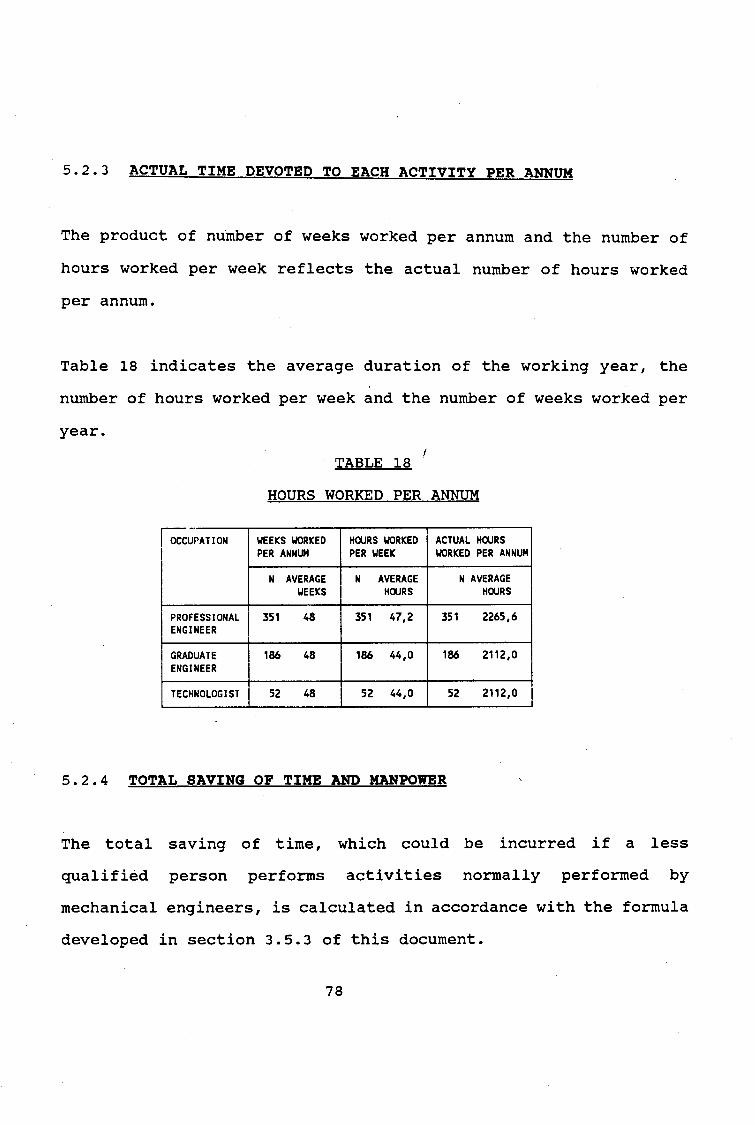
Univers
ity of
Cap
e Tow
n
5.2.3 ACTUAL TIME DEVOTED TO EACH ACTIVITY PER ANNUM
The product of number of weeks worked per annum and the number of
hours worked per week reflects the actual number of hours worked
per annum.
Table 18 indicates the average duration of the working year, the
number of hours worked per week and the number of weeks worked per
year.
TABLE 18
HOURS WORKED PER ANNUM
l occ~~ATION WEEKS \.IORKED HOURS \.IORKED ACTUAL HOURS I PER ANNUM PER WEEK \.IORKED PER ANNUM
I N AVERAGE N AVERAGE N AVERAGE WEEKS HOURS HOURS
PROFESSIONAL 351 48 351 47,2 351 2265,6 ENGINEER
GRADUATE 186 48 186 44,0 186 2112,0 ENGINEER
TECHNOLOGIST 52 48 52 44,0 52 2112,0 I
5.2.4 TOTAL SAVING OF TIME AND MANPOWER
The total saving of time, which could be incurred if a less
qualified person performs activities normally performed by
mechanical engineers, is calculated in accordance with the formula
developed in section 3.5.3 of this document.
78

Univers
ity of
Cap
e Tow
n
Essentially the saving of time is the product of the
following three terms:
actual hours worked per annum
percentage time devoted to a specific activity or job
function and
percentage time of the specific function above, that a
less qualified person could perform.
Table 19 indicates the saving of time and manpower which
could be achieved by employing less qualified persons to
perform a portion of activities currently performed by
mechanical engineers.
79

Univers
ity of
Cap
e Tow
n
I I ACTIVITY I I I ~reliminary I Investigations
I 2. Development of Design
I
I 3. Detail Design
I Doc1.111entation I
I 4. COllTll.lnications
I 5. Measurement and
Estimating I
I 6. Investigation
I and Evaluation
I 7. Project Management
8. Maintenance
9. Management
10. Aaninistration
11. Marketing, Promo-tion and Sales
12. Education and Training
TABLE 19
ANNUAL MANPOWER SAVINGS
ANNUAL SAVINGS
PROFESSIONAL ENGINEERS GRADUATE ENGINEERS I HOURS PER MAN HOURS PER MAN I Pr Eng YEARS Grad Eng YEARS
56,5 8,8 26,9 2,5
63,8 9,9 46,8 4,4,
37, 7 5,8 34,5 3,2
100,1 15,5 68,9 6,5
35,5 5,5 31,1 2,9
52,4 8, 1 28,2 2,7
172,4 26,7 119,5 11,3
71,0 11,0 63,0 5,9
178, 1 27,6 34,2 / 3,2
104,4 16,2 45,0 4,2
66,9 10,4 5,0 5,4
73,2 11,3 18,6 1,8
TOTAL MAN YEARS SAVED FOR ALL ACTIVITIES
TOTAL SAVINGS PER
ACTIVITY
MAN YEARS
11,3
14,3
9,0
22,0
8,4
10,8
38,0
16,9
30,8
20,4
15,8
13, 1
* 210,8
I l I
I
* ~xpressed as a percentage, 210 1 8 man years represents a total
savings of 38 percent of the 550 engineers (graduates and
professionals) who participated in the survey.
80

Univers
ity of
Cap
e Tow
n
The mathematical basis for Table 19 is developed
comprehensively in Appendix VII.
Since one man year is equal to one mechanical engineer it is
thus apparent that about 210 mechanical engineers could be
"saved" by employing less qualified persons to perform a
portion of the activities which currently mechanical
engineers perform.
A saving of 210 mechanical engineers compared to the total
of 550 professional and graduate engineers who participated
in this study means a savings of 38 percent. Alternatively,
the mechanical engineer's utilization could be increased by
as much as 38 percent thus resulting in a savi~g of 210,8
engineers.
If, however, one hypothetically assumes that the utilization
of all 3500 mechanical engineers registered with SAI Mech E
could .be improved by 38 percent, then this would bring about
a total saving of 1330 mechanical engineers which would
result in a surplus since the shortage of mechanical
engineers in 1987 was determined to be 11a< 40 >.
It would be unrealistic to expect an improvement in
utilization of 38 percent in the short term. If it is
assumed that an improvement in utilization of 10 percent is
attainable in over the short term then almost immediately an
81
r
Univers
ity of
Cap
e Tow
n
additional 13 3 mechanical engineers would be available in
South Africa. The number of 133 additional engineers is.
based on an improved utilization of 10 percent and a total
population of 3500 mechanical engineers registered with
SAI Mech E. The number of 133 engineers represents a
decrease of almost 75 percent in the shortage of mechanical
engineers.
It can thus be appreciated that marginal improvements in
utilization of engineers have significant effects on
reducing the shortage of mechanical engineers.
5.3 FACTORS CAUSING POOR UTILIZATIOR
Respondents were asked to indicate, for each activity, the
extent to which five preselected factors contributed to
under utilization. The factors were: ·
(a) no suitable personnel available'in one organisation
(b) not enough suit~ble personnel available in the
organisation
(c) impractical for another person to do part of the job
(d) person who could do the job cannot be kept fully
occupied in the organisation
(e) bad management.
82

Univers
ity of
Cap
e Tow
n
Respondents indicated on a five point scale (1 = none and
5 = very much) the extent to which each factor contributed
to poor utilization of mechanical engineers.
The results presented in table 20 indicates the extent to
which each factor (a to e) contributes to the under
utilization of mechanical engineers.
Factors (a) and (b) point towards a lack or shortage on the
supply side. Factor (b) "not enough suitable perspnnel
available in the organization" was given the as the most
important reason contributing towards the current situation
which results in inefficient utilization of mechanical
engineers. This applied to all job functions or activities
except "management" where factor (c) "impractical for
another person to do part of the job" was ranked higher.
Table 20 further indicates that factors (c) and (d)
generally play an important role in contributing to under
utilization, however, very little can be done about these
factors.
Finally it is apparent, judging by the low rating given to
(e), that respondents are of the opinion that "bad
management" played a minor role in contributing to poor
utilization of mechanical engineers.
83

Univers
ity of
Cap
e Tow
n
TABLE 2G
CONTRIBUTION OF VARIOUS FACTORS TO POOR UTILIZATION
PROFESSIONAL AND GRADUATE ENGINEERS JOB FUNCTION FACTOR
N x
a 58 3.5 b 90 4.4
1. PRELIMINARY INVESTIGATION c 48 3.2 d 18 2.5 e 7 2.0
a 49 3.6 b 87 4.2
2. DEVELOPMENT AND DESIGN c 40 3.0 d 18 2.6 e 6 2.4
a· 32 3.2 b 70 4.8
3. DETAIL DESIGN DOCUMENTATION c 28 3.0 d 26 3.1 e 3 1.7
a 45 3.8 b 81 3.5
4. COMMUNICATIONS c 80 4.0 d 31 3.4 e 16 3.5
a 39 3.4 b 75 4.3
5. MEASUREMENT AND ESTIMATING c 40 3.7 d 30 3.2 e 5 2.0
a 37 3.8 b 92 4.3
6. INVESTIGATION AND EVALUATION c 41 3.9· d 20 1.7 e 4 2.0
a 47 4.0 b 110 4.7
7. PROJECT MANAGEMENT c 48 3.8 d 29 3.2 e 13 2.8
II 39 4.2 b 61 3.8
8. MAINTENANCE c 27 2.6 d 21 3.1 e 13 2.2
a 56 3.8 b 51 3.4
9. MANAGEMENT c 71 4.6 d 20 2.2 e 14 1.7
II 58 3.6 b 76 3.8
10. ADMINISTRATION c 70 3.7. d 52 3.2 e 34 3.0
a 21 4.0 b 35 3.8
11. MARKETING, PROMOTION AND SALES c 23 3.4 d 16 2.2 e 9 1.0
a 30 3.9 b 39 4.2
12. EDUCATION AND TRAINING c 27 3.4 d 13 2.0 e 10 1.8
X = VALUE OF CONTRIBUTION ON A SCALE OF I to 5
84

Univers
ity of
Cap
e Tow
n
• q
5.4 TRAINING REQUIREMENTS OP~ MECHANICAL TECHNICIAN
Table 21 indicates the most appropriate level of academic
qualification required by personnel who could support the .
mechanical engineer in the execution of his duties. -From
table 21 it is suggested that the education qualification
required by the mechanical technician is that of group 4
i.e. either a National or National higher Diploma.
Respondents further indicated that the bias of the required
qualification should be technical as opposed to
administrative.
In the case of the job function or activity
"Administration", respondents indicated that the support
staff required an elementary education i.e. Std 10. This is
indicative of the fact that many of the administration
activities performed by mechanical engineers are way below
his or her level of academic training. This could possibly
be one of the areas of greatest inefficiency •
85
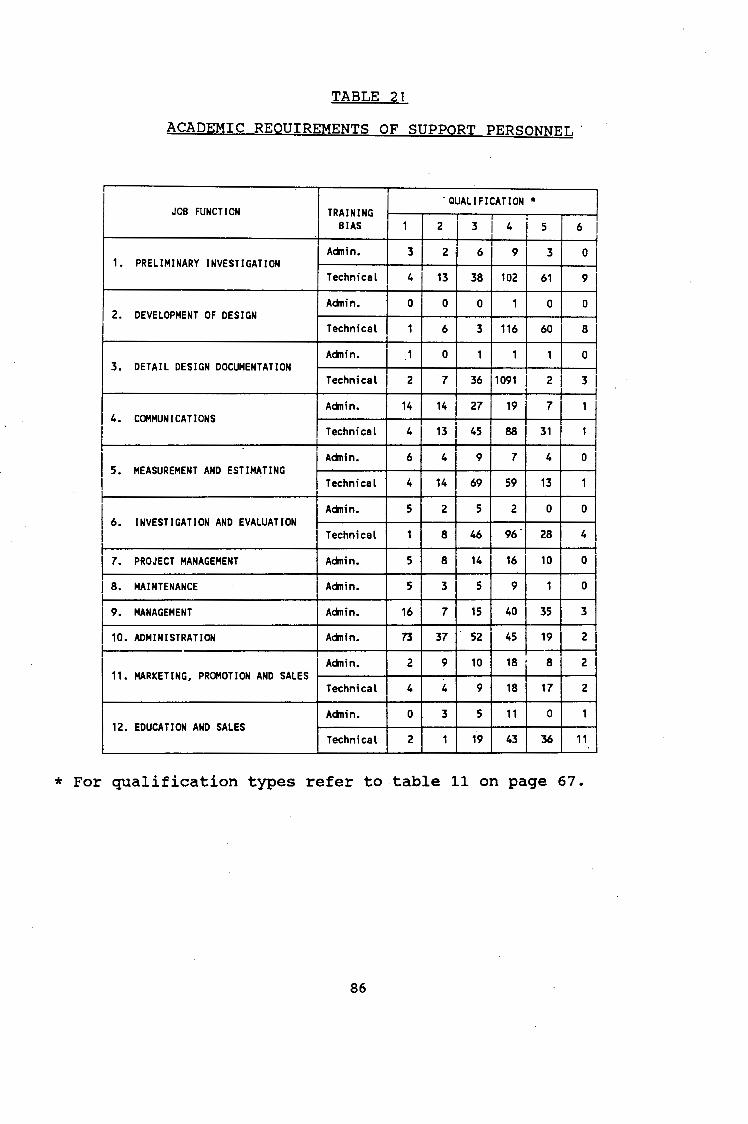
Univers
ity of
Cap
e Tow
n
TABLE 21
ACADEMIC REQUIREMENTS OF SUPPORT PERSONNEL '
I . QUALi FI CATION * JOB FUNCTION TRAINING
BIAS 1 2 3 I 4 5 I 6 I Achin. 3 2 6 9 3 0
1. PRELIMINARY INVESTIGATION
I Technical 4 13 38 102 I 61 9
I 2. Achin. 0 0 0 1 0 0
DEVELOPMENT OF DESIGN Technical 1 6 3 116 60 8 I
i
Achin. 1 0 1 1 1 0 3. DETAIL DESIGN DOCUMENTATION
Technical 2 7 36 1091 I 2 3 I Achin. 14 14 27 19 7 1
4. COMMUNICATIONS Technical 4 13 45 88 31 1
I 5.
Achin. 6 4 9 7 4 0 MEASUREMENT AND ESTIMATING
Technical 4 14 69 59 13 1
Achin. 5 2 5 2 0 0 6. INVESTIGATION AND EVALUATION
Technical 1 8 46 96 28 4
7. PROJECT MANAGEMENT Achin. 5 8 14 16 10 0
8. MAINTENANCE Achin. 5 3 5 9 1 0
9. MANAGEMENT Achin. 16 7 15 40 35 3
10. ADMINISTRATION Achin. 73 37 52 45 19 2
Achin. 2 9 10 18 ' 8 2 11. MARKETING, PROMOTION AND SALES
Technical 4 4 9 18 17 2
Achin. 0 3 5 11 0 1 12. EDUCATION AND SALES
Technical 2 1 19 43 36 11
* For qualification types refer to table 11 on page 67.
86

Univers
ity of
Cap
e Tow
n
CHAPTER 6
DISCUSSION
6.1 INTRODUCTION
The results of this study conclusively indicate that
mechanical engineers are being ineffectively utilized. This
ineffective utilization has wide ranging implications for:
industry and the government who are both users of this
specific type of manpower, and
. universities and technikons who are the suppliers of
mechanical engineers and mechanical engineering
technicians respectively.
The implications, of ineffective utilization of mechanical
engin.eers, for industry, government, universities and
technikons will be comprehensively examined in this chapter.
The study furthermore indicates that there is a shortage of
mechanical engineers in South Africa at this time and that
the shortage is both real and artificial. It is real in the
sense that the national demand for mechanical engineers
exceeds the numbers available. The shortage is to some
extent artificial in that the efficiency of the use of
mechanical engineers is only 62 percent i.e. 38 percent of
the output of each mechanical engineer is wasted.
87
Univers
ity of
Cap
e Tow
n
In order to facilitate an improvement in the utilization of
mechanical engineers and in so doing to reduce the shortage
of mechanical engineers it is of paramount importance that
managers of industrial and commercial concerns should have
an in-depth knowledge of factors affecting utilization.
Since mechanical engineering manpower may be regarded as an
input cost in most industrial concerns it is in the
pursuance of profit maximization or cost minimization that
employers should seek to maximize the utilization of
mechanical engineers as well as all other types of manpower
employed.
6.2 UTILIZATION IN PRACTICB
This study, which amongst other things analysed the
functions performed by mechanical engineers, found that as
much as 38 percent of the engineer's time is spent on
activities which do not require the unique training of a
mechanical engineer. Fundamentally, this finding means that
in practice or in industry mechanical engineers are
performing tasks which could be performed by less qualified
personnel such as technicians.
The figure of 38 percent obtained in this study compares
well with the value of 30 percent inefficient utilization
obtained by Terblanche(41).
88

Univers
ity of
Cap
e Tow
n
Initially, the comparison of the 38 percent inefficient
utilization obtained by this study with the value of 64, 2
percent inefficiency obtained by Hirsch(42), et al, proved
somewhat disappointing. However, careful scrutiny of the
Hirsch study revealed that factors other than "time spent on
activities which do not employ the unique training of
engineers" were taken into account when they determined the
percentage inefficient utilization. It would thus be
somewhat unrealistic to expect a close correlation between
the results obtained by this study and those obtained
by Hirsch, et al.
However, based on answers to question 35 of the
questionnaire Hirsch ( 4 3 ) , et al, used in their survey, the
average engineer indicated that his or her capabilities are
not used for 35 percent of the time i.e. that their
inefficiency was 35 percent. This value correlates very
well with both the values of 38 percent and 30 percent
obtained by this study and Terblanche respectively.
The results, in respect of inefficient utilization, obtained
by both this study and Terblanche are based on a utilization
model which uses as a basic input, information . or data
supplied by the engineers themselves. Hence an element of
subjectivity may well be present in the results obtained
from such models. Furthermore these models do not consider
89

Univers
ity of
Cap
e Tow
n
any additional factors as in the case_of Hirsch(44), et al,
who pointed out that whilst much of the work performed by an
engineer may not be below his engineering training or
capability i.e. may be efficient work, it might still be
classed as unproductive work.
These additional factors which Hirsch, et al, considered to
contribute to inefficiency of utilization are:
assignments of little or no value;
time spent on unassigned activities;
duplication of effort;
employee turnover, and
physical facilities.
Subsequent discussions will clearly show that all of the
above mentioned factors do, to varying degrees, influence
the efficient utilization of engineers, and in practice
these factor do result in decreased efficiency, however, the
problem lies in trying to quantify the effect of each factor
on the overall utilization.
90

Univers
ity of
Cap
e Tow
n
(i) Assignments of little or no value
In this situation, engineers are used to their fullest
capabilities in performing the work, but there is little or
no reason for the assignment. It might be argued that as
long as any creative work is being performed, it has value.
While this is true, in this discussion it is assumed that
the goal is to maximise utilization and in this regard all
effort should be coordinated. Reasons for performing
assignments of little value were given by Hirsch( 45 ) to
include:
poor planning on the part of management or supervisors,
and
where engineers are maintained by companies in order
to secure certain contracts.
(ii) Time spent .Qil unassigned activities
This category concerns the time spent on inefficient
activities such as:
personal projects,
relaxation and relief (tea and toilet breaks), and
unnecessary reading.
91

Univers
ity of
Cap
e Tow
n
It is not suggested that the engineer should be deprived of
reasonable relaxation. A major concern in this category is
the necessity to create in the individual engineer a feeling
that he belongs to and is part of the organization. This
concern is related to the problem of human motivation. Very
little information on the interrelation between motivation
and utilization was uncovered and this could certainly be
suggested as an area for future research.
(iii) Duplication of effort
Duplication of effort is taken to refer to efforts being
expended on the same activities when the duplication is
unknown to the parties concerned. Such duplication of
effort exists both between different companies and within
individual companies.
include:
Reasons for such duplication may
competitive restrictions between companies;
poor communications, and
organizational weaknesses within companies.
Hirsch< 46 ), et al, estimates that the loss of engineering
time due to duplication of effort may be anywhere between 30
and 50 percent.
92
Univers
ity of
Cap
e Tow
n
(iv) Employee turnover
Hirsch< 47 >, et al, contends that employee turnover is
wasteful to engineering manpower utilization, primarily
because of time which is spent by the engineer in becoming
reoriented to the new environment. Time lost in
reorientation varies greatly with the individual and the
company, however, Hirsch's estimate is that job-changing
could decrease an engineer's output by about 20 percent.
(v) Physical Facilities
It is a fact that utilization of engineers like almost all
types of personnel is to some extent affected by the
numerous aspects of physical environment. It is difficult
to attempt to estimate the corresponding increase in
utilization that may accompany a change in physical
facilities or conditions, thus ~urther research is certainly
needed in this field. It appears quite likely that certain
changes would cause significant increases in human output.
6.2.1 OVER-ALL UTILIZATION
All of the factors identified by Hirsch serves to further
erode the engineer's efficiency, hence the efficiency of
engineering
efficiency
utilization
obtained
93
cannot be assumed to be that
by considering inefficient or

Univers
ity of
Cap
e Tow
n
nonproductive uses alone. The over-all efficiency is the
product of the various individual efficiencies of the
complete system.
The value of efficiency of 62 percent obtained in this study
is thus considered to be a high side value. Taking
cognisance of additional efficiencies would have the effect "-
of further reducing the value of efficiency obtained in this
study.
Future research on the subject of "utilization of
engineering manpower" should endeavour to focus on a
quantitative analysis of the factors mentioned here.
6.3 CAUSES OF POOR OTILIZATIOH
Based on the quantitative analysis of the utilization of
mechanical engineers conducted by this study, it seems
reasonable to assume that the utilization of 62 percent is
lower than could be realized under "optimum conditions".
Consideration was given to the possible causes for the
present conditions not being optimum.
The study essentially focused on the relative importance of
five factors which were identified by a previous studyC 48 >
to contribute to poor utilization. The results contained in
table 20 clearly indicate that the major cause for poor
94
Univers
ity of
Cap
e Tow
n
utilization of mechanical engineers is a lack of sufficient,
suitably trained support staff to assist the engineer.
It is interesting to note that respondents felt that
management did not play an important role in contributing
towards inefficient utilization. However, management should
take cognisance of the benefits which result from improved
utilization and endeavour to ensure that the highest possible
utilization of its engineering manpower is being attained.
The finding of this study with regards to causes of poor
utilization correlates well with the results of the study
conducted by Cilliers ( 49 ) on the possible causes for poor
utilization of electrical and electronic engineers.
Cilliers is of the opinion that the provision of sufficient
suitably qualified technicians will to a large extent reduce
the shortage of engineers.
The finding of this study is supported by Davidson< 50 > who
cited an example of a large American company which found
that it could reduce its engineering staff by 15 percent,
get more work done by happier engineers and pay them better,
by relieving them of non-technical duties. The hiring of a
few more clerks, secretaries and engineering technicians did
the trick!
95

Univers
ity of
Cap
e Tow
n
In support of the above finding Professor G Bozzoli(51) wrote:
"The inefficient utilization_ of highly
trained manpower is not solved by inducing
more young men to take university degrees
in engineering, since this will only result
in greater inefficiency".
"Clearly, the answer lies in training many,
many more young men and women as technicians".
6.4 SUPPORT PERSONNEL FOR MECHANICAL ENGINEERS
This research study along with various others< 4> (lO) have
clearly indicated that the engineer's performance and
utilization would be enhanced by employing supporting
personnel ~ho could undertake a host of routine activities
identified by Hirsch< 20 >, et al.
It is recognised that it is both impractical and undesirable
to relieve the engineer of all the routine activities,
however, it is the contention of the researcher that care
must be taken to prevent these activities from absorbing a
substantial portion of his time.
The extent to which an engineer would require the services
of either a technical or administrative assistant would
depend on the nature of his work and also on his experience
and the nature of his responsibilities. By referring to
96

Univers
ity of
Cap
e Tow
n
figure 7 it can be shown that a typical mechanical engineer's
career can be roughly divided into three phases:
(i) The first 5 years after graduation:
this period is generally dominated by technical
tasks with limited managerial functions.
(ii) The next 5 to 10 years:
during this period management activities rapidly
increase in importance while theoretical or technical
tasks decrease.
(iii) The last phase of the mechanical engineer's career:
this period is dominated by managerial activities
which occupy more than 60 percent of his time.
The above information has implications for the training of
both engineers and technicians and these will be examined
later in section 6.6.
Admittedly, this is a very simplified picture of an
engineer's career, however, it is useful in determining the
training bias required of support personnel at various
stages in the engineer's career.
Table 21 reflects that most respondents indicated that
technical assistance would serve the engineer better than
administrative support. However, the information contained
in table 21 bears no reference to the engineer's experience
97

Univers
ity of
Cap
e Tow
n
or the phase of his career in which he is. Hence, while
the data in table 21 is statistically correct it does not
have much value unless it is considered along with
additional information about the engineer's experience.
Smit< 52 > contends that the type of assistance required by an
engineer is directly related to the nature of tasks he is
performing. Based on the aforementioned contention it
would be correct to deduce that the average mechanical
engineer would require the following type of assistance
during the various phases of his career:
First phase
Second phase
Third phase
technical
a combination of technical and managerial
managerial
Respondents indicated that the desired level of academic
qualification of the technical support personnel should be a
National Diploma (TJ). No scientific basis exists to
support or refute the claims made by respondents in the
above regard.
experience.
Possibly the information was based on
6.5 CHANGING WORK PATTERNS :IXfll INCREASING EXPERIENCE
The results of the study as contained in table 15 indicates
that a typical professional mechanical engineer would spend
his working time roughly as indicated below:
98

Univers
ity of
Cap
e Tow
n
Activity
Theoretical Engineering
Practical Engineering
Management
% time
26
20
54
The results contained in table 15 represents a "snapshot" of how
mechanical engineers (professional and graduates) divide their time
amongst theoretical engineering, practical engineering and
management activities.
1 ·
The data supplied by respondents enabled the variation in work
patterns with increasing experience to be established.
The zero base of experience was set at age 25 years old and the
results of the analysis are reflected in table 22 and figure 7
below.
TABLE 22
VARIATION IN TIME SPENT ON ACTIVITIES
WITH INCREASING EXPERIENCE
YEARS OF EXPERIENCE ACTIVITIES
0 10 20 30
THEORY 62 38 28 26
PRACTICAL 11 12 10 10
MANAGEMENT 27 50 62 64
100% 100% 100% 100%
99
40
26
12
62
100%

Univers
ity of
Cap
e Tow
n
tJ. TIME
eo
40
20 ·······················-·················-·························································································································
0 10 20 30 YEARS EXPERIENCE
THEORY -+- PRACTICAL ~ MANAGEMENT
FIGURE 2
VARIATION IN TIME SPENT ON ACTIVITIES WITH INCREASING EXPERIENCE
Theoretical functions decrease significantly from 62 percent
at the beginning of the mechanical engineer's career to 26
percent after 40 years experience. However, managerial
activities increase relatively r~pidly where, after 10 years
experience, management related activit~es occupy a typical
mechanical engineer for 50 percent of the time. Management
activities peak after 30 years experience and take up 64
percent of the engineer's time.
100
Univers
ity of
Cap
e Tow
n
Practical engineering activities remain relatively constant
throughout the mechanical engineer's career, fluctuating
between 10 and 12 percent.
It is interesting to note that university education, in
respect of engineering, essentially concentrates on
knowledge related to theoretical activities< 48 >. However,
since theoretical activities rapidly decreases in importance
for the average mechanical engineer as he gains experience,
it could be inferred that mechanical engineers make
decreasing use of their formal engineering education.
If the aforementioned inference is correct, then there is
reason for serious concern since one could then further
deduce that the utilization of an engineer decreases in
direct relation to the decrease in use of theoretical
engineering knowledge.
The above hypothesis would, however, require to be confirmed
and it is suggested that much benefit could be derived from
a -study which determined the variation in utilization
throughout the career of a typical mechanical engineer.
101
Univers
ity of
Cap
e Tow
n
6.6 ENGINEERING EDUCATION FOR IMPROVED UTILIZATION
Table 12 on page 69 indicate that despite the fact that all
respondents are registered with SAI Mech E and as such may
be referred to as "engineers", 20 percent do not possess the
basic academic qualification of an engineer Le. B.Sc(Eng)
which is evaluated as four years post matric.
The above information serves to confirm the contention that
certain activities normally performed by engineers do not
require the comprehensive training of an engineer and may be
efficiently performed by a person with less academic
training such as a technician in possession of a National
Diploma.
Furthermore, figure 7 indicates that .the basic mechanical
engineering degree course provides engineers with a
theoretical education which far exceeds the normal. demands
made on an engineer throughout his career. However, it
could also be deduced that in other areas, noticeably
management skills, the degree training does not equip an·
engineer to fully handle the demands made on him.
102

Univers
ity of
Cap
e Tow
n
The suppliers (universities and technikons) of engineering
manpower (engineers and technicians) are confronted with two
main issues:
(i) engineers frequently perform activities which are
below their level of training, and
(ii) the theoretical training of an engineer more than
adequately prepares him for the performance of
theoretical engineering activities.
The results contained in table 20 indicate that the main
reason for poor utilization of engineers is "not enough
suitable personnel available".
Clearly then, to solve the issue regarding engineers
performing activities below their training requires the
training of greater numbers of technicians at technikons.
However, in order to effect the proposed solution it is
important that the career of a technician be projected as an
attractive alternative to that of an engineer.
It is thus proposed that urgent attention be given to the
following aspects which currently restrict the training of
103

Univers
ity of
Cap
e Tow
n
sufficient numbers of engineering technicians for industry
in general:
(i) The professional status of technicians
The status of the technician requires to be enhanced by:
delegating activities to the technician which will make
full use of his training, and
remunerating the technicians in line with the level of
work performed and responsibility carried.
(ii) Financial Provisions for training technicians
The state should ensure that sufficient, suitably funded
technikons are provided for training an increased number of
technicians. In this regard the state has a responsibility
to ensure that technikon facilities are suitably equipped,
funded and utilized. In order to assist the state in
determining the number of technikons and the level of
funding required, it is suggested that an investigation be
commissioned with the mandate to establish:
the number of technicians ideally required annually,
the number of technikons required to support the
training of these technicians,
104

Univers
ity of
Cap
e Tow
n
the optimum level of funding required by technikons
to provide the numbers of technicians required by
industry, and
the necessity of provide bursaries to student
technicians.
Universities play an important role in providing engineering
graduates who are able to satisfy the technological and
other demands made by industry. However, it it suggested
that a study should be made to determine the caliber of
engineer that industry needs i.e. to determine industry's
requirement with regards to
theoretical engineering,
management.
training
practical
in such aspects as
engineering and
It is then further suggested that based on the findings of
the proposed study, universities should determine the extent
to which their courses require to be modified to meet the
requirements of industry.
The above proposals will result in an improvement in the
utilization of mechanical engineers and given the high cost
of ineffective utilization it would be well worth
pursuing< 53 >.
105

Univers
ity of
Cap
e Tow
n
Technikons should ensure that the National Diploma
programmes are sufficiently balanced to ensure that the
technician can provide both the technical and manegerial
support required by the engineer.
106
Univers
ity of
Cap
e Tow
n
CHAPTER 7
CONCLUSIONS AND RECOMMENDATIONS
7.1 INTRODUCTION
This investigation into the utilization of mechanical
engineering manpower in South Africa was regarded as a pilot
study. The findings were intended to:
(i) stimulate further research into related problems, and
(ii) initiate the adoption of a programme of action which
would bring about an improvement in the utilization
of mechanical engineers and in so doing result in a
decrease in the shortage of mechanical engineers.
A summary of the most important conclusions which can be
drawn from this study will be presented and finally, a
summary of recommendations will be given.
7.2 CONCLUSION
The aim of the study was to investigate the utilization of
mechanical engineering manpower in South Africa.
In the light of the survey on documented research literature
related to the utilization and supply/demand for 1
107
Univers
ity of
Cap
e Tow
n
mechanical engineers, it is possible to make the following
conclusions:
(i) Scientific research literature on· the utilization of
mechanical engineering manpower is scarcely
available.
(ii) The bulk of available documented research literature
is of little benefit.to the industrialist to increase
the utilization of his engineers.
(iii) A shortage of mechanical engineers has most certainly
existed in South Africa since a least 1973. Since
then the shortage has tended to decrease from a level
of about 275 mechanical engineers in 1973 to 178 in
1987.
The study used the model employed by the Federation of
Societies of Professional Engineers to determine the
shortage of mechanical engineers.
Models used to determine the utilization of mechanical
engineers were reviewed and the study adopted a model which
used the percentage of.working time spent on different
activities as a basis.
\.
108

Univers
ity of
Cap
e Tow
n
)
The study then set out to seek empirical data on:
(i) how mechanical engineers spend their working time,
and
(ii) what percentage of working time mechanical engineers
spend on activities which they consider to be below
their training.
Based on the findings of this study it is possible to
conclude that:
mechanical engineers are certainly ineffectively
utilized_ in South Africa and
the extent of the ineffective utilization is of the
order of 38 percent.
The study examined the sensitivity of the shortage of
engineers to variations in utilization and in this regard it
can be concluded that the shortage of mechanical engineers
is very sensitive to variations in utilization i.e. the·
shortage will be greatly reduced by a small increase in
utilization of mechanical engineers;
Empirical data was also obtained in respect of:
the factors which cause poor utilization of mechanical
engineers and
109
Univers
ity of
Cap
e Tow
n
the level of training required by personnel who could
support the engineer in the performance of those
activities considered to be below the engineers
training or routine in nature.
In light of the findings of the study it can be conducted
that:
the factor which contributes the most to poor
utilization of mechanical engineers is the shortage of
adequately trained support staff or technicians, and
finally, the study concluded that the most appropriate
level of training for the support staff is that of a
National Diploma i.e. a qualification evaluated as
matric plus three years.
110

Univers
ity of
Cap
e Tow
n
7.3 RECOMMENDATIONS
On the strength of the findings it is possible to make
recommendation as to how the utilization of mechanical
engineers may be improved and in so doing reduce the the
shortage of mechanical engineers.
Since the probl·em of a shortage of mechanical engineers is a
national one, it is recommended that it be addressed by a
National committee comprising representatives from the South
African Council for Professional Engineers, the Department
of Manpower and the South African Institution of Mechanical
Engineers. This committee should serve to coordinate the
nation's effort to meet the growing demand for mechanical
engineers by amongst other things:
{i) increasing public understanding of the importance of
optimum utilization of engineers to South Africa's
future,
{ii) encourage the training and the use of technicians to
release engineers from routine duties,
{iii) gather more adequate data on supply and demand of
engineering manpower,
{iv) making maximum effective use of our existing supply
of engineers,
111

Univers
ity of
Cap
e Tow
n
(v) promoting scientific and mathematics at primary and
secondary schools in order to increase the number of
people entering the engineering field, and
(vi) making companies aware of inefficiencies associated
with:
duplication of effort,
poor working conditions, and
high turnover.
It is recommended that universities ensure that the
engineers they are producing fully meets the requirements of
industry.
In the above regard it is recommended that universities
review their academic programmes with the view to ensuring:
a cqrrect balance between technical and managerial
training, and
that the engineering course content is related to the
functions that engineers actually perform in industry.
112
Univers
ity of
Cap
e Tow
n
BIBLIOGRAPHY
1. TERBLANCHE, S.A. An analysis of the macro-manpower
demand and supply situation (1977-1987) in the RSA:
Aid to manpower planning at organizational level.
Pretoria, HSRC 1981 (Report No. MM-83) p. 1.
2. EBERSOHN, D. Die ingenieurs in die RSA. HSRC,
(MM-55) Pretoria 1975~ p
3. TERBLANCHE, S.S. The ideal skill mix in the civil
engineering industry. HSRC (MR-95) Pretoria 1982.
4. CILLIERS, G. Benutting van elektriese elektroniese en
meganiese ingenieurs. HSRC (MN-112) Pretoria 1985.
, 5. LLOYD, P. "The supply and demand for engineers 1988"
Report of the Federation of Societies of Professional
Engineers. Johannesburg 1988.
6. BARKER, F s Manpower shortages in Smith Africa HSRC
Pretoria 1984, p.21.
7. SOUTH AFRICA. Department of Education Arts and
Science Proceedings, the National Conference on the
effective utilization of professional engineers.
July 1965, p.38.
8. TERBLANCHE, S.S., op cit p.16.
113

Univers
ity of
Cap
e Tow
n
9. TORPEY, W G The Utilization Programme of the
President's Committee on Scientists and Engineers.
Journal of Engineering Education Vol 49 No, 3,
December 1958, pp. 205.
10. HIRSCH I, MILWITT w, OAKES w and PELTON R. 1958.
The Relation of Utilization to the Shortage of
Scientists, IRE Transactions on Engineering
Management, September 1958 pp 73 - 127.
11. ·HIRSCH, I, et al, op cit p. 82.
12. HANSEN, W LEE. The "Shortage" of Engineers,
Review of Economics and Statistics, August 1961:
251 - 56.
13. CAIN, G.G. FREEMAN, R.B., HANSE, W.L. Labor market
analysis of engineers and technicial workers.
Baltimore, Johns Hopkins University Press, 1973
p. 32.
14. CAIN, op cit p.33.
15. BOZZOLI, G.R. "Manpower training in south Africa and
the role of the Universities". Conference proceedings
vaal Triangle College for Advanced Technical Education
23 and 24 October 1978, p. 1.
114
Univers
ity of
Cap
e Tow
n
16. BOZZOLI, op cit p. 2.
17. BOZZOLI, op cit p. 3.
18 .. SOUTH AFRICA (REPUBLIC). Department of National
· Education Commission of Enquiry into the method of
training for University degrees in Engineering.
Report: Part I and Part II, Straszacker, R.L. IN
STRASZACKER, et al., Pretoria, 1964.
19. GOODE R c J "Optimium use of manpower in South Africa
with secial reference to the technologist" Conference
proceedings Vaal Triangle College for Advanced
Technical Education 23 and 24 October 1978.
20. HIRSCH, et al, op cit p. 84.
21. HIRSCH, et al, op cit p. 102.
22. SKOLNICK, MICHAEL L. 1970. An Empirical Analysis of
Substitution Between Engineers and Technicians in
Canada. Industrial Relations Quarterly Review (April
1970), pp. 284 - 300.
23. HIRSCH, et al, op cit p. 84.
24. HIRSCH, et al, op cit p. 85
115

Univers
ity of
Cap
e Tow
n
25. HERWALD, S W The Future Engineering Needs of Large
Industry. Journal of Engineering Education, Vol 51,
No. 1 October 1960 pp 37 - 38.
26. GRESENS, HJ. Make Your Own Engineers, IRE Transactions
on Education September 1958 pp 88 - 90
27. TORPEY, op cit p. 209.
28. CAMBEL PITT, L.T. TECHNICIANS - a review with
contributions. The South African Mechanical
Engineer 20(9), September 1970: 282 - 311.
29. HIRSCH, op cit p. 102
30. BAKER, op cit p. 1
31. BLANK D.S. and STIGLER G.J. The Demand and Supply
of Scientific Personnel 1957 p. 28
32. Baker, op cit p. 2
33. VAN PLETZEN, J. The supply of and demand for
engineers in 1987. HSRC (MM-82) Pretoria, 1981.
34. Baker, op cit p. 26
35. Baker, op cit p. 30
36. Blank and Stigler, op cit p. 40
116

Univers
ity of
Cap
e Tow
n
37. Cain, et al, op cit p. 86
38. Hirsch, et al, op cit p. 91
39. Hirsch, et al, op cit p. 102
40. Lloyd, op cit p. 13
41. Terblanche, op cit p. 18
42. Hirsch, et al, op cit p. 84
43. Hirsch, et al, op cit p. 103
44. Hirsch, et al, op cit p. 86
45. Hirsch, et al, op cit p. 87
46. Hirsch, et al, op cit p. 107
47. Hirsch, et al, op cit p. 93
48. Cilliers, op cit p.
49. Cilliers, op cit p.
so. DAVIDSON AW "The Technical Manpower Situation"
Journal of Engineering Education Vol 47 No. 3
November 1956 pp 263 - 268.
51. Bozzoli, op cit p. 18
117

Univers
ity of
Cap
e Tow
n
52. SMIT, P.C. Die ingenieurspotensiaal by leerling
ingenieurstegnici. HSRC (MM-62) Pretoria 1976.
118
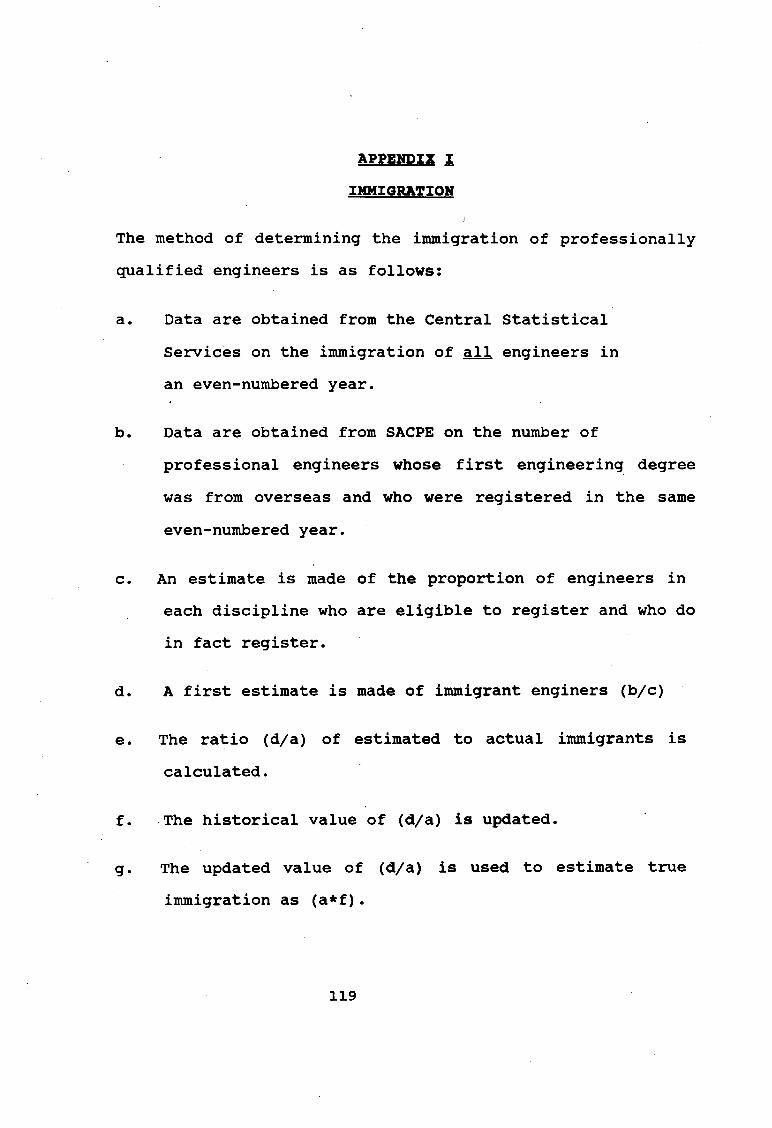
Univers
ity of
Cap
e Tow
n
APPENDIX !
IMMIGRATIOH
The method of determining the immigration of professionally
qualified engineers is as follows:
a. Data are obtained from the Central Statistical
Services on the immigration of all engineers in
an even-numbered year.
b. Data are obtained from SACPE on the number of
professional engineers whose first engineering degree
was from overseas and who were registered in the same
even-numbered year.
c. An estimate is made of the proportion of engineers in
each discipline who are eligible to register and who do
in fact register.
d. A first estimate is made of immigrant enginers (b/c}
e. The ratio (d/a} of estimated to actual immigrants is
calculated.
f. The historical value of (d/a) is updated.
g. The updated value of (d/a) is used to estimate true
immigration as (a*f}.
119
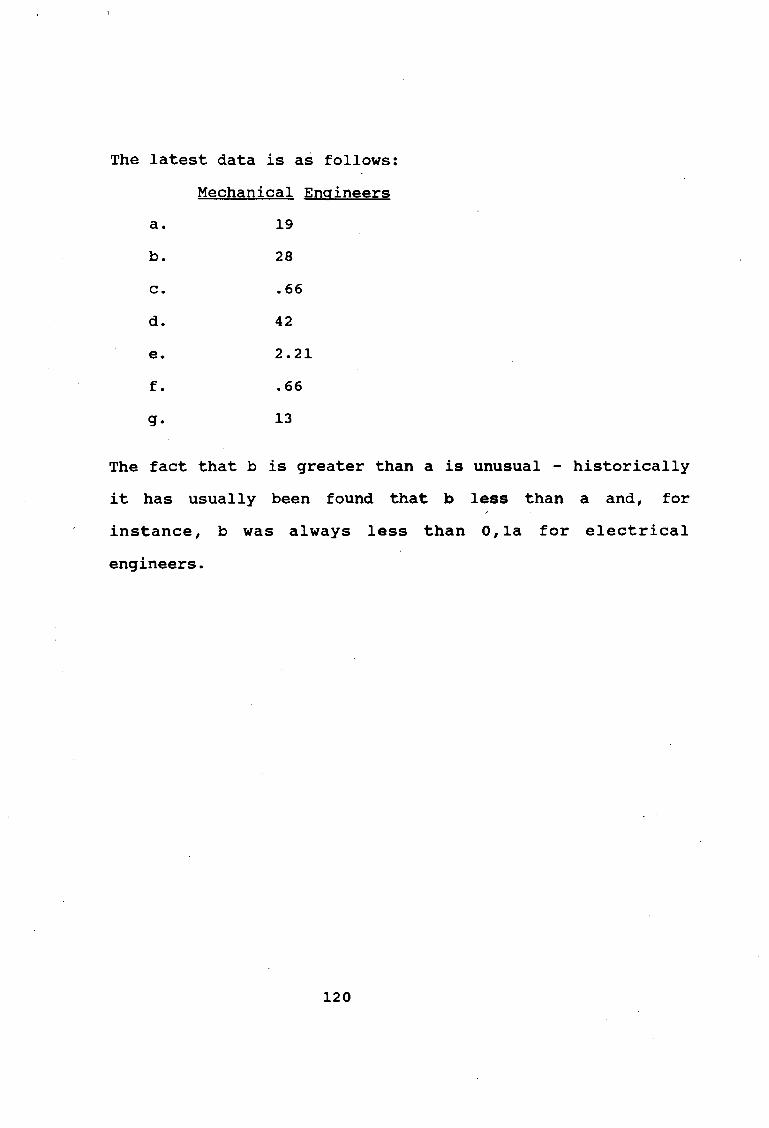
Univers
ity of
Cap
e Tow
n
The latest data is as follows:
Mechanical Engineers
a. 19
b. 28
c. .66
d. 42
e. 2.21
f. .66
g. 13
The fact that b is greater than a is unusual - historically
it has usually been found that b less than a and, for
instance, b was always less than O, la for electrical
engineers.
120
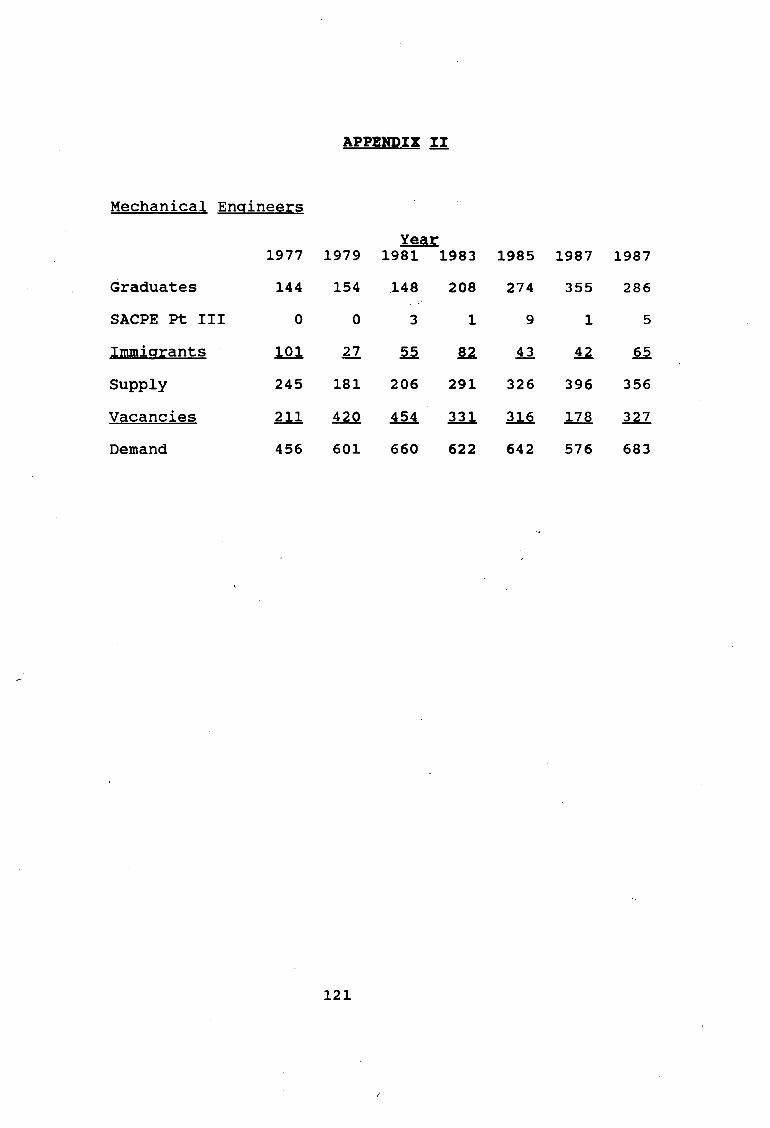
Univers
ity of
Cap
e Tow
n
APPENDIX II
Mechanical Engineers
Year 1977 1979 1981 1983 1985 1987 1987
Graduates 144 154 148 208 274 355 286
SACPE Pt III 0 0 3 1 9 1 5
Immigrants 101 27 55 ll 43 42 65
Supply 245 181 206 291 326 396 356
Vacancies 211 420 454 331 316 178 327
Demand 456 601 660 622 642 576 683
121
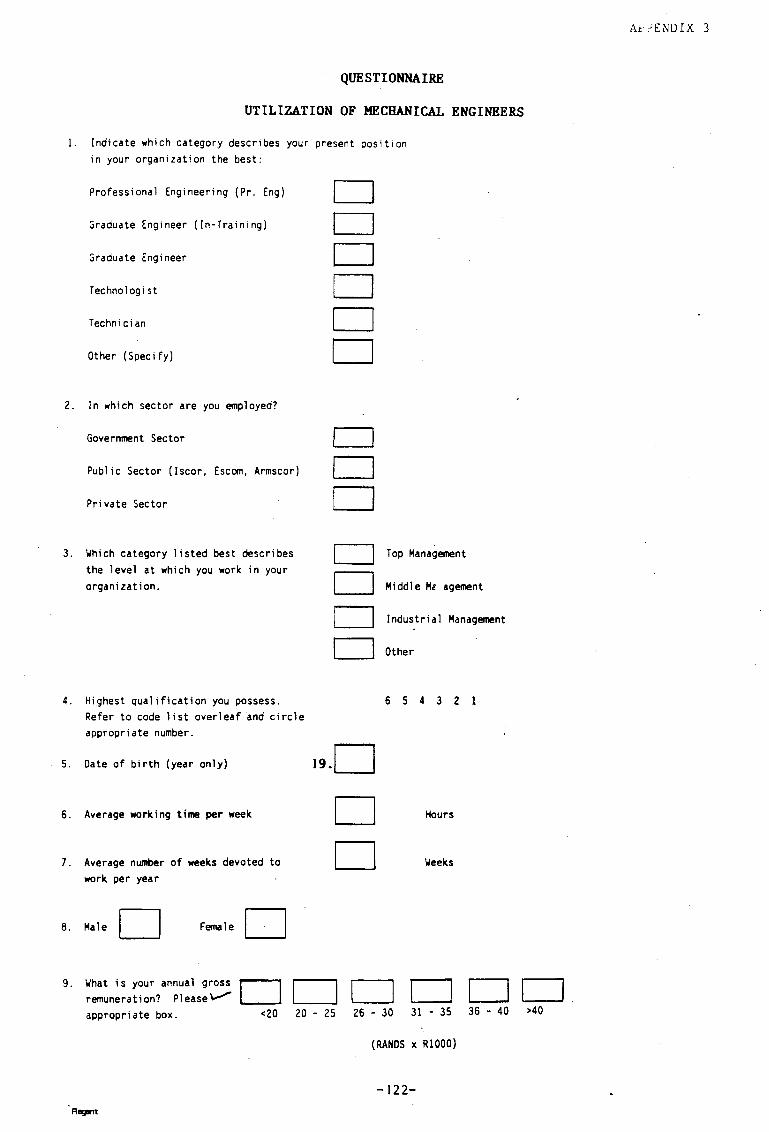
Univers
ity of
Cap
e Tow
n
QUESTIONNAIRE
UTILIZATION OF MECHANICAL ENGINEERS
1. Indicate which category describes your present position in your organization the best:
Professional Engineering (Pr. Eng)
Graduate Engineer (In-Training)
Graduate Engineer
Technologist
Technician
Other (Spec i fy)
2. In which sector are you employed?
Government Sector
Public Sector (!scar, Escom, Armscor)
Private Sector
3. Which category listed best describes the level at which you work in your organization.
4. Hi.ghest qualification you possess. Refer to code list overleaf and circle appropriate number.
5. Date of birth (year only)
6. Average working time per week
7. Average number of weeks devoted to work per year
8. Hale D Female D
D D D D D D
D D D LJ Top Management
D Middle He agement
r-1 ~ Industrial Management
D Other
6 5 4 3 2 l
19.D D D
Hours
Weeks
9. What is your annual gross remuneration? Pl ease\..--""'" appropriate box.
DDDDDD <20 20 - 25 26 - 30 31 - 35 36 - 40 >40
(RANDS x RlOOO)
-122-Regent
Ai: :'END IX 3
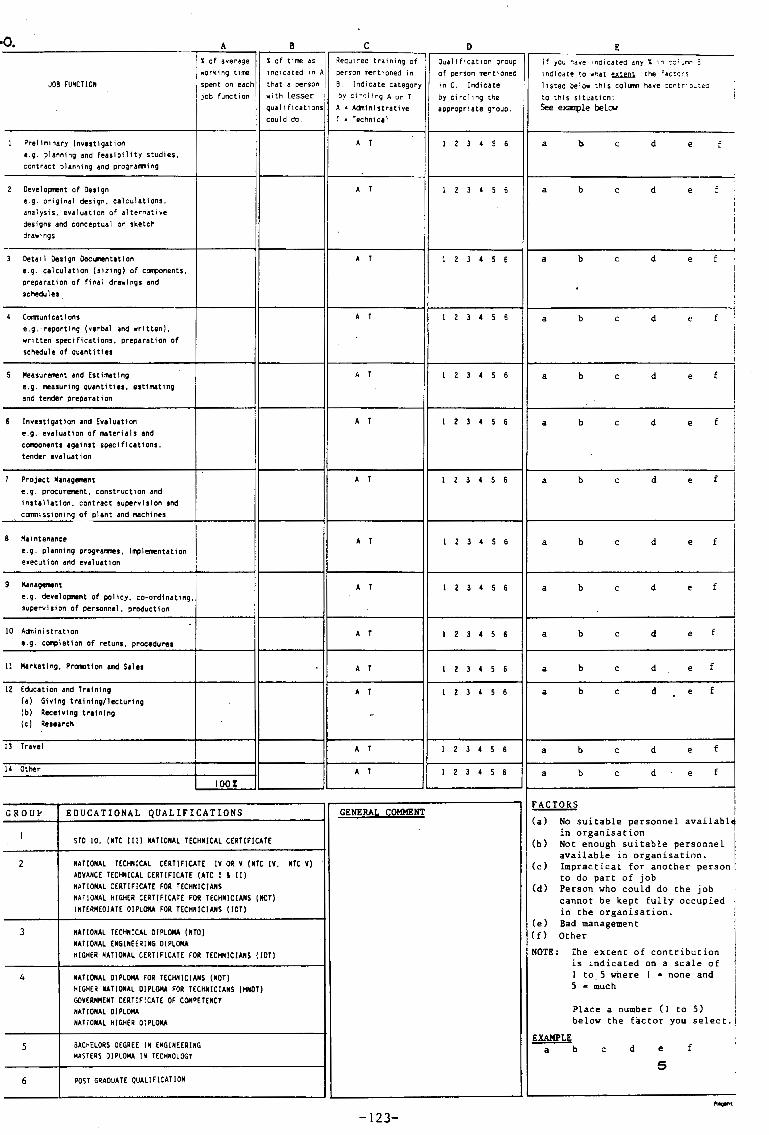
Univers
ity of
Cap
e Tow
n
·O. A B c D E X of average X of time as Requ1:-ed training of I Qualificat1on group If you have indicated any i 1n ::• .imt"' S
working time indicated 1n A person mentioned in of person mentioned 1ndicate to what c.a.u.ru. the factc•s JOB FUNCTION spent on each that a person B. Indicate category in C. Indicate listed below this col1.1nn have :ontr1bu~e-:
job function with lesser by cir*':ling A or T by circling the to this situat1on: ! qualifications A = Actninistratlve approprl ate group. See exanple belcv could do. T • Technical
1 Pre11m1nary Investigation A T 1 2 3 4 5 6 a b c d e f e.g. planning and feasibility studies,
contract planning and progranmlng
2 Oevelo~nt of Design A T 1 2 3 4 5 6 a b c d e f I e.g. orlginal design, calculations, j
analysis. evaiuation of alternative I designs and conceptual or sketch I I drawl ngs ' -
3 Oetai 1 Design Ooc""8ntatlon A T 1 2 3 4 5 6 a b c d e f I e.g. calculation (sizing) of components, I preparation of final drawl ngs and . !
scneclules
A T 1 2 3 4 5 6 b d f ' 4 Cannunlcatlons a c e e.g. reporting (verbal and written),
i written spectf;cations, preparation of i schedule of quantities '
I I
5 Measurement and Estimating A T 1 2 3 4 5 6 a b c d e f e.g. measuring quantities, estimating
and tender preparation
6 Investigation and Evaluation A T I 2 3 4 5 6 a b c d e f e.g. evaluation of materials and
components against specifications,
tender eva 1 uat ion i 7 Project Management A T 1 2 3 4 5 6 a b c d e f I e.g. procurement, construction and l
installation. contract supervision and
I comnisstoning of plant and machines
8 Hai ntenance A T 1 2 3 4 5 6 a b c d e f e.g. planning programres, Implementation execut;on and evaluation
9 Management A T I 2 3 4 5 6 a b c d e f e.g. developirent of pol Icy, co-ordi nat Ing, supervision of personne 1 , ~reduction
10 Acini n is t ration A T I 2 3 4 5 6 a b c d e f e.g. completion of retuns. procedures
11 Marketing, Promotion and Salu A T I 2 3 4 5 6 a b c d e f
12 Education and Training A T I 2 3 4 5 6 a b c d e f (a) Giving training/lecturing (b) Receiving training -(c) Research
13 Travel A T 1 2 3 4 5 6 a b c d e f
14 Other A T I 2 3 4 5 6 a b c d e f 100%
i FACTORS I G ROUI:' EDUCATIONAL QUALIFICATIONS GENERAL COMMENT
(a) No suitab.le personnel availabld in organisation I
I STD 10, (NTC 11 l) NATIONAL TECHNICAL CERTIFICATE (b) Not enough suitable personnel I available in organisation.
2 NATIONAL TECHNICAL CERT! Fl CATE IV ORV (NTC IV, NTC V) (c) Impractical for another person ADVANCE TECHNICAL CERTIFICATE (ATC l & II) to do part of job NATIONAL CERTIFICATE FOR TECHNICIANS (d) Person who could do the job NATIONAL HIGHER CERTIFICATE FOR TECHNICIANS (NCT) cannot be kept fully occupied INTERMEDIATE DIPLOMA FOR TECHNICIANS (IDT) in the organisation.
(e) Bad management 3 NATIONAL TECHNICAL DIPLOMA (NTO) (f) Other
NATIONAL ENGINHRING DIPLOMA NOTE: The extent of contribution HIGHER NATIONAL CERT!FlCATE FOR TECHNICIANS (IDT)
is indicated on a scale of 4 NATIONAL DIPLOMA FOR TECHNICIANS (NOT) I to.5 where I ::z none and
HIGHER NATIONAL DIPLOMA FOR TECHNICIANS (HNOT) 5 " much GOVERNMENT CERTIFICATE OF COMPETENCY NATIONAL DIPLOMA Place a number (I to 5) NATiONAL HIGHER DIPLOMA below the factor you select.
~ f 5 BACHELORS DEGREE IN ENGINEERING a b c d e
MASTERS DIPLOMA IN TECHNOLOGY 5
6 POST GRADUATE QUALIF!CATION
-123-

Univers
ity of
Cap
e Tow
n
-
CATEGORIES OF MECHANICAL ENGINEERING PERSONNEL
PROFESSIONAL ENGINEER {PR. ENG. )
GRADUATE ENGINEER (IN-TRAINING)
GRADUATE ENGINEER
TECHNOLOGIST
TECHNICIAN
TECHNICIAN (IN-TRAINING)
CATEGORIES
TECHNICIAN
TECHNOLOGIST
GRADUATE ENGINEER
GRADUATE ENGINEER (IN-TRAINING)
PROFESSIONAL ENGINEER
APPENDlX 4
QUESTIONNAIRE
UTILIZATION OF MECHANICAL ENGINEERS
NUMBER OF ADDITIONAL NUMBER INDICATE BY MECHANICAL OF MECHANICAL CIRCLING A NUMBER ENGINEERING ENGINEERING ( I to 5) THE AVAI-PERSONNEL PERSONNEL WHICH LABILITY OF MECHA-IN YOUR YOU COULD EMPLOY NICAL ENG. MANPOWER. EMPLOY IF THEY_WERE _ .. EASILY - - NOT
IMMEDIATELY AVAILABLE AVAILABLE AVAILABLE
I 2 3
I 2 3
I 2 3
I 2 3
I 2 3
I 2 3
CLASSIFICATION OF CATEGORIES
QUALIFICATION
A technician should have technical education above NTC 3 such as the National Diploma (T3) or National
Higher Diploma (T4) in Engineering.
A technologist is distinguished from the technician
4
4
4
4
4
4
in that he can operate in a broader field, has greater depth of knowledge and possesses a technical qualification such as the Master Diploma in Technology. (TS)
Usually a B Sc (Eng)
is in possession of at least a B Sc (Eng) and is registered with South African Council for Professional Engineers as an "Engineer in-training".
Usually in possession of a B Sc (Eng) or higher qualification and is registered with SACPE as a Professional Engineer (Pr. Eng).
-124-
5
5
5
5
5
5

Univers
ity of
Cap
e Tow
n
APPENDIX 5
• ~ Department of Mechanical Engineering University of Cape Town· Private Bag· Rondebosch 7700 ·South Africa
Telephone: (021) 650-3235; Telex: 521439SA Fax: (021) 650-3242
Head of Department: Professor R K Penny
27 May 1988
Dear Sir
The department of Mechanical Engineering of the University of Cape Town is appealing to you for help. we are not asking for funds - all we ask is a few minutes of your time.
It is to your advantage to be a member of a strives towards excellence by ensuring the utilization of manpower resources.
profession which most effective
You can assist us to maintain - and to enhance the status of the Profession - by co-operating in the study into the utilization of mechanical engineering manpower.·
we have enclosed a questionnaire which will not take more fifteen minutes of your time to answer. We are sure that will be willing to make a contribution to the profession completing the questionnaire.
than you by
As an enclosure with this letter you will find a self-addressed stamped envelope for returning the completed questionnaire.
Thank you for the courtesy of your prompt assistance.
very sincerely yours
, . --·: '\ :f :=.-.. :~'2 · _ .,v; -~,'2': ·s ~-:=c1sn""' ':;d ~ac1cl segregcticn unc stri 1 ... -.=s ~,-: r:"'C:nta1r. a str.: ....... ,g trca:t:or -::;f :c:r·- :! s.:~ ........ · .c~ :,,- .... ~ .... ·-.-:.;.<; =--~ · ·
.,. -:···r::: .. -;er,~9r ; ....... '? -::::.rs:1!\ . .ittcn •:::;f .ts 5tudent ::=toCv :n ~"'.e :.eiecticr· 'Jr-d ~rorn0t1or. .,::,t :-5 .:.·-::ff :_::r,; ~ ·: ~~.:~ ·· .;··.:::· ·· ·
-125-

Univers
ity of
Cap
e Tow
n
- ,-:=-= ~ :.nv· ·:.::?\' ':'J ·:..:in S:.!.nue ..• I=·:: :-'_i.: ~u.r- ·= ~·,_ir uat~.uc?.se: ,_: ·. :..1r:'.µ·=E ! './ \t_+·. D2!= I :'·iumoer ·~·( Qd'C.3. ~-.:::icor 1:1s: 767 Aopcndix 6 :·,2,1::.e c.1 r lctsi: 1_tpc1a te l <)/ :2'-.::./~S·
,: l·? ~.:j ::·1ei1j Na.me T\lpe l<Jidth !:1ec In·je;.; 1..;: l 1_~hdrac ter ,,
2 ·.~::: Ch~r :;u: t.•:r N 1..,:1 • .:· Lll2T:\C ter- "' ,, d4 1...:-i-:2rac t.'::?'r !\!
_, t..:i5 Lhar-ac:1:.er- 2 N 6 ~!6 Ct-i.=.r.3.•: t.er 2 N / t.:i7 Lharac ter- 2 N d !..:!8 Ch.~rac t>?r N C~· L:i7' Lharacter N
1 0 i.jlOlA Char.;,cter 2 N l 1 L:d 1)1B Character 2 N 12 1J101C Character N l3 1~ilr)1D Character N 14 '-H<)lEl Char;,cter 2 N .!.5 L:il01E2 Character 2 N 16 lH02A Character 2 N 17 Ll102B Character 2 N 18 1..:!102C Character N 19 1.J102D Character N 20 U l U2E 1 Character 2 N 21 Cll02E2 Character 2 N 22 1J103A Character 2 N 23 Gi 1 o:.a Character 2 N 24 U103C Character N 25 01030 Character N 26 Ll103El Character 2 N 27 Q103E2 Character 2 N :28 Ul04A Character
,, N .:.
29 Q104B Character 2 N 30 CH04C Character 1 N 31 Ql04D Character 1 N 32 Ul04El Character 2 N .,;; . ..;;. Ql041::2 Character 2 N 34 Ql05A Character 2· N 35 Q105B Character 2 N .36 li105C Character N 37 01050 Character N 38 li 105E l Character 2 N ::'..9 Q105E2 Character 2 N 40 Ul06A Character 2 N 41 G1106B Character 2 N 42 1Jt06C Character l N 43 GH06D Character 1 N 44 lH06El Character 2 N 45 Gil06E2 Character 2 N 46 <J107A Character 2 N 47 0107B Character 2 N 48 Q107C Character N 49 Ql07D Character N 50 Q107El Character
,, .:. N
51 Ql07E2 Cha-racter 2 N 52 lll08A Character 2 N 53 0108B Character 2 N 54 Q108C Character N 55 U108D Character N 50 I] l 08£ 1 Character .:. N 57 l~1<)8f:.2 Character 2 N 58 Ll109A Character 2 N 59 Q109B Character 2 N 60 ll109C Character N 61 Ql09D Character N 62 Q109E1 Character 2 N 63 Q109E2 Character 2 N 64 UlOlOA Character 2 N 65 QlOlOB Character 2 N 66 QlOlOC Character N 67 Q1010D Character N 68 1J1010El Character 2 N 69 Ql010E2 Character 2 N 70 CHOl lA Character 2 N 71 01011B Character 2 N 72 0101 lC Character N 73 010110 Character N 74 0101 lEl Character 2 N 75 Ql011E2 Character 2 N 76 Ql012A Character 2 N 77 Ql012B Character 2 N 7i::l Q1012C Character N 79 Ol012D Character N 80 Ul012E1 Character 2 N 81 01012£2 Character 2 N 82 i.H013A Character .:. N 83 Gll013B Character 2 N o4 Q1013C Character N d5 LllOt:!.D Character N 86 i..i101-3E1 Character 2 N 87 LH013E2 Character 2 N 88 Q1014A Character 2 N 89 01014B Character 2 N 90 U1014C Character N 91 Q10140 Character N 92 li1014E1 Character 2 N 93 Ql014E2 Character 2 N ·...;.a. ·:::'fJMl"IENT M'?•TiD ~ ,., '.I
126
Univers
ity of
Cap
e Tow
n
ANALl. PRG*
v~T~HMINE8 THE AVERAGE QUALIFICATION PER JOB ER CATEGORY (Ql) PER SECTOR (Q2).
SET TALK OFF USE OF STOR SFAC(7) TO V STOR 11 TON N=O STOR 1 TO Q2N Q2N:2 STOR 1 TO Q1N Q1N:O STOR 1 TO I I: 0 STOR 111 TO SM SM=O STOR "ABCDEF" TO CHOICE STOR 111. 11 TO CNT CNT:O STOR 111 TO CNTER CNTER=O DO WHILE Q2N<3
Q2N=Q2N+1 DO WHILE Q1N<6
Q1N=G1N+1 SET PRINT ON !' "lHHEQ1:", "",Q1N, 11 lHHEQ2:", "",Q2N, "llifll" SET PRINT OFF N=O DO WHILE N<1l!-
N:N+1 I: 0 V:"Q10"+LTRIM(STR(N))+"E1" DO WHILE I<6
I=I+1 AVERAGE VAL(SUBSTR(&V, 2, 1)) FOR VAL(Q1):(Q1N) .AND.
VAL (Q2) = (Q2N) . AND. SUBSTR ( &V, 1, 1): SUBSTR (CHOICE, I, 1) TO CNT
COUNT FOR VAL(Q1):Q1N .AND. VAL(Q2):Q2N .AND. SUBSTR(&V, 1, 1) :SUBSTR(CHOICE, I, 1) 'I'O CNTER
SET PRINT ON ? N, SUBSTR(CHOICE, I, 1)," SET PRINT OFF CNT=O
", CNT," "I CNTER
END DO END DO
END DO END DO CLOSE DATA
-127-

Univers
ity of
Cap
e Tow
n
ANAL2.PRG*
THIS PROGRAM DETERMINES THE NUMBER OF RESPONDENTS PER JOB FUNCTION (QlO) PER CATEGORY (Ql), AS WELL AS THE SUM OF THE PERCENTAGES UNDER A AND B OF Q10.
SET TALK ON USE OF STOR SPAC(7) TO V STOR 11 TON N=O STOR 1 TO Q2N Q2N=2 STOR 1 TO Q1N CHN=O STOR 1 TO I I= 0 STOR 111 TO SM SM=O STOR "AB" TO CHOICE STOR 111. 11 TO CNT CNT=O STOR 111 TO CNTER CNTER=O DO WHILE Q2N<3
Q2N=Q2N+1 DO WHILE Q1N<6
Q1N=Q1N+1 'SET PRINT ON
? "***G1=", "", Q1N, "***" SET PRINT OFF N=O DO WHILE N<14
N=N+1 I= 0 DO WHILE I<2
I=I+1 V="Q10"+LTRIM(STR(N) )+SUBSTR(CHOICE, I, 1) SUM VAL(&V) FOR VAL(Q1)=Q1N TO SM COUNT FOR VAL(Q1)=Q1N .AND. val(SUBSTR(&V, 1, 1))<>0 TO CNTER SET PRINT ON ? N, SUBSTR(CHOICE, I, 1)," SET PRINT OFF CNT=O
END DO END DO
END DO END DO CLOSE DATA
-128-
",SM," "I CN'l'ER

Univers
ity of
Cap
e Tow
n
APPENDIX VII
Annual Manpower Savings for Professional Engineers
Savings on activity "Preliminary Investigation".
Average per cent of time spent on "preliminary
investigations" is 8 per cent. (Table 16) ~
Average per cent of time spent on "preliminary
investigations" which could be performed by a person
with a lower qualification is 31,2 percent.
(Table 17)
Average hours worked per annum by professional
engineers is 2265,6 hours. (Table 18)
Savings which could be incurred by releasing
professional engineers of tasks below their training
is
8 31,2 = x x 2265,6 = 56,5 hours per Pr Eng
100 100
Total savings for all respondents who are classified
as professional Engineers is 56,5 x 351 = 19831,5
hours.
Divide 19831,5 by 2265,6 to convert to man years =
8,8 man years saved.
129
Recommended