UNIVERSITA' DEGLI STUDI DI PISA DIPARTIMENTO DI ECONOMIA E
MANAGEMENT
Corso di Laurea Magistrale in Strategia,
Management e Controllo
Tesi di Laurea Magistrale
HOW TO COPE WITH A SCARCE RESOURCE:
THE SUSTAINABLE VISION OF THE UK WATER
UTILITIES
Candidato Relatore
Marta Chiarullo Chiar.mo Giulia Romano
Anno Accademico 2012– 2013

1
Table of contents
Introduction ....................................................................................................................... 2
1. Water resources ownership and management: focus on the sustainability ................... 4
1.1 An introduction to the current water issue .......................................................... 5
1.2 Water sustainability management ..................................................................... 34
1.3 Ownership of water utilities .............................................................................. 37
2. The water sector in England and Wales ...................................................................... 43
2.1 A brief historical background ............................................................................ 43
2.2 Privatization of the English and Welsh water utilities ...................................... 47
2.2.1 The positive effects of privatization....................................................... 53
2.2.2 The negative effects of privatization ...................................................... 54
2.3 Characteristics of the English and Welsh water industry today ........................ 61
2.3.1 Competition ........................................................................................... 63
2.3.2 Customers’ bills ..................................................................................... 63
2.3.3 Prices ...................................................................................................... 64
2.3.4 Companies’ characteristics..................................................................... 67
2.4 Availability of water in UK ............................................................................... 78
2.5 Legislation of water sustainability .................................................................... 80
3. The English and Welsh water utilities: an analysis of sustainable practices and
ownership ........................................................................................................................ 85
3.1 The empirical research ...................................................................................... 87
3.1.1 Financial structure .................................................................................. 89
3.1.2 Corporate Governance ........................................................................... 91
3.1.3 Costumers’ bills ................................................................................... 101
3.1.4 Employment ......................................................................................... 109
3.2 The sustainable objective achievements ......................................................... 110
3.2.1 Sustainable solutions ............................................................................ 117
3.2.2 Customers’ satisfaction ........................................................................ 121
3.3 The water utilities in Europe: a comparison with Italy and France ................ 122
3.3.1. The Italian case ................................................................................... 122
3.3.2 France: three biggest private water companies .................................... 129
Conclusions ................................................................................................................... 133
Bibliography ................................................................................................................. 136
Sitography ..................................................................................................................... 139

2
Introduction
The purpose of this dissertation is to analyze how UK water companies face the actual
issue related to the water resource, namely its scarcity. Before arriving to that point I
find necessary to explain the current water status all over the world, from Europe to
Asia and Africa, and then deepen the
discussion to the UK, where, as we will see,
the matter should not be underestimated.
Describing the different laws water
companies have to comply with, nationally
and internationally, we will observe the
difficulties they are asked to handle. In this
regard, we will see how the European Union
faces the problem through the issuing of the
Directive 2000/60/EC and, eventually, how companies comply with it.
In doing so it is necessary to start from the significant privatization occurred in this
sector in 1989, presenting its negative and positive effects, explaining, then, how the
sector is organized nowadays, which are its regulators and how companies perform.
Introducing the regulators appointed with the privatization, we will see how they run the
sector, focusing on their most important tool: the price setting. On this note, I will
discuss the problem related to the establishment of a fair price, meaning the respect of
its characteristic of public good which makes it necessary to be available to everybody,
which tries to encounter the necessity of companies to earn profits, in order to remain
motivated in running the business efficiently, and the necessity of reducing the consume
of water in a context in which it is getting scarcer and scarcer. Besides the price, I will
analyze the trend assumed by customers’ bills during the last years, the different forms
of competition in this sector and finally I will describe companies’ features, including
their latest economic performance and investment policy.
In the third chapter I present the empirical research I have conducted in regard of the ten
water and sewerage companies present in England and Wales, with the final aim of
finding their sustainable solutions in facing the water scarcity. In doing so, I have
analyzed them according to their financial structure, their compliance with the corporate
governance principles, so that I could have found some best practices, their employment
policy and, finally, customers’ bills.
“Water is essential for economic growth, and the water industry has a vital role in the transition to a green economy. The green economy needs a sustainable, resilient, affordable water supply.” Defra, Water for Life, December 2011, page 7

3
At the end of my dissertation I wanted to put the English tariff system into a European
context, comparing it with the Italian and French ones, in order to find similarities and
differences. Furthermore, considering the biggest private water companies, both Italian
and French, I have taken into account their approach to the water issue and found some
best practices in this regard.

4
1. Water resources ownership and management: focus on the sustainability
When we talk about water resource we mean every kind of water at human disposal
which can be abundant and available or scarce and unavailable. Generally, it is a
renewable resource generated from the natural hydrological cycle of the coupled
atmospheric oceanic terrestrial system, hence, its use and withdrawal don’t affect its
availability. However, not every water resource is renewable and some renewable
resource can be made non-renewable by human activity.
The majority of human uses need fresh water which is natural water coming from the
surface as ice caps, bogs, ponds, lakes, rivers or from the underground as groundwater
in aquifers and underground streams. Although surface water is used more to supply
drinking water and to irrigate crops, groundwater is vital since it does not help only to
keep rivers and lakes full, but also to provide water for people living in places where
visible water is scarce, e.g. areas such as the desert towns of the western United States.
Fresh water is usually called “sweet water” because of the absence of salt, in fact, it
excludes seawater and brackish water. It can also be obtained by desalination: an
artificial process by which saline water is converted to fresh water; it consists in
removing salt and other amount of minerals from saline water. This kind of process is
usually expensive compared to alternative sources of water (rivers, groundwater, water
recycling and water conservation), it might cost 15 times more than regular water, plus
it is environmentally damaging. That’s why it is used only for high-valued, as household
and industrial, uses in arid areas. Fresh water source is renewable and variable but
finite, it can only be replenished through the process of the water cycle.
Our planet consists of 70% of water but only 2.5% of it is freshwater, the rest is saline
water. Of those 2.5% only 1% is easily accessible; basically only 0.007% of the planet’s
water is usable (Source National Geographic). Many factors have led to this situation
where water availability became a global issue.
Years ago when humans’ habits were different and the population wasn’t growing so
fast this topic wasn’t concerning the whole world. Nowadays the Earth is populated by
about 6.8 billion people (Source National Geographic) and it is expected to grow of 2-3
billion people over the next 40 years (Source unwater.org). This phenomenon has
implications on the water availability as more water is needed for agricultural, industrial
and household uses; for example a growth of food demand implies an increase of

5
agricultural outputs which means a raise of water. Regarding different habits,
differences can be found in typical human diets. It became more common a meat and
dairy diet then a starches consumption which has, again, consequences on the amount of
water needed to produce food. Indeed, producing a kg of rice requires about 3,500 L of
water, 1 kg of beef requires 15,000 L and a cup of coffee 140 L.1
These two factors, added to many others, have decreased the amount of water at human
disposal in such a way that it’s common now talk about water scarcity.
In order to understand the importance of a good water management by companies, in
the following paragraph I will explain the problems related to the water and the related
legislation.
1.1 An introduction to the current water issue
Water scarcity is defined as the lack of sufficient available water resources to meet
population’s demand of water usage. Water scarcity, water stress, water shortage and
water crisis are all synonyms. Usually, water stress is mentioned when there are many
difficulties in satisfying the water demand during a certain period or when the poor
quality restricts its use2, while water shortage term is used when the cause is the climate
change, for example droughts and floods, and water crisis when the potable water isn't
enough for the existing population.
Water scarcity is a result of physical water scarcity and economic water scarcity. The
first one is due to inadequate natural resources to supply a region’s demand; it happens
when the demand outstrips the lands’ ability to provide the needed water, that’s what,
for instance, occurs to arid regions. Yet, in many regions this physical scarcity is a man-
made condition and the Colorado River Basin is the proof of it. It is one of the most
important river in the U.S., providing water for 30 million people, which is strongly
tapped for agriculture, industry and municipal uses along its course so that it barely
reaches its delta and the gulf of California. Here people continue to propose dams,
reservoirs, pipelines and energy projects with the aim to obtain water from an
endangered river instead of focusing on water conservation, efficiency and a rapid shift
away from dirty energy projects.3
1 http://www.unwater.org/water-cooperation-2013/water-cooperation/facts-and-figures/en/
2 http://www.eea.europa.eu/themes/water/wise-help-centre/glossary-definitions/water-stress 3 Wockner G. (2013), “Is the Colorado river damned? Oped”, in http://www.livescience.com/28866-most-endangered-

6
Instead, the economic water scarcity is due to an absence of investment in water or
insufficient human capacity to satisfy the demand of water in certain areas where the
population doesn’t have the monetary means or the necessary skills to manage the water
demand. Economic water scarcity usually occurs when the region is characterized by a
lack of infrastructures and by the presence of political and ethnic conflicts causing an
unequal distribution of water resources. This is a typical situation occurring in Africa
particularly in sub-Saharan Africa, but we’ll see it later.
Figure 1: Water scarcity all over the world
Many indicators are used to establish the water stress level and one of them is the
“Falkenmark Indicator”. It is defined as the fraction of the total annual runoff available
for human use. Four different categories related to the water conditions in an area were
defined: no stress, stress, scarcity and absolute scarcity (Table1). The index thresholds
1,700m3 and 1000m
3 per capita per year are used as the thresholds between water
stressed and scarce areas, respectively (Falkenmark 1989).
Source: University of Arkansas, The Sustainability Consortium4
river.html 4 Brown A., Martlock M. D.(2011), “A review of water scarcity indices and methodologies” in
http://www.sustainabilityconsortium.org/wp-
content/themes/sustainability/assets/pdf/whitepapers/2011_Brown_Matlock_Water-Availability-Assessment-Indices-

7
The figure 2 shows the European and Asian regions affected by water stress according
to the Falkenmark Indicator.
Figure 2: Annual water availability per person (Falkenmark Indicator)
Source: European Environment Agency
The Falkenmark indicator is the most common because of its simplicity and because the
data needed is readily available and provides results that are easy to understand,
however it presents some limitations. For example it measures water scarcity at a
country level instead of deepening the differences of the water availability within the
country; it doesn’t count that different countries use different amounts of water
depending also on the culture, the lifestyle, the climate etc.; it doesn’t take into account
that some water resources might be inaccessible because are stored deep underground or
polluted, and finally it doesn't consider that some freshwater can be obtained for
example through the desalination process.
A more accurate indicator used is the Water Exploitation Index (WEI) which measures
the pressure or the stress exerted on freshwater resources by the demand. It is calculated
dividing the average demand for freshwater and the long-term average freshwater
resources and it can be applied in different scales, for instance national or river basin.
The long-term average freshwater resource is derived from the long-term average
precipitation minus the long-term average evapotranspiration plus the long-term average
inflow from neighboring countries. Although no legal thresholds are defined, many
and-Methodologies-Lit-Review.pdf

8
authors agree that a WEI above 20% implies that a water resource is under stress, and
values above 40% indicate severe water stress and clearly unsustainable use of the water
resource5.
The main causes of water scarcity are deepened below and can be listed in the climate
change, the pollution, the overuse of the water and the regional conflicts which,
actually, represent more a consequence than a cause.
The climate change is a change in the statistical properties of the climate system when
considered over long periods of time. In an environmental policy this term has become a
synonymous of global warming which refers to surface temperatures increases. Instead,
climate change includes global warming and everything else that increasing greenhouse
levels will affect.
A climate change has several consequences which I try to explain hereinafter. It impacts
all areas of the water industry: the quality and availability of water resources, the water
infrastructure and the further treatments necessary to follow high quality standards.
Consequences of the climate change are a reduction of stream and river flow, a
contraction of lakes and ponds and dissolution of glaciers. Starting with the latter issue,
rising temperatures are melting glacial ice which, by the way, is an important freshwater
resource in danger of disappearing. Once these glaciers have melted away there’s no
way to restore them, it means that in those particular areas depending on them it is
necessary to find another kind of source. Lakes and rivers are then the primary sources
of freshwater; if they disappear, people are forced to resort to groundwater. Lower river
flows reduce the dilution of wastewater effluent. This implies the need of additional
treatments to meet higher standards, which can be reached only by using energy-
intensive processes, causing greenhouse gas emissions.
Moreover a warmer environment implies that precipitation occurs as rain instead of
snow which leads to water shortages. When snow and ice collect on mountaintops,
water is released slowly into reservoirs as it melts during spring and summer. Instead,
when rain falls reservoirs get full quickly in the winter which can also result in excess
water runoff that can’t be restored; plus since it flows faster than melting snow it is
unlikely to have higher levels of soil moisture and groundwater recharge. Accordingly,
5 Marcuello C., Lallana C., Thyssen N. (2003), “Indicator Fact Sheet”, in http://www.eea.europa.eu/data-and-

9
those areas where freshwater is obtained by snowmelt are more likely to experience
water shortages than other areas, having low water supplies by the end of the summer.
Another effect of warmer temperatures is the increase of the rate of evaporation of water
into the atmosphere which influences the latter capacity to keep the water that could
lead, on one hand to have some dry areas and on the other hand to have some areas
where precipitation is so abundant to provoke dangerous storms. For example in the
United States in the past 50 years the amount of rain falling during the most intense 1%
of storms increased by almost 20%.6 Heavy precipitation raises the sea level which
provokes a contamination by saline water of the freshwater close to the coasts, so that it
is necessary to find other sources of fresh water or to increase the operations of
desalination, which, as said before, are quite expensive. In addition, rising sea levels can
lead to mass migration and increase water conflicts. For example it represents what it
might happen in Bangladesh (area highly vulnerable to natural disasters such as floods,
tornadoes and tidal bores) where a one-meter rise of sea levels over the next 100 years
would lead it to lose 20% of its land area, causing 15 million of people to migrate.
England and Wales might be affected by rising sea levels as well, causing issues to
homes and businesses, with implications, also, to water companies.
Furthermore, excessive rainfall can damage water infrastructure; swollen rivers may
carry discharge materials into water supplies making them unusable or in need of water
treatment. Eventually the quality of water would be deteriorated. Most of the current
treatment plants and distribution systems weren't built to take climate change into
account, hence, they’re not able to face a weather aggravation as well as an hypothetical
sea level rise due to heavy precipitation. Therefore, this type of infrastructure can’t, for
example, fully capture a larger volume of water during abundant precipitation, and then
use it to satisfy water demand during times of drought. In addition, warmer water
temperatures make algal and bacterial blooms growing as much as to further
contaminate water supplies.
Besides, as climate changes lead to greater soil movement because of the wetting and
drying cycles, it is likely to assist to some pipe systems cracks regarding both drinking
water supply and sewerage.
Climate change has effects also on the amount of water necessary for agriculture,
maps/indicators/water-exploitation-index/water-exploitation-index
6 Karl T.R., Melillo J.M., Peterson T.C. (2009), Global Climate Change Impacts in the United States. New York, NY:
Cambridge University Press.

10
breeding and industry. Higher temperatures, of atmosphere and water, and long and
severe droughts cause an increase of the amount of water needed for irrigation, for the
hydration of farms, animals and for the industrial cooling.
Water pollution regards basically any chemical, physical or biological change in the
quality of water that has dangerous effects on every organism that uses it. There are two
different types of sources depending on their number: point source or non-source point
of pollution. In the first situation there’s a single source (e.g. an oil spill), in the second
one there are many sources affecting a waterway, for example when fertilizers from a
field are carried into a stream by surface runoff. Some water sources of pollution are
listed below.7
a. Sewage and wastewater.
This water pollution comes from domestic and industrial processes. The first one refers
to wastewater containing for example feces, urine and laundry waste and is more
dangerous in developing countries where not every inhabitant has access to sanitary
conditions and clean water. Pollutants from industrial processes are extremely
dangerous not only for water but also in general for the environment, some examples
are asbestos, lead, mercury, nitrates, phosphates, oils, petrochemicals etc.
b. Marine and river dumping
It refers to every kind of litter thrown into the sea water or into the river, like plastic,
newspapers, glass etc. Rubbish dumps create a strong chemical cocktail called leachate
which can be deadly to fish, small water creatures and plants and of course which can
pollute our drinking water.
c. Radioactive substances
These kinds of substances are produced from industrial, medical and scientific processes
that use radioactive material. In the Northern Europe there are some nuclear-fuel
reprocessing plants which represent the biggest sources of man-made nuclear waste in
the surrounding ocean. The mining and refining of uranium and thorium cause marine
nuclear waste as well.
d. Oil Pollution
It is caused by losses from storage facilities, spillages during delivery and deliberate
disposal of waste oil to drainage systems. It makes, obviously, our drinking water unsafe
7 http://www.water-pollution.org.uk/types.html

11
to drink and it represents a dangerous threat for the wildlife and the ecosystem.
e. Underground storage leakages
An underground storage tank is a tank or a piping network that has at least 10 percent of
its volume underground. The substances they store, such as petroleum, are extremely
dangerous for the environment and many of them are made of steel which over the time,
corrodes and causes leakages affecting surrounding soil and groundwater.
f. Air pollution
It occurs when water vapor absorbs all the pollutants in the air and become more acidic
so that it disseminates this acid rain while pouring and contaminates seas, rivers and
lakes.
Groundwater depletion is caused when a high amount of water is frequently pumped.
This can generate several negative effects such as:
− the lowering of the groundwater table which makes the wells no longer able to
reach groundwater. When the groundwater table lowers, it is necessary to pump the
water farther to reach the surface which means to consume more energy and to bear
higher costs. Plus, since groundwater and surface water are connected, a
groundwater lowering means a decrease of water in lakes, rivers and streams.
− The dwindling of the quality of water when an excessive amount of water is
withdrawn in coastal areas, which can lead to a contamination of the water supply
by saltwater.
− Environmental damages such as a land subsidence when, for example, the soil
collapses.
Often wasteful overuse in one area deprives users in other areas which has the
consequences of falls in agricultural production and loss of jobs. In fact, where the
rivers no longer flow, water for irrigation becomes unavailable, farmers go out of
business and local production fails.
Finally, even the human activities can cause water scarcity, for example through the
building of dams. There are several dams around the world and the threat is due to the
fact that they alter the natural flow of the river, often improving the water and energy
security for some, at the expense of others.
In 2011, 768 million people were still without access to improved sources of drinking

12
water8. This situation, sometimes, leads to water conflicts because the demand for water
resource, and especially potable water, is way higher than the amount of water actually
available.
Water supply will always be under politics control and conflicts for many reasons:
− its importance is remarkably high, not only for a household use but also for an
economic development,
− it is getting scarcer,
− it could be shared by several countries because of the presence of transboundary
freshwater reserves.
The latter point is really important. Indeed, 148 countries include territory within one or
more transboundary river basins, 39 countries have more than 90% of their territory
within one or more transboundary river basins, and 21 lie entirely within one or more of
these watersheds (source: UNESCO). 60% of the world’s 276 international river basins
lack any type of cooperative management (source: WWDR 2012). Therefore, until they
don’t stipulate transboundary agreements, there will always be disputes.
Basically, there are two types of water conflicts. One between two or more neighboring
countries that share a transboundary water source, the other one within a country
between two or more parties, for example between agricultural land and urban water use
but also rich farmers competing with poorer ones.
Disputes with water topic regard the whole world but the regions where those are more
likely to occur are basically the Middle East and the Africa; for two main reasons: the
water scarcity and the growth of the population which make the competition between
users more aggressive. As a result people from regions where water is not enough tend
to migrate to other regions where water is more abundant with the consequence that less
water is available for the existing people in the migration area.
That’s what happened, for example, in Tanzania. The Panzani River Basin, which has a
population of 3.4 million people, is already facing a dwindling of water due to the
climate change that can’t bear a migration of people with cattle seeking for water,
coming from the northern area of Moshi and Arusha. This phenomenon besides
depriving the Panzani’s area of water causes land damages. Although the government
tried to control this influx, there is a lack of policy coordination between these regions
8 http://www.unwater.org/statistics_san.html

13
that nullifies each effort.9
Besides this particular kind of conflicts we can find many others, for example the
Pacific Institute categorizes them into six different groups, listed below.
− Control of water resources (state and non-state actors): where water supplies or
access to water is at the root of tensions (which actually might be the category the
example mentioned before belongs to).
− Military tool (state actors): where water resource, or water systems themselves, are
used by a nation or state as a weapon during a military action.
− Political tool (state and non-state actors): water resources, or water systems
themselves, used by a nation, state or non-state actor for a political goal.
− Terrorism (non-state actors): water resource as a target or tool of violence or
coercion by non-state actors.
− Military target (state actors): water resource systems as targets of military actions
by nations or states.
− Development disputes (state and non-state actors): water resource is crucial for the
economic and social development.10
It’s easy to understand that water conflicts are likely to occur in developing countries
where water availability is scarce and the institutional environment is weak as well as
where wars are the most common way to solve problems and where agriculture is the
main source of the economic development.
345 million of people in Africa have no water access11
.
Compared to Northern Africa, the South is more likely to suffer from water scarcity for
the reasons mentioned before, considering, also, that is the poorest and most
undeveloped region of the world, therefore, it doesn’t have the means by which tackle
this problem.
Although rainwater in Sub-Saharan Africa is abundant, it is seasonal and irregularly
distributed. It is an area susceptible to floods and droughts which destroy economic
livelihood and farmers food sources and has a heavy negative impact on the GDP
(Gross Domestic Product) growth in one-third of the countries.
9 http://www.ipsnews.net/2013/10/conflicts-over-water-rise-in-tanzania/ 10 http://www2.worldwater.org/chronology.html 11 http://water.org/water-crisis/water-facts/water/

14
The population’s growth is another threat. Not only people are expected to double to
around 400 million by 202012
, but also the migration phenomenon, where people from
rural area move to urban area, is spreading causing a sort of pressure in the city which
needs to meet an increasing demand, raising conflicts.
African access to water is different from region to region, i.e. from Northern Africa to
Sub-Saharan Africa and from social class to social class, hence between urban and rural
areas and between rich and poor people. In 2010, 96% of the urban population used an
improved drinking water source in spite of the 81% of the rural population and over
60% of the richest quintile in urban areas has piped water in premises contrary to rural
areas where piped-in water doesn’t exist in the poorest 40% of households13
.
Some figures:
it is the world’s second driest country after Australia;
about 66% of Africa is arid or semi-arid and more than 300 of the 800 million
people in Sub-Saharan Africa live in a water scarce environment;
115 people in Africa die every hour from diseases linked to poor sanitation, poor
hygiene and contaminated water;
35% of Water and Sanitation aid commitment on MDG goes to Africa with Sub-
Saharan having 27% of the financial allocation;
especially in Sub-Saharan Africa more than a quarter of the population spends more
than half an hour per round trip to collect water;
by mid-2011 Africa’s population, excluding the northern-most states, was around
838 million and its average natural rate of increase was 2.6% per year while the
world’s average was 1.2%. Now it is estimated that the population will grow to
1.245 million by 2025 and 2.069 million by 2050.14
Situation in Asia and Oceania is not that different: 396 million people have no water
access, of which 200 million in Southeast, East Asia and Oceania15
.
The Asia-Pacific area is growing fast, in regard of the population but also the economy,
the industry and the agriculture with all the consequences, already explained, that this
implies.
Asian access to water is divided in two groups. As reported by the UN, analyzing the
12 http://www.un.org/waterforlifedecade/africa.shtml 13 http://www.un.org/waterforlifedecade/africa.shtml 14 http://www.un.org/waterforlifedecade/africa.shtml 15 http://water.org/water-crisis/water-facts/water/

15
different uses of water sources from 1990 to 2010 is possible to notice that in certain
regions in Asia (Oceania, Southern and South-East Asia) the use of piped water to a
dwelling, plot or yard is low (30% or less). In fact, 65% of the population in Southern
Asia is using other improved sources rather than piped water on premises. In Southern
and South-Eastern Asia access to an improved water source increased from 71% to 89%
and from 72% to 90%, respectively, during this period.
On the contrary, in Eastern and Western Asia the population is using piped water on
premises. Moreover Eastern Asia is the region which increased dramatically the use of
improved drinking water sources, it reached a 91% of coverage in 2010 from a 68% in
1990.16
The most common climatic phenomena are tropical cyclones, typhoons, and
earthquakes which can really sweep away years of development efforts. Pakistan, for
example, was inundated in the summer 2010 and more than 20 million people close to
the River Indus were affected, plus, of course, damages on agriculture. 17
In the whole Asia, the Middle East is the region considered more likely to experience
water stress periods. This area’s wealth comes from the large oil reserves. Yet, this is not
enough to make living easy seen the climate and the environmental adversities
occurring, such as desertification. Desertification is caused both for an increase of the
temperatures and for an unsustainable agriculture practices, which uses 85% of water, in
an already water stressed area, and for an overgrazing. Countries more susceptible to
water shortages are Syria, Jordan, Iraq and Iran.18
Some figures:
The Asia-Pacific is home to 60% of the world’s population but it has only 36% of its
water resources. Per capita water availability is the lowest in the world.
Between 2000 and 2009, an average of 20.451 people was killed by water-related
disaster excluding victims of tsunamis.19
Given the importance of this resource a complex framework of law is necessary. We can
say “complex” since it is difficult to establish any rules for something that is not
constant, as the amount of water available depends, for example, on the rainfall had
during the year, on the climate etc., but also because, as said before, most of the rivers
16 http://www.un.org/waterforlifedecade/asia.shtml 17 http://www.un.org/waterforlifedecade/asia.shtml 18 http://thewaterproject.org/water-in-crisis-middle-east.php

16
cross different countries.
At an international level the UNESCO (the United Nations Educational, Scientific and
Cultural Organization) took care of the water issue implementing the “International
Hydrological Programme (IHP)”. This program was drawn up in 1975 and since then it
evolved from an internationally coordinated hydrological research programme to a
holistic programme which aim is to facilitate education and capacity building, and
enhance water resources management and governance following multidisciplinary and
environmentally approaches. It is tailored to the needs of the 195 Member States and
consists in six-year phases, which can be modified according to the world’s changes.
This project is built on three tracks:
Hydrological science for policy relevant advice;
Education and capacity building responding to the growing needs of sustainable
development;
Water resources assessment and management to achieve water sustainability.
The eleven IHP programs covering projects and activities used to develop and
implement the IHP themes are briefly explained below.
− FRIEND (Flow Regimes from International Experimental and Network Data): it’s
an international program that sets up regional networks for analyzing hydrological
data. Its aim is to understand the hydrological evolution through the mutual
exchange, between the States, of data, knowledge and techniques at the regional
level in such a way to improve methods applicable in water management. The data
mentioned here regard low flows, floods, variability of regimes, rainfall/runoff
modeling, processes of stream flow generation, sediment transport, snow and
glacier melt, climate change and variability and its uncertainties, and land-use
impacts.
− GRAPHIC (Groundwater Resources Assessment under the Pressures of Humanity
and Climate Change): its aim is to better understand how groundwater interacts
within the global water cycle and how it reacts to the human pressure and to the
climate change. Using case studies, working groups, scientific research and
communication it provides a range of information useful to better manage the water
resource.
19 http://www.un.org/waterforlifedecade/asia.shtml

17
− G-WADI (Global Network on Water and Development Information on Arid Lands):
it’s a program established particularly for the improvement of the arid and semi-arid
water management through a network of national and international cooperation.
− HELP (Hydrology for the Environment, Life and Policy): it’s a program
establishing a link between the hydrology and the needs of society; means water
and climate, water and food, water quality and human health, water and the
environment and water and conflicts. This, respecting the sustainable and the
appropriate use of water in such a way to deliver social, environment and economic
benefits to stakeholder.
− IFI (International Flood Initiative): it’s an initiative aimed to the remedy to water
disasters such as floods. On this note, for example, IFI promotes an integrated
approach to flood management able to maximize the benefits of floods and
minimize the negative effects (e.g. the damages to the agriculture). In order to
achieve this aim, the initiative focuses on research, training, information
networking, promoting good governance and providing technical assistance.
− ISARM (Internationally Shared Aquifers Resources Management programme): its
aim is to fill the gap represented by the lack in the development, management and
protection of shared aquifers by creating wise practices and guidance tools.
− ISI (International Sediment Initiative): seen the negative effects of sedimentation,
such as the pollution of water bodies by sediment-borne contaminants, this
initiative aims to assess these effects and create, then, a plan by which remediate
and conserve surface waters.
− JIIHP (Joint International Isotope in Hydrology Programme): its aim is to integrate
isotopes in hydrological practices developing tools, using isotopes techniques in
water management, incorporating isotope hydrology in university curricula and
integrating isotopic data in hydrological databases.
− PCCP (From Potential Conflict to Cooperation Potential): it’s a program that has its
purpose in solving water transboundary conflicts between countries in a sort of
peaceful way, trying to increase the opportunities for cooperation and development.
− UWMP (Urban Water Management Programme): it helps countries to develop
strategies and policies for sustainable urban water management, also considering a
scientific approach. Plus, it aims to find new approaches to improve slums, focusing
on integrated urban water services.
− WHYMAP (World-wide Hydrogeological Mapping and Assessment Programme):

18
it’s a program which purpose is to map, model and quantify the amount of the
Earth’s water available, particularly groundwater in order to manage, in a
sustainable way, this resource.
The current phase (IHP - VIII) is titled “Water security: Responses to local, regional,
and global challenges”, lasts from 2014 to 2021 and follows the Millennium
Development Goals explained afterwards.
Water security refers to the capacity of the population to benefit from an adequate
quantity and acceptable quality of water in such a manner to sustain human and
ecosystem health. The main topics of this phase, built on previous IHP phases, are a
better understanding and a developing of innovative tools to adapt the changing water
availability through a different human behavior, cultural beliefs and attitudes to water,
and socio-economic research. It focuses on six themes:
1. Water-related disaster and hydrological change;
2. Groundwater in a changing environment;
3. Addressing water scarcity and quality;
4. Water and human settlements of the future;
5. Eco-hydrology, engineering harmony for a sustainable world;
6. Water education, key for water security.
Naturally, these themes need to be linked and tackled together by a surface and
groundwater management based on holistic and environmental, social and cultural
traditions and approaches; a prevention and a solution of potential international conflicts
regarding transboundary waters by an integrated and consistent management; an
evaluation of the impact of global changes on resources availability and quality and
population vulnerability; a formulation of a water governance policy framework based
on multilevel and transectorial approaches contemplating a water stakeholders and
general public involvement and, finally, a reinforcement of the efforts in water
education training, capacity building and hydrological research.
One of the biggest international environmental agreements regarding the transboundary
waters entered into force on 6th October 1996: the “Convention on the Protection and
Use of Transboundary Watercourses and International Lakes” also called the Water
Convention. It has been drawn up by the UNECE (United Nations Economic
Commission for Europe) and has been amended in 2003 to let countries outside the

19
UNECE region be part of it, becoming, then, a global legal framework for
transboundary cooperation. This amendment entered into force in August 2013 and has
been ratified by 39 parties, 38 States and the European Union. In particular, it has been
signed but not ratified by the United Kingdom. Its aim is to reinforce national measures
for the protection and ecologically sound management of transboundary surface waters
and groundwaters, contributing to achieve the Millennium Development Goals.
According to this Convention and to the art.2 comma 2, the States Parties shall take all
the appropriate measures:
− to prevent, control and reduce pollution of waters causing or likely to cause
transboundary impact;
− to ensure that transboundary waters are used with the aim of ecologically sound and
rational water management, conservation of water resources and environmental
protection;
− to ensure that transboundary waters are used in a reasonable and equitable way,
taking into particular account their transboundary character, in the case of activities
which cause or are likely to cause transboundary impact;
− to ensure conservation and, where necessary, restoration of ecosystems.
This Convention is based on three principles which have to guide the Parties in taking
those measures:
the precautionary principle, meaning that the potential transboundary impact should
be avoided;
the polluter-pays principle, i.e. the costs generated by the prevention, the control
and the reduction mentioned before need to be borne by the polluter; whoever
causes damages has to remedy and bear resulting costs;
managing water in such a way to ensure to future generations they will have the
opportunities to satisfy their needs with regard to waters.
Furthermore, this Convention fosters the State Parties to establish bilateral or
multilateral agreements to develop harmonized policies, programs and strategies
regarding transboundary waters. Plus, according to the art.2 comma 8, it remains
possible for the Parties to adopt more stringent measures than those set down by the
Convention.
The Convention consists in two protocols: the protocol on Water and Health and the

20
protocol on Civil Liability. We are interested in the first one which has been negotiated
in 1999 and concerns the water related diseases in the UNECE region, where one person
out of seven doesn’t have access to safe drinking water and adequate sanitation. Indeed,
the main aims of this Protocol are to prevent, control and reduce water-related disease;
ensure adequate supplies of safe drinking water meaning also protecting it from
pollution; ensure adequate sanitation in order to safeguard human health and the
environment and establish effective systems for monitoring and responding to outbreaks
or incidents of water-related disease.
Its implementation contemplates two core provisions. One of them is the setting targets:
national and local targets plus the dates by which the States will achieve these targets.
These goals should be related to the quality of drinking water and the quality of
discharges, as well as to the performance of water supply and waste-water treatment.
Then, a realistic plan for improvements needs to be elaborated by each State Party. The
other one is the surveillance: the Parties agreed to establish and maintain comprehensive
national and local surveillance and early warning systems to prevent and respond to
water-related disease, along with contingency and outbreak response plans.
In 2002 the United Nations created the “Millennium Project” which set eight targets the
Member States have to achieve by 2015. These goals regard many topics: poverty,
hunger and disease affecting people from all over the world. The topic we are interested
in is represented by the goal number 7: ensure environmental sustainability. It
establishes that by 2015 the Member States shall halve the proportion of people without
sustainable access to safe drinking water and basic sanitation. The indicator used in this
case, is the proportion of population with sustainable access to an improved water
source, urban and rural (UNICEF - WHO). As reported in the “Blueprint”, the world has
met this MDG (Millennium Development Goals) target (safe drinking water access) five
years ahead of schedule, even though 11% of the global population (783 million people)
has still no access to safe drinking water and following this trend 605 million of people
will still lack coverage in 2015. Indeed Sub-Saharan Africa still suffers for unhealthy
drinking water, they represent over the 40% of all people without improved drinking
water20
. North Africa has 92% coverage and will meet its 94% target before 2015,
instead South Africa is far from reach its goal since it has 61% coverage and right now
20
United Nations (2012), “The millennium development goals report” in
http://www.un.org/millenniumgoals/pdf/MDG%20Report%202012.pdf

21
it cannot reach the 75% target set for the region21
.
Plus, concerning the achievement of the MDG target for sanitation access,
unfortunately, countries are still far from meeting this goal since it is estimated that
currently 2.5 billion people lack improved sanitation22
.
The European region has always been considered an area where water resources are
adequate; however, water scarcity and drought are increasingly occurring in the
European Union since 1975. Between 1976 and 2006, the number of people and areas
hit by drought rose by almost 20%, and the yearly average cost has quadrupled.
In 2003 one of the worst drought occurred in one-third of EU territory and over 100
million people were affected, plus another one in 2007, when at least 11% of Europe’s
population and 17% of its territory had been stricken by water scarcity. The damages
caused by those droughts produced expenditure over the past thirty years of EUR 100
billion23
. Recently, in 2011 and 2012, the whole Europe experienced other droughts
especially in 2011 when precipitations decreased by 40% compared to standards. In
these years water resource availability considerably diminished during the spring time
and most of the EU regions adopted water rationing measures.24
A forecast for 2030
made by a modeled localization shows that the number of river basins affected by water
scarcity might increase up to 50%.25
Relying on the WEI indicator, explained before, Cyprus, Bulgaria, Spain, Italy and
Malta are using 20% or more of their long-term supplies every year. Furthermore,
Cyprus, which has been experiencing severe droughts, consumed much more than 40%
of its renewable supplies.
The following figure shows a comparison between the 1990 and the latest year which
was 1998-2007 of the European countries.
21 http://www.un.org/waterforlifedecade/africa.shtml 22 United Nations (2012), “The millennium development goals report” in
http://www.un.org/millenniumgoals/pdf/MDG%20Report%202012.pdf 23 http://ec.europa.eu/environment/water/quantity/scarcity_en.htm 24 “Communication from the commission to the European parliament, the council, the European economic and social
committee and the committee of the region” Report on the review of EU policy on water scarcity and drought {SWD
(2012) 380 final}

22
Figure 3: Total abstraction per year/long term renewable resource
Source: European Environment Agency 2010
The distribution of water in this area is not regular, and compared to the North, the
South Europe is more likely to experience drought periods; this is worsened by the
human activity for instance by tourism, which, increases the water demand and, in a
country like Cyprus, where water scarcity is already occurring, might provoke
desertification.
It is estimated that in the future Europe will be experiencing water shortages for the
reasons already explained, i.e. the increasing demand (not only by the public but also by
industry and agriculture), the climate change and another cause, not mentioned yet,
which is the water available wasting: it is estimated that 20-40% of Europe’s available
water is being wasted because of leakages in the supply system, no water saving
technologies installed, too much unnecessary irrigation, dripping taps etc. We’ll see in
the third chapter how the English and Welsh companies are remedying to this.
Several solutions to water scarcity can be found, some of them are more feasible than
others.
Since sometimes water scarcity is occurring just for a short period, a remedy could be to
keep more stocks i.e. more reservoirs. It presents advantages and disadvantages. First of
all this practice needs the permission by the authorities in charge which can be tough to
obtain since the building of reservoirs can damage the environment and it is risky
because future is uncertain so we don’t know if it will be useful years later as well;
imagine climate changes again and these reservoirs are no longer necessary, it would
25 Modeling made by Clim. Wat. Adapt. project

23
have been just an expense of a lot of money and time, since it is a costly and long
practice.
Another diffused practice is desalination. I have already described its operation so I’ll
just linger on the negative aspects which are not limited on the high costs but also
include the high carbon impact as it is a “power hungry” practice, the damage inflicted
to the marine life and the problem created by the salt extracted: what to do with that.
Purify waste water. Waste water comes from dirty dishes, baths and toilets so that the
big challenge is to convert skeptical people to drink this kind of water even though is
purified so perfectly drinkable. Moreover treating dirt water is quite costly although it is
a practice already working, hence, the new cost would be to purify water from rivers to
reservoirs and other storage areas.
Since public is the most water customer, persuading it to use less water would be a great
solution especially in England, where the amount of water used is quite high. We’ll see
enterprises’ solutions in the third chapter.
Finally, since more water is available in the Northern Europe, building a cross-country
pipeline that connects water from the North to the South would be another solution even
though it’s easily understandable which kind of issues this could generate, conflicts
(also within the population), high costs etc.
Protecting water resources is one of the most important duties of the European Union.
Its water policy regarding scarcity and droughts is based on the “water hierarchy”
principle, meaning that in cases of additional water supply, infrastructures such as water
transfers and desalination plants should be considered only after all demand-side
measures, like water saving, water efficiency improvements and water pricing, have
been ceased.
European legislation usually takes form of a directive. A directive is a legislation act
that requires member state to achieve a particular outcome without dictating the means
of reaching that result. Thus, each country has the possibility to establish its better way
of implementation, considering its own features including its legal systems and existing
laws. Directives are legally binding; hence, the States are in breach if the Directive is
not fully and correctly implemented within the time limit required by it.
The first directives were drawn up in 1975 and 1980: the “Surface Water Directive” and
the “Drinking Water Directive”. Those directives were focused mainly on water quality

24
standards, in fact they set the minimum quality requirements needed to be met by
surface fresh water in order to protect them and guarantee an adequate quality level for
drinking water.
In 1976 the EU compiled the “Bathing Water Directive” aimed to improve the quality of
bathing waters. This Directive has been replaced, then, by the “new” Bathing Water
Directive 2006/7/EC, which purpose, integrating the Directive 2000/60/CE, is to
preserve, protect and improve the quality of the environment and the human health. It
applies to surface waters that can be used for bathing except for swimming pools and
spa pools, confined waters subject to treatment or used for therapeutic purposes and
confined waters artificially separated from surface water and groundwater. Member
States shall monitor and assess the bathing water every year following two parameters
(intestinal enterococci and escherichia coli); naturally the Member can consider also
other parameters such as cyanobacteria or microalgae. Then, waters have to be
classified according their level of quality which can be poor, sufficient, good or
excellent. All the Member States shall reach the sufficient level by the end of 2015 and
in case of poor level they should take some management measures. One peculiarity of
this directive is the importance given to the information the Member States have to
provide to the public. First of all they should prepare a description of bathing waters and
the potential impact of threats to water quality, then it is established in the directive that
citizens have the right to be informed about the quality of water during the bathing
season, especially for notices banning or advising against bathing.
Later in 1991, Europe faced another wave of directives focused, besides quality
standards, on controlling emission levels to achieve established standards. These
directives were: the “Urban Waste Water Management Directive” which concerned the
collection, treatment and discharge of urban wastewater in such a way to protect the
water environment from being damaged by that; “the Nitrates Directive” aimed to
prevent nitrates from agricultural sources polluting ground and surface waters and to
promote the use of good farming practices; the “New Drinking Water Directive”,
explained later on, and finally in 1996 the “Directive for Integrated Pollution and
Prevention Control” which purpose was to minimize the pollution from industrial
sources.
The directives in regard to drinking water have been redacted several times. After the
ones in 1980 and 1991, another Drinking Water Directive replaced them in 1998 with

25
effect from December 2003. Its purpose doesn’t differ from the others, the only
difference is that contemplates a lower number of parameters but allows the Member
States to add other ones. Therefore, its aim is to protect human health and the
environment from adverse effects of any contaminations of water intended to people
consumption. Member States shall ensure that water doesn’t contain microorganisms
and parasites or any other substances which can damage human health; that it meets the
minimum requirements referred to microbiological, chemical and radioactivity
parameters set up and, finally, that they will adopt any measure to guarantee that this
kind of water satisfies any requirements laid down by the directive. The Blueprint to
safeguard Europe’s water resources, that I am going to describe afterwards, is an useful
tool helping to implement this directive.
The “Habitats Directive” 1992 is another directive relevant for the water industry which
was introduced to protect and/or restore habitats for wild flora and fauna. The
conservation sites identified by means of it have been designated as “protected areas”
under the Water Framework Directive (WFD). Other directives, listed and explained
hereinafter, were redacted during those years (and even before), then repealed and
substituted, and finally replaced by the WFD.
− The “Surface Water Abstraction Directive” drawn up in 1976 but replaced by the
end of 2007 which set quality objectives for surface water intended for drinking
use.
− The “Freshwater Fish Directive” originally adopted on 18 July 1978 but
consolidated in 2006 and replaced by the end of 2013. It required Member States to
protect designated surface waters from pollution that could have been harmful for
fish.
− The “Shellfish Waters Directive” originally adopted on 30 October 1979, repealed
by the codified Shellfish Waters Directive (2006/113/EC), adopted on 12 December
2006 and replaced by the end of 2013. It set physical, chemical and microbiological
water quality requirements that designated shellfish water had to respect in order to
protect the aquatic habitat of bivalve and gastropod mollusks.
− The “Dangerous Substances Directive” compiled in 1976 but replaced as well by
the end of 2013 which aim was to regulate potential aquatic pollution by thousands
of chemicals produced prohibiting the release of certain substances into the
environment.

26
− The “Groundwater Directive” drawn up in 1980 and replaced by the end of 2013,
aimed at protecting groundwater from pollution, laying down a list of substances
which weren’t allowed to be released into the environment. It required a system of
prior investigation, authorization and surveillance to be put in place.
As said before, all these directives were, then, combined in one single directive: the
Water Framework Directive (WFD) (2000/60/EC). It has been the first directive which
purpose was to protect water ecosystems equally in terms of water quality, water
quantity and their role as habitats. Framework means that it prescribes steps to reach the
common goals rather than adopting the more traditional limit value approach.
Its aim is to maintain and improve the aquatic environment of the Community which
can be satisfied by means of the quality control, primarily, and secondarily with a
quantity control since, as reported in the Directive, “the quantitative status of a body of
groundwater may have an impact on the ecological quality of the surface waters and
terrestrial ecosystems associated with that groundwater body”.
Water ecosystems have many functions: filtering, diluting and storing freshwater;
preventing floods; maintaining microclimate balance and safeguarding biodiversity.
This entails that it is necessary to adopt a correspondingly broad vision which makes
essential the integration of policies on climate change adaptation and biodiversity with
sectorial policies such as those dealing with agriculture, energy and transportation. The
Water Framework Directive is based on different principles such as the precautionary
and preventive action principle and the most important: the “polluter-pays” principle,
according to which those who produce pollution should bear the costs of managing it to
prevent damage to the environment.
In summary, the purposes of this Directive are to prevent the qualitative and quantitative
deterioration of water and terrestrial ecosystems; to protect and improve them; to ensure
both a sustainable use of water, based on the long term protection of the water resource,
and a reduction of water pollution. Finally, as reported in the first article, the Directive
aims to mitigate the effects of floods and droughts in order to guarantee a sufficient and
good superficial and groundwater quality supply, to decrease groundwater pollution, to
protect territorial and marine water and to realize the objectives of relevant international
agreements including those which head to prevent and eliminate pollution of the marine
27
environment.
The Directive mentions the ecological and chemical statuses of surface waters which are
assessed according to the following criteria:
biological quality (fish, benthic invertebrates, aquatic flora);
hydromorphological quality such as river bank structure, river continuity or
substrate of the river bed;
physical-chemical quality such as temperature, oxygenation and nutrient conditions
and
chemical quality that refers to environmental quality standards for river basin
specific pollutants.
These standards specify maximum concentrations for specific water pollutants. If even
one such concentration is exceeded, the water body will not be classed as having a
“good ecological status”.
Following the Directive instructions (Art. 4) the Member States shall prevent the
deterioration of the status of all bodies of surface water, subject to the application of
paragraphs 6 and 7 and without prejudice to paragraph 8. The sixth paragraph
establishes that a temporary deterioration of bodies of water due to natural causes out of
the human control, which is exceptional or could not reasonably be foreseen, doesn't
constitute a violation of this Directive if:
anything possible has been done to prevent a further deterioration in status and to
not compromise the achievement of the good status of those bodies not affected by
those circumstances,
the river basin management plan mentions these kind of situations declaring them
unforeseen or exceptional,
measures needed to be adopted in those particular circumstances are already
provided in the measure program and do not compromise the recovery of the
quality of the body of the water once those circumstances are gone,
the effects produced by those circumstances are examined annually and anything
possible is done to recover the body of water as soon as reasonably practicable,
a summary of the effects produced and of the measures adopted is inserted in the
next update of the river basin management plan.
Furthermore, according to the paragraph 7, Member States aren’t infringing the
Directive if their failure to achieve a good quality of the water is due to new
28
modifications to the physical characteristics of a surface water body to alterations to the
level of bodies of groundwater or is due to new sustainable human development
activities. However, there are some conditions the Member States have to observe:
they have to prove anything possible has been done to mitigate the adverse impact
on the body of water,
every modification or alteration are mentioned and illustrated in the river basin
management plan and the objectives are reviewed every six years,
the reasons generating those modifications and alterations satisfy public interest,
for reasons of technical feasibility or high costs the achieving of certain objectives
can’t be done by other means which are significantly better for the environment.
Naturally, following the eighth paragraph, the Member States, in realizing the objectives
of the Directive, shall ensure that the achievement of the same ones regarding other
bodies of water in the same basin district is not compromised.
Going back to the art.4, the first paragraph sets that each Member State shall protect and
improve all the surface waters, artificial and modified waters, in order to reach a good
status in 15 years, in accordance to the Annex V, subject to the application of extensions
determined in accordance with paragraph 4 and to the application of paragraphs 5, 6 and
7, without prejudice to paragraph 8 explained before.
The paragraph 4 poses some exceptions regarding the deadlines within which the
objectives need to be achieved. It is possible to extend them insofar which no further
deterioration is caused and that some conditions are respected:
Member States declare that the improvements can’t be achieved within the time
limits because of three particular reasons which are feasibility reasons that let this
objectives be reached in phases exceeding the timescale, the achievement of them
within the deadline implies costs too high, natural conditions don’t allow timely
improvements in the status of the body of water;
the reasons of the extensions of time limits need to be indicated and explained in
the river basin management plan;
these extensions shall be limited to a maximum of two further updates of the river
basin management plan except in cases where the natural conditions hinder the
achievement of these objectives within this period;
a summary of the measures necessary to bring the body of water progressively to
the required status by the extended deadlines, the reasons for the delay in making

29
these measures operational and the expected timetable for their implementation are
set out in the river basin management plan.
The Annex V defines the provisions the Member States need to follow to reach a good
quality status of the body of the water. It provides the definitions for high, good and
moderate ecological status in rivers, lakes, transitional waters, coastal water and heavily
modified or artificial water bodies following the quality elements described in the
Annex itself, such as the biological, hydromorphological and physic-chemical elements
for rivers. Regarding the groundwater it establishes the parameters for the determination
of groundwater chemical status, which are conductivity and concentration of pollutants,
and it defines the good groundwater chemical status.
Plus, it determines the procedures the Member States have to follow in setting the
environmental quality standards and in monitoring the water status (superficial water
and groundwater) as required in the art. 8: “Member States shall ensure the
establishment of programs for the monitoring of water status in order to establish a
coherent and comprehensive overview of water status within each river basin district:
for surface waters such programs shall cover:
i) the volume and level or rate of flow to the extent relevant for ecological and
ii) the ecological and chemical status and ecological potential;
for groundwaters such programs shall cover monitoring of the chemical and
quantitative status,
for protected areas the above programs shall be supplemented by those
specifications contained in Community legislation under which the individual
protected areas have been established.”
Besides guaranteeing a protection from pollutants and an improvement of the
groundwater, it’s an important duty of the Member States to ensure a balance between
abstraction and recharge of groundwater which, as we have seen before, it is a crucial
point to avoid water scarcity and to reduce pollution, diminishing also the human
activity impact, in superficial water and groundwater.
A new aspect coming from this Directive is the establishment of the “river basin”. The
territorial unit of reference for the basin management is identified in the “river basin

30
district”, area of land and sea, consisting of one or more neighboring river basins
together with their associated ground waters and coastal waters. A management system
based on natural river basin districts rather than regional and national boundaries has the
aim to bring together all water managers, the public and all affected sectors to safeguard
ground and surface waters to better achieve good standard quality by 2015. First task for
the Member States is to identify European waters in order to detect the river basin and
district, and for a river basin covering more than one Member State, the Directive
imposes that each State guarantees that this is assigned to an international river basin
district (IRBD) which, in some cases, can be harsh. Therefore, if necessary, the Member
States can ask the European Commission to give its contribution facilitating the
assignment of those international river basin districts. A clear example is the Danube
which is the largest international RBD, since it is shared by 18 countries, which
contribute with small or large land areas. In Ireland, for example, an international river
basin district is represented by the “Shannon IRBD”: it flows through 18 local authority
areas of which a small portion is represented by the County Fermanagh in Northern
Ireland where a stream drains underground to the Shannon pot.26
For each district it is necessary to arrange a program of measures based on the analysis
conducted by the Member States following the art. 5, which are:
basin features analysis,
human activities impact on the groundwater and surface water reviewing,
economic of the water use analysis,
in order to reach a “good status” of the water by 2015. These programs of measures
contain different instruments (legal, administrative, technical, infrastructure, training
etc.) and are funded in different ways: public budget, funds provided by private
operators (cost recovery provisions) or European funds (structural cohesion or CAP
funds). Member States need to identify the financing mechanism and the availability of
funds while selecting the measures so that the feasibility of implementation is certain.
These programs of measures are mentioned in the “River Basin Management Plans”
drawn up by the Member States for each river basin district, it represents the tool
through which it is possible to achieve the already mentioned objectives. They should
26
Shannon River Basin Management Plan (2009-2015)
http://www.wfdireland.ie/docs/1_River%20Basin%20Management%20Plans%202009%20-

31
be updated every six years. The Member States have to ensure all programs of measures
are coordinated for the whole of the river basin district and regarding the international
RBDs, the Member States concerned shall together ensure this coordination with the
possibility to use existing structures that should be set in the international agreements.
A River Basin Management Plans contains the description of the water resource in a
drainage basin and water allocation plan, following the Annex VII of the Water Frame
Directive. Plans must include:
a general description of the characteristics of the river basin district;
a summary of significant pressures and impact on human activity on the status of
surface water and groundwater;
the identification and mapping of protected areas, a map of the monitoring networks
established for the purposes of the art. 8 and Annex V, and a presentation in map
form of the results of the monitoring programs carried out under those provisions
for the status of surface water, groundwater and protected areas;
a list of environmental objectives established under art. 4;
a summary of the economic analysis of water use;
a summary of the programs of measures adopted and the ways in which the
objectives have to be achieved;
a register with related contents of any more detailed program and management plan
for the river basin district dealing with particular sub-basins, sectors, issues or water
types;
a summary of the public information and consultation measures adopted with
related results and any consequential changes to the plan;
a list of the competent authorities in the river basin district;
the contact points and procedures for obtaining the background documentation and
information referred to in art. 14.
With the art.16 the WFD, setting out strategies against pollution of water, contemplates
the creation of a list of priority substances chosen within those presenting a significant
risk for or via the aquatic environment. This list was, then, replaced by the Directive of
the Environment Quality Standards (2008/105/CE) which lays down, in Annex I, the
limits on concentration of the priority substances in surface waters (river, lake,
%202015/ShIRBD%20RBMP%202010/ShIRBD%20RBMP%202010.pdf

32
transitional and coastal) of 33 priority substances and 8 other pollutants.
European Waters in qualitative terms are not in good conditions, despite improvements
in recent years. Pollution, body of the water changes and water shortages are
widespread throughout the Union and extreme events such as floods have increased in
many Member States. Between 1998 and 2009 Europe went through many damaging
floods and the most catastrophic ones interested the Danube and the Elbe rivers in 2002.
The negative consequences were been 1126 deaths, displacement of about half a million
people and 52€ billion in insured economic losses (source EEA). On this note, another
directive, which needs to be carried out with the WFD, has been introduced in 2007: the
Directive 2007/60/EC, the “Flood Directive”. Its aim is to reduce and manage the risks
that floods pose to human health, to the environment, to the cultural heritage and to the
economic activity. According to this Directive the Member States have to follow three
important steps:
1. Undertake a preliminary flood risk assessment of their river basins and associated
coastal zones to identify areas where potential significant flood risk does exist;
2. By 2013 develop a flood hazard map and a flood risk map for such areas. These
maps will identify areas with a medium likelihood of flooding (at least 1 in 100
years event) and extreme events or low likelihood events in which expected water
depths should be indicated. For those areas, the Member States shall indicate also
the number of inhabitants potentially at risk, the economic activity and the
environmental damage potential;
3. By 2015 draw up flood risk management plans for those hazard areas. These plans
must contain measures to reduce the probability of flooding addressing all phases to
prevention, protection and preparedness.
These steps need to be reviewed every six years and it is crucial that are coordinated and
synchronized with the Water Framework Directive.
The EEA State of Water report and the Commission assessment of the Member States’
RBMPs prove that the WFD’s objective is likely to be achieved in slightly over half
(53%) of EU waters.
That’s why in 2012 the European Commission launched the “Blueprint to Safeguard
Europe’s Water Resources”, a document defining the guidelines the Member States

33
should follow to improve the river basin management. On this note the Environment
Commissioner Jane Botočnik said: “This Blueprint shows that we have a good
understanding of the problems we need to face and a solid platform to solve them. It’s
time to act to take advantages of our legislation and create opportunities for innovative
solutions in politics and in the water sector. What we need is a balance between water
demand and supply, taking into account citizens’ needs and natural ecosystems they
depend on.”
Its long-term aim is to ensure the sustainability of all activities that impact on water in
such a way to guarantee a good quality supply of water. The Blueprint identifies the
obstacles to achieve this goal and the ways to tackle them. The topics covered in this
document are the land use and the ecological status of the EU waters, their chemical
status and pollution, their vulnerability and the EU water efficiency, which is related to
the quantity of this resource.
In 2012 the European Union wrote down a report on the implementation of the Water
Framework Directive in which it explains the current achievement of the objectives set
by it referred to the time span 2009-2015 and based on the information given by the
Member States on the River Basin Management Plans. Generally speaking, the
European States improved their water bodies’ conditions by far, but the good status will
not be reached by the end of 2015 for most of them for different reasons such as the fact
that the hydromorphological pressures, the pollution and the over abstraction remain the
main sources of pressure in the water environment. In this report is highlighted that the
percentage of progress 2009-2015 regarding the ecological status of surface waters is
10%, of quantitative status of groundwater is 7% and of chemical status of groundwater
is 9%. It has not been possible to evaluate the chemical status of surface waters since a
large proportion of water bodies was reported with unknown chemical status (40% in
2009) and as the information reported in the first RBMPs showed different degrees of
implementation of the Directive 2008/105/CE mentioned before so that it is difficult to
compare the chemical status of the water bodies belonging to the Member States. The
fact that some Member States reported an unknown chemical or ecological status means
that there’s a gap in monitoring which needs to be filled since it is required by the
Directive (art.8), plus, costs of monitoring are lower than costs of inappropriate
decisions.
Anyway, since the WFD allows the Member States to achieve the objectives with a

34
certain lagging, because of technically infeasibility or excessive monetary expenditure,
the deadline can be extended up to 2027 or beyond so that the States have more time to
let the water status be improved. In this case they have to explain the reasons they ask
for it, and the actions to undertake, in the RBMPs.
In conclusion, Member States have to do their best to improve water quality especially
because it is scarce and as forecasts show, it is getting poorer and poorer. Following the
International and the European law, they shall regulate their own country but also their
industries giving them the possibilities, such as financial aids and authorizations, to
ensure a better environment and social health. These mentioned industries include the
water industry, which is the most important since it supplies water to the public.
In the next chapter I analyze the water sector, with particular attention to England and
Wales which went through important modification assets during past years.
1.2 Water sustainability management
As water becomes scarcer the importance of how it is managed grows quickly as well as
the importance of its sustainability.
The most common definition of sustainability is: ”to meet the needs of the present
without compromising the ability of future generation to meet their own needs.”27
This means it is not enough to care about the present, making sure we have what we
need today, but it is also necessary to understand the long-term implications of
decisions; to prevent any damage to society environment and economy; to leave
opportunities for generations and finally, to use the resources in such an efficient and
effective way. Applying this approach to the water and sewage sector will deliver long-
term benefits to stakeholders and to the environment.
Another important aspect that has to be taken into consideration by the States is to adopt
an approach which contemplates the needs of the society, the environment and the
economy together (see figure 4).
The 2005 World Summit on Social Development, a follow-up meeting to the United
Nations’ 2000 Millennium Summit, specified that the sustainability has to be intended
27 http://www.sd-commission.org.uk/pages/what-is-sustainable-development.html

35
as the mutual reinforcement of the three components mentioned before.
Figure 4: Relationship between Environment, Society and Economy
Source: M. Scott Cato “Green Economics” 2009
This figure explains the interconnection between them: society depends on the
environment in order to run businesses, build communities, feed the populations etc., we
can mention for example the need of clean water to drink. The success of society
depends on its well-being, a society which suffers from poverty will not develop in the
long term. This means that the social well-being and the economic well-being are
interconnected plus they depend on the environment. Therefore, it is necessary to well
understand the relationship between these factors in order to protect our environment
and reach sustainability objectives.
According to the definition of sustainability, a sustainable water management requires to
take into account the needs of present and future users while managing the water
resources, involving a new way of looking at how we use our resource.
The International Hydrological Programme from UNESCO, mentioned before, says:
"It is recognized that water problems cannot be solved by quick technical solutions,
solutions to water problems require the consideration of cultural, educational,
communication and scientific aspects. Given the increasing political recognition of the
importance of water, it is in the area of sustainable freshwater management that a major
contribution to avoid/solve water-related problems, including future conflicts, can be
found."
Environment
Society
Society
Economy

36
Therefore, it is necessary to consider all sectors affecting water use such as political,
economic, social, technologic and environment sectors, while managing water in a
sustainable way.
The Sustainable Water Management is based on the principles established in Dublin in
1992 during the International Conference on Water and the Environment (ICWE):
1) Freshwater is a finite and valuable resource, essential to sustain life, development
and the environment: effective management demands a global approach which
considers social and economic development together, respecting the ecosystems,
and links land and water uses across the whole of a catchment or groundwater
aquifer.
2) Water development and management should be based on a participatory approach,
involving users, planners and policy-makers at all levels: let all the stakeholders
participating to the decisions, diffusing the importance of water resource among
them.
3) Women play a central part in the provision, management and safeguarding of water:
providers and users of water, guardians of the living environment; it is necessary,
then, to implement positive policies in order to involve them in the water
management.
Water is both a social and economic good. It’s a social good because it benefits the
largest number of people in the largest possible way, under this definition clean water is
a social good. Since water is important for life and health and for the economic
development, it has often been provided at subsidized prices or for free in many
situation implying financial burdens since society has to pay for the subsidy. In this
case, a low price might encourage a wasteful use of water and perhaps the poorest
people may be deprived of clean water at a reasonable price, because those who have
access use more water than they need. That’s why it is necessary to treat it also as an
economic good as established in the ICWE:
4) Water has an economic value in all its competing uses and should be recognized as
an economic good: managing it as an economic good in order to achieve efficient
and equitable use, encouraging conservation and protection of water resources.
An economic good is any good or service that has value to more than one person; a
good that is not “economic” is either without value or it has value to none but its owner.
37
The challenge here is to get the most value for water that is available without depriving
people of sufficient clean water to meet their basic needs meaning to manage water as
both a social and economic good which is far from being easy. For example, it could be
useful implementing a costs-benefits analysis when doing so is feasible and affordable
(since some cultural ad ecological benefits and costs cannot be quantified), but more
important is to contemplate the stakeholders’ participation in decisions concerning the
water allocation in such a way to allocate it to the higher value uses trough processes
that are accepted as fair and equitable by stakeholders.
1.3 Ownership of water utilities
Theoretically, the ownership is related to the distribution of the property rights which
are the right and the duty to control the institution, and the right and duty to claim the
residual results. While the first one is related to the right to make decisions in managing
the enterprise, the second one concerns the right to benefit from the profits and the duty
to bear the losses. These property rights can be distributed within more than a category
of stakeholder or in the same category which incorporates more than one role and
benefit from the property rights.
The public utilities’ ownership structure has always been discussed since the importance
for the human life of this service and since it could be heavily influent on the
companies’ performance.
Basically, there are four types of ownership in public utilities:
1) Public, majority of controlling shareholding of a firm by the government;
2) Private, ownership of property by non-governmental legal entities which can be
either one individual or a group of individuals;
3) Non-profit, organizations that use their revenues to achieves their objectives instead
of distributing as profits or dividends;
4) Mixed, a combination of public and private ownership, situation that makes more
difficult the understanding of the relationship between ownership and performance.
Besides the ownership, Bozeman (1997), identified two more dimensions of publicness:
− Funding, government funds and transfer or consumers payments and

38
− Control, political or market forces.
As suggested by Musgrave (1959), the government intervenes in the economy in regard
of allocation, distribution and stabilization.
In particular to allocation, it has the duty to correct market failures (natural monopoly,
public good, externalities, information asymmetry) when they occur, through regulation,
taxation and providing public goods. Hence, a public ownership in this case could be
justified. As the microeconomic view suggests, if the public provision of a good cannot
be justified by a market failure, privatization can only improve efficiency, since public
intervention constitutes a costly and imperfect market substitute. Yet, as the Public
Choice Theory declares, there also can be government failures whereby private
ownership could be a better option.
Indeed, the economic theory of property rights (Coase 1937) suggests that public
ownership leads to lower efficiency. In private ownership organizations, property rights
are well defined and owners and shareholders have a direct financial incentive to
monitor and control the behavior of managers in order to maximize profits. Moreover,
managers can benefit from higher performance either because part of their remuneration
comes from the shares or because their salary is linked directly to financial success.
Conversely, public firms are formally the property of the state which means that profits
belong to the state. Ministers and bureaucrats don’t have any specific incentive in
guaranteeing the rights of the public owner (they may have personal interests) and they
are not given any direct financial benefits from a better organizational performance.
Here, property rights are widespread: individual voters have little gain for putting any
efforts in monitoring managerial behavior.
The Public Choice theory sustains that between public and private company there’s a
difference in the objectives pursued by managers. In a private company the main goal is
to maximize profits. In a public company is more complicated as other factors influence
managers’ behavior. They may have other interests in leading a company, such as
political interests, prestige and personal powers. Hence in these cases, there’s the risk
that managers utilize resources in a less efficient way so that the maximization of profits
or the minimization of costs are not achieved. The political system has a dual effect: on
the one hand it could be more successful in controlling managers in public firms than in
the private ones, which might produce improvement in efficiency, on the other hand it

39
could just be used as a tool to maximize the consensus of the current political party.
An argument in favor of a private management might be the bankruptcy. Public
companies don’t go bankrupt since they have soft budget constraints. Conversely, in
private companies, the threat of bankruptcy gives managers the right incentive to well
lead the enterprise. However, as Massimo Florio reports in his “The Great Divestiture”,
those who bear the risk of bankruptcy aren’t the managers but the firms’ creditors or
employees and less informed shareholders, not to mention that there are several safety
nets for large firms.28
Furthermore, as the Austrian School, a school of economic thought originated in late
19th
and early 20th
century in Vienna with the contribution of Carl Menger, Eugen von
Böhm-Bawerk, Friedrich von Wieser and others, states there are different manager
practices in public and private ownership which lead to different performance. Those
practices are more innovative and are discovered and then exercised by private
companies. According to this vision, only private company and competition can
stimulate a process of experimentation with innovative solutions.29
On the side of investments, the lack of funds produces negative effects for example on
the maintenance of physical assets, which if not properly treated cause a lower quality
service. That’s one of the multiple motives leading to privatization; costs of upkeep are
so high that a private ownership may be an alternative solution. As Lobina and Hall
stated in their paper “From a private past to a public future”, investments in the water
sector, after privatization, increased up to an average of £3.7bn per year, compared with
an average of £2bn per year during the 1980s. However, the Authorities in charge before
1989 didn’t afford the same level of investment throughout the 1980s; indeed, they rose
it from 1985 to 1989 (from £1.6bn to £2.2bn). In this regard, Ofwat assumed that there
wouldn’t have been any further increase in investments by the Authorities after 1989;
conversely, the authors sustain that this wouldn’t have been possible as a consequence
of the legal requirements for investments the Authorities had to comply with, for
example those coming from the European Union. Lobina and Hall explain that even if
the increase of investments were half of the rate they were delivering in those four years
before privatization (namely 4% per annum), they would have provided a total
28 Florio M. (2004), The great divestiture, evaluating the welfare impact of the British privatizations 1979-1997.
London, UK: The MIT Press. 29 Florio M. (2004), The great divestiture, evaluating the welfare impact of the British privatizations 1979-1997.
London, UK: The MIT Press.

40
investment of over £50bn over the next 15 years which correspond to that of the private
companies mentioned before.30
Another issue rose by the literature is if a state-owned company and a private company
have the same incentive to promote water conservation, which is considerably important
nowadays. Howart (1999) declares that public owned utilities should be more keen to
promote the conservation of water and to protect the environment because their
shareholders (municipalities or provinces) have the common interests of community,
customers and environment and naturally, for a private company the more water you use
the more you spend, meaning more profits.
The different objectives characterizing the “public view” and the “private view” are
reflected in the tariff plans as well. In general, the rule dictated by the EU is that prices
cover costs (Full Cost Recovery) both in a private and in a state-owned management.
Prices should cover all the necessary investments for a good quality delivery service
which depends on the territory for: the facility through which water is obtained, the type
of purification adopted, the water supply plans conditions, the territorial morphology
etc. The only difference is that the private company always seeks for a profits
maximization which can be obtained through a prices increase or costs decrease. Yet,
reaching high level of efficiency allows enterprises to bear low level of costs, and then
reduce the service price. However, what companies usually do, in this case, is to collect
the profits and distribute them as dividends to their shareholder. Even if the ownership
is private, authorities should be put in charge in regard of price fixation in such a way
that no exorbitant prices are established also in order to follow the sustainability
principles enacted by the EU, so that companies adopt a tariff policy able to spur
consumers to use the resource in an efficient way.
Water resource management is different from country to country, here few examples.
In Germany, while the water networks are state-owned, its management is partly public
(municipalities) and partly private and mixed.31
Indeed, in Berlin the Berliner
Wasserbetriebe, which was owned by the French group Veolia and the German RWE for
the 49,9% and for the 50,1% by the State of Berlin, is responsible for the management.
30 D. Hall, E. Lobina (2007), “From a private past to a public future? - the problems of water in England and Wales”,
in http://gala.gre.ac.uk/2946/1/PSIRU_Report_9757_2008-02-W-UK.pdf 31 Federal Ministry for the Environment, Nature Conservation and Nuclear Safety (2001), “ Water management in
Germany, water supply - water waste disposal” in http://www.bmub.bund.de/fileadmin/bmu-import/files/english/pdf/application/pdf/faltblatt_wasserwirtschaft_en_bf.pdf

41
In November 2013 the State of Berlin acquired the Veolia and RWE part of shares, so
that it increased its shares of the Berlinwesser group from 50,1% to 100%.32
In the Ruhr
basin and in the lower Saxony the drinking water management, sewage and water
treatment are managed by a private multinational group of companies through the
granting of over thirty municipalities.33
France is characterized by an high fragmentation: drinking water services and sewage
can directly be managed by consortium or delegated through a grant which represents
almost the 70% of the total. In this country there’s no Authority responsible for the
water sector regulation but there are agencies and institutional actors in charge. In 1984
the municipality of Paris decided to contract out the water service for 25 years to two
private firms: the “Compagnie des Eux de Paris”, which was a Veolia’s subsidiary, and
the “Eau et Force Parisienne”, a Suez’s subsidiary.34
But after those years, in 2010, the
increased prices by 260%, the scant maintenance and the mismanagement made
necessary a return to the public.
Italy is incredibly fragmented as well. Accordingly to AEEG data, at the end of 2013
there were 1235 operators involved in the water industry; and 72 assignments made by
the AATO35
: bodies formed by the mayors and their delegates that entrust the water
service to the operators through an agreement. There are only 72 assignments coincident
with the AATO which are 92, in some of them, in fact, the service is not granted and is
managed directly by local bodies.36
There are different types of assignments: public,
private or mixed. The regulation and control of the water service is handled by an
independent Authority.
In the last “XI Edizione dell'Encuesta de suministro de agua potable y saneamiento”, a
Spanish research concerning the water service situation, it has been marked that in
Spain the 43% of the population is supplied by a public society, the 33% by private
companies, 13% for joint venture and the 7% through a local government. This
highlights the fact that more joint ventures have been established (from 8% to 13%) at
the expense of public and private firms.37
Prices are fixed by hydrographic
confederations or by consortia between municipalities, with no control from the
32 http://www.bwb.de/content/language1/html/8368.php 33 http://www.gruppohera.it/gruppo/com_media/dossier_acqua/articoli/pagina23.html 34 http://www.eaudeparis.fr/lespace-culture/patrimoine/ 35 http://www.isprambiente.gov.it/it/temi/acqua/gestione-delle-risorse-idriche-in-italia 36 http://www.gruppohera.it/gruppo/com_media/dossier_acqua/articoli/pagina25.html 37 http://www.iagua.es/2010/06/aeas-presenta-la-xi-edicion-de-la-%E2%80%9Cencuesta-de-suministro-de-agua-

42
regulator.
Instead, Netherlands has its own model. There are 15 private societies responsible for
the integrated water service whose shareholders are local government and provincial
bodies.
Finally, the U.S.A. have nowadays a public water service while for years it has been
private. Now only the 15% is private or mixed.
The U. K. situation will be explained later.
potable-y-saneamiento-en-espana%E2%80%9D/
43
2. The water sector in England and Wales
The water supply process consists in the abstraction of water from the underground
resources and from the surface water such as river, lakes and reservoirs. This water
needs, then, to be treated in order to remove natural and man-made pollutants so that
can be ready to be distributed via a network of mains to the consumer. Once the
consumers have used the water, it returns in the form of sewage and is collected in
sewers; then it must be pumped to a nearby treatment work where solids are removed
and incinerated, dumped at sea or used as fertilizer on farm land. These treatment works
produce a liquid which is effluent and needs to be treated before being placed back to
the water cycle. During this process several externalities can affect the quality of water
and damage the environment, for example the dumping of sewage sludge can harm
fisheries, lower the quality of nearby bathing beaches etc.
The water sector in England and Wales is characterized by the dramatic privatization
occurred in 1989 under the Thatcher’s government. The government policy is delivered
through Acts of Parliament.
2.1 A brief historical background
Before and after the Second World War the industry in England and Wales was in a
developing phase due to the industrial revolution and to the consequent economic
growth, and to the increase of the population which, provoked, in regard of the water
sector, an increase of the water demand.
In 1945 there were more than 1000 institutions in the supply of water and almost 1400
responsible for sewerage and sewage disposal, most of which were local authorities.38
Indeed, water planning was a localized activity with little coordination at either a
regional or national level. Local authorities were responsible for funding requirements
and had the power to decide where the expenditures should be intended to, whether the
water services or the local authority budget. Furthermore, there were the Statutory water
companies as water suppliers: private companies with shared capital regulated by the
government in regard of dividend payable to shareholders, the borrowing amount and
the profits they were permitted to retain. A potential conflict could have taken place
38 OFWAT, DEFRA (2006) “The development of the water industry in England and Wales” in http://www.ofwat.gov.uk/publications/commissioned/rpt_com_devwatindust270106.pdf

44
between them and the Water Authorities, but with the Water Act 1973 explained later,
they were ensured sufficient access to water from the authorities.
With the aim to expand and support the national water supply the Parliament issued the
“Water Act 1945” whereby it encouraged local authorities to merge to form joint boards
in such a way to benefit from improved arrangements for the supply of water across
local authority boundaries. As a result, the number of the water undertakings was
significantly reduced by 1960s.39
Already in this period, the concern about the environment was wide spreading. In effect,
the position paper regarding the future of the sector published by the government,
identified, in the integrated river basin basis with water authorities directly responsible
for all functions related to the water resources, the right method to better manage the
resource. This was to regulate and manage the resources in order to ensure that
discharges and abstractions didn’t damage the water. But to implement an integrated
resource management, it was necessary to narrow the number of the authorities.
In fact, the considerable change happened in 1973 with the “Water Act 1973” when all
water bodies were regionalized with the aim to include the whole of a river’s catchment
area in one authority. Therefore, ten Water Authorities have been created basing on
those catchment areas, giving them the role to plan and control all users of water in each
area. They were given the ownership of all publicly owned facilities and land and,
basically, they had regulatory and utility functions of water supply and sewerage.
Therefore, they were responsible for the planning (making strategic plans for their own
catchment area which can be considered as an anticipation of the European Directives
issued some years later), the design, the operation, the construction and the financing of
facilities for water supply, sewerage, ambient water quality, water based recreation,
flood and drainage control, inland fisheries and navigation.40
Summing up, their
responsibilities were:
− water conservation,
− controlling pollution of inland and tidal waters,
− land drainage and flood control,
− fisheries and
− supply of water and sewerage services.
39 Ofwat, Defra (2006) “The development of the water industry in England and Wales” in
http://www.ofwat.gov.uk/publications/commissioned/rpt_com_devwatindust270106.pdf 40 National Research Council “Privatization of water service” 2002

45
They made significant gains between 1974 and 1989, perhaps also because of the
reduction of the number of employees, from 80,000 to 50,000.41
These Authorities were
regulated by the Government who used to discipline them in regard of investment,
borrowing and operating costs. Its power was quite influential, besides the financial
constraints, it had the duty to examine and approve water authorities’ plans which
included also the decisions related to the level of capital investment.
Regarding the investments it set a two-part financial target. The first one established
that new investments should have earned the Treasury’s required rate of return which,
for the most of 1980s, was 5%.42
The second one imposed a low but increasing return
on the current value of existing assets. Their investments were financed by the Central
Government, which, by the way, had always been keen to implement potential cutbacks
in this industry.
The respect of financial constraints limited the borrowing decision power. Borrowing
was controlled by an external financial limit, meaning that any investment above this
limit had to be financed with retained earnings. Furthermore, it was established a
maximum annual capital expenditure and a limit on the amount each authority could
allocate to reserves.43
The achievement of performance aims implied the establishment of a target figure for
operating costs. The Government imposed to operate on a cost recovery basis which
established that no gross revenue was recognized until the entire cost of the
merchandise had been recovered.44
So all these factors implied that companies had to finance their investments by
internally generated funds and, as a consequence, water charges rose even more than the
rate of inflation. Dividends, transfers to reserves and accumulated reserves were
controlled so that to constitute a sort of rate-of-return regulation able to pass through
consumers any reductions or increases in costs.45
The only subsidies from the government were for land drainage, under the Land
41 Bernard Barraque (1995), Les Politiques de l’Eau en Europe p.233, Paris: La Découverte 42 Ofwat, Defra (2006) “The development of the water industry in England and Wales” in http://www.ofwat.gov.uk/publications/commissioned/rpt_com_devwatindust270106.pdf 43 Ofwat, Defra (2006) “The development of the water industry in England and Wales” in
http://www.ofwat.gov.uk/publications/commissioned/rpt_com_devwatindust270106.pdf 44 Ofwat, Defra (2006) “The development of the water industry in England and Wales” in
http://www.ofwat.gov.uk/publications/commissioned/rpt_com_devwatindust270106.pdf 45 Ofwat, Defra (2006) “The development of the water industry in England and Wales” in
http://www.ofwat.gov.uk/publications/commissioned/rpt_com_devwatindust270106.pdf

46
Drainage Act 1976, and for extension for water and sewerage supplies in rural areas,
under the Rural Water Supplies and Sewerage Act 1944.
Each authority was formed by a chairman and other members nominated both by the
central government and local and district councils. Following the principle of multi-
disciplinary approach to management, adopted by the government, the board should
have consisted in a team inclusive of specialist managers, including finance, operations
and planning.46
After the UK adhesion to the European Community, the government issued a number of
laws, according to the EU directives, in order to control that authorities respected those
laws and the quality standards established. In fact, in 1974 the Control of Pollution act
was drawn up in order to pursue protection environment objectives introducing the
“polluter-pays” principle and put the water authorities in charge for the pollution
control.
Alongside the government, there was an independent statutory board whose aims were
to implement the national water policy, assist the regional authorities in matters of joint
concern and set and enforced national regulations on water quality and conservation. It
was the National Water Council and was formed by the ten chairmen of the water
authorities and ten independent members appointed by the government.
The charging system was based on property values rather than consumption and no
significant promotion on water metering was introduced yet.
This government policy wasn’t efficient: the lack of capital maintenance and
investments required by the industry, due to the instability in the wider economy and to
the high level of debt inherited by water authorities, caused a discontent within the
public whose concern increased as much as the Europe’s, which began, through the
European Union Directives, to regulate the industry. This under investment caused a
low maintenance which worsened the conditions of the facilities, for instance it
increased the leakage of the aging pipes and discharges of pollution into the rivers and
sea as well as overloaded wastewater treatment works. The price was kept within levels
of the Price Retail Index47
with the consequence that the authorities’ cash flow
diminished considerably.48
46 Ofwat, Defra (2006) “The development of the water industry in England and Wales” in
http://www.ofwat.gov.uk/publications/commissioned/rpt_com_devwatindust270106.pdf 47 It is a measure of inflation in UK and is the average of change in the prices of consumer goods and services. 48 Ofwat, Defra (2006) “The development of the water industry in England and Wales” in
http://www.ofwat.gov.uk/publications/commissioned/rpt_com_devwatindust270106.pdf

47
Trying to solve these issues, the Parliament drew up the “Water Act 1983” whereby
constitutional changes were made. Therefore little power in decision making was taken
away from the local governments and more changes were implemented on the board of
directors of the authorities which, for example, was reduced and filled by people with
experience in the industry rather than of public affairs. Moreover, since the National
Water Council didn’t produce any improvement, it was decided to abolish it. From a
financial point of view, this Act enabled the authorities to borrow directly from the
capital markets rather than only from the central government.
Unfortunately, these changes had no positive effects, the capital investment program
remained inadequate and several number of pollution incidents continued to occur.
These factors added to the usual government unwillingness to provide additional public
finance led to think that privatization was the best solution.49
2.2 Privatization of the English and Welsh water utilities
The term “Privatization” generally refers to the formation of a “Companies Act” and the
subsequent sale of at least 50 per cent of the shares to private shareholders. Normally,
the reason is to improve the industry performance by increasing the role of market.50
The industry was privatized in 1989 under the Conservative Government led by
Margaret Thatcher. Thatcher’s government was founded on neo-liberal economic
policies where the perception of the government as an obstacle to growth and liberty,
the commitment to monetarism and the rejection of income policies, were the major
principles.
Indeed, the Government thought private companies were more keen to improve cost
efficiency if they had to make profits, in fact, they usually strive to reduce costs in order
to increase profits. Furthermore, the existence of the regional monopolies would have
permitted “yardstick competition” by which the regulator could have set prices
comparing companies’ levels of efficiency, in such a way to reward the efficient firms
and penalize the inefficient ones. With this type of competition a company’s price would
have been related to the average of the other firms’ stated unit costs.51
Plus, seen the
49 Ofwat, Defra (2006) “The development of the water industry in England and Wales” in
http://www.ofwat.gov.uk/publications/commissioned/rpt_com_devwatindust270106.pdf 50
Bishop M., Kay J., Mayer C. (1994), Privatization and economic performance. Oxford, UK: Oxford
University Press. 51 Bishop M., Kay J., Mayer C. (1994), Privatization and economic performance. Oxford, UK: Oxford University

48
inability of the government to provide funds from the public finance, they would be
better able to finance the large investments needed, also raising them from the capital
markets. Competition in the capital market and the shareholders’ pressure would have
led managers to improve efficiency.
One more reason leading to privatization was the high public debt held by the
Government in that period. In fact, in the first year of privatization the receipts coming
from it were an equivalent of 4 percent of the British public debt.52
Moreover, the
objectives demanded by the European Directives concerning the quality of the
environment required significant investments that the government wasn’t able to afford.
Therefore, in 1989, the government issued the “Water Act 1989” through which the
privatization was launched.
Technically, it consisted in the transfer of assets and personnel of the ten water
authorities into limited companies. The Act gave them 25-year concessions for
sanitation and water supply and protected them against any possibility of competition
creating private monopolies. It removed the restrictions on the amounts that the
statutory water companies could have borrowed or paid as dividends and, on the side of
environmental regulation, it introduced, for the first time, statutory water quality
classifications and objectives.
Basically, there have been four methods of privatization under Thatcher’s Government:
1. Placement of the corporation on the London Stock Exchange, with an initial fixed
price by public offering or with a minimum price tender;
2. Some of them were sold privately or bought out by managers and employees;
3. Some public services were contracted out;
4. Others were placed on a more commercial footing within the public sector.53
In each water and sewerage company the government continued to have some shares
with special powers through the “golden-share” formula in order to block hostile
takeovers or acquisitions by foreign investors, seen the small size of the authorities. In
fact, a golden share is a type of share that gives special voting rights, giving the
Press. 52 Florio M. (2004), The great divestiture, evaluating the welfare impact of the British privatizations 1979-1997.
London, UK: The MIT Press. 53 Shaoul J.(1997), “A critical financial analysis of the performance of privatised industries: the case of the water
industry in England and Wales”, in Critical perspective accounting, 8, 479-505

49
shareholder the ability to block another shareholder from taking more than a ratio of
ordinary shares. Thus, any individual or company was hindered to control more than
15% of voting shareholdings, unless 75% of shareholders voted otherwise.
Table 2: Proceeds from privatization of water and sewerage companies in 1989
Name of the company Date privatized
Gross proceeds
(millions of
pound, current
prices)
Gross proceeds
(millions of pounds,
1995 prices)
Anglian Water December 1989 707 904
Dŵr Cymru (Welsh Water) December 1989 157 201
North West Water December 1989 854 1,092
Northumbrian Water December 1989 849 1,086
Severn Trent Water December 1989 392 501
Southern Water December 1989 293 375
South West Water December 1989 922 1,179
Thames Water December 1989 346 442
Wessex Water December 1989 246 315
Yorkshire Water December 1989 472 604
Total 5,238 6,699
Source: Massimo Florio “The great divestiture”
Since the Water Authorities had accumulated large debts by 1989, in order to boost
companies’ profitability, the government decided to give them a sort of incentive writing
off the debts at a total cost of £4.9bn in 1989 prices (Ofwat 2004) and giving them a
£1.5 billion cash injection in 1989 prices (Ofwat 2004), known as “green dowry”. In
addition, they were given a provision for capital tax allowances of £7.7bn in 1989 prices
(National Audit Office, 1992), in order to ensure they were not in a disadvantage
situation compared to those companies who had already built up capital allowance over
time. Companies were sold for GBP £5.2bn which means that, considering the debt

50
written off and the cash injection, the government lost money.54
In order to assure a quick purchase, the government set a low share price, which value,
then, immediately rose considerably.55
At flotation, the 2,183 water shares were fully
unwritten and the eventual averaged share price was £2.80.56
A system of price regulation was preferred over the direct control on profits. In effect,
the type of regulation established was RPI+K, with RPI as the Retail Price Index and K
as the amount of investment necessary to meet the European Directives. It was simple, it
offered strong incentives to the companies to improve their efficiency and cut costs by
allowing companies to retain any profits made within the existing price cap. These
profits would not be clawed back before the next price review (5 years) since they
would be transmitted to the consumer through the price capping formula for the next
period, at the end of the five years.57
The K factor was set considering the future
investment proposals of each company (the Asset Management Plan), the comparative
efficiency assessment of each company (examining their operating costs) and the
minimum return accepted by investors to invest in the private companies. With the aim
to ensure the companies a sufficient access to debt and equity, the cost of capital was a
pre-tax rate of return of 7% for water and sewerage companies and 8% for most of the
water only companies.58
People’s judgment of privatized companies was absolutely negative for different
reasons: excessive pricing, excessive profits, poor performance. Comparing salaries, it
was easy to notice that government water executives were less paid than the captains of
industry who had taken over the water companies. An increase of the rates, a decrease
of the quality of the services and a perception of the “high life” of the private water
managers made the consumers dislike this privatization.59
With the aim to ensure the interest of customers and to secure the environment, three
different independent bodies were created in order to regulate the activities of the water
and sewerage companies: the National Rivers Authority, The Drinking Water
Inspectorate and the Ofwat. Their duties and powers were defined in the Water Act
54 Shaoul J. (1997), “A critical financial analysis of the performance of privatised industries: the case of the water
industry in England and Wales”, in Critical perspective accounting, 8, 479-505 55 National Research Council (2002) “Privatization of water service” 56 Ofwat, Defra (2006) “The development of the water industry in England and Wales” in
http://www.ofwat.gov.uk/publications/commissioned/rpt_com_devwatindust270106.pdf 57 Shaoul J. (1997), “A critical financial analysis of the performance of privatised industries: the case of the water
industry in England and Wales”, in Critical perspective accounting, 8, 479-505 58 Ofwat, Defra (2006) “The development of the water industry in England and Wales” in
http://www.ofwat.gov.uk/publications/commissioned/rpt_com_devwatindust270106.pdf 59 The National Reasearch Council (2002) “Privatization of water services”
51
1991, which was, then, amended by the Water Industry Act 1999.
The National River Authority was then replaced by the Environment Agency. It is
responsible to the Secretary of State for Environment, Food and Rural Affairs (DEFRA)
for the provision of water resources, the protection and improvement of the environment
and the promotion of a sustainable development. Its aim is to create a better
environment, respecting and implementing the UK government’s policies and EU
directives. Its responsibilities are:
regulation of major industries,
flood and coastal risk management,
water quality and resources,
waste regulation,
climate change,
fisheries,
contaminated land,
conservation and ecology,
navigation.
With its efforts, and following its sustainability principle, the EA, tries to reduce climate
change and its consequences and tackles pollution in order to protect the environment
thereby the quality of water, land and air. To make it possible it works with
communities, businesses and other organizations to use resources wisely.
Since 1965 the water supply and sewerage was organized in a water abstraction
licensing system where the catchment based water authorities could adjudicate on their
own license application, it was said they were both poacher and gamekeeper. It means
that they could sue the polluters but never did so since the polluters were themselves.
That’s why, then, the Environment Agency has been instructed to assign abstraction
licensing, in order to conserve, redistribute and augment water resources. The Agency
analyses the demand of abstraction, including the scope for demand management and
the environmental impact, and then, if all the requirements are satisfied it decides if it is
appropriate to grant the license or not. The abstractors are charged on the basis of
recovering the water management costs and in proportion of the environment impact of
the abstraction. It has the power to amend or take away licenses whenever the company,
in abstracting water, causes damage to others or to the environment, even without
compensation in case of significant damage.

52
Furthermore, the Agency is responsible for controlling and monitoring the discharges,
and for collecting charges in respect of the permits to discharges granted to the
companies by itself.
The Drinking Water Inspectorate has the duty of ensuring that public water supplies in
England and Wales are safe and drinking water quality is acceptable to consumers and
respects the standards set down by the law. It is organized in three groups: the
operations group, the regulations group and the sciences and strategy group. Its
inspectors, from time to time, check the tests made on tap water by the water companies
and audit water companies laboratories. Whenever these tests fail the standards, their
inspectors use their powers to make them undertake every necessary improvement to
drinking water quality and check, then, that those improvements are reached on time.
The Chief Inspector of Drinking Water elected by the Secretary of State for
Environment, Food and Rural Affairs and Welsh Ministers but acts independently on
behalf of these authorities.
The Ofwat is (Office of Water Services) the economic regulator of water industry; it is
independent of government and water companies, even though it is directly accountable
to the British Parliament and the Welsh Government. It is responsible for protecting the
customers’ interests making sure that companies provide to consumers a good quality
service at a fair price, for ensuring that companies are profitable and efficient in such a
way to be able to finance their own activities (by securing a reasonable rate of return on
their capital) and making sure that those activities are properly carried out. In order to
realize these tasks, it keeps bills for consumers as low as possible setting price limits, it
monitors and compares the services the companies provide, it examines the companies’
costs and investments and encourages competition when it gives advantages to the
customers.
It works with several organizations of which: the Environment Agency, DEFRA, the
Welsh Government, the Drinking Water Inspectorate, the Consumer Council for Water
(which represents the interests of consumers in the water industry and deals with
complaints), the Natural England on environmental issues in England (a Non-
Departmental Public Body under the sponsorship of the Defra which has to ensure that
England’s natural environment is protected and improved) and the Natural Resource
Wales on environmental issues and water abstraction regulation in Wales. Ofwat’s
regulatory mechanism and policies are explained later.

53
2.2.1 The positive effects of privatization
Starting from the clients’ side, they were given the possibility to choose between being
metered or unmetered. Metering allowed them to save some money. According to the
European Directives, metering was a great tool to save water as well, since the less you
consume the less you pay. So the wide spread of metered water service was able to let
companies meeting environmental objectives. Since privatization, more attention was
given to the demand management as it was cheaper compared to, for example, resource
reinforcement (National Rivers Authority 1995), and metering was one of its tools.
The leakage control has always been an issue and with the drought in 1995, the concern
increased considerably. During those droughts, companies were likely to impose
restraints to consumers, limiting the use of water, putting in place hosepipe bans.
Therefore, Ofwat introduced the obligation for companies to compensate consumers to
potential interruptions in services and set leakage targets. Those targets generated a
significant improvement: leakage levels rose from 1992-93 to 1995 of about 6%
(National Audit Office 2000) and then fell from 31% of the 16,598 Ml/d put into supply
in 1994-95 to 22% of the 15,058 Ml/d put into supply in 1999/2000 (Ofwat 1996/97 -
1998/99).
According to Ofwat, after privatization, there has been a high increase in investments of
about £55bn in the 15 years after privatization, meaning an average of $3.7bn per year,
compared with an average figure of £2bn per year during 1980.60
This was partly due to
the forced achievement of higher quality standards of drinking water, beaches
conditions but also treatment of wastewater, established by the European directives
which required an averaging investment of £0.6bn per year since 1990.61
Thanks to the government’s injection and to the debts written off, the finance became
available to pay for the necessary investments. In addition, the government allowed
companies to increase their prices, which the Water Authorities weren’t able to do, and
freed them from the borrowing limits the state-owned companies had to comply with.
A positive side of the privatization was certainly the transparency resulting from the
dispositions established by the regulators. Indeed, a lot of data began to be published
and made available for the public so that companies’ trends and behavior could have
60 OFWAT (September 2005), “Financial performance and expenditure of the water companies in England and Wales
2004-2005 report.”, p.47, in http://www.ofwat.gov.uk/regulating/reporting/rpt_fpr2004-05_fpe.pdf, Figures at 2004-
05 prices. 61 Hall D., Lobina E. (2007), “From a private past to a public future? - the problems of water in England and Wales”,

54
been monitored. Most of these data are posted by the Ofwat in its annual reports and
statistics, available in its website.
Establishing the economic regulator, authorities weren’t poachers and gamekeepers
anymore, since Ofwat’s duty was to monitor them. Nevertheless, this brought to an
improvement of the environment conditions.62
Since privatization, the industry succeeded in reaching some objectives:
the number of properties at risk of sewer flooding fell by 75%, thanks to a more
sustainable use of water by consumers,
the number of properties experiencing low pressure dropped by almost 99%,
an achievement of 98.6% compliance with the E.U. standards in regard of the
bathing water and a 99.6% in regard of quality drinking water,
operating costs declined and account for around 35% of the average household
bill.63
2.2.2 The negative effects of privatization
First of all, privatization was certainly quite expensive for the government, which
besides the fact that wrote off the debts and conferred the “green dowry”, it gave the
companies £240m for restructuring the industry for privatization and £131m for the sale
itself (National Audit Office 1992). Considering that the sale yielded £5.25bn, the
government lost £1.6bn.64
A study from J. Shaoul explained companies’ performance after privatization using the
value added. The value added, which can be calculated subtracting the cost of producing
from the sales revenues, is a measure of cash earned by the firm as a result of its labor
conversion process, hence, it can explain if a company does generate cash or not, from
which activities (operating or non-operating) the cash flow is absorbed or produced,
how the company is financing any cash deficit or how it is using any cash surplus and
finally, the quality of the firm’s profits.65
in http://gala.gre.ac.uk/2946/1/PSIRU_Report_9757_2008-02-W-UK.pdf 62 David A. Howart “Provatization - a help or an hindrance in managing water demand?” in
http://opensiuc.lib.siu.edu/cgi/viewcontent.cgi?article=1219&context=jcwre 63 http://www.ofwat.gov.uk/industryoverview/today/achieve 64 Ernst J. (1994), Whose utility? The social impact of public utility privatization and regulation in Britain, Open
University Press. 65 Ellis , J . & Williams , D . (1993), Corporate Strategy and Financial Analysis, London : Pitman Publishing

55
In his study he highlighted the fact that, primarily, the growth of the sale after
privatization wasn’t due to an increase of the consumption but, as we’ll see, was due to
an increase of the price. Indeed, as reported by Ofwat66
the volume of water delivered
and sewage collected declined since privatization. Then, he examined companies’ cost
structure and affirmed that external costs, which were represented by the electricity to
power the pumping stations and sewage treatment works, had doubled as the ratio of
purchases to sales, probably because of the shift to outsourcing, of more purchases or
the inability to reduce suppliers’ costs.
Then, observing how the value added was shared, he noticed that a low part of it was
given to the labor and this as a consequence of the employment reduction after
privatization.
Employment
One of the factors which has been stricken by privatization is the labor market. It has
been estimated that since 1990 it fell of 21.5%. From 1991 to 1997 the number of
employees dramatically decreased: from 46.436 to 37.379 and in some companies even
more.67
Employment dropped because some of the work was contracted out. As Odgen
reported is his “Transforming frameworks of accountability: the case of water
privatization” (1995), there was a policy commitment to use contractors where this was
able to lead to a better efficiency but also where there wasn’t a cost differential in order
to keep the numbers of employees as low as possible. Anyway, most of the times those
dismissals just caused a loss of expertise.
The workers category likely to be affected by potential job cuts was the one assigned on
leakage control, since it was acknowledged that it represented a hurdle to efficiency.68
Prices
The level of prices rose as a consequence of the mandatory increase on the amount of
the investments necessary to reach quality standards demanded firstly by the European
66 OFWAT (1995), “OFWAT 1994-95 Report on the cost of water delivered and sewerage collected” 67 Lobina E., Hall D. (2001), “UK Water Privatization - a briefing”, in
http://www.archives.gov.on.ca/en/e_records/walkerton/part2info/partieswithstanding/pdf/CUPE18UKwater.pdf 68 Howart D. A. (1999), “Privatization - A help or an hindrance in managing water demand?”, in
http://opensiuc.lib.siu.edu/cgi/viewcontent.cgi?article=1219&context=jcwre.

56
Union, then, by the U.K.
As shown in the figure 5, bills increased significantly but slowly from 1989 until 1999.
The main components of customers’ bills were operating costs, capital charges that are
the costs of improving and maintaining the assets, and operating profits (return on
capital to lenders and investors). As reported by Ofwat, while operating costs and
capital charges remained quite stable, a considerably increase occurred in regard of the
operating profits. This was a consequence of the increase of the capital programs and
the benefits of the increased efficiency.69
Bills, then, decreased from 1999 until 2003,
mostly because of negligible taxes, and then started to rise again as a consequence of an
increase in taxes and capital charges.70
Figure 5: Average household bills from 1989-2006 (2005-2006 prices)
Source: Ofwat 200671
Profits for management
Compared to government water executives’ salaries, those of the entrepreneurs who
bought the water companies were considerably higher.72
69 Ofwat “Final determinations 2005-06 charges” https://www.ofwat.gov.uk/pricereview/pr99/det_pr_fd99.pdf 70 Ofwat “Future water and sewerage 2005-2010 final determinations”
http://www.ofwat.gov.uk/pricereview/pr04/det_pr_fd04.pdf 71 Ofwat “Water and sewerage charge Report 2006-2007” http://www.ofwat.gov.uk/regulating/reporting/rpt_tar2006-
07.pdf 72 National Research Council (2002) “Privatization of water service” Washington, DC: National Academy Press.

57
Managements’ salaries were high since, most of the time, profits were distributed by
means of dividends instead of being reinvested. For example in 1995, South West Water
favored increasing dividends overheads’ remuneration rather than investing on the
necessary infrastructure developments. As reported in Lobina’s briefing in regard of UK
water privatization, directors could benefit from large fees, salaries and bonuses.73
Financing
Privatizing companies would have meant the companies to finance themselves from
investors such as in other private companies, where, usually, shareholders invest in the
enterprise (equity).74
But what they actually did, was to increase their debts. In fact,
their gearing after privatization, rose to 60%.75
The interests they used to pay were
really low, the debt was, usually, granted from the European Investment Bank (a public
sector bank owned by the E.U. able to lend at a very good rates). So companies
preferred borrow to finance their investments in such a way to use, then, their profits
from higher prices to pay dividends to their shareholders.
Cost of capital
Ofwat reported that the cost of equity was about 5%-7% while the cost of government
bonds was about 2%-4%, which justifies the companies’ choice to borrow.76
Capital maintenance
As reported by Ofwat the amount spent on the water system maintenance after
privatization was higher than before but still really low, which is objectionable seen the
poor conditions of the network. From Ofwat’s report emerges that, after privatization,
companies’ provisions for renewals increased initially but, then, started to decrease from
1991.77
73 Lobina E., Hall D. (2001), “UK Water Privatization - a briefing”, in
http://www.archives.gov.on.ca/en/e_records/walkerton/part2info/partieswithstanding/pdf/CUPE18UKwater.pdf 74 Hall D., Lobina E. (2007), “From a private past to a public future? - the problems of water in England and Wales”,
in http://gala.gre.ac.uk/2946/1/PSIRU_Report_9757_2008-02-W-UK.pdf 75 OFWAT (September 2005), “Financial performance and expenditure of the water companies in England and Wales
2004-2005 report.” , p.47., in http://www.ofwat.gov.uk/regulating/reporting/rpt_fpr2004-05_fpe.pdf 76 OFWAT (1991), “Cost of Capital: a consultation paper Volume 1” 77 OWAT (1995), “Report on the financial performance and capital investment of the water companies in England and

58
Customers’ relationship
With an increase of the price and consequently an increase of the profits eventually
distributed as dividends, companies didn’t succeed in endearing to their customers.
Especially because their bills rose, they weren’t willing to accept a poor service.
Companies and clients’ interests were, certainly, different. While the companies wanted
to obtain high profits, clients required, naturally, a good quality service at a fair price.
Furthermore, following privatization a high number of households have been
disconnected as a result of period of drought or of the consumers’ inability to pay. As
reported in the “Disconnections Report ‘89-’99 in England and Wales” this phenomenon
largely spread during the first five years, when it reached 18,629 households
disconnected in 1994.78
After that year companies’ power to disconnect was curtailed,
people retained it to be a social threat. Therefore, companies started using the “pre-
payment meter” consisting in having a card by which consumers provided to the
payment and, if unfilled, they weren’t allowed to benefit from the service. Considered
as an illegal practice, it was, then, prohibited by the Water Act 1999.
I think that, after privatization, four Acts are worth to be mentioned:
1. The Water Act 1991
2. The Competition Act 1998
3. The Water Industry Act 1999 (which amended the Water Act 1991)
4. The Enterprise Act 2002.
Basically, the Water Act 1991 replaced the Water Act 1989 for what concerns the
powers and duties of the water and sewage companies and defined the power of the
General Director of the Water Services.
The Competition Act 1998 is the most important source of competition law which aim
is to harmonize the UK with the EU competition policy; indeed, Chapter I and II are
drawn up following the articles 81 and 82 of the Treaty of Amsterdam. In Chapter I it
declares illegal every agreement between undertakings, decisions by associations of
undertakings or concerted practices that may have a damaging effect on competition
Wales” 78 Research Paper 98/117 “Water industry bill” page 54, in
http://www.publications.parliament.uk/pa/cm200102/cmhansrd/vo020212/text/20212w34.htm

59
that are, or are intended to, prevent, restrict or distort competition. In particular, when
these agreements:
− directly or indirectly fix purchase or selling prices or any other trading conditions;
− limit or control production, markets, technical development or investments;
− share markets or source of supply;
− apply dissimilar conditions to equivalent transactions with other trading parties,
thereby placing them at a competitive disadvantage;
− make the conclusion of contracts subject to acceptance by the other parties of
supplementary obligations which, by their nature or according to commercial usage,
have no connection with the subject of such contracts.
Chapter II defines dominant position and pursues every situation when an abuse of this
position occurs, meaning when a firm uses its power to affect trade within the United
Kingdom.
The Water Industry Act 1999 brought several changes. First of all, it removed the
possibility for companies to disconnect household customers for non-payment charges,
forbidding the use of “pre-payment cards” to cope with bills. It narrowed the
circumstances in which companies can compulsorily meter domestic customers and
ensured that they are able to charge customers according to the ratable value. This Act
then, allowed the Secretary of State to issue regulations in order to set requirements that
companies were supposed to consider in their schemes.
The Competition Act 1998 is completed with the Enterprise Act 2002. The latter gives
more independence to the competition authority (the OFT, Office of Fair Trading, a not-
for-profit and non-ministerial government department established with the Fair Trading
Act 1973, which aim is to monitor markets in such a way to ensure a fair competition
and to protect the consumers), reforms bankruptcy laws and tackles trading practices
that harm consumers. It prohibits mergers when they provoke a reduction of
competition in the UK market and sets a criminal offence for whoever dishonestly
engages in cartel agreements.

60
Besides the European Union, the Ofwat, the Drinking Water Inspectorate and the
Environment Agency, this sector is regulated by:
1. Defra (Department for Environment, Food and Agricultural Affairs),
2. The Competition Commission,
3. The Consumer Council for Water,
4. Natural England.
The Department for Environment, Food and Rural Affairs (Defra) is the UK
government department responsible for policy and regulations on environmental, food
and rural issues. Its principal task is to develop the national water policies and its main
objectives are securing a supply of water of a quality safe for drinking, ensuring a water
usage in a sustainable way and promoting social and economic policies.
Following the Competition Act 1998, the Competition Commission has the duty to
ensure a healthy competition between companies in the UK in order to preserve
consumers’ interests and economy. This independent public body has the task to
investigate into mergers and markets when it is required by other authorities, for
example the Office of Fair Trading. Therefore, it identifies the competition issues and
then remedies those problems.
Furthermore, it has the role of “court of appeal” for companies that resort against some
decisions taken by economic regulators regarding the five-yearly review of the K-
factors and infrastructure charge, interim adjustments of K and any modification to the
licenses.
The Consumer Council for Water is an independent of both water industry and
regulators body that represents water and sewerage consumers in England and Wales
and acts like an intermediary between customers and companies in order to protect their
interests.
Finally, the Natural England is the government’s advisor on natural environment. Its
purpose is to ensure a sustainable management of land and sea in order to maintain and
improve the quality of the environment.

61
2.3 Characteristics of the English and Welsh water industry today
This sector is characterized by a natural monopoly where companies can benefit from
economies of scale. In this case, supply by one firm involves lower costs than supply by
more than a firm.79
Therefore, lower costs allow enterprises to gain more profits and, if
there was no economic regulator (Ofwat), apply higher prices.
These monopolies consist in concessions by which companies can supply water and
sewerage services in their own area (see figure 6). The English and Welsh water
industry is formed by ten regional companies providing water and sewerage services,
nine regional companies providing water services only, five local companies providing
either water or sewerage services or both and eight water supply licensees offering
water services to large use costumers.
Each water and sewerage company has between 1.2 million and 8.5 million customers
while each regional water only company has between 2000 and 3.1 million clients.
Local companies have appointments to serve defined areas (of around 1700 customers)
and have the same powers and responsibilities as the regional water and sewerage and
water only companies.
Furthermore, there are other companies that have supply licensees by which they can
access an appointed water company’s supply system to deliver water and sewerage
services. They can compete with the appointed water companies to serve large
customers and are not regulated by Ofwat in setting their prices.
Finally, there are some private water companies which supply water usually in the rural
part of the country. They serve about 1% of the population of England and Wales and
are not regulated by Ofwat but supported by the Drinking Water Inspectorate which has
an advisory role.
79 Bishop M., Kay J., Mayer C. (1994), Privatization and economic performance. Oxford, UK: Oxford University
Press.

62
Figure 6: Water company boundaries
Source: Ofwat
Some of the water and sewerage companies have other interests, for example Severn
Trent plc has interests in Europe, America and Asia operating concessions for water,
waste water contract management and consultancy services.
Each company has the duty to publish information about their performance which will
be used by the economic regulator in its investigations. Therefore, they draw up a risk
and compliance statement every year in which they explain how they have complied
with their relevant statutory, licence and regulatory obligations, a report in which they
describe their performance related to some key indicators (referred to customers,
reliability and availability, environmental impact and financial) and an annual
regulatory account explaining their financial performance.
63
2.3.1 Competition
Competition in this sector takes place in two particular forms:
Comparative competition: Ofwat evaluates each company’s performance and then
compares them. Its comparisons concerns companies’ bills, service levels, quality
compliance, leakage, operational costs, capital expenditure, relative efficiency,
network activity and financial performance, and are realized also at an international
level. Those comparisons are used by the regulator in determining the price cap. So,
is an important regulatory tool which fosters companies in doing better.
Inset appointments: a new appointment gives the possibility to a limited company
to provide water and sewerage or just water services in a particular area instead of
the former provider. It has local monopoly for its services based on boundaries set
when it was appointed and has the same duties and responsibilities as the previous
one. Ofwat has the power, through the Water Industry Act, to release or modify the
licensed areas according to strict criteria (the large user criteria, the unserved
criteria and the consent criteria) and to determine disputes over supplies between
water undertakers. In 2011 there were 32 appointments awarded but forecasts
showed the number was likely to grow.
2.3.2 Customers’ bills
There are two options available for customers: unmetered service and metered service.
With the first one, consumers are charged a fixed amount each year depending on the
ratable value of their own property. With the metered service, instead, the amount
consumers pay depends on the amount they use. Nowadays, 40% of customers in
England and Wales have metered water (Ofwat).
Ofwat has the duty of monitoring and approving companies’ charges in order to check if
they respect the price limit it sets. Until Ofwat doesn’t evaluate that the charge schemes
drawn up by companies, aren’t in keeping with its principles and guidelines, customers
can’t be charged.
The economic pressure occurring in those years is making the affordability of water less
obvious. It has been estimated that households are more likely to experience water
affordability issues when they are on a low income and spend over 3% of their income

64
on water and sewerage bills. In England and Wales about 23% of households now spend
more than 3% of their income on water and sewerage bills. In 2011, households in the
lowest income group spent an average of around £310 per year which corresponds to
3.2% of their total expenditure, while the total expenditure for all households was 1.0%
and that for the households in the top income group was 0.5%.80
The consequence of
high bills is that those who aren’t able to pay for them stop doing so since, anyway, it is
illegal to cut their water off for non-payment.81
A non-payment provokes an increase of
the companies’ debt levels and eventually adds more charges in the bills of those who
pay. This is, obviously, a threat to sustainability since the whole sector depends on the
customers’ availability and willingness to pay their bills. As a result is strictly necessary
to establish a good relationship with consumers, setting the right price limit, spreading a
sustainable use of water among the community etc.
2.3.3 Prices
One of the Ofwat’s duties is to set price limits in order to preserve customers’ interests
and to make sure companies have enough money to meet their investment plans. As said
in regard of privatization, prices are set using the RPI+K formula. K factors are set
according to the companies’ long-term revenue requirements, the capital investment
required to meet the company’s statutory obligations, the operating expenditure
requirements including a judgment on potential operating and capital efficiencies, the
return on capital and tax requirements. It sets the maximum percentage whereby total
income can be increased for a basket of principal charges to all customers. Prices are
fixed according to the tariff basket calculation. The tariff basket consists in unmetered
and metered water, unmetered and metered sewerage and trade effluent. The tariff
basket formula is used to calculate the weighted average increase in individual tariffs
which, then, is compared to the overall price limit. Companies can modify the amount
of the individual charges as long as the total average change doesn’t exceed the overall
price limit. For example, a company can decide to charge more for an unmetered water
service than for a metered water service as long as the difference between them is
80 House of Commons (2013), “Water bills - are they affordable to all?” in
http://www.parliament.uk/business/publications/research/briefing-papers/SN06596/water-bills-are-they-affordable-to-
all 81 House of Commons (2013), “Water bills - are they affordable to all?” in
http://www.parliament.uk/business/publications/research/briefing-papers/SN06596/water-bills-are-they-affordable-to-

65
justified by a greater cost. This is called “tariff rebalancing” and it has been established
in order to ensure a fairness charging between metered and unmetered and to remedy to
the effect produced from the movement of a customer from an unmetered service to a
metered service in order to ensure the companies to not have a significant loss.
In setting the price limit, Ofwat considers the cost of capital in order to make the
companies able to access finance. The difficulty encountered in doing so is that a too
high amount would ensure access to finance but would make excess profits, while with
a too low amount companies wouldn’t be able to gather the financial means necessary to
cope with the investments needed. Therefore, Ofwat sets a cost of capital able to let the
efficient and well-managed companies earn a fair rate of return, contrarily, those who
fail in achieving efficiency targets will gain a lower rate of return.
Price limits are set every five years but companies can ask for a price limit change in
between price reviews as an interim determination or as a substantial effect
determination. In the first case, specific changes have led to lower revenue or higher
cost making necessary for companies the setting of a new price limit. These specific
changes are called “relevant changes of circumstances” and “notified items”, the latter
are set by Ofwat in the price review while the changes of circumstances are described in
the companies’ licence condition B. When a company apply for an interim
determination, the regulator make the materiality test by which it evaluates the changes
in costs, receipts, revenues or other changes given by the company and, if they are at
least equal to the 10% of the company’s turnover, the regulator modifies the price limits.
In the second case, the substantial effect determination, companies can ask for a price
change when an unforeseen circumstance substantially increases or decreases their costs
or revenues. As well as in the previous case, the regulator makes the material test, where
the changes are required to be at least equal to 20% of the company’s turnover, and
assesses if a prudent action by the company could have avoided the alteration. Once the
material hurdle is cleared, Ofwat establishes if the price adjustment is necessary.
Ofwat can use both interim determination and substantial effect determination, when it
believes that a change in the price limits could benefit the customers.
all

66
In setting the price limit of 2010-2015, Ofwat adopted a future-oriented vision. In fact,
the process took account of the companies’ 25-years strategic direction statement and
business plan so that it was possible to identify the best pattern of investments over
time, to face more certainty regarding future activities and make the companies more
confident that future price limits will cover additional investments necessary after 2015.
The table below shows the price limits for each company for each year of the price
review period and the annual average and the five-year average for the industry as a
whole. At the industry level, over the five-year period, Ofwat’s determinations increase
price limits by an average of 0.5% a year. The annual price limit represents the
maximum amount by which a company can increase its overall prices in a particular
year.
Table 3: Price limits for 2010/11 to 2014/15 (excluding inflation)
Water and
sewerage
companies
2010/11
%
2011/12
%
2012/13
%
2013/14
%
2014/15
% Average
82
Anglian -0.7 0.0 1.4 1.1 0.9 0.5
Dŵr Cymru -1.3 -0.4 -0.4 -0.6 -0.8 -0.8
Northumbrian 5.0 3.8 0.9 0.0 -1.0 1.7
Severn Trent -1.0 0.0 0.0 -1.0 1.7 -0.6
South West 1.1 3.4 2.5 1.3 1.1 1.9
Southern -0.7 0.0 3.6 3.3 -0.1 1.2
Thames 0.2 0.4 4.6 0.4 1.4 1.4
United Utilities -4.3 -0.2 0.6 1.0 1.2 -0.4
Wessex 0.3 0.3 1.9 1.9 0.5 1.2
Yorkshire -1.2 -1.3 1.4 1.8 1.6 0.5
Average
(weighted) -0.8 0.2 1.7 0.7 0.5 0.5
Source: Ofwat
Ofwat allows companies to increase their charges for customers, considering the price
limit and the inflation. For example Thames Water had been allowed, for 2011-12, to
increase its overall average charge for its household and non-household customers by
5.11%. This 5.11% comprises the price limit (0.4%) and the inflation (4.71%83
).84
Instead, Dŵr Cymru, which presented a negative price limit, had been allowed, for the
82 The average of the price limit is the geometric average of the annual price limits. 83 Inflation based on the Retail Price Index for the year from November 2009 to November 2010 84 Ofwat, “Thames Water: household charges 2011-12” in
http://www.ofwat.gov.uk/consumerissues/chargesbills/prs_inf_tms_charges2011-12.pdf

67
year 2011-12 to increase its charges by 3.41%. Ofwat considered the inflation of 4.71%
less the negative price limit of -1.3%.85
Its approach for 2010-2015 price review followed these steps:
1. Regulatory Capital Value (RCV)86
x
2. The allowed return
+
3. Operating expenditure plus depreciation for an efficient company
+/-
4. Performance related adjustments
+
5. Taxation
=
6. Ofwat allowed revenues
7. Overall price limit, K.
2.3.4 Companies’ characteristics
The following table has the aim of clarifying the ten water and sewerage companies’
dimensions, in term of employees and consumers, km of water and sewer.
Table 4: Companies’ dimensions
Companies Employees at 31
March 2013
Consumers Km of water Km of
sewer
Anglian 4,000 6,000,000 37.876 75.931
Thames 4,500 15,000,000 32.000 67.000
Dwr Cymr 2,340 1,310,000 27.000 19.000
Northumbrian 2,933 4,500,000 25.545 29.724
Severn Trent 5,631 8,000,000 46.000 92.000
South West 1,300 1,600,000 15.101 14.800
Southern 2,092 1,000,000 13.700 40.000
United Utilities 5,300 7,000,000 42.000 76.000
Wessex 2,000 1,300,000 11.509 30.000
Yorkshire 2,500 1,900,000 31.000 20.000
85 https://www.ofwat.gov.uk/consumerissues/chargesbills/prs_inf_wsh_charges2011-12.pdf 86 The value of the regulated business which earns a return on investment. It represents the initial market value (200
day average), including debt, plus subsequent net new capital expenditure as assumed at the time of initial price setting. It includes new obligations imposed since 1989. The capital value is calculated using Ofwat’s methodology
(for example, after current cost depreciation and infrastructure renewals accrual).

68
Thames water is the company who serves the highest number of consumers, indeed it
runs the business in London and surroundings area which are really populated. Besides
Thames water, there are Anglian, Severn Trent and United Utilities with an average of
7.000.000 consumers served. Basically, we can define them as the biggest water
companies in England and Wales.
Turnover
As shown in the figure 7, turnover for the ten water and sewerage companies for the last
three years presents an increasing trend.
Figure 7: Turnover 2010/11, 2011/12, 2012/13
Source: companies’ reports
Basically, this growth can be realized by an increase in prices or an increase in
consumption. Considering that the companies’ volume of business between these years
remained more or less at the same level87
, this increase has been the result of a more
tolerant price formula. Indeed, the price limits set by Ofwat, reported in the table 3, for
the 2010-2015 follow an increasing trend until the year 2012/2013 and then a
diminishing until the 2014/2015. Furthermore, the occurrence of an increase of the UK
87 Water UK, Excel spreadsheet “Volume measures water, wastewater” in http://www.water.org.uk/home/resources-
and-links/uk-water-industry/about/2013-datashare
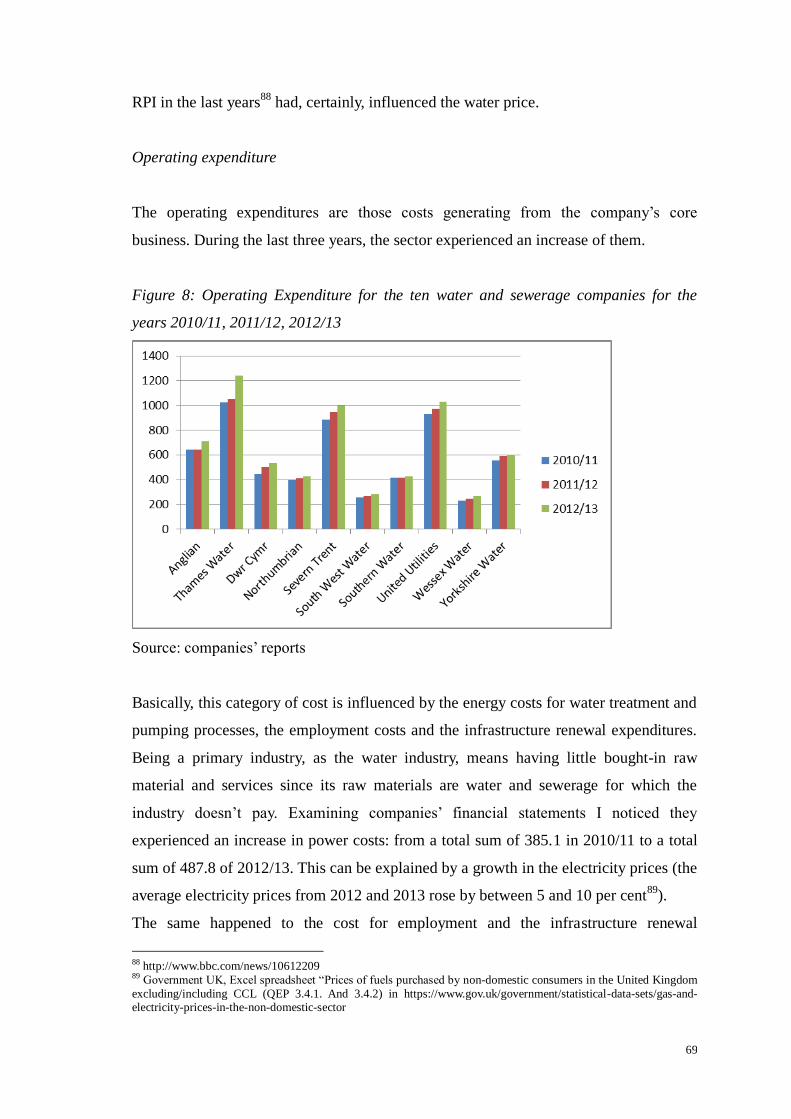
69
RPI in the last years88
had, certainly, influenced the water price.
Operating expenditure
The operating expenditures are those costs generating from the company’s core
business. During the last three years, the sector experienced an increase of them.
Figure 8: Operating Expenditure for the ten water and sewerage companies for the
years 2010/11, 2011/12, 2012/13
Source: companies’ reports
Basically, this category of cost is influenced by the energy costs for water treatment and
pumping processes, the employment costs and the infrastructure renewal expenditures.
Being a primary industry, as the water industry, means having little bought-in raw
material and services since its raw materials are water and sewerage for which the
industry doesn’t pay. Examining companies’ financial statements I noticed they
experienced an increase in power costs: from a total sum of 385.1 in 2010/11 to a total
sum of 487.8 of 2012/13. This can be explained by a growth in the electricity prices (the
average electricity prices from 2012 and 2013 rose by between 5 and 10 per cent89
).
The same happened to the cost for employment and the infrastructure renewal
88 http://www.bbc.com/news/10612209 89 Government UK, Excel spreadsheet “Prices of fuels purchased by non-domestic consumers in the United Kingdom
excluding/including CCL (QEP 3.4.1. And 3.4.2) in https://www.gov.uk/government/statistical-data-sets/gas-and-electricity-prices-in-the-non-domestic-sector
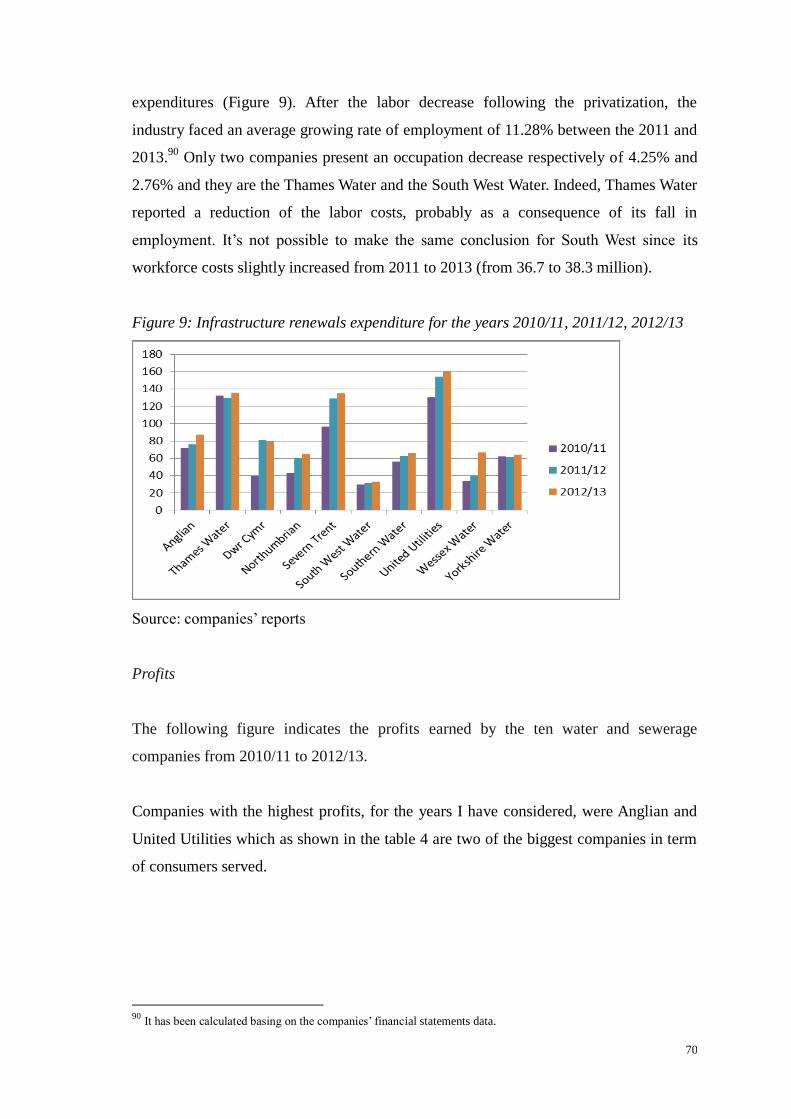
70
expenditures (Figure 9). After the labor decrease following the privatization, the
industry faced an average growing rate of employment of 11.28% between the 2011 and
2013.90
Only two companies present an occupation decrease respectively of 4.25% and
2.76% and they are the Thames Water and the South West Water. Indeed, Thames Water
reported a reduction of the labor costs, probably as a consequence of its fall in
employment. It’s not possible to make the same conclusion for South West since its
workforce costs slightly increased from 2011 to 2013 (from 36.7 to 38.3 million).
Figure 9: Infrastructure renewals expenditure for the years 2010/11, 2011/12, 2012/13
Source: companies’ reports
Profits
The following figure indicates the profits earned by the ten water and sewerage
companies from 2010/11 to 2012/13.
Companies with the highest profits, for the years I have considered, were Anglian and
United Utilities which as shown in the table 4 are two of the biggest companies in term
of consumers served.
90
It has been calculated basing on the companies’ financial statements data.

71
Figure 10: Companies’ profits for the years 2010/11, 2011/12, 2012/13
Source: companies’ income statements
Companies don’t present losses except for Southern Water for the year 2010/11 and Dŵr
Cymru for the year 2011/12. In regard of Dŵr Cymru, this was due to financing costs
which amounted at £322.4 million, in particular the fair value losses on derivative
financial instruments which amounted at £137.6 million (£12.3 million for the year
2011). In this regard the company sustained a loss of £35.3 million (gain of £1.2 million
in 2011) on interest rate swaps and £102.3 million (gain of £11.1 million in 2011) on
index-linked swaps. In the company’s financial statement is explained the interest rate
swap losses were due to a fall in long-term swap rate, while the index-linked swap
losses were caused by a fall in the value of index-linked gilts and fluctuations in three-
months LIBOR91
.
Concerning Southern Water, its losses in the year 2010/11 was due to a payment of
£77.1m of dividends.
Consumers
The industry serves over 50 million household and non-household consumers in
England and Wales. Being a public service means that water should be available to
everyone, regardless to consumers’ income. Therefore, the price borne by consumers
should be relatively low and the quality offered to them, possibly high. In this case the
water demand is price-inelastic and seasonal; it reaches its peak in the summer when
91 London Interbank Offered Rate

72
raw water availability is at its lowest level.92
Consumers’ requirements have changed during these years, the introduction of markets
in utility sectors makes them expect to choose over the prices they pay and the services
they receive. Furthermore, their concern about the environment has grown that much
that they demand a more sustainable companies’ behavior that forcedly brings them to
sustain higher investments.
As said so far, companies’ relationship with clients is precious; hence, they need to fully
satisfy customers’ priorities for the sake of sustainability. Ofwat suggests three
approaches by which a great relationship can be reached. They consist in giving the
consumers the tools to be able to get the services they want, engage with them for
example by asking what are their necessities and protect them ensuring the delivering of
the service at a fair price.
Investments
The industry is capital intensive, characterized by fixed assets with strong lives such as
reservoirs, networks of water-mains and sewers etc. Several years of negligence before
privatization, have made those infrastructures in old and poor conditions. Therefore,
Ofwat allowed companies to invest more than £108bn in maintaining and improving
assets and services, which, by the way, also permits to follow the European Legislation
requirements. The latter, set so tough standards that expenses are expected to be
between £30 and £100bn.93
Analyzing companies’ reports is possible to identify their capital expenditure of the last
years. Capital expenditures are funds used by a company to acquire or upgrade physical
assets such as property, industrial buildings or equipment. This type of outlay is made
by companies to maintain or increase the scope of their operations. These expenditures
can cover investments aimed at improving water quality, upgrading water treatment
works, environmental improvements etc. I examined their gross capital expenditures
(which includes both maintenance and enhancement projects) and as shown in the figure
11, it’s in the last two years that companies started again to invest in maintenance, in
order to improve their service.
92 Bishop M., Kay J., Mayer C. (1994), Privatization and economic performance. Oxford, UK: Oxford University
Press. 93 Ofwat “Delivering sustainable water” in
http://www.ofwat.gov.uk/aboutofwat/reports/forwardprogrammes/rpt_fwd_20100303ofwatstrategy.pdf

73
Deepening the analysis in the last two years, the companies who spent more are the
Thames Water and the United Utilities, two of the biggest companies in England and
Wales, for dimensions and costumers served. Indeed United Utilities has 42.000 km of
water mains and 76.000 km of sewer, and around 7 million consumers, instead, Thames
Water supplies 15 million consumers (it serves the city of London and its surroundings).
The question mark could be the Severn Trent Water, which is also one of the biggest
companies, with 46.000 km of water mains and 92.000 km of sewer and around 8
million consumers. It presents capital expenditure of 405.3 million for the 2010/11,
498.8 million for the 2011/12 and 588.5 million for 2012/13, less than the Thames
Water and The United Utilities. The following figure shows the gross capital
expenditure trend for the ten water and sewerage companies for the last three years.
Figure 11: Gross Capital Expenditure for 2010/11, 2011/2012 and 2012/2013
Source: companies’ reports
Breaking the capital expenditure amount into two different figures, one for wastewater
and the other one for water, we can analyze how companies divided their expenditures.
First of all, the total capital expenditure for the 2010/11 was around 3.8 billion and was
distributed in 1.5 billion for water expenditure and 2.3 for wastewater expenditure; for
the year 2011/12 the total amount was approximately 4.4bn and was distributed in 1.8bn
for the water management and 2.6 for waste water; finally for the year 2012/13 a total
amount of 4.6bn was divided in 1.8 for water and 2.8 for wastewater.94
For wastewater the major amount of capital expenditure has been intended to: sludge
94 Data have been taken from the spreadsheet “explanatory variables and volume measures water and wastewater”
http://www.water.org.uk/home/resources-and-links/uk-water-industry/about/2013-datashare

74
(enhancement and base), maintaining the serviceability of infrastructure assets and of
sewage treatment works. The first one refers to all sludge treatments and disposal assets
and associated biogas treatments for all purposes, i.e. meeting new environmental
obligations, providing new capacity and maintaining existing assets, for both
infrastructure and non-infrastructure assets. Capital expenditure in maintaining the
serviceability of sewage treatment works includes any non-infrastructure investment
associated with sea outfalls and headworks.
Figure 12: Capital Expenditure Repartition of waste water for the years 2010/11,
2011/12, 2012/13.
Source: companies’ reports
Instead, for the water management, the capital expenditure has been intended mainly in
maintaining the serviceability of infrastructure and non-infrastructure assets,
respectively 476 million for the 2010/11, 598 million for 2011/12, 562 million for
2012/13 and 497 million for 2010/11, 615 million for 2011/12, 589 million for 2012/13.
Dividends
Examining companies’ annual reports I have gathered information about the amount of
dividends paid for the year 2010/2011, 2011/2012 and 2012/2013. The table below
shows the results.
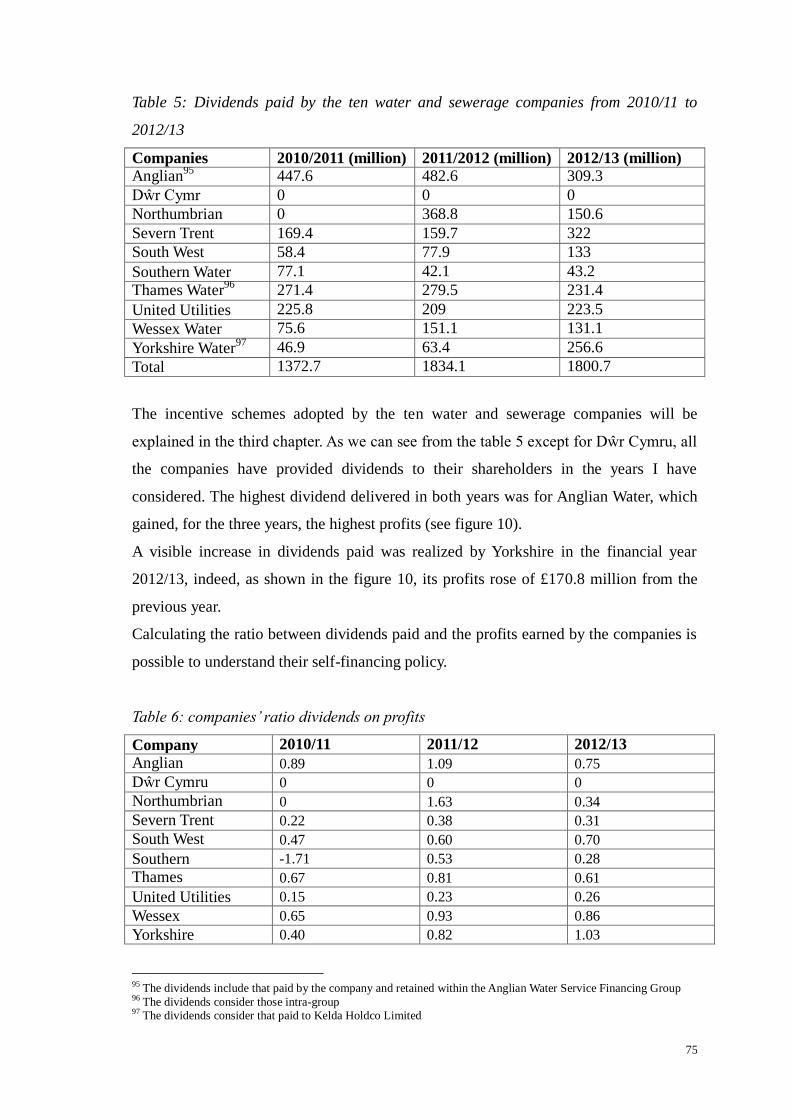
75
Table 5: Dividends paid by the ten water and sewerage companies from 2010/11 to
2012/13
Companies 2010/2011 (million) 2011/2012 (million) 2012/13 (million)
Anglian95
447.6 482.6 309.3
Dŵr Cymr 0 0 0
Northumbrian 0 368.8 150.6
Severn Trent 169.4 159.7 322
South West 58.4 77.9 133
Southern Water 77.1 42.1 43.2
Thames Water96
271.4 279.5 231.4
United Utilities 225.8 209 223.5
Wessex Water 75.6 151.1 131.1
Yorkshire Water97
46.9 63.4 256.6
Total 1372.7 1834.1 1800.7
The incentive schemes adopted by the ten water and sewerage companies will be
explained in the third chapter. As we can see from the table 5 except for Dŵr Cymru, all
the companies have provided dividends to their shareholders in the years I have
considered. The highest dividend delivered in both years was for Anglian Water, which
gained, for the three years, the highest profits (see figure 10).
A visible increase in dividends paid was realized by Yorkshire in the financial year
2012/13, indeed, as shown in the figure 10, its profits rose of £170.8 million from the
previous year.
Calculating the ratio between dividends paid and the profits earned by the companies is
possible to understand their self-financing policy.
Table 6: companies’ ratio dividends on profits
Company 2010/11 2011/12 2012/13
Anglian 0.89 1.09 0.75
Dŵr Cymru 0 0 0
Northumbrian 0 1.63 0.34
Severn Trent 0.22 0.38 0.31
South West 0.47 0.60 0.70
Southern -1.71 0.53 0.28
Thames 0.67 0.81 0.61
United Utilities 0.15 0.23 0.26
Wessex 0.65 0.93 0.86
Yorkshire 0.40 0.82 1.03
95 The dividends include that paid by the company and retained within the Anglian Water Service Financing Group 96 The dividends consider those intra-group 97 The dividends consider that paid to Kelda Holdco Limited

76
Except for Southern Water for the year 2010/11, Anglian and Northumbrian for the
financial year 2011/12 and Yorkshire for the year 2012/13, companies use to finance
themselves through the retaining of profits. The ratio for Southern Water results to be
negative as a consequence of a year of losses (see figure 10), £ (45.1) million; this
demonstrates that the company, albeit being at a loss, distributed dividends. In regard of
the Northumbrian company the ratio seems to be excessive especially for the year
2011/12; however, it must be considered that in the year 2010/11 the company didn’t
distribute any dividends. The following figure shows the trend in distributing dividends
in regard of the last three years. After a peak in the year 2011/12, companies slightly
reduced the amount of dividends distributed to their shareholders.
Figure 13: Companies’ trend in distributing dividends calculated according to the
payout ratio
Table 7: Comparison between investments and the previous ratio of the ten water and
sewerage companies
Company Investments (million) Payout
2010/11 2011/12 2012/13 2010/11 2011/12 2012/13
Anglian 291.7 407.3 496.5 0.89 1.09 0.75
Dŵr Cymru 242 262 313 0 0 0
Northumbrian 221.5 293.5 232.9 0 1.63 0.34
Severn Trent 405.3 498.8 588.5 0.22 0.38 0.31
South West 125.1 130.8 116.5 0.47 0.60 0.70
Southern 385.4 443.4 380 -1.71 0.53 0.28
Thames 1003 1056 963 0.67 0.81 0.61
United Utilities 608 680 787 0.15 0.23 0.26
Wessex 109 172.6 216.8 0.65 0.93 0.86
Yorkshire 300.3 404.3 385.7 0.40 0.82 1.03
77
It is perceivable from the table 7 that the companies which bear the highest investments,
Thames, United Utilities, Severn Trent and Anglian, use to finance themselves.
However, in particular to Anglian and Thames Water, they present a high ratio which
could mean that they prefer to distribute dividends, limiting their possibility of
investment.
Leakage
Leakage is the process by which water is lost, intentionally or accidentally, through
holes or defects of their containers. It depends on several factors such as operational
strategies, network characteristics, climate, asset conditions and customer base
composition. Compared to leakage around 1994-1995, the industry has succeeded in
dwindling it and it is now around 35% lower than before.98
This also thanks to the
introduction of the economic level of leakage. Ofwat still requires companies to operate
at a sustainable economic level of leakage, which is that level of leakage that gives
consumers the best value for money. It is the point at which the cost of reducing leakage
is equal to the benefit gained from leakage reductions. It is an approach which gives
important benefits such as a reduction of costs for consumers, more water available so
less need to build new water resources and of course less risks of interruption of water
supply.
Companies Governance
I have observed companies’ group structure and came to the conclusion that: two water
and sewerage companies out of ten are owned by private equity fund (Anglian and
Thames Water), four out of ten are listed, or have the parent company listed, in the
London Stock Exchange (Severn Trent, South West, United Utilities and
Northumbrian), Dŵr Cymru’s parent company (Glas Cymru) is a company limited by
guarantee and finally, the remaining companies are owned by infrastructure, investment
and pension funds. Now, in order to run the business efficiently and ensure a good
quality service and transparency in doing so, especially in regard of the listed
companies, in 2013, the English economic regulator (Ofwat) set few principles
98 http://www.ofwat.gov.uk/sustainability/waterresources/leakage/

78
addressed to the water and sewerage companies, representing the minimum standard for
board leadership, transparency and governance that those companies shall apply to.
Implementing the following principles should allow companies to work in a more
sustainable way.
In order to act in a transparent way companies should:
− ensure the open access to their information and comply with the standards set out in
the Disclosure and Transparency Rules;
− act as if they are a separate public listed company with the Board fully focused on
the company’s obligations;
− establish a Board significantly independent and endowed with the necessary skills,
experiences, independence and knowledge of the company;
− set a Chair independent of management and investors;
− state Board committees operating at the regulated company level and an audit and
remuneration committee formed for the majority by independent members and
finally,
− explain the group structure in a way that is easy to understand. 99
Companies’ compliance with it will be explained in the next chapter.
2.4 Availability of water in UK
As said in the first chapter, Southern Europe is more likely to experience droughts and
consequently water shortage periods but, seen the last events, we can definitely say this
is not a rule. In 2010 and 2011 UK suffered dry winters which have left reservoirs,
aquifers and rivers below normal levels.
The country is more wet in the north and west and drier in the south and east, where the
migration, but also the displacement of industries from the northern part to the southern,
is already affecting the area.
The UK Environment Agency warned the country might face water shortages in the
next years if there’s no significant rainfall over the winter months. Indeed, it says UK
could experience a severe short term drought, like the one experienced in 1976, every
ten years considering also that the population in London is already water stressed and
that the South East of England is expected to grow by 23 per cent by 2035. UK
99 Ofwat “Board leadership, transparency and governance - principles” 2013

79
currently has 0.9% of the world’s population but only 0.3% of its renewable
freshwater.100
In its last report, where it analyzes the climate change effects in UK and
the possible scenarios, the Environment Agency forecasts a population growth by 9.6
million by 2030 of which 9.2 million in England and 0.4 million in Wales; it is also
foreseen a growing number of single household, which use more water per person.101
In
the latest UK Climate Projections (UKCP09), which provides climate changes
information about UK, for the 2050s, indicate that changes in summer temperatures may
be greatest in parts of Southern England (between 1.3 to 4.6°C with a median of 2.8°C)
and least in the North of England (between 1.1 to 3.9°C with a median of 2.8°C).
Instead, Wales’s summer temperatures may increase between 1.2°C to 4.1°C with a
median of 2.5°C.
Some figures on extreme weather in 2012:
− 7,950 properties flooded;
− 78 days of 2012 saw flooding ( 1 in 5 );
− 95 days were officially in drought ( 1 in 4 );
− A hosepipe ban affected over 20 million people.
In England and Wales, water is abstracted for almost half of the total amount taken from
freshwater (non-tidal waters) but return over 70% of this as treated effluent which
support river flows, unless it is discharged to the marine environment. 85% of water
abstracted comes from surface water but it depends on the region, for instance, the
South and East of England relies on groundwater resources, and on the use of water, for
example public water supply relies more on groundwater resources.
Water is abstracted for different uses such as spray irrigation, which in East Anglia
represents the 4% of the total for all uses. Here during the hottest days in summer a
major amount of water is used for this purpose (spray irrigation) than for public water
supply. We’ll see in the next chapter how the Environmental Agency manages the
abstraction licenses. This practice may have a negative impact on the environment
especially when water is over-abstracted, for the reasons seen before (it dries-out water
courses and wetlands, it sinks water table, it empties wells and causes the intrusion of
salt water from the sea which degrades groundwater...).
100 Ofwat “delivering sustainable water - Ofwat’s strategy”
http://www.ofwat.gov.uk/aboutofwat/reports/forwardprogrammes/rpt_fwd_20100303ofwatstrategy.pdf 101 Ofwat “delivering sustainable water - Ofwat’s strategy”
http://www.ofwat.gov.uk/aboutofwat/reports/forwardprogrammes/rpt_fwd_20100303ofwatstrategy.pdf

80
The nowadays situation in England is worrying: the country is water stressed (in some
regions more than in others) and in some places current levels of water abstraction are
already harming nature conservation sites or the ecological health of catchments.
2.5 Legislation of water sustainability
The Water Industry Act 2003 established another framework for abstractions licenses
and impoundments in order to improve the protection of environment. The Act
empowered the Environment Agency to cancel a water’s company abstraction licence
and re-allocate it to another company; increased the focus on water conservation,
imposing companies to conserve water and established the duty to develop and publish
water resources management and drought plans where, in the latter, the company reports
how it is supposed to deliver water in period of drought. In case a company applies for a
drought order or permit, the Act establishes that the Environment Agency may recover,
from a water undertaker, any expenses it incurs.
Sustainability is one of the topics of the Flood and Water Management Act 2010. It
requires the authorities (lead local flood authorities, district councils, internal drainage
boards and highway authorities) to adopt a sustainable behavior in exercising a flood or
coastal erosion risk management function. It also defines a sustainable drainage and
demands the Ministers for drainage systems in England and Wales to establish national
standard for the implementation of a sustainable drainage. A drainage system is a
structure which function is to receive and gather rainwater from buildings and roofs.
Basically, there are two types of drainage system: one collects sewage and water
separately, the other one collects it together and it is called combined sewage. In case of
heavy rain, combined systems can’t hold all of the storm water and sewer flooding
happens. That’s why it is necessary to implement a sustainable drainage, in order to
protect society and the environment.
Furthermore, the Flood and Water Management Act 2010 allowed undertakers to reduce
charges for whoever might have difficulties in paying full, making easier for companies
to offer lower tariffs to certain groups, and removed the automatic right to connect to
sewers.

81
The UK Government, besides adopting an environment-social-economic approach,
launched, in its “One future-different paths Framework” (2005), the implementation of
five principles concerning the sustainable development. These principles are generalized
and aspirational so that they can be applied across all areas of government. Indeed,
OFWAT shaped them to the water and sewerage sectors.
Figure 14: Sustainability Principles from Defra
Source: DEFRA
Here the OFWAT sustainability principles reported in “Water today, water tomorrow -
Ofwat and sustainability” (2009):
1. A safe and reliable water and sewerage service for consumers that minimizes the
impact on the environment now and in the future: companies should manage water
resource in a careful way while implementing their activities of supplying water
and removing sewage, always considering future implications.
2. Consumers continue to get a fair deal and receive a level of service that consistently
meets their needs: on the one hand the regulator continues to have an important role
in protecting consumers’ needs and in establishing fair prices, on the other hand
companies shall consider the wider benefits and costs experienced by consumers
while delivering proportionate and timely solutions.

82
3. Financially robust sectors that are able to meet consumers’ needs at a fair cost into
the future: companies need to be financially robust in order to deliver good services
and the regulator has to guarantee this, making sure they have right incentives to
put in place appropriate charges and to collect revenues stemming from them.
4. Companies that remain accountable to their consumers: they always need to respect
customers’ needs while planning and implementing their businesses; it’s Ofwat’s
task to monitor it, scrutinizing companies’ business plans and performance.
5. Using the best available information to support decision making: companies and the
regulator should improve their knowledge in order to, respectively, achieve their
outputs in different ways and deliver an improved regulatory framework.
UK Sustainability Indicators
An indicator is a device providing specific information on the state or condition of
something.
Water UK is an organization that represents all major UK water and wastewater service
suppliers at an International and European level which mission is to provide a positive
framework for the water industry to deal with government, regulators, stakeholder
organizations and the public. It developed a set of indicators to measure the UK water
industry progress towards the environmental sustain. In its report, “Sustainability
Indicators 2010-2011” it describes 17 indicators; they have been created according to
the five industry priorities agreed by Water UK in its vision for a sustainable water
industry, listed below.
Protect and promote public health
By ensuring the safety of drinking water, effective water treatment, waste management
and by promoting the importance of water in the nation’s health. Indicators:
− Drinking Water, measure: compliance with Drinking Water standards;
− Incidents of sewer flooding, measure: properties actually affected by sewer
flooding;
− Reported accidents, measure: major/fatal accidents to employees arising whilst
83
undertaking water company related activities.
Provide high quality, reliable and value for money service
To satisfy customers’ needs. Indicators:
− Water supply interruptions, measure: properties with interruptions to supply (in
excess of 6 hours in duration);
− Water into supply, measure: total volume of water put into supply;
− Domestic water demand, measure: domestic water demand liters/person/day;
− Cash interest cover, measure: sector cash interest cover ratio.
Respond to climate change
By understanding and minimizing the effects of climate change on customers and on the
environment. Indicators:
− Total energy use, measure: total energy used (annual);
− Renewable energy generation, measure: renewable energy generated by water and
wastewater companies;
− Greenhouse Gas emissions, measure: total GHG (from water supply, wastewater
treatment, offices and transport)
Reduce our impacts on the environment
By minimizing the demands on scarce water resources and by enhancing the quality and
health of the water. Indicators:
− Sludge management, measure: total waste water sludge;
− Sludge use, measure: waste water sludge sent for recycling (agriculture, land,
reclamation, other);
− Non-sludge waste, measure: other waste recycled;
− Total loss of water from the Supply Network, measure: total leakage;
− Status of Sites of Special Scientific Interest (SSSIs), measure: SSSIs in target
condition.
84
Earn the trust of the community
By satisfying all the legal obligations and operating in a transparent manner and by
participating in the communities they serve. Indicators:
− Convictions for environmental and public health offences, measure: number of
convictions (sector total);
− Community investment, measure: total value of financial contributions to
community during reporting year.

85
3. The English and Welsh water utilities: an analysis of sustainable practices
and ownership
Debt and equity are two sources available to finance capital investments.
Companies can borrow money from the debt markets, issuing corporate bonds or
obtaining bank loans. For this borrow they pay interests, as the return to investors,
which aren’t based on the company’s performance. The interest rate is determined by
the general level of interest rates in the economy and the perceived riskiness of the
company. Debts generally have high certainty of recovery except in case of company
fails in honoring part of all of the debt. Investors have limited control rights except if
company defaults and, to evaluate this probability, they refer to the credit rating of the
company. The better the credit rating is the lower interest rate on debt the financiers will
require. Those interests are the primary cost of companies’ debt financing which
constitute a part of the return on investment that costumers pay in their bills.102
So why companies resort to the debt, as well as to the equity, to cope with their
investment needs?
The reason is simply to avoid charging customers of the entire amount of the investment
in the year following the investment embarked. If companies have to bear an investment
of £200 million that lasts 10 years and benefits 2 million customers, in case they fund it
directly without financing they would have to charge customers of £100 each, in the
present year. Since this is too expensive, companies can raise finance from investors and
spread the cost within 10 years of the asset life. So, investors pay £100 million for the
investment at the moment, and customers pay back in the following 10 years, with a
certain percentage of return.103
Equity investors provide finance in exchange for a share in the ownership of the
company, hence, a share in the profit the firm earns. Therefore, they obtain their return
through dividends which are related to the company’s performance. This kind of
investors bear the majority of the risk of the investment and, unlike the debt investors,
which are guaranteed a repayment of the debt, they will receive a lower dividend if the
investment, eventually, profits less than expected. Furthermore, for this reason, they use
102 Frontier Economic (2013), “ Investment in the water sector: the role of financing” in
http://www.water.org.uk/home/policy/publications/archive/finance/the-role-of-financing/rep-investment-in-the-water-
sector---the-role-of-financing-final-27-03-2013-stc.pdf 103 Frontier Economic (2013), “ Investment in the water sector: the role of financing” in
http://www.water.org.uk/home/policy/publications/archive/finance/the-role-of-financing/rep-investment-in-the-water-

86
to play an active role in the company’s management, for example through the
appointment of non-executive directors, and use to ask for a higher return than debt
investors.104
It’s company’s duty to establish the right proportion of equity and debt, according to its
own features, in such a way to ensure cost efficient financing, as well as an overall
financial structure that is resilient against adverse external shocks such as the credit
crisis. In setting this structure, companies compare the cost of debt to the cost of equity.
While the first one is easy to calculate, by looking at the interest rate companies pay on
their debt, the cost of equity is more complex. It is usually calculated using the Capital
Asset Pricing Model which estimates the return on the equity based on its risk. In order
to obtain equity investment from the capital market, companies need to offer at least a
return on equity commensurate with the potential risk of the business.105
CAPM formula106
:
The risk free rate of interest is the return available on an asset which has no risk, for
example the interest arising from government bonds; Beta represents the sensitivity of
the expected excess asset returns to the expected excess market returns and the equity
risk premium is the return over and above the risk free rate for taking risks and depends
on the riskiness of the equity.107
sector---the-role-of-financing-final-27-03-2013-stc.pdf 104 Frontier Economic (2013), “ Investment in the water sector: the role of financing”
http://www.water.org.uk/home/policy/publications/archive/finance/the-role-of-financing/rep-investment-in-the-water-
sector---the-role-of-financing-final-27-03-2013-stc.pdf 105 Frontier Economic (2013), “ Investment in the water sector: the role of financing”
http://www.water.org.uk/home/policy/publications/archive/finance/the-role-of-financing/rep-investment-in-the-water-
sector---the-role-of-financing-final-27-03-2013-stc.pdf 106 Brealey R., Allen F., Myers S., Sandri S. (2007) Principi di finanza aziendale 107 Frontier Economic (2013), “ Investment in the water sector: the role of financing”
http://www.water.org.uk/home/policy/publications/archive/finance/the-role-of-financing/rep-investment-in-the-water-
sector---the-role-of-financing-final-27-03-2013-stc.pdf

87
The cost of debt plus the cost of equity generates the cost of capital. It is calculated in
order to estimate the total cost borne by companies and it is used by Ofwat in setting
price limits.108
The formula used is the WACC (Weighted Average Cost of Capital):
WACC= Cost of debt x Gearing109
+ Cost of Equity x (1 - Gearing).110
In setting their financial structure, companies shall consider that on the one hand they
can save money resorting to the debt but on the other hand, the effect generated by the
switching from debt to equity is an higher cost of equity. This because the transition
from debt finance to equity, means less equity finance which implies that the risk related
to the equity is more concentrated in the small amount of equity. As a result, the savings
coming from a high debt might be nullified by an increase of the cost of equity.
However, in reality, due to some reasons, such as the tax treatment, the increase of cost
of equity may not completely offset the savings produced by the increased gearing (net
debt on total capital). The WACC should be as low as possible, hence, companies, in
establishing the financial structure, shall fix a level of gearing able to keep it low.111
In setting price limits, Ofwat considers the cost of capital calculated using the WACC.
In the price review 2009 the regulator set a weighted average cost of capital post-tax of
4.5%, determined with a gearing of 57.5%, a cost of equity post-tax of 7.1% and a cost
of debt of 3.6%. The cost of equity has been calculated considering a risk free rate of
2.0%, an equity beta of 0.9 and an equity risk premium of 5.4%. The cost of debt has
been calculated assuming a ratio of existing debt to new debt of 75:25.112
3.1 The empirical research
My research is divided into two sections and the aim is to analyze how companies
achieve their sustainable objectives and which are their results. Therefore, I have
108 Ofwat (2009), “Future water and sewerage charges 2010-2015: Final determinations” in
https://www.ofwat.gov.uk/pricereview/pr09phase3/det_pr09_finalfull.pdf 109 Gearing represents the percentage of company’s net debt of its total capital. Ofwat uses its regulatory capital value
as denominator 110 Frontier Economic (2013), “Investment in the water sector: the role of financing” http://www.water.org.uk/home/policy/publications/archive/finance/the-role-of-financing/rep-investment-in-the-water-
sector---the-role-of-financing-final-27-03-2013-stc.pdf pag. 20 111 Frontier Economic (2013), “Investment in the water sector: the role of financing” in
http://www.water.org.uk/home/policy/publications/archive/finance/the-role-of-financing/rep-investment-in-the-water-sector---the-role-of-financing-final-27-03-2013-stc.pdf 112 Ofwat (2009), “Future water and sewerage charges 2010-2015: Final determinations” in

88
examined their reports, focusing on the last three years (from 2011 to 2013). The data I
have used are found in companies’ balance sheets and income statements, having
regard, also, to the final comments written in the last part of those reports.
In the first section I have analyzed companies’ financial structure, including the ratio
between debt and equity and the resulting costs in order to evaluate how it influenced
customers’ bills, having regard, also, to the dividends they paid to their CEOs.
Furthermore, I have studied Ofwat’s system in setting the price and how it had foreseen
customers’ bills in the period for which the price limit is set (i.e. 2010-2015), deepening
the analysis on each company.
Then, basing on companies’ compliance with the corporate governance principles, I
have expressed an opinion in this regard, namely on their board composition, and tried
to find some best practices.
Since I think that, in order to run the business properly and supply a good quality
service to customers, companies should keep an eye on their employment policy, in the
last part of the first section, I have assessed the way they manage it.
The second section reports the achievements reached by companies in regard of
sustainable targets. I have considered, first of all, the expenditure on research and
development as I believe the creation of new solutions, to face water scarcity, comes
primarily from the involvement of firms in this department.
Then I have assessed companies’ goals in regard of indicators established by the
economic regulator (as the SIM, explained in details afterwards), in order to evaluate
their compliance with the European requirements.
Finally, I have done some research, both in companies’ websites and reports, concerning
the innovative solutions companies have found with the aim to promote water
conservation among the customers; we’ll see, indeed, the role acquired by the social
marketing. The last point I wanted to highlight was the customers’ satisfaction. The
sustainability of the sector, as I have already hinted, comes from their satisfaction,
therefore, I have used the data reported by the Consumer Council of Water in order to
describe where and who succeeded or failed in doing that.
https://www.ofwat.gov.uk/pricereview/pr09phase3/det_pr09_finalfull.pdf

89
3.1.1 Financial structure
Going through the most recent accounts of all ten water and sewerage companies in
England and Wales, I found that they are likely to borrow than to resort to equity. Only
three of them are listed in the London the stock exchange (Severn Trent, South West and
United Utilities) plus, actually, Northumbrian Water which parent company is listed,
and only two are private equity-owned (Thames Water and Anglian Water); but,
anyway, their borrowing is considerably high and this is explained by the advantage of
cheapness carried by the debt. Indeed, the industry presents an average debt to total
capital113
ratio of 73% in 2010/11, 75.9% in 2011/12 and 76.8% in 2012/13. They all
generally present really high ratio except for Yorkshire Water that had an average ratio
in the last three years of 55.88%. Its ratio grew from 54.20% to 57.73%, in the period
2010/11-2012/13, as a result of an increase of debt not offset by particular increases on
its equity portion.
Calculating the gearing ratio as the debt to equity, it appears really high, reaching a peak
of 859.70 in 2013 for the Wessex Water, while usually it gets to an average (assuming
the companies together) of 308-380.
The following table shows the total debt, interests and dividends borne by the
companies and the revenues gained during those three years.
Table 8: Net debt, revenue, interests and dividends
Source: companies’ financial statements
Among them, I have calculated they have gathered in 2010/11 almost 34 billion in total
net debt114
, 37bn in 2011/12 and almost 39bn in 2012/13. The figure 15 shows
companies’ net debt trend.
113 Debt plus equity 114 Calculated as total borrowing (current and non-current) less cash and cash deposits
Financial year Net debt (bn) Revenues (bn) Interests (bn) Dividends (bn)
2010/2011 33.70 9.39 1.85 1.37
2011/2012 36.73 9.83 2.03 1.83
2012/2013 38.75 10.32 1.84 1.80

90
Figure 15: Net debt average
Source: companies’ financial statements
For these borrowings they paid 1.8bn in 2010/2011, 2 billion in 2011/2012 and 1.8 in
the last year, of interests. The water industry’s total revenue in 2010/2011 was
approximately 9bn, in 2011/2012 almost 10bn and in the last year was 10.3bn. This
means that almost one fifth of the money spent by people on water bills in England and
Wales went to paying the interests on the companies’ debt. The industry presents a total
average cost of debt, calculated as the percentage of the financial charges to debt, for the
2013 of 4.75% which is not high and justifies the companies’ choice to recur to
liabilities.
If we add to the interests paid, the amount of dividends which, for the total industry was
1.37bn in 2010/11, 1.83bn in 2011/12 and 1.8bn in 2012/13, we can conclude that two-
fifths of the total revenue has been spent to paying the interests on the companies’ debts
or as dividends. The figure 16 shows the trend of interests and dividends paid by
companies from 2010/2011 to 2012/2013.

91
Figure 16: Industry’s total interests and dividends paid for the year 2010/11, 2011/12
and 2012/13
Source: companies’ financial statements
Money from bills is also intended to the salaries, bonuses and other benefits going to the
water companies’ CEOs. In 2013 I have calculated that their emoluments amounted at
8.899.153 million, the highest CEO paid was Sir Steve Mogford (United Utilities)
which reached 1.547.800 million in 2013 which compared, for example, to that of the
CEO of Anglian Water, Sir Peter Simpson in 2013 (£1.274.605 million) is not that
higher. Yet, compared to that of Sir Martin Baggs, £840.000 million, CEO of the
Thames Water, which turnover was even higher than that of United Utilities, Mogford’s
remuneration seems to be way higher. However, Thames’ profits for the year 2012/13
were lower than those of United Utilities (Thames: £150mln, United Utilities:
£296.9mln).
3.1.2 Corporate Governance
The system by which companies are directed and controlled highly influences the
supply service to customers, therefore is useful to analyze companies’ corporate
governance.
The following definition was reported in the first version of the Corporate Governance
Code (1992) but it is still valid to describe its meaning:
“Corporate governance is the system by which companies are directed and controlled.
Boards of directors are responsible for the governance of their companies. The

92
shareholders’ role in governance is to appoint the directors and the auditors and to
satisfy themselves that an appropriate governance structure is in place. The
responsibilities of the board include setting the company’s strategic aims, providing the
leadership to put them into effect, supervising the management of the business and
reporting to shareholders on their stewardship. The board’s actions are subject to laws,
regulations and the shareholders in general meeting.”
“The Code” establishes principles of good corporate governance and is addressed to
companies listed in the London Stock Exchange but private companies are encouraged
to comply with it as well. The Code adopted a “comply or explain” approach by which
companies have the duty to declare how they have complied with the Code and explain
where they have not applied it.115
For example I have noticed in Anglian Water’s report,
which is not a listed company, that it declared that it voluntarily complies with the Code
except for some provisions which its Board retains are not applicable. For example,
Robert Napier, defined as non-executive director, has served on the Anglian Water
Service Board for over 9 years undertaking different other roles. For the Code it is
necessary to determine whether a director is independent in character and judgment.
The company declared that, even though Robert Napier is working in the company for
over nine years undertaking several roles, it is satisfied that he remains independent in
judgment and character, specifying that, with his experience in different fields, he brings
a significant contribution to the Board which continues to be composed by the necessary
knowledge, skills and independence.116
I have introduced in the previous chapter that Ofwat set some guiding principles as well,
reported in its “Board leadership, transparency and governance - principles”. Basically,
those principles follow the Code and are not mandatory but recommended to be
respected in order to run the business properly. Furthermore, companies are subjected to
compliance with some obligations set under their licences, in particular the conditions F,
K and P. The condition F requires companies to have full control of the business, acting
as if they are separate public listed companies from the parent one, hence it is necessary
that they compose the Boards in such a way that they are able to act independently of
115 The Financial Reporting Council “The UK Corporate Governance Code” pag.4 116 Anglian Services Limited “Corporate governance compliance statement” 2013
http://www.anglianwater.co.uk/_assets/media/Corporate_Governance_Compliance_Statement_Nov_13.pdf

93
their parent companies. This is also in order to better face potential conflicts occurring
between the regulated company and those of the group companies. Condition K requires
the assurance of sufficient rights, assets and financial resources to enable a special
administrator to manage the affairs, business and property of the company in case of
special administration order. Finally condition P requires companies to ensure
themselves they are provided by their ultimate controller with all the information they
need to comply with their obligations; they are ensured that their controllers don’t held
any action causing the regulated company to breach any obligations under the Water Act
or their licence and finally to ensure there are no less than three independent non-
executive directors on the regulated company’s Board.117
The most comprehensive
principle in order to guarantee the legitimacy of the sector is the transparency: each
company is required to provide transparency and open reporting. It’s a Board’s duty to
establish the best way to meet this principle. All the water and sewage companies I have
examined provide all the necessary reports concerning their financial structure, their
corporate governance, their financial and non-financial performance and their
sustainable principles and achievements, those reports are available in their websites so
that they can be consulted anytime by the public.
Basically, the governance structure is formed by the following elements:
− the Board,
− the Chairman,
− the Committees and
− the External Auditor.
The Board consists in executive and non-executive directors. The difference between
them is that the second ones can’t participate to the management of the company, unlike
the others. The table below shows the composition of each English and Welsh water and
sewage company.
117 Ofwat (2013), “Board leadership, transparency and governance - principles” in
http://www.ofwat.gov.uk/regulating/gud_pro20140131leadershipregco.pdf

94
Table 9: Boards’ composition
Company N. of
directors
N. of
meetings
2013
N. of
women
N. of non-
executive
N. of
independent
Type of
owner
Anglian 8 12 1 3 3 Private
equity
Dŵr Cymr 10 12 2 7 6
Limited
by
guarantee
Northumbrian 12 6 2 8 4 Listed
Severn Trent 11 7 1 6 5 Listed
South West 7 11 2 3 3 Listed
Southern
Water 10 10 1 6 4
Infrastruct
ure and
pension
fund
Thames
Water 15 9 2 11 3
Private
equity
United
Utilities 8 8 2 5 5 Listed
Wessex Water 13 7 2 8 4 Infrastruct
ure fund
Yorkshire
Water 13 12 5 3 3
Infrastruct
ure and
investor
funds
Source: companies’ reports
Table 10: Percentages of women, non-executive directors and independent non-
executives on the total directors
Companies % of women % of non-executive % of independent
Anglian 12.5 37.5 37.5 Dŵr Cymr 20.0 70.0 60.0
Northumbrian 16.7 66.7 33.3 Severn Trent 9.1 54.5 45.5
South West 28.6 42.9 42.9
Southern Water 10.0 60.0 40.0
Thames Water 13.3 73.3 20.0
United Utilities 25.0 62.5 62.5
Wessex Water 15.4 61.5 30.8
Yorkshire Water 38.5 23.1 23.1
Source: companies’ reports
The number of meetings for the year 2012/13 seems to be satisfying, the Boards met

95
more or less once a month, this proves it is active and careful about the management of
the company. Furthermore, considering the sector, the importance of the resource they
manage, what it entails (the several laws they have to comply with) and the
sustainability issues related to it, I think a maximum of twelve meetings can be judged
as acceptable and not worrying. Just the Northumbrian company organized only six
meetings, figure that, by the way, can’t be considered unacceptable since it represents
the minimum number in order to define the Board as efficient.118
The board of big enterprises is generally composed by a range of eight to fifteen
persons.119
This is a feature that is worth to be considered since this number influences
the debate inside the Board; a high number of directors is more likely to provoke
conflicts. The enterprises taken into consideration present an average of 10/11 directors
but this characteristic must be considered with the dimension of the enterprise, for
example the limited number of directors in South West (7 directors) is justified by its
small size. According to this issue, Thames Water presents the highest number of
directors (15 directors), which compared to its narrowed dimension seems to be
excessive. It is directly owned by the Kemble Water Limited which is 100% per cent
owned by Kemble Water Holdings Limited which investors are pension funds and other
long-term institutional investors. Therefore, its large board composition may be justified
by its articulated ownership.
An important requirement to the Board is its diversity in terms of professional
experiences and cultural training, in order to better run the company. The Boards I
examined are all formed by people experts in utilities and environment; they’re
engineers, managers, accountants etc., with several years of experience in the water
sector. The company that I think is the most complete in this regard is Severn Trent. It
has in its Board experts in science, environment, health, finance, public and private
sector, marketing, strategy, international business and human resources which I believe
is an important presence in the Board as it knows how to better establish the
communication inside the team, motivate it, how to maintain a good work atmosphere,
manage conflicts etc. What is considered to be a best practice, further to the publication
of the Davie Report “Women on Boards” February 2011, is the presence of women in
118 Zattoni A. Assetti proprietari e corporate governance pag 278 119 Zattoni A. Assetti proprietari e corporate governance pag.269

96
the Board.120
As reported by Lord Davie of Abersoch, researches showed that a higher
proportion of women in Boards brings to higher performance121
; however, in the water
and sewage companies I have analyzed, there is a low number of women. Each Board
has maximum two women out of 10/13 persons, except for Yorkshire Water which has
in its Board five women out of fifteen directors, the highest number.
A delicate argument in regard of the composition of the Board is the independence of
the directors. The necessary characteristics set by the Code to be defined as independent
require the director to do not satisfy the following conditions:
“has been an employee of the company or group within the last five years;
has, or has had within the last three years, a material business relationship with the
company either directly, or as a partner, shareholder, director or senior employee of
a body that has such a relationship with the company;
has received or receives additional remuneration from the company apart from a
director’s fee, participates in the company’s share option or a performance-related
pay scheme, or is a member of the company’s pension scheme;
has close family ties with any of the company’s advisers, directors or senior
employees;
holds cross-directorships or has significant links with other directors through
involvement in other companies or bodies;
represents a significant shareholder; or
has served on the board for more than nine years from the date of their first
election.”122
The Code requires that within the Board the proportion of executives and non-
executives is balanced in order to avoid any potential abuse of position which can
damage the board’s decision taking. As we can see from the previous table (table 9),
except for Yorkshire Water, the proportion of the non-executive directors in the Boards
can be judged as acceptable. However, not every non-executive director is independent.
Deepening the analysis only to the four listed companies, including the one which
120 https://www.gov.uk/government/uploads/system/uploads/attachment_data/file/31480/11-745-women-on-
boards.pdf 121 McKinsey and Company (2007), “Women matter: gender diversity, a corporate performance driver” in
http://www.mckinsey.de/sites/mck_files/files/Women_Matter_1_brochure.pdf 122 The Financial Reporting Council “The UK Corporate Governance Code” pag 11-12

97
parent company is listed (Severn Trent, South West, United Utilities and Northumbrian),
the proportion of independent non-executives within the Board is quite low except for
United Utilities where they represent the majority, this constitutes a guarantee for its
shareholders. In Thames Water there are only three independent out of eleven non-
executive directors since the latter, following the shareholders’ agreement, are all
nominated and appointed by the shareholders of Kemble Water Holding Limited123
, so
they can’t be defined as independent.
Following the principle set by Ofwat, the Chairman should be independent as well. His
function is to lead the board and ensure its effectiveness, for this reason he should be
independent of management and investor, so that he/she can generate effective debate
and provide constructive challenges.124
Only five companies out of ten declared their
Chairman to be independent, of those five, two are listed in the London Stock Exchange
(Southern and South West). Concerning the other listed company, United Utilities, it is
indicated in its report that its Chairman is not considered to be independent under the
Code in view of his unique role in corporate governance, although it was considered
independent at the time of his initial appointment to the board.
The Committees are set in order to support the Board, analyzing and formulating
different solutions in regard of a particular issue. Each committee should be formed, for
the majority, by independent non-executive directors. The most diffuse are:
− executive committee,
− audit committee,
− remuneration committee and
− nomination committee.125
The latter three committees are also suggested by the Code.126
In the table below I have reported the Committees of the ten companies, according to
their reports.
123 The parent company 124 Ofwat “Board leadership, transparency and governance - principles” 2013 pag.14 125 Alessandro Zattoni “Assetti proprietari e corporate governance” pag 273 126 The Financial Reporting Council “The UK Corporate Governance Code”

98
Table 11: The Committees
Company Number of
Committees
Executive
Committee
Audit
Committee
Remuneration
Committee
Nomination
Committee
Anglian 1 no yes no127 no128
Dwr Cymr 5 no yes yes yes Northumbrian 3 no yes yes no
Severn Trent 5 yes yes yes yes South West 3 no yes yes yes
Southern Water 3 no yes yes no Thames Water 5 no yes yes yes129
United Utilities 6 no yes yes yes
Wessex Water 5 no yes yes yes
Yorkshire Water 4 yes no130 no131 no
Except for the nomination committee all the water and sewerage companies, but
Yorkshire, respect the best practices having the audit and remuneration committees.
I have noticed that the companies characterized by the presence of the nomination
committee are listed in the London stock exchange, having regard, then, of their
shareholders. The nomination committee has the duty to select new directors, establish
the number of the directors, evaluate its effectiveness and analyze the skills present in
the board and, if necessary, take some measures to establish the right balance of
competences.132
The Code establishes that a majority of members of this committee
should be independent, seen the delicacy of its tasks. Only Wessex Water’s nomination
committee sees in its inside just one independent non-executive plus the chief executive
director and two executives appointed by the parent company.
The executive committee has the duty of participating actively to the formulation and
implementation of the strategy and is generally composed of the managers, including
the CEO. Its creation may be dangerous since it is inclined to the generation of two
different classes of directors which can affect the opportunity of contribution to the
management of the enterprise for the non-executives.133
The executive committee of
Severn Trent is, indeed, formed by its executives; instead, that of Yorkshire is
completely formed by a team of its parent company, Kelda Group.
127 The salaries of directors and senior managers are considered by the remuneration committee of the Anglian Group 128 All the matters related to the appointment of directors, the removal of directors or the company secretary are considered by the full board of the Group 129 It’s the Compensation and HR Committee which has also a nominating function 130 The Audit Committee is Kelda’s (the parent company) 131 The Remuneration Committee is that of Kelda (the parent company) 132 Alessandro Zattoni “Assetti proprietari e corporate governance” pag. 272-273

99
The audit committee has the duty of monitoring the mechanisms of the internal and
external control.134
Therefore, it is necessary that it is formed by independent non-
executives; indeed, the Code establishes that there should be at least three independent
non-executive directors, two for the smaller companies. Analyzing those companies, I
noticed that all of them, except for Thames Water, follow the Code and established an
audit committee with a majority of independent non-executive directors. As said before,
Thames Water’s non-executives are appointed by its parent company.
The remuneration committee has the duty of determining the total amount of the
director’s remuneration and its composition, meaning the base salary, the annual bonus,
the incentive plans and the pension.135
As the audit and nomination committees, the
Code explains that, it is necessary that it is formed by at least three independent non-
executive directors. Looking at companies’ reports emerges that all of them comply with
this requirement except for the Thames Water, for the reasons explained before, and the
Wessex Water. Wessex Water’s remuneration committee is formed by two independent
non-executive directors and two executives appointed by the parent company.
Basically, the incentive plans are established in order to align manager’s interests to
those of the shareholders. The Code sets up that the level of remuneration should be
able to attract, retain and motivate directors with the necessary qualities to manage the
company in a successful way, but shouldn’t be excessively high, more than it is required
for this purpose. I have analyzed each company and found out that they contemplate a
short-term and long-term incentive, the latter in order to pursue future and sustainable
objectives. The annual bonuses are related to financial, non-financial performance and
individual performance. Some of the financial performances are the EBTDA, the
operating cash flow post interest and tax, the opex136
etc., while the non-financial
performance can be related to the capital delivery index, the energy use, the level of the
quality of the water, numbers of incidents etc. What I believe is worth it to be mentioned
in regard of annual bonus, is the percentage of the award obtained through the
achievement of personal objectives. Basically, I have calculated that the overall
percentage minimum was 10 and the maximum 20, except for three companies:
133 Alessandro Zattoni “Assetti proprietari e corporate governance” pag. 274 134 Alessandro Zattoni “Assetti proprietari e corporate governance” pag. 274 135 Alessandro Zattoni “Assetti proprietari e corporate governance” pag. 274 136 The opex (operating expenditure) is the appointed water companies’ day-to-day spending on running the services
such as staff costs and power.

100
Southern (40%), Thames (33,34%) and Yorkshire Water (50%). Examining their
remuneration committees I have noticed that only Southern Water has a committee
composed for the majority by independent non-executive directors.
Seen the importance of setting objectives in order to support the sector sustainability, I
think is important to analyze the formulation or not of environmental targets. The long
term incentive plans, as well as the annual bonus, are related to financial and non-
financial performance, according to the different enterprises they can last three or five
years, correspondingly to the AMP5. First of all, I have observed that only the Wessex
Water company didn’t realize a long term incentive plan, hence, it won’t be considered.
Now, let’s take into consideration only the listed companies. One of their targets is the
shareholders return which represents a measure of the performance of companies’
stocks and shares over time, and can also be compared to those of other companies.
For Severn Trent Water company, the target was the Ofwat’s return on regulatory capital
value (RoRCV), used by the regulator in setting the customer price in the Final
Determination. Reading the company’s report 2012/2013 I found out that it established
this measure because it believes it reflects the efficiency of earnings rather than simply
being an absolute measure of profit and it gives a strong alignment between the long
term financial and operational performance of the group and the reward delivered to
management. However, it explained that is a dangerous measure, hence, it is not
convenient to set it too high because managers could be encouraged to adopt
inappropriate behavior such as operational performance, which doesn’t deliver customer
value, or inadequate investment in company’s capital base.
Furthermore, what I have noticed is that, besides financial targets, companies, generally,
consider the SIM (Service Incentive Mechanism) set by Ofwat, the serviceability of
assets and the operating efficiency. The SIM aims to improve the level of service that
companies provide and is based on two measures: quantitative measure (number of
complaints and unwanted contacts received by the company) and qualitative measure
(quality of the experience reported by customers). The link between these measures and
targets and the managers’ remuneration means that companies are focused on their
customers and the quality of the service they deliver. This mechanism will be explained
afterwards.

101
Considered the sector, I think it could be defined as best practice to constitute a
committee taking care of all the issues related to the environment, the public health and
the quality of the drinking water. Of all the ten water and sewage companies, only three
have this kind of committee. The Dŵr Cymru has the Quality and Environment
Committee, which has the duty to advise the board on any issue regarding the
operational policy and practice in relation to public health and compliance with drinking
water and environment regulations; it is formed by three non-executive directors and
two executive directors.
The Southern Water has the Healthy and Safety Committee which task is to review and
advise on the company’s health and safety policy and the implementation and
compliance with the concerned regulation and it is formed by two independent non-
executive directors and two executive directors.
Finally, Thames Water set the Health, Safety and Environment Committee with the duty
of supporting the board in all matters related to the health, safety and environment
responsibilities the company has to satisfy. It consists in three non-executive directors,
one of whom is independent.
3.1.3 Costumers’ bills
In the UK customers’ bills are established according to the water and sewerage service
companies offer. While the first one is based on the amount of water the customer
consumes, if metered, or based on the ratable value of the property, if unmetered, the
sewage service customers pay for is divided into three categories:
1. Foul sewage: collecting and treating foul sewage;
2. Surface water drainage: collecting and treating the rainwater that drains from the
properties into the sewer;
3. Highway drainage: treating water that falls onto the public roads and drains into the
public sewers.
Customers’ bill is a delicate topic in this sector. The problem comes out because of the
service we’re talking about, meaning that, on the one hand water is a resource that
everybody should be able to benefit from and on the other hand it is impossible to
reduce significantly the price as otherwise companies wouldn’t earn any profit and
consequently wouldn’t be keen to work in such an efficient way and create a good

102
service for the costumers.
Preserving customers’ rights is an Ofwat’s prerogative and its principal tool is the price
setting. In the UK water industry, costumers aren’t able to express their preferences, by
choosing their suppliers, because of the monopoly of which companies may take
advantages. Therefore, they need to be represented, that’s why it has been constituted
the Consumer Council of Water.
Seen the importance of their satisfaction in order to pursue sustainable objectives,
Ofwat is required to understand them while establishing the water price limits. Thus, it
implemented a three-stage consumer consultation, where it worked with customers’
representatives. The information acquired during those steps by different stakeholders,
including companies, accompanied the process establishing the price review. Basically,
customers have been consulted firstly by companies in order to draw their long-term
strategic direction statements, secondly by the Consumer Council of Water in order to
advise companies in redacting their draft business plan proposals, finally, Ofwat
investigated on consumers’ views on their company’s proposals to, eventually, set the
final business plans, followed by the final price determination.137
With its 2010-2015 price review the regulator aimed to make the average household
bills falling of £3 at the end of 2015, the table 12 shows what will drive the changes in
bills.
Table 12: Bills changes’ drivers (2009-10 prices)
Average bill in 2009-10 343£ £
Past efficiency savings and outperformance 2
Maintaining base services of which: (26)
-changes in revenues (14)
-changes in operating costs 7
-changes in capital maintenance 1
-changes in impact of taxation (7)
-changes in cost of capital (13)
Maintaining and enhancing security of supplies to all customers 9
Impact of improvements in services of which: 21
-drinking water quality 4
-environmental improvements 15
-improvements in service performance 2
Scope for reduction through future efficiency improvements (9)
Average at 2014-15 340
Change from end of the last period 3
137 Owfat report “Future water and sewerage charges 2010-2015: final determination” 2009

103
Source: Ofwat
Albeit small decreases are offset by the necessity for companies to improve their
services and the environment quality and to cope with their operating costs, Ofwat,
foreseen a saving of 3£.
It sets an average price increase of 0.5% a year for the water and sewage companies,
which compared with that proposed by the companies (2.4%) is really low and
demonstrates that it puts all its efforts in meeting customers’ needs.
The research mentioned before conducted to a request from the customers, of bills able
to be as stable as possible. Therefore, Ofwat nullified the differences of price between
the years, due for example to different levels of investment, smoothing them out,
causing no impact on the overall customers’ bills by 2015 or on the financial return of
companies for the five-year period.138
I have examined Ofwat’s report regarding the price setting and noted that the overall
decrease of water bills (£3), from 2009/10 and 2015, is assigned to the sewerage. The
depth analysis is shown in the table 13, and the companies expected to produce a
reduction in bills in regard of both the water service and sewerage until the 2015, are:
Anglian (£-28), Dŵr Cymru (£-29), Severn Trent (£-13) and South West (£-6). Instead,
Thames and Yorkshire are expected to reduce their household bills only for the water
service, respectively of £-2, and £-4, with increases in the sewerage service, while
United Utilities and Wessex only for the sewerage service, £-12 and £-10, with increases
in the water service. Other companies like Northumbrian and Southern aren’t expected
to reduce their customers’ bills at all, indeed it is foreseen a total growth in their
household bills of £17 for Northumbrian (of which only £16 attributable to the water
service) and £20 for Southern Water.139
The table 13 shows the expected average household bills for the five-year period.
138 Owfat report “Future water and sewerage charges 2010-2015: final determination” 2009 139 Owfat report “Future water and sewerage charges 2010-2015: final determination” 2009

104
Table 13: Expected average household bills
Companies 2009-10 2014-15 Change
water sewerage water sewerage water sewerage total %
Anglian 172 216 159 202 -13 -15 -28 -7
Dŵr Cyrm 171 233 155 219 -16 -13 -29 -7
Northumbrian 147 167 163 168 16 1 17 6
Severn Trent 152 152 151 140 -1 -12 -13 -4
South West 207 283 205 278 -1 -5 -6 -1
Southern 127 246 138 255 11 9 20 5
Thames 183 121 180 133 -2 12 10 3
United
Utilities 169 205 172 192 3 -12 -9 -3
Wessex 202 210 224 200 22 -10 12 3
Yorkshire 154 178 149 183 -4 6 1 0
Average
(weighted) 165 181 165 178 0 -2 -3 -1
Source: Ofwat final price determination 2009
To sum up, the highest increase in household bills, foreseen for the 2015, would be at
Wessex for the water service (£22) and Thames for the sewerage service (£12) and the
highest decrease would be at Dŵr Cymru for the water service (£16) and Anglian for the
sewerage service (£15).140
The Thames increase might be justified for the high expense
on the investment planned to be implemented for the five-years plan (4.9bn141
), but we
can’t come to the same conclusion for Wessex Water which for the Asset Management
Plan for 2010-2015 (AMP5) planned a 1bn142
investment. South West Water and Dŵr
Cymru are expected to charge of a lower amount their customers in order to meet their
request since, it has been estimated by Ofwat, that those areas are characterized by low
income and high bills. Indeed, for those companies, the regulator used its power and
established lower prices than those proposed by the companies in their business
plans.143
Naturally, bills change from metered and unmetered customers. Differences in bills are
significant for the unmetered customers which in the period taken into consideration
(from 2010 to 2015) will experience an increase of 5% (from an overall average of 370
to 390). When a costumer switches from an unmetered to a metered payment method
the balance between the two different charge schemes, in a company’s tariff basket, has
140 Owfat report “Future water and sewerage charges 2010-2015: final determination” 2009 141 Thames’ reports and accounts 2013 142 Wessex Water reports and accounts 2013

105
to remain the same. The problem comes out because the optional metering unwinds the
cross-subsidy existing within the group of unmetered customers in an irregular way.
Therefore, when customers switch to a metered service, start to pay for what they
consume, meaning that, if they used to pay, even with low consumption, a high bill
because of the ratable value of their property, now they pay less. This implies that, since
it is not fair to make metered clients paying for the remaining unmetered customers,
unmetered charges have to increase.144
The three components of the customers’ bills are: operating costs (the costs related to
the core business), capital charges (costs for improving and maintaining the assets) and
the return on capital (comprehensive of interests, profits, dividends and tax).
In its price determination 2010-2015, Ofwat considered an increase of the operating
costs of 7% compared to those of 2009; this in order to deliver improved quality and
customer service standards and meet the increased demand for water caused by a
growth of the population, as explained in the previous chapter. The total operating
expenditure set by Ofwat for the 2010/11-2014/15 is £3.323m and the heaviest elements
foreseen to increase the total costs are: pensions, energy costs, business rate and bad
debt. As seen in the previous chapter, at least until 2013, companies have borne a high
energy amount of costs. In its final price determination 2009, Ofwat explained its
approach in establishing the energy costs which was that, if the company that demanded
the consideration of higher costs had procured effectively and its base year energy costs
were very low, it could have included a specific increase in their costs. Indeed, for some
companies, energy costs assumption was higher than others. Its approach is explained in
the final price determination 2009, by the fact that the regulator thinks that energy costs
can be managed with an effective usage and price management.
What I have found interesting is the bad debt, or customer debt. The bad debt is that part
of cost that the enterprise has to bear because a part of customers is unable to pay its
bills or, improbably, choose not to pay them. Therefore, companies need to provide a
percentage of their revenue against non-payment bills. Thus, Ofwat shall consider this
factor in its price setting and automatically charge, taking into account what companies
declare to sustain for bad debt, those who pay for those who don’t pay. I have calculated
143 Owfat report “Future water and sewerage charges 2010-2015: final determination” 2009 144 Owfat report “Future water and sewerage charges 2010-2015: final determination” 2009

106
that in 2012/13, the biggest companies, Anglian, Severn Trent, Thames and United
Utilities, spent an average of 31 million in bad debt. They can, anyway, try to mitigate
this problem adopting good practice and innovative approaches to debt, using
sophisticated debt management system. I have noticed in their reports that most of them
have segmented their customers in such a way to offer social tariffs to the vulnerable
ones, offering them lower bills according to their affordability measured on their
income. Anglian Water created the Anglian Water Assistance Fund with the aim of
supporting its vulnerable customers, it also put a strong focus on the collection of
customers debt and uses all the available recovery procedures to minimize bad debts
including legal redress. Instead, South West implemented different practices such as the
use of third party collection agencies, the external trace data to track down previous
occupiers, the continued use of property charges orders and it began to work with social
housing partners.
Ofwat’s approach, in regard of bad debt, is to spur companies in improving their
efficiency by not considering in the price limits the costs related to this debt. However,
it takes account of the economic climate and accepts a notified item145
for bad debt in
order to ensure that price limits reflect a fair balance of risk between companies and
their customers. A company which wishes to use the notified item has to demonstrate
that it has done its best in maximizing cost effective revenue collection.146
The part of customers’ bills intended to capital charges refers to a current depreciation
charge for above ground-assets and an infrastructure renewals charge for underground
assets. As the investments in improving the services grow, the depreciation charges
grow consequently. The infrastructure renewals charges are those charges borne for the
medium to long-term maintenance needs of underground pipes. They have been
calculated by Ofwat for the 2010-2015 price determination using a 15-year average of
infrastructure renewals expenditure (the actual expenditure incurred in the financial year
in maintaining the operating capability of the infrastructure assets through renewal) over
the period 2005-2020.147
The return on capital, which quantifies how well a company generates cash flows
145 A notified item is any item notified by Ofwat as not having been allowed for, either in full or in part, in its price
determination at the most recent price review. Though, it can be considered in interim determinations. 146 Owfat report “Future water and sewerage charges 2010-2015: final determination” 2009 147 Owfat report “Future water and sewerage charges 2010-2015: final determination” 2009
107
relative to the capital it has invested in the business, has been set considering that it is
expected to decrease, during the five-year period, in reflection of the cost of capital.148
Furthermore, customers can be charged more when its company supplier achieves good
performance targets. Indeed, Ofwat established an incentive mechanism by which a
company that scores well on the overall performance assessment (OPA149
) can charge its
customers slightly more, while those companies with poorer performance must charge
slightly less. The range of potential price adjustments is between +0.5% and -1.0% and
in the 2010-2015 price review the performance taken into consideration refers to the
five years 2004/05-2008/09.150
Another kind of incentive scheme put in place by Ofwat in the price review 2009 has
been the capital expenditure incentive scheme (CIS). This is a mechanism with the aim
of spurring companies in making challenging and efficient business plans before the
price limits are set and in overcoming the final price limit assumptions set by the
regulator. This scheme contemplates the recovery of the company’s actual capital
expenditure plus or minus an incentive allowance depending on its forecast of capital
expenditure and its actual expenditure in 2010-2015. Then, after price limits are set,
each company retains the incentives to outperform the Ofwat determinations, and the
companies which have made more challenging expenditure assumptions will have a
higher award. If a company chooses to spend more than what established in the final
determination, the regulator will consider the actual expenditure in the future regulatory
capital value.151
Finally, there’s a part in customers’ bills, the leakage allowance, that permit them to not
bear the costs stemming from the leak on the underground supply pipe into properties,
since they must be assigned to companies. If noticing higher bills, customers believe
there might be a leak, companies have to detect it and repair it, subtracting the excess
costs from the household bills.152
148 Owfat report “Future water and sewerage charges 2010-2015: final determination” 2009 149 The Overall Performance Assessment is a measure of performance which reflects the broad range of services
provided to customers. The key areas are: water supply (pressures, interruptions..), sewerage service (flooding
incidents and risk of flooding), customer service (quantitative and qualitative aspects) and environmental impact
(compliance with legislation). 150 Owfat report “Future water and sewerage charges 2010-2015: final determination” 2009 151 Owfat report “Future water and sewerage charges 2010-2015: final determination” 2009 152 Owfat report “Future water and sewerage charges 2010-2015: final determination” 2009

108
Table 14 shows Ofwat’ prediction for the customers’ water bills for the 2013-14
including 3% rate of inflation and the table 15 shows a comparison between customers’
bills for 2010/11 and for 2011/12.
Table 14: Customers’ water bills foreseen by Ofwat for 2013-14
Company Water
unmetered
Water
metered
Overall
average
water
Sewage
metered
Sewage
unmetered
Overall
average
sewage
Anglian £252 £174 £194 £291 £223 £240
Dwr Cymr £210 £131 £181 £293 £190 £253
Northumbrian £263 £187 £221 £209 £163 £195
Severn Trent £185 £164 £177 £169 £139 £158
South West £347 £194 £230 £514 £267 £319
Southern
Water £165 £155 £158 £319 £275 £291
Thames
Water £217 £187 £207 £153 £138 £147
United
Utilities £208 £167 £193 £224 £195 £213
Wessex Water £300 £210 £249 £260 £200 £229
Yorkshire
Water £192 £137 £167 £229 £166 £201
Source: Ofwat
Table 15: Customers’ bills comparison for 2010/2011 and 2011/2012
Company average water bill average sewerage bill
2010/11 2011/12 % increase 2010/11 2011/12 % increase
Anglian 168 177 5.36 215 221 2.79 Dwr Cymr 166 171 3.01 234 240 2.56
Northumbrian 187 204 9.10 170 183 7.65 Severn Trent 158 164 3.80 140 147 5.00
South West 207 217 4.83 286 300 4,90
Southern 132 142 7.58 242 255 5.37
Thames 191 196 2.62 115 123 6.96
United
Utilities 173 182 5.20 189 194 2.65
Wessex 203 218 7.39 206 210 1.94
Yorkshire 150 157 4.67 177 182 2.82
Source: Ofwat

109
3.1.4 Employment
I believe the level of service is inevitably linked with the company’s employment
policy. It is necessary that every employee knows the vision and the values of the
company, that he/she is motivated in doing his/her job and feels to be part of the
company. The enterprises have the duty to inform their workforce about the importance
of a good service supply delivered in a sustainable way. All of this is implemented with
the spreading of a good information quality through the diffusion of company’s
newspapers, intranet, briefings, meetings with trade unions etc., in such a way that the
company can tell its workforce about the performance achieved and the related news,
establishing a good relationship with its own employees, making them proud, hence
more excited, to work with the firm.
Analyzing the enterprises I have noted they use to run an annual engagement survey,
which gives the employees the opportunity to provide confidentially their honest views
on what it is like to work for the company, in order to understand them and solve any
potential issue. For example, Southern Water set a Business Involvement Group which
facilitates the consultation between managers and employees and consists in regularly
group meetings. Furthermore, reading the companies’ reports I have noticed that they’re
all involved in the promotion of equal opportunities, having no regard on the gender, the
ethnicity etc., and in the enhancement of health and safety programs in order to avoid
incidents and set a sound workplace.
Moreover, some companies provide the involvement of the workforce in some incentive
plans, like Wessex Water with its share option scheme of its indirect parent company
(YTL153
) and Severn Trent with its two employee share plans, one of which makes an
annual award of shares to employees based on performance against the KPIs154
.
Each water and sewage company, except for Northumbrian, Yorkshire and Southern
Water, adopted a whistleblowing policy. A whistleblowing occurs when an employee
reports suspected wrongdoing at work including when someone’s health and safety is in
danger, when there could be any potential damage to the environment, when there is
criminal offence, when the society is not complying with the law or when anyone is
covering up wrongdoing.155
This has a dual effect: it encourages employees to tell the
company when something inappropriate occurs, raising their concerns with the line
153 YTL Corporation Berhad, a Malaysian infrastructure conglomerate founded in 1995 154 Key Performance Indicators

110
management, and gives the opportunity to the directors to monitor, prevent or, in the
worst case, remedy to some misbehavior. It usually falls within the remit of the Audit
Committee, except for Severn Trent Water where is a prerogative of the Corporate
Responsibilities Committee.
3.2 The sustainable objective achievements
Research and development
I believe that the research and development in water utility companies, is really
important since leads to new technologies improving efficiency, hence, the quality of
the service offered, and reducing the environmental impact. Each company conducts
research and development programs; the figure 17 shows that, after a slight decrease in
R&D expenditure in 2012, companies started to invest in this field again.
Figure 17: R&D expenditure from 2011/2012 until 2012/2013 for the ten English and
Welsh water and sewage companies
Source: companies’ reports
I have examined companies’ reports and the results are described below.
The companies who spent the most in 2012/13 were Severn Trent (5.4 million) and
Thames Water (3.9 million). For Severn Trent part of its expenditure has been borne for
the implementation of a research conducted with the Loughborough University which
155 https://www.gov.uk/whistleblowing

111
aim was to develop a prototype leak detection system that reduces the time it takes to
detect a leak on plastic pipes, since they had just replaced their old metal pipes with
plastic ones so that detecting leak is more difficult. Thames Water expenditure, instead,
was aimed to the cost savings. Some of their innovation discoveries are listed below:
− the using of food industry technology to “de-water” sewage sludge;
− the setup of a “living filter” of baffles and plants at the outlet tower of a reservoir in
order to remove the threat of algal blooms of restricting the capacity of water
treatment work (increasing costs);
− the setup of phosphorus-recovery system in sewage works which can improve the
operation of the site and decrease the energy needed to pump sludge. Then, the
recovered phosphorus is transformed in a slow-release fertilizer which, if applied to
land, can help close the phosphorus loop and reduce the loss of this natural
resource.
Talking about energy savings, companies are implementing thermal hydrolysis process.
These processes are able to reduce energy consumption and carbon footprint: the
organic components are “split” and dissolved into the water and the compounds
resulting from the process (organic acids) are easily and quickly convertible in biogas in
the following digestive processes. The treaty sludge is, then, completely sterilized and
more easily and effectively to be dehydrated.156
Wessex Water, instead, implemented its innovation tools in order to identify their impact
on bathing waters and to improve the quality of water reducing pollution. In fact, their
last innovative technique on regard is the MST “microbial source tracking”: it is a form
of genetic fingerprint of the bacterial DNA which allows determining what animal the
bacteria might have come from so that it is possible to understand the source of
pollution and the contribution of their assets. It allows them to invest in works and
projects which can bring maximum improvements to the quality of water.
In 2013, Northumbrian water implemented an innovative project consisting in the use of
“ice pigging” to clean large mains faster than conventional methods. In this process an
ice slurry is pumped into a pipe and forced along inside in order to remove sediment and
other unwanted deposits to leave the pipe clean.
Summing up, each company is investing its resources in R&D, in order to improve their
156 https://www.swe.siemens.com/italy/web/IS/Acqua/Prodotti/Pages/Idrolisi%20Termica.aspx

112
service, hence, the quality of water and the environment, with the dual aim to better
satisfy customers and comply with the several laws, national and international.
Operational achievements
A measure used by Owfat to assess companies’ operational achievements, mentioned
before, is the Service Incentive Mechanism (SIM). The aim of the SIM is triple:
− reducing customer impact of service failure: boosting enterprises to quickly
minimize customer impact and keep them informed in order to reduce the
probability they are unsatisfied;
− getting things right the first time: the best way to deal with customers is to satisfy
their needs at the first contact, which is also the cheapest way;
− resolving complaints the first time: since it is really harsh to succeed at the first
time, clients are less dissatisfied if their complaints are dealt with quickly and
effectively. It improves company’s reputation with its consumers and reduces
failure demand.157
The SIM is also a financial incentive because affects companies’ price limit. Ofwat
based its price determination for 2015-2020 on the companies’ performance in the three
years between 2011-12 and 2013-14. Naturally, companies which perform better are
awarded with higher price limits, therefore, it also represents a competition tool. The
potential range of adjustment is +0.5% and -1.0%.158
In the table 16 I have considered
companies’ performance for the year 2011/12 and 2012/13, both quantitative and
qualitative performance. The quantitative performance considered are: all lines busy,
calls abandoned, unwanted telephone contacts, written complaints, escalated written
complaints and Consumer Council Water escalated complaints. The qualitative
performance consists in the annual survey score.
157 http://www.ofwat.gov.uk/regulating/aboutconsumers/sim/prs_web201211sim.pdf 158 http://www.ofwat.gov.uk/regulating/aboutconsumers/sim/prs_web201211sim.pdf

113
Table 16: SIM score
Company quantitative (out of 50) qualitative (out of 50) tot score (out of 100)
2011/12 2012/13 2011/12 2012/13 tot
2011/12 tot
2012/13 Anglian 34.34 38.41 44.24 46.13 78.58 84.54
Dwr Cymr 34.47 38.6 43.5 45.25 77.97 83.85 Northumbrian 36.5 36.9 41.63 43.25 78.13 80.15
Severn Trent 32.9 36.11 37 42 69.9 78.11 South West 28.44 31.65 38.5 38.88 66.94 70.53
Southern
Water 25.51 21.92 39.38 40.25 64.89 62.17
Thames Water 23.86 26.9 38.75 36 62.61 62.9
United
Utilities 27.31 35.08 39.75 42.88 67.06 77.96
Wessex Water 40.91 40.63 44.5 44.13 85.41 84.76
Yorkshire
Water 34.29 34.37 42.38 43.38 76.67 77.75
Source: Water UK159
As shown in the table 16 the best companies in these two years were Anglian, Dŵr
Cymr and Wessex Water, with significant improvements both in quantitative and
qualitative elements.
Another measure I think it is worth it to be considered, seen its importance in a
sustainable way, is the number of sewer flooding incidents shown in the table 17 with a
measure of customers: the water supply interruptions.
Table 17: Customer indicators 2011/12-2012/13
Company sewer flooding incidents water supply interruptions
(hours)
2011/12 2012/13 2011/12 2012/13 Anglian 101 204 0.24 0.14
Dwr Cymr 156 103 0.40 0.85 Northumbrian 313 1.196 0.18 0.12
Severn Trent 112 255 0.62 0.48 South West 31 118 0.62 0.27
Southern Water 158 243 0.40 0.30 Thames Water 355 549 0.21 0.22
United Utilities 500 906 0.42 0.30
Wessex Water 37 109 0.60 0.40
Yorkshire Water 75 155 0.32 0.17
Source: Companies’ performance reports
159 Service incentive mechanism spreadsheet http://www.water.org.uk/home/resources-and-links/uk-water-
industry/about/2013-datashare

114
As we can see, an important increase of the number of sewer flooding incidents
occurred for the Northumbrian Water. However, it is necessary to consider the storms
that the region served by these firms had to face, which have caused several incidents.160
As a result, the company is investing in innovation (1.2 million in the 2012/2013) and
working with other flooding agencies in order to find solutions to the problem of intense
summer storms. Besides Northumbrian other companies present performance
significantly below the Ofwat targets or expectations concerning the sewer flooding
incidents: Severn Trent, South West, Southern Water and United Utilities. Regarding the
water supply interruptions, apart from Welsh Water (Dŵr Cymru), there have been
significant improvements which prove the increased importance given to the customers’
satisfaction.
Finally, we can consider another important measure: the compliance with drinking water
standards. These standards, set with the purpose to ensure acceptable water quality to
consumers, are established in Europe, through the Water Directive explained in the first
chapter, and at a national level in UK. These strict standards cover:
Micro-organisms
Chemicals such as nitrate or pesticides
Metals such as lead and copper
The way water looks and how it tastes.161
Figure 18: Drinking water compliance for the English and Welsh water and sewerage
companies for the last three years
Source: Companies’ performance reports
160 Northumbrian annual performance review 2013 161 http://dwi.defra.gov.uk/consumers/advice-leaflets/standards.pdf

115
Companies’ compliance with drinking water quality standards remains more or less
similar for the last three years, starting from the first year of AMP5; the figure 18 shows
a high achievement of those targets especially in the year 2011/12.
Environmental impact indicators
Some of the environmental indicators used by Ofwat (reported in that table 18) are: the
greenhouse gas emissions, the pollution incidents sewerage, the pollution incidents
water, the discharge permit compliance and the satisfactory sludge disposal.
Table 18: Environmental impact indicators 2011/12-2012/13
Company GHG Pollution
incidents
sewerage
discharge permit
compliance
satisfactory
sludge
disposal
2011/
12 2012/
13 2011/12 2012/13 2011/12 2012/13
2011/
12 2012/
13 Anglian 481 481 99 99.7 97.10% 98.10% 100% 100%
Dŵr Cymru 252 256 246 205 95.60% 99.00% 100% 100% Northumbrian 220.2 214.8 59.15 119.6 99.40% 100% 100% 100%
Severn Trent 521.7 520.4 80.8 66.1 97.46% 99.15%
99.39
%
99.93
% South West 152.7 158.8 158.3 223.4 97% 97.00% 100% 100%
Southern
Water 268 286 218 185 96.10% 96.80% 100% 100%
Thames
Water 741 770 37.76 68.49 99.71% 99.13% 100% 100%
United
Utilities 522 524 73 74 99% 99.00%
91.10
%
99.20
%
Wessex Water 149 159 35.5 35.4 99.70% 99.70% 100% 100%
Yorkshire
Water 394 386 95.1 82.68 97.31% 97.31% 100%
99.72
%
Source: Companies’ performance reports
While the figures for the greenhouse gas emissions, the discharge permit compliance
and the satisfactory sludge disposal have improved or at least remained in line with the
year before, the pollution incidents for Northumbrian, South West and Thames Water
increased, becoming too high compared to those of the other companies. Besides them,
Dŵr Cymru and Southern Water, succeeded in decreasing the incidents but, as shown in
the table 18, the number remains too high. The reason of failure given by the companies
is the climate adversity which they are trying to handle in a more sustainable and

116
innovative way.
Reliability and availability indicators
Ofwat considers also some reliability and availability indicators such as the leakage,
meaning the sum of distribution losses and supply pipe losses in megalitres per day
including any uncontrolled losses between the treatment works and the customer’s stop
tap, excluding internal plumbing losses. Leakage targets are set in the Ofwat’s final
price determination 2009.
Table 19: leakage 2011/12-2012/13
Company leakage targets leakage achievements
2011/12 2012/13 2011/12 2012/13
Anglian 212 211 199 189 Dwr Cymr 188 186 185 184.40
Northumbrian 216 216 188.6 189.90 Severn Trent 474 468 464 441
South West 84 84 81.3 84.20
Southern Water 80 79 82 81
Thames Water 673 673 637 646
United Utilities 464 464 452 457
Wessex Water 71 71 69 69
Yorkshire Water 297 297 274.00 265
Source: Companies’ reports
It is easy to notice from the table 19 that all the companies, albeit with slight
differences, have over-performed, exceeding Ofwat’s targets. Yet, Thames Water and
Severn Trent, even if they obtained some improvements, need to put more efforts in
solving their leakage problem. Yorkshire has been the company that overcame Ofwat’s
target the most. This was because of its investment in this area (an addition of 25
million of operating cost during the year 2013) which allowed them to increase their
leakage control activity.
Other indicators used by the regulator include the serviceability for water non-
infrastructure and infrastructure, the serviceability for sewerage non-infrastructure and
infrastructure and finally, the security of supply index. The latter measures the extent to
which a company is able to guarantee provision of its levels of service for restrictions
for supply in two particular situations: under dry year annual average conditions and
117
peak demand conditions. All these indicators don’t present significant differences from
2011/12 and 2012/13 and remain acceptable according to the regulator.
3.2.1 Sustainable solutions
Water sustainability requires a balance between water availability and water demand.
Water demand can be managed by the regulators, Ofwat in this case, and companies.
The regulator’s tool is the price, already explained previously; instead what I believe
companies can do is to implement a domestic water demand management aimed at
reducing water consumption through the customers’ sensitization to water conservation.
Being a private company means that the main objective is the maximization of profits,
but, in my opinion, when it comes to water, a public good, other priorities shall be more
important. Indeed, even if, enterprises’ aim still remain the same, they understood the
significance of the satisfaction of customers and the significance of water, this is proved
by the several initiatives aimed at reducing water consumption, that will be described
hereinafter. This could seem contradictory since the high consumption of water
generates high income for companies, but it represents what is necessary in order to
limit the effect of the climate change. Therefore, companies, as well as the regulator,
began to spread within their clients, a sort of water culture. I have checked their
websites and the results are explained below.
Besides claiming the importance of daily actions such as taking a shower rather than a
bath, flushing as less as possible, turning off the tap while brushing teeth, making full
use of the dishwasher, using bowls for washing dishes and vegetables, installing dual
flush toilets, having a full load before using the washing machine etc., companies are
involved in the promotion of water conservation using devices such as water butts, tap
inserts, shower flow regulation and save-a-flush products. In order to capture the water
falling onto the roofs, households can install water butts which, basically, are containers
in which that water can be recovered. This allows families to supply from another
source of water without having to tap into home’s supply, plus rainwater is better for
plants. Tap inserts save on average 36 litres per day, inserting them into wash basin taps
they mix air with the water, giving the same effect while using only five litres of water
per minutes.

118
Furthermore, installing a shower flow regulation is possible to obtain an high quality
shower while saving water and money through the control of the flow rate, making it as
low as possible, so that the right amount of water is delivered to the shower. The save-a-
flush bags are filled with crystals that expand in the toilet cisterns to save one litre of
water per flush and can be used especially in old single flush toilet.
Some of these products are offered by water utilities to their customers for free, so that
households are more keen to adopt them.
Another device promoted by companies is the shower timer: it is a timer which can be
used while showering, by turning the timer over and getting out when the sand runs out,
so that people know how much time spend in the shower and are more keen to take
them faster.
Northumbrian Water proposes the trigger hose gun: it attaches to the end of a garden
hose using a hose end connector, allowing the flow of water to be stopped when moving
around the garden.
It is not only necessary to be well equipped with those kinds of devices, but, as Dŵr
Cymru notices in its website, it is also important that those devices are efficient and
checked steadily in regard of their efficiency.
Anglian Water, instead, promotes the water reuse systems: greywater reuse system and
rainwater harvesting. Those systems are able to provide an alternative source of water
that can be used in place of high quality drinking water for equipment that do not need
high quality to work effectively, such as toilets, clothes washing machines and garden
use. Greywater is wastewater generated from wash and hand basins, showers and baths
which can be relatively clean, depending on the amount of soap shampoo and shower
gel used, and which can be recycled. Nowadays, greywater reuse systems are not
common, basically for two reasons: the high costs and the quality of water since when
greywater is left to stand in a greywater storage tank, water quality can worsen as
bacteria levels rise.
The rainwater harvesting process occurs when the water is collected in water butts. If
collected and stored correctly, with minimal treatment it can be used, apart for garden
uses, for toilet flushing and washing machine. It could save up to 50% of household
water use. The problem is that the roof areas of houses are too small to meet all of this

119
demand, industrial establishments with larger roofs are better built for this purpose. Like
the greywater reuse systems, the rainwater harvesting isn’t common for the same
reasons plus because of the uncertainty of the amount of water that can be collected and
the size of the storage needed to provide a dependable supply during dry winters. Both
systems, anyway, are really useful to save water but it is necessary to be careful in using
them in home or in industrial processes since they may cause greater health issues.
As said many times, what people can do to save both water and money is to switch to
metered water. Companies help customers in doing so, encouraging and advising them
and providing on-line calculators on their website, where clients can assess the
convenience in switching from unmetered to metered water. Switching to metered water
is a consumer’s choice, however, Ofwat expects for Southern Water, housing metering
levels to be at least 90% at the end of 2015.162
This is because of the Government’s
knowledge of the South-East region as water-stressed area.
The effects of both metered and unmetered water, on consumers’ behavior, are difficult
to control; those with high income and metered water can decide anyway to waste water
using it disproportionately, that’s why I think is necessary to undertake those campaigns,
seen also the impossibility and unfairness to significantly increase the price of this
public good.
I have seen in companies’ websites that water tips are not only given to households but
also to small businesses to identify where to make savings, companies offer business
audit or guides able to explain how to undertake the audit. Everyone can use calculators
on companies’ websites in order to find out the amount of water consumed, increasing
the awareness of how much water can be saved.
Besides the promotion of water tools, companies are carrying on several awareness
campaigns in order to influence consumers behavior and reduce the waste of water, this
is a tool commonly used in implementing social marketing. While the aim of the
commercial marketing is financial, here the aim is “social good”. Its approach is to
develop activities aimed at changing or maintaining people’s behavior for the benefit of
individuals and society.163
162 Ofwat “Final price determination” 2009 pag. 54 163 http://www.thensmc.com/content/what-social-marketing-1

120
For example Anglian and Wessex Water implemented correspondingly, the “Drop 20”
and the “Target 20” campaigns, with the same purpose. Indeed, their aim was to
encourage customers to save 20 litres of water per day. In addition, Anglian Water offers
free water efficiency home visit where people are given tips on how to save water, in
order to achieve that target.
Furthermore, I have noticed it is common within English and Welsh water and sewage
companies, to implement some education programs at all levels: in primary and
secondary schools, colleges, universities, adult community groups. Those education
programs have the aim of sensitizing people, starting from the youngest, on this topic,
with interactive presentations, group activities and workshops etc. For example
Southern Water created the “Drip, drip, drip” campaign. The aim is, again, saving water,
but this time in such an alternative way, by producing and entertaining school plays in
which the characters suggest water saving tips. In this way, nearly 4000 children see this
play in a year and, if every child convinces their parents to follow these tips, 3.5 million
litres of water would be saved in a year.164
What I found also interesting is a campaign conducted by Southern Water called
“Fighting the FOG”. FOG is the acronym of fat, oil and grease, which, as explained by
the company, represent two third of the sewage blockages. The campaign consisted in
the construction of “Lardy the Fatman” made by 180 packet of lard, the drawing of
giant 3D blocked sewer images on the floor of shopping centers and the involvement of
celebrities in the sewers to spread the message. Then, they made films, held
competitions and gave away thousands of Fat Traps encouraging customers to keep the
sewers FOG-free. The result was a decrease on FOG-related sewer blockages from
6.849 to 4.907. Those improvements have the positive effect of reducing internal
flooding incidents (40 fewer) and river pollution (20 fewer).165
There are many other campaigns conducted by companies proving their involvement in
taking care of the environment and the people’s safety and health.
Water conservation can be hindered by the fact that, usually, according to my personal
experience, renters consume more than owners, probably because rent often covers the
water bill so renters do not pay attention on water waste and do not receive accurate
price signals for their consumption behavior. Therefore, I think the importance of these
164 http://www.southernwater.co.uk/about-us/community/#So-much-more 165 http://www.southernwater.co.uk/about-us/community/#So-much-more

121
campaigns becomes more significant and is clearly necessary a cooperation of people,
the owners in this case, in letting renters know everything about their bills.
3.2.2 Customers’ satisfaction
If customers acquire a high importance in the industry, it is worth it to be considered
their satisfaction in regard of the supply of water. According to a research conducted by
the Consumer Council for Water, the number of written complaints to companies by
domestic and business customers in 2012/2013 decreased by 7,4% compared to the year
before, 45% since their peak in 2007/2008.166
This research showed that the company
which received the major part of complaints was Southern Water (+77,4% than the
2012/13), followed by Yorkshire Water (+26.5%). The main problems came from:
− inadequate staffing resources when they extended their call center opening hours,
− high bills, actually the second highest in the sector after South West (see Table 15),
− more consumers contacting them about their compulsory water meter programme
for household and
− billing properties the company previously thought were unoccupied.
Instead, the best company, with the less amount of complaints received, was United
Utilities (-39,2%).
Breaking down the number of complaints into different categories, the research found
out that from 2011/2012 to 2012/2013 consumers complained the most for sewerage
(+51%) and for metering (+11,7%), the number of complaints for the rest of the
categories (bills and charges and water supply) decreased. Southern Water received the
major number of complaints in the category of bills and charges, we have already seen
the high bills it generated; Thames Water received them for the water supply and for the
sewerage service, as a consequence of the hosepipe bans established as a result of low
rainfall and of the dry spring and summer had in 2012167
; finally, United Utilities
received the major number of complaints in regard of metering. Those were mainly for
leakage, incorrect or infrequent meter reads, faulty meter, peak consumption and
standing charges.
166 The Consumer Council “Written Customer Complaints, Complaint Handling in the Water Industry England and
Wales April 2012 – March 2013” http://www.ccwater.org.uk/wp-content/uploads/2013/12/Written-Complaint-
Handling-in-the-Water-Industry-England-and-Wales-April-2012-March-2013.pdf 167 The Consumer Council “Written Customer Complaints, Complaint Handling in the Water Industry England and Wales April 2012 – March 2013”

122
I think that companies, in these cases, should keep their consumers updated on what
their service consists, what are the problems of the water management, how they cope
with the regulations and should listen to their needs, in order to solve those issues
together.
3.3 The water utilities in Europe: a comparison with Italy and France
Making a comparison between the UK and these European countries (Italy and France)
is not easy, seen the different system related to the water management (see chapter one,
paragraph 1.3). Anyway, I tried to individuate the best practices in terms of water
conservation, implemented by the biggest private companies in Italy and in France, after
having explained each tariff system.
3.3.1. The Italian case
As outlined in the first chapter, the Italian water system is quite different from the
English one. Basically, water is a public resource that could be managed by public,
private or mixed bodies. There is no general management’s model, private and public
managers cohabit in the Italian territory.
The art.154 of the legislative decree 152/2006 establishes that the water service tariff
reflects the quality of the service offered, the management costs, an adequate return on
invested capital, as well as the portion of the operating costs of the ATO, in order to
ensure the full coverage of the investment and operating costs according to the principle
of cost recovery and to that of “the polluter pays”. Then, each ATO, sets its own tariffs
basing on its territorial features such as ease of water supply, type of drinking water
abstraction, system status of water quality and the sewerage catchment for the territorial
morphology. So, the national legislation establishes that the tariff represents the
consideration of the integrated water service (water supply, sewerage and water
treatment), and sets some guidelines principles, then each AATO quantifies the tariff
and decide the articulation of the different type of clients, between the various levels of
consumption and between the three components of integrated water services. The tariff

123
thus defined is applied by the operator.168
The cost components of the tariff and the way they shall be determined are defined in
the Decree of the Minister of Public Works 1996. The operators draw up the financial
plan and the management model which have to be approved by the AATO who, basing
on those plans, determines the average effective tariff for the first year, fixes the
percentage of the annual growth rate of the tariff respecting the price limit and the tariff
structure.169
This Decree established the reference tariff:
Tn=(C+A+R)n-1(1+Π+K)
Where:
Tn is the current tariff
C represents the operating costs
A represents the depreciation costs
R represents the return on investment capital
Π is the rate of inflation of the current year and
K is the “price limit”.
The return of investment capital is calculated as:
R=t(V0+V1)/2170
Where:
T is the rate of return set by the legislation equal to 7%
V0 is the invested capital at time 0
V1 is the invested capital at time 1.
So, tariffs can be increased within the price limit K set by the ATO having regard of
different maximum values established by the Decree of the Minister of Public Works
168 Art. 154 Decreto Legislativo 152/2006
http://www.gruppohera.it/gruppo/attivita_servizi/business_acqua/canale_acqua/tariffe_chiare_acqua/tariffachiara/attori_sii/chi_decide_costo/ 169
http://www.ors.regione.lombardia.it/resources/pagina/N120392e249da6a2c13a/N120392e249da6a2c13a/D.M.2001-
08-1996.pdf 170 Art. 154 Decreto Legislativo 152/2006
http://www.gruppohera.it/gruppo/attivita_servizi/business_acqua/canale_acqua/tariffe_chiare_acqua/tariffachiara/atto
ri_sii/chi_decide_costo

124
1996. A common point I have found in this decree with the English view, is the focus on
improvements. Indeed, the decree establishes that the tariff should be set in such a way
that encourages a decrease of the operating costs to the benefit of investments and the
achievement of the objectives. In setting the tariff, the ATO has to determine a
coefficient of efficiency improvement that the operator should comply with, thanks to
the planned investments, through the reduction of operating costs. Besides the tariff
structure, the price limit and the coefficient of efficiency improvement, the ATO has to
establish the initial operating cost considered while implementing the reduction set for
the operating costs and the investment plan, its verification and the penalties charged to
the defaulting operators. Set the financial and management plans, the ATO can intervene
if there are any deviations regarding the achievement of the service levels provided in
the plan, the correspondence between the revenues deriving from the application of the
tariff structure and the revenues expected as a result of the average tariff established in
the grant, in order to make the resulting changes and, finally, the correspondence of
operating costs with structural changes in production and distribution and the resulting
changes to the reductions expected in consequence of the efficiency improvements.171
In 2011 a referendum has been held in Italy, where the population has been asked to
decide to privatize the water supply and to remove the return on invested capital in the
tariff structure.172
The outcomes were the unwillingness of people to the water
privatization and the request for the repealing of the return on invested capital in the
tariffs.173
Now, the tariff set and accepted previously to the referendum are still in force for some
cities, for the actual tariff plans, so water bills still consider the return on invested
capital. Removing it means generate a saving cost for customers. The example of “Hera
Group” below shows the difference in customers’ bills in including the return on
invested capital or not.
Hera Group S.p.A. is an Italian multi utility, supplying the North of Italy, owned by the
municipalities and provinces of Romagna for the 21,7%, the municipality of Bologna
for the 15.4%, the municipality of Modena for the 10,5%, the shareholders’ agreements
171 Art. 154 Decreto Legislativo 152/2006 172 http://www.forumcivico.it/referendum-12-13-giugno-2011-325.html 173 http://www.interno.gov.it/mininterno/site/it/sezioni/sala_stampa/speciali/referendum_2011/

125
for 8%, the municipality of Trieste for the 5,35%, the municipality of Padova for the
5,33%, the municipality of Ferrara for 2,6% and the remaining (31,2%) is free float.174
The table below shows Hera’s bills trend from 2010 to 2013, considering the average
bill for a customer related to 130 cubic meters per year.
Table 20: Customers’ bills for the Emilia-Romagna region
Euro 2010 2011 2012
Aqueduct 84,83 87,52 88,61
Drainage 20,73 21,97 23,66
Depuration 56,43 59,87 64,32
Fixed charges 11,91 12,50 15,14
IVA 10% 17,39 18,19 19,17
Total 191,30 200,04 210,90
Source: Hera175
The total bill in 2012 was €210,90 which considering the actual exchange rate
correspond to 175,26 GBP, slightly less than the bills in England and Wales.
In those bills, the return on invested capital is considered; the company calculated water
bills without it and came to the conclusion that there would be a cost saving of 0,93 €
per inhabitant (the price, as shown in the figure 17, for 1000 litres for a client in 2010
was 1,74€). The company foresees a cost saving of 4€ per inhabitant in 2017 as a
consequence of new investments.176
Figure 19: Tariff structure 2010
Source: Hera
174 http://www.gruppohera.it/gruppo/corporate_governance/azionariato/ 175http://bs.gruppohera.it/clienti/clienti_tariffe_bollette/bolletta_servizio_idrico/081.html 176
http://www.gruppohera.it/gruppo/attivita_servizi/business_acqua/canale_acqua/tariffe_chiare_acqua/costo_sii/rem
unerazione_2010/

126
In this particular case the Emilia-Romagna region fixed the rate of return equal to the 15
years interest rate swap (IRS) which in 2010 was 7.16%.177
Conversely to England and Wales, the Italian water bills are calculated basing on the
amount the customers consume, there is no possibility to choose between metered and
unmetered. Therefore, I think it is possible to encourage customers to the water saving,
through “the more you use, the more you pay” system.
In December 2013 the AEEG178
(the authority for the electricity and gas) issued the act
related to the new tariff method for the water services for the years 2014 and 2015: the
resolution 27th
December 2013, 643/2013/R/IDR.179
This new method contemplates the
following cost components.
− Fixed assets: the sum of financial expenses, taxes and depreciation on return
investment;
− operating costs: the sum of operating costs endogenous to the management, costs
related to electricity, wholesale supplies, charges related to loans and fees paid to
local authorities and other cost components;
− potential components of anticipation for the financing of new investments;
− environmental and resource costs;
− components related to adjustments.
The fees to users are determined applying the tariff multiplier ϑ to the fixed and variable
portion of the tariff structure related to the base year 2012. The tariff multiplier ϑ of
each year a is determined as the ratio between the recognized costs listed above and the
enhancement, in terms of rates measured at the beginning of 2012, of the volumes for
the year (a-2), considering the possible effects of other water activities. The value of the
multiplier is limited considering the comparison between the average tariff of the
operator and the average tariff of the sector. The calculation method of the different
component costs depends on the position held by the company in the matrix of the
“dials” (regulatory schemes) reported in the resolution. The positioning in the dials
depends on the ratio between the planned investments in the period 2014-17 and the
value of the assets managed and on the potential presence of systematic change of the
177http://www.gruppohera.it/gruppo/attivita_servizi/business_acqua/canale_acqua/tariffe_chiare_acqua/tariffachiara/r
emunerazione/remunerazione_calcolo/ 178 Autorità per l’energia elettrica e il gas 179 http://www.autorita.energia.it/allegati/docs/13/643-13.pdf

127
activities of the operator. This positioning determined differences in calculating the cost
components.180
The argument raised by the “Forum italiano dei movimenti per l’acqua” is that the
AEEG nullified the effect obtained with the past referendum when the return of capital
investment was repealed, establishing, as cost component, the financial charges.181
The ten Italian companies I have considered are:
− Abbanoa S.p.A.;
− Acea Ato2 S.p.A.;
− Acque S.p.A.;
− Acquedotto Del Fiora S.p.A.;
− Acquedotto Lucano S.p.A.;
− Amiacque S.r.l.;
− Gaia S.p.A.;
− G.O.R.I. S.p.A. - Gestione Ottimale Risorse Idriche;
− Alto Calore Servizi S.p.A.:
− Publiacqua.
For each company I have examined their websites in order to express an opinion on
their sustainable techniques to spread a water culture among the public. The parameters
I have considered are: the existence of sustainability reports and their availability on
websites, the promotion of daily norms for sustainable water use (such as closing the tap
while brushing teeth or washing the car with a bucket) and the advertising campaigns to
support water.
The following table summarizes the results.
180 http://www.autorita.energia.it/allegati/docs/13/643-13all.pdf 181http://www.acquabenecomune.org/raccoltafirme/index.php?option=com_content&view=article&id=2470:laeeg-
delibera-il-nuovo-metodo-tariffario&catid=53:notizie&Itemid=67

128
Table 21: Italian companies’ sustainable activities
Company Sustainability
report
Promotion of
daily norms
Campaigns
Abbanoa S.p.A. no yes no
Acea Ato2 S.p.A. yes yes yes
Acque S.p.A. yes yes yes
Acquedotto Del Fiora S.p.A. yes no no
Acquedotto Lucano S.p.A. no yes yes
Amiacque S.r.l. yes yes yes
Gaia S.p.A. no yes no
G.O.R.I. S.p.A. - Gestione Ottimale
Risorse Idriche
no yes yes
Alto Calore Servizi S.p.A. no yes no
Publiacqua no no yes
Source: companies’ websites
The importance of the sustainability report comes from its ability to show company’s
economic but also, environmental, social and governance performance proving
company’s commitment to sustainable development to their stakeholders. As shown in
the table 21, only four companies out of ten publish their sustainability report in their
websites.
Almost every company, eight out of ten, promote the adoption of daily attentions in
using water but only the 60% of them created campaigns for the wide spreading of the
water conservation. Most of these campaigns involve people of all ages: children, teens
and adults. Companies use to promote the responsible use of water in schools, among
the youngest public.
Within those companies I have found interesting the involvement of Acque S.p.A. at an
international level through the “Acqua per il Burkina Faso” project. With this project the
company, in collaboration with other bodies and companies present in its region
(Tuscany), helps this country, the Burkina Faso (Africa), in solving its problem related
to the water scarcity, through the realization of wells in the villages and the beginning of
training of technicians from Burkina Faso.
All companies invest in research and development, indeed, I have noticed in Abbanoa
S.p.A. a significant involvement in improving technologies in order to keep under
control the infrastructures through the creation of:
− the water balance on networks and infrastructure supply,
− the remote control on treatment plants and

129
− the remote reading of meters on large consumers.
The functions of the water balance are the recording of water flows, the acquisition of
measures from other software environments, the garrison of goods sold and the
elaboration of water balances. This system can also be used as support of the action
planning.
The purposes of the remote control system are the supervision and the real-time
monitoring of the process, the data acquisition and the historicizing. The advantages are
a timely intervention in case of anomalies, the possibility of implement appropriate
corrective action on the process parameters in case of deviation from the optimal values,
a more flexible and effective management of the process with the possibility of a time
reduction of the intervention and the possibility to arrange targeted projects aimed at
increasing the performance of the sewage purification process.
Finally, the remote reading of meters on large customers aims at giving more detailed
and accurate information related to consumers’ water consumption, that the operators of
the company can’t give manually.
3.3.2 France: three biggest private water companies
The French water system is based on two principles:
− water pays the water: the water system must be funded independently through the
invoices paid by users and
− the polluter and the consumer pay: through the pollution tax payable to the water
agencies.182
The price is divided into different components: the distribution of drinking water, the
water treatment, the pollution tax, the component intended to the FNDAE183
, the
“waterways” canon and the value added tax. Anyway it is set in such a way to make the
companies able to cope with the repayment of loans and bank interests, the management
182 http://www.fondazioneamga.org/public/Moisello.pdf 183 Fonds National pour le Développement des Adductions d’Eau potable.

130
and administration fees and the maintenance, repair and depreciation costs.184
Water management in France can be direct or delegated to a private company, through
concession or leasing, or even mixed.185
In the second case, when the management is
granted, the price is set at the beginning of the contract and the formula used is:
Pn = P0 (a + b In / I0 + c I’n / I’0 + …) a + b + c + …=1
With:
n: the year taken into consideration
In and I0: describing the evolution of some factors of production such as the price of
energy, and are calculated by the public bodies
b, c,..: representing the distribution of the expense reported in the cash flow statement
a: intended to reduce the increase of the price due to the formula and defines the
productivity gains.186
Basically, there are three big private companies: Saur Group, Suez S.A. and Veolia S.A..
I have conducted the same research as that for the Italian companies but only in regard
of those three companies because I retain they are the most significant, seen their
dimensions.
The table below shows the findings.
Table 22: French companies’ sustainable activities
Company Sustainable report Promotion of daily
norms
Campaigns
Veolia no no yes
Suez yes no yes
Saur yes no yes
Source: companies’ websites
For what I have noticed in those French companies’ websites I can conclude that it is
not typical to promote the daily use of precautions in benefiting from water but it is
widespread to implement awareness campaigns. In 2007, Suez organized a campaign in
collaboration with the French National Institution of Consumers, intended to the
children from the primary schools, their teachers and their parents, with the aim to
184 http://www.fondazioneamga.org/public/Moisello.pdf 185 http://www.isf-france.org/La-gestion-de-l-eau-potable-en-France 186 http://www.fondazioneamga.org/public/Moisello.pdf

131
promote a “friendly access” to water through the provision of a kit with educational
teaching games and the installation of fountains-tap.187
Moreover, I have noticed that most of the campaigns are intended to the children. For
example, Saur initiated the “Classes H2O” in Morbihan (a Brittany’s department) with
the aim of introducing the children to the water cycle and sensitize them to the eco-
gestures and the water issues.188
Both Veolia and Suez have been at the center of an event worth to be mentioned. They
used to run the business in Paris until the 2010 when the municipality, after 25 years of
private management, decided to switch into public. This choice has been a consequence
of years of inefficiency, no monitoring and non-financial transparence from the private
management conducted under Veolia and Suez Water.189
The municipality’s idea was to
create a unique body in charge of the water supply instead of two different entities
which, as testified by a company’s worker in an Italian television program
“Presadiretta”, used to generate confusion and tensions between different offices and
among costumers. In that TV deepening, the city councilor declared that all the savings
coming from the switching from private to public would have been used for new
investments with no negative consequences on customers’ bills and employment. Under
the public management, 105 million have been invested in order to replace 90 km of
pipes, which will last one century. These maintenance works were led by the
municipality of Paris and financed by public resources.190
On the 1st January 2014 the water price was 3,2254 €/m
3.191
The table below shows the trend of the water price before and after the
remunicipalisation.
187 http://www.actu-environnement.com/ae/news/suez_campagne_sensibilisation_eau_robinet_ecoles_3392.php4 188 http://www.saur.com/index.php/nos-metiers/eau/informer-et-sensibiliser-aux-enjeux-de-leau 189 https://www.youtube.com/watch?v=Q7acCqGsE4A 190
https://www.youtube.com/watch?v=Q7acCqGsE4A 191 http://www.eaudeparis.fr/leau-au-quotidien/une-eau-au-juste-prix/

132
Figure 20: Water price from 2008 to 2014
Source: Municipality of Paris reports
Considering an average consumption of 180 litres per day and per person, the total bill
for a year would be 209€ (173,96 GBP). Here, prices rose from 2008 as well as the
customers’ satisfaction, from 87% of Parisians respondents satisfied by the water supply
and depuration to 92% satisfied by the water supply and 86% by the purification service
in 2012.192
In 2012 Eau de Paris spent a total of 82.7 million in investments for the quality service
improvements such as the reconstruction of siphons193
, while in 2011 it spent 49
million194
and 65.7 million in 2010195
. I believe, the increase in the investments can
justify the rise in the water price.
Finally, Eau de Paris is aware of the water scarcity as well as the English companies and
encourages customers, in its website, to adopt all the necessary precautions in using
water such as checking if there are any potential leakages from the tap, use the tap
regulator, use a glass while brushing teeth etc.
192 Municipality of Paris reports http://www.paris.fr/pratique/eau/donnees-rapports/barometre-2010-de-satisfaction-
des-usagers-de-l-eau-a-paris/rub_6467_stand_15087_port_14623 193 http://www.eaudeparis.fr/fileadmin/contribution/culture/mediatheque/publications/Rappot_annuel_2012.pdf 194 http://www.eaudeparis.fr/uploads/tx_edpevents/Rapport_activite_EDP_2011.pdf 195 http://www.eaudeparis.fr/uploads/tx_edpevents/Rapport_activite_EaudeParis2010.pdf
133
Conclusions
The aim of this dissertation was to examine how the UK water sector handles the issue
related to the water scarcity. Before arriving to those conclusions I have considered the
water status all over the world and then I focused on the UK, examining, firstly the
legislation the European State Members are obliged to comply with and, secondly, the
specific UK legislation.
The climate change is making the entire world worrying about the water scarcity and
talking about the sustainability of water that much that the European Union intervened
in this regard issuing the Directive 2000/60/EC through which it imposes the respect of
defined limits and the achievement of determined objectives in regard of the
environment and, specifically, the water status. All the Member States are, then, asked
to establish the way by which reaching those targets, according to their own territory
and policy features.
Retracing the history of the sector, starting from the privatization in 1989, I came up
analyzing it for the last three year (2011, 2012 and 2013). After privatization, due to the
requirements established by the European Union, companies felt the necessity of
increasing their investments in such a way that they were able to achieve defined
environmental standards, especially in the years I have considered. Indeed, companies
succeeded in improving their performance, both quantitative and qualitative, as
demonstrated for instance by the SIM, the measure used by Ofwat to assess companies
operational achievement, or by the drinking water compliance, which overall swings
from 99.95% to 99.96%. The improving in the quality service allows companies to
reach higher standards of customers’ satisfaction which, as a consequence, make them
more willing to pay for it, reducing, some days, the bad debt companies need to provide
in case of non-payments. However, they still have to work on it, as demonstrated by the
research conducted by the Consumer Council for Water, especially for those companies
who received the major part of complaints, Southern and Yorkshire Water.
Furthermore, the results of my research prove that companies are concerned about the
water issue and keen to set a water culture among the customers through the promotion
of daily norms such as taking a shower instead of a bath or turning the taps while
brushing teeth etc.. Apart from that, they are involved in the implementation of
awareness campaigns with the aim of sensitizing clients, including the youngest ones
and are involved in the generation of technological instruments such as the “microbial

134
source tracking” implemented by the Wessex Water. Indeed, as shown in the third
chapter, the resources intended to the R&D department of the companies have been
rising in the last year, reaching £14million throughout the industry in 2012/13.
We have also seen that the ownership and the corporate governance of the companies
influence their way of running the business, thus the service they offer to the final
clients and the achievement of sustainable objectives, including the improvement of the
environment. Unlisted companies aren’t obliged to comply with the Code but we have
seen they are keen to do it, sometimes making some exceptions as, for example, Anglian
Water which declares it does comply with the Code except for some dispositions.
Furthermore, even in this regard, their corporate governance, some of them have found
sustainable solutions such as the establishment of special Committees intended to the
care of environmental and social objectives, such as the Quality and Environment
Committee set by Dŵr Cymru. Furthermore, I have noticed companies followed the
third principle set by the International Conference on Water and Environment (see
chapter 1) and started considering the importance of the women within the management,
increasing their presence in their company.
Analyzing companies’ financial structure it came up they use to resort to debt instead of
equity, which was one of the purpose of the privatization. Indeed, in the second chapter
it is shown that, in the last three years, they generally distributed a high amount of
dividends, financing their large investments mostly with borrowing instead of self-
financing.
The regulator has the duty to monitor the competition in the sector but, also, to set the
price limit. We have seen how Ofwat established it for the five year period from 2010 to
2015 and how the sustainability of the sector has been taken into consideration, through
the setting of an affordable price to everybody but at the same time able to encourage
companies in running the business properly and to stimulate both consumers and
companies to respect the environment implementing the water conservation. Indeed,
Ofwat promotes the switching from a metered to an unmetered water payment system in
order to foster people to use less water, through the “pay for what you consume”
method; the less you consume, the less you pay. Furthermore, in order to ease the
situation in the south of England which is already water stressed, Ofwat imposed the
company supplying water in charge, Southern Water, to reach housing metering levels at
90% at the end of 2015.
All things considered I believe the five principles set by Ofwat in its “Water today,

135
water tomorrow - Ofwat and sustainability” report, are followed by companies. In fact,
they use to respect customers’ needs, and this is proved by the customers’ satisfaction
explained before, they are improving their water management for example by reducing
the leakages, they have got a financial strength, proved by their usual profits (only two
companies borne losses for only two years) and, finally, Ofwat continues to play an
important role in the sector by setting the price limit.
Finally, the comparison between England and Wales, Italy and France, in regard of the
tariff system and the sustainable solutions shows that: both of them consider the return
on investment except for Italy, which removed it with the referendum 2011 but, recently,
added the financial charges in the price setting which is considered, for somebody, not
that different from the return on investment. A difference from the England and Wales
system is that there is no possibility to choose between the metered or unmetered
payment since the latter one is not contemplated. Finally, in regard of sustainable
solutions, basing on my research on the biggest private water companies, both Italian
and French, I find more involved in the water culture spreading the English and Welsh
companies. While the promotion of daily norms and the implementation of awareness
campaigns are practiced by the Italian and French companies, the diffusion of particular
tools, such as the tap insert or the shower flow regulation, aren’t widespread by them,
conversely to the English and Welsh ones which, often, give them for free.

136
Bibliography
“Shannon River Basin Management Plan (2009-2015)” in
http://www.wfdireland.ie/docs/1_River%20Basin%20Management%20Plans%2
02009%20-
%202015/ShIRBD%20RBMP%202010/ShIRBD%20RBMP%202010.pdf
Bernard Barraque (1995), Les Politiques de l’Eau en Europe, p.233, Paris: La
Découverte.
Bishop M., Kay J., Mayer C. (1994), Privatization and economic performance. Oxford,
UK: Oxford University Press.
Brealey R., Allen F., Myers S., Sandri S. (2007), Principi di finanza aziendale, New
York, The McGraw-Hill Companies.
Brown A., Martlock M. D.(2011), “A review of water scarcity indices and
methodologies” in http://www.sustainabilityconsortium.org/wp-
content/themes/sustainability/assets/pdf/whitepapers/2011_Brown_Matlock_Wat
er-Availability-Assessment-Indices-and-Methodologies-Lit-Revi ew.pdf
Consumer Council for Water (2013) “Written customers complaints, complaint handling
in the water industry England and Wales April 2012- March 2013” in
http://www.ccwater.org.uk/wp-content/uploads/2013/12/Written-Complaint-
Handling-in-the-Water-Industry-England-and-Wales-April-2012-March2013.pdf
Decreto Legislativo 152/2006, Art. 154 in
http://www.gruppohera.it/gruppo/attivita_servizi/business_acqua/canale_acqua/t
ariffe_chiare_acqua/tariffachiara/attori_sii/chi_decide_costo/
Ellis , J . & Williams , D . (1993), Corporate Strategy and Financial Analysis, London :
Pitman Publishing.
Ernst J. (1994), Whose utility? The social impact of public utility privatization and
regulation in Britain, Open University Press.
European Commission (2013), “Communication from the commission to the European
Parliament, the Council, the European Economic and Social Committee and the
Committee of the regions”, 636 final, Brussels 11/9/2013.
Federal Ministry for the Environment, Nature Conservation and Nuclear Safety (2001),
“ Water management in Germany, water supply - water waste disposal”
http://www.bmub.bund.de/fileadmin/bmu-
import/files/english/pdf/application/pdf/fal tblatt_wasserwirtschaft_en_bf.pdf

137
Florio M. (2004), The great divestiture, evaluating the welfare impact of the British
privatizations 1979-1997. London, UK: The MIT Press.
Frontier Economic (2013), “ Investment in the water sector: the role of financing” in
http://www.water.org.uk/home/policy/publications/archive/finance/the-role-of-
financing/rep-investment-in-the-water-sector---the-role-of-financing-final-27-
03-2013-stc.pdf
Government UK, Excel spreadsheet “Prices of fuels purchased by non-domestic
consumers in the United Kingdom excluding/including CCL (QEP 3.4.1. And
3.4.2)” in https://www.gov.uk/government/statistical-data-sets/gas-and-
electricity-prices-in-the-non-domestic-sector
Hall D., Lobina E. (2007), “From a private past to a public future? - the problems of
water in England and Wales”, in
http://gala.gre.ac.uk/2946/1/PSIRU_Report_9757_2008-02-W-UK.pdf
House of Commons (2013), “Water bills - are they affordable to all?” in
http://www.parliament.uk/business/publications/research/briefing-
papers/SN06596/water-bills-are-they-affordable-to-all
Howart D. A. (1999), “Privatization - A help or an hindrance in managing water
demand?”, in
http://opensiuc.lib.siu.edu/cgi/viewcontent.cgi?article=1219&context=jcwre.
Karl T.R., Melillo J.M., Peterson T.C. (2009), Global Climate Change Impacts in the
United States. New York, NY: Cambridge University Press.
Lobina E., Hall D. (2001), “UK Water Privatization - a briefing”, in
http://www.archives.gov.on.ca/en/e_records/walkerton/part2info/partieswithstan
ding/pdf/CUPE18UKwater.pdf
Marcuello C., Lallana C., Thyssen N. (2003), “Indicator Fact Sheet”, in
http://www.eea.europa.eu/data-and-maps/indicators/water-exploitation-
index/water-exploitation-index
McKinsey and Company (2007), “Women matter: gender diversity, a corporate
performance driver” in
http://www.mckinsey.de/sites/mck_files/files/Women_Matter_1_brochure.pdf
National Research Council (2002), Privatization of water service, Washington, DC:
National Academy Press.
Ofwat (2013), “Board leadership, transparency and governance - principles” in
138
http://www.ofwat.gov.uk/regulating/gud_pro20140131leadershipregco.pdf
OFWAT (1991), “Cost of Capital: a consultation paper Volume 1”.
OFWAT (1995), “OFWAT 1994-95 Report on the cost of water delivered and sewerage
collected”.
Ofwat (2004) “Future water and sewerage 2005-2010 final determinations”, in
http://www.ofwat.gov.uk/pricereview/pr04/det_pr_fd04.pdf
Ofwat (2007) “Water and sewerage charge Report 2006-2007”, in
http://www.ofwat.gov.uk/regulating/reporting/rpt_tar2006-07.pdf
Ofwat (2007), “Final determinations 2005-06 charges”, in
https://www.ofwat.gov.uk/pricereview/pr99/det_pr_fd99.pdf
Ofwat (2009), “Future water and sewerage charges 2010-2015: Final determinations” in
https://www.ofwat.gov.uk/pricereview/pr09phase3/det_pr09_finalfull.pdf
OFWAT (September 2005), “Financial performance and expenditure of the water
companies in England and Wales 2004-2005 report.” , p.47., in
http://www.ofwat.gov.uk/regulating/reporting/rpt_fpr2004-05_fpe.pdf
Ofwat “Delivering sustainable water” in
http://www.ofwat.gov.uk/aboutofwat/reports/forwardprogrammes/rpt_fwd_2010
0303ofwatstrategy.pdf
Ofwat, “Thames Water: household charges 2011-12” in
http://www.ofwat.gov.uk/consumerissues/chargesbills/prs_inf_tms_charges2011-
12.pdf
OFWAT, DEFRA (2006) “The development of the water industry in England and
Wales” in
http://www.ofwat.gov.uk/publications/commissioned/rpt_com_devwatindust270
106.pdf
OWAT (1995), “Report on the financial performance and capital investment of the water
companies in England and Wales”.
Research Paper 98/117 (10 December 1998),“Water industry bill” page 54, in
http://www.publications.parliament.uk/pa/cm200102/cmhansrd/vo020212/text/2
0212 w34.htm
Shaoul J.(1997), “A critical financial analysis of the performance of privatised
industries: the case of the water industry in England and Wales”, in
Critical perspective accounting, 8, 479-505.
The Financial Reporting Council (2012), “The UK Corporate Governance Code”.

139
Water UK, Excel spreadsheet “Volume measures water, wastewater” in
http://www.water.org.uk/home/resources-and-links/uk-water-
industry/about/2013-dat ashare
Wockner G. (2013), “Is the Colorado river damned? Oped”, in
http://www.livescience.com/28866-most-endangered-river.html
Zattoni A. (2006), Assetti proprietari e corporate governance, pag 278, Milano, EGEA.
Sitography
http://www.unwater.org/water-cooperation-2013/water-cooperation/facts-and-figures/en/
http://www.eea.europa.eu/themes/water/wise-help-centre/glossary-definitions/water-
stress
http://www.water-pollution.org.uk/types.html
http://www.unwater.org/statistics_san.html
http://www.ipsnews.net/2013/10/conflicts-over-water-rise-in-tanzania/
http://www2.worldwater.org/chronology.html
http://water.org/water-crisis/water-facts/water/
http://www.un.org/waterforlifedecade/africa.shtml
http://thewaterproject.org/water-in-crisis-middle-east.php
http://ec.europa.eu/environment/water/quantity/scarcity_en.htm
http://www.sd-commission.org.uk/pages/what-is-sustainable-development.html
http://www.bwb.de/content/language1/html/8368.php
http://www.gruppohera.it/gruppo/com_media/dossier_acqua/articoli/pagina23.html
http://www.eaudeparis.fr/lespace-culture/patrimoine/
http://www.isprambiente.gov.it/it/temi/acqua/gestione-delle-risorse-idriche-in-italia
http://www.gruppohera.it/gruppo/com_media/dossier_acqua/articoli/pagina25.html
http://www.iagua.es/2010/06/aeas-presenta-la-xi-edicion-de-la-%E2%80%9Cencuesta-
de-suministro-de-agua-potable-y-saneamiento-en-espana%E2%80%9D/
http://www.ofwat.gov.uk/industryoverview/today/achieve
https://www.ofwat.gov.uk/consumerissues/chargesbills/prs_inf_wsh_charges2011-
12.pdf
http://www.bbc.com/news/10612209
http://www.ofwat.gov.uk/sustainability/waterresources/leakage/
https://www.gov.uk/government/uploads/system/uploads/attachment_data/file/31480/11

140
-745-women-on-boards.pdf
https://www.gov.uk/whistleblowing
https://www.swe.siemens.com/italy/web/IS/Acqua/Prodotti/Pages/Idrolisi%20Termica.a
spx
http://www.ofwat.gov.uk/regulating/aboutconsumers/sim/prs_web201211sim.pdf
http://www.water.org.uk/home/resources-and-links/uk-water-industry/about/2013-
datashare
http://dwi.defra.gov.uk/consumers/advice-leaflets/standards.pdf
http://www.thensmc.com/content/what-social-marketing-1
http://www.southernwater.co.uk/about-us/community/#So-much-more
http://www.ors.regione.lombardia.it/resources/pagina/N120392e249da6a2c13a/N12039
2e249da6a2c13a/D.M.2001-08-1996.pdf
http://www.forumcivico.it/referendum-12-13-giugno-2011-325.html
http://www.interno.gov.it/mininterno/site/it/sezioni/sala_stampa/speciali/referendum_20
11/
http://www.ors.regione.lombardia.it/resources/pagina/N120392e249da6a2c13a/N12039
2e249da6a2c13a/D.M.2001-08-1996.pdf
http://www.forumcivico.it/referendum-12-13-giugno-2011-325.html
http://www.interno.gov.it/mininterno/site/it/sezioni/sala_stampa/speciali/referendum_20
11/
http://www.gruppohera.it/gruppo/corporate_governance/azionariato/
http://bs.gruppohera.it/clienti/clienti_tariffe_bollette/bolletta_servizio_idrico/081.html
http://www.gruppohera.it/gruppo/attivita_servizi/business_acqua/canale_acqua/tariffe_c
hiare_acqua/costo_sii/remunerazione_2010/
http://www.gruppohera.it/gruppo/attivita_servizi/business_acqua/canale_acqua/tariffe_c
hiare_acqua/tariffachiara/remunerazione/remunerazione_calcolo/
http://www.autorita.energia.it/allegati/docs/13/643-13.pdf
http://www.acquabenecomune.org/raccoltafirme/index.php?option=com_content&view
=article&id=2470:laeeg-delibera-il-nuovo-metodo-
tariffario&catid=53:notizie&Itemid=67
http://www.fondazioneamga.org/public/Moisello.pdf
http://www.isf-france.org/La-gestion-de-l-eau-potable-en-France
http://www.actu-
environnement.com/ae/news/suez_campagne_sensibilisation_eau_robinet_ecoles_3392.

141
php4
http://www.saur.com/index.php/nos-metiers/eau/informer-et-sensibiliser-aux-enjeux-de-
leau
https://www.youtube.com/watch?v=Q7acCqGsE4A
http://www.eaudeparis.fr/leau-au-quotidien/une-eau-au-juste-prix/
Municipality of Paris reports http://www.paris.fr/pratique/eau/donnees-
rapports/barometre-2010-de-satisfaction-des-usagers-de-l-eau-a-
paris/rub_6467_stand_15087_port_14623
http://www.eaudeparis.fr/fileadmin/contribution/culture/mediatheque/publications/Rapp
ot_annuel_2012.pdf
http://www.eaudeparis.fr/uploads/tx_edpevents/Rapport_activite_EDP_2011.pdf
http://www.eaudeparis.fr/uploads/tx_edpevents/Rapport_activite_EaudeParis2010.pdf
Recommended