©2014 International Monetary Fund
IMF Country Report No. 14/233
UNITED KINGDOM 2014 ARTICLE IV CONSULTATION—STAFF REPORT; PRESS RELEASE; AND STATEMENT BY THE EXECUTIVE DIRECTOR FOR THE UNITED KINGDOM
Under Article IV of the IMF's Articles of Agreement, the IMF holds bilateral discussions with members, usually every year. In the context of the 2014 Article IV consultation with the United Kingdom, the following documents have been released and are included in this package: A Staff Report prepared by a staff team of the IMF for the Executive Board’s consideration on July 23, 2014, following discussions that ended June 6, 2014, with the officials of the United Kingdom on economic developments and policies. Based on information available at the time of these discussions, the staff report was completed on July 8, 2014.
An Informational Annex of July 8, 2014 prepared by the IMF.
A Press Release summarizing the views of the Executive Board as expressed during its July 23, 2014 discussion of the staff report that concluded the Article IV consultation.
A Statement by the Executive Director for the United Kingdom.
The document listed below has been or will be separately released. Selected Issues Paper
The publication policy for staff reports and other documents allows for the deletion of market-sensitive information.
Copies of this report are available to the public from
International Monetary Fund Publication Services PO Box 92780 Washington, D.C. 20090
Telephone: (202) 623-7430 Fax: (202) 623-7201 E-mail: [email protected] Web: http://www.imf.org
Price: $18.00 per printed copy
International Monetary Fund Washington, D.C.
July 2014

UNITED KINGDOM
STAFF REPORT FOR THE 2014 ARTICLE IV CONSULTATION
KEY ISSUES
The economy has rebounded strongly and prospects are promising. Headwinds that
previously held back the economy—relating notably to credit conditions and
confidence—have eased. Nonetheless, sustaining strong growth will depend on a
recovery in productivity growth and further demand rebalancing. The housing market
brings risks of financial vulnerabilities. Sterling is moderately overvalued.
The overall policy mix is appropriate, but policy settings might need to be adjusted
quickly. Effective monetary conditions are very supportive, compensating for ongoing
fiscal consolidation:
Accommodative monetary policy is appropriate for now, given weak inflation
pressures, but policy might need to be adjusted quickly if inflation takes off. Interest
rate increases may also need to be considered if macroprudential tools are
insufficient to deal with financial stability risks from the housing market.
The authorities have recently implemented macroprudential measures, including
limiting the share of high loan-to-income mortgages lenders can issue, establishing
them as the primary defense against housing-related risks. They should stand ready
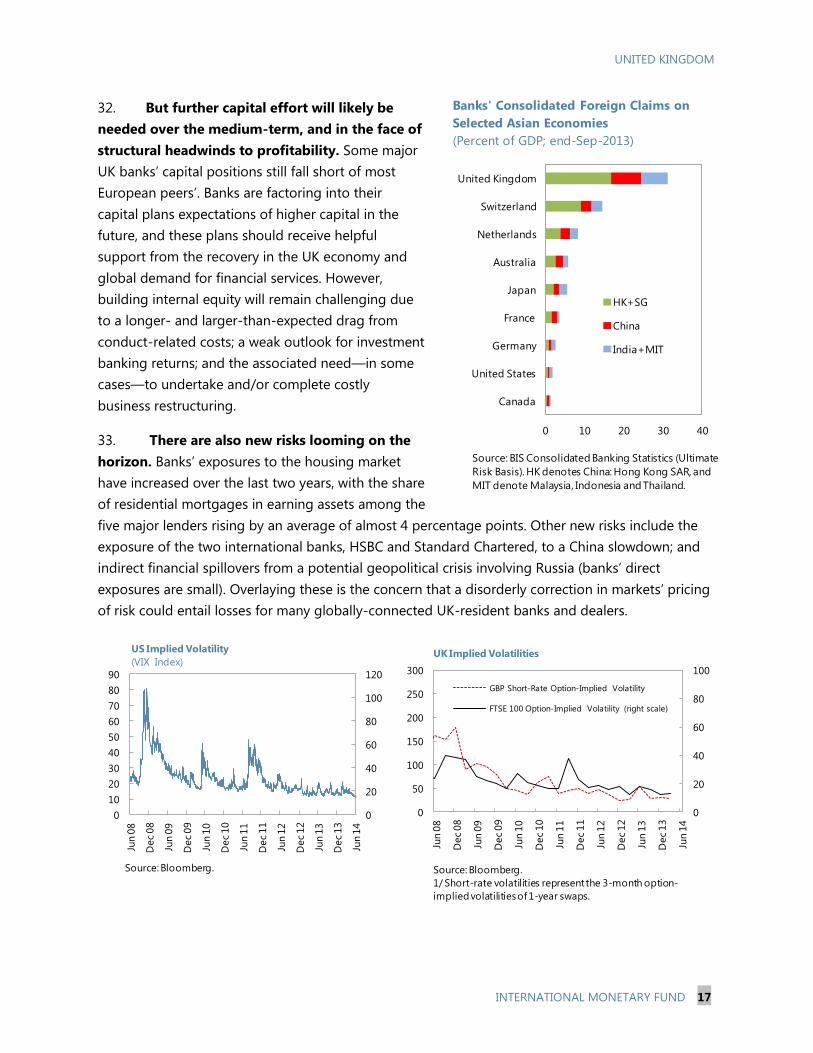
to tighten these limits should current settings prove ineffective in reining in those
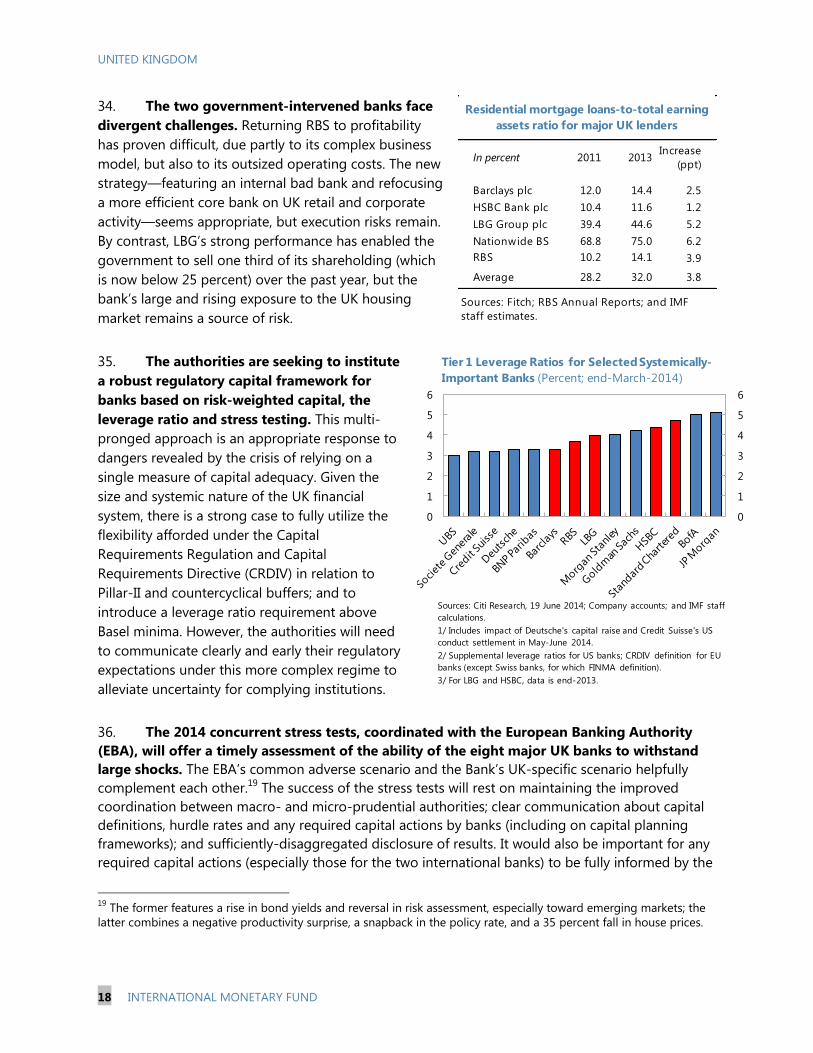
risks.
A lasting solution to house price pressures requires measures to address insufficient
supply. Significant planning reforms have been undertaken, but political consensus is
needed to make further progress in this area.
High deficits and rising debt mean that fiscal consolidation needs to continue. The
pace and composition of deficit reduction over the near term is appropriate. Further
reducing the deficit over the medium term will be challenging; both revenue and
expenditure measures should be considered, keeping in mind both equity and
efficiency.
The financial sector is more robust, the new financial architecture is settling in, and
significant changes have been made to banks’ liquidity backstops to adapt to
changing needs. Implementing macroprudential policy will be a test of the new
architecture. Some problems—such as Too Important To Fail and bank misconduct—
persist, and new challenges, such as from shadow banking, are emerging.
July 8, 2014

UNITED KINGDOM
2 INTERNATIONAL MONETARY FUND
Approved By Philip Gerson and
Kalpana Kochhar
Discussions took place in London during May 22–June 6, 2014. The
staff team comprised Messrs. Srinivasan (head), Scott, Abbas, Ishi,
Lama and Gerson (EUR), and Mr. Norat (MCM). The Managing Director
met with the Chancellor and BoE Governor and held a Press
Conference.
CONTENTS
THE FOCUS OF THE CONSULTATION ___________________________________________________________ 4
RECENT DEVELOPMENTS _______________________________________________________________________ 4
OUTLOOK AND RISKS ___________________________________________________________________________ 7
MONETARY POLICY _____________________________________________________________________________ 8
POLICIES TO ADDRESS HOUSING MARKET RISKS AND PROBLEMS ________________________ 11
FISCAL POLICY _________________________________________________________________________________ 14
FINANCIAL SECTOR POLICIES _________________________________________________________________ 16
STRUCTURAL FINANCIAL REFORMS __________________________________________________________ 19
SUPPLY-SIDE POLICIES ________________________________________________________________________ 20
THE AUTHORITIES’ VIEWS ____________________________________________________________________ 21
STAFF APPRAISAL _____________________________________________________________________________ 23
RISK ASSESSMENT MATRIX ___________________________________________________________________ 25
BOX
1. Monetary Policy Communications _____________________________________________________________ 10
FIGURES
1. Indicators of Spare Capacity ___________________________________________________________________ 27
2. Housing Market Developments _______________________________________________________________ 28
3. Progress and Challenges in Fiscal Consolidation, 2009/10–2018/19 ___________________________ 29
4. Comparison of Major UK, EU, and US Banks ___________________________________________________ 30
UNITED KINGDOM
INTERNATIONAL MONETARY FUND 3
TABLES
1. Selected Economic Indicators, 2012–15 _______________________________________________________ 31
2. Medium-Term Scenario, 2012–19 _____________________________________________________________ 32
3. Statement of Public Sector Operations, 2010/11–18/19 _______________________________________ 33
4. Statement of General Government Operations, 2007–13 ______________________________________ 34
5. General Government Stock Positions, 2007–13 ________________________________________________ 35
6. Balance of Payments, 2012–19 ________________________________________________________________ 36
7. Net Investment Position, 2007–13 _____________________________________________________________ 37
ANNEXES
1. External Sector Reports ________________________________________________________________________ 38
2. Debt Sustainability Analysis ___________________________________________________________________ 39

UNITED KINGDOM
4 INTERNATIONAL MONETARY FUND
THE FOCUS OF THE CONSULTATION
1. The consultation focused on evaluating policies to counter risks to the UK economy
and secure durable and robust growth. The acceleration in growth is welcome but needs to be
sustained. In this respect, staff assessed the balance of the recovery and risks posed by ongoing
productivity concerns, the housing market, and external factors. Policy discussions devoted
particular attention to the normalization of monetary policy, measures needed to address financial
stability risks and ensure a vibrant, but safe financial sector, the pace and composition of fiscal
adjustment, and steps to boost housing supply and long-run potential growth.
2. Economic policy has been broadly in line with past Fund advice. Consistent with Fund
recommendations in the 2013 Article IV consultations, the Bank of England has continued to
maintain an accommodative monetary policy stance to support growth. Repair of bank balance
sheets has progressed, and the authorities have elaborated a strategy for the two state-owned
banks, aimed at returning them to good health and eventually to private ownership. The Bank of
England has also outlined a framework for stress-testing bank soundness. The government has also
boosted capital spending, within the confines of the well-elaborated medium-term fiscal
consolidation strategy, to boost the economy’s long-term potential.
RECENT DEVELOPMENTS
3. The economy has rebounded strongly:
Growth has accelerated since the second half of 2013 and leading indicators suggest that the
recovery has momentum. After expanding by just 0.3 percent in 2012, real GDP grew by
1.7 percent in 2013, nearly twice the projection in the 2013 Article IV Staff Report.1 Faster-than-
expected growth is associated with easier credit conditions and improved consumer confidence.
1 Growth in 2013 was projected to be 0.9 percent in the 2013 Article IV staff report.
30
35
40
45
50
55
60
65
70
30
35
40
45
50
55
60
65
70
Jan
-12
Mar-
12
May-
12
Jul-
12
Sep
-12
No
v-1
2
Jan
-13
Mar-
13
May-
13
Jul-
13
Sep
-13
No
v-13
Jan
-14
Mar-
14
Manufacturing
Construction
Services
PMI
(50+: expansion, SA)
Source: Haver/ONS.
-35
-30
-25
-20
-15
-10
-5
0
-35
-30
-25
-20
-15
-10
-5
0
Jan
-12
Mar-
12
May-
12
Jul-
12
Sep
-12
No
v-12
Jan
-13
Mar-
13
May-
13
Jul-
13
Sep
-13
No
v-13
Jan
-14
Mar-
14
May-
14
Gfk Consumer Confidence Barometer
Source: Haver/ONS.
UNITED KINGDOM
INTERNATIONAL MONETARY FUND 5
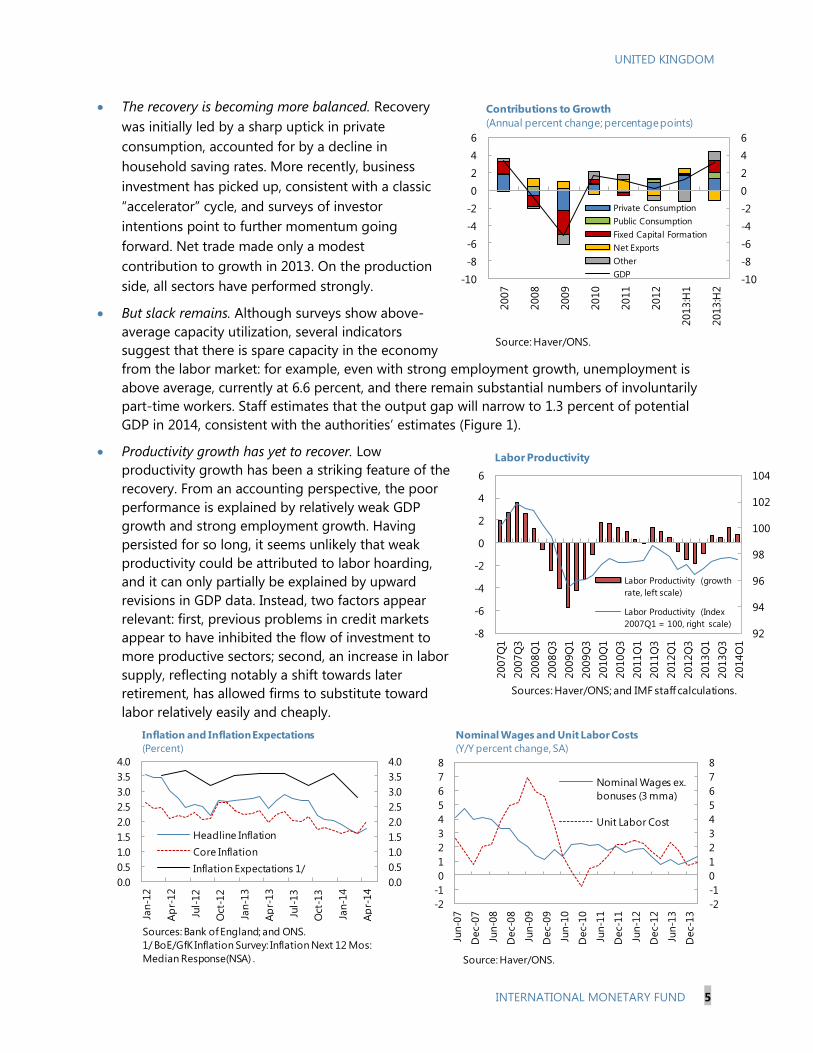
The recovery is becoming more balanced. Recovery
was initially led by a sharp uptick in private
consumption, accounted for by a decline in
household saving rates. More recently, business
investment has picked up, consistent with a classic
“accelerator” cycle, and surveys of investor
intentions point to further momentum going
forward. Net trade made only a modest
contribution to growth in 2013. On the production
side, all sectors have performed strongly.
But slack remains. Although surveys show above-
average capacity utilization, several indicators
suggest that there is spare capacity in the economy
from the labor market: for example, even with strong employment growth, unemployment is
above average, currently at 6.6 percent, and there remain substantial numbers of involuntarily
part-time workers. Staff estimates that the output gap will narrow to 1.3 percent of potential
GDP in 2014, consistent with the authorities’ estimates (Figure 1).
Productivity growth has yet to recover. Low
productivity growth has been a striking feature of the
recovery. From an accounting perspective, the poor
performance is explained by relatively weak GDP
growth and strong employment growth. Having
persisted for so long, it seems unlikely that weak
productivity could be attributed to labor hoarding,
and it can only partially be explained by upward
revisions in GDP data. Instead, two factors appear
relevant: first, previous problems in credit markets
appear to have inhibited the flow of investment to
more productive sectors; second, an increase in labor
supply, reflecting notably a shift towards later
retirement, has allowed firms to substitute toward
labor relatively easily and cheaply.
-10
-8
-6
-4
-2
0
2
4
6
-10
-8
-6
-4
-2
0
2
4
6
2007
2008
2009
2010
2011
2012
2013:H
1
2013:H
2
Private Consumption
Public Consumption
Fixed Capital Formation
Net Exports
Other
GDP
Contributions to Growth
(Annual percent change; percentage points)
Source: Haver/ONS.
92
94
96
98
100
102
104
-8
-6
-4
-2
0
2
4
6
2007Q
1
2007Q
3
2008Q
1
2008Q
3
2009Q
1
2009Q
3
2010Q
1
2010Q
3
2011Q
1
2011Q
3
2012Q
1
2012Q
3
2013Q
1
2013Q
3
2014Q
1
Labor Productivity (growth
rate, left scale)
Labor Productivity (Index
2007Q1 = 100, right scale)
Labor Productivity
Sources: Haver/ONS; and IMF staff calculations.
0.0
0.5
1.0
1.5
2.0
2.5
3.0
3.5
4.0
0.0
0.5
1.0
1.5
2.0
2.5
3.0
3.5
4.0
Jan
-12
Ap
r-12
Jul-
12
Oct
-12
Jan
-13
Ap
r-13
Jul-
13
Oct
-13
Jan
-14
Ap
r-14
Headline Inflation
Core Inflation
Inflation Expectations 1/
Inflation and Inflation Expectations
(Percent)
Sources: Bank of England; and ONS.
1/ BoE/GfK Inflation Survey: Inflation Next 12 Mos:
Median Response(NSA) .
-2
-1
0
1
2
3
4
5
6
7
8
-2
-1
0
1
2
3
4
5
6
7
8
Jun
-07
Dec-
07
Jun-0
8
Dec-
08
Jun-0
9
Dec-
09
Jun-1
0
Dec-
10
Jun
-11
Dec-
11
Jun
-12
Dec-
12
Jun
-13
Dec-
13
Nominal Wages ex.
bonuses (3 mma)
Unit Labor Cost
Nominal Wages and Unit Labor Costs
(Y/Y percent change, SA)
Source: Haver/ONS.
UNITED KINGDOM
6 INTERNATIONAL MONETARY FUND
4. Inflation has fallen and cost pressures are contained. Despite the recent rebound in
demand and flat productivity growth since the onset of the crisis, headline inflation has fallen
rapidly, to 1.5 percent, after being well above the 2 percent inflation target over the past four years.
This fall reflects the end of administered price increases, reduced pressures from import prices, and
weak growth in wages and margins owing to slack in labor and goods markets, despite recent
strong employment and output growth.
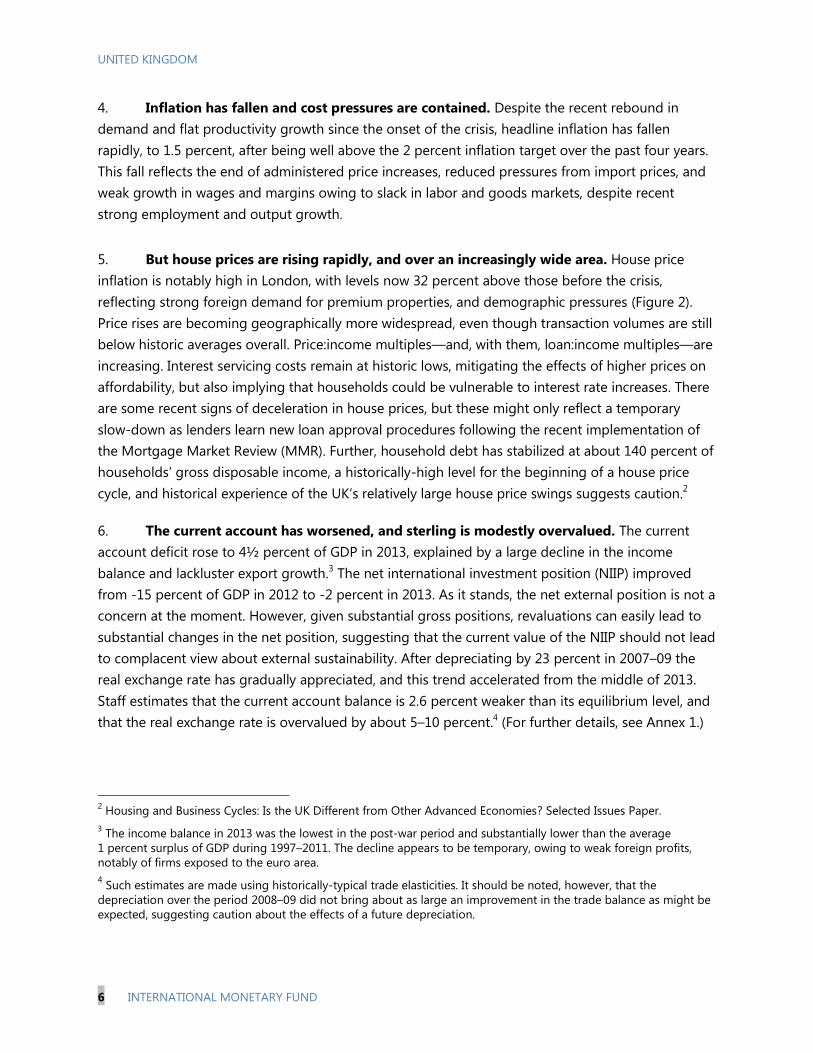
5. But house prices are rising rapidly, and over an increasingly wide area. House price
inflation is notably high in London, with levels now 32 percent above those before the crisis,
reflecting strong foreign demand for premium properties, and demographic pressures (Figure 2).
Price rises are becoming geographically more widespread, even though transaction volumes are still
below historic averages overall. Price:income multiples—and, with them, loan:income multiples—are
increasing. Interest servicing costs remain at historic lows, mitigating the effects of higher prices on
affordability, but also implying that households could be vulnerable to interest rate increases. There
are some recent signs of deceleration in house prices, but these might only reflect a temporary
slow-down as lenders learn new loan approval procedures following the recent implementation of
the Mortgage Market Review (MMR). Further, household debt has stabilized at about 140 percent of
households’ gross disposable income, a historically-high level for the beginning of a house price
cycle, and historical experience of the UK’s relatively large house price swings suggests caution.2
6. The current account has worsened, and sterling is modestly overvalued. The current
account deficit rose to 4½ percent of GDP in 2013, explained by a large decline in the income
balance and lackluster export growth.3 The net international investment position (NIIP) improved
from -15 percent of GDP in 2012 to -2 percent in 2013. As it stands, the net external position is not a
concern at the moment. However, given substantial gross positions, revaluations can easily lead to
substantial changes in the net position, suggesting that the current value of the NIIP should not lead
to complacent view about external sustainability. After depreciating by 23 percent in 2007–09 the
real exchange rate has gradually appreciated, and this trend accelerated from the middle of 2013.
Staff estimates that the current account balance is 2.6 percent weaker than its equilibrium level, and
that the real exchange rate is overvalued by about 5–10 percent.4 (For further details, see Annex 1.)
2 Housing and Business Cycles: Is the UK Different from Other Advanced Economies? Selected Issues Paper.
3 The income balance in 2013 was the lowest in the post-war period and substantially lower than the average
1 percent surplus of GDP during 1997–2011. The decline appears to be temporary, owing to weak foreign profits,
notably of firms exposed to the euro area.
4 Such estimates are made using historically-typical trade elasticities. It should be noted, however, that the
depreciation over the period 2008–09 did not bring about as large an improvement in the trade balance as might be
expected, suggesting caution about the effects of a future depreciation.
UNITED KINGDOM
INTERNATIONAL MONETARY FUND 7
OUTLOOK AND RISKS
7. Strong growth and low inflation are expected to persist. Real GDP is projected to
expand by 3.2 percent in 2014 and 2.7 percent in 2015, before growth gradually returns to trend
rates. Business investment is expected to be strong, given the sharp decline in uncertainty about the
prospects for final demand, relatively healthy corporate balance sheets, and improvements in
domestic credit and financial market conditions.5 The projections also assume a slow recovery in
labor productivity growth to average levels, which would support household incomes and allow
inflation to remain close to the target. The output gap is expected to close gradually, enabling
unemployment to reach its natural rate of 5.5 percent by 2019.
8. Important political events are on the horizon. A UK general election is scheduled for May
7, 2015. On September 18, 2014, voters in Scotland will be asked, “Should Scotland be an
independent country?” In the event of a “yes” vote, a newly-independent Scotland would face a
number of international economic issues, including about the allocation of assets and liabilities
currently held by the UK, the exchange rate regime, the financial regulatory and supervisory
framework, and membership of international institutions such as the IMF.
9. Uncertainty about productivity implies upside and downside risks. Accelerating
productivity growth would spur investment and output even further. However, if productivity
continues to be flat, the recovery will eventually stall as remaining spare capacity is exhausted.
Alternatively, if earnings claims increase ahead of productivity, then inflation risks will accelerate.
10. The housing market creates domestic risks. So far, there are few of the typical signs of a
credit-led bubble in the housing market: net credit growth is modest, transaction “churn” is relatively
low, and households are not drawing on housing equity to finance consumption. Nonetheless, a
steady increase in high loan-to-income mortgages implies that households are gradually becoming
more vulnerable to falls in income and interest rate shocks.6
5 The UK’s Prospects for Strong Growth: The Role of Business Investment, Selected Issues Paper.
6 The BoE estimates that a hike in interest rates of 2.5 percentage points would increase the average mortgage
repayment (principal plus interest rate payments) from 21 to 28 percent of gross disposable income. The effect is
relatively large since many mortgagors have fixed-rate contracts that last two to three years (Bank of England
Quarterly Bulletin, 2013Q4).
90
95
100
105
110
115
90
95
100
105
110
115
Jan
-12
Mar-
12
May-
12
Jul-
12
Sep
-12
No
v-12
Jan
-13
Mar-
13
May-
13
Jul-
13
Sep
-13
No
v-13
Jan
-14
Mar-
14
Nominal Effective Exchange Rate, CPI
Real Effective Exchange Rate, CPI
Effective Exchange Rates
(Index, 2010 = 100)
Source: IMF's Information Notice System.
-5
-4
-3
-2
-1
0
1
2
3
-5
-4
-3
-2
-1
0
1
2
3
2007 2008 2009 2010 2011 2012 2013
Trade Income
Transfers CAB
Current Account Balance
(Percent of GDP)
Source: Haver/ONS.

UNITED KINGDOM
8 INTERNATIONAL MONETARY FUND
11. External risks are tilted to the downside. The global economy could see further
disruptions arising from the withdrawal of unconventional monetary policies in the US, a sharp
slowdown of growth in the euro area and across key emerging economies, and increases in
geopolitical tensions. The presence of two globally-systemic UK banks (HSBC and Standard
Chartered) with large exposures to China and Asia also implies potential financial stability risks from
a sharp China slowdown. Although the UK’s direct exposure to these risks through trade and
financial channels is in some cases small, the realization of any one of them, in concert with a re-
pricing of risk from the current unusually low levels, could depress asset prices and damage
confidence.7
MONETARY POLICY
12. Monetary policy has been highly accommodative. Bank rate and QE balances have
remained unchanged, and the Funding for Lending Scheme (FLS) was modified to favor lending to
firms.8 The Bank of England formally implemented a policy of “forward guidance” in August 2013,
very similar to that employed by the Federal Reserve.9
13. Effective monetary conditions have eased further:
Spreads over funding rates have compressed, especially for secured lending and consumer
credit, and have made corporate debt issuance especially attractive.
The flow of credit has increased, reflecting both demand and supply factors. After declining
during 2010–12, consumer credit rebounded strongly in 2013 and has continued to grow at
rates of around 5 percent, year-on-year. The growth of net secured lending has been less
spectacular, at around 1 percent, year-on-year, but both gross lending and repayments have
picked up strongly. Net lending to businesses over the year is still negative, but the rate of
decline has slowed and shows signs of stabilizing.
7 The impact of a disorderly exit from accommodative monetary policy in the US, which leads to a sharp rise in yields
and affects non-banks and banks through the collateral channel, has been a particular focus of this year’s Spillover
Report analysis for the UK.
8 Bank of England has maintained Bank rate at 0.5 percent since April 2009. The Bank has kept a stock of £375bn of
gilts on the books of the Asset Purchase Facility since October 2012. The FLS, introduced in 2012, provided a
collateral swap to lower funding costs for banks that increase any net lending. A new version of the FLS, which came
into effect in February 2014 and runs into 2015, no longer supports new loans to households and favors SME
lending. Since its inception, lenders have drawn £43.3 billion from the FLS, and marginal wholesale funding costs
have fallen around 150–200 basis points.
9 The policy was that policy rates would be held fixed and the stock of assets purchased not reduced at least until the
unemployment rate had fallen to 7 percent, so long as: (i) projected CPI inflation 18 to 24 months ahead were no
more than ½ percentage point above the 2 percent target; (ii) medium-term inflation expectations remained
sufficiently well anchored; and (iii) there were no substantial threat to financial stability that could not be contained
by tools available to the Financial Policy Committee. In February 2014, the unemployment threshold the Bank had set
as a precondition for a rate hike was de-emphasized, with the Bank now communicating that the appropriate path
for Bank rate to eliminate slack over the next 2-3 years and keep inflation at target would likely be gradual.

UNITED KINGDOM
INTERNATIONAL MONETARY FUND 9
14. Monetary policy should stay accommodative—for now. With cost pressures contained
and still some excess supply, accommodative monetary policy is appropriate. Policy might, however,
have to be tightened quickly if costs run ahead of productivity growth or slack is absorbed, and
should be considered if financial stability concerns cannot otherwise be addressed.
15. There are important macroeconomic arguments for raising Bank rate before reducing
QE balances, but operational imperatives may warrant a more flexible approach to
sequencing. When the time comes to begin normalizing monetary conditions, raising the policy
rate first is preferable, from a macroeconomic policy point of view, to selling off assets: the MPC will
likely find it easier to fine tune policy tightening using familiar tools like interest rate increases, an
important consideration while the recovery is still gathering strength, and should changing
conditions require reversing the normalization, the MPC would likely find it easier to calibrate the
response by decreasing the policy rate rather than by repurchasing gilts.10
There is considerable
uncertainty about the equilibrium level of demand for central bank reserves due to the new
regulatory liquidity requirements. Ensuring the smooth functioning of the money market during
policy renormalization may imply that the Bank has to drain some central bank reserves, for
example, issuing at the same time as it starts to increase Bank rate.
10
If interest rates rose and the BoE were to sell gilts, financial losses would likely be realized. However, the QE
operation is fully indemnified by HMT: any financial losses (gains) as a result of the asset purchases should be borne
by (owed to) HMT. The BoE has so far made profits from holding gilts, which have been transferred to HMT.
However, based on the market’s expectations for interest rates, the OBR projects that the BoE would incur cash flow
losses from 2017/18 onward, and the HMT would need to transfer cash to the BoE to cover these losses.
0
2
4
6
8
10
12
14
16
0
2
4
6
8
10
12
14
16
Jan-0
7
Jun-0
7
No
v-07
Ap
r-08
Sep
-08
Feb
-09
Jul-
09
Dec-
09
May-
10
Oct
-10
Mar-
11
Aug
-11
Jan-1
2
Jun-1
2
No
v-12
Ap
r-13
Sep
-13
Feb
-14
Household secured and
unsecured credit 1/
Corporate bonds 2/
Bank loans to businesses 3/
Spreads
(Percent)
Sources: Bank of England; BofA; Merrill Lynch; and IMF staff estimates.
1/ Weighted average of interest rates charged on, inter alia, high -LTV and
low-LTV mortgages, and unsecured loans, over corresponding risk-free
reference rates (for methodology, see BoE Quarterly Bulletin 2014 Q2, pp.
140-141).
2/ Average of option-adjuted spreads for investment-grade and high-yield
bonds over risk-free reference rates.
3/ Spread (over Bank rate) charged on new business loans.
-6
-4
-2
0
2
4
6
8
10
-6
-4
-2
0
2
4
6
8
10
Dec-
10
Mar-
11
Jun-1
1
Sep
-11
Dec-
11
Mar-
12
Jun-1
2
Sep
-12
Dec-
12
Mar-
13
Jun-1
3
Sep
-13
Dec-
13
Mar-
14
Quarterly Change in MFIs' Sterling Net Lending to
Non-Financial Private Sector (SA, GBP billions)
Source: Bank of England.
UNITED KINGDOM
10 INTERNATIONAL MONETARY FUND
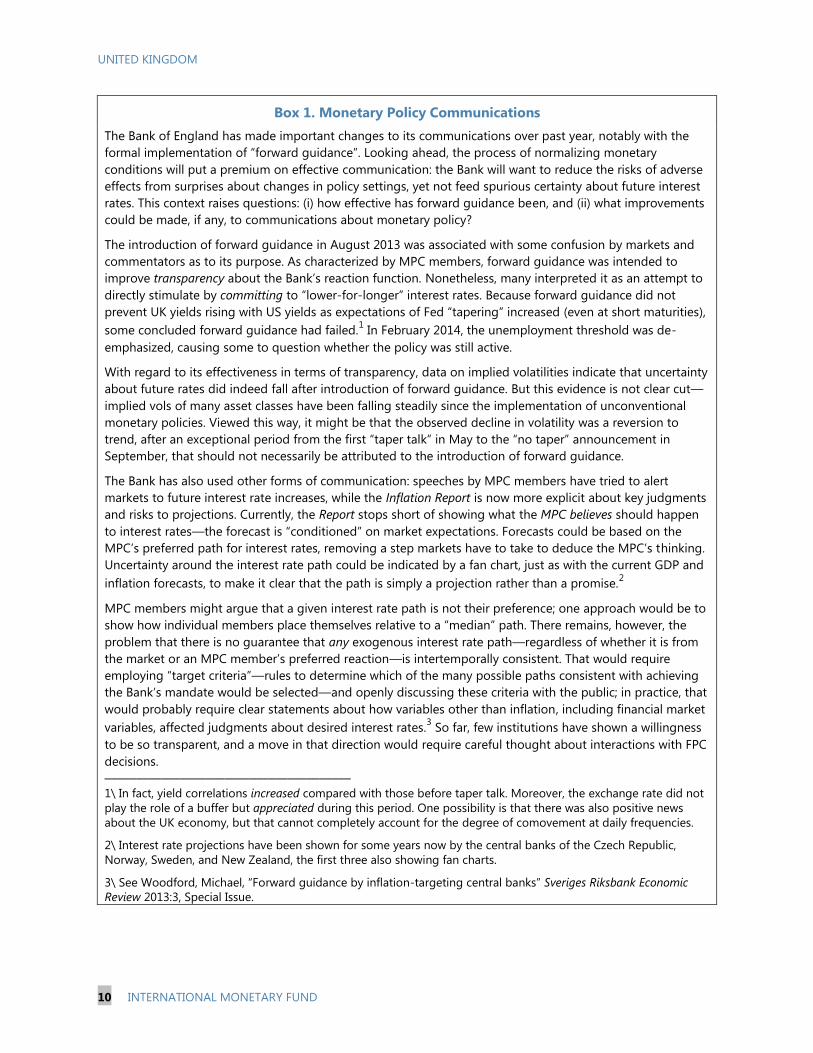
Box 1. Monetary Policy Communications
The Bank of England has made important changes to its communications over past year, notably with the
formal implementation of “forward guidance”. Looking ahead, the process of normalizing monetary
conditions will put a premium on effective communication: the Bank will want to reduce the risks of adverse
effects from surprises about changes in policy settings, yet not feed spurious certainty about future interest
rates. This context raises questions: (i) how effective has forward guidance been, and (ii) what improvements
could be made, if any, to communications about monetary policy?
The introduction of forward guidance in August 2013 was associated with some confusion by markets and
commentators as to its purpose. As characterized by MPC members, forward guidance was intended to
improve transparency about the Bank’s reaction function. Nonetheless, many interpreted it as an attempt to
directly stimulate by committing to “lower-for-longer” interest rates. Because forward guidance did not
prevent UK yields rising with US yields as expectations of Fed “tapering” increased (even at short maturities),
some concluded forward guidance had failed.1 In February 2014, the unemployment threshold was de-
emphasized, causing some to question whether the policy was still active.
With regard to its effectiveness in terms of transparency, data on implied volatilities indicate that uncertainty
about future rates did indeed fall after introduction of forward guidance. But this evidence is not clear cut—
implied vols of many asset classes have been falling steadily since the implementation of unconventional
monetary policies. Viewed this way, it might be that the observed decline in volatility was a reversion to
trend, after an exceptional period from the first “taper talk” in May to the “no taper” announcement in
September, that should not necessarily be attributed to the introduction of forward guidance.
The Bank has also used other forms of communication: speeches by MPC members have tried to alert
markets to future interest rate increases, while the Inflation Report is now more explicit about key judgments
and risks to projections. Currently, the Report stops short of showing what the MPC believes should happen
to interest rates—the forecast is “conditioned” on market expectations. Forecasts could be based on the
MPC’s preferred path for interest rates, removing a step markets have to take to deduce the MPC’s thinking.
Uncertainty around the interest rate path could be indicated by a fan chart, just as with the current GDP and
inflation forecasts, to make it clear that the path is simply a projection rather than a promise.2
MPC members might argue that a given interest rate path is not their preference; one approach would be to
show how individual members place themselves relative to a “median” path. There remains, however, the
problem that there is no guarantee that any exogenous interest rate path—regardless of whether it is from
the market or an MPC member’s preferred reaction—is intertemporally consistent. That would require
employing “target criteria”—rules to determine which of the many possible paths consistent with achieving
the Bank’s mandate would be selected—and openly discussing these criteria with the public; in practice, that
would probably require clear statements about how variables other than inflation, including financial market
variables, affected judgments about desired interest rates.3 So far, few institutions have shown a willingness
to be so transparent, and a move in that direction would require careful thought about interactions with FPC
decisions.
–––––––––––––––––––––––––––––––––––––––
1\ In fact, yield correlations increased compared with those before taper talk. Moreover, the exchange rate did not
play the role of a buffer but appreciated during this period. One possibility is that there was also positive news
about the UK economy, but that cannot completely account for the degree of comovement at daily frequencies.
2\ Interest rate projections have been shown for some years now by the central banks of the Czech Republic,
Norway, Sweden, and New Zealand, the first three also showing fan charts.
3\ See Woodford, Michael, “Forward guidance by inflation-targeting central banks” Sveriges Riksbank Economic
Review 2013:3, Special Issue.

UNITED KINGDOM
INTERNATIONAL MONETARY FUND 11
16. Clarity is needed on the operational framework that will deliver the Bank’s target
interest rate in the future. At the start of QE, the Bank moved away from its reserve averaging-
cum-“corridor system” for Bank rate targeting, to the current “floor system” in which reserves are
remunerated at the Bank rate. With prospects of a rate rise strengthening, the Bank will need to
announce soon what the new monetary control framework will be and how the transition to it will
be managed. An early pronouncement will enable banks to plan accordingly, and help reduce the
possibility of a sudden surge in the volatility of short-term rates (after a long period of very low
volatility) during renormalization.
17. The Bank of England should continue to point to a forthcoming normalization of
monetary policy, while avoiding spurious precision about either the timing or the size of the
move. The Bank of England has taken important steps toward greater transparency, including the
introduction of forward guidance and discussion of key assumptions and alternative scenarios in the
Bank’s Inflation Report.
With policy rates having been so low for so long, and retail spreads having compressed further
since the market stresses in 2012, there is a risk that borrowers and lenders could make
decisions based on assumptions that monetary conditions will remain accommodative
indefinitely. Hence, going forward, the Bank faces the challenge of reducing the risk of potential
market surprises, yet without imparting a false sense of certainty about the evolution of interest
rates (see Box 1).
Further, now that the Financial Policy Committee (FPC) also plays a key role in affecting
economic conditions, the Bank faces the additional challenge of explaining the coordination of
monetary and macroprudential policies, especially as macroprudential measures will have
implications for the pace of economic activity and changes in interest rates will have an impact
on prudential risks.
POLICIES TO ADDRESS HOUSING MARKET RISKS AND
PROBLEMS
18. Prudential, rather than monetary policy tightening, tools should be the first line of
defense against financial risks from the housing market. The objective of policy should be to
address systemic financial risks, such as the increasing vulnerabilities of households to income and
interest rate shocks, rather than to dampen house price growth per se. The first-best response
would be to use more targeted prudential tools, rather than the blunter instrument of interest rate
increases.
19. A number of micro-prudential and credit policy measures have already been
introduced in an effort to take some of the steam out of the housing market.11
In particular:
11
In addition to the measures listed here, the authorities are planning to remove the capital gain tax exemption for
non-residents disposing of residential property, starting from April 2015.
UNITED KINGDOM
12 INTERNATIONAL MONETARY FUND
Micro-prudential policies have, over the last year, been targeted to strengthen banks’ buffers
against their mortgage exposures, both through the application of more stringent mortgage risk
weights and higher provisioning for forborne retail mortgages.
In November 2013, the Funding for Lending Scheme was refocused towards businesses, with
emphasis on SME loans, while household lending is no longer eligible for additional borrowing
allowances from the Bank.
Following the MMR, underwriting standards for owner-occupier mortgages were tightened in
April 2014 to ensure better borrower protection.
20. But in an environment where expectations of capital gains can quickly drive up
household indebtedness—and thus systemic risk for financial institutions—macro-prudential
policy action is also warranted.
Consistent with previous staff advice, the Chancellor has indicated that the Financial Policy
Committee (FPC) would be given explicit powers of direction to limit loan-to-income and loan-
to-value ratios. The FPC currently has powers of direction to set sectoral capital requirements
(including on mortgage exposures) and countercyclical capital buffers for lenders, tools which
are more helpful for targeting banks’ health than for addressing household vulnerabilities.
In June, the FPC has recommended that the PRA and FCA apply a 15 percent limit, effective
October 1, on the proportion of new mortgage loans with loan-to-income at or above 4.5 that
any lender can issue.12
This is a helpful first step toward addressing excessive household
indebtedness at the system-wide level, while allowing individual lenders some flexibility to lend
to households with low current, but high prospective, incomes, or sizable other assets.
The 15 percent limit is presently non-binding for most lenders, is imposed on the flow of new
mortgages rather than on the stock, and does not cover certain types of mortgages (e.g. buy-to-
let and some remortgages) and lenders (e.g. small lenders).13
It will therefore be important to
monitor carefully the adequacy of the current settings and coverage in coming months. For
instance, should housing-related financial risks fail to respond adequately to the measure,
tightening limits on the percentage of loans with high income multiple that lenders can grant—
by lowering the 15 percent ceiling, having it apply to loans starting at a lower income multiple,
and/or broadening coverage to more types of loans or lenders—would be warranted.
Should these measures prove insufficient to contain financial risks from the housing market,
outright caps on LTIs or LTVs may need to be considered. Raising lenders' sectoral capital
requirements would build additional buffers against increased exposures to the housing sector.
12
In parallel, in June the FPC recommended lenders assess mortgage affordability against a 3 percentage point
increase in Bank rate over the first five years of the loan. This measure does not appear to be binding at this time as
most lenders are already using a similar stress interest rate.
13 Only 11 percent of mortgages issued in 2014Q1 had loan-to-income multiples exceeding 4.5.
UNITED KINGDOM
INTERNATIONAL MONETARY FUND 13
21. If macroprudential policy—appropriately calibrated and targeted—proves ineffective
at alleviating risks to financial stability, interest rate hikes should be considered. There is
significant uncertainty around the efficacy of, and lags associated with, macro-prudential measures;
even the best designed measures may not achieve the authorities’ objectives in relation to
addressing risks from the housing market over a given period of time.14
Should macroprudential
measures appear to be ineffective, policy makers would need to weigh the likely collateral damage
to output and employment from a rate hike against the potential costs of an extended period of
household or renewed bank weakness.
22. Supply-side measures are crucial to safeguard affordability and mitigate financial
risks. Fundamentally, house prices are rising because demand outstrips supply. The UK has secular
problem with inadequate housing supply, amplified by a high rate of household formation. The
aftermath of the financial crisis, in which housing starts plummeted, has compounded this problem
and makes addressing “pent-up” demand all the more difficult. Moreover, in an environment in
which trend house price increases are high, surges in house prices can easily be interpreted as
signals that even higher prices are yet to come, reinforcing individuals’ perceptions that they must
do whatever it takes to get on the housing ladder. In such a situation, macroprudential and
monetary policies will only ever be temporary palliatives to an underlying structural problem.
23. New initiatives to spur house building are welcome, but political consensus for further
reform is needed. The government has introduced major changes to the planning system (the
National Planning Policy framework) to create incentives for local councils to increase available land
for housing development, and there are some signs of recovery in housing construction.
Nonetheless, key inefficiencies remain. These include unnecessary constraints on brownfield and
greenfield developments and tax policies that discourage the most economically-efficient use of
property.
24. Help to Buy (HtB) has given lower income households access to mortgage credit, but
should regularly be re-assessed. In the aftermath of the crisis, credit for lower income households
at higher LTVs shrunk considerably. The aim of the second part of HtB is to enable creditworthy
lower-income households to access finance.15
Data show that guaranteed mortgages so far have, on
average, been few (relative to the volume of housing transactions), small in value (relative to
national averages), and mostly for properties outside of London and the south east, where price
increases have been most dramatic. The program has also played a role in unlocking mortgage
credit for lower-income borrowers from other sources. If these alternative flows increase
significantly, the FPC and the Treasury may wish to consider whether HtB should be modified or
14
See Macroprudential Policy: Lessons from Advanced Economies, Selected Issues Paper, for an evaluation of
macroprudential measures used in other countries.
15 HtB has two components. The first consists of a home-equity loan to finance the purchase of newly-built houses.
The second provides a government guarantee for mortgages provided by banks and other lenders. The first part of
HtB, the equity loan scheme, provides interest-free loans for 5 year up to 20 percent of the value of a new-build
home. The benefit of this part of HtB is that it stimulates housing supply. By April, there were 20,548 new properties
purchased with this scheme, where the average price was £205,424. 87 percent of the equity loans were offered to
first-time buyers.
UNITED KINGDOM
14 INTERNATIONAL MONETARY FUND
even remains necessary for the full three years of the policy. And as the volume of high-LTV
transactions rises, the FPC will need to evaluate if the program is contributing to financial risks.16
FISCAL POLICY
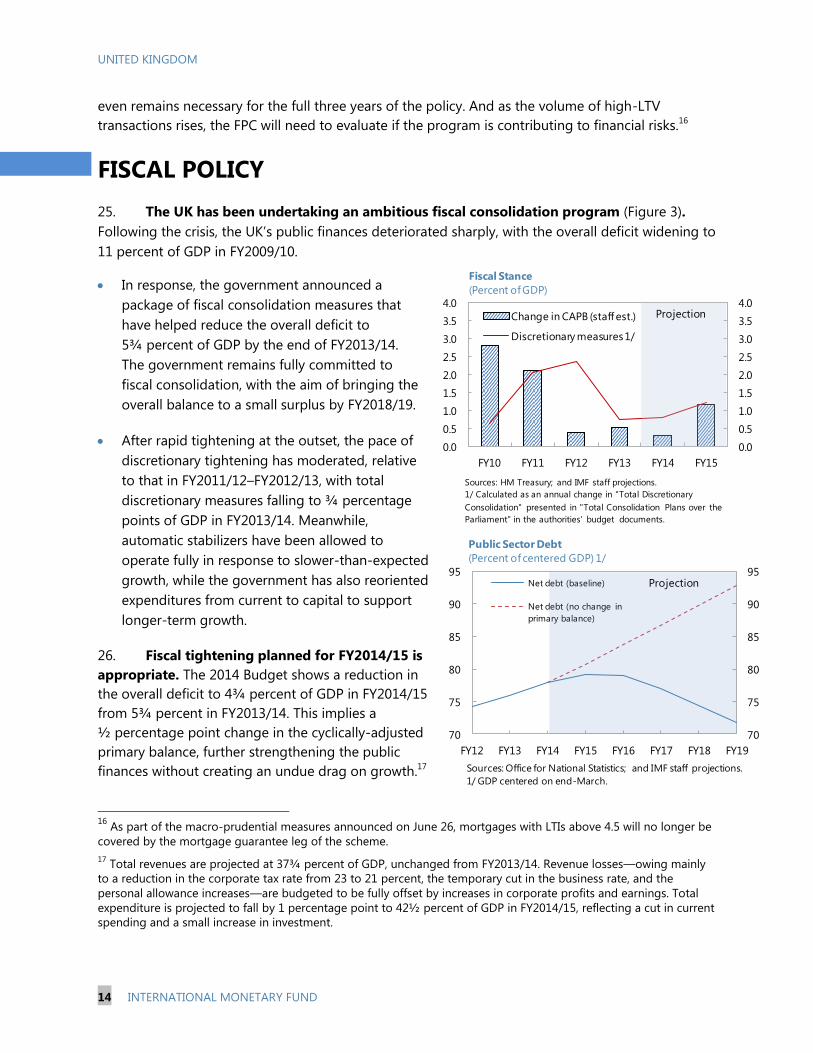
25. The UK has been undertaking an ambitious fiscal consolidation program (Figure 3).
Following the crisis, the UK’s public finances deteriorated sharply, with the overall deficit widening to
11 percent of GDP in FY2009/10.
In response, the government announced a
package of fiscal consolidation measures that
have helped reduce the overall deficit to
5¾ percent of GDP by the end of FY2013/14.
The government remains fully committed to
fiscal consolidation, with the aim of bringing the
overall balance to a small surplus by FY2018/19.
After rapid tightening at the outset, the pace of
discretionary tightening has moderated, relative
to that in FY2011/12–FY2012/13, with total
discretionary measures falling to ¾ percentage
points of GDP in FY2013/14. Meanwhile,
automatic stabilizers have been allowed to
operate fully in response to slower-than-expected
growth, while the government has also reoriented
expenditures from current to capital to support
longer-term growth.
26. Fiscal tightening planned for FY2014/15 is
appropriate. The 2014 Budget shows a reduction in
the overall deficit to 4¾ percent of GDP in FY2014/15
from 5¾ percent in FY2013/14. This implies a
½ percentage point change in the cyclically-adjusted
primary balance, further strengthening the public
finances without creating an undue drag on growth.17
16
As part of the macro-prudential measures announced on June 26, mortgages with LTIs above 4.5 will no longer be
covered by the mortgage guarantee leg of the scheme.
17 Total revenues are projected at 37¾ percent of GDP, unchanged from FY2013/14. Revenue losses—owing mainly
to a reduction in the corporate tax rate from 23 to 21 percent, the temporary cut in the business rate, and the
personal allowance increases—are budgeted to be fully offset by increases in corporate profits and earnings. Total
expenditure is projected to fall by 1 percentage point to 42½ percent of GDP in FY2014/15, reflecting a cut in current
spending and a small increase in investment.
0.0
0.5
1.0
1.5
2.0
2.5
3.0
3.5
4.0
0.0
0.5
1.0
1.5
2.0
2.5
3.0
3.5
4.0
FY10 FY11 FY12 FY13 FY14 FY15
Change in CAPB (staff est.)
Discretionary measures 1/
Sources: HM Treasury; and IMF staff projections.
1/ Calculated as an annual change in "Total Discretionary
Consolidation" presented in "Total Consolidation Plans over the
Parliament" in the authorities' budget documents.
Projection
Fiscal Stance
(Percent of GDP)
70
75
80
85
90
95
70
75
80
85
90
95
FY12 FY13 FY14 FY15 FY16 FY17 FY18 FY19
Net debt (baseline)
Net debt (no change in
primary balance)
Projection
Public Sector Debt
(Percent of centered GDP) 1/
Sources: Office for National Statistics; and IMF staff projections.
1/ GDP centered on end-March.

UNITED KINGDOM
INTERNATIONAL MONETARY FUND 15
27. There is a clear need to put debt on a downward path to ensure long term fiscal
sustainability. Despite the significant consolidation over the past few years and faster output
growth, public debt dynamics are yet to stabilize. Public sector net debt is projected to increase to
about 80 percent by FY2015/16, due to still-large primary deficits and rising interest costs. In this
context, the government’s objective of eliminating the overall deficit by FY2018/19, implying some
6 percentage point of GDP reduction in the overall deficit over the next five years, is appropriate.18
28. But the overall consolidation plan implies difficult choices. Because national elections
are scheduled for May 2015, fiscal plans are specified only through FY2015/16. However, achieving
the required medium-term deficit reduction only through spending measures would likely require
some combination of cuts to previously prioritized areas (such as health and education), further
reductions in the budgets of departments that have already faced significant cutbacks, or cuts in
social security spending.
29. A wider range of options—including both revenue and expenditure items—should be
explored to meet the medium-term fiscal objectives. Consolidation efforts should also carefully
consider issues of equity and efficiency.
Efforts to enhance efficiency have already lowered spending. In searching for further efficiency
gains, the government should prioritize the delivery of quality health and education services, as
well as infrastructure, to help bolster the productive capacity of the economy. Means testing for
social benefits could be used more widely, to reduce spending while ensuring that basic needs
continue to be met. Entitlement reforms could both yield budgetary savings and improve labor
supply incentives.
Revenue measures could include reducing tax expenditures (such as VAT zero-ratings, which
amount to some 2½ percent of GDP annually) and greater reliance on Pigouvian taxes
(including those on carbon and congestion). Property taxation could be reformed, to stimulate
housing supply, improve housing allocation, and boost revenues. This could include
appropriately updating valuations for taxable property.
Recent efforts by the government to analyze and document the distributional impact of the
consolidation are welcome. In developing and implementing its medium-term plans, the
government should continue to undertake and publicize this type of analysis to allow for an
informed public discussion.
30. The planned review of the fiscal framework is opportune. Fiscal policy is currently
framed by two objectives: (i) balancing the structural current budget by the end of a rolling 5-year
period; and (ii) putting the net debt-to-GDP ratio on a downward path by FY2015/16. The first of
these objectives is expected to be met within a few years, and the latter will be redundant soon.
Hence, a new framework will be needed. The new framework should have clearly defined operating
targets that can be directly controlled by policymakers and are closely linked to debt and its
sustainability (such as overall deficits), while allowing for flexibility to deal with unexpected shocks.
18
See also the Debt Sustainability Analysis in Annex 2.

UNITED KINGDOM
16 INTERNATIONAL MONETARY FUND
Formalization of the Spending Review process could help reduce uncertainty about the medium-
term expenditure framework.
FINANCIAL SECTOR POLICIES
31. Important progress has been made to
strengthen banks’ balance sheets and ability to lend.
Following the Bank of England’s 2013 capital-building
exercise, major UK banks’ common equity tier 1 ratios
(on a fully-loaded Basel-III basis) have risen above
9 percent, while provisioning for future loan losses and
conduct-related costs has strengthened. Encouragingly,
the capital build was largely driven by new capital
issuance and non-core deleveraging. Liquidity indicators
have also improved, with a further reduction in wholesale
funding. Overall, faster balance sheet repair has been
associated with a fall in banks’ borrowing costs to
historic lows, and rising equity valuations. In turn, credit
conditions have eased and loan growth is resuming.
0
5
10
15
20
25
30
0
5
10
15
20
25
30
PPI IRS LIBOR Total
2011 2012 2013
Major Banks' Provisions for Conduct-Related Costs
(Billions Pounds)
Source: Annual statements for RBS, HSBS, Barclays and
LBG.
6 8 10 12 14 16 18 20
Svenska
Swedbank
Skandinaviska
Nordea
DNB
KBC
UBS
Danske
Intesa
ABN Amro
HSBC
BPCE
LBG
BNP Pariabas
Credit Suisse
ING
Deutsche
Unicredit
Barclays
Commerzbank
RBS
End-2013 Basel-III Common Equity Tier 1
Ratios Reported by Selected European
Banks (Percent; fully-loaded)
Green
bars
represent
end-2012
positions;
beige bars
show y-o-y
increase to
end-2013.
Source: SNL Financial. Ratios reported by banks may
not be strictly comparable given differences in
banks' definitions and assumptions about Basel III
end-point rules.
2012 2013 Change
Capital adequacy
Total capital ratio 16.2 18.8 2.5
Tier 1 ratio 13.2 14.5 1.3
Tangible common equity ratio 4.1 4.5 0.3
Leverage ratio 4.6 4.8 0.2
Asset quality
Provision for loan loss / total loans 0.9 0.9 0.0
Reserves for loan loss (% of non-performing assets) 39.4 49.3 9.9
Non-performing assets / total loans 6.8 5.6 -1.2
Loan growth (including to banks) -2.1 -2.7 -0.6
Profitability
Net interest income / avg. earning assets 1.40 1.39 -0.01
Efficiency ratio (overheads/revenue) 60.6 65.0 4.4
Return on assets -0.02 -0.06 -0.04
Return on common equity -1.2 -1.6 -0.4
Trading income (% of total revenue) 8.4 15.0 6.5
Liquidity
Total loans to total deposits 104.2 98.1 -6.1
Wholesale funding / total liabilities 59.3 53.5 -5.9
ST borrowings / total liabilities 5.9 5.4 -0.5
Liquid assets / total assets 16.3 16.4 0.1
1/ Simple average for Barclays, HSBC, LBG and RBS.
Financial Soundness Indicators for Major UK Banks 1/(Percent)
Source: Bloomberg, based on data published by individual banks. Indicators
reported on a Basel-II basis.
UNITED KINGDOM
INTERNATIONAL MONETARY FUND 17
32. But further capital effort will likely be
needed over the medium-term, and in the face of
structural headwinds to profitability. Some major
UK banks’ capital positions still fall short of most
European peers’. Banks are factoring into their
capital plans expectations of higher capital in the
future, and these plans should receive helpful
support from the recovery in the UK economy and
global demand for financial services. However,
building internal equity will remain challenging due
to a longer- and larger-than-expected drag from
conduct-related costs; a weak outlook for investment
banking returns; and the associated need—in some
cases—to undertake and/or complete costly
business restructuring.
33. There are also new risks looming on the
horizon. Banks’ exposures to the housing market
have increased over the last two years, with the share
of residential mortgages in earning assets among the
five major lenders rising by an average of almost 4 percentage points. Other new risks include the
exposure of the two international banks, HSBC and Standard Chartered, to a China slowdown; and
indirect financial spillovers from a potential geopolitical crisis involving Russia (banks’ direct
exposures are small). Overlaying these is the concern that a disorderly correction in markets’ pricing
of risk could entail losses for many globally-connected UK-resident banks and dealers.
0
20
40
60
80
100
120
0
10
20
30
40
50
60
70
80
90
Jun 0
8
Dec
08
Jun 0
9
Dec
09
Jun 1
0
Dec
10
Jun 1
1
Dec
11
Jun 1
2
Dec
12
Jun 1
3
Dec
13
Jun 1
4
Source: Bloomberg.
US Implied Volatility
(VIX Index)
0
20
40
60
80
100
0
50
100
150
200
250
300
Jun 0
8
Dec
08
Jun
09
Dec
09
Jun
10
Dec
10
Jun 1
1
Dec
11
Jun 1
2
Dec
12
Jun
13
Dec
13
Jun
14
GBP Short-Rate Option-Implied Volatility
FTSE 100 Option-Implied Volatility (right scale)
Source: Bloomberg.
1/ Short-rate volatilities represent the 3-month option-
implied volatilities of 1-year swaps.
UK Implied Volatilities
0 10 20 30 40
Canada
United States
Germany
France
Japan
Australia
Netherlands
Switzerland
United Kingdom
HK+SG
China
India+MIT
Source: BIS Consolidated Banking Statistics (Ultimate
Risk Basis). HK denotes China: Hong Kong SAR, and
MIT denote Malaysia, Indonesia and Thailand.
Banks' Consolidated Foreign Claims on
Selected Asian Economies
(Percent of GDP; end-Sep-2013)
UNITED KINGDOM
18 INTERNATIONAL MONETARY FUND
34. The two government-intervened banks face
divergent challenges. Returning RBS to profitability
has proven difficult, due partly to its complex business
model, but also to its outsized operating costs. The new
strategy—featuring an internal bad bank and refocusing
a more efficient core bank on UK retail and corporate
activity—seems appropriate, but execution risks remain.
By contrast, LBG’s strong performance has enabled the
government to sell one third of its shareholding (which
is now below 25 percent) over the past year, but the
bank’s large and rising exposure to the UK housing
market remains a source of risk.
35. The authorities are seeking to institute
a robust regulatory capital framework for
banks based on risk-weighted capital, the
leverage ratio and stress testing. This multi-
pronged approach is an appropriate response to
dangers revealed by the crisis of relying on a
single measure of capital adequacy. Given the
size and systemic nature of the UK financial
system, there is a strong case to fully utilize the
flexibility afforded under the Capital
Requirements Regulation and Capital
Requirements Directive (CRDIV) in relation to
Pillar-II and countercyclical buffers; and to
introduce a leverage ratio requirement above
Basel minima. However, the authorities will need
to communicate clearly and early their regulatory
expectations under this more complex regime to
alleviate uncertainty for complying institutions.
36. The 2014 concurrent stress tests, coordinated with the European Banking Authority
(EBA), will offer a timely assessment of the ability of the eight major UK banks to withstand
large shocks. The EBA’s common adverse scenario and the Bank’s UK-specific scenario helpfully
complement each other.19
The success of the stress tests will rest on maintaining the improved
coordination between macro- and micro-prudential authorities; clear communication about capital
definitions, hurdle rates and any required capital actions by banks (including on capital planning
frameworks); and sufficiently-disaggregated disclosure of results. It would also be important for any
required capital actions (especially those for the two international banks) to be fully informed by the
19
The former features a rise in bond yields and reversal in risk assessment, especially toward emerging markets; the
latter combines a negative productivity surprise, a snapback in the policy rate, and a 35 percent fall in house prices.
In percent 2011 2013Increase
(ppt)
Barclays plc 12.0 14.4 2.5
HSBC Bank plc 10.4 11.6 1.2
LBG Group plc 39.4 44.6 5.2
Nationwide BS 68.8 75.0 6.2
RBS 10.2 14.1 3.9
Average 28.2 32.0 3.8
Sources: Fitch; RBS Annual Reports; and IMF
staff estimates.
Residential mortgage loans-to-total earning
assets ratio for major UK lenders
0
1
2
3
4
5
6
0
1
2
3
4
5
6
Tier 1 Leverage Ratios for Selected Systemically-
Important Banks (Percent; end-March-2014)
Sources: Citi Research, 19 June 2014; Company accounts; and IMF staff
calculations.
1/ Includes impact of Deutsche's capital raise and Credit Suisse's US
conduct settlement in May-June 2014.
2/ Supplemental leverage ratios for US banks; CRDIV definition for EU
banks (except Swiss banks, for which FINMA definition).
3/ For LBG and HSBC, data is end-2013.

UNITED KINGDOM
INTERNATIONAL MONETARY FUND 19
results of sequential stress tests conducted by the Prudential Regulation Authority (PRA) to assess
banks’ resilience to a sharp China slowdown.
37. To more comprehensively identify risks in the system, broadening the institutional
perimeter of the stress tests and strengthening supervision beyond the major banks would be
important. The authorities have laid out medium-term plans that could see the concurrent stress
testing framework extended to systemic entities beyond major UK banks. In addition, there are
broader efforts aimed at strengthening the monitoring of risks in the shadow banking system. These
efforts are critical given the size of shadow banking activity routed through the UK, recent evidence
of search-for-yield and leverage build-up outside the banking system, and the associated risk of
outward financial spillovers in the event of an abrupt change in risk sentiment.20
Any additional
budgetary resources, regulatory perimeter adjustments, and international coordination initiatives (in
relation to “global” shadow banking), required to support these efforts should be prioritized.
STRUCTURAL FINANCIAL REFORMS
38. The new regulatory architecture is settling in. The new structure of the FPC, the PRA and
the Financial Conduct Authority (FCA) has functioned relatively smoothly over the last year, and is
helping to deliver a more resilient financial system. Looking ahead, maintaining strong coordination
across bodies (on microprudential and macroprudential matters) and ensuring coherent
communication will be vital to avoid uncertainty, such as of the kind faced by banks around the
2013 Asset Quality Review, or by insurers earlier this year. Separately, given the Bank of England’s
expanded mandate and potential for future changing demands, it would be important to maintain
and further develop effective internal and external oversight arrangements.
39. Reforms to the Bank of England’s Sterling Monetary Framework will provide a further
buffer against shocks. The recently strengthened liquidity backstops should help solvent UK banks
ride out temporary funding stresses, which otherwise carry the potential for disruptive domestic and
outward credit spillovers. However, easier access to the backstops could increase banks’ appetite for
risk-taking, unless supervision is commensurately strengthened. This consideration should also
guide the implementation of the authorities’ recent decision to offer backstops to major broker-
dealers and central counterparties. Separately, there may be a need to ensure that the EU Bank
Recovery and Resolution Directive (BRRD) does not inhibit the Bank’s ability to extend emergency
liquidity support.21
20
A companion Selected Issues Paper on outward financial spillovers from the UK finds that a sharp worldwide
interest rate increase (or “snapback”) could place leveraged global shadow banks under pressure, opening the
possibility of contagion to the G-14 dealer banks sitting at the center of world repo markets, and leading, eventually,
to external deleveraging by those banks and, hence, adverse outward credit spillovers.
21 The Bank’s lean capital position effectively requires that it be indemnified by the government against any losses on
its emergency liquidity assistance to illiquid, but solvent institutions, which is a form of State Aid. However, under the
recently-enacted EU BRRD it could be interpreted that State Aid would trigger mandatory write down or conversion
of certain capital instruments, which could prove counterproductive to stabilization efforts. If the Bank were not
indemnified, this could result in negative Bank equity should losses materialize; this would argue for an ex ante
increase in the level of Bank capital.
UNITED KINGDOM
20 INTERNATIONAL MONETARY FUND
40. Measures to address the problem of Too-Important-To-Fail institutions are advancing,
but are not yet complete. The ring-fencing of banks’ retail operations, new bail-in and other
resolution powers for the Bank of England, and the development of resolution strategies and plans
for systemically important banks all constitute important reforms. As the authorities have
acknowledged, completing the task requires a clear strategy for systemic entities outside the ring
fence and maintaining positive momentum on cross-border cooperation on resolution of global
banks (including international agreement on gone-concern loss-absorbing capacity). This agenda
must be implemented in a way that ensures international consistency of national reforms, and
guards against regulatory arbitrage. In particular, it will be important to ensure that excessive
penalization and/or reduced profitability of certain activities (such as investment banking) does not
stifle market making or result in a migration of risks elsewhere (such as to non-bank financial
institutions).
41. The authorities are adopting a more determined approach to tackling rogue banking
practices. A new legal regime to hold senior bank managers more directly accountable for
misconduct is being extended to all UK-resident banks and, subject to consultation, branches of
foreign banks. A “Fair and Effective Markets Review” has been launched with a view to: strengthen
the governing principles and oversight tools for already-regulated wholesale fixed income,
commodity and currency markets; assess the case for extending the regulatory perimeter for
unregulated wholesale markets (such as FX and precious metals) where international coordination
may be required; and subject additional benchmarks (other than LIBOR) to recent UK legislation
providing for, inter alia, criminal sanctions for market manipulation. These measures should help to
reform banking culture, ensure the integrity of financial markets, and strengthen confidence in the
UK’s financial center as a global public good.
42. Ongoing efforts to enhance entity transparency and address tax evasion are welcome.
Following-up on its G8 presidency objectives, the UK aims to fight tax evasion including by
improving transparency of companies’ and trusts’ ownership, both in the UK and in British overseas
territories (BoTs) and Crown dependencies (CDs), and by mobilizing the anti-money laundering
(AML) framework. The consultation process has concluded and primary legislation is expected to be
introduced in Parliament soon. Depending on the extent to which the international standards are
reflected in the new legislation, its implementation may necessitate economic adjustments,
particularly in BoTs and CDs. This could also generate spillovers on other financial centers as a
consequence of the transmission of UK regulation through global banks located in the UK. In this
regard, the UK authorities indicated that they do not play any role in ensuring corporate
transparency or in enforcing legislation on tax crimes in the BoTs and CDs.
SUPPLY-SIDE POLICIES
43. To continue growing at historical trends the UK economy needs to address structural
impediments in the economy. Although cyclical factors could partially account for the weakness in
productivity growth, several structural factors in the UK economy are dampening long-run potential
growth:
UNITED KINGDOM
INTERNATIONAL MONETARY FUND 21
Infrastructure: Reducing bottlenecks in infrastructure, notably in transportation and energy, is a
prerequisite to sustaining higher productivity gains. Currently, road congestion in the UK
remains among the highest in the EU, and 20 percent of electricity generating capacity is
expected to close within the next decade. A further expansion in public investment in
infrastructure projects, within the medium-term fiscal framework, along with the implementation
of well-designed guarantee schemes, could provide the necessary infrastructure to address
capacity constraints.
Education: Improving the economy’s skill base by investing in human capital not only can
enhance the potential growth of the economy, but can also foster more inclusive growth. While
the UK leads OECD countries in terms of educational attainment in tertiary education, it lags in
the educational attainment of the population aged 15–19 years old. Only 78 percent of this
population segment is enrolled in education, below the OECD average. A further expansion in
vocational training and apprenticeship programs could provide the needed skills for the young
and reduce the double-digit youth unemployment rate.
Immigration: Restrictive immigration policies could have a negative impact on productivity
growth. Relaxing immigration requirement in areas with labor shortages, such as manufacturing,
could provide a boost to productivity and facilitate the rebalancing of the UK economy. In
addition, loosening the visa regime for foreign students could contribute to expanding the
skilled labor force and to improving the prospects of higher education exports.
THE AUTHORITIES’ VIEWS
44. The authorities had broadly similar views on recent developments. Staff at the Treasury
and Bank of England shared the view that the recovery has momentum and is becoming more
balanced. Uncertainty about productivity remained high. The authorities noted regional differences
in house prices and their driving factors and, while cautious about future prospects, noted that there
had not so far been widespread deterioration in lending standards or signs of “bubble”-like
behavior.
45. The authorities also had qualitatively very similar views on prospects for the UK
economy, with strong growth in 2014 reverting to trend, moderate increases in productivity growth,
and little contribution from net exports. There was also broad agreement about risks: on the
domestic side, from productivity and vulnerability of indebted households to interest rate and
income shocks; on the external side, from potential for financial disruption from normalization of
monetary policy in the US; risks associated with a sharper-than-expected slowdown in China; and
weak demand from significant export economies, especially the euro area. More generally, the
authorities expressed concern about under-pricing of risk by markets.
46. Monetary policy settings were viewed as appropriate. Careful communications would be
needed to make sure that the public understood that the MPC would, in time, need to raise rates
from current levels. The process of normalizing monetary policy should begin with rises in Bank rate

UNITED KINGDOM
22 INTERNATIONAL MONETARY FUND
and should proceed gradually. And the “natural” rate of interest is likely to remain below levels seen
prior to the financial crisis. Asset sales should only be considered once Bank Rate had reached a
level from which it could be cut in the face of a negative shock. Compared with the pre-crisis period,
increased demand for liquid assets could mean that the Bank of England’s balance sheet would
remain large by historical standards.
47. Macroprudential policies were widely agreed to be the first response to risks from the
housing market. The MMR and lenders’ own tighter lending standards should act to limit some
risks. Nonetheless, additional macroprudential measures were justified, as reflected in the FPC’s
recent recommendations for mortgage lenders to apply more stringent interest rate stress tests (an
increase in Bank rate of 3 percentage points) as part of their MMR affordability assessments and to
limit the proportion of new lending at high loan-to-income multiples. Uncertainty about the effects
of such tools implied taking early and gradual steps. However, it would also be important to
improve the understanding of the general public and of the other domestic institutions for the
active use of macroprudential tools.
48. The authorities emphasized supply-side constraints and regional disparities behind
house prices. Supply had picked up during the past year in response to policy initiatives, but was
well below levels needed to satisfy demand. Further progress on planning reform was needed and
would require broad political consensus. There are no plans for property tax reform at present. Help
to Buy had brought about some increase in construction, while transactions so far under the
mortgage guarantee part of the scheme were not playing a significant role in rising house prices.
49. The overall fiscal deficit had come down, but further consolidation efforts would be
needed to bring down public debt. Given national elections in 2015, the details of medium-term
consolidation plans have not yet been specified. Given that revenue measures had been front
loaded and risks to future revenue (especially, arising from structural changes to the oil and financial
sectors), consolidation should seek to find the appropriate mix between expenditure and revenue
measures, ideally from including additional gains in expenditure efficiency, with due attention to
social equity. Spending decisions should look to prioritize efficiency gains and areas of spending
that provide value for money, while continuing to provide high quality outputs in key areas
including science, infrastructure, education, and health.
50. Financial policies were seen as successful in bringing banks to better health, but many
challenges remained. Banks had more capital, and significant progress had been made on the two
state-intervened entities, with a complete sale of the government’s stake in LBG feasible over the
medium term. The authorities judge RBS’s recently-announced restructuring strategy to be on
course, but acknowledge the scale of the ambition means that some challenges remain. The three-
pronged capital framework, including a leverage ratio requirement, was viewed as particularly
important, moving banks away from a single concept or target number for capital adequacy. The
authorities emphasized the importance of the concurrent stress tests in targeting UK-specific risks
and global shocks.

UNITED KINGDOM
INTERNATIONAL MONETARY FUND 23
51. Structural financial reforms had been far reaching and were now having significant
effects. The new architecture focuses on coordination and communication, with the ultimate goal of
ensuring forward-looking, judgment-based supervision of the UK financial system (as an important
public good), which has required culture reforms for both firms and regulators. The introduction of
ring fencing and, in particular, new resolution and bail-in powers for the Bank of England, and the
continuing development of resolution strategies and plans, is helping to make systemically-
important firms more resolvable and so help to address the Too-Important-to-Fail problem.
Securing international agreements on GLAC and cross-border enforceability of resolution actions
later this year (in line with the FSB’s commitments to the G20 leaders) will also be critical in this
respect. Reforms to the Sterling Monetary Framework, accompanied with deeper and broader
supervision of the backstopped entities, would ensure that the UK financial system is resilient to
shocks, and remains a global public good, with favorable spillovers to the rest of the world.
52. The authorities noted the importance of accurate and reliable data in forming an
assessment of the economy. Analysis of some important areas—notably business investment—was
constrained by the level of detail available. National accounts investment and trade data were
sometimes at odds with other survey sources, and revisions in recent years had been substantial.
New accounts to meet ESA requirements, forthcoming toward the end of the year, could have
potentially significant changes.
STAFF APPRAISAL
53. The rebound in growth is strong and welcome. There are promising signs that demand is
becoming more balanced, with growth in business investment now running ahead of private
consumption. Employment growth has remained strong. Despite this, inflation has been contained,
justifying the Bank of England’s stance of “looking through” above-average headline inflation and
focusing on underlying pressures. With better growth has come an improvement in the public
finances, albeit one that has been somewhat less “tax rich” than might be hoped for based on the
improvement in GDP growth.
54. The exchange rate appears moderately overvalued. Although the net external asset
position has improved, due largely to revaluation effects, the persistent trade deficit suggests an
overvaluation in the order of 5–10 percent. However, such measures come with a wide range of
uncertainty.
55. An immediate challenge to the authorities is to ensure that strong growth persists,
without creating inflationary pressures or financial stability risks. Much depends on
productivity developments—even a relatively modest increase in labor productivity would facilitate
higher real wages, which will be needed to sustain the recovery. Should productivity fail to pick up,
the MPC would eventually have to tighten monetary conditions to dampen inflationary pressures, in
keeping with its mandate. As with many previous cycles in the UK, the housing market is becoming
buoyant, creating risks to household finances and affordability and standards of living. Compared
with previous cycles, however, the Bank of England is equipped with a clear mandate and tools to

UNITED KINGDOM
24 INTERNATIONAL MONETARY FUND
address such risks, which it has already begun to use. The impact of these tools will need to be
monitored closely, and settings (including with respect to coverage) may need to be modified over
time to maximize their benefits. Interest rate increases could be considered, should macroprudential
tools prove ineffective, with careful consideration to the tradeoff between damage to the real
economy and the ultimate costs of financial vulnerabilities.
56. The UK’s distinct role as a global financial centre necessitates ongoing efforts to
strengthen bank balance sheets and implement durable structural reforms. The new financial
regulatory architecture is helping to build a more resilient financial system. The recent Bank of
England initiatives to raise bank capital and provisioning, institute a robust multi-pronged
framework for assessing capital adequacy, stress test major banks for large shocks, and strengthen
liquidity backstops for banks and some systemic nonbanks are welcome. Looking ahead, it will be
important to strengthen the monitoring of risks in the shadow banking system; maintain clear
communication and coordination across regulatory bodies; and ensure effective oversight
arrangements at the Bank of England (given its expanded mandate). The authorities are alert to the
remaining work needed on banking culture and Too-Important-To-Fail reforms. It would be
important to implement these in a way that ensures international consistency of national reforms,
and avoids regulatory arbitrage.
57. Fiscal policy is appropriate for the immediate term, but a range of options will need to
be considered to achieve further consolidation over the medium term. The measures budgeted
for this fiscal year strike an appropriate balance by strengthening the public finances without
creating undue drag on growth. To put debt on a downward path, more consolidation will be
needed over the medium term. There remains potential for further revenue gains, notably from
eliminating tax expenditures; the alternative of relying entirely on expenditure cuts would likely
imply reduced delivery of key public services and/or highly regressive policies.
58. It is recommended that the next Article IV consultation with the United Kingdom be held on
the standard 12-month cycle. An FSAP assessment is expected to be conducted in time for 2016
Article IV consultation discussions, in line with the usual five-year cycle for jurisdictions with
systemically important financial sectors.
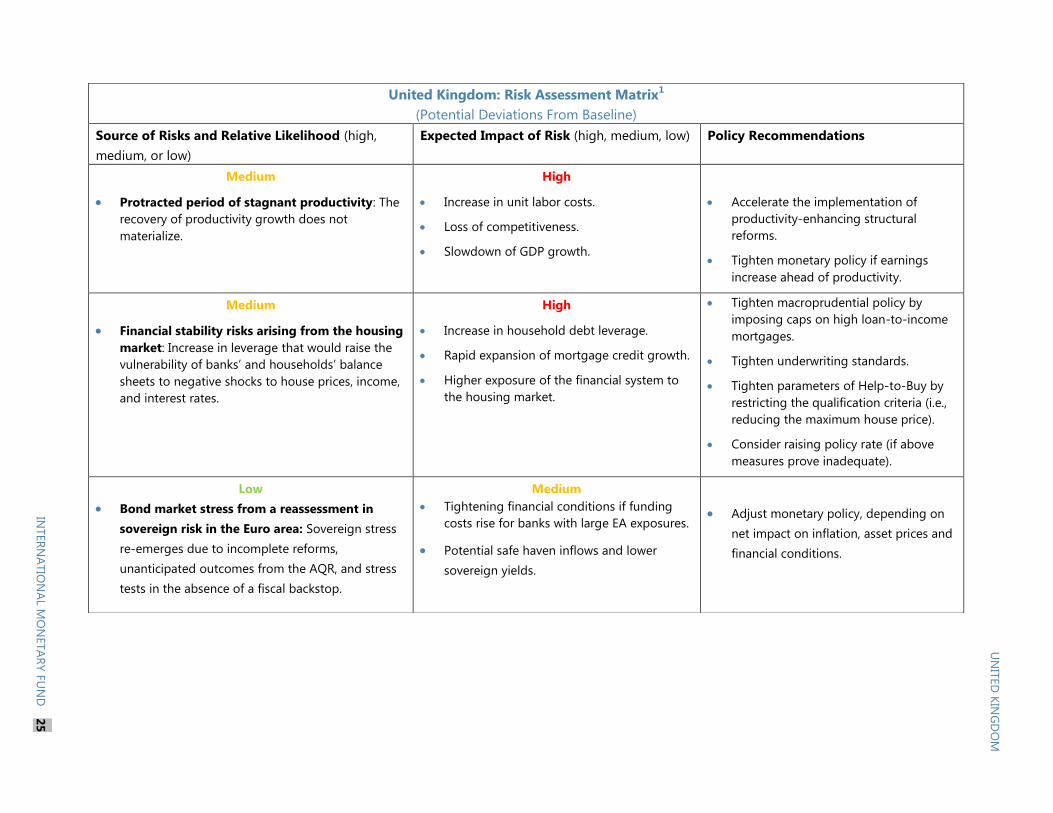
United Kingdom: Risk Assessment Matrix1
(Potential Deviations From Baseline)
Source of Risks and Relative Likelihood (high,
medium, or low)
Expected Impact of Risk (high, medium, low) Policy Recommendations
Medium
Protracted period of stagnant productivity: The
recovery of productivity growth does not
materialize.
High
Increase in unit labor costs.
Loss of competitiveness.
Slowdown of GDP growth.
Accelerate the implementation of
productivity-enhancing structural
reforms.
Tighten monetary policy if earnings
increase ahead of productivity.
Medium
Financial stability risks arising from the housing
market: Increase in leverage that would raise the
vulnerability of banks’ and households’ balance
sheets to negative shocks to house prices, income,
and interest rates.
High
Increase in household debt leverage.
Rapid expansion of mortgage credit growth.
Higher exposure of the financial system to
the housing market.
Tighten macroprudential policy by
imposing caps on high loan-to-income
mortgages.
Tighten underwriting standards.
Tighten parameters of Help-to-Buy by
restricting the qualification criteria (i.e.,
reducing the maximum house price).
Consider raising policy rate (if above
measures prove inadequate).
Low
Bond market stress from a reassessment in
sovereign risk in the Euro area: Sovereign stress
re-emerges due to incomplete reforms,
unanticipated outcomes from the AQR, and stress
tests in the absence of a fiscal backstop.
Medium
Tightening financial conditions if funding
costs rise for banks with large EA exposures.
Potential safe haven inflows and lower
sovereign yields.
Adjust monetary policy, depending on
net impact on inflation, asset prices and
financial conditions.
UN
ITED
KIN
GD
OM
INTER
NA
TIO
NA
L MO
NETA
RY F
UN
D
25

1. The Risk Assessment Matrix (RAM) shows events that could materially alter the baseline path (the scenario most likely to materialize in the view of IMF staff). The
relative likelihood of risks listed is the staff’s subjective assessment of the risks surrounding the baseline (“low” is meant to indicate a probability below 10 percent,
“medium” a probability between 10 and 30 percent, and “high” a probability of 30 and 50 percent). The RAM reflects staff views on the source of risks and overall
level of concern as of the time of discussions with the authorities. Non-mutually exclusive risks may interact and materialize jointly.
High
Surges in global financial market volatility,
triggered by geopolitical tensions, revised market
expectations on UMP exit/emerging market
fundamentals, and more generally a re-pricing of
risk.
High
Tightening of financial conditions and
market discontinuity.
Increased uncertainty could depress
investment, consumption, and GDP growth.
Sharp reduction in house prices and asset
prices, with implications for aggregate
demand.
Continue with accommodative
monetary policy to offset market
volatility.
Consider providing backstops for
systemic non-banks (along with
enhanced regulation and supervision) in
addition to existing enhanced liquidity
facilities for banks.
High
Protracted period of slower growth:
Advanced economies: Lower-than-anticipated
potential growth and persistently low inflation due
to a failure to fully address legacies of the financial
crisis, leading to secular stagnation.
Emerging economies: Maturing of the cycle,
misallocation of investment, and incomplete
structural reforms leading to prolonged slower
growth.
Medium
Reduction in GDP growth; current recovery
could stall.
Widening of the current account deficit.
Continue with accommodative
monetary policy for longer to support
demand.
Move to neutral fiscal policy stance;
allow automatic stabilizers to fully
operate.
Implement structural policies to boost
investment, productivity and
competitiveness.
Medium
Growth slowdown in China: Continued buildup
and eventual unwinding of excess capacity,
eventually resulting in a sharp growth slowdown
and large financial and fiscal losses (medium-term).
Medium
Substantial financial linkages through G-
SIB’s (HSBC and Standard Chartered).
Limited impact through trade (3 percent of
exports are directed to China).
UN
ITED
KIN
GD
OM
26
IN
TER
NA
TIO
NA
L MO
NETA
RY F
UN
D
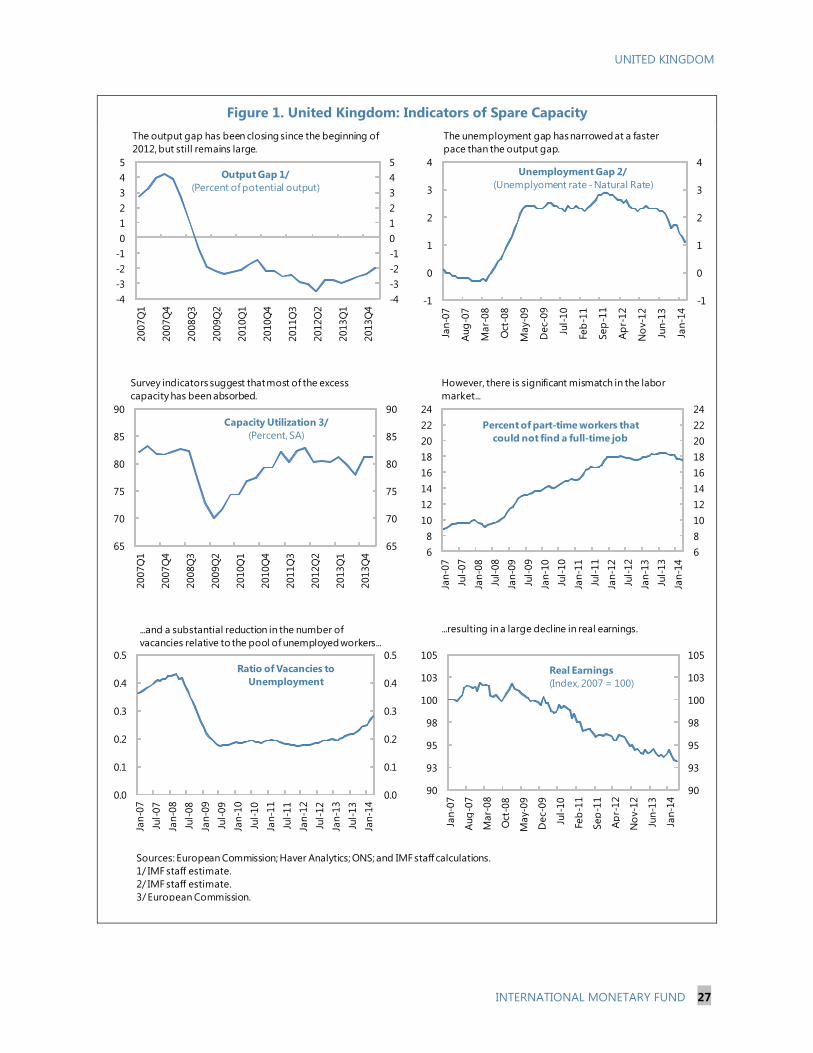
UNITED KINGDOM
INTERNATIONAL MONETARY FUND 27
Figure 1. United Kingdom: Indicators of Spare Capacity
Sources: European Commission; Haver Analytics; ONS; and IMF staff calculations.
1/ IMF staff estimate.
2/ IMF staff estimate.
3/ European Commission.
65
70
75
80
85
90
65
70
75
80
85
90
2007Q
1
2007Q
4
2008Q
3
2009Q
2
2010Q
1
2010Q
4
2011Q
3
2012Q
2
2013Q
1
2013Q
4
Capacity Utilization 3/
(Percent, SA)
Survey indicators suggest that most of the excess
capacity has been absorbed.
6
8
10
12
14
16
18
20
22
24
6
8
10
12
14
16
18
20
22
24
Jan-0
7
Jul-
07
Jan-0
8
Jul-
08
Jan-0
9
Jul-
09
Jan-1
0
Jul-
10
Jan-1
1
Jul-
11
Jan-1
2
Jul-
12
Jan-1
3
Jul-
13
Jan-1
4
Percent of part-time workers that
could not find a full-time job
However, there is significant mismatch in the labor
market...
0.0
0.1
0.2
0.3
0.4
0.5
0.0
0.1
0.2
0.3
0.4
0.5
Jan
-07
Jul-
07
Jan
-08
Jul-
08
Jan
-09
Jul-
09
Jan
-10
Jul-
10
Jan
-11
Jul-
11
Jan
-12
Jul-
12
Jan
-13
Jul-
13
Jan
-14
Ratio of Vacancies to
Unemployment
...and a substantial reduction in the number of
vacancies relative to the pool of unemployed workers...
90
93
95
98
100
103
105
90
93
95
98
100
103
105
Jan
-07
Aug
-07
Mar-
08
Oct
-08
May-
09
Dec-
09
Jul-
10
Feb
-11
Sep
-11
Ap
r-12
No
v-12
Jun
-13
Jan
-14
Real Earnings
(Index, 2007 = 100)
...resulting in a large decline in real earnings.
-4
-3
-2
-1
0
1
2
3
4
5
-4
-3
-2
-1
0
1
2
3
4
5
2007Q
1
2007Q
4
2008Q
3
2009Q
2
2010Q
1
2010Q
4
2011Q
3
2012Q
2
2013Q
1
2013Q
4
Output Gap 1/
(Percent of potential output)
The output gap has been closing since the beginning of
2012, but still remains large.
-1
0
1
2
3
4
-1
0
1
2
3
4
Jan-0
7
Aug
-07
Mar-
08
Oct
-08
May-
09
Dec-
09
Jul-
10
Feb
-11
Sep
-11
Ap
r-12
No
v-12
Jun-1
3
Jan-1
4
Unemployment Gap 2/
(Unemplyoment rate - Natural Rate)
The unemployment gap has narrowed at a faster
pace than the output gap.

UNITED KINGDOM
28 INTERNATIONAL MONETARY FUND
Figure 2. United Kingdom: Housing Market Developments
Sources: Haver Analytics; ONS; RICS; OBR; and IMF staff calculations.
1/ Housing transactions are defined as the ratio of sales to stock of housing. Supply constraints are measured as the ratio of
housing completions to the population stock. This ratio is normalized to 100 in 2008.
2/ Source: Council of Mortgage Lenders (CML).
60
70
80
90
100
110
120
130
140
60
70
80
90
100
110
120
130
140
2008Q
1
2008Q
3
2009Q
1
2009Q
3
2010Q
1
2010Q
3
2011Q
1
2011Q
3
2012Q
1
2012Q
3
2013Q
1
2013Q
3
2014Q
1
UK London
House Prices
(Index 2008Q1 = 100)
House prices are increasing at a fast pace in the UK,
particularly in London...
0
20
40
60
80
100
120
140
0
5
10
15
20
25
30
35
40
2008Q
1
2008Q
3
2009Q
1
2009Q
3
2010Q
1
2010Q
3
2011Q
1
2011Q
3
2012Q
1
2012Q
3
2013Q
1
2013Q
3
2014Q
1
Transactions (Sales-to-Stock ratio)
Housing Completions/Population (right scale)
Housing Transactions and
Housing Completions 1/
As a result of an increase in housing demand and
tighter housing supply constraints...
2.0
2.2
2.4
2.6
2.8
3.0
3.2
3.4
2.0
2.2
2.4
2.6
2.8
3.0
3.2
3.4
2008Q
1
2008Q
3
2009Q
1
2009Q
3
2010Q
1
2010Q
3
2011Q
1
2011Q
3
2012Q
1
2012Q
3
2013Q
1
2013Q
3
2014Q
1
UK London
Loan-to-Income Ratio
(Multiple of borrowers' total income)
But the loan-to-income ratio is increasing,
particularly in London...
2.0
2.4
2.8
3.2
3.6
4.0
2.0
2.4
2.8
3.2
3.6
4.0
2008Q
1
2008Q
3
2009Q
1
2009Q
3
2010Q
1
2010Q
3
2011Q
1
2011Q
3
2012Q
1
2012Q
3
2013Q
1
2013Q
3
2014Q
1
First-time buyers
Movers
...and among first-time buyers.
Loan-to-Income Ratio 2/
(Multiple of borrowers' total income)
0
2
4
6
8
10
12
0
2
4
6
8
10
12
2008Q
1
2008Q
3
2009Q
1
2009Q
3
2010Q
1
2010Q
3
2011Q
1
2011Q
3
2012Q
1
2012Q
3
2013Q
1
2013Q
3
2014Q
1
Debt Service Ratio
(Percent of gross disposable income)
In an environment of low interest rates that is
reducing the debt service ratio...
60
64
68
72
76
80
84
88
92
60
64
68
72
76
80
84
88
92
2008Q
1
2008Q
3
2009Q
1
2009Q
3
2010Q
1
2010Q
3
2011Q
1
2011Q
3
2012Q
1
2012Q
3
2013Q
1
2013Q
3
2014Q
1
First-time buyers
Movers
Loan-to-Value Ratio 2/
(Percent of property value)
The loan-to-value ratio has also started to increase at
the beginning of 2014.

UNITED KINGDOM
INTERNATIONAL MONETARY FUND 29
Figure 3. United Kingdom: Progress and Challenges in Fiscal Consolidation,
2009/10–2018/19
Sources: HMT; Office for National Statistics (ONS); and IMF staff estimates.
0
1
2
3
4
5
6
7
8
9
0
1
2
3
4
5
6
7
8
9
FY2010 FY2011 FY2012 FY2013 FY2014
June 2010 Budget forecast
Actual and staff proj.
Nominal GDP Growth
(Percent )
...largely because nominal GDP growth significantly
underperformed...
400
450
500
550
600
650
700
750
800
400
450
500
550
600
650
700
750
800
FY2009 FY2010 FY2011 FY2012 FY2013 FY2014
Receipts (2010 Budget)
Expenditure (2010 Budget)
Receipts (Actual and 2014 Budget)
Expenditure (Actual and 2014 Budget)
Public Sector Revenues and Expenditures
(Billions of pounds)
...and revenue collections fell short of projections.
0
2
4
6
8
10
12
14
16
0
2
4
6
8
10
12
14
16
FY2009 FY2010 FY2011 FY2012 FY2013 FY2014
Net borrowing (June 2010 Budget plan)
Net borrowing (Actual and staff proj.)
Public Sector Net Borrowing
(Percent of GDP)
The deficit has been nearly halved, although the pace of
consolidation has been slower than that in the original plan...
0
1
2
3
4
5
6
7
8
9
10
0
1
2
3
4
5
6
7
8
9
10
FY2010 FY2011 FY2012 FY2013 FY2014 FY2015
Spending Revenue
Public Sector Discretionary Consolidation Plan
(Percent of average FY2010-FY2015 GDP)
The consolidation thus far has mainly driven by
expenditure-measures. A plan for beyond FY2016 will
be specified after the elections.
50
55
60
65
70
75
80
85
90
95
50
55
60
65
70
75
80
85
90
95
FY2009 FY2011 FY2013 FY2015 FY2017
No change in primary balance
Baseline
Public Sector Net Debt
(Percent of GDP)
...aimed at putting debt on a firmly downward path in
the medium term.
-2
0
2
4
6
8
-2
0
2
4
6
8
FY2014 FY2015 FY2016 FY2017 FY2018
Net borrowing
2014 Budget Fiscal Consolidation Plan
(Percent of GDP)
The current government envisages balancing the budget
by FY2018...

UNITED KINGDOM
30 INTERNATIONAL MONETARY FUND
Sources: Bloomberg.; and IMF staff calculations. Ratios shown are not adjusted for accounting differences across regions
(such as GAAP for US vs. IFRS for UK). UK refers to the average for HSBC, Barclays, RBS and LBG. EU and US indicators are
weighted averages (by total assets) of the following major banks. EU banks: Cooperatieve Centrale Raiffeisen-
Boerenleenbank, BNP Paribas, Credit Agricole, Societe Generale, Bayerische Landesbank, Commerzbank, Deutsche Bank,
DZ Bank AG Deutsche Zentral-Genossenschaftsbank, LBBW, Credit Suisse Group, UBS, Banca Monte dei Paschi di Siena,
Intesa Sanpaolo, UniCredit, Unione di Banche Italiane, Banco Bilbao Vizcaya Argentaria, Banco Popular Espanol, Banco
Santander, Danske Bank, DNB, Nordea Bank, Skandinaviska Enskilda Banken, Svenska Handelsbanken and Swedbank. US
banks: Bank of America, Bank of New York Mellon, BB&T, Citigroup, Goldman Sachs, JPMorgan Chase, Morgan Stanley,
State Street Corp., SunTrust Banks and Wells Fargo.
1/ For US banks, FDIC series on commercial banks for “non-recurrent loans to total loans”, and “coverage ratio” were used
as proxies for the NPA-to-total loans and loan loss reserves to NPA, respectively.
0
2
4
6
8
10
12
0
2
4
6
8
10
12
2006 2007 2008 2009 2010 2011 2012 2013
EU
US
UK
NPA-to-Total Loans 1/
(Percent)
The 2012 decline in UK banks' problem loans
continued into 2013, albeit from relatively high levels.
0
40
80
120
160
200
0
40
80
120
160
200
2006 2007 2008 2009 2010 2011 2012 2013
EU
US
UK
Reserves for Loan Loss-to-NPA 1/
(Percent)
NPL coverage ratios are now better than for EU
banks, reflecting stronger provisioning.
50
75
100
125
150
50
75
100
125
150
2006 2007 2008 2009 2010 2011 2012 2013
EU
US
UK
Efficiency Ratio
(Percent)
But non-interest expense/income ratios for UK banks have
"risen ", given the drag from conduct/restructuring costs.
-0.2
0.0
0.2
0.4
0.6
0.8
1.0
1.2
1.4
-0.2
0.0
0.2
0.4
0.6
0.8
1.0
1.2
1.4
2006 2007 2008 2009 2010 2011 2012 2013
EU
US
UK
Return on Assets
(Percent)
This has continued to weigh on profitability.
4
6
8
10
12
14
16
18
20
4
6
8
10
12
14
16
18
20
2006 2007 2008 2009 2010 2011 2012 2013
EU
US
UK
Liquid Assets/Total Assets
(Percent)
...and raised the share of liquid assets.
40
50
60
70
80
90
100
40
50
60
70
80
90
100
2006 2007 2008 2009 2010 2011 2012 2013
EU
US
UK
Share of Wholesale Funding in Liabilities
(Percent)
Post-crisis, EU, UK and US banks have reduced reliance
on wholesale funding...
Figure 4. Comparison of Major UK, EU, and US Banks

UNITED KINGDOM
INTERNATIONAL MONETARY FUND 31
Table 1. United Kingdom: Selected Economic Indicators, 2012–15
2012 2013 2014 2015
Proj. Proj.
Real Economy (change in percent)
Real GDP 0.3 1.7 3.2 2.7
Domestic demand 1.2 1.7 3.0 2.6
Private final domestic demand 1.3 2.0 3.3 3.5
CPI, end-period 2.6 2.1 1.9 2.0
Unemployment rate (in percent) 1/ 8.0 7.6 6.5 6.3
Gross national saving (percent of GDP) 10.9 10.1 11.2 12.1
Gross domestic investment (percent of GDP) 14.7 14.5 15.2 15.6
Public Finance (fiscal year, percent of GDP) 2/
Public sector overall balance -6.9 -5.8 -4.8 -3.6
Public sector cyclically adjusted primary balance (staff estimates) 3/ -2.6 -2.1 -1.8 -0.7
General government gross debt 88.5 91.2 92.1 93.0
Public sector net debt 74.2 75.8 77.9 79.1
Money and Credit (end-period, 12-month percent change)
M4 -1.0 0.2 ... ...
Net lending to private sector -0.2 0.9 ... ...
Interest rates (percent; year average)
Three-month interbank rate 0.8 0.5 ... ...
Ten-year government bond yield 1.9 2.5 ... ...
Balance of Payments (percent of GDP)
Current account balance -3.8 -4.4 -4.0 -3.5
Trade balance -2.1 -1.7 -1.3 -1.3
Net exports of oil -1.0 -1.1 -0.9 -0.9
Exports of goods and services (volume change in percent) 1.7 1.0 1.9 3.3
Imports of goods and services (volume change in percent) 3.4 0.5 1.4 3.0
Terms of trade (percent change) -0.3 0.9 0.3 -0.1
FDI net -0.4 -0.7 -0.5 -0.6
Reserves (end of period, billions of US dollars) 99.9 101.5 ... ...
Fund Position (as of May 31st, 2014)
Holdings of currency (in percent of quota) 75.8
Holdings of SDRs (in percent of allocation) 95.2
Quota (in millions of SDRs) 10,738.5
Exchange Rates
Exchange rate regime Floating
Bilateral rate (June 17th, 2014) US$1 = £0.5896
Nominal effective rate (2005=100) 4/ 82.1 80.1 ... ...
Real effective rate (2005=100) 4/ 5/ 89.3 88.5 ... ...
1/ ILO unemployment; based on Labor Force Survey data.
3/ In percent of potential output.
4/ Average. An increase denotes an appreciation.
5/ Based on relative consumer prices.
Sources: Bank of England; IMF's International Finance Statistics; IMF's Information Notic System;
HM Treasury; Office for National Statistics; and IMF staff estimates.
2/ The fiscal year begins in April. Data exclude the temporary effects of financial sector interventions. Debt stock data
refers to the end of the fiscal year using centered-GDP as a denominator.
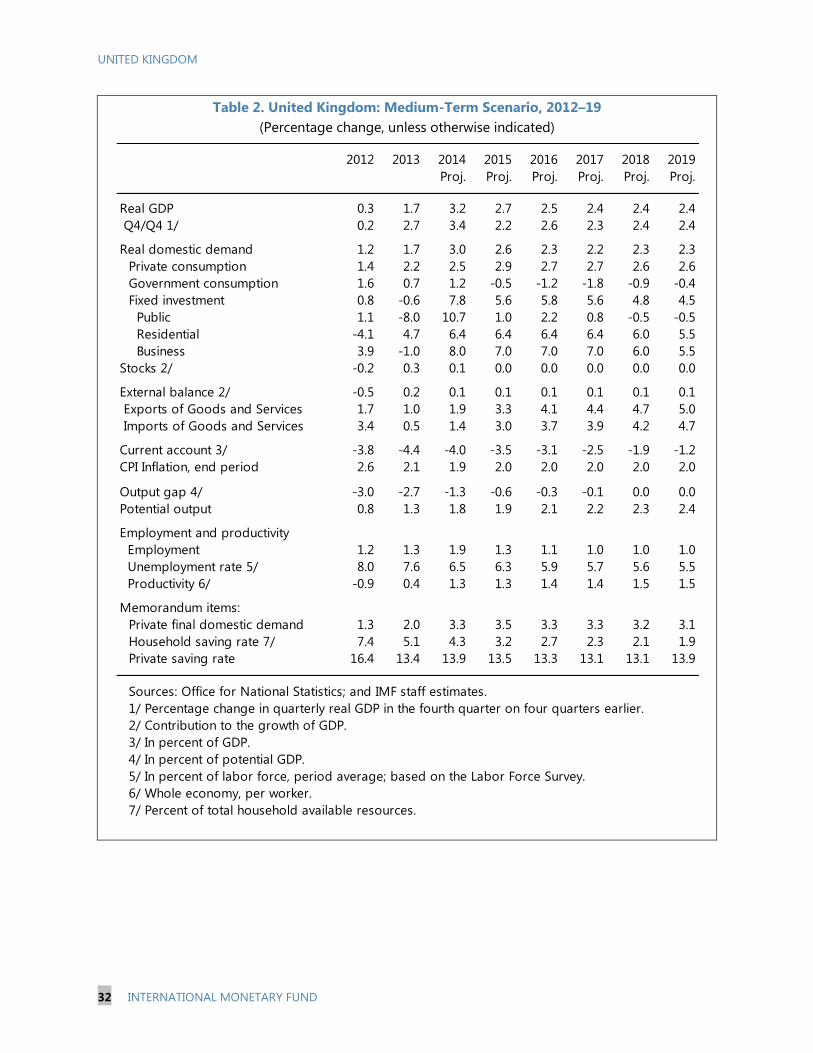
UNITED KINGDOM
32 INTERNATIONAL MONETARY FUND
Table 2. United Kingdom: Medium-Term Scenario, 2012–19
(Percentage change, unless otherwise indicated)
2012 2013 2014 2015 2016 2017 2018 2019
Proj. Proj. Proj. Proj. Proj. Proj.
Real GDP 0.3 1.7 3.2 2.7 2.5 2.4 2.4 2.4
Q4/Q4 1/ 0.2 2.7 3.4 2.2 2.6 2.3 2.4 2.4
Real domestic demand 1.2 1.7 3.0 2.6 2.3 2.2 2.3 2.3
Private consumption 1.4 2.2 2.5 2.9 2.7 2.7 2.6 2.6
Government consumption 1.6 0.7 1.2 -0.5 -1.2 -1.8 -0.9 -0.4
Fixed investment 0.8 -0.6 7.8 5.6 5.8 5.6 4.8 4.5
Public 1.1 -8.0 10.7 1.0 2.2 0.8 -0.5 -0.5
Residential -4.1 4.7 6.4 6.4 6.4 6.4 6.0 5.5
Business 3.9 -1.0 8.0 7.0 7.0 7.0 6.0 5.5
Stocks 2/ -0.2 0.3 0.1 0.0 0.0 0.0 0.0 0.0
External balance 2/ -0.5 0.2 0.1 0.1 0.1 0.1 0.1 0.1
Exports of Goods and Services 1.7 1.0 1.9 3.3 4.1 4.4 4.7 5.0
Imports of Goods and Services 3.4 0.5 1.4 3.0 3.7 3.9 4.2 4.7
Current account 3/ -3.8 -4.4 -4.0 -3.5 -3.1 -2.5 -1.9 -1.2
CPI Inflation, end period 2.6 2.1 1.9 2.0 2.0 2.0 2.0 2.0
Output gap 4/ -3.0 -2.7 -1.3 -0.6 -0.3 -0.1 0.0 0.0
Potential output 0.8 1.3 1.8 1.9 2.1 2.2 2.3 2.4
Employment and productivity
Employment 1.2 1.3 1.9 1.3 1.1 1.0 1.0 1.0
Unemployment rate 5/ 8.0 7.6 6.5 6.3 5.9 5.7 5.6 5.5
Productivity 6/ -0.9 0.4 1.3 1.3 1.4 1.4 1.5 1.5
Memorandum items:
Private final domestic demand 1.3 2.0 3.3 3.5 3.3 3.3 3.2 3.1
Household saving rate 7/ 7.4 5.1 4.3 3.2 2.7 2.3 2.1 1.9
Private saving rate 16.4 13.4 13.9 13.5 13.3 13.1 13.1 13.9
Sources: Office for National Statistics; and IMF staff estimates.
1/ Percentage change in quarterly real GDP in the fourth quarter on four quarters earlier.
2/ Contribution to the growth of GDP.
3/ In percent of GDP.
4/ In percent of potential GDP.
5/ In percent of labor force, period average; based on the Labor Force Survey.
6/ Whole economy, per worker.
7/ Percent of total household available resources.

UNITED KINGDOM
INTERNATIONAL MONETARY FUND 33
2010/11 2011/12 2012/13 2013/14 2014/15 2015/16 2016/17 2017/18 2018/19
March 2014 Budget
Revenue 37.1 37.3 37.8 37.7 37.7 37.8 38.0 38.0 38.1
Taxes 28.4 28.6 28.4 28.3 28.4 28.7 28.7 28.8 28.8
Social contributions 6.5 6.6 6.7 6.5 6.4 6.4 6.7 6.7 6.8
Other revenue 2.1 2.1 2.8 2.9 2.8 2.7 2.5 2.5 2.5
Of which: Interest income 0.4 0.4 0.9 1.2 1.1 0.9 0.8 0.8 0.8
Expenditure 46.3 44.9 44.8 43.5 42.5 41.6 40.2 38.9 38.1
Expense 44.8 43.8 44.0 42.6 41.6 40.8 39.4 38.2 37.5
Consumption of fixed capital 1.4 1.4 1.4 1.4 1.4 1.4 1.4 1.4 1.4
Interest 3.1 3.2 3.1 3.0 3.1 3.4 3.5 3.8 3.9
Others 40.3 39.3 39.5 38.2 37.1 36.0 34.5 33.1 32.2
Net acquisition of nonfinancial assets 1.6 1.1 0.8 0.9 1.0 0.8 0.8 0.7 0.6
Gross operating balance -7.7 -6.5 -6.1 -4.9 -3.9 -3.0 -1.4 -0.2 0.6
Net lending/borrowing (overall balance) -9.3 -7.6 -6.9 -5.8 -4.9 -3.8 -2.2 -0.9 0.1
Current balance 2/ -6.7 -5.8 -5.5 -4.3 -3.3 -2.3 -0.7 0.4 1.3
Primary balance -6.6 -4.8 -4.8 -4.0 -2.9 -1.4 0.5 2.1 3.2
Cyclically adjusted overall balance -7.2 -5.7 -4.9 -4.2 -3.8 -3.1 -1.7 -0.7 0.1
Cyclically adjusted current balance 2/ -4.6 -3.8 -3.5 -2.8 -2.2 -1.6 -0.2 0.6 1.4
Cyclically adjusted primary balance (CAPB) -4.5 -2.9 -2.8 -2.5 -1.9 -0.6 1.0 2.3 3.2
General government gross debt 3/ 79.1 85.1 88.3 89.6 91.8 93.1 91.9 89.4 86.6
Public sector net debt 4/ 65.9 71.4 74.2 74.5 77.3 78.7 78.3 76.5 74.2
Memorandum items:
Output gap (percent of potential) 5/ -2.6 -2.9 -2.8 -2.0 -1.3 -1.0 -0.6 -0.2 0.0
Real GDP growth (percent) 2.0 0.8 0.3 2.3 2.6 2.4 2.6 2.6 2.4
Nominal GDP (in billions of pounds) 1,499 1,546 1,568 1,644 1,721 1,788 1,871 1,956 2,042
Potential GDP growth (percent) 1.6 1.1 0.2 1.5 1.9 2.1 2.2 2.2 2.2
Staff projections
Revenue 37.1 37.3 37.9 38.0 37.7 37.9 38.1 38.1 38.1
Taxes 28.4 28.6 28.4 28.5 28.5 28.8 28.8 28.9 28.9
Social contributions 6.5 6.6 6.7 6.6 6.4 6.4 6.7 6.7 6.7
Other revenue 2.1 2.1 2.8 2.9 2.8 2.6 2.5 2.5 2.5
Of which: Interest income 0.4 0.4 0.9 1.1 1.1 0.9 0.8 0.8 0.8
Expenditure 46.3 44.9 44.8 43.8 42.5 41.4 40.2 38.9 37.9
Expense 44.8 43.8 44.0 42.8 41.5 40.6 39.5 38.2 37.3
Consumption of fixed capital 1.4 1.4 1.4 1.4 1.4 1.4 1.4 1.4 1.4
Interest 3.1 3.2 3.1 2.9 3.1 3.3 3.5 3.7 3.7
Other 40.3 39.3 39.5 38.4 37.1 35.9 34.5 33.1 32.2
Net acquisition of nonfinancial assets 1.6 1.1 0.8 1.0 1.0 0.8 0.8 0.7 0.6
Gross operating balance -7.7 -6.5 -6.1 -4.8 -3.8 -2.8 -1.4 -0.1 0.8
Net lending/borrowing (overall balance) -9.3 -7.6 -6.9 -5.8 -4.8 -3.6 -2.2 -0.8 0.2
Current balance 2/ -6.7 -5.8 -5.4 -4.3 -3.2 -2.1 -0.7 0.5 1.5
Primary balance -6.6 -4.8 -4.8 -4.0 -2.9 -1.2 0.5 2.1 3.2
Cyclically adjusted overall balance -7.9 -5.9 -4.9 -4.0 -3.8 -3.1 -2.0 -0.7 0.2
Cyclically adjusted current balance 2/ -5.3 -4.0 -3.4 -2.5 -2.2 -1.6 -0.5 0.6 1.5
Cyclically adjusted primary balance (CAPB) -5.2 -3.1 -2.7 -2.2 -1.9 -0.7 0.7 2.2 3.2
CAPB (percent of potential GDP) -5.1 -3.0 -2.6 -2.1 -1.8 -0.7 0.7 2.2 3.2
General government gross debt 3/ 79.1 85.1 88.5 91.2 92.1 93.0 92.4 90.3 87.4
Public sector net debt 4/ 65.9 71.4 74.2 75.8 77.9 79.1 78.9 76.9 74.3
Memorandum items:
Output gap (percent of potential) -1.9 -2.7 -3.0 -2.4 -1.0 -0.6 -0.2 -0.1 0.0
Real GDP growth (percent) 2.0 0.8 0.3 2.3 3.2 2.5 2.5 2.4 2.4
Nominal GDP (in billions of pounds) 1,499 1,546 1,568 1,631 1,722 1,794 1,870 1,955 2,042
Potential GDP growth (percent) 1.6 1.7 0.6 1.7 1.8 2.0 2.1 2.2 2.3
Sources: HM Treasury; Office for National Statistics; and IMF staff estimates.
1/ Excludes the temporary effects of financial sector interventions, as well as the one-off effect on public sector net
investment in 2012/13 of transferring assets from the Royal Mail Pension Plan to the public sector, unless otherwise noted.
2/ Includes depreciation.
3/ On a Maastricht treaty basis. Includes temporary effects of financial sector intervention.
4/ End of fiscal year using centered-GDP as the denominator.
Table 3. United Kingdom: Statement of Public Sector Operations, 2010/11–18/191
(Percent of GDP, unless otherwise noted)
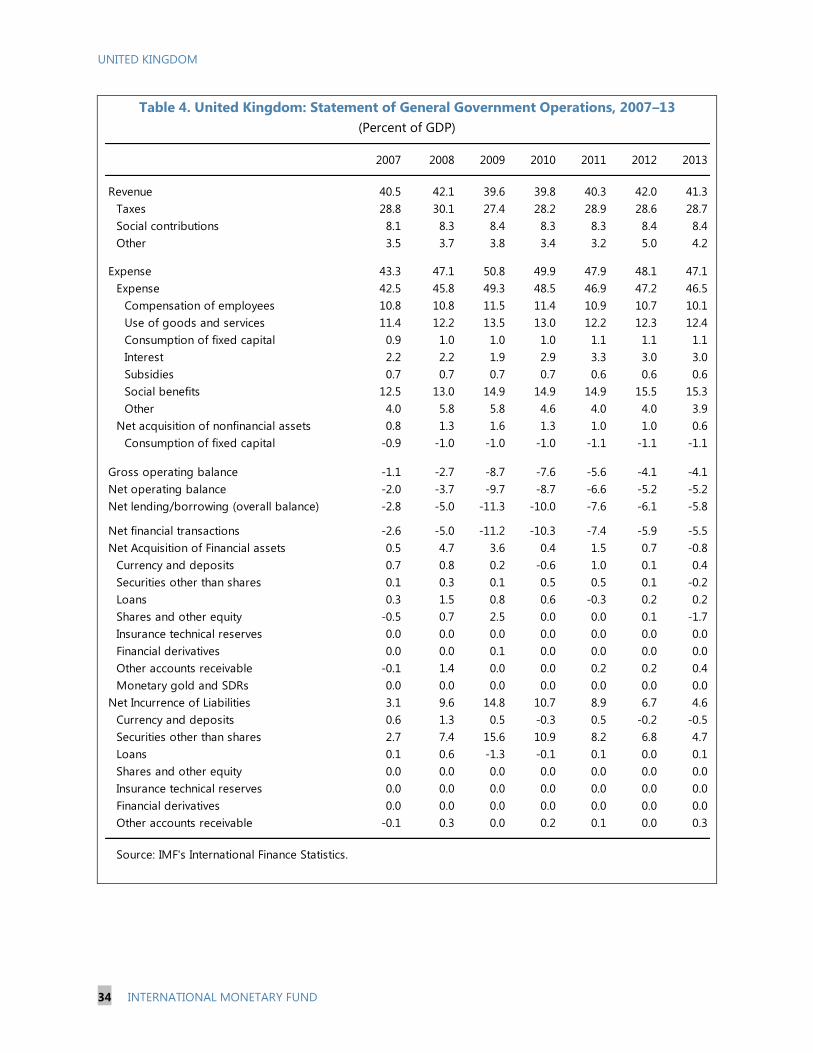
UNITED KINGDOM
34 INTERNATIONAL MONETARY FUND
Table 4. United Kingdom: Statement of General Government Operations, 2007–13
(Percent of GDP)
2007 2008 2009 2010 2011 2012 2013
Revenue 40.5 42.1 39.6 39.8 40.3 42.0 41.3
Taxes 28.8 30.1 27.4 28.2 28.9 28.6 28.7
Social contributions 8.1 8.3 8.4 8.3 8.3 8.4 8.4
Other 3.5 3.7 3.8 3.4 3.2 5.0 4.2
Expense 43.3 47.1 50.8 49.9 47.9 48.1 47.1
Expense 42.5 45.8 49.3 48.5 46.9 47.2 46.5
Compensation of employees 10.8 10.8 11.5 11.4 10.9 10.7 10.1
Use of goods and services 11.4 12.2 13.5 13.0 12.2 12.3 12.4
Consumption of fixed capital 0.9 1.0 1.0 1.0 1.1 1.1 1.1
Interest 2.2 2.2 1.9 2.9 3.3 3.0 3.0
Subsidies 0.7 0.7 0.7 0.7 0.6 0.6 0.6
Social benefits 12.5 13.0 14.9 14.9 14.9 15.5 15.3
Other 4.0 5.8 5.8 4.6 4.0 4.0 3.9
Net acquisition of nonfinancial assets 0.8 1.3 1.6 1.3 1.0 1.0 0.6
Consumption of fixed capital -0.9 -1.0 -1.0 -1.0 -1.1 -1.1 -1.1
Gross operating balance -1.1 -2.7 -8.7 -7.6 -5.6 -4.1 -4.1
Net operating balance -2.0 -3.7 -9.7 -8.7 -6.6 -5.2 -5.2
Net lending/borrowing (overall balance) -2.8 -5.0 -11.3 -10.0 -7.6 -6.1 -5.8
Net financial transactions -2.6 -5.0 -11.2 -10.3 -7.4 -5.9 -5.5
Net Acquisition of Financial assets 0.5 4.7 3.6 0.4 1.5 0.7 -0.8
Currency and deposits 0.7 0.8 0.2 -0.6 1.0 0.1 0.4
Securities other than shares 0.1 0.3 0.1 0.5 0.5 0.1 -0.2
Loans 0.3 1.5 0.8 0.6 -0.3 0.2 0.2
Shares and other equity -0.5 0.7 2.5 0.0 0.0 0.1 -1.7
Insurance technical reserves 0.0 0.0 0.0 0.0 0.0 0.0 0.0
Financial derivatives 0.0 0.0 0.1 0.0 0.0 0.0 0.0
Other accounts receivable -0.1 1.4 0.0 0.0 0.2 0.2 0.4
Monetary gold and SDRs 0.0 0.0 0.0 0.0 0.0 0.0 0.0
Net Incurrence of Liabilities 3.1 9.6 14.8 10.7 8.9 6.7 4.6
Currency and deposits 0.6 1.3 0.5 -0.3 0.5 -0.2 -0.5
Securities other than shares 2.7 7.4 15.6 10.9 8.2 6.8 4.7
Loans 0.1 0.6 -1.3 -0.1 0.1 0.0 0.1
Shares and other equity 0.0 0.0 0.0 0.0 0.0 0.0 0.0
Insurance technical reserves 0.0 0.0 0.0 0.0 0.0 0.0 0.0
Financial derivatives 0.0 0.0 0.0 0.0 0.0 0.0 0.0
Other accounts receivable -0.1 0.3 0.0 0.2 0.1 0.0 0.3
Source: IMF's International Finance Statistics.
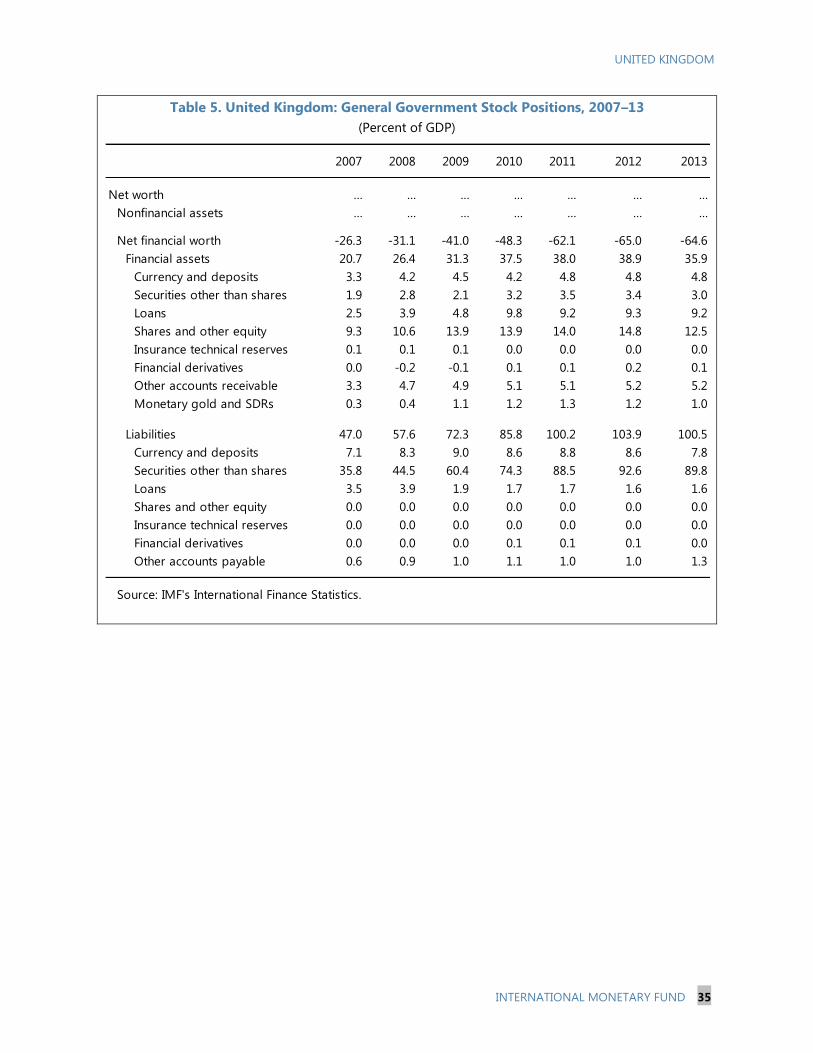
UNITED KINGDOM
INTERNATIONAL MONETARY FUND 35
Table 5. United Kingdom: General Government Stock Positions, 2007–13
(Percent of GDP)
2007 2008 2009 2010 2011 2012 2013
Net worth … … … … … … …
Nonfinancial assets … … … … … … …
Net financial worth -26.3 -31.1 -41.0 -48.3 -62.1 -65.0 -64.6
Financial assets 20.7 26.4 31.3 37.5 38.0 38.9 35.9
Currency and deposits 3.3 4.2 4.5 4.2 4.8 4.8 4.8
Securities other than shares 1.9 2.8 2.1 3.2 3.5 3.4 3.0
Loans 2.5 3.9 4.8 9.8 9.2 9.3 9.2
Shares and other equity 9.3 10.6 13.9 13.9 14.0 14.8 12.5
Insurance technical reserves 0.1 0.1 0.1 0.0 0.0 0.0 0.0
Financial derivatives 0.0 -0.2 -0.1 0.1 0.1 0.2 0.1
Other accounts receivable 3.3 4.7 4.9 5.1 5.1 5.2 5.2
Monetary gold and SDRs 0.3 0.4 1.1 1.2 1.3 1.2 1.0
Liabilities 47.0 57.6 72.3 85.8 100.2 103.9 100.5
Currency and deposits 7.1 8.3 9.0 8.6 8.8 8.6 7.8
Securities other than shares 35.8 44.5 60.4 74.3 88.5 92.6 89.8
Loans 3.5 3.9 1.9 1.7 1.7 1.6 1.6
Shares and other equity 0.0 0.0 0.0 0.0 0.0 0.0 0.0
Insurance technical reserves 0.0 0.0 0.0 0.0 0.0 0.0 0.0
Financial derivatives 0.0 0.0 0.0 0.1 0.1 0.1 0.0
Other accounts payable 0.6 0.9 1.0 1.1 1.0 1.0 1.3
Source: IMF's International Finance Statistics.

UNITED KINGDOM
36 INTERNATIONAL MONETARY FUND
Table 6. United Kingdom: Balance of Payments, 2012–19
(Percent of GDP)
2012 2013 2014 2015 2016 2017 2018 2019
Proj. Proj. Proj. Proj. Proj. Proj.
Current account -3.8 -4.4 -4.0 -3.5 -3.1 -2.5 -1.9 -1.2
Trade balance -2.1 -1.7 -1.3 -1.3 -1.2 -0.9 -0.7 -0.6
Trade in goods -7.0 -6.7 -6.4 -6.3 -6.3 -6.2 -6.2 -6.2
Exports 19.3 19.0 17.4 17.4 17.6 18.0 18.3 18.7
Imports -26.3 -25.7 -23.8 -23.7 -23.9 -24.1 -24.5 -24.9
Trade in services 4.8 5.0 5.0 5.0 5.1 5.3 5.5 5.6
Exports 12.5 12.4 12.1 12.1 12.2 12.5 12.7 13.0
Imports -7.7 -7.4 -7.1 -7.0 -7.1 -7.2 -7.3 -7.4
Income balance -0.2 -1.1 -1.0 -0.6 -0.2 0.0 0.4 1.0
Current transfers -1.4 -1.7 -1.7 -1.7 -1.7 -1.7 -1.7 -1.7
Capital and financial account 4.2 4.2 4.0 3.5 3.1 2.5 1.9 1.2
Capital account 0.1 0.1 0.1 0.1 0.1 0.1 0.1 0.1
Financial account 4.1 4.1 3.9 3.5 3.0 2.5 1.9 1.1
Direct investment -0.4 -0.7 -0.5 -0.6 -0.5 -0.5 -0.5 -0.5
Domestic -1.9 -1.5 -1.6 -1.4 -1.4 -1.3 -1.3 -1.2
Abroad 1.4 0.8 1.0 0.8 0.9 0.8 0.8 0.7
Portfolio investment balance 12.0 -1.9 4.6 1.3 2.7 1.9 2.2 1.9
Other financial transactions 1/ -14.2 -1.8 -7.4 -4.1 -4.9 -3.7 -3.3 -2.4
Change in reserve assets 0.5 0.3 0.4 0.3 0.3 0.3 0.3 0.3
Net errors and omissions -0.4 0.2 0.0 0.0 0.0 0.0 0.0 0.0
Sources: Office for National Statistics; and IMF staff estimates.
1/ Includes net financial derivatives

UNITED KINGDOM
INTERNATIONAL MONETARY FUND 37
Table 7. United Kingdom: Net Investment Position, 2007–131
(Percent of GDP)
2007 2008 2009 2010 2011 2012 2013
Assets 538 749 602 665 708 656 593
Direct investment abroad 63 73 69 70 71 71 70
Portfolio investment abroad 118 114 132 139 135 147 154
Other investment abroad 258 284 244 252 263 238 215
Reserve assets 2 2 3 3 4 4 4
Liabilities 553 744 615 670 707 671 595
Direct investment in the UK 43 45 48 49 50 60 61
Portfolio investment in the UK 141 138 171 172 161 162 152
Other investment in the UK 272 293 248 254 266 254 235
Net investment position -15 5 -13 -5 1 -15 -2
Direct investment 20 28 21 21 22 10 10
Portfolio investment -22 -25 -38 -33 -26 -15 2
Other investment -14 -9 -4 -2 -3 -17 -20
Reserve assets 2 2 3 3 4 4 4
Monetary financial institutions -19 -13 -17 -11 -8 -9 -7
Other sectors 13 30 17 24 30 17 27
Public sectors -9 -11 -12 -17 -22 -22 -21
Memorandum items:
Change in the net investment position -0.1 20.1 -18.4 7.6 5.4 -16.0 12.8
Current account balance -2.2 -0.9 -1.4 -2.7 -1.5 -3.8 -4.5
Source: Office for National Statistics.
GDP of the four preceding quarters.
1/ Data corresponds to the end of the indicated period, expressed as a percent of the

Annex 1. External Sector Report United Kingdom Overall Assessment
Foreign asset and liability position and trajectory
Background. The net international investment position (NIIP) improved from -15 percent of GDP in 2012 to -2 percent in 2013, as a result of valuation effects and changes in the stock of portfolio investment. Although the net position is relatively small relative to the size of the UK economy, gross positions are about 600 percent of GDP. Staff projections for the current account and GDP suggest that the NIIP to GDP ratio would decline to about -8 percent by 2019. Assessment. While the net external position and sustainability issues are not a concern, fluctuations in the underlying gross positions are sources of external vulnerability to the extent that they could lead to large changes in the net position.
Overall Assessment:
The external position is moderately weaker than implied by medium-term fundamentals and desirable policy settings.
External deficits reflect insufficient public and private saving rates. More fundamentally, the external position is influenced by the lack of competitiveness and limited export diversification.
Potential policy responses
Sustaining a strong and durable recovery in the UK requires a rebalancing away from public support toward private-sector led demand, along with a greater reliance on external demand. The current fiscal consolidation plan implemented within a medium-term framework and an accommodative monetary policy stance contribute to the goal of external rebalancing. Further structural reforms focused on broadening the skill base and investing in public infrastructure will boost productivity, improving the competitiveness of the economy.
Current account Background. Before the crisis, the UK experienced persistent current account (CA) deficits as a result of an overreliance on public and private consumption. In the aftermath of the crisis, the CA balance deteriorated primarily as a consequence of a decline in the income balance. This reflects a fall in earnings on UK’s foreign direct investment abroad, notably earnings on investment exposed to the euro area. The trade balance deficit has remained stable around 2 percent of GDP, despite 16 percent real exchange rate depreciation between 2007 and 2013. The lack of external adjustment is a result of high trade exposure to the euro area and weak growth of financial service exports. While investment declined in the aftermath of the crisis, national savings experienced an even larger contraction primarily as a result of lower public savings. More recently, the household sector savings rate has declined, also contributing to the increase in the CA deficit. Assessment. The EBA CA regression approach estimates a CA gap of around -2.6 percent of GDP. Based on alternative models and historical CA analysis, staff’s assessment find a cyclically-adjusted CA balance that is 1–2 percent weaker than the current account norm. 1/
Real exchange rate
Background. In the decade preceding the global crisis (1997–2007), the real effective exchange rate (REER) appreciated 16 percent; since 2007, the REER has depreciated by 16 percent. Moreover, the UK experienced an increase in unit labor costs (ULC) of 16 percent since 2007, the largest increase in ULC among G7 economies. Since July 2013, sterling has appreciated in real effective terms. By May 2014, the REER was 6 percent stronger than its average level in 2013. Assessment. The EBA exchange rate assessment implied by the EBA CA regression model indicates an overvaluation in the range 10–15 percent. The staff assesses the 2013 REER as 5–10 percent above the level consistent with fundamentals and desirable policy settings; this assessment is consistent with the staff’s CA assessment. 2/ 3/
Capital and financial accounts:
flows and policy measures
Background. Given the UK’s role as an international financial center, portfolio investment and financial derivatives are the key components of the financial account. Assessment. Large fluctuations in capital flows are inherent to financial transactions in countries with a large financial services sector. This volatility is a potential source of vulnerability.
FX intervention and reserves level
Background. The pound has the status of a global reserve currency. Assessment. Reserves held by the UK are typically low relative to standard metrics (4 percent of GDP at the end of 2013), and the currency is free floating.
Technical Background
Notes
1/ The difference between the EBA and staff’s CA gap estimate is explained by the treatment of the income balance. Staff has taken the view that recent fluctuations in the income balance are almost entirely cyclical, leading to a smaller estimate of the CA gap. 2/ The estimate from the EBA REER regression-based approach (which tends to be less reliable than the CA regression-based approach) would suggest an 2013 average REER undervaluation (of 5 percent); this estimate is discarded as implausible, including in light of the assessment that the CA is too weak as well as evidence on competitiveness. 3/ The difference between the EBA and staff’s exchange rate assessment is accounted by the alternative approaches to estimate the CA balance gap.
UN
ITED KIN
GD
OM
38 IN
TERNATIO
NAL M
ON
ETARY FUN
D
UNITED KINGDOM
INTERNATIONAL MONETARY FUND 39
Annex 2. Debt Sustainability Analysis1
Despite substantial efforts in fiscal consolidation, public sector debt continues to rise. Accordingly,
there is a clear need for the authorities to continue with medium term fiscal consolidation to put
debt on a downward path. Staff forecast that the gross public sector debt-to-GDP ratio will peak at
around 93 percent in FY2015/16, before declining to 83 percent by FY2019/20. However, gross
financing needs are relatively moderate compared to other economies with a similar level of debt.
All debt profile vulnerabilities are below early warning benchmarks, but the projected debt trajectory
is susceptible to various shocks, especially a negative real GDP growth shock.
Baseline and Realism of Projections
Macroeconomic assumptions. Real GDP growth in FY2014/15 is projected at 3.2 percent, on
the back of strong consumption, a rebound in investment, and a smaller drag from net trade. In
the subsequent years, growth is projected to moderate somewhat. Inflation is projected to stay
broadly at around 2 percent throughout the projection horizon, while short-term interest rates
are projected to start rising from 2015/16, gradually by 250 basis points by 2019/20.
Fiscal adjustment. The authorities continue to implement its fiscal consolidation program with
the aim of eliminating the overall budget deficit by FY2018/19. In staff’s baseline projections, the
primary balance strengthens over the medium term from a deficit of 4 percent of GDP in
FY2013/14 to a surplus of 3¼ percent of GDP in FY2019/20.
Heat map and debt profile vulnerabilities. Risks from the debt level are deemed high as the
level of debt exceeds the benchmark of 85 percent of GDP under baseline and stress scenarios.
However, gross financing needs (estimated at around 13 percent of GDP in FY2013/14) remain
comfortably below the benchmark of 20 percent of GDP, and all debt profile vulnerability
indicators are below early warning thresholds.2
Realism of baseline assumptions. The median forecast errors for real GDP growth and inflation
(actual minus projection) in FY2005/06−FY2013/14 were -0.6 percent and -0.2 percent,
respectively, suggesting a slight upward bias in staff’s past projections. The median forecast
error for the primary balance is 0.4 percent of GDP, suggesting that staff projections have been
slightly pessimistic. The cross-country experience suggests that the envisaged CAPB adjustment
of over 4 percentage points of GDP in FY2015/16−FY2017/18 appears to be slightly ambitious.
However, given the authorities’ commitment to fiscal consolidation, provided that output
continues to grow in line with the baseline projections, the fiscal consolidation plan appears to
be credible.
1 The data are presented on a fiscal year (April–March) basis with ratios calculated using fiscal year GDP (not
centered-fiscal year GDP).
2 Gross financing needs are defined as overall new borrowing requirement plus debt maturing during the year
(including short-term debt).

UNITED KINGDOM
40 INTERNATIONAL MONETARY FUND
Shocks and Stress Tests
The DSA framework suggests that medium-term debt dynamics are not highly sensitive to interest
rate shocks given the long average maturity of government debt (about 14 years) but highly
susceptible to growth shocks.
Growth shock. Real output growth rates are lower by one standard deviation in FY2015/16 and
FY2016/17. The primary balance would improve much more slowly than in the baseline, reaching
only 1 percent of GDP by FY2019/20. The debt-to-GDP ratio reaches 100 percent of GDP by FY
2016/17 and declines only gradually thereafter. Gross financing needs rise to about 15 percent
of GDP by FY2016/17 and stays relatively high through FY2019/20.
Primary balance shock. Assume that fiscal consolidation stalled between FY2014/15 and
FY2015/16 (no change in the primary balance). The debt-to GDP ratio rises to nearly 95 percent
of GDP by FY2016/17 and thereafter falls to 89 percent of GDP by FY2019/20, about
6 percentage points of GDP higher than the baseline. Gross financing needs reach about
14 percent of GDP by FY2016/17.
Interest rate shock. Assume a 200 basis points increase in interest rates throughout the
projection period. The effective interest rate edges up to 5¼ percent, only ½ percentage points
higher than the baseline, by FY2019/20. The impact on debt and gross financing needs are
expected to be mild.
Combined macro-fiscal scenario. This scenario aggregates shocks to real growth, the interest
rate, and the primary balance. The debt-to-GDP ratio would exceed 100 percent of GDP in
FY2016/17 and remain at around 100 percent of GDP through the rest of the projection period.
The impact on financing needs would also be significant, raising them to over 15 percent of GDP
after FY2016/17.
Contingent fiscal shock. Assume hypothetically that a banking crisis leads to one-time bail out
of the financial sector, raising non-interest expenditures by 3 percent of banking sector assets.
Real GDP is also reduced by one standard deviation for two years. Under this hypothetical
scenario, the debt-to-GDP ratio would rise to over 110 percent of GDP, while gross financing
needs would exceed 25 percent of GDP at its peak.
Stagnant growth scenario. There is risk that the recent pick-up in growth would not sustain,
because the UK’s economy fails in raising productivity and rebalancing. Potential growth would
not recover, and actual GDP growth is one percentage point lower than in the baseline. With
subdued growth rates, revenue growth would lack buoyancy, and the revenue to GDP ratio falls
short of that in the baseline by one percentage points of GDP. Under this scenario, debt would
not be put clearly on a downward path, with the debt ratio staying at around 98 percent of GDP.
Gross financing needs would hover around 15 percent of GDP.

UNITED KINGDOM
INTERNATIONAL MONETARY FUND 41
United Kingdom: Public Sector Debt Sustainability Analysis (DSA)–Baseline Scenario
(in percent of GDP unless otherwise indicated)1
As of June 23, 20143/
2012 2013 2014 2015 2016 2017 2018 2019 Sovereign Spreads
Nominal gross public debt 55.5 88.6 91.3 92.0 92.7 92.0 89.6 86.5 83.4 EMBIG (bp) 3/ 142
Public gross financing needs 9.1 14.3 13.3 11.7 12.1 11.5 10.7 9.0 9.0 5Y CDS (bp) 19
Real GDP growth (in percent) 1.4 0.3 2.3 3.2 2.5 2.5 2.4 2.4 2.4 Ratings Foreign Local
Inflation (GDP deflator, in percent) 2.5 1.2 1.7 2.3 1.7 1.7 2.1 2.0 2.1 Moody's Aa1 Aa1
Nominal GDP growth (in percent) 3.9 1.4 4.0 5.6 4.2 4.2 4.5 4.5 4.6 S&Ps AAA AAA
Effective interest rate (in percent) 4/ 5.0 3.7 3.5 3.6 3.8 4.0 4.3 4.5 4.6 Fitch AA+ AA+
2012 2013 2014 2015 2016 2017 2018 2019 cumulative
Change in gross public sector debt 5.3 3.4 2.7 0.8 0.7 -0.7 -2.4 -3.1 -3.1 -7.9
Identified debt-creating flows 4.6 4.6 1.9 1.9 1.7 0.1 -1.6 -2.3 -2.3 -2.6
Primary deficit 3.6 4.8 4.0 2.9 1.2 -0.5 -2.1 -3.2 -3.2 -5.0
Primary (noninterest) revenue and grants 36.8 37.0 37.0 36.6 37.0 37.3 37.3 37.3 37.3 222.9
Primary (noninterest) expenditure 40.5 41.8 40.9 39.5 38.1 36.8 35.2 34.2 34.2 217.9
Automatic debt dynamics 5/
0.6 1.9 -0.5 -1.7 -0.4 -0.2 -0.2 0.0 0.0 -2.5
Interest rate/growth differential 6/
0.6 1.9 -0.5 -1.7 -0.4 -0.2 -0.2 0.0 0.0 -2.5
Of which: real interest rate 1.1 2.1 1.5 1.1 1.8 2.0 1.9 2.1 2.0 10.9
Of which: real GDP growth -0.6 -0.2 -2.0 -2.8 -2.2 -2.2 -2.1 -2.1 -2.0 -13.4
Exchange rate depreciation 7/
0.0 0.0 0.0 … … … … … … …
Other identified debt-creating flows 0.4 -2.0 -1.6 0.8 0.9 0.8 0.7 0.8 0.8 4.8
Cash adjustments incl. privatization(-) 0.4 -2.0 -1.6 0.8 0.9 0.8 0.7 0.8 0.8 4.8
Contingent liabilities 0.0 0.0 0.0 0.0 0.0 0.0 0.0 0.0 0.0 0.0
Residual, including asset changes 8/
0.7 -1.3 0.8 -1.1 -0.9 -0.8 -0.8 -0.8 -0.8 -5.3
Source: IMF staff.
1/ In percent of fiscal year GDP, different from Table 3 where centered-fiscal year GDP is used.
2/ Public sector is defined as consolidated public sector.
3/ Based on available data.
4/ Long-term bond spread over German bonds.
4/ Defined as interest payments divided by debt stock (excluding guarantees) at the end of previous year.
5/ Derived as [(r - π(1+g) - g + ae(1+r)]/(1+g+π+gπ)) times previous period debt ratio, with r = interest rate; π = growth rate of GDP deflator; g = real GDP growth rate;
a = share of foreign-currency denominated debt; and e = nominal exchange rate depreciation (measured by increase in local currency value of U.S. dollar).
6/ The real interest rate contribution is derived from the numerator in footnote 5 as r - π (1+g) and the real growth contribution as -g.
7/ The exchange rate contribution is derived from the numerator in footnote 5 as ae(1+r).
8/ Includes asset changes and interest revenues (if any). For projections, includes exchange rate changes during the projection period.
9/ Assumes that key variables (real GDP growth, real interest rate, and other identified debt-creating flows) remain at the level of the last projection year.
0.8
balance 9/
primary
Debt, Economic and Market Indicators 2/
2003-2011
Actual
Projections
Contribution to Changes in Public Debt
Projections
2003-2011
Actual
debt-stabilizing
-10
-5
0
5
10
15
20
2003 2004 2005 2006 2007 2008 2009 2010 2011 2012 2013 2014 2015 2016 2017 2018 2019
Debt-Creating Flows
Primary deficit Real GDP growth Real interest rate
Exchange rate depreciation Other debt-creating flows Residual
Change in gross public sector debt
projection
(in percent of GDP)
-30
-25
-20
-15
-10
-5
0
5
10
15
20
cumulative

UNITED KINGDOM
42 INTERNATIONAL MONETARY FUND
United Kingdom
Source: IMF staff.
6/ Overseas holding of gilts.
1/ The cell is highlighted in green if debt burden benchmark of 85% is not exceeded under the specific shock or baseline, yellow if exceeded under specific shock but not
baseline, red if benchmark is exceeded under baseline, white if stress test is not relevant.
Real Interest
Rate Shock
External
Financing
Requirements
Real GDP
Growth Shock
Heat Map
Upper early warning
Evolution of Predictive Densities of Gross Nominal Public Debt
(in percent of GDP)
Debt profile 3/
Lower early warning
(Indicators vis-à-vis risk assessment benchmarks, in 2013)
Debt Profile Vulnerabilities
Gross financing needs 2/
Debt level 1/ Real GDP
Growth Shock
Primary
Balance Shock
3/ The cell is highlighted in green if country value is less than the lower risk-assessment benchmark, red if country value exceeds the upper risk-assessment benchmark,
yellow if country value is between the lower and upper risk-assessment benchmarks. If data are unavailable or indicator is not relevant, cell is white.
Lower and upper risk-assessment benchmarks are:
Change in the
Share of Short-
Term Debt
Foreign
Currency
Debt
Public Debt
Held by Non-
Residents
Primary
Balance Shock
Real Interest
Rate Shock
Exchange Rate
Shock
Contingent
Liability Shock
Exchange Rate
Shock
Contingent
Liability shock
5/ External financing requirement is defined as the sum of current account deficit, amortization of medium and long-term total external debt, and short-term total external
debt at the end of previous period.
4/ Long-term bond spread over German bonds, an average over the last 3 months, 25-Mar-14 through 23-Jun-14.
2/ The cell is highlighted in green if gross financing needs benchmark of 20% is not exceeded under the specific shock or baseline, yellow if exceeded under specific shock
but not baseline, red if benchmark is exceeded under baseline, white if stress test is not relevant.
400 and 600 basis points for bond spreads; 17 and 25 percent of GDP for external financing requirement; 1 and 1.5 percent for change in the share of short-term debt; 30
and 45 percent for the public debt held by non-residents.
Market
Perception
1 2
Not applicable
for United
Kingdom
400
600
122
bp
1 2
17
25
3%
1 2
1.0
1.5
-
1.3%
1 2
Bond spreadExternal Financing
Requirement
Annual Change in
Short-Term Public
Debt
Public Debt in
Foreign Currency
(in basis points) 4/ (in percent of GDP) 5/ (in percent of total) (in percent of total)
60
65
70
75
80
85
90
95
100
105
2012 2013 2014 2015 2016 2017 2018 2019
10th-25th 25th-75th 75th-90thPercentiles:Baseline
Symmetric Distribution
60
65
70
75
80
85
90
95
100
105
2012 2013 2014 2015 2016 2017 2018 2019
Restricted (Asymmetric) Distribution
3 is the max positive growth rate shock (percent)
no restriction on the interest rate shock
1 is the max positive pb shock (percent GDP)
no restriction on the exchange rate shock
Restrictions on upside shocks:
30
45
28%
1 2
Public Debt Held
by Non-Residents
(in percent of total) 6/
Not applicable
for United
Kingdom
United Kingdom: Public DSA Risk Assessment
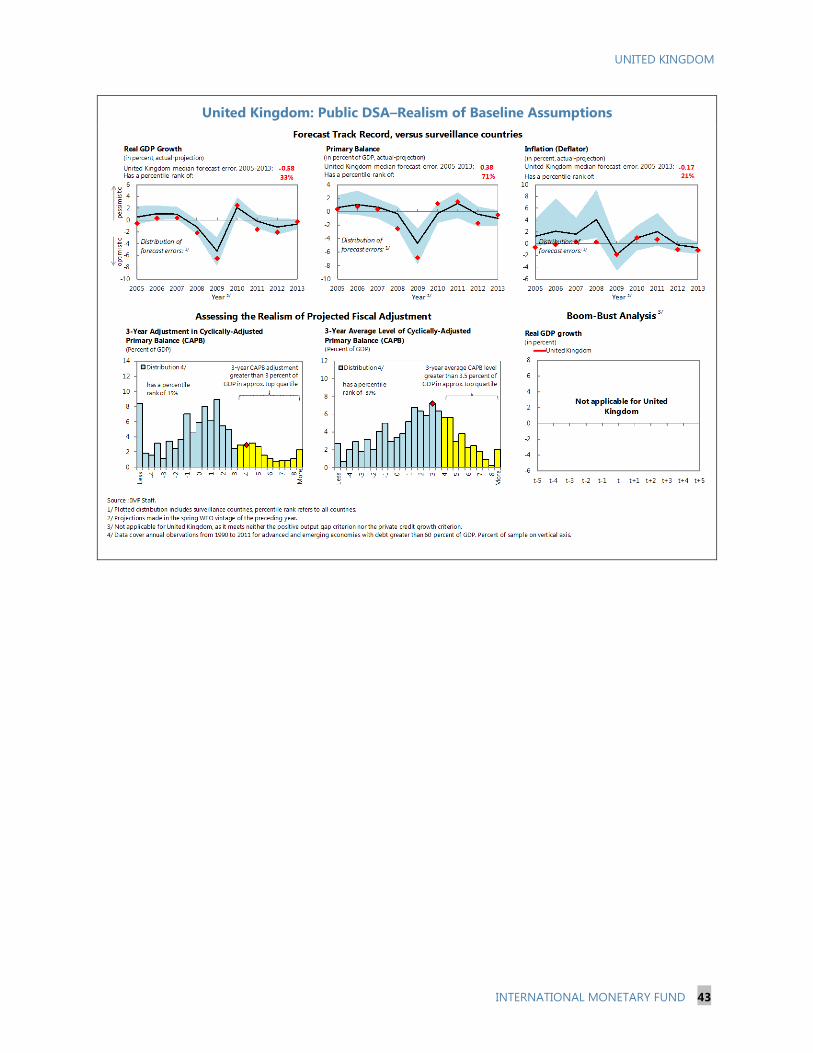
UNITED KINGDOM
INTERNATIONAL MONETARY FUND 43
United Kingdom: Public DSA–Realism of Baseline Assumptions

UNITED KINGDOM
44 INTERNATIONAL MONETARY FUND
United Kingdom: Public DSA–Composition of Public Debt and Alternative Scenarios
Baseline Scenario 2014 2015 2016 2017 2018 2019 Historical Scenario 2014 2015 2016 2017 2018 2019
Real GDP growth 3.2 2.5 2.5 2.4 2.4 2.4 Real GDP growth 3.2 1.1 1.1 1.1 1.1 1.1
Inflation 2.3 1.7 1.7 2.1 2.0 2.1 Inflation 2.3 1.7 1.7 2.1 2.0 2.1
Primary Balance -2.9 -1.2 0.5 2.1 3.2 3.2 Primary Balance -2.9 -4.0 -4.0 -4.0 -4.0 -4.0
Effective interest rate 3.6 3.8 4.0 4.3 4.5 4.6 Effective interest rate 3.6 3.8 4.0 4.2 4.3 4.4
Constant Primary Balance Scenario
Real GDP growth 3.2 2.5 2.5 2.4 2.4 2.4
Inflation 2.3 1.7 1.7 2.1 2.0 2.1
Primary Balance -2.9 -2.9 -2.9 -2.9 -2.9 -2.9
Effective interest rate 3.6 3.8 4.0 4.2 4.3 4.4
Source: IMF staff.
Underlying Assumptions(in percent)
Alternative Scenarios
Composition of Public Debt
Baseline Historical Constant Primary Balance
Net debt (in
percent of
GDP)
50
60
70
80
90
100
110
120
130
2012 2013 2014 2015 2016 2017 2018 2019
Gross Nominal Public Debt
(in percent of GDP)
projection
0
5
10
15
20
25
2012 2013 2014 2015 2016 2017 2018 2019
Public Gross Financing Needs
(in percent of GDP)
projection
0
10
20
30
40
50
60
70
80
90
100
2003 2005 2007 2009 2011 2013 2015 2017 2019
By Maturity
Medium and long-term
Short-term
projection
(in percent of GDP)
0
10
20
30
40
50
60
70
80
90
100
2003 2005 2007 2009 2011 2013 2015 2017 2019
By Currency
Local currency-denominated
Foreign currency-denominated
projection
(in percent of GDP)
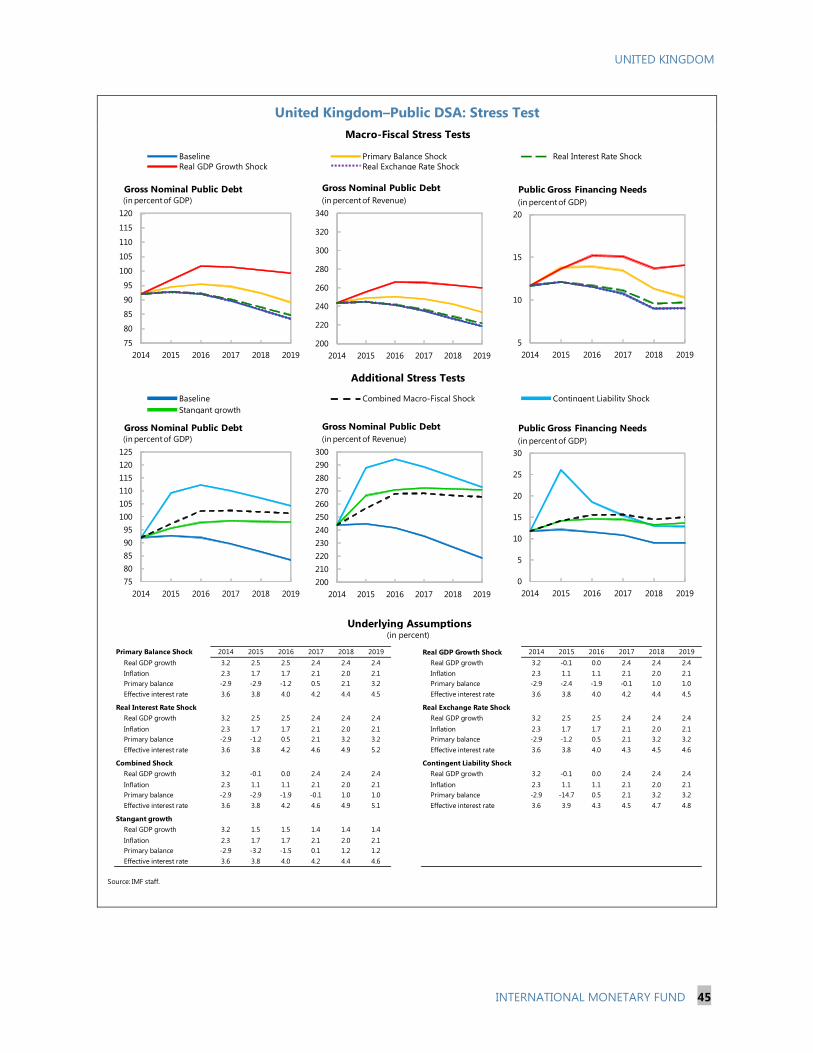
UNITED KINGDOM
INTERNATIONAL MONETARY FUND 45
United Kingdom–Public DSA: Stress Test
Primary Balance Shock 2014 2015 2016 2017 2018 2019 Real GDP Growth Shock 2014 2015 2016 2017 2018 2019
Real GDP growth 3.2 2.5 2.5 2.4 2.4 2.4 Real GDP growth 3.2 -0.1 0.0 2.4 2.4 2.4
Inflation 2.3 1.7 1.7 2.1 2.0 2.1 Inflation 2.3 1.1 1.1 2.1 2.0 2.1
Primary balance -2.9 -2.9 -1.2 0.5 2.1 3.2 Primary balance -2.9 -2.4 -1.9 -0.1 1.0 1.0
Effective interest rate 3.6 3.8 4.0 4.2 4.4 4.5 Effective interest rate 3.6 3.8 4.0 4.2 4.4 4.5
Real Interest Rate Shock Real Exchange Rate Shock
Real GDP growth 3.2 2.5 2.5 2.4 2.4 2.4 Real GDP growth 3.2 2.5 2.5 2.4 2.4 2.4
Inflation 2.3 1.7 1.7 2.1 2.0 2.1 Inflation 2.3 1.7 1.7 2.1 2.0 2.1
Primary balance -2.9 -1.2 0.5 2.1 3.2 3.2 Primary balance -2.9 -1.2 0.5 2.1 3.2 3.2
Effective interest rate 3.6 3.8 4.2 4.6 4.9 5.2 Effective interest rate 3.6 3.8 4.0 4.3 4.5 4.6
Combined Shock Contingent Liability Shock
Real GDP growth 3.2 -0.1 0.0 2.4 2.4 2.4 Real GDP growth 3.2 -0.1 0.0 2.4 2.4 2.4
Inflation 2.3 1.1 1.1 2.1 2.0 2.1 Inflation 2.3 1.1 1.1 2.1 2.0 2.1
Primary balance -2.9 -2.9 -1.9 -0.1 1.0 1.0 Primary balance -2.9 -14.7 0.5 2.1 3.2 3.2
Effective interest rate 3.6 3.8 4.2 4.6 4.9 5.1 Effective interest rate 3.6 3.9 4.3 4.5 4.7 4.8
Stangant growth
Real GDP growth 3.2 1.5 1.5 1.4 1.4 1.4
Inflation 2.3 1.7 1.7 2.1 2.0 2.1
Primary balance -2.9 -3.2 -1.5 0.1 1.2 1.2
Effective interest rate 3.6 3.8 4.0 4.2 4.4 4.6
Source: IMF staff.
(in percent)
Real Exchange Rate Shock
Combined Macro-Fiscal Shock
Additional Stress Tests
Baseline
Underlying Assumptions
Contingent Liability Shock
Stangant growth
Macro-Fiscal Stress Tests
Baseline Primary Balance Shock
Real GDP Growth Shock
Real Interest Rate Shock
75
80
85
90
95
100
105
110
115
120
2014 2015 2016 2017 2018 2019
Gross Nominal Public Debt(in percent of GDP)
200
220
240
260
280
300
320
340
2014 2015 2016 2017 2018 2019
Gross Nominal Public Debt
(in percent of Revenue)
5
10
15
20
2014 2015 2016 2017 2018 2019
Public Gross Financing Needs
(in percent of GDP)
75
80
85
90
95
100
105
110
115
120
125
2014 2015 2016 2017 2018 2019
Gross Nominal Public Debt(in percent of GDP)
200
210
220
230
240
250
260
270
280
290
300
2014 2015 2016 2017 2018 2019
Gross Nominal Public Debt
(in percent of Revenue)
0
5
10
15
20
25
30
2014 2015 2016 2017 2018 2019
Public Gross Financing Needs
(in percent of GDP)
UNITED KINGDOM
STAFF REPORT FOR THE 2014 ARTICLE IV
CONSULTATION—INFORMATIONAL ANNEX
Prepared By
European Department
FUND RELATIONS _______________________________________________________________________ 2
STATISTICAL ISSUES ____________________________________________________________________ 4
CONTENTS
July 8, 2014

UNITED KINGDOM
2 INTERNATIONAL MONETARY FUND
FUND RELATIONS
(Data as of May 31, 2014)
Membership Status: Joined December 27, 1945; accepted Article VIII.
General Resources Account
SDR
Million
Percent
Quota
Quota 10,738.50 100.00
Fund holdings of currency 8,134.09 75.75
Reserve position in Fund 2,604.50 24.25
New arrangement to borrow 2,275.84
SDR Department
SDR
Millions
Percent
Allocation
Net cumulative allocations 10,134.20 100.00
Holdings 9,646.23 95.18
Outstanding Purchases and Loans: None
Financial Arrangements: None
Projected Payments to Fund (SDR million; based on present holdings of SDRs):
Forthcoming
2014 2015 2016 2017 2018
Principal
Charges/Interest 0.25 0.56 0.56 0.56 0.56
Total 0.25 0.56 0.56 0.56 0.56
Exchange Rate Arrangement:
The UK authorities maintain a free floating regime.
The United Kingdom accepted the obligations of Article VIII, Sections 2, 3, and 4 on February 15,
1961. It maintains an exchange system free of restrictions on the making of payments and transfers
for current international transactions, except for exchange restrictions imposed solely for the
preservation of national or international security. In accordance with UN resolutions and EU
restrictive measures, the United Kingdom applies targeted financial sanctions under legislation
relating to Al-Qaeda and Taliban, and individuals, groups, and organizations associated with

UNITED KINGDOM
INTERNATIONAL MONETARY FUND 3
terrorism; and certain persons associated with: the former Government of Iraq, the former
Government of Liberia, the current Government of Burma (aka Myanmar), the former Government of
the Republic of Yugoslavia and International Criminal Tribunal Indictees, the current Government of
Zimbabwe, the current government of Belarus, the current government of North Korea; the current
government of Iran and persons considered to be a threat to peace and reconciliation in Sudan,
Cote d'Ivoire, and Democratic Republic of Congo; and persons considered by the UN to have been
involved in the assassination of former Lebanese Prime Minister Rafik Hariri. These restrictions have
been notified to the Fund under Decision 144–(52/51).
Article IV Consultation:
The last Article IV consultation was concluded on July 15, 2013. The UK is on the standard 12 –month
consultation cycle.
FSAP
The FSAP update was completed at the time of the 2011 Article IV Consultation. The next FSAP
assessment is expected to be conducted in time for 2016 Article IV consultation discussions, in line
with the usual five-year cycle for jurisdictions with systemically important financial sectors.
Technical Assistance: None
Resident Representatives: None
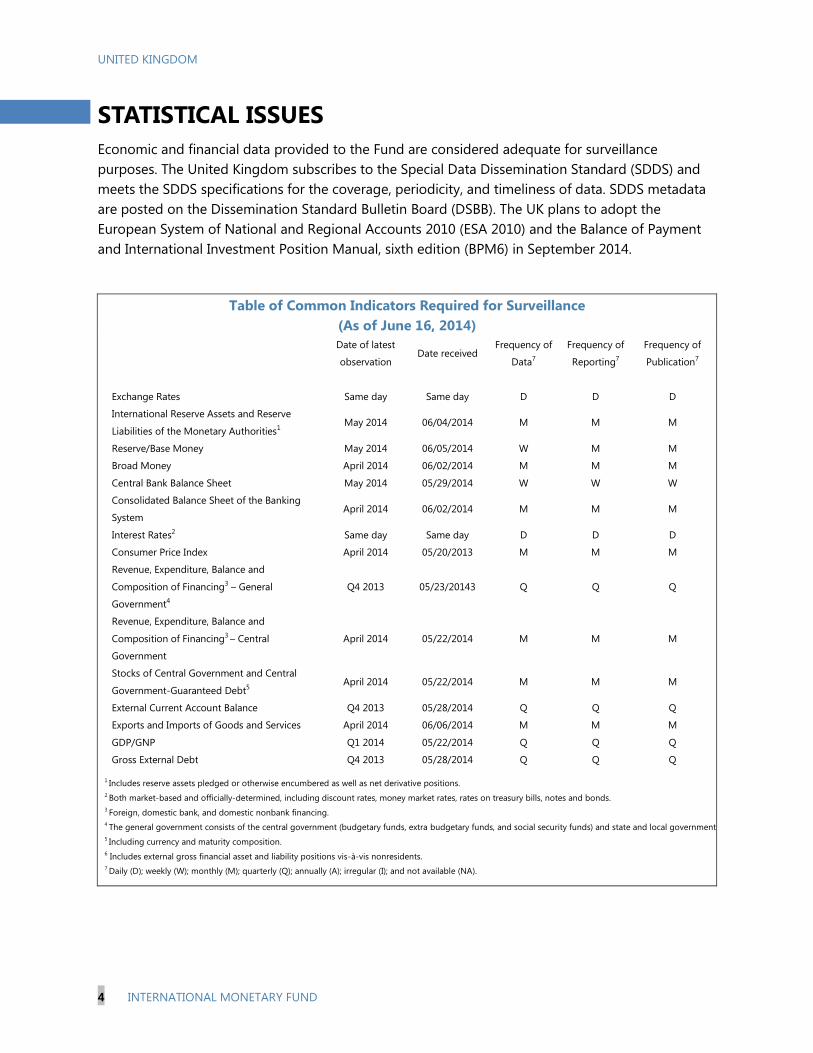
UNITED KINGDOM
4 INTERNATIONAL MONETARY FUND
STATISTICAL ISSUES
Economic and financial data provided to the Fund are considered adequate for surveillance
purposes. The United Kingdom subscribes to the Special Data Dissemination Standard (SDDS) and
meets the SDDS specifications for the coverage, periodicity, and timeliness of data. SDDS metadata
are posted on the Dissemination Standard Bulletin Board (DSBB). The UK plans to adopt the
European System of National and Regional Accounts 2010 (ESA 2010) and the Balance of Payment
and International Investment Position Manual, sixth edition (BPM6) in September 2014.
Table of Common Indicators Required for Surveillance
(As of June 16, 2014)
1 Includes reserve assets pledged or otherwise encumbered as well as net derivative positions.
2 Both market-based and officially-determined, including discount rates, money market rates, rates on treasury bills, notes and bonds.
3 Foreign, domestic bank, and domestic nonbank financing.
4 The general government consists of the central government (budgetary funds, extra budgetary funds, and social security funds) and state and local governments.
5 Including currency and maturity composition.
6 Includes external gross financial asset and liability positions vis-à-vis nonresidents.
7 Daily (D); weekly (W); monthly (M); quarterly (Q); annually (A); irregular (I); and not available (NA).
Date of latest
observation Date received
Frequency of
Data7
Frequency of
Reporting7
Frequency of
Publication7
Exchange Rates Same day Same day D D D
International Reserve Assets and Reserve
Liabilities of the Monetary Authorities1 May 2014 06/04/2014 M M M
Reserve/Base Money May 2014 06/05/2014 W M M
Broad Money April 2014 06/02/2014 M M M
Central Bank Balance Sheet May 2014 05/29/2014 W W W
Consolidated Balance Sheet of the Banking
System April 2014 06/02/2014 M M M
Interest Rates2 Same day Same day D D D
Consumer Price Index April 2014 05/20/2013 M M M
Revenue, Expenditure, Balance and
Composition of Financing3 – General
Government4
Q4 2013 05/23/20143 Q Q Q
Revenue, Expenditure, Balance and
Composition of Financing3 – Central
Government
April 2014 05/22/2014 M M M
Stocks of Central Government and Central
Government-Guaranteed Debt5 April 2014 05/22/2014 M M M
External Current Account Balance Q4 2013 05/28/2014 Q Q Q
Exports and Imports of Goods and Services April 2014 06/06/2014 M M M
GDP/GNP Q1 2014 05/22/2014 Q Q Q
Gross External Debt Q4 2013 05/28/2014 Q Q Q

Press Release No.14/365
FOR IMMEDIATE RELEASE
July 28, 2014
IMF Executive Board Concludes 2014 Article IV Consultation with
the United Kingdom
On July 23, 2014 the Executive Board of the International Monetary Fund (IMF) concluded
the Article IV consultation with the United Kingdom.1
The economy has rebounded strongly and prospects are promising. Headwinds that
previously held back the economy—including adverse credit conditions and diminished
confidence—have eased. There are signs that demand is becoming more balanced, with
growth in business investment now ahead of private consumption. Employment growth has
remained strong. Despite this, inflation has been contained.
Nonetheless, sustaining strong growth will depend on a recovery in productivity growth and
real wages. In addition, the housing market is becoming buoyant, potentially creating
financial stability risks. Further demand rebalancing is needed: net trade has made only a
modest contribution to the recovery, and the real exchange rate is moderately overvalued.
Policies have been directed toward supporting growth, while strengthening public finances
through a mix of revenue and expenditure measures and ensuring financial stability.
Monetary policy remains highly accommodative, and effective monetary conditions have
eased compared with last year. A number of micro-prudential and credit policy measures
have been introduced in an effort to take some of the steam out of the housing market, such
as modification of the Funding for Lending Scheme and the introduction of tighter
underwriting standards for owner-occupier mortgages. The Financial Policy Committee of
the Bank of England has also recommended the implementation of macroprudential measures
aimed at insuring against excessive household indebtedness. Meanwhile, the 2014 Budget
implies a half-percentage point tightening in the cyclically-adjusted primary balance. Going
forward, fiscal policy aims to eliminate the budget deficit by FY2018 and to put the debt
1 Under Article IV of the IMF's Articles of Agreement, the IMF holds bilateral discussions with members,
usually every year. A staff team visits the country, collects economic and financial information, and discusses
with officials the country's economic developments and policies. On return to headquarters, the staff prepares a
report, which forms the basis for discussion by the Executive Board.
International Monetary Fund
Washington, D.C. 20431 USA

2
ratio firmly on a downward path while preserving the delivery of quality public services and
paying due attention to social equity.
After the overhaul of the UK’s financial regulatory architecture in 2013, which saw the
establishment of the Prudential Regulation Authority, Financial Conduct Authority, and
Financial Policy Committee, efforts to strengthen bank balance sheets and implement durable
structural reforms to the financial sector have continued. These include higher bank capital
and provisioning, a robust multi-pronged framework for assessing capital adequacy, and
stress testing of major banks for large shocks. Liquidity backstops have been strengthened,
which should help solvent UK banks ride out temporary funding stresses that could otherwise
create domestic and outward credit spillovers. But easier access to liquidity requires
commensurately strong supervision of banks and other financial intermediaries.
Executive Board Assessment2
Executive Directors welcomed the rebound in output and employment in the UK economy
amid improved credit conditions and confidence. They agreed that the overall policy mix is
appropriate in view of remaining slack in the economy and a continued weak external
environment, but encouraged the authorities to readily adjust the policy settings should
inflation accelerate. Directors emphasized that sustaining strong growth and improving
competitiveness will require a recovery in productivity growth and further demand
rebalancing.
Directors supported the authorities’ near-term fiscal consolidation efforts, stressing the
importance of strengthening public finances without undermining economic growth. They
saw a need to continue these efforts in the medium term in order to put debt on a downward
path. They encouraged the authorities to explore both revenue and expenditure measures,
taking into account efficiency and equity considerations, while maintaining delivery of key
public services. In this regard, Directors also welcomed the authorities’ efforts to analyze the
distributional impact of fiscal consolidation.
Directors agreed that maintaining the accommodative monetary policy stance is appropriate
in the immediate term. They noted the Bank of England’s strategy and intentions to raise the
policy rate first when the time comes for normalizing monetary policy, and pointed out the
need for flexibility in policy sequencing as developments warrant. In this context, Directors
highlighted the particular importance of clear communications on the factors that would
guide the decisions of the Monetary and Financial Policy Committees.
2 At the conclusion of the discussion, the Managing Director, as Chairman of the Board, summarizes the views
of Executive Directors, and this summary is transmitted to the country's authorities. An explanation of any
qualifiers used in summings up can be found here: http://www.imf.org/external/np/sec/misc/qualifiers.htm.
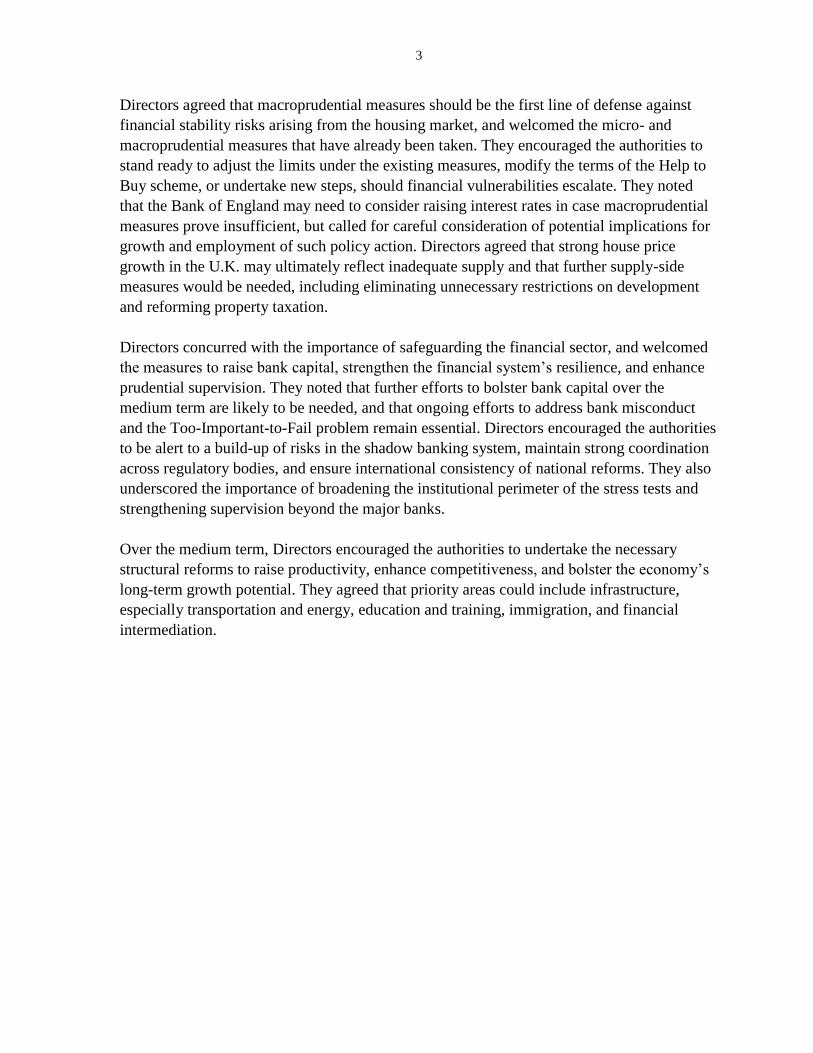
3
Directors agreed that macroprudential measures should be the first line of defense against
financial stability risks arising from the housing market, and welcomed the micro- and
macroprudential measures that have already been taken. They encouraged the authorities to
stand ready to adjust the limits under the existing measures, modify the terms of the Help to
Buy scheme, or undertake new steps, should financial vulnerabilities escalate. They noted
that the Bank of England may need to consider raising interest rates in case macroprudential
measures prove insufficient, but called for careful consideration of potential implications for
growth and employment of such policy action. Directors agreed that strong house price
growth in the U.K. may ultimately reflect inadequate supply and that further supply-side
measures would be needed, including eliminating unnecessary restrictions on development
and reforming property taxation.
Directors concurred with the importance of safeguarding the financial sector, and welcomed
the measures to raise bank capital, strengthen the financial system’s resilience, and enhance
prudential supervision. They noted that further efforts to bolster bank capital over the
medium term are likely to be needed, and that ongoing efforts to address bank misconduct
and the Too-Important-to-Fail problem remain essential. Directors encouraged the authorities
to be alert to a build-up of risks in the shadow banking system, maintain strong coordination
across regulatory bodies, and ensure international consistency of national reforms. They also
underscored the importance of broadening the institutional perimeter of the stress tests and
strengthening supervision beyond the major banks.
Over the medium term, Directors encouraged the authorities to undertake the necessary
structural reforms to raise productivity, enhance competitiveness, and bolster the economy’s
long-term growth potential. They agreed that priority areas could include infrastructure,
especially transportation and energy, education and training, immigration, and financial
intermediation.

United Kingdom: Selected Economic Indicators, 2012–15
2012 2013 2014
Proj.
2015
Proj.
Real Economy (change in percent)
Real GDP 0.3 1.7 3.2 2.7
Domestic demand 1.2 1.7 3.0 2.6
Private final domestic demand 1.3 2.0 3.3 3.5
CPI, end-period 2.6 2.1 1.9 2.0
Unemployment rate (in percent) 1/ 8.0 7.6 6.9 6.3
Gross national saving (percent of GDP) 10.9 10.1 11.2 12.1
Gross domestic investment (percent of GDP) 14.7 14.5 15.2 15.6
Public Finance (fiscal year, percent of GDP) 2/
Public sector overall balance -6.9 -5.8 -4.8 -3.6
Public sector cyclically adjusted overall balance (staff estimates) 3/ -2.6 -2.1 -1.8 -0.7
General government gross debt 88.5 91.1 92.0 92.9
Public sector net debt 74.2 75.8 77.8 79.0
Money and Credit (end-period, 12-month percent change)
M4 -1.0 0.2 ... ...
Net lending to private sector -0.2 0.9 ... ...
Interest rates (percent; year average)
Three-month interbank rate 0.8 0.5 ... ...
Ten-year government bond yield 1.9 2.5 ... ...
Balance of Payments (percent of GDP)
Current account balance -3.8 -4.4 -4.0 -3.5
Trade balance -2.1 -1.7 -1.3 -1.3
Net exports of oil -1.0 -1.1 -0.9 -0.9
Exports of goods and services (volume change in percent) 1.7 1.0 1.9 3.3
Imports of goods and services (volume change in percent) 3.4 0.5 1.4 3.0
Terms of trade (percent change) -0.3 0.9 0.3 -0.1
FDI net -0.4 -0.7 -0.5 -0.6
Reserves (end of period, billions of US dollars) 99.9 101.5 ... ...
Fund Position (as of May 31st, 2014)
Holdings of currency (in percent of quota) 75.8
Holdings of SDRs (in percent of allocation) 95.2
Quota (in millions of SDRs) 10,738.5
Exchange Rates
Exchange rate regime Floating
Bilateral rate (June 17th, 2014)
US$1 =
£0.5896
Nominal effective rate (2005=100) 4/ 82.1 80.1 ...
Real effective rate (2005=100) 4/ 5/ 89.3 88.5 ...
Sources: Bank of England; IMF's International Finance Statistics; IMF's Information Notic System; HM Treasury; Office for
National Statistics; and IMF staff estimates.
1/ ILO unemployment; based on Labor Force Survey data.
2/ The fiscal year begins in April. Data exclude the temporary effects of financial sector interventions. Debt stock data
refers to the end of the fiscal year using centered-GDP as a denominator.
3/ In percent of potential output.
4/ Average. An increase denotes an appreciation.
5/ Based on relative consumer prices.

Statement by Mr. Steve Field, Executive Director for United Kingdom July 23, 2014
I thank staff for a very productive mission and thorough Article IV report. My authorities broadly agree with the staff analysis, note that staff considers the overall policy mix appropriate and, notwithstanding the entrenched recovery, agree with staff that efforts should continue to ensure the UK is more resilient to ongoing domestic and external challenges. Economic Outlook The UK economy is moving into expansion with the composition of the economic recovery broadening and becoming more sustainable. WEO projections show the UK is expected to grow at 3.2 per cent this year, faster than any other major advanced economy, and 2.7 per cent in 2015. GDP growth in Q1 was 0.8 per cent, the fourth consecutive quarter of growth around or above its pre-crisis average rate. Recent survey data for the services, construction and manufacturing sectors remains strong, pointing to growth continuing around these rates. The recovery now appears more broad-based than previously estimated, with the pickup in growth in 2013 associated with an increase in both household consumption and business investment growth (with investment increasing 10.6 per cent over the year to the first quarter of 2014). Sustained output growth has not yet been accompanied by a material pickup in productivity. Looking forward, the Bank of England’s Monetary Policy Committee (MPC) expects there will be a gradual recovery in productivity as demand strengthens and the economy recovers. The pickup in business investment gives some positive indications, but the rate of productivity growth over the next couple of years is unlikely to materially exceed pre-crisis rates. Nevertheless, this anticipated gradual improvement in supply capacity means that, on the basis of the current forecasts for demand growth, the absorption of slack is expected to slow over the forecast period compared with the recent past. The employment picture has been positive. Over 1.5 million jobs have been created in less than three years. Unemployment has fallen from a peak of 8.4 per cent in 2011 to 6.5 per cent – its lowest level for over five years. Over the same period, inflationary pressures have abated, with inflation falling from a peak of 5.2 per cent in 2011 to 1.9 per cent in June, close to the Bank’s 2 per cent inflation target. In June, the MPC judged that under market interest rate expectations, the economy remained on course to meet the 2 per cent inflation target and to eliminate spare capacity over the next two to three years.

2
The UK’s current account deficit is large by historical standards, at 4.5 per cent of nominal GDP in 2013. The recent widening primarily reflects the investment income surplus reversing to a deficit driven by falling profits abroad of UK firms. The MPC expects the trade deficit to be broadly stable over the next three years. The Office for Budget Responsibility's (OBR) projections are consistent with a narrowing of the current account deficit to 1.5 per cent by 2018. Whilst the global outlook is improving, ongoing domestic and external challenges remain. The Government’s strategy to promote a strong and sustainable recovery is built on: monetary activism; deficit reduction; structural reforms; and reform of the financial system. Monetary activism Monetary policy continues to play an important role in supporting the economy. Following the global financial crisis, the MPC reduced and held Bank Rate to its historically low level of 0.5 per cent and purchased a stock of assets amounting to £375 billion. In last year's Article IV the Fund recommended that reassurance could be provided that policy rates will remain low until the recovery reaches full momentum and noted that greater transparency about future policy rates could therefore be a useful tool. Consistent with this, in August 2013, the MPC provided guidance on the future stance of monetary policy, stating its intention not to raise Bank Rate at least until the unemployment rate fell to a threshold of 7 per cent, subject to maintaining price and financial stability. Unemployment has since fallen sharply as the recovery has gained momentum and fell below 7 per cent in April. Reflecting that good news, the MPC provided new guidance in February to make clear that when the MPC does start to raise Bank Rate, it expects to do so gradually, and to a level materially below its pre-crisis average. Forward guidance has been a useful tool. Surveys of businesses to assess the effects of the initial phase of guidance found that the majority of companies consider policy guidance had made them more confident about UK economic prospects. On balance, companies indicated it had caused them to bring forward or increase spending and increase hiring. There was little reaction in financial markets to the transition between the two phases of policy guidance. Macroprudential policies and the housing market UK house price inflation has strengthened in line with the improved economic outlook, reflecting increasing demand for house purchases, which in turn has been supported by reduced economic uncertainty and improved credit conditions. UK house prices have increased by 10.5 per cent in the year to May 2014. Price increases have been most pronounced in London and the South East, while house prices excluding these regions have only increased by 6.4 per cent in the year to May. House prices in real terms remain around 5 per cent lower than they were in 2007. The Bank’s central view suggests annual house price inflation will continue at current levels until mid-2015, after which it is expected to slow and grow broadly in line with incomes from 2016.
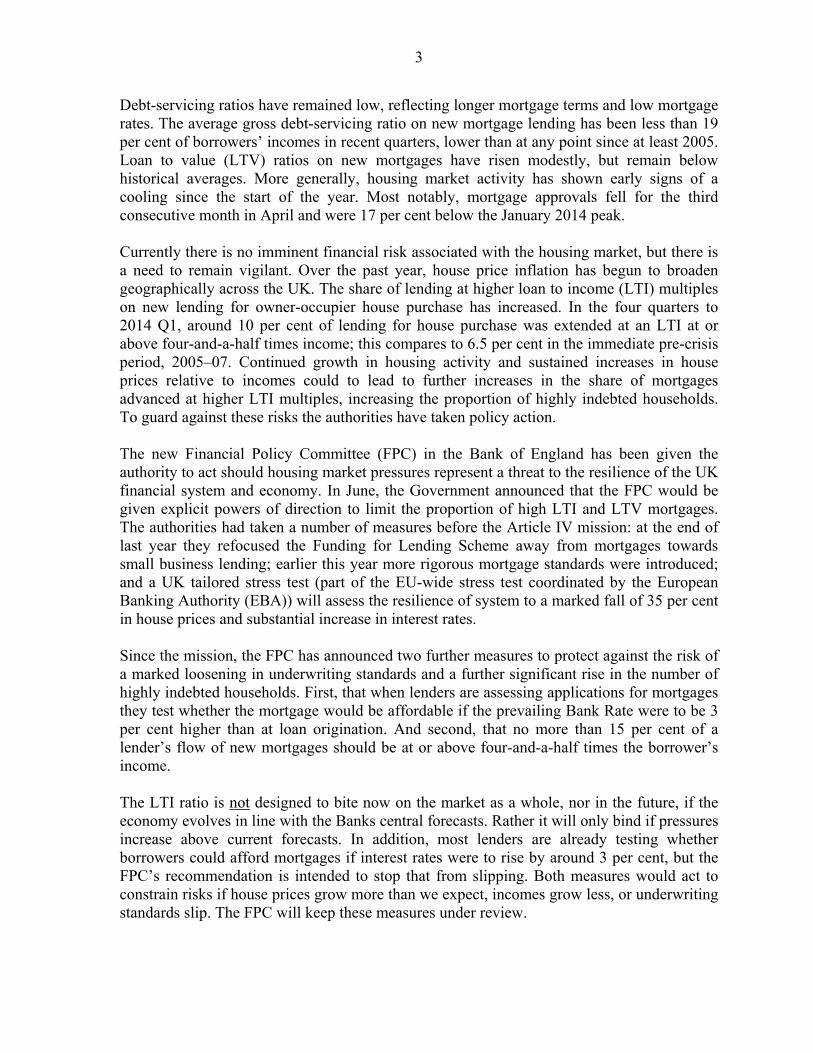
3
Debt-servicing ratios have remained low, reflecting longer mortgage terms and low mortgage rates. The average gross debt-servicing ratio on new mortgage lending has been less than 19 per cent of borrowers’ incomes in recent quarters, lower than at any point since at least 2005. Loan to value (LTV) ratios on new mortgages have risen modestly, but remain below historical averages. More generally, housing market activity has shown early signs of a cooling since the start of the year. Most notably, mortgage approvals fell for the third consecutive month in April and were 17 per cent below the January 2014 peak. Currently there is no imminent financial risk associated with the housing market, but there is a need to remain vigilant. Over the past year, house price inflation has begun to broaden geographically across the UK. The share of lending at higher loan to income (LTI) multiples on new lending for owner-occupier house purchase has increased. In the four quarters to 2014 Q1, around 10 per cent of lending for house purchase was extended at an LTI at or above four-and-a-half times income; this compares to 6.5 per cent in the immediate pre-crisis period, 2005–07. Continued growth in housing activity and sustained increases in house prices relative to incomes could to lead to further increases in the share of mortgages advanced at higher LTI multiples, increasing the proportion of highly indebted households. To guard against these risks the authorities have taken policy action. The new Financial Policy Committee (FPC) in the Bank of England has been given the authority to act should housing market pressures represent a threat to the resilience of the UK financial system and economy. In June, the Government announced that the FPC would be given explicit powers of direction to limit the proportion of high LTI and LTV mortgages. The authorities had taken a number of measures before the Article IV mission: at the end of last year they refocused the Funding for Lending Scheme away from mortgages towards small business lending; earlier this year more rigorous mortgage standards were introduced; and a UK tailored stress test (part of the EU-wide stress test coordinated by the European Banking Authority (EBA)) will assess the resilience of system to a marked fall of 35 per cent in house prices and substantial increase in interest rates. Since the mission, the FPC has announced two further measures to protect against the risk of a marked loosening in underwriting standards and a further significant rise in the number of highly indebted households. First, that when lenders are assessing applications for mortgages they test whether the mortgage would be affordable if the prevailing Bank Rate were to be 3 per cent higher than at loan origination. And second, that no more than 15 per cent of a lender’s flow of new mortgages should be at or above four-and-a-half times the borrower’s income. The LTI ratio is not designed to bite now on the market as a whole, nor in the future, if the economy evolves in line with the Banks central forecasts. Rather it will only bind if pressures increase above current forecasts. In addition, most lenders are already testing whether borrowers could afford mortgages if interest rates were to rise by around 3 per cent, but the FPC’s recommendation is intended to stop that from slipping. Both measures would act to constrain risks if house prices grow more than we expect, incomes grow less, or underwriting standards slip. The FPC will keep these measures under review.
4
The fundamental problem, however, is that the growing demand for homes must be met by growing supply. The Government is committed to reforms to address the long term structural issues in the housing market, including increasing housing supply and reform of the planning system. At Budget 2014 the Government announced measures to support the building of over 200,000 new homes, including the extension of Help to Buy equity-loan scheme to March 2020. The Government has also introduced the National Planning Policy Framework (NPPF) that replaces the previous fragmented system with a unified framework. Planning approvals are now at their highest level since 2008 with 88 per cent of applications approved in Q4 2013 and 174,000 planning permissions granted in England in 2013, the highest annual figure since 2007. Deficit reduction The deficit is forecast to have fallen by a half as a percentage of GDP by 2014-15, but it will still be too high at 5.5 per cent. Faster growth alone will not balance the books. The OBR expects public sector net debt to be 74.5% of GDP this year and expects it to peak at 78.7% in 2015-16 – lower than the 80% previously forecast - before falling. General government gross debt is expected to peak at 93.1 per cent in 2015-16. Continued implementation of the government’s medium-term fiscal consolidation plan is necessary to tackle these high levels of public debt, which divert resources toward higher interest payments and away from public services, and increase the UK’s vulnerability to future shocks. The government welcomes the IMF’s judgment that the pace and composition of the deficit reduction in the near-term and the goal to eliminate the overall deficit by 2018-19 is appropriate. The UK general election is scheduled for 7 May 2015 and as such detailed fiscal consolidation plans are only specified through 2015/16. Further savings will be required to support the government’s commitment to put the public finances on a sustainable path. The Chief Secretary to the Treasury has asked the Minster for the Cabinet Office to set out an ambitious new efficiency programme to deliver savings from 2016-17 and across the next Parliament. The government’s fiscal consolidation plan envisaged a split of 80 - 20 between spending and tax. All the tax measures have been delivered. Efforts to drive efficiencies and reduce wasteful expenditure have already yielded savings of £20 billion a year compared to 2009-10. Spending Round 2013 identified a further £5 billion additional efficiency savings in 2015-16. At the same time significant reductions in overall departmental spending have been delivered while protecting education and health and maintaining broader public service outcomes. To further manage spending pressures, the government has brought a material amount of spending under new controls through the introduction of the welfare cap. The welfare cap is a nominal spending limit for “welfare in scope” (state pension and counter-cyclical spending excluded) in each year of the forecast starting from 2015-16. The OBR will report annually on the government’s performance against the cap, starting in Autumn 2014. This is an important improvement in spending control and budget management.

5
As highlighted in the IMF’s analysis, the government publishes analysis at each fiscal event showing the breakdown of the cumulative impact of the fiscal policy changes on households by income distribution. The government is mindful of the distributional impacts of fiscal consolidation and the analysis shows that households in the top income quintile make the greatest contribution towards reducing the deficit, both in cash terms and as a percentage of their income and benefits in kind from public services. In December 2013 the government announced a review of the current fiscal framework – in line with the objective to revisit the design of the fiscal framework once the public finances were closer to balance. The outcome of the review will inform an updated Charter for Budget Responsibility, which will be presented to Parliament alongside Autumn Statement 2014. Structural reform Structural reforms remain very high on the government’s agenda to rebalance and strengthen the economy. Particular focus has been placed on prioritising infrastructure investment. In this context, and as the IMF have recognised, the government has already taken a number of steps to switch current spending to capital spending to support the quality of the fiscal consolidation and long-term productivity growth. In June 2013, the government provided greater long-term certainty by setting out commitments for over £100bn of capital spending out to 2020-21. The National Infrastructure Plan 2013 sets out a refreshed infrastructure pipeline of investment worth over £375 billion. The NIP also includes a provision of up to £40 billion of support for critical infrastructure projects through the UK Guarantees Scheme. The government has also taken action to equip young people with the skills they need to compete in the labour market. At Budget 2014 the government expanded the Apprenticeship Grants for Employers scheme, by providing an extra £85 million in both 2014-15 and 2015-16 for over 100,000 grants to employers. Reform of the Financial System Delivering and completing necessary financial regulatory reforms and repair continues to be a priority, building on recent progress. The new more focused architecture for judgment-led financial regulation and supervision has been up and running since April 2013. Since the crisis broke, banks in the UK and elsewhere have made significant progress in rebuilding capital. The FPC therefore decided in June to close its recommendation of March last year that the largest UK banks and building societies should meet a minimum 7 per cent Common Equity Tier One ratio (set out in the EU rules to implement Basel III) after adjustments for expected future losses, future conduct costs, and a more prudent calculation of risk weights. The capital adequacy framework has made much needed progress in recent years. The leverage ratio is a very useful complement, which is why the Prudential Regulation Authority has moved to using a baseline leverage ratio more
6
rapidly than the international standard requires. The FPC is currently consulting on the scope and form of its application. As part of this, further improvements to the quantity and quality of banks’ capital should bolster their resilience to unexpected shocks. Earlier this year, the EBA announced details of its 2014 stress-testing exercise. In addition, several UK banks and building societies will participate in a UK variant of the EBA’s stress test focusing on a housing shock. In combination, these measures can enhance the safety and soundness of firms and improve the resilience of the financial system as a whole by ensuring that institutions fund their activities with sufficient capital. Many of the key pieces of structural banking reform have been agreed and are already in the process of being implemented. The Banking Reform Act, which received Royal Assent in December 2013, introduces significant structural and cultural changes to the banking system. This includes giving the government the power to require the ‘ring-fencing’ of the deposits of individuals and small businesses and the authorities power to ensure that banks are more able to absorb losses. In June, the Bank announced it would extend the scope of its liquidity facilities to the UK’s biggest broker dealers and to central counterparties. Progress also continues to implement the global financial reform agenda, including enhancing competition in the financial sector, with work towards policy agreement ongoing in areas like shadow banking and completing reforms to enhance cross-border resolution. The government recently announced further steps to raise standards of conduct in the financial system with a joint review by the Treasury, the Bank and the Financial Conduct Authority (FCA) into the way wholesale financial markets operate. It builds upon the tough action the UK has already taken to tackle misconduct, including the work of the FCA to reform LIBOR and the Parliamentary Commission on Banking Standards which has led to a new legal regime for senior managers. Strong and successful financial services that set the highest standards are an essential part of building a resilient economy and ensuring the UK financial system remains a global public good.
Recommended