Unions, Costs and Productivity in the LTL Motor Carrier Industry
IntroductionLiterature ReviewMethodologyResultsConclusions

Unions, Costs and Productivity in the LTL Motor Carrier Industry
Of the 10 largest carriers of 1979 only 3 still in business as of 1984:
Yellow FreightRoadway ExpressConsolidated Freightways
Many Smaller Unionized CarriersCF Now GoneMore Intense CompetitionProblems Associated with Unions
Unions, Costs and Productivity in the LTL Motor Carrier Industry
Problems Associated with Unions
Higher Labor CostsWork RulesLess FlexibilityWork Slowdowns and Stoppages
Overnite’s Battle ($30 Million plus) to Avoid Unionization
Unions, Costs and Productivity in the LTL Motor Carrier Industry
It should come as no surprise that virtually all of the bankrupt carriers …were union companies. Conversely, the most rapidly growing and most profitable firms in the current LTL industry are primarily non-union carriers…
(Rakowski 1994)
Unions, Costs and Productivity in the LTL Motor Carrier Industry
The new carriers are
…aggressive, primarily non-union firms which started out in specialized regional market niches. These firms have grown rapidly in recent years while still maintaining good levels of profitability
(Rakowski 1994)
Unions, Costs and Productivity in the LTL Motor Carrier Industry
Why Question Rakowski?
Not all Managers Oppose Unions (Roadway, ABF)
Survival of Unionized Firms (CF Notwithstanding)
Suggestions from the Literature that Union Workers are More Productive than Nonunion

Unions, Costs and Productivity in the LTL Motor Carrier Industry
Literature Review
Freeman and Medhoff (1979)
Ehernberg and Smith (1985)
Allen (1984)
Clark (1980)
Medford (1986)
Allen (1986)
Gregg, Machin, and Metcalf (1993)
Unions, Costs and Productivity in the LTL Motor Carrier Industry
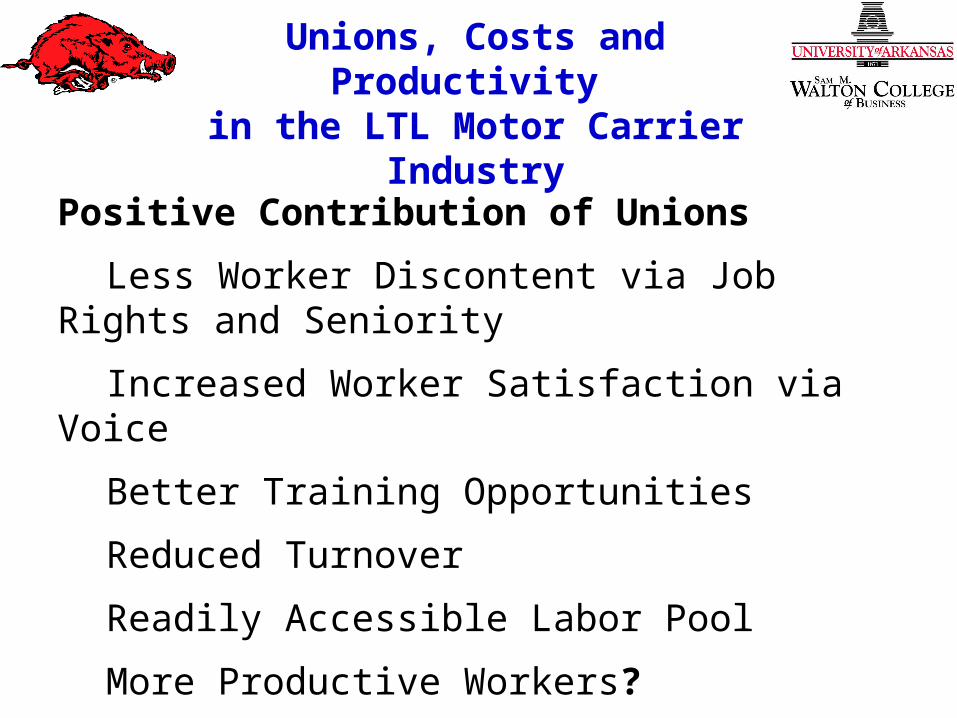
Positive Contribution of Unions
Less Worker Discontent via Job Rights and Seniority
Increased Worker Satisfaction via Voice
Better Training Opportunities
Reduced Turnover
Readily Accessible Labor Pool
More Productive Workers?

Unions, Costs and Productivity in the LTL Motor Carrier Industry
Methodology
Hypotheses
Data
Analytic Technique

Unions, Costs and Productivity in the LTL Motor Carrier Industry
Hypotheses
Union Carriers are Expected to be Lower than Non Union with Respect to:
H1: Growth Rates H2: ProfitabilityH3: PerformanceH4: Productivity

Unions, Costs and Productivity in the LTL Motor Carrier Industry
Data
TTS Bluebook 1989-2000
Had to Appear in TTS in at least 3 of the years between 1989-2000
Had to Have Earned at Least $10 Million in Revenue During at Least One of those Years (Class I Carriers)
Each Year for Each Carrier was a Separate Observation
Number of Union Observations (156-189)
Number of Non Union Observations (1109-1438)

Unions, Costs and Productivity in the LTL Motor Carrier Industry
Table 1Average Annual Revenue:
Non Union vs Union Carriers: 1989-2000 Revenue
Year Non Union Union1989 44,682.62 467,419.431990 45,078.59 492,538.331991 44,484.27 473,139.321992 48,366.37 504,949.291993 59,218.28 537,636.701994 67,897.39 593,305.711995 70,447.71 750,359.751996 79,937.72 972,475.891997 114,402.56 825,950.081998 149,957.19 807,553.151999 148,480.77 923,436.502000 123,500.55 1,263,179.77

Unions, Costs and Productivity in the LTL Motor Carrier Industry
Figure 3Average Annual Revenue:
Union vs Non Union Carriers, 1989-2000
0.00
200,000.00
400,000.00
600,000.00
800,000.00
1,000,000.00
1,200,000.00
1,400,000.00
1985 1990 1995 2000 2005
Year
Do
llars Non Union
Union

Unions, Costs and Productivity in the LTL Motor Carrier Industry
Table 2Profitability Measures of Non Union
and Unionized Motor Carriers: 1989-2000
Number of Number ofMeasure Observations Mean Observations Mean P-Value Revenue 1438 75,093.83 189 646,507.21 0.0000Operating Expenses 1438 66,861.81 189 616,866.17
0.0000Operating Income 1438 4,283.60189 17,084.82 0.0000Operating Ratio 1431 96.49 183 95.86 0.2849Net Profit Margin 1431 2.05 183 1.94 0.8200Return on Equity 1438 9.46 189 3.00 0.7120Profit/Mile 1247 0.14 174 0.22 0.0265Profit/Ton 1174 5.87 174 8.13 0.0588Profit/Ton-Mile 1158 0.03 174 0.02 0.4512Profit/Load 1155 25.50 181 57.67 0.0288
Non Union Union

Unions, Costs and Productivity in the LTL Motor Carrier Industry
Table 3Performance and Productivity Measures: 1989-2000
Number of Number ofMeasure Observations Mean Observations Mean P-Value Wages/Employee 1109 33,700.00 156 43,350.00
0.0000Expenses/Mile 1248 3.59 174 4.22 0.0406Expenses/Ton 1175 153.57 174 186.92 0.0593Expenses/Ton-Mile 1159 0.88 174 0.40 0.0507Average Load 1317 8.44 188 10.05 0.0000Avg Length of Haul 1317 343.51 188 570.47 0.0000Revenue/Mile 1317 2.84 188 3.85 0.0000Revenue/Ton 1317 134.39 188 179.46 0.0040Revenue/Ton-Mile 1317 0.48 188 0.39 0.0745Revenue/Employee 1120 284.66 158 1,233.480.0585Revenue/Vehicle 1171 345.02 175 283.85 0.2086Revenue/Load 1155 1,105.62174 2,277.540.0000Profit/Employee 1122 5.15 158 14.20 0.1911
Non Union Union

Unions, Costs and Productivity in the LTL Motor Carrier Industry
Results
All Hypotheses are Rejected:
H1: Growth Rates H2: ProfitabilityH3: PerformanceH4: Productivity
Unions, Costs and Productivity in the LTL Motor Carrier Industry
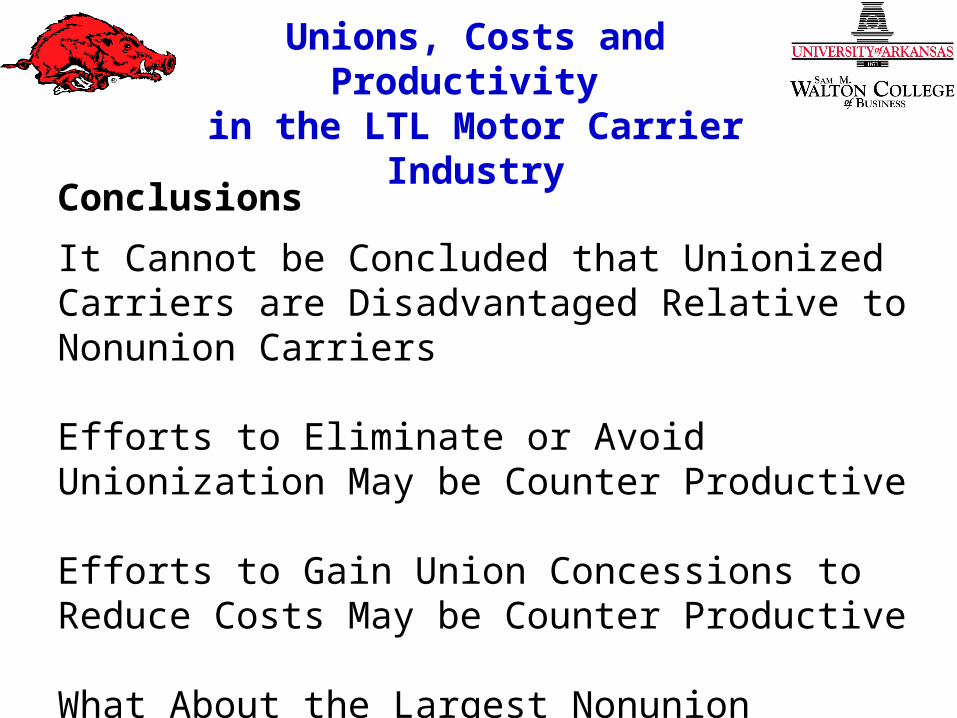
Conclusions
It Cannot be Concluded that Unionized Carriers are Disadvantaged Relative to Nonunion Carriers
Efforts to Eliminate or Avoid Unionization May be Counter Productive
Efforts to Gain Union Concessions to Reduce Costs May be Counter Productive
What About the Largest Nonunion Carriers?
Unions, Costs and Productivity in the LTL Motor Carrier Industry
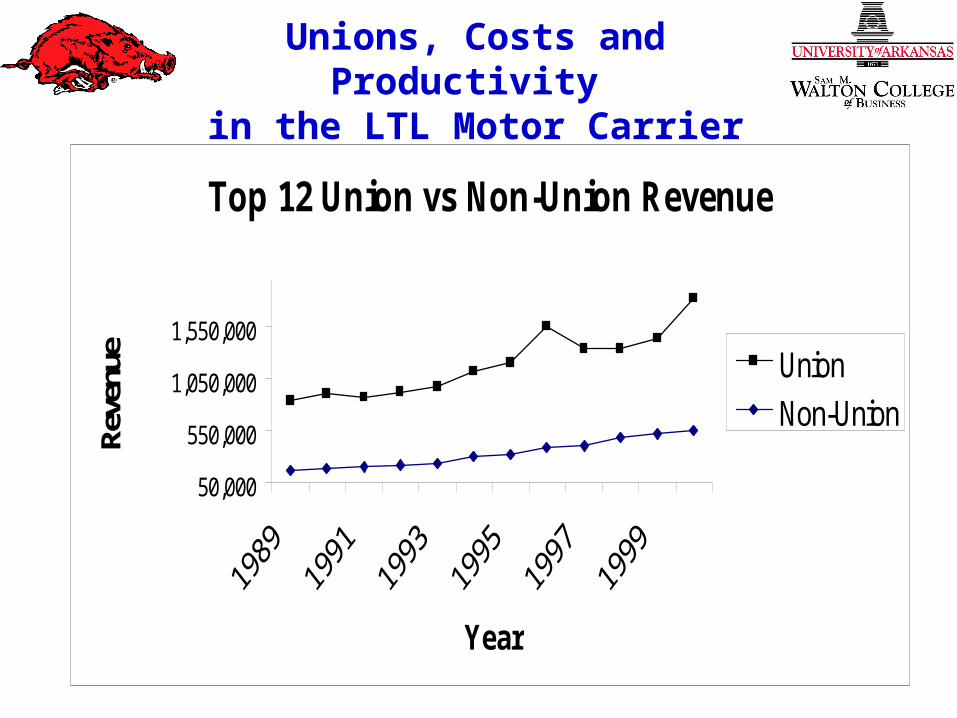
Top 12 Union vs Non-Union Revenue
50,000
550,000
1,050,000
1,550,000
Year
Reve
nue Union
Non-Union
Unions, Costs and Productivity in the LTL Motor Carrier Industry
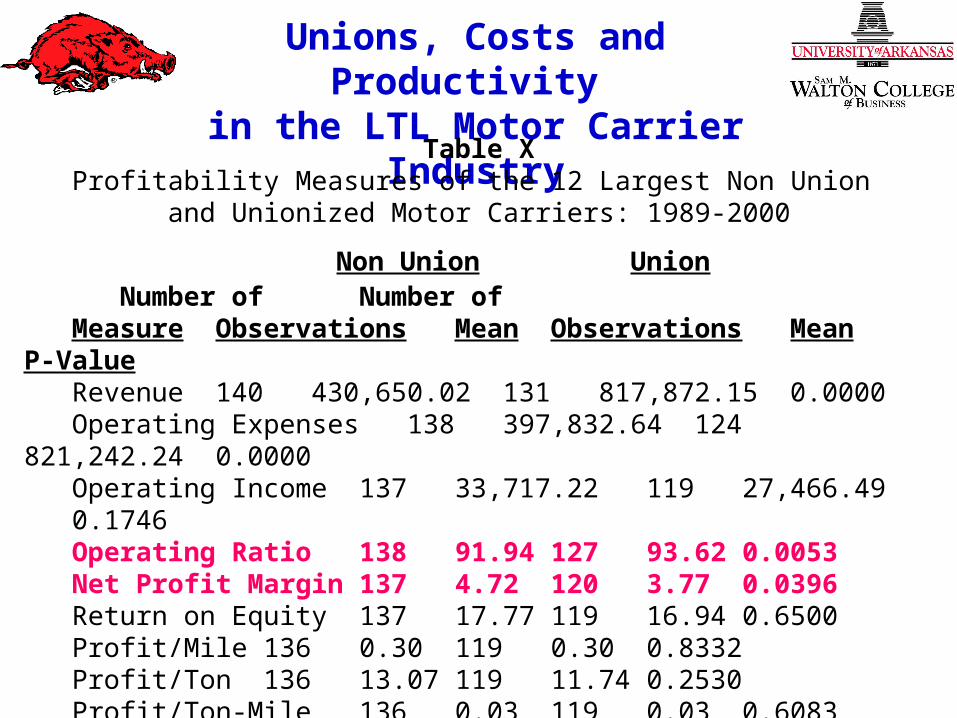
Table XProfitability Measures of the 12 Largest Non Union
and Unionized Motor Carriers: 1989-2000
Number of Number ofMeasure Observations Mean Observations Mean P-Value Revenue 140 430,650.02 131 817,872.15 0.0000Operating Expenses 138 397,832.64 124 821,242.24
0.0000Operating Income 137 33,717.22 119 27,466.49
0.1746Operating Ratio 138 91.94 127 93.62 0.0053Net Profit Margin 137 4.72 120 3.77 0.0396Return on Equity 137 17.77 119 16.94 0.6500Profit/Mile 136 0.30 119 0.30 0.8332Profit/Ton 136 13.07 119 11.74 0.2530Profit/Ton-Mile 136 0.03 119 0.03 0.6083Profit/Load 136 73.20 119 66.07 0.3791
Non Union Union

Unions, Costs and Productivity in the LTL Motor Carrier Industry
Table YPerformance and Productivity Measures 12 Largest: 1989-2000
Number of Number ofMeasure Observations Mean Observations Mean P-Value Wages/Employee 133 36,860.00 105 42,200.00
0.0000Expenses/Mile 136 3.24 119 4.05 0.0000Expenses/Ton 136 152.50 119 201.17 0.0000Expenses/Ton-Mile 136 0.34 119 0.40 0.0108Average Load 137 9.89 119 11.04 0.0045Avg Length of Haul 137 527.94 119 703.79 0.0011Revenue/Mile 136 3.53 119 4.35 0.0000Revenue/Ton136 165.57 119 212.92 0.0000Revenue/Ton-Mile 136 0.37 119 0.44 0.0180Revenue/Employee 133 118.85 107 132.46 0.0001Revenue/Vehicle 126 182.00 120 305.43 0.0369Revenue/Load 136 1,689.97119 2,541.620.0000Profit/Employee 133 5.51 107 4.54 0.1098
Non Union Union
Recommended