Uncertainty surrounding the Uncertainty surrounding the Cone of UncertaintyCone of Uncertainty
Todd Little
“It’s tough to make predictions, especially about the future.” – Yogi Berra

Managing the Coming Storm Managing the Coming Storm Inside the TornadoInside the Tornado
When will we get the requirements?All in good time, my little pretty, all in good timeBut I guess it doesn't matter anyway
Doesn't anybody believe me?
You're a very bad man!
Just give me your estimates by this afternoon
No, we need something today!
I already promised the customer it will be out in 6 months
No, we need it sooner.
Not so fast! Not so fast! ... I'll have to give the matter a little thought. Go away and come back tomorrow
Ok then, it will take 2 years.
Team Unity
Project Kickoff

We’re not in Kansas AnymoreWe’re not in Kansas Anymore
My! People come and go so quickly here!
I may not come out alive, but I'm goin' in there!
The Great and Powerful Oz has got matters well in hand.
"Hee hee hee ha ha! Going so soon? I wouldn't hear of it! Why, my little party's just beginning!
Developer HeroReorg
Testing

About LandmarkAbout Landmark
Commercial Supplier of Oil and Gas Exploration and Production Software
Users are Geophysicists, Geologists, Engineers
Subsidiary of Halliburton Energy Services
Integrated suite of ~60 Products
~50 Million lines of code
Some products 20 years old

Landmark Product SuiteLandmark Product Suite
Common Model Representation
Well data
Production data
Seismic data
Velocity data
Reservoir /Fluid data
Structural /Stratigraphic data
Common Model Representation

Data in the PortfolioData in the Portfolio
3 years of data (1999-2002)
570 projects– 106 valid (Shipped commercial product)– Remainder: Currently active, placeholder projects, internal
projects, non-commercial releases, deferred projects, etc.
Relatively Unbiased.– Each week the Program Manager recorded the state of the
project and the current release estimate.– No “improvement goal” bias

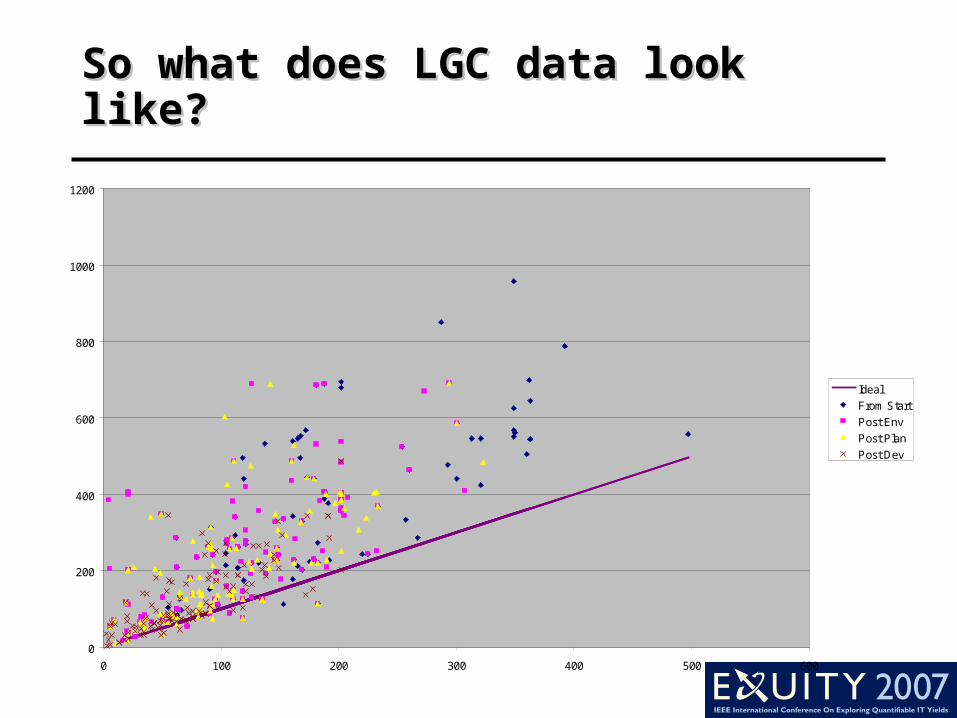
Data from LGCData from LGC
Developing Products in Twice the TimeInitial Estimate vs. Actual Project Duration (from LGC Portfolio Database)
y = 1.6886x
0
200
400
600
800
1000
1200
0 100 200 300 400 500 600 700 800 900 1000
Initial Estimate
Ac
tua
l
LGC Data
Ideal
Linear (LGC Data)

Data from Tom DeMarcoData from Tom DeMarco
It’s déjà vu all over againIndustry data from Tom DeMarco
0
200
400
600
800
1000
1200
0 100 200 300 400 500 600 700 800 900 1000
Estimated Effort
Ac
tua
l E
ffo
rt
Actual
2X
Ideal
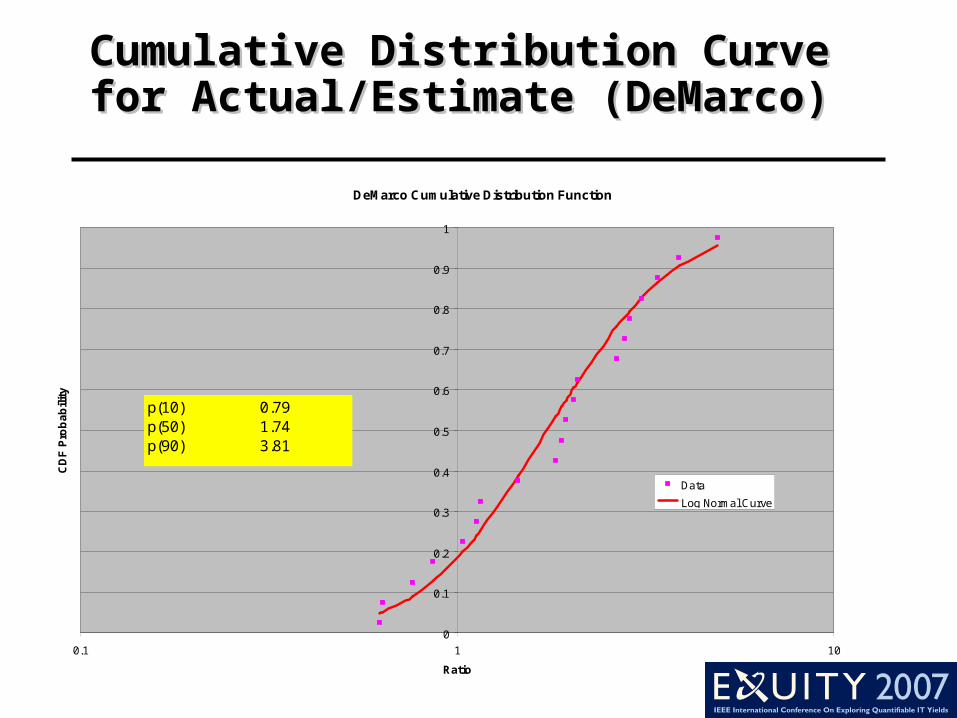
Cumulative Distribution Curve Cumulative Distribution Curve for Actual/Estimate (DeMarco)for Actual/Estimate (DeMarco)
DeMarco Cumulative Distribution Function
0
0.1
0.2
0.3
0.4
0.5
0.6
0.7
0.8
0.9
1
0.1 1 10
Ratio
CD
F P
rob
ab
ilit
y
Data
Log Normal Curve
p(10) 0.79p(50) 1.74p(90) 3.81

CDF Distribution Curve (LGC)CDF Distribution Curve (LGC)
Landmark Graphics Cumulative Distribution of Portfolio Projects
0
0.1
0.2
0.3
0.4
0.5
0.6
0.7
0.8
0.9
1
0.1 1 10
Ratio of Actual to Estimate
Cum
mul
ativ
e P
roba
bilit
y
p(10) 0.96p(50) 1.76p(90) 3.23

Probability Distribution CurveProbability Distribution Curve
Distribution Curve of Actual/Estimated (DeMarco data vs. LGC)(Demarco data is Effort/Effort; LGC data is Duration/Duration)
0
0.5
1
1.5
2
2.5
0 1 2 3 4 5 6 7 8
(Actual/Estimated)
Fre
qu
en
cy
DeMarco
LGC

How does Estimation Accuracy How does Estimation Accuracy Improve Over Time?Improve Over Time?
At the “end” of each phase, compare the most current estimate with the resulting end date.– Envisioning– Planning– Developing

Estimation Accuracy (Boehm)Estimation Accuracy (Boehm)
0.1
1
10
Feasibility Concept ofOperation
RequirementsSpec
ProductDesign Spec
Detail DesignSpec
AcceptedSoftware
Minimum
Maximum
0.5
2
0
200
400
600
800
1000
1200
0 100 200 300 400 500 600
Ideal
From Start
Post Env
Post Plan
Post Dev
So what does LGC data look So what does LGC data look like?like?
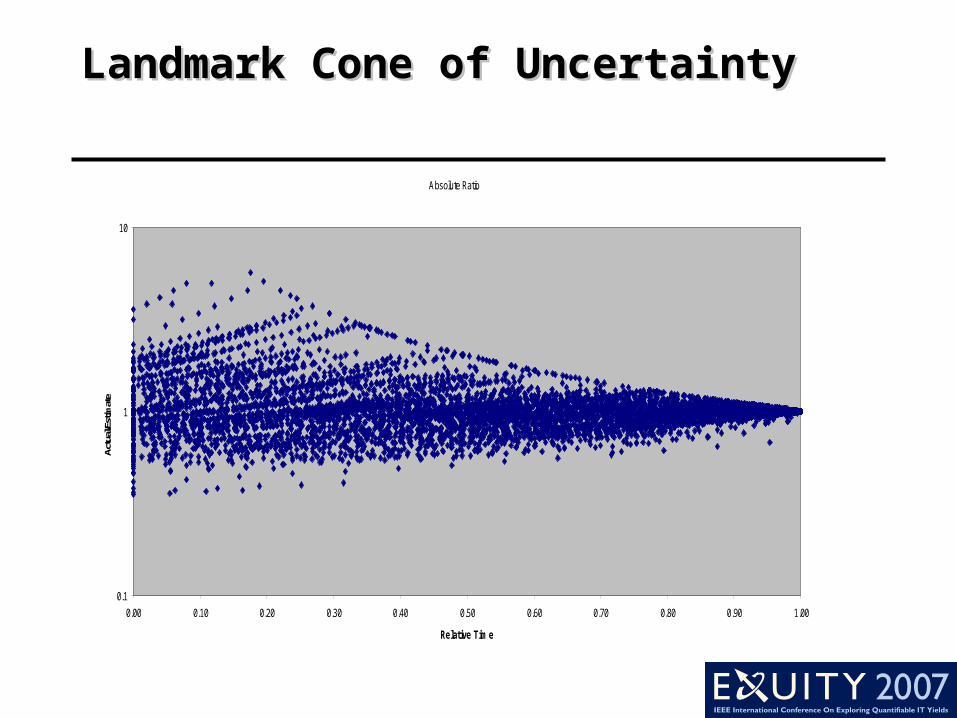
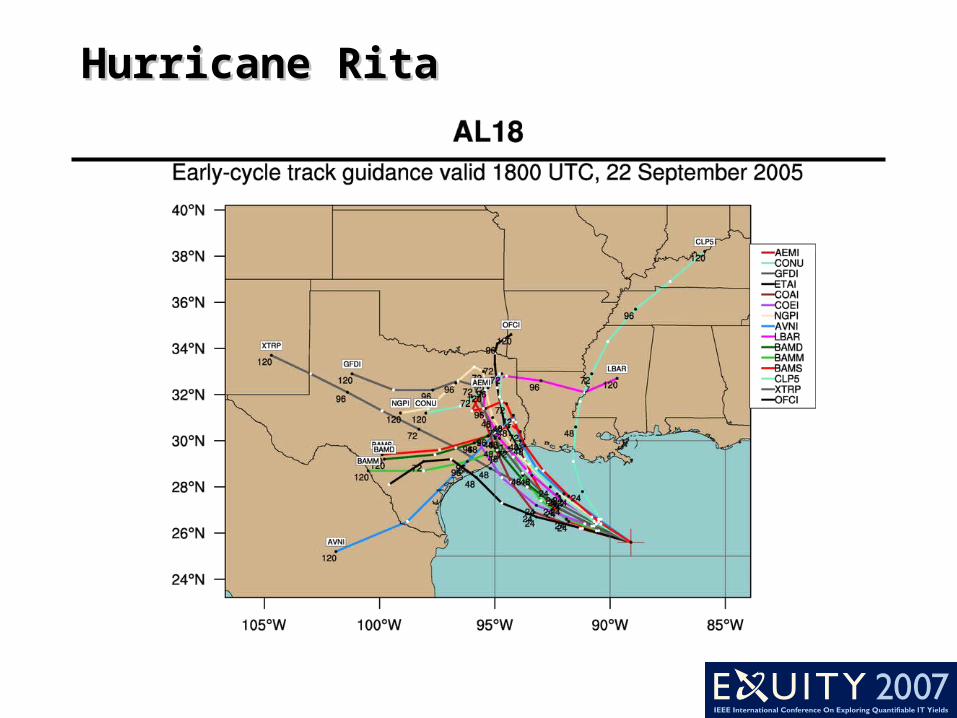
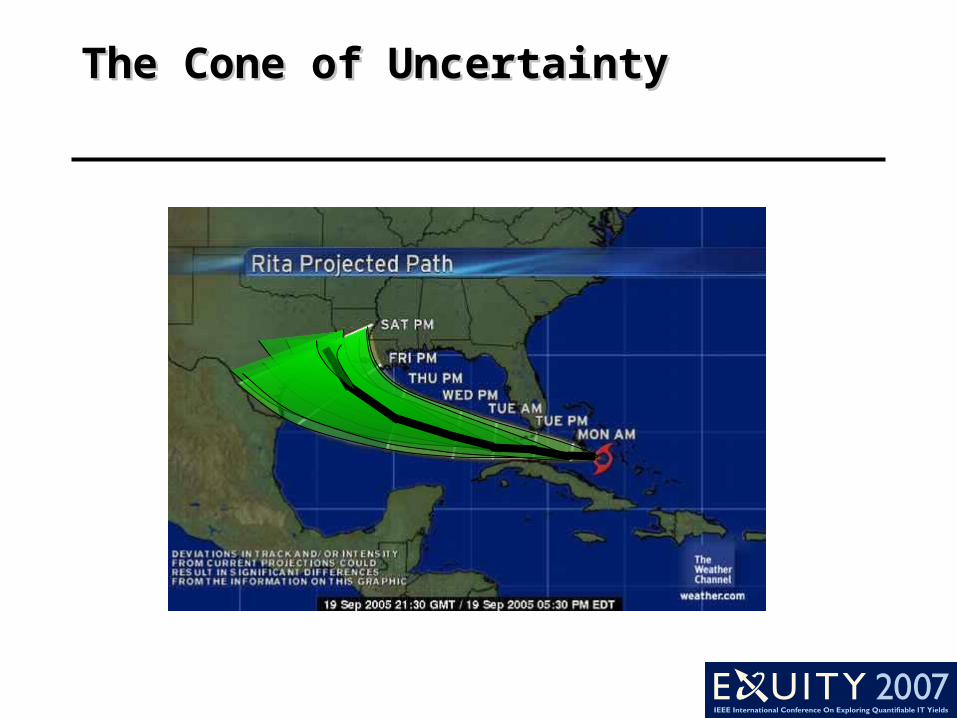
Landmark Cone of UncertaintyLandmark Cone of Uncertainty
Absolute Ratio
0.1
1
10
0.00 0.10 0.20 0.30 0.40 0.50 0.60 0.70 0.80 0.90 1.00
Relative Time
Actu
al/E
stim
ate

Cumulative Distribution (CDF) Cumulative Distribution (CDF) CurveCurve
0
0.1
0.2
0.3
0.4
0.5
0.6
0.7
0.8
0.9
1
0.1 1 10 100
Initial
Post Env
Post Plan
Post Dev
Log Normal
But is Uncertainty Really But is Uncertainty Really Reduced?Reduced?
“Take away an ordinary person’s illusions and you take away happiness at the same time.”
Henrik Ibsen--Villanden
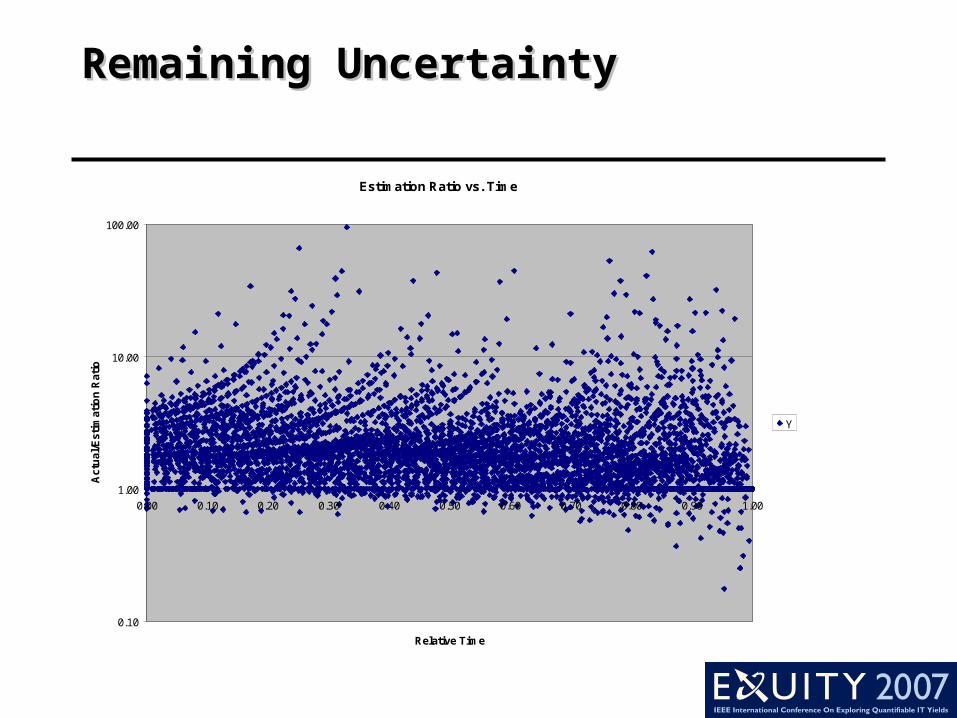
Remaining UncertaintyRemaining Uncertainty
Estimation Ratio vs. Time
0.10
1.00
10.00
100.00
0.00 0.10 0.20 0.30 0.40 0.50 0.60 0.70 0.80 0.90 1.00
Relative Time
Act
ual
/Est
imat
ion
Rat
io
Y

The Pipe of UncertaintyThe Pipe of Uncertainty
0.1
1
10
Envisioning Planning Developing Stabilizing
Minimum
Maximum
0.5
2

Does Landmark Suck at Does Landmark Suck at Estimation?Estimation?
A severe depression like that of 1920-21 is outside the range of probability.
Harvard Economic Society, Weekly Letter, November 16, 1929.
I think there is a world market for about five computers.
Thomas J. Watson, chairman of IBM, 1943.
They couldn't hit an elephant at this dist…
General John B. Sedgwick, Union Army Civil War officer's last words, uttered during the Battle of Spotsylvania, 1864

Estimation Quality Factor (EQF)Estimation Quality Factor (EQF)
Elapsed Time
Val
ue to
be
Est
imat
ed
Actual Value
Initial Estimate
Actual End Date
Link to article by Tim Lister
Blue Area
Red AreaEQF =
EQF from Lister/DeMarcoEQF from Lister/DeMarco
An EQF of 5 is pretty good (i.e. averaging about 1/5 or 20 percent off.)
The median for schedule estimating is about a 4, with the highest sustained scores at 8 to 9.
Lister and DeMarco have never known anybody to sustain a 10 (just 10 percent off).
Typical disaster project is 1.8
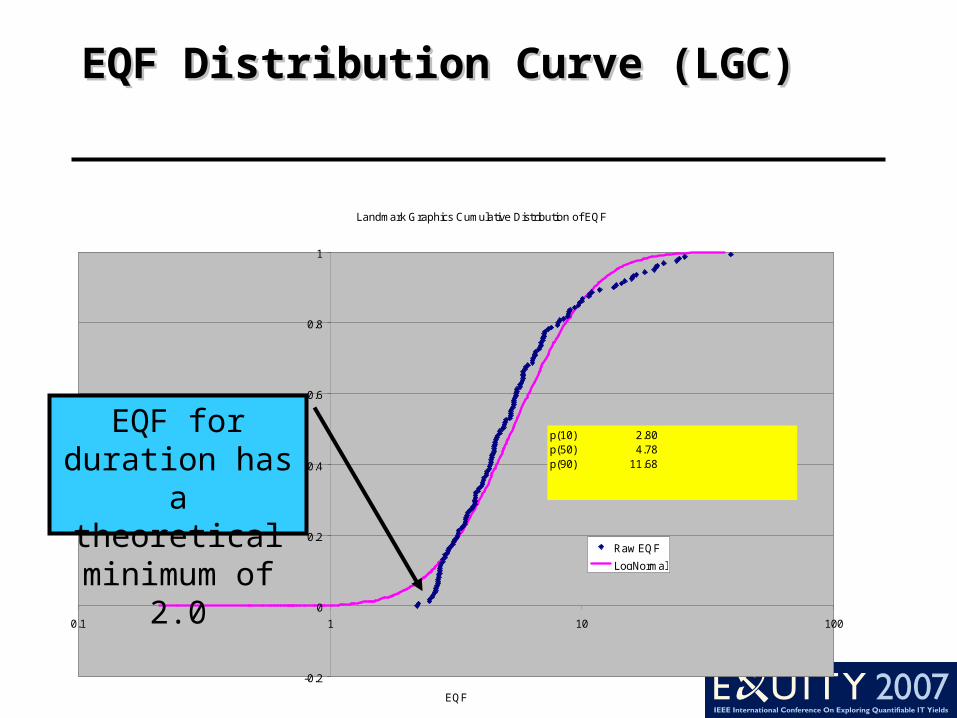
EQF Distribution Curve (LGC)EQF Distribution Curve (LGC)
Landmark Graphics Cumulative Distribution of EQF
-0.2
0
0.2
0.4
0.6
0.8
1
0.1 1 10 100
EQF
CD
F/P
rob
Raw EQF
LogNormal
p(10) 2.80p(50) 4.78p(90) 11.68
EQF for duration has a theoretical minimum of 2.0

We slip one day at a time, We slip one day at a time, EQF=2EQF=2
Elapsed Time
Val
ue to
be
Est
imat
ed
Actual Value
Initial Estimate Actual End Date
Blue Area
Red AreaEQF =
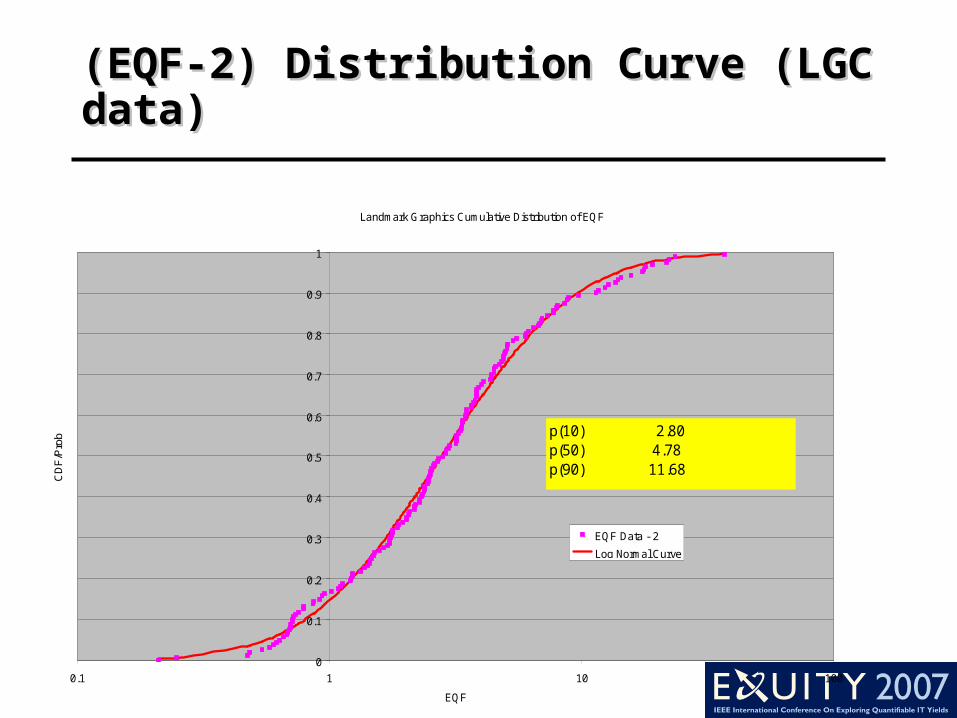
(EQF-2) Distribution Curve (LGC (EQF-2) Distribution Curve (LGC data)data)
Landmark Graphics Cumulative Distribution of EQF
0
0.1
0.2
0.3
0.4
0.5
0.6
0.7
0.8
0.9
1
0.1 1 10 100
EQF
CD
F/P
rob
EQF Data - 2
Log Normal Curve
p(10) 2.80p(50) 4.78p(90) 11.68

LGC Estimation QualityLGC Estimation Quality
LGC’s EQF measurement is pretty good.
Our p(50) is 4.8, versus an industry average around 4 and a best sustained in the ~8-10.
Our p(10) is 2.8, which is not bad.

Successful Projects?Successful Projects?
0.1
1
10
0% 10% 20% 30% 40% 50% 60% 70% 80% 90% 100%
Relative Time
Ratio
of A
ctua
l Rem
aini
ng/E
stim
ate
Recommended