Technology Research and Innovation Fund Project Report
The use of membrane bioreactors in the anaerobic digestion of the biodegradable fraction of municipal solid waste.
Produced for Defra
Author
AP Trzcinski (PhD Thesis)
Imperial College London
2009

ANAEROBIC MEMBRANE BIOREACTOR
TECHNOLOGY FOR SOLID WASTE
STABILIZATION
By
Antoine Prandota Trzcinski
A thesis submitted for the degree of Doctor of Philosophy and for the Diploma of Imperial
College
Department of Chemical Engineering and Chemical technology
Imperial College London
London SW7 2AZ
May 2009

It is declared that the work presented in the thesis is the candidate’s own.
Signature of Candidate
1

ABSTRACTIn this study, a simulated Organic Fraction of Municipal Solid Waste (OFMSW) was treated in
an anaerobic two-stage membrane process. The OFMSW feedstock was fed to a ten litre hy-
drolytic reactor (HR) where solid and liquid fractions were separated by a coarse mesh, while
the leachate was fed to a three litre submerged anaerobic membrane bioreactor (SAMBR) with
in-situ membrane cleaning by biogas sparging beneath a flat sheet Kubota membrane. The
aim was to develop and optimize this two-stage process where the use of a membrane in both
reactors to uncouple the Solid and Liquid Retention Times (SRT and HRT) would allow us to
improve the current performances obtained with single stage designs. The Denaturing Gradient
Gel Electrophoresis (DGGE) technique was used to monitor the microbial population in the re-
actors and have a better understanding of the archaeal and bacterial distribution in a two-stage
process.
It was found that meshes with pore sizes of ≤ 10 microns and ≥ 150 microns were inappropriate
to uncouple the SRT and HRT in the HR. In the former case, the mesh became clogged, while
in the latter case, the large pore size resulted in high levels of suspended solids in the leachate
that built up in the SAMBR. The most important parameter for Volatile Solids (VS) removal in the
HR was the SRT. Maximum VS removals of 70-75% could be achieved when the SRT was equal
to or greater than 50-60 days. This was achieved at a HRT of 9-12 days and an Organic Loading
Rate (OLR) of 4-5 g VS.l-1.day-1.Increasing the SRT to beyond 100 days did not significantly
increase the VS removal in the HR. However, at an OLR of 10 g VS.l-1.day-1 in the HR the SRT
had to be reduced due to a build up of TS in the HR that impeded the stirring. Below 20 days
SRT, the VS removal reduced to between 30 and 40%. With kitchen waste as its main substrate,
however, an OLR of 10 g VS.l-1.day-1 was achieved with 81% VS removal at 23 days SRT and
1.8 days HRT.
The SAMBR was found to remain stable at an OLR up to 19.8 g COD.l-1.day-1 at a HRT of
0.4 day and at a SRT greater than 300 days, while the COD removal was 95%. However, the
performance at such low HRTs was not sustainable due to membrane flux limitations when
the Mixed Liquor Total Suspended Solids (MLTSS) went beyond 20 g.l-1 due to an increase in
viscosity and inorganics concentration. At 35 ˚ C the SAMBR was found to be stable (SCOD
removal ≥ 95%) at SRTs down to 45 days and at a minimum HRT of 3.9 days. The SAMBR
could achieve 90% COD removal at 22 ˚ C at an OLR of 13.4 g COD.l-1.day-1 and 1.1 days HRT
(SRT = 300 days).
The DGGE technique was used to monitor the archaeal and bacterial diversity and evolution
in the HR and SAMBR with varying SRTs, HRTs, OLRs and temperatures in the biofilm and
in suspension. Overall, it was found that stable operation and high COD removal correlated
with a high bacterial diversity, while at the same time very few species (2-4) were dominant.
Only a few dominant archaeal species were sufficient to keep low VFA concentrations in the
SAMBR at 35 ˚ C, but not at ambient temperatures. It was found that some of the dominant
species in the HR were hydrogenotrophic Archaea such as Methanobacterium formicicum and
Methanobrevibacter while the other dominant species were from the genus Methanosarcina
2

or Methanosaeta. The presence of hydrogenotrophic species in the HR could be fostered by
reinoculating the HR with excess sludge from the SAMBR when the SRT of the SAMBR was
greater than 45 days. Among the bacterial species Ruminococcus flavefaciens, Spirochaeta,
Sphingobacteriales, Hydrogenophaga, Ralstonia, Prevotella and Smithella were associated with
good reactor performances.
3

ACKNOWLEDGEMENTSFirst of all, I would like to deeply thank my supervisor Professor David Stuckey for his inspiring
and motivating guidance throughout this research. His passion for anaerobic wastewater treat-
ment and his commitment to sustainable development encouraged me to start and go on with
the long and painstaking process of doing a PhD thesis on this subject.
I would like to thank the Department of Environment, Food and Rural Affairs (DEFRA) for financ-
ing this project under the Technologies Research and Innovative Fund (TRIF).
I would like to acknowledge all members of the laboratory for interesting discussions both in
group meetings and in more social environments.
Finally, from the depth of my heart, many thanks to Flora, my mother, father and brother for
encouraging me all the way.
4

NOTATIONSAD Anaerobic Digestion
AF Anaerobic Filter
AOB Ammonia-Oxidising Bacteria
ATA Anaerobic Toxicity Assay
BET Brunauer-Emmett-TellerBMP Biochemical Methane Potential
BSI British Standard Institution
BVS Biodegradable Volatile Solids
C:N Carbon to Nitrogen Ratio
COD Chemical Oxygen Demand (mg/L)
CP Concentration Polarisation
CSTR Continuously Stirred Tank Reactor
dm dry matter
DO Dissolved Oxygen
EGSB Expanded Granular Sludge Bed
EPS Extracellular Polymeric Substances
EC European Commission
FA Free AmmoniaFF Fixed-Film reactor
FS Flat Sheet
FSS Fixed Suspended Solids
FWC Fresh Water Consumption
FYV Fruits, Yard and Vegetables waste
GAC Granular Activated Carbon
GPR Gas Production Rate
GW Garden WasteHF Hollow Fibers
HOA Hydrogen-Oxidising Acetotrophs
HOM Hydrogen-Oxidising Methanogens
HR Hydrolytic Reactor
HRT Hydraulic Retention Time
IPW Industrial Potato Wastekd bacterial decay rate constant
kh Hydrolyis constant
Ks Half-saturation coefficient for substrate utilization
KW Kitchen WasteLB Leach-Bed
LCFA Long-Chain Fatty Acids
LMH Litre.m-2.hr-1
LPM Litre per Minute
MBR Membrane BioreactorMBT Mechanical-biological treatment
5

MF Microfiltration
MLTSS Mixed Liquor Total Suspended Solids
MLVSS Mixed Liquor Volatile Suspended Solids
MS-OFMSW Mechanically-Sorted Organic Fraction of Municipal Solid Waste
MSW Municipal Solid Waste
MTBE Methyl Tertiary-Butyl Ether
MW Molecular Weight
µmax Maximum growth rate
NHOA Non-Hydrogen Oxidising Acetotrophs
NOB Nitrite-Oxidising Bacteria
OFMSW Organic Fraction of Municipal Solid Waste
OHPA Obligate Hydrogen Producing Acetogenic bacteria
OLR Organic Loading Rate
PAC Powdered Activated CarbonPB Packed Bed reactor
PS Primary Sludge
PSD Particle Size DistributionPW Paper Waste
RPM Revolutions per Minute
ROS Refractory Organic Substances
SAMBR Submerged Anaerobic Membrane Bioreactor
SAMBR-MABR Submerged Anaerobic Membrane Bioreactor - Membrane aerated Bioreactor
SBR Sequencing Batch Reactor
SCOD Soluble Chemical Oxygen Demand
SEBAC Sequential Batch Anaerobic Composting reactor
SEC Size Exclusion Chromatography
SGP Specific Gas Production
SMP Soluble Microbial Products
SMY Specific Methane Yield
SPE Solid Phase Extraction
SRT Solid Retention Time
SS Sidestream
SS-OFMSW Source-Sorted Organic Fraction of Municipal Solid Waste
STP Standard Temperature and Pressure
T TubularTMP Transmembrane Pressure
TS Total Solids
TSS Total Suspended Solids
U Specific Substrate utilization rate
UASB Upflow Anaerobic Sludge Blanket
UF UltrafiltrationVFAs Volatile Fatty Acids
VS Volatile Solids
VSS Volatile Suspended Solids
WAS Waste Activated Sludge
6

Contents
1 INTRODUCTION 23
2 LITERATURE REVIEW 26
2.1 ANAEROBIC DIGESTION . . . . . . . . . . . . . . . . . . . . . . . . . . . . . . . . 26
2.1.1 Hydrolytic Bacteria . . . . . . . . . . . . . . . . . . . . . . . . . . . . . . . . 27
2.1.2 Fermentative Bacteria . . . . . . . . . . . . . . . . . . . . . . . . . . . . . . 28
2.1.3 Acetogenic Bacteria . . . . . . . . . . . . . . . . . . . . . . . . . . . . . . . 28
2.1.4 Methanogenic Bacteria . . . . . . . . . . . . . . . . . . . . . . . . . . . . . 29
2.1.5 Protein Degradation . . . . . . . . . . . . . . . . . . . . . . . . . . . . . . . 30
2.1.6 Ammonia Degradation . . . . . . . . . . . . . . . . . . . . . . . . . . . . . . 32
2.2 MUNICIPAL SOLID WASTE . . . . . . . . . . . . . . . . . . . . . . . . . . . . . . . 33
2.2.1 Introduction . . . . . . . . . . . . . . . . . . . . . . . . . . . . . . . . . . . . 33
2.2.2 Composition of the Organic Fraction of Municipal Solid Waste . . . . . . . . 34
2.2.3 Biodegradability of the Organic Fraction of Municipal Solid Waste . . . . . . 36
2.2.4 Kinetics of the Anaerobic Digestion of MSW . . . . . . . . . . . . . . . . . . 37
2.3 FACTORS AFFECTING THE AD OF MSW . . . . . . . . . . . . . . . . . . . . . . 39
2.3.1 Introduction . . . . . . . . . . . . . . . . . . . . . . . . . . . . . . . . . . . . 39
2.3.2 Inoculum/Substrate Ratio . . . . . . . . . . . . . . . . . . . . . . . . . . . . 39
2.3.3 Pretreatments . . . . . . . . . . . . . . . . . . . . . . . . . . . . . . . . . . 40
2.3.4 Particle Size Distribution (PSD) . . . . . . . . . . . . . . . . . . . . . . . . . 41
2.3.5 pH . . . . . . . . . . . . . . . . . . . . . . . . . . . . . . . . . . . . . . . . . 41
2.3.6 Alkalinity . . . . . . . . . . . . . . . . . . . . . . . . . . . . . . . . . . . . . 42
2.3.7 Solid Retention Time (SRT) . . . . . . . . . . . . . . . . . . . . . . . . . . . 42
2.3.8 Total Solid Content (TS) . . . . . . . . . . . . . . . . . . . . . . . . . . . . . 43
2.3.9 Organic Loading Rate (OLR) . . . . . . . . . . . . . . . . . . . . . . . . . . 44
2.3.10 Volatile Fatty Acids Inhibition . . . . . . . . . . . . . . . . . . . . . . . . . . 44
2.3.11 Effect of Temperature . . . . . . . . . . . . . . . . . . . . . . . . . . . . . . 45
7

CONTENTS CONTENTS
2.3.12 Ammonia Inhibition . . . . . . . . . . . . . . . . . . . . . . . . . . . . . . . . 47
2.3.13 Struvite Precipitation . . . . . . . . . . . . . . . . . . . . . . . . . . . . . . . 48
2.3.14 Calcium Salts Precipitation . . . . . . . . . . . . . . . . . . . . . . . . . . . 49
2.3.15 Nutrient Requirements . . . . . . . . . . . . . . . . . . . . . . . . . . . . . . 50
2.3.16 Phase Separation . . . . . . . . . . . . . . . . . . . . . . . . . . . . . . . . 51
2.3.17 Recirculation of the Effluent . . . . . . . . . . . . . . . . . . . . . . . . . . . 51
2.3.18 Stability of the Digestate . . . . . . . . . . . . . . . . . . . . . . . . . . . . . 52
2.3.19 Solid Waste Anaerobic Processes . . . . . . . . . . . . . . . . . . . . . . . 56
2.4 ANAEROBIC MEMBRANE BIOREACTORS . . . . . . . . . . . . . . . . . . . . . . 58
2.4.1 Introduction . . . . . . . . . . . . . . . . . . . . . . . . . . . . . . . . . . . . 58
2.4.2 Concentration Polarisation . . . . . . . . . . . . . . . . . . . . . . . . . . . 60
2.4.3 Nominal Pore Size and Flux . . . . . . . . . . . . . . . . . . . . . . . . . . . 60
2.4.4 Fouling . . . . . . . . . . . . . . . . . . . . . . . . . . . . . . . . . . . . . . 61
2.4.5 Anaerobic Membrane Bioreactors for High Strength Wastewater and Leachate
Treatment . . . . . . . . . . . . . . . . . . . . . . . . . . . . . . . . . . . . . 67
2.5 PHYSICO-CHEMICAL TREATMENT OF STABILISED LEACHATE . . . . . . . . . 69
2.5.1 Introduction . . . . . . . . . . . . . . . . . . . . . . . . . . . . . . . . . . . . 69
2.5.2 Activated Carbon . . . . . . . . . . . . . . . . . . . . . . . . . . . . . . . . . 71
2.5.3 Coagulation-Flocculation . . . . . . . . . . . . . . . . . . . . . . . . . . . . 71
2.5.4 Ultrafiltration (UF) . . . . . . . . . . . . . . . . . . . . . . . . . . . . . . . . 73
2.5.5 Ion Exchange Resins . . . . . . . . . . . . . . . . . . . . . . . . . . . . . . 73
2.6 SUMMARY OF LITERATURE REVIEW . . . . . . . . . . . . . . . . . . . . . . . . 73
2.7 OBJECTIVES OF THE STUDY . . . . . . . . . . . . . . . . . . . . . . . . . . . . . 75
3 MATERIALS AND METHODS 77
3.1 EXPERIMENTAL SETUP . . . . . . . . . . . . . . . . . . . . . . . . . . . . . . . . 77
3.1.1 Hydrolytic Reactor . . . . . . . . . . . . . . . . . . . . . . . . . . . . . . . . 77
3.1.2 Methanogenic Reactor . . . . . . . . . . . . . . . . . . . . . . . . . . . . . . 77
3.2 ANALYTICAL METHODS . . . . . . . . . . . . . . . . . . . . . . . . . . . . . . . . 78
3.2.1 pH . . . . . . . . . . . . . . . . . . . . . . . . . . . . . . . . . . . . . . . . . 78
3.2.2 Oxido-Reduction Potential . . . . . . . . . . . . . . . . . . . . . . . . . . . . 78
3.2.3 Biogas Composition and Production Rate . . . . . . . . . . . . . . . . . . . 79
3.2.4 Volatile Fatty Acids (VFAs) . . . . . . . . . . . . . . . . . . . . . . . . . . . 79
3.2.5 Gas Chromatography - Mass Spectrometry (GC-MS) . . . . . . . . . . . . . 79
8

CONTENTS CONTENTS
3.2.6 Particle Size Distribution . . . . . . . . . . . . . . . . . . . . . . . . . . . . . 81
3.2.7 Heavy Metals . . . . . . . . . . . . . . . . . . . . . . . . . . . . . . . . . . . 81
3.2.8 Ion Chromatography . . . . . . . . . . . . . . . . . . . . . . . . . . . . . . . 81
3.2.9 Size Exclusion Chromatography (SEC) . . . . . . . . . . . . . . . . . . . . 82
3.2.10 Scanning Electron Microscope - Energy Dispersive X-ray (SEM-EDX) . . . 82
3.2.11 Surface Area . . . . . . . . . . . . . . . . . . . . . . . . . . . . . . . . . . . 82
3.3 PHYSICO-CHEMICAL METHODS . . . . . . . . . . . . . . . . . . . . . . . . . . . 82
3.3.1 Alkalinity . . . . . . . . . . . . . . . . . . . . . . . . . . . . . . . . . . . . . 82
3.3.2 Total Solids, Volatile Solids and Fixed Solids . . . . . . . . . . . . . . . . . 83
3.3.3 Total Suspended Solids and Volatile Suspended Solids . . . . . . . . . . . 83
3.3.4 COD Measurement . . . . . . . . . . . . . . . . . . . . . . . . . . . . . . . 83
3.3.5 Ammonia Measurement . . . . . . . . . . . . . . . . . . . . . . . . . . . . . 84
3.3.6 Total Nitrogen Measurement . . . . . . . . . . . . . . . . . . . . . . . . . . 84
3.3.7 Total Phosphorus Measurement . . . . . . . . . . . . . . . . . . . . . . . . 84
3.3.8 Carbohydrates Measurement . . . . . . . . . . . . . . . . . . . . . . . . . . 85
3.3.9 Protein Measurement . . . . . . . . . . . . . . . . . . . . . . . . . . . . . . 85
3.3.10 Ultrafiltration Tests . . . . . . . . . . . . . . . . . . . . . . . . . . . . . . . . 85
3.3.11 Biochemical Methane Potential Test . . . . . . . . . . . . . . . . . . . . . . 86
3.3.12 Microbial Respiration Test . . . . . . . . . . . . . . . . . . . . . . . . . . . . 86
3.3.13 Adsorption Isotherms . . . . . . . . . . . . . . . . . . . . . . . . . . . . . . 88
3.3.14 Adsorption Kinetics . . . . . . . . . . . . . . . . . . . . . . . . . . . . . . . 89
3.4 MOLECULAR BIOLOGY METHODS: Denaturing Gel Gradient Electrophoresis
(DGGE) . . . . . . . . . . . . . . . . . . . . . . . . . . . . . . . . . . . . . . . . . . 89
3.5 FEEDSTOCK COMPOSITION AND PROPERTIES . . . . . . . . . . . . . . . . . . 91
3.5.1 Composition . . . . . . . . . . . . . . . . . . . . . . . . . . . . . . . . . . . 91
3.5.2 Properties . . . . . . . . . . . . . . . . . . . . . . . . . . . . . . . . . . . . . 92
4 EFFECT OF ACETIC ACID ON THE CHEMICAL HYDROLYSIS OF THE OFMSW 98
4.1 INTRODUCTION . . . . . . . . . . . . . . . . . . . . . . . . . . . . . . . . . . . . . 98
4.2 EXPERIMENTAL AND ANALYTICAL DETAILS . . . . . . . . . . . . . . . . . . . . 100
4.2.1 Chemical hydrolysis . . . . . . . . . . . . . . . . . . . . . . . . . . . . . . . 100
4.2.2 Enzymatic hydrolysis . . . . . . . . . . . . . . . . . . . . . . . . . . . . . . . 100
4.3 RESULTS AND DISCUSSION . . . . . . . . . . . . . . . . . . . . . . . . . . . . . 101
4.3.1 Chemical hydrolysis . . . . . . . . . . . . . . . . . . . . . . . . . . . . . . . 1019

CONTENTS CONTENTS
4.3.2 Enzymatic hydrolysis . . . . . . . . . . . . . . . . . . . . . . . . . . . . . . . 103
4.3.3 Reduced conditions . . . . . . . . . . . . . . . . . . . . . . . . . . . . . . . 103
4.3.4 Hydrolysis constant . . . . . . . . . . . . . . . . . . . . . . . . . . . . . . . 106
4.4 SUMMARY . . . . . . . . . . . . . . . . . . . . . . . . . . . . . . . . . . . . . . . . 109
5 BATCH TREATMENT OF THE OFMSW IN A TWO-STAGE PROCESS 110
5.1 INTRODUCTION . . . . . . . . . . . . . . . . . . . . . . . . . . . . . . . . . . . . . 110
5.2 EXPERIMENTAL AND ANALYTICAL DETAILS . . . . . . . . . . . . . . . . . . . . 111
5.2.1 Reactors . . . . . . . . . . . . . . . . . . . . . . . . . . . . . . . . . . . . . 111
5.2.2 Inoculation of Reactors . . . . . . . . . . . . . . . . . . . . . . . . . . . . . 112
5.3 RESULTS AND DISCUSSION . . . . . . . . . . . . . . . . . . . . . . . . . . . . . 113
5.3.1 Performance of the HR . . . . . . . . . . . . . . . . . . . . . . . . . . . . . 113
5.3.2 Performance of the SAMBR . . . . . . . . . . . . . . . . . . . . . . . . . . . 115
5.3.3 Total and Volatile Solids Concentrations . . . . . . . . . . . . . . . . . . . . 116
5.3.4 Size Exclusion Chromatography (SEC) . . . . . . . . . . . . . . . . . . . . 118
5.3.5 Flux and Transmembrane Pressure . . . . . . . . . . . . . . . . . . . . . . 120
5.3.6 Biochemical Methane Potential (BMP) . . . . . . . . . . . . . . . . . . . . . 125
5.4 SUMMARY . . . . . . . . . . . . . . . . . . . . . . . . . . . . . . . . . . . . . . . . 126
6 CONTINUOUS TREATMENT OF LOW STRENGTH LEACHATE IN A SAMBR 128
6.1 INTRODUCTION . . . . . . . . . . . . . . . . . . . . . . . . . . . . . . . . . . . . . 128
6.2 EXPERIMENTAL AND ANALYTICAL DETAILS . . . . . . . . . . . . . . . . . . . . 130
6.2.1 Reactors . . . . . . . . . . . . . . . . . . . . . . . . . . . . . . . . . . . . . 130
6.2.2 Inoculation and start-up of Reactors . . . . . . . . . . . . . . . . . . . . . . 130
6.3 RESULTS AND DISCUSSION . . . . . . . . . . . . . . . . . . . . . . . . . . . . . 131
6.3.1 Performance of the Hydrolytic Reactor . . . . . . . . . . . . . . . . . . . . . 131
6.3.2 Performance of SAMBR1 . . . . . . . . . . . . . . . . . . . . . . . . . . . . 135
6.3.3 Performance of SAMBR2 . . . . . . . . . . . . . . . . . . . . . . . . . . . . 140
6.3.4 Effect of the Biogas Sparging Rate on COD Rejection . . . . . . . . . . . . 145
6.3.5 Performance of the AMBR . . . . . . . . . . . . . . . . . . . . . . . . . . . . 150
6.3.6 Particle Size Distribution . . . . . . . . . . . . . . . . . . . . . . . . . . . . . 158
6.3.7 Salts . . . . . . . . . . . . . . . . . . . . . . . . . . . . . . . . . . . . . . . . 158
6.3.8 Size Exclusion Chromatography (SEC) . . . . . . . . . . . . . . . . . . . . 163
6.3.9 Gas Chromatography - Mass Spectrometry . . . . . . . . . . . . . . . . . . 167
6.3.10 Denaturing Gel Gradient Electrophoresis (DGGE) . . . . . . . . . . . . . . 176
6.4 SUMMARY . . . . . . . . . . . . . . . . . . . . . . . . . . . . . . . . . . . . . . . . 18110

CONTENTS CONTENTS
7 CONTINUOUS TREATMENT OF HIGH STRENGTH LEACHATE IN A SAMBR 183
7.1 INTRODUCTION . . . . . . . . . . . . . . . . . . . . . . . . . . . . . . . . . . . . . 183
7.2 EXPERIMENTAL AND ANALYTICAL DETAILS . . . . . . . . . . . . . . . . . . . . 186
7.2.1 Reactors . . . . . . . . . . . . . . . . . . . . . . . . . . . . . . . . . . . . . 186
7.2.2 Inoculation of Reactors . . . . . . . . . . . . . . . . . . . . . . . . . . . . . 187
7.3 RESULTS AND DISCUSSION . . . . . . . . . . . . . . . . . . . . . . . . . . . . . 187
7.3.1 Performance of the Hydrolytic Reactor . . . . . . . . . . . . . . . . . . . . . 187
7.3.2 Stability of the Digestate . . . . . . . . . . . . . . . . . . . . . . . . . . . . . 194
7.3.3 Heavy Metals Content of the Digestate from the HR . . . . . . . . . . . . . 199
7.3.4 Performance of the SAMBR . . . . . . . . . . . . . . . . . . . . . . . . . . . 199
7.3.5 Performance of the AMBR . . . . . . . . . . . . . . . . . . . . . . . . . . . . 205
7.3.6 Scanning Electron Microscopy of the Fibers in the HR and SAMBR. . . . . 207
7.3.7 Contribution of Organic and Inorganic Materials to Fouling. . . . . . . . . . 209
7.3.8 Scanning Electron Microscope - Energy Dispersive X-ray (SEM-EDX) . . . 210
7.3.9 Ions . . . . . . . . . . . . . . . . . . . . . . . . . . . . . . . . . . . . . . . . 212
7.3.10 Denaturing Gel Gradient Electrophoresis (DGGE) . . . . . . . . . . . . . . 215
7.4 SUMMARY . . . . . . . . . . . . . . . . . . . . . . . . . . . . . . . . . . . . . . . . 223
8 CONTINUOUS TREATMENT OF LEACHATE IN A SAMBR-MABR 225
8.1 INTRODUCTION . . . . . . . . . . . . . . . . . . . . . . . . . . . . . . . . . . . . . 225
8.2 EXPERIMENTAL AND ANALYTICAL DETAILS . . . . . . . . . . . . . . . . . . . . 227
8.2.1 Reactors . . . . . . . . . . . . . . . . . . . . . . . . . . . . . . . . . . . . . 227
8.2.2 Inoculation and start-up of Reactors . . . . . . . . . . . . . . . . . . . . . . 228
8.3 RESULTS AND DISCUSSION . . . . . . . . . . . . . . . . . . . . . . . . . . . . . 229
8.3.1 Performance of the Hydrolytic Reactor . . . . . . . . . . . . . . . . . . . . . 229
8.3.2 Formation and Performance of a Nitrifying Biofilm . . . . . . . . . . . . . . 237
8.3.3 Performance of the SAMBR-MABR . . . . . . . . . . . . . . . . . . . . . . . 240
8.3.4 Performance of the Conventional SAMBR . . . . . . . . . . . . . . . . . . . 245
8.3.5 Gas Chromatography - Mass Spectrometry . . . . . . . . . . . . . . . . . . 249
8.3.6 Denaturing Gel Gradient Electrophoresis (DGGE) . . . . . . . . . . . . . . 253
8.4 SUMMARY . . . . . . . . . . . . . . . . . . . . . . . . . . . . . . . . . . . . . . . . 260
11

CONTENTS CONTENTS
9 CHARACTERISATION OF THE SAMBR PERMEATE 263
9.1 INTRODUCTION . . . . . . . . . . . . . . . . . . . . . . . . . . . . . . . . . . . . . 263
9.2 EXPERIMENTAL AND ANALYTICAL DETAILS . . . . . . . . . . . . . . . . . . . . 264
9.2.1 GAC and PAC properties . . . . . . . . . . . . . . . . . . . . . . . . . . . . 264
9.2.2 Effect of pH . . . . . . . . . . . . . . . . . . . . . . . . . . . . . . . . . . . . 264
9.2.3 Effect of Concentration . . . . . . . . . . . . . . . . . . . . . . . . . . . . . 265
9.2.4 Performance of Two Different Types of Activated Carbon . . . . . . . . . . . 265
9.2.5 Effect of Powdered Activated Carbon on Various Fractions of Effluent . . . 265
9.2.6 Coagulation / Flocculation Tests . . . . . . . . . . . . . . . . . . . . . . . . 265
9.2.7 Polymeric Adsorbents . . . . . . . . . . . . . . . . . . . . . . . . . . . . . . 266
9.2.8 Anaerobic Toxicity Assay (ATA) . . . . . . . . . . . . . . . . . . . . . . . . . 266
9.3 RESULTS AND DISCUSSION . . . . . . . . . . . . . . . . . . . . . . . . . . . . . 268
9.3.1 Batch Adsorption Test Using Activated Carbon . . . . . . . . . . . . . . . . 268
9.3.2 Other Factors Influencing the Adsorption Capacity . . . . . . . . . . . . . . 270
9.3.3 Controls . . . . . . . . . . . . . . . . . . . . . . . . . . . . . . . . . . . . . . 271
9.3.4 Effect of PAC on Various Fractions of Effluent . . . . . . . . . . . . . . . . . 272
9.3.5 Effect of Various Adsorbents and Coagulants on Removal of Low Molecu-
lar Weight Substances . . . . . . . . . . . . . . . . . . . . . . . . . . . . . . 274
9.3.6 Effect of Iron Chloride on Coagulation-Flocculation of Organic Compounds 275
9.3.7 Anaerobic Toxicity Assay (ATA) . . . . . . . . . . . . . . . . . . . . . . . . . 278
9.3.8 Size Exclusion Chromatography Results . . . . . . . . . . . . . . . . . . . . 281
9.4 SUMMARY . . . . . . . . . . . . . . . . . . . . . . . . . . . . . . . . . . . . . . . . 287
10 CONCLUSIONS AND FUTURE WORK 289
10.1 CONCLUDING DISCUSSION . . . . . . . . . . . . . . . . . . . . . . . . . . . . . . 289
10.1.1 investigation of the role of acetic acid in the chemical hydrolysis of the
OFMSW . . . . . . . . . . . . . . . . . . . . . . . . . . . . . . . . . . . . . . 289
10.1.2 Investigation of the effect of a macrofilter and performance of the HR op-
erating at various SRT, HRTs and temperature. . . . . . . . . . . . . . . . . 289
10.1.3 Characterisation of the archaeal and bacterial populations using Denatur-
ing Gradient Gel Electrophoresis (DGGE) . . . . . . . . . . . . . . . . . . . 290
10.1.4 Treatment of the effluent of the HR in a SAMBR and determination of the
effect of SRT, HRT and temperature on COD removal, permeate flux and
stability . . . . . . . . . . . . . . . . . . . . . . . . . . . . . . . . . . . . . . 291
10.1.5 Identification of the main foulants of the membrane in the SAMBR and AMBR292
12

CONTENTS CONTENTS
10.1.6 Investigation of nitrification of COD-polishing of an aerated MBR treating
the permeate of the SAMBR . . . . . . . . . . . . . . . . . . . . . . . . . . 293
10.1.7 Characterisation of the effluent of the SAMBR and adsorption and floccu-
lation/coagulation tests . . . . . . . . . . . . . . . . . . . . . . . . . . . . . 293
10.2 RECOMMENDATIONS FOR FUTURE WORK . . . . . . . . . . . . . . . . . . . . 295
11 BIBLIOGRAPHY 298
A Technical Drawings 333
B Measurement of gas volumes 343
13

List of Figures
2.1 The main degradation pathways in anaerobic digestion. . . . . . . . . . . . . . . . 27
2.2 Steps in the bioconversion of protein. . . . . . . . . . . . . . . . . . . . . . . . . . . 31
2.3 Struvite solubility limit curves. . . . . . . . . . . . . . . . . . . . . . . . . . . . . . . 49
2.4 The parameters and interactions that influence process performance in an anaer-
obic membrane bioreactor. . . . . . . . . . . . . . . . . . . . . . . . . . . . . . . . 60
3.1 3-D view of the hydrolytic reactor and stirrer. . . . . . . . . . . . . . . . . . . . . . . 77
3.2 Schematic diagram of the Submerged Anaerobic Membrane Bioreactor. . . . . . . 78
3.3 Biochemical Methane Potential on the components and the feedstock of OFMSW
used in this study. . . . . . . . . . . . . . . . . . . . . . . . . . . . . . . . . . . . . 94
3.4 Effect of the acclimatisation of the biomass on the Biochemical Methane Potential
test of OFMSW. . . . . . . . . . . . . . . . . . . . . . . . . . . . . . . . . . . . . . . 96
4.1 Evolution of Soluble COD during chemical hydrolysis of MSW at different pHs
under oxidative environments in comparison with bacterial hydrolysis of MSW. . . 101
4.2 Evolution of Soluble COD during chemical hydrolysis of MSW at different pHs
under a controlled reducing environment in comparison with bacterial hydrolysis
of alpha-cellulose. . . . . . . . . . . . . . . . . . . . . . . . . . . . . . . . . . . . . 104
4.3 Comparison of the chemical hydrolysis of the OFMSW at pH 4 with acetic acid
and sulphuric acid. . . . . . . . . . . . . . . . . . . . . . . . . . . . . . . . . . . . . 106
4.4 Plot of ln (SCOD(t)) versus 1/t to find the intercept SCODmax in equation 4.6
(top). Comparison between the experimental data and the SCOD values esti-
mated with Equation 4.4 (bottom). . . . . . . . . . . . . . . . . . . . . . . . . . . . 107
5.1 Schematic diagram of the 2-phase process treating the organic fraction of Munic-
ipal Solid Waste. . . . . . . . . . . . . . . . . . . . . . . . . . . . . . . . . . . . . . 112
5.2 SCOD, TCOD and VFAs (as COD) in the hydrolytic reactor effluent and pHs pro-
files in the HR and the SAMBR. . . . . . . . . . . . . . . . . . . . . . . . . . . . . . 113
5.3 Solubilisation and acidification efficiencies and methane percentage in the headspace
of the HR. . . . . . . . . . . . . . . . . . . . . . . . . . . . . . . . . . . . . . . . . . 114
14
LIST OF FIGURES LIST OF FIGURES
5.4 Volatile Fatty Acid distribution in the hydrolytic reactor effluent. . . . . . . . . . . . 115
5.5 SCOD and VFAs (as COD) within the SAMBR and in its permeate. . . . . . . . . . 116
5.6 Evolution with time of total VFAs, acetate, propionate and n-butyrate in the per-
meate of the SAMBR. . . . . . . . . . . . . . . . . . . . . . . . . . . . . . . . . . . 117
5.7 Evolution with time of the SCOD removal, the SCOD membrane rejection and the
organic loading rate in the SAMBR. . . . . . . . . . . . . . . . . . . . . . . . . . . . 118
5.8 Evolution with time of total TSS, VSS, FSS and VSS/TSS ratio in the HR. . . . . . 119
5.9 Evolution with time of total TSS, VSS, FSS and VSS/TSS ratio in the SAMBR. . . 120
5.10 Size exclusion chromatograms of standard, HR effluent, SAMBR bulk and SAMBR
permeate taken on day 29 of the batch treatment of the OFMSW. . . . . . . . . . . 121
5.11 Evolution of concentration of different groups of molecules during the batch treat-
ment of the OFMSW. . . . . . . . . . . . . . . . . . . . . . . . . . . . . . . . . . . . 122
5.12 Evolution with time of the transmembrane pressure (TMP) between days 21 and 29.123
5.13 Comparison of TMP evolution after a step increase in flux on day 44 and day 50
of the batch. . . . . . . . . . . . . . . . . . . . . . . . . . . . . . . . . . . . . . . . . 123
5.14 Kubota membrane partially scoured by biogas bubbles (left) and diffuser located
at the bottom of the SAMBR (right). . . . . . . . . . . . . . . . . . . . . . . . . . . . 124
5.15 BMP of the soluble and total fractions of leachate on day 9 of the batch test. . . . . 125
6.1 Evolution with time of TCOD, SCOD and VFAs in the effluent of the HR, OLR and
pH. . . . . . . . . . . . . . . . . . . . . . . . . . . . . . . . . . . . . . . . . . . . . . 132
6.2 Evolution of the methane content in the HR, SAMBR1 and SAMBR2. . . . . . . . . 134
6.3 VFA distribution in the effluent of the HR. . . . . . . . . . . . . . . . . . . . . . . . 135
6.4 Scanning Electron Microscopy of the virgin fibers and treated fibers in the HR. . . 136
6.5 Close zoom on the fibers treated in the HR. . . . . . . . . . . . . . . . . . . . . . . 137
6.6 SCOD inside SAMBR1 and in its permeate and COD removal in SAMBR1. . . . . 137
6.7 Evolution with time of the TSS, VSS, FSS and VSS/TSS ratio, and evolution of the
flux in SAMBR1. . . . . . . . . . . . . . . . . . . . . . . . . . . . . . . . . . . . . . 138
6.8 Correlation between the bulk SCOD in SAMBR1 and membrane rejection. . . . . . 140
6.9 Specific acidogenic activity test on the inoculum from SAMBR1 and the inoculum
from a 4 litre chemostat. . . . . . . . . . . . . . . . . . . . . . . . . . . . . . . . . . 142
6.10 SCOD inside and in the permeate of SAMBR2 and AMBR at different HRTs. COD
removal in SAMBR2 and AMBR. . . . . . . . . . . . . . . . . . . . . . . . . . . . . 144
6.11 Evolution with time of the TSS, VSS, FSS and VSS/TSS ratio, and evolution of the
flux in SAMBR2. . . . . . . . . . . . . . . . . . . . . . . . . . . . . . . . . . . . . . 146
6.12 Evolution with time of the TMP in SAMBR1 and SAMBR2. . . . . . . . . . . . . . . 14715
LIST OF FIGURES LIST OF FIGURES
6.13 Evolution with time of the SCOD rejection by the membrane in SAMBR1 and
SAMBR2. . . . . . . . . . . . . . . . . . . . . . . . . . . . . . . . . . . . . . . . . . 149
6.14 Concentration over time of the organic and inorganic nitrogen in the permeate of
the AMBR. . . . . . . . . . . . . . . . . . . . . . . . . . . . . . . . . . . . . . . . . 151
6.15 Evolution with time of the pH, flux, TSS, VSS, FSS and the VSS/TSS ratio in the
AMBR. . . . . . . . . . . . . . . . . . . . . . . . . . . . . . . . . . . . . . . . . . . 153
6.16 Evolution of the alkalinity in the effluent of HR and the permeate of SAMBR 1,
SAMBR2 and AMBR. . . . . . . . . . . . . . . . . . . . . . . . . . . . . . . . . . . 155
6.17 General view of the precipitate on the membrane in the AMBR and elemental
chromatogram of the background. . . . . . . . . . . . . . . . . . . . . . . . . . . . 156
6.18 Zoom of the needle-shaped precipitate on the membrane in the AMBR and its
elemental chromatogram. . . . . . . . . . . . . . . . . . . . . . . . . . . . . . . . . 157
6.19 Particle size distribution of the leachate from the HR and the mixed sludge from
SAMBR1, SAMBR2 and the AMBR. . . . . . . . . . . . . . . . . . . . . . . . . . . 159
6.20 Concentration over time of Na+, K+, Mg2+, Ca2+, Cl−, PO3−4 in the HR effluent
and the permeate of SAMBR1, SAMBR2 and AMBR. . . . . . . . . . . . . . . . . . 160
6.21 Calibration of the Size Exclusion Chromatography. . . . . . . . . . . . . . . . . . . 163
6.22 (A) Size exclusion chromatograms of the HR effluent, SAMBR1, SAMBR2 and
AMBR bulks permeates on day 192. (B) Zoom of the curves before 10 minutes of
elution time. . . . . . . . . . . . . . . . . . . . . . . . . . . . . . . . . . . . . . . . 165
6.23 (A) Evolution with time of the absorbance of medium MW compounds in the HR
effluent and in the permeates of SAMBR1, SAMBR2 and AMBR. (B) Evolution
with time of the absorbance of low MW compounds in the HR effluent and in the
permeates of SAMBR1, SAMBR2 and AMBR. . . . . . . . . . . . . . . . . . . . . 166
6.24 Compounds detected by GC-MS in the reactor’s plastic scraps. . . . . . . . . . . 168
6.25 Compounds detected by GC-MS in the HR effluent. . . . . . . . . . . . . . . . . . 170
6.26 New compounds detected by GC-MS in the permeate of SAMBR1. . . . . . . . . 173
6.27 New compounds detected by GC-MS in the permeate of SAMBR2. . . . . . . . . 174
6.28 Evolution with time of the archaeal population in the HR and SAMBR1. . . . . . . . 177
6.29 Evolution with time of the bacterial population in the SAMBR2 using nested PCR
27F and 1492R then 338FGC and 518R. . . . . . . . . . . . . . . . . . . . . . . . 178
6.30 Comparison on an agarose gel between the nested PCR products (27F and
1492R then 338FGC and 518R) on the left hand side and the PCR products using
primers 341FGC + 907R on the right hand side . . . . . . . . . . . . . . . . . . . . 179
6.31 Evolution with time of the bacterial population in the HR, SAMBR1, SAMBR2 and
AMBR using primers 341FGC and 907R. . . . . . . . . . . . . . . . . . . . . . . . 179
16

LIST OF FIGURES LIST OF FIGURES
6.32 Evolution with time of the population of AOB in the HR and the AMBR using the
primers CTO189FGC and 654R. . . . . . . . . . . . . . . . . . . . . . . . . . . . . 180
7.1 Panel A: Evolution with time of TCOD, SCOD and VFAs (as COD) in the effluent
of the HR at different temperatures and SRT. Panel B: Evolution with time of the
distribution of VFAs in the effluent of the HR. Panel C: Evolution with time of the
pH (left axis) and the alkalinity (right axis). . . . . . . . . . . . . . . . . . . . . . . 189
7.2 Evolution with time of the methane content of the biogas in the HR and the SAMBR.190
7.3 Evolution with time of the respiration rate of the digestate taken at different times
during the treatment of OFMSW in the HR. . . . . . . . . . . . . . . . . . . . . . . 195
7.4 Evolution with time of the respiration rate of the digestate after different periods of
aeration. . . . . . . . . . . . . . . . . . . . . . . . . . . . . . . . . . . . . . . . . . . 196
7.5 Panel A: Evolution with time of SCOD and VFAs in bulk and permeate (left axis),
and the COD removal (right axis). Panel B: Evolution with time of the SRT (left
axis), and the HRT in the SAMBR (right axis). . . . . . . . . . . . . . . . . . . . . . 200
7.6 Panel A: Evolution with time of the MLTSS, MLVSS, MLFSS (left axis) and MLVSS/MLTSS
ratio (right axis). Panel B: Evolution with time of the pH and the flux (right axis). . . 203
7.7 Panel A: Particle Size Distribution of the supernatant of the HR and the SAMBR.
Panel B: Particle Size Distribution of the solids of the HR and the SAMBR. . . . . . 204
7.8 Panel A: Evolution with time of the SCOD in the bulk and permeate (left axis) and
the COD removal percentage in the AMBR (right axis). Panel B: Evolution with
time of the flux (left axis) and the pH in the AMBR (right axis). . . . . . . . . . . . . 206
7.9 Scanning Electron Microscopy of the fibers in the HR (left) and SAMBR (right). . . 208
7.10 View of the inorganic precipitate on the permeate side of the SAMBR (left) and
elemental chromatogram (right). . . . . . . . . . . . . . . . . . . . . . . . . . . . . 210
7.11 Evolution of the ions concentration in the HR effluent, SAMBR permeate and
AMBR permeate. . . . . . . . . . . . . . . . . . . . . . . . . . . . . . . . . . . . . . 213
7.12 Evolution with time of the archaeal population in the HR using the primers ARCH46F
and ARCH1017R then 344FGC and Univ522R. . . . . . . . . . . . . . . . . . . . 216
7.13 Evolution with time of the bacterial population in the HR, SAMBR and AMBR. . . . 220
7.14 Evolution with time of the population of ammonia-oxidisers in the HR and AMBR. . 222
8.1 (A)Evolution with time of the TCOD (after centrifugation), SCOD and VFAs (as
COD) of the leachate at different HRTs and OLRs. (B) Evolution with time of the
distribution of VFAs. (C) Evolution with time of the pH and the ORP of the leachate
from the HR. . . . . . . . . . . . . . . . . . . . . . . . . . . . . . . . . . . . . . . . 230
8.2 Effect of SRT on the respiration rate of the digestate taken at different times during
the treatment of OFMSW in the HR. . . . . . . . . . . . . . . . . . . . . . . . . . . 233
17

LIST OF FIGURES LIST OF FIGURES
8.3 Effect of the TS content on the respiration rate of the digestate from the HR. . . . 235
8.4 Evolution of the ammonia-nitrogen concentration vs time during several tests on
a nitrifying biofilm grown on a Kubota membrane. . . . . . . . . . . . . . . . . . . 239
8.5 Panel A : Evolution of the SCOD, acetate and propionate concentration in the
bulk of the SAMBR-MABR (left axis), and the SCOD removal percentage (right
axis) under various HRTs and temperatures. Panel B: Evolution of the ammonia-
nitrogen and nitrite-nitrogen in the HR and SAMBR-MABR effluents. Panel C:
Evolution of the flux and pH (left axis) and the ORP (right axis) in the SAMBR-
MABR. . . . . . . . . . . . . . . . . . . . . . . . . . . . . . . . . . . . . . . . . . . 241
8.6 Panel A : Evolution of the SCOD, acetate and propionate concentration in the bulk
and the permeate SCOD of the conventional SAMBR (left axis), and the SCOD
removal percentage (right axis) under various HRTs and temperatures. Panel B:
Evolution of the flux and pH (left axis) and the ORP (right axis) in the conventional
SAMBR. . . . . . . . . . . . . . . . . . . . . . . . . . . . . . . . . . . . . . . . . . 246
8.7 Particle size Distribution of the colloidal fraction in the SAMBR before and after
PAC addition. . . . . . . . . . . . . . . . . . . . . . . . . . . . . . . . . . . . . . . . 249
8.8 Evolution with time of the archaeal population in the HR (left), conventional SAMBR
(middle) and SAMBR-MABR (right) using the primers ARCH46F and ARCH1017R
then 344FGC and Univ522R. . . . . . . . . . . . . . . . . . . . . . . . . . . . . . . 253
8.9 Evolution with time of the bacterial population in the HR (left), conventional SAMBR
(middle) and SAMBR-MABR (right) using the primers 341F-GC and 907R. . . . . 256
8.10 Evolution with time of the ammonia-oxidising bacterial population in the SAMBR-
MABR using the primers CTO189F GC and CTO654R. . . . . . . . . . . . . . . . 260
9.1 Effect of pH on COD removal percentage with 5g/L of GAC. . . . . . . . . . . . . . 269
9.2 Comparison of adsorption kinetics and capacity of GAC and PAC at 10g/l. . . . . 271
9.3 Control experiment for adsorption using activated carbon. . . . . . . . . . . . . . . 272
9.4 Evolution with time of the COD removal percentage of various MW fractions on
PAC 10g/l. . . . . . . . . . . . . . . . . . . . . . . . . . . . . . . . . . . . . . . . . . 273
9.5 Evolution with time of the COD removal percentage of the low MW fraction (less
than 1 kDa) from the SAMBR permeate with various adsorbents and coagulants. . 274
9.6 Evolution with time of the COD removal percentage of the organics with 0.5, 1 and
3 g/l FeCl3 at pH5. . . . . . . . . . . . . . . . . . . . . . . . . . . . . . . . . . . . . 276
9.7 Anaerobic Toxicity Assay on 2,6 - di -tert- butyl- 4- (dimethylaminomethyl) phenol,
Bis(2-Ethylhexyl)phthalate and o-hydroxybiphenyl. . . . . . . . . . . . . . . . . . . 279
9.8 Standard for Size Exclusion Chromatography and effect of the sample pH on the
size distribution. . . . . . . . . . . . . . . . . . . . . . . . . . . . . . . . . . . . . . 282
9.9 Effect of GAC on size distribution at various pHs. . . . . . . . . . . . . . . . . . . . 28318

LIST OF FIGURES LIST OF FIGURES
9.10 Effect of GAC and PAC dosage on size distribution after 24 hours of contact time. . 284
9.11 Kinetics of GAC and PAC adsorption at 10 g/l. . . . . . . . . . . . . . . . . . . . . . 285
9.12 Effect of pH on coagulation-flocculation with 1g/l FeCl3 and effect of FeCl3 dosage
on coagulation-flocculation at pH 5. . . . . . . . . . . . . . . . . . . . . . . . . . . . 286
9.13 Effect of polymeric adsorbents on aromatic compounds removal at pH 8. . . . . . . 287
19

List of Tables
2.1 Hydrolysis products of biopolymers under anaerobic conditions. . . . . . . . . . . . 27
2.2 Typical reactions involved in anaerobic digestion and their standard free energies
(25 ˚ C). . . . . . . . . . . . . . . . . . . . . . . . . . . . . . . . . . . . . . . . . . . 28
2.3 Biokinetics of acetate cleavage to methane. . . . . . . . . . . . . . . . . . . . . . . 30
2.4 Advantages and disadvantages of landfills. . . . . . . . . . . . . . . . . . . . . . . 33
2.5 Biogas properties. . . . . . . . . . . . . . . . . . . . . . . . . . . . . . . . . . . . . 34
2.6 Opportunities and barriers to the anaerobic digestion of municipal solid waste. . . 34
2.7 Possible unit processes, products and quality standards involved in an anaerobic
digestion plant for organic solids. . . . . . . . . . . . . . . . . . . . . . . . . . . . . 35
2.8 Lignin content range and methane yields of various organic substrates in the
OFMSW. . . . . . . . . . . . . . . . . . . . . . . . . . . . . . . . . . . . . . . . . . 37
2.9 Biochemical methane potential assays of feedstocks at 35 ˚ C. . . . . . . . . . . . . 38
2.10 Advantages and disadvantages of high solids content. . . . . . . . . . . . . . . . . 43
2.11 MSW anaerobic digestion processes. . . . . . . . . . . . . . . . . . . . . . . . . . 57
2.12 Anaerobic Membrane Bioreactors for high-strength wastewater/leachate . . . . . . 70
3.1 Retention times in minutes of standard hydrocarbons detected by the GC-MS
used in this study. . . . . . . . . . . . . . . . . . . . . . . . . . . . . . . . . . . . . 80
3.2 Detection limits of heavy metals analyzed by Inductively Coupled Plasma- Optical
Emission Spectrometer. . . . . . . . . . . . . . . . . . . . . . . . . . . . . . . . . . 81
3.3 Polyacrylamide concentration in the DGGE vs. the base pair of the PCR products 90
3.4 Composition of the simulated paper waste used for the study . . . . . . . . . . . . 91
3.5 Physical and chemical properties of the simulated OFMSW and its components. . 93
3.6 Concentration and percentage of carbohydrates and proteins in total and soluble
fractions of OFMSW. . . . . . . . . . . . . . . . . . . . . . . . . . . . . . . . . . . . 93
3.7 Gompertz coefficients and experimental ultimate biodegradabilities. . . . . . . . . 95
3.8 Heavy metals concentration in the simulated MSW. . . . . . . . . . . . . . . . . . . 97
20

LIST OF TABLES LIST OF TABLES
4.1 Summary of solubilisation yields due to chemical hydrolysis obtained under ox-
idative and reduced conditions at various pHs and in comparison with bacterial
hydrolysis. . . . . . . . . . . . . . . . . . . . . . . . . . . . . . . . . . . . . . . . . . 105
4.2 BET surface area and pore width of dried samples from Experiment 2 treated
under different conditions. . . . . . . . . . . . . . . . . . . . . . . . . . . . . . . . . 106
4.3 Values of the First-Order Kinetic Constant for Hydrolysis of Solid Organic Wastes
or Sludge. . . . . . . . . . . . . . . . . . . . . . . . . . . . . . . . . . . . . . . . . . 108
5.1 Contribution of various components of fouling in the SAMBR. . . . . . . . . . . . . 124
6.1 Comparison of volatile solids retention times, volatile solids removal percentages,
fresh water consumption, hydraulic retention times, percentages of fresh water
addition compared to recycled process water and digestate methane potential at
different organic loading rates in the hydrolytic reactor. . . . . . . . . . . . . . . . . 133
6.2 Weight percentages of several points of the background and the needle precipitates.158
6.3 Compounds detected by GC-MS in the reactor’s plastic scraps. . . . . . . . . . . . 169
6.4 Recalcitrant compounds detected by GC-MS in the effluent from the HR. . . . . . . 171
6.5 Recalcitrant compounds detected by GC-MS in the permeate of SAMBR1. . . . . 172
6.6 Recalcitrant compounds detected by GC-MS in the permeate of SAMBR2. . . . . 173
6.7 Recalcitrant compounds detected by GC-MS in the permeate of AMBR. . . . . . . 175
6.8 Bands cut from the DGGE gel using bacterial primers. . . . . . . . . . . . . . . . . 177
6.9 Bands cut from the DGGE gel using AOB primers. . . . . . . . . . . . . . . . . . . 181
7.1 Operational characteristics of anaerobic digesters working under psychrophilic
and sub-mesophilic conditions. . . . . . . . . . . . . . . . . . . . . . . . . . . . . . 185
7.2 Fractionation of the leachate from the HR on day 49. . . . . . . . . . . . . . . . . . 194
7.3 Respiration rate of the digestate taken on day 115 and aerated at 65 and 30 ˚ C. . 197
7.4 Heavy metals content of the digestate from the HR and comparison with the com-
pliance criteria for compost and stabilised biowaste established by the European
Commission (EC) and the British Standard Institution (BSI). . . . . . . . . . . . . . 199
7.5 Contribution of various components of fouling in the SAMBR and the AMBR. . . . 210
7.6 Weight percentages of the inorganic precipitates in the permeate side of the
SAMBR and comparison with known calcium precipitates. . . . . . . . . . . . . . . 211
7.7 Weight percentages of the inorganic precipitate in the permeate side of the SAMBR
using the Bruker AXS for inorganic elements only. . . . . . . . . . . . . . . . . . . 212
7.8 Bands cut from the DGGE gel using archaeal primers. . . . . . . . . . . . . . . . . 219
7.9 Bands from the SAMBR using bacterial primers. . . . . . . . . . . . . . . . . . . . 221
21

LIST OF TABLES LIST OF TABLES
7.10 Bands cut from the DGGE gel of AMBR using bacterial primers. . . . . . . . . . . 221
8.1 Volatile Solids removal percentages at different conditions in the hydrolytic reactor. 232
8.2 Heavy metals content of the digestate from the HR under various SRTs and fresh
water consumption rates (FWC), and comparison with the compliance criteria for
compost and stabilised biowaste established by the European Commission and
the British Standard Institution. . . . . . . . . . . . . . . . . . . . . . . . . . . . . . 236
8.3 Synthetic ammonia wastewater used in this study to grow autotrophic nitrifiers on
the Kubota membrane. . . . . . . . . . . . . . . . . . . . . . . . . . . . . . . . . . . 238
8.4 Comparison of the best performance obtained in the SAMBR-MABR and the con-
ventional SAMBR at 35 ˚ C. . . . . . . . . . . . . . . . . . . . . . . . . . . . . . . . 244
8.5 Compounds detected in the SAMBR by GC-MS and removal percentages by PAC
adsorption based on the abundance. . . . . . . . . . . . . . . . . . . . . . . . . . . 247
8.6 Compounds detected in the SAMBR operating at 35 ˚ C with deionized water. . . . 250
8.7 Recalcitrants compounds detected by GC-MS in the effluent of the HR. . . . . . . 250
8.8 Recalcitrant compounds detected by GC-MS in the permeate of the SAMBR-
MABR at different temperatures. . . . . . . . . . . . . . . . . . . . . . . . . . . . . 251
8.9 Recalcitrants compounds detected by GC-MS in the permeate of the conventional
SAMBR at 35 and 20 ˚ C. . . . . . . . . . . . . . . . . . . . . . . . . . . . . . . . . 252
8.10 Identified bands from the DGGE gel using archaeal primers. . . . . . . . . . . . . . 255
8.11 Identified bands from the DGGE gel using bacterial primers. . . . . . . . . . . . . . 257
8.12 Identified bands from the DGGE gel using primers for ammonia-oxidising bacteria. 261
9.1 Properties of the GAC and PAC used in this study. . . . . . . . . . . . . . . . . . . 264
9.2 Properties of the resins XAD7HP and XAD4 used in this study. . . . . . . . . . . . 266
9.3 Properties of the plasticizers used for the ATA test in this study. . . . . . . . . . . . 267
9.4 Isotherm constants of Langmuir and Freundlich models for adsorption onto GAC
and PAC used in this study. . . . . . . . . . . . . . . . . . . . . . . . . . . . . . . . 270
9.5 Kinetic constants for adsorption onto GAC and PAC used in this study. . . . . . . . 270
9.6 COD proportions of the SAMBR permeate divided into various MW fractions and
the percentage removal of each fraction on PAC (10g/L) after 24 hours. . . . . . . 273
22

Chapter 1
INTRODUCTION
The amount of waste produced in England and Wales, annually, is around 434 million tonnes,
of which 8% is Municipal Solid Waste (MSW) (Phillips et al., 2005). Moreover, household waste
is growing by around 2% each year. If this rate continues, nearly twice as many new waste
management facilities will be required by 2020 to reach UK and EU targets. Municipal Solid
Waste (MSW) is a growing concern in the world, and European authorities discourage munici-
palities choosing landfilling as their waste management strategy. The European landfill directive
(99/31/EC) requires that biodegradable municipal waste landfilled should be reduced by 2010 to
75% of that produced in 1995. In addition, the Household Waste Recycling Act 2003 in the UK
requires that waste collection authorities shall ensure that by the end of 2010 they should collect
at least two types of dry recyclable waste separate from the remainder of the waste. The aim of
the Act was to increase the recycling rate of household waste by recycling or composting, and
implementation of the Act should allow the UK to reach the target of 25% of MSW being recy-
cled or composted by 2005, 30% by 2010 and 33% by 2015. Unfortunately, in 2003/2004, the
majority (72%) of municipal waste in England was still disposed of to landfill, 9% was incinerated
and only 19% was recycled or composted (DEFRA, 2005). The last figure increased to 36% in
2008 (DEFRA, 2008), but MSW is still a huge problem.
Currently, biological treatment methods such as composting and Anaerobic Digestion (AD) offer
the only route for recycling organic matter and nutrients from the organic fraction of municipal
solid waste (OFMSW) (Braber, 1995). Composting can diminish the organic matter by about
50% through the formation of carbon dioxide and water (Held et al., 2002), but it represents an
energy consuming process (around 30-35 kWh is consumed per tonne of waste input) while AD
is a net energy producing process (100-150 kWh per tonne of input waste). AD is a process by
which bacteria degrade organic matter and convert it to mainly carbon dioxide and methane. The
main advantage of this technology is the destruction of organic components without the addition
of oxygen, and it produces useful by-products such as a gaseous fuel and stabilized solid residue
that can be sold as a soil fertilizer. In contrast, aerobic treatment is plagued by the production of
large amounts of activated sludge (about 10 times more than AD) and consumption of significant
amounts of energy due to aeration requirements (Braber, 1995; Speece, 1996; Mahmoud, 2002).
Digester technology for solid waste has basically followed the conventional approach used for
sewage sludge digestion over the last fifty years. The result is that the market is currently domi-
nated (over 90%) by single tank designs (Vandevivere et al., 2003) aimed at promoting good mix-23
1. INTRODUCTION
ing. In sewage sludge digestion the rate-limiting factor is the slow growth of the methanogenic
population; this necessitates long retention times (15-20 days), which in turn leads to low load-
ings because of the low solids concentration of the feed sludge. This approach is inappropriate
for high solids digestion, however, where the rate-limiting step is in the hydrolysis of the sub-
strate, and hence excessively long retention times are required even at moderate loading rates.
The anaerobic digestion of solid waste and the organic fraction of municipal solid waste (OFMSW)
in particular has been reported to be more stable and robust in two stages (Banks and Humphreys,
1998; Vieitez et al., 2000). The first phase includes a hydrolytic reactor (HR) in which enzymes
transform complex molecules into simple ones that can be converted into fatty acids; these acids
are then degraded by methanogens in the second reactor. The slow-growing methanogens can
therefore operate at an optimum pH independent of the pH in the first reactor. The literature
revealed that the hydrolytic stage takes place either in a well mixed reactor, or in a leach-bed
where the leachate is recirculated to the top of the reactor to promote the hydrolysis of solid
waste. The loading rate can be as high as 20-25 g VS.l-1.d-1 in a Continuously Stirred Tank Re-
actor depending on the proportion of easily degradable waste, but the hydraulic retention time
(HRT) has been restricted to 2 days due to process limitations. In batch leach-bed processes,
the OLR is low and they require a large footprint.
In an anaerobic system, the slow growth rate of mixed cultures posed a major problem for reactor
design as long minimum solid retention times (SRT) are required. Thus, anaerobic bacteria are
easily washed out because their doubling times are normally higher (5-6 days) than the HRT. As
efficient anaerobic digester performance depends on the hydrolysis rate of soluble solids and
the biomass concentration, the challenge was to develop a reactor which enables the HRT to be
uncoupled from the SRT. Thus the objective of this work was to investigate the use of membranes
in anaerobic bioreactors to achieve this. Possible problems that may arise include the clogging of
the membrane due to the wide molecular weight (MW) distribution from the complex substrates.
This may significantly lower the flux which will in turn affect the loading rate to the methanogenic
reactor.
A common problem associated with the continuous wet anaerobic fermentation process is that
inhibition can occur due to the build up of light metal ions and ammonia (Gallert et al., 2003).
Another issue is the generation of approximately 100-320 L wastewater per ton of waste input
(Dierick, 2006; Fricke et al., 2007). Therefore, recycling the stabilized leachate to the head of
a continuous wet process treating OFMSW could significantly reduce the amount of wastewater
produced, and reduce the environmental impact of MSW disposal. This was one of the objectives
of the present work.
Mechanical-biological treatment (MBT) of the OFMSW is now the main strategy to reduce biodegrad-
able MSW in waste in the UK and in Europe (Scaglia and Adani, 2008). It consists of mechani-
cal pretreatment followed by an aerobic (composting-like process) or anaerobic process so that
waste impacts are reduced. These processes have attracted attention because they produced a
stabilized waste, which has a low impact when disposed of in landfill (Adani et al., 2004). How-
ever, landfill leachate still represents a serious environmental threat. In the UK, the leachate
from the OFMSW disposed in landills is currently being treated anaerobically in ponds or aero-24

Chapter 1. INTRODUCTION
bically by Sequencing Batch Reactor (SBR) (Robinson, 2005); raw leachate is fed to an aerated
reactor. After a certain time, aeration is shut down and the solids are allowed to settle. The
supernatant, i.e. the treated leachate, is discharged to sewer or a watercourse. On lab-scale,
several researchers have used UASB (Upflow Anaerobic Sludge Blanket), fixed-film and packed
bed reactors to treat the leachates from MSW and the COD removal efficiencies were typically
higher than 90% (Anderson and Saw, 1992; He et al., 2005a). Aerobic Membrane reactors have
also been used for biological oxidation and nitrification/denitrification (Ahn et al., 2002; Laiti-
nen et al., 2006), but the use of an anaerobic MBR for the stabilization of the leachate is not
widespread. In particular, Submerged Anaerobic Membrane Bioreactors (SAMBRs) have been
developed at Imperial College (Hu, 2004), and stable operation was reported for high strength
feed (20,000 mg COD/L) at 20 hours HRT and a permeate flux of 1.5-2 LMH (litres m-2hour-1)
(Akram, 2006), but no information is available about its behaviour for high-strength leachates
from the OFMSW.
The aim of this project was thus to explore the feasibility of treating the OFMSW in a two-
stage process where the OFMSW is first hydrolyzed in a hydrolytic reactor, and leachate
is treated in an anaerobic membrane bioreactor so that the more stable and efficient pro-
cess can achieve better performance than current technologies. The research will pro-
vide the technical knowledge for operating the two-stage process so that ultimately a
pilot plant can be constructed to demonstrate the advantages and provide new solutions
for industries, governments and research organizations active in this area. In addition
to the direct technical benefits of an improved process technology aimed at helping to
meet obligations for the diversion of biodegradable MSW, the development of high-rate
anaerobic digestion systems that can deal with solid waste material will contribute to the
UK government’s overall aims of producing renewable energy from sustainable biomass
sources
25

Chapter 2
LITERATURE REVIEW
2.1 ANAEROBIC DIGESTION
Anaerobic Digestion (AD) is the result of the concerted action of several populations of bacteria,
and occurs in a series of steps. The degradable solids that make up the waste are firstly bio-
logically hydrolysed to smaller soluble molecules. Then acid-forming bacteria use these soluble
intermediates as substrates for energy and growth, resulting in the formation of fermentation
products such as Volatile Fatty Acids (VFAs). Finally, the methanogens or VFA-consuming bac-
teria produce methane and carbon dioxide.
Several researchers (Gujer and Zehnder, 1983; Harper and Pohland, 1986) have described the
anaerobic process in six recognisable steps (see Figure 2.1).
1. The hydrolysis of high molecular often insoluble organic polymers such as proteins, car-
bohydrates and lipids. Enzymes convert them to soluble fragments (monomers) such as
sugars, amino acids, long-chain fatty acids;
2. The acidogenesis or fermentation of amino acids and sugars: conversion of organic monomers
to acetic, propionic and butyric acids (gathered under the ’VFA’ label), hydrogen, carbon
dioxide, and other organic products such as ethanol and lactic acid;
3. Anaerobic oxidation of long chain fatty acids and alcohols to acetic acid, hydrogen and
carbon dioxide by the obligate hydrogen producing acetogenic (OHPA) bacteria;
4. Anaerobic oxidation of intermediate products such as volatile acids (with the exception of
acetate);
5. Acetoclastic methane fermentation, i.e. conversion of acetate to methane;
6. Conversion of hydrogen to methane.
AD depends on a variety of different bacteria, i.e. a consortium. It is generally thought that a
wider diversity of bacteria will more efficiently absorb stresses. The following subsections briefly
describe the main characteristics of the different bacteria involved in AD.
26

Chapter 2. LITERATURE REVIEW
Figure 2.1: The main degradation pathways in anaerobic digestion (Gujer and Zehnder, 1983).
2.1.1 Hydrolytic Bacteria
Hydrolysis is achieved by the release of extracellular enzymes and by cell bound enzymes such
as cellulase, lipase or protease; the microorganisms producing them can be either obligate or
facultative anaerobes (Zehnder, 1988). Common hydrolytic microorganisms and their enzymes
are listed in Table 2.1, along with the hydrolysis products.
Table 2.1: Hydrolysis products of biopolymers under anaerobic conditions (Gujer andZehnder, 1983).
Biopolymer Hydrolysis products Microorganisms Enzymes
• Carbohydrates:
- Cellulose Polysaccharides Bacteroides CellulaseOligosaccharides
Glucose ClostridiaAcetovibrio celluliticus
- Hemicellulose Polysaccharides HemicellulaseOligosaccharides Xylanase
Hexoses FungiPentoses Clostridia
• Proteins Polypeptides ProteaseOligopeptides PeptidaseAmino acids Proteus vulgaris
Clostridia
• Lipids Fatty acids Clostridia LipaseGlycerolAlcohols
27
Chapter 2. LITERATURE REVIEW
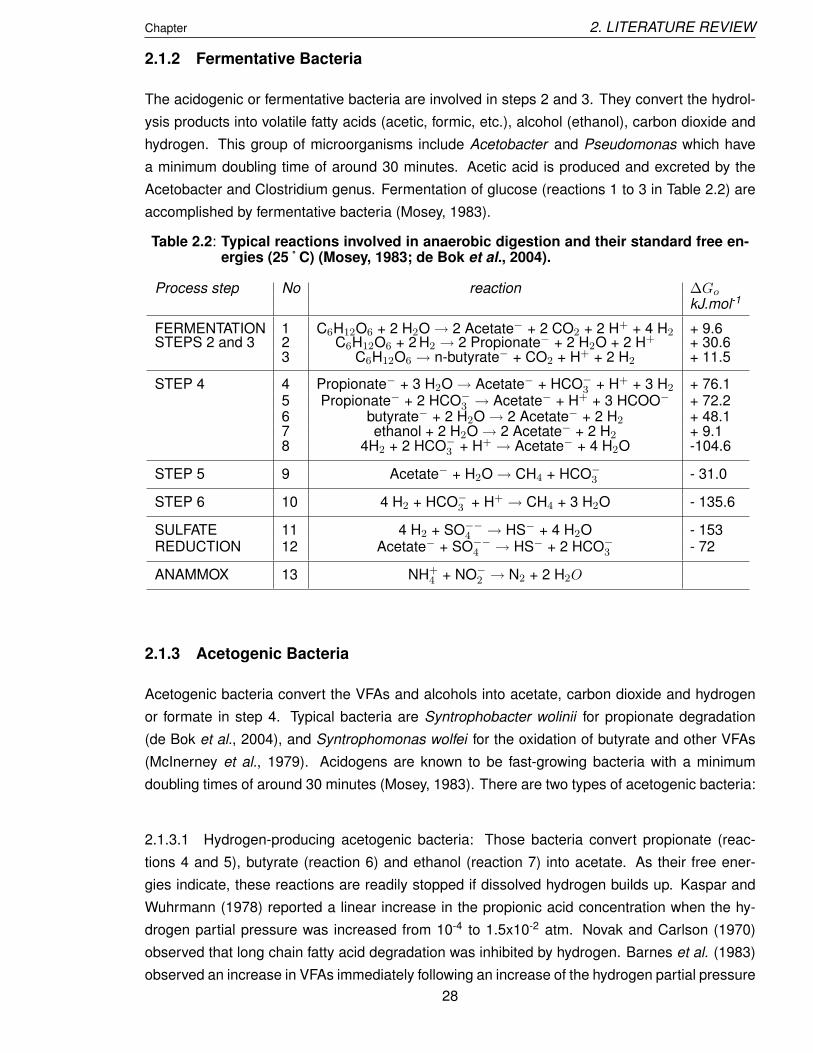
2.1.2 Fermentative Bacteria
The acidogenic or fermentative bacteria are involved in steps 2 and 3. They convert the hydrol-
ysis products into volatile fatty acids (acetic, formic, etc.), alcohol (ethanol), carbon dioxide and
hydrogen. This group of microorganisms include Acetobacter and Pseudomonas which have
a minimum doubling time of around 30 minutes. Acetic acid is produced and excreted by the
Acetobacter and Clostridium genus. Fermentation of glucose (reactions 1 to 3 in Table 2.2) are
accomplished by fermentative bacteria (Mosey, 1983).
Table 2.2: Typical reactions involved in anaerobic digestion and their standard free en-ergies (25 ˚ C) (Mosey, 1983; de Bok et al., 2004).
Process step No reaction ∆Go
kJ.mol-1
FERMENTATION 1 C6H12O6 + 2 H2O→ 2 Acetate− + 2 CO2 + 2 H+ + 4 H2 + 9.6STEPS 2 and 3 2 C6H12O6 + 2 H2 → 2 Propionate− + 2 H2O + 2 H+ + 30.6
3 C6H12O6 → n-butyrate− + CO2 + H+ + 2 H2 + 11.5
STEP 4 4 Propionate− + 3 H2O→ Acetate− + HCO−
3 + H+ + 3 H2 + 76.15 Propionate− + 2 HCO−
3 → Acetate− + H+ + 3 HCOO− + 72.26 butyrate− + 2 H2O→ 2 Acetate− + 2 H2 + 48.17 ethanol + 2 H2O→ 2 Acetate− + 2 H2 + 9.18 4H2 + 2 HCO−
3 + H+ → Acetate− + 4 H2O -104.6
STEP 5 9 Acetate− + H2O→ CH4 + HCO−
3 - 31.0
STEP 6 10 4 H2 + HCO−
3 + H+ → CH4 + 3 H2O - 135.6
SULFATE 11 4 H2 + SO−−
4 → HS− + 4 H2O - 153REDUCTION 12 Acetate− + SO−−
4 → HS− + 2 HCO−
3 - 72
ANAMMOX 13 NH+4 + NO−
2 → N2 + 2 H2O
2.1.3 Acetogenic Bacteria
Acetogenic bacteria convert the VFAs and alcohols into acetate, carbon dioxide and hydrogen
or formate in step 4. Typical bacteria are Syntrophobacter wolinii for propionate degradation
(de Bok et al., 2004), and Syntrophomonas wolfei for the oxidation of butyrate and other VFAs
(McInerney et al., 1979). Acidogens are known to be fast-growing bacteria with a minimum
doubling times of around 30 minutes (Mosey, 1983). There are two types of acetogenic bacteria:
2.1.3.1 Hydrogen-producing acetogenic bacteria: Those bacteria convert propionate (reac-
tions 4 and 5), butyrate (reaction 6) and ethanol (reaction 7) into acetate. As their free ener-
gies indicate, these reactions are readily stopped if dissolved hydrogen builds up. Kaspar and
Wuhrmann (1978) reported a linear increase in the propionic acid concentration when the hy-
drogen partial pressure was increased from 10-4 to 1.5x10⁻² atm. Novak and Carlson (1970)
observed that long chain fatty acid degradation was inhibited by hydrogen. Barnes et al. (1983)
observed an increase in VFAs immediately following an increase of the hydrogen partial pressure
28

Chapter 2. LITERATURE REVIEW
from 2x10⁻⁴ to 1.5x10⁻³ atm, as induced by a shock loading. As a result, it is recommended to
keep the hydrogen concentration low in anaerobic digesters, and this is achieved by maintaining
a small distance between syntrophic bacteria (Kim et al., 2002; de Bok et al., 2004).
Later, it was discovered that the hydrogen-producing bacteria can only survive when their prod-
ucts are removed. This is achieved by the hydrogen-consuming bacteria, i.e. the methanogenic
ones. These obligate hydrogen producing acetogenic bacteria have been estimated to provide
the substrate for 54% of the total methane produced (Kaspar and Wuhrmann, 1978), but their
doubling times are of the order of 2-6 days (McInerney et al., 1979; Boone and Bryant, 1980).
2.1.3.2 Hydrogen-consuming acetogenic bacteria: Reaction 8 in Table 2.2 is achieved by
hydrogen-consuming acetogenic bacteria such as Clostridium aceticum, and these bacteria will
have to compete with the methanogenic bacteria involved in reaction 10 which have a high affin-
ity for hydrogen. This can result in inhibition of acetate cleavage by the methanogens when the
level of hydrogen is high, and this has been observed by Van den Berg et al. (1976).
2.1.4 Methanogenic Bacteria
These bacteria are involved in steps 5 and 6 for the production of methane. All the methanogenic
bacteria are capable of oxidising hydrogen and reducing carbon dioxide, except Methanothrix sp.
which can only utilize acetate. Acetic acid can only be utilised by two genera: Methanosarcina
and Methanothrix. According to their ability to utilise the various substrates, the methanogenic
bacteria can be classified as follows (Dolfing and Bloemen, 1985):
1. hydrogen-oxidising acetotrophs (HOA) which can utilise both H2 and CO2 and acetate, i.e.
Methanosarcina; Traore et al. (1983) showed that Methanosarcina spp can use both sub-
strates simultaneously at low substrate concentrations. However, at high concentrations,
Dolfing and Bloemen (1985) found that methane formation from acetate in Methanosarcina
spp is inhibited by high levels of hydrogen;
2. non-hydrogen oxidising acetotrophs (NHOA) or aceticlastic methanogens which can utilise
only acetate and not H2 and CO2, i.e. Methanosaeta;
3. hydrogen-oxidising methanogens (HOM) which do not cleave acetate, but use H2 and CO2
(or formate) as substrates, i.e. Methanobacterium or Methanococcus.
Some species can also grow on other substrates such as methanol and formate (Zehnder, 1988).
Kaspar and Wuhrmann (1978) have reported that approximately 70% of the methane produced
originates from acetate (reaction 9), while about 30% is formed through hydrogen oxidation
(reaction 10). Doubling times of the methanogens are in the range of 0.2-2 days when hydrogen,
formate or high levels of acetate are used as substrate (Ghosh and Klass, 1978), but some
species require more time, e.g. Methanothrix soehngenii : 9 days (Zehnder, 1988).
29

Chapter 2. LITERATURE REVIEW
Methanogenic bacteria have not only different substrates but also different kinetic parameters.
Table 2.3 shows that non-hydrogen oxidising acetotrophs (NHOA) such as Methanothrix sp.
have much lower substrate utilisation rates (U) and their maximum growth rate (µmax) is only
one-fifth of that of HOA bacteria, although their affinity for acetate is much higher (smaller value
of KS). These observations corroborate the finding that Methanosarcina sp. develop preferen-
tially throughout or in the inlet of reactors, wherever the acetate concentration was equal to or
higher than 350 mg L-1. When the acetate concentration falls below 350 mg L-1, Methanosaeta
becomes the prevailing species (Ehlinger et al., 1987).
Table 2.3: Biokinetics of acetate cleavage to methane.
Reference Culture µmax KS Y Ud-1 mg COD/L g VSS/g COD g COD/g VSS.d
(Smith and Mah, 1978) Methanosarcina 0.6 320 0.04 15barkeri
(Zehnder, 1988) Methanothrix 0.11 30 0.03 3.7soehngenii
Furthermore, nitrate-reducing bacteria and the sulphate-reducing bacteria (SRB) (Desulfovibrio
sp.) are also found in anaerobic digesters (Harper and Pohland, 1986). They are known to
compete with the methanogenic bacteria for the substrate (Griffin et al., 1998) and are involved
in the oxidation of the intermediate products to acetic acid and carbon dioxide and the oxidation
of acetic acid (Reaction 12), propionic acid and hydrogen (Reaction 11). The acidogenic bacteria
play a key role in degrading macro-organics to hydrogen, ethanol and volatile fatty acids (VFAs),
which are then utilized by SRB to reduce sulfate. The symbiotic relationship between SRB
and acidogenic bacteria has been examined although no direct microbiological evidence has
been presented previously (Zhao et al., 2008). SRB can utilize more than 100 different organic
substances, although lactate has been shown to be the preferred electron donor.
The good health of an anaerobic process is thus a matter of balance between the different fam-
ilies of bacteria involved. If the methanogenic bacteria are not present in sufficient numbers
to convert the VFAs into the final products, a build-up of these acids will occur, resulting in an
acidification of the media. If the acidification persists, the pH may decrease to under the acidity
threshold of the methanogenic bacteria, leading to irrecoverable failure. Several clues can indi-
cate an imbalance; large amounts of propionic acid in the effluent can be a sign of stress and/or
overloading depending on the reactions leading to the formation of this acid (Pullammanappallil
et al., 2001), while large amounts of butyric acid usually suggest failure (Asinari Di San Marzano
et al., 1981). Products such as lactate and ethanol usually appear shortly after overloading
and/or when some environmental stress has been applied to the reactor.
2.1.5 Protein Degradation
Ammonia is produced by the biological degradation of the nitrogenous matter present in the
yard and food waste fractions of MSW, mostly in the form of proteins. A protein is a long,
30

Chapter 2. LITERATURE REVIEW
complex chain of alpha-amino acids, linked by peptide bonds. Complete hydrolysis of a protein
reduces it to its constituent alpha-amino acids. During hydrolysis, intermediate compounds are
produced and then further hydrolysed. These compounds are composed of shorter chains of
amino acids. As groups, they are called, in order of decreasing length and increasing water
solubility, proteoses, peptones, and polypeptides.
Besides proteins, other nitrogenous compounds present in the food and yard waste fractions of
MSW include: phospholipids, other nitrogenous lipids and nucleic acids. Each of these com-
pounds is sequentially digested by the two groups of anaerobic bacteria (hydrolysers and ace-
togens) and eventually their by-products are utilized by methanogens. The steps in the biocon-
version of proteins are illustrated in Figure 2.2.
Figure 2.2: Steps in the bioconversion of protein (Kayhanian, 1999).
Purines and pyrimidines are produced in the digestion of a few amino acids. They also contain
nitrogen and, therefore, also release ammonia when further degraded. As can be seen in Figure
2.2, ammonia is released during hydrolysis , the first stage of bioconversion. There, hydrolyzing
micro-organisms deaminate nitrogenous compounds to produce ammonia. Theoretically, the
quantity of ammonia that will be generated from an anaerobic biodegradation of biodegradable
31

Chapter 2. LITERATURE REVIEW
organic substrate can be estimated using the following stoichiometric relationship:
CaHbOcNd +4a− b− 2c + 3d
4H2O →
4a− b− 2c + 3d
8CH4 +
4a− b + 2c + 3d
8CO2 + d NH3
(2.1)
where Nd is the amount of nitrogen present in the feedstock and dNH3 is the amount of ammonia
produced. In other words, all of the organic nitrogen present in the feedstock will be converted
to ammonia.
2.1.6 Ammonia Degradation
Ammonia is oxidised to nitrite by ammonia-oxidising bacteria (AOB):
NH3 + 1.5O2 → NO−
2 + H+ + H2O (2.2)
while nitrite-oxidising bacteria (NOB) mineralise nitrite to nitrate:
NO−
2 + 0.5O2 → NO−
3 + H+ + H2O (2.3)
Factors affecting nitrification are dissolved oxygen (DO), free ammonia concentration, alkalinity,
pH, temperature, SRT, HRT and heterotrophic nitrification.
There are two phylogenetically distinct groups of bacteria that collectively perform nitrification.
Ammonia - oxidising bacteria (AOB) obtain energy by catabolising unionized ammonia to nitrite,
while nitrite-oxidising bacteria (NOB) mineralise nitrite to nitrate (Hagopian and Riley, 1998).
Bacteria of the genera Nitrosomonas, Nitrosospira, Nitrosococcus, Nitrosolobus and Nitrosovib-
rio participate in the first stage of nitrification. The second stage involves the genera Nitrospira,
Nitrobacter, Nitrococcus and Nitrospina.
Denitrification is the process in which nitrite or nitrate is used as an electron acceptor and organ-
ics are used as electron donor to produce nitrogen gas. Most denitrifying bacteria are facultative
and heterotrophic such as : Achromobacter, Aerobacter, Alcaligenes, Bacillus, Flavobacterium,
Micrococcus, Proteus and Pseudomonas.
However, nitrite rarely occurs as an intermediate of nitrogen removal processes because in the
absence of inhibition and limitations Nitrobacter grow almost twice as fast as Nitrosomonas.
Consequently, ammonia oxidation is commonly the rate-limiting step. Similarly, in denitrification
the reduction of nitrite is about 1.8 times faster than nitrate reduction (Wett and Rauch, 2003).
As the overall nitrite consumption is almost twice as high as the production, nitrite can not accu-
mulate in common municipal wastewater treatment.
In addition, it has been reported that nitrogen removal can be accomplished by ”Anaerobic Am-
monium Oxidation” or ANAMMOX under anaerobic conditions. This would lead to a significant
reduction of aeration costs and exogenous electron donor as compared to the conventional
nitrification-denitrification process (van Dongen et al., 2001). The anammox reaction (Reaction
13) in Table 2.2 involves the oxidation of ammonium to nitrogen gas with nitrite as electron ac-
ceptor under strictly anoxic conditions (Van de Graaf et al., 1996). This is accomplished by
Planctomycete-like bacteria (Gong et al., 2008). Anammox apparition is favoured if the ratio of32

Chapter 2. LITERATURE REVIEW
nitrite:ammonia is in the range 1:1 to 1:1.3 (Feng et al., 2007). This can be obtained by inhibit-
ing NOB species by keeping a low DO concentration (≤ 0.5 mg/L) since the oxygen saturation
coefficients of Monod kinetics for nitritation and nitratation are known to be 0.3 and 1.1 mg/L,
respectively (Wiesmann, 1994). Controlled temperature of 35 ˚ C is also preferred for nitrite ac-
cumulation because AOB outcompete NOB only at temperatures above 25 ˚ C (Xue et al., 2009).
Moreover, an inoculum rich in Anammox species is strongly advised for start up of a Anammox
biofilm due to their high doubling times of 11 days (Strous et al., 1998).
2.2 MUNICIPAL SOLID WASTE
2.2.1 Introduction
The treatment of MSW by landfilling suffers from serious disadvantages (Chugh et al., 1999;
Nyns and Gendebien, 1992) listed in Table 2.4.
Table 2.4: Advantages and disadvantages of landfills.
Advantages Disadvantages
• easy maintenance • fugitive release of gases (methane is a significant greenhouse gas)
• odor problems
• not expensive technology • fire and explosion hazards
• the leachate may carry toxic contaminants to underground waters
• care, monitoring and management of the sites are required for long periods
• damage to vegetation
• damage by settlement
In terms of energy production, the Renewable Obligation Order 2002 set a target for the UK to
obtain 10% of its electricity from renewable sources by 2010 (Nordberg, 2003). Under this order,
each designated electricity supplier will annually increase the supply of electricity generated
from eligible renewable source. Due to problems associated with other waste management
strategies, subsidies for combined heat and power facilities and tax exemption for the production
of bio-fuels, it can be stated that the legislation will favour anaerobic digestion of MSW because
of its environment-friendly character.
The current disposal methods include landfill and incineration of a mixed stream of MSW. Gener-
ally only a small fraction of the MSW is recycled (waste paper, bottles etc.), usually excluding the
digestible fraction. Currently, biological treatment methods such as composting and AD offer the
only route for recycling organic matter and nutrients from the organic fraction of municipal solid
waste (OFMSW) (Braber, 1995). Typically, one tonne of organic MSW produces in the range of
100 - 200 m3 of biogas (Braber, 1995), and a typical composition is given in Table 2.5 along with
the biogas energy content.
However, AD of solid waste (particularly the OFMSW) still has to compete economically and
environmentally with aerobic composting. This is in part related to the fact that composting is
a long-established technology which generally requires less initial investment. Nevertheless,
33

Chapter 2. LITERATURE REVIEW
Table 2.5: Biogas properties.
Energy content 20 - 25 MJ/m3
Methane (vol. %) 55 - 70Carbon dioxide (vol. %) 30 - 45Hydrogen sulfide 200 - 4000 ppm
current energy prices and the targeted reduction of fossil fuel combustion in the coming decades
focus increasingly more attention on anaerobic digestion (Lissens et al., 2001; Gomez et al.,
2005). The following table (Table 2.6) lists more specific opportunities and barriers to the AD of
MSW (Braber, 1995).
Table 2.6: Opportunities and barriers to the anaerobic digestion of municipal solidwaste.
Advantages Disadvantages
• Net production of energy • more expensive thancomposting in many cases
• Reduced CO2 emission • does not treat whole waste,just a fraction of it
• Potential to treat the ”wet” fraction of MSW • novel application. Information on economicwhich is less amenable to incineration and practical issues is not widely disseminated
• Potential to treat the OFMSW in countries • Persistent materials handling problems,considering banning landfilling of waste particularly related to plastics (mechanical separation)
• Potential for co-disposal with other organic waste streams(e.g. industrial waste such as food processing waste andagricultural waste such as manure)
• the residue can be sold as a soil amendmentor combusted to recover more energy
2.2.2 Composition of the Organic Fraction of Municipal Solid Waste
MSW is a heterogeneous waste, which may be divided into a number of sub fractions:
• Digestible organic fraction. Organic matter which is readily degradable i.e. kitchen waste,
grass cuttings, paper, etc.
• Combustible fraction. Slowly digestible and indigestible organic matter i.e. wood, card-
board, plastics and other synthetics etc.
• inert fraction. Stones, sand, glass, metals, bones etc.
In general about 50 - 60% of MSW consists of organic matter (Gellens et al., 1995; Veeken and
Hamelers, 1999), and the OFMSW contains typically 40-50% cellulose, 12% hemicellulose, and
10-15% lignin by weight (Wang et al., 1994). Due to its heterogeneous character, the MSW
stream requires various pre-treatments before anaerobic degradation (see Table 2.7).
The composition of the OFMSW is important in determining which treatment method is most
appropriate; yard waste contains lignocellulosic material, which does not readily degrade under
34

Chapter 2. LITERATURE REVIEW
Table 2.7: Possible unit processes, products and quality standards involved in an anaer-obic digestion plant for organic solids (Vandevivere et al., 2003).
Unit processes Reusable products Standards or criteria
PRE-TREATMENT
- Magnetic separation Ferrous metals Organic impurities
- Size reduction Comminution of paper,(drum or shredder) cardboard and bags
- Pulping with Heavy inerts reused as Organic impuritiesgravity separation construction material
- Drum screening Coarse fraction, plastics Calorific value
- Pasteurization Germs kill off
DIGESTION
- Hydrolysis
- Methanogenesis Biogas Norms nitrogen, sulphur
- Biogas valorization Electricity 150 - 300 kWhelec/ton
Heat (steam) 250 - 500 kWhheat/ton
POST-TREATMENT
- Mechanical dewatering Load on water treatment
- Aerobic stabilization Compost Norms soil amendments
- Water treatment Water Disposal norms
- Biological dewatering Compost Norms soil amendments
- Wet separation Sand Organic impuritiesfibres (peat) Norms potting mediaSludge Calorific value
anaerobic conditions (Braber, 1995; Veeken and Hamelers, 1999). Furthermore, wood is highly
refractory to anaerobic decomposition (Chynoweth and Jerger, 1985). On the other hand, mate-
rial such as kitchen waste is too wet and lacking in structure for aerobic composting. In general,
if the material collected is predominantly kitchen waste, AD is the most appropriate treatment
and if yard waste dominates, aerobic composting is preferred.
MSW composition may vary considerably with various factors: the period of the year(i). There is
more fruit in the blend during summer months, leading to a higher VS/TS ratio. In contrast, the
OFMSW may comprise less biodegradable items such as fir trees after the Christmas period;
the region(ii); the climate(iii); the extent of recycling(iv); the collection frequency(v); the socio-
cultural practices(vi); changes in technology(vii). Furthermore, Yard waste fractions of MSW can
be expected to exhibit a high variability in yields due to the variety of plant materials which can
be included (Owens and Chynoweth, 1993).
Paper waste can contribute a significant fraction of the MSW. The type of virgin fiber, pulping
process, lignin content, coating and printing may all affect the methane yield and rates. Fine
printing papers and office papers are generally made from a high grade bleached kraft pulp,
which has none of the lignin present in the virgin fibers. The corrugated box board and brown
bag paperboard are normally made from an unbleached kraft pulp, which may still have a 5%
lignin content. Groundwood pulp is used in newsprint and magazine production, and contains
almost all of the virgin lignin comprising up to 20% of virgin fibers. It is worth highlighting the fact
35
Chapter 2. LITERATURE REVIEW
that inks used in newsprint do not lower the methane yields over unprinted newsprint (Owens and
Chynoweth, 1993). Also, in the same study the authors found that paper used in food packaging
is highly biodegradable and its degradation was not affected by polymer coatings provided the
samples were finely ground, however, information concerning the influence of inks and coatings
on AD is not widely available in the literature.
Nevertheless, the presence of paper is responsible for one of the most frequent problems as-
sociated with OFMSW digestion, i.e. the high C:N ratio of these residues (Gomez et al., 2005).
The carbon/nitrogen ratio has been estimated at 150/1 for a substrate of paper waste and wood,
which is nitrogen deficient (Banks and Humphreys, 1998). Pfeffer and Liebman (1974) also de-
termined that the typical MSW was deficient in both nitrogen and phosphorus with respect to
microbial growth. A feedstock with a C/N ratio (biodegradable C) greater than 30 is considered
to be deficient in nitrogen for a biological treatment process. To circumvent this problem, sev-
eral authors have proposed co-digestion of the OFMSW, either with sewage sludge or residues
from livestock farms, or both (Kayhanian and Rich, 1995; Gomez et al., 2005). The benefit of
co-digestion include: dilution of potential toxic compounds, improved balance of nutrients, syn-
ergistic effects of microorganisms, increased load of biodegradable organic matter and better
biogas yields.
In terms of chemical composition, three groups of biopolymers are the major constituents of
MSW: carbohydrates, proteins and lipids. Carbohydrates are known to be rapidly converted via
hydrolysis to simple sugars and subsequently fermented to VFAs. Proteins are hydrolysed to
amino acids and further degraded to ammonium, VFAs, carbon dioxide and hydrogen, and the
acidification rate of the amino acids is faster than the rate of protein hydrolysis. For this reason,
amino acids occur in very low concentrations (Miron et al., 2000). Among the lipids often found
in food waste, triglycerides are hydrolysed to long-chain fatty acids (LCFA) and further oxidised
to acetate or propionate; this oxidation is inhibited by the accumulation of hydrogen.
2.2.3 Biodegradability of the Organic Fraction of Municipal Solid Waste
The ultimate biodegradability of a feedstock can be characterised by the biochemical methane
potential (BMP) method (Owen et al., 1979). This standard technique allows for the deter-
mination of the methane yield by incubating a substrate under ideal conditions for AD, i.e.
broad spectrum inoculum, excess inoculum, excess nutrients, substrate concentration below
inhibitory levels, excess buffering capacity, mesophilic temperature and strict anaerobic condi-
tions (Chynoweth et al., 2002). An ultimate methane yield greater than 0.2 L.g-1VS is considered
favourable for any feedstock (O’Keefe et al., 1996).
The following empirical relationship was developed to estimate the biodegradable fraction of
an organic substrate from lignin test results (Kayhanian, 1995): Biodegradable fraction BF =
0.83 - 0.028LC where the BF is expressed as a fraction of the VS and LC is the lignin content,
expressed as a percentage of the VS.
Carbohydrates, the major component of plant residues, have a theoretical methane yield of
0.36 L.g-1 VS. Some components such as lignin, are not degradable under anaerobic condi-36

Chapter 2. LITERATURE REVIEW
tions and may hinder degradation of other components (Tong et al., 1990; Clarkson and Xiao,
2000). A substantial fraction of the lignin solubilised may be in the form of medium molecular
weight oligoaromatic compounds (McFarlane and Pfeffer, 1981). Typical lignin percentages and
methane yields are listed in Table 2.8 for organic waste. In fact, lignin forms a three-dimensional
complex structure with cellulose and hemicellulose, which renders these compounds less avail-
able to microorganisms.
Table 2.8: Lignin content range and methane yields of various organic substrates in theOFMSW (source: a (Kayhanian, 1995),b (Owens and Chynoweth, 1993),c(Cho et al., 1995)).
Organic substrate Lignin content range (% of VS) L CH4 STP/ g VS
Newspaper 20 - 23a 0.1b
Office paper 0.1 - 1a 0.369b
Yard waste 4 - 10a 0.143b
Food waste 0.1 - 0.7a 0.472c
According to McFarlane and Pfeffer (1981), these lignocellulosic materials are resistant to biodegra-
dation and unless some form of pre-treatment is employed, the methane generated is unlikely
to be economic as large digesters operating at long retention time will be required. Originally
the readily hydrolysable carbohydrates were named hemicellulose to differentiate them from cel-
lulose. Three well-defined groups of hemicellulose, the xylans, mannans and galactans are
recognized as components in all lignified plants. With organic substrates, it is usual to assume
that the biodegradable volatile solids (VS) consist entirely of cellulose. Thus, each kilogram of
VS removed will produce 0.415 m3 methane at STP or 0.453 at 25 ˚ C. This assumes that the
biodegradability of lignin is negligible and the gas yield per gram of hemicellulose is similar to
that per gram of cellulose metabolised.
It is still not clear whether cellulose degradation is limited by the existence of a lignin-cellulose
bond, or whether the three dimensional lignin network physically protects the cell wall carbohy-
drates. However, to improve the degradability of any lignocellulosic material, two factors should
be ideally achieved: 1.) The fine structure of the cellulose molecule should be altered. The con-
version of crystalline to amorphous cellulose will generally assist enzymatic hydrolyses; 2.) The
ligno-cellulose complex should be disrupted or, at least, the pore size increased to improve the
accessibility of the cellulose to enzymatic attack. Table 2.9 provides an idea of the biodegrad-
ability of various typical components of the OFMSW.
2.2.4 Kinetics of the Anaerobic Digestion of MSW
As explained in section 2.1, a dynamic balance between the various steps is necessary; the
overall reaction rate is then equal to the slowest rate of the steps. Several researchers (Eastman
and Ferguson, 1981; Hobson, 1987; Vavilin et al., 1999; Miron et al., 2000; Sanders, 2001) have
shown that, in the case of particulate substrate, the hydrolytic step is the rate-limiting step and
not the fermentation of soluble hydrolysis products. In all their experiments, soluble hydrolysis
37

Chapter 2. LITERATURE REVIEW
Table 2.9: Biochemical methane potential assays of feedstocks.
Reference Feedstock Yield Kinetic constantL CH4 STP/ g VS in eq. 2.5: k (d-1)
(Owens and Chynoweth, 1993) Office paper 0.369 0.136corrugated box board 0.278 0.058magazine 0.203 0.116News paper 0.1 0.069food packaging 0.318 - 0.349 0.083 - 0.141wax paper 0.34 0.083Grass 0.209 0.084Leaves 0.123 0.084Branches 0.134 0.035Yard waste 0.143 0.067MSW 0.186 - 0.222
(Chynoweth et al., 1993) Grasses 0.16 - 0.39Woods 0.014 - 0.32Food Wastes 0.54MSW 0.22 0.13 - 0.16
(Cho et al., 1995) Food Wastes 0.472
(Shiralipour and Smith, 1984) Ligno-cellulosics 0.02 - 0.27
(Chugh et al., 1999) MSW 0.23 - 0.25
(Silvey et al., 2000) MSW 0.19
(Vavilin and Angelidaki, 2005) MSW 0.1
(Veeken and Hamelers, 1999) Wholewheat bread 0.195at 30 ˚ C Leaves 0.215
Bark 0.076Straw 0.087Orange peelings 0.264Grass 0.09
products did not accumulate, meaning that the kinetics of the overall process are determined
primarily by the rate of hydrolysis, not by the bacterial growth kinetics. It has been suggested that
this is mainly due to steric hindrance of the activity of hydrolysing enzymes by non-degradable
polymers (Mudrack and Kunst, 1986).
Eastman and Ferguson (1981) proposed that the hydrolytic step obeys first order kinetics with
respect to the remaining concentration of degradable particulate COD:
Rh = khF (2.4)
where Rh is the hydrolysis rate (mg COD.L-1.h-1), kh is the first-order hydrolysis rate constant
(h-1) and F is the remaining concentration of degradable particulate COD (mg COD.L-1). The
first-order hydrolysis function is an empirical expression that reflects the cumulative effects of
the many sub-processes (Eastman and Ferguson, 1981). Later, this model has been used with
success by other investigators (Pavlostathis and Giraldo-Gomez, 1991b; Veeken and Hamelers,
1999; Bolzonella et al., 2005) for the hydrolysis of MSW.
The degradation is assumed to follow a first order rate of decay. Thus, the production of methane
was assumed to follow:
Y = Ymax. (1− exp (−kt)) (2.5)38
Chapter 2. LITERATURE REVIEW
where: Y is the cumulative methane yield at time t, Ymax is the ultimate methane yield, k is the
first order rate constant.
2.3 FACTORS AFFECTING THE AD OF MSW
2.3.1 Introduction
It is not straightforward to compare processes treating OFMSW as performance depends heav-
ily on the composition of the feed used for the study, and furthermore many authors simply do
not specify the composition, nor the ultimate biodegradability of the MSW feedstock. In most
papers, authors only specify whether the MSW feedstock is source-sorted (SS) or mechanically
sorted (MS). The former comprises waste hand-sorted such as kitchen waste or waste fruit and
vegetables from a market with a high organic content (VS/TS ∼= 90%). The latter represents
the OFMSW after a sorting plant where the plastics and glass can be removed in a hydropulper
for instance. The SS-OFMSW has a much lower solid content than MS-OFMSW. Furthermore,
the MS-OFMSW presents lower biodegradability (VS/TS ∼= 45%) due to the presence of more
inerts and lignin or plastics which may have passed the sorting line together with the degradable
fraction (Pavan et al., 2000a). Some studies refer to the waste as ”OFMSW”, although it contains
some impurities (plastic, metal, glass) depending on the efficiency of the waste collection strat-
egy (Hartmann and Ahring, 2005). The following sections deal with the parameters affecting the
digestion of the OFMSW; some of the processes described in the text are summarized in Table
2.11 at the end of the chapter.
2.3.2 Inoculum/Substrate Ratio
The utilization of inoculum in order to decrease the biostabilization time of organic solid waste
has shown satisfactory results. Generally, the inocula are sludge originating from sewage treat-
ment stations or from animal origin, such as bovine manure or others (Lopes et al., 2004). It
is rigorously defined as the mass of living MLVSS (g MLVSS) divided by the mass of organic
matter (g VS) in a specified volume. The inoculum can occupy between 20 and 80% of the total
test volume (Angelidaki et al., 2008), depending on the activity and biomass concentration of the
inoculum, and on substrate concentration, and degradability.
The I/S ratio proposed by Owen et al. (1979) was approximately 1, but Chynoweth et al. (1993)
stated that increasing the ratio may be necessary for some types of substrates and suggested
a ratio of 2. Neves et al. (2004) investigated the BMP of kitchen waste with an I/S ratio of 2, 1,
0.74 and 0.43 and found that the highest ratio prevented acidification.
Lopes et al. (2004) investigated the anaerobic digestion of OFMSW using bovine rumen in-
oculum at an I/S ratio of 0.17, 0.11 and 0.05. They found better performance at a ratio of 0.17
compared to no inoculum in terms of methane produced per gram VS (+112%), first order kinetic
constant (+105%), VS removal (+23%) and the average methane amount in the biogas (+39%).
They speculated that this was associated with the quantity of native microorganisms present in
rumen bovine fluid favoring the conversion of COD to biogas.39

Chapter 2. LITERATURE REVIEW
Raposo et al. (2006) used an I/S ratio of 1, 1.5, 2 and 3 to investigate the BMP of maize and
found similar methane contents in the biogas. However, the cumulative biogas was inversely
proportional to the I/S ratio. The highest methane yield was obtained at a ratio of 1 and this was
associated with a greater accumulation of VFAs. Nevertheless, the methane yields were in the
range 196 - 233 mL CH4 (STP)/g VS, and may therefore not be significantly different from each
other as no standard deviation was reported.
Nallathambi (1997) reports that methane yields from straw were drastically low at an I/S ratio
below 0.25, and that yields increased at a decreasing rate up to an I/S ratio of 2 after which it
remained relatively constant.
2.3.3 Pretreatments
AD of solid waste is rate-limited by the hydrolytic step, and therefore pre-treatment is often used
to promote solubilisation of the organic matter. These treatments include aerobic conditions,
addition of enzymes, mechanical or chemical pretreatment. Several authors have highlighted
the benefits of an aerobic pre-treatment prior to the AD of solid waste (Capela et al., 1999;
Wellinger et al., 1999; Hasegawa et al., 2000). For instance, Hasegawa et al. (2000) obtained
50% improvement in yields when sewage sludge was solubilised under slightly thermophilic aer-
obic conditions prior to AD. They suggested that thermophilic aerobic bacteria secrete external
enzymes which dissolve sludge more actively than commercial enzymes. Capela et al. (1999)
and Wellinger et al. (1999) found that it is possible to increase the hydrolysis rate with micro-
aerophilic conditions. In contrast, in another paper (Nguyen et al., 2006), the micro-aeration
in a leach-bed treating MSW at ambient temperature, exhibited an equivocal result in terms of
enhancing hydrolysis/acidification.
Scheidat et al. (1999) added a mixture of peptidases, carbohydrolases and lipases which sig-
nificantly improved hydrolysis at 39 and 51 ˚ C. However, they did not study the technical and
economic feasibility of this addition. Hartmann et al. (1999) observed an increase of up to 25%
in biogas from fibers in manure feedstock, after pre-treatment in a macerator before digestion.
Confirming these results, Angelidaki and Ahring (1999) found an average increase of 17% in the
biogas potential after mechanical maceration. The chemical treatment of the fibres with NaOH,
NH4OH or a combination also led to increased methane potential. Combination of both treat-
ments, chemical and mechanical, did not lead to any further increase. Delgenes et al. (1999)
obtained 70% solubilisation at pH12, T=140°C for 30 minutes with NaOH. However, anaerobic
biodegradability did not improve, remaining near 40%. The poor anaerobic biodegradability per-
formances were attributed to the soluble molecules generated being refractory and/or inhibitory
to anaerobic micro-organisms. Clarkson and Xiao (2000) also argued that alkali pre-treatment
significantly improved newsprint biodegradability, but treatments for longer duration or at ele-
vated temperatures did not improve bioconversion of newsprint to methane.
40

Chapter 2. LITERATURE REVIEW
2.3.4 Particle Size Distribution (PSD)
The biodegradability depends on the lignin content and the cellulose crystallinity as well as the
surface available for hydrolysis (Zhu et al., 2007). Some authors argued that the increase in the
hydrolysis rate at increasing biodegradability suggests that the rate of hydrolysis of particulate
organic matter is determined by the adsorption of hydrolytic enzymes to the biodegradable sur-
face sites (Tong et al., 1990; Veeken and Hamelers, 1999). This is in accordance with Tong et al.
(1990) who reported positive correlation between the rate of hydrolysis and higher biodegrad-
abilities of the particulate organic substrates.
This means that a high surface area is required for an efficient enzymatic adsorption to take
place. Chynoweth et al. (1993) have shown that particle size did not influence the rate of
methane production in a BMP of herbaceous and woody feedstocks and municipal waste in the
range of 1 to 8 mm. Similarly, in a feedstock of MSW, Nopharatana et al. (2006) and Angelidaki
and Ahring (1999) did not observed any difference in the rate of digestion and the methane yield
with particles within the 2 - 50 mm and 5 - 20 mm ranges, respectively.
In contrast, Sharma et al. (1989) have obtained 98% more biogas with 0.4 mm particles of
plant stem than they did with the 6.0 mm particles. Hills and Nakano (1984) showed that the
hydrolysis rate of tomato waste increased with decreasing particle size. In a more recent study
(Clarkson and Xiao, 2000), different sizes of paper (ground paper, shredded strips and whole
pieces) did not show any differences, statistically, on bioconversion rate and extent. Hartmann et
al. (1999) found that biogas potential did not correlate with a smaller size of fibers. Results from
the maceration indicate that the biodegradability of the fibers is rather enhanced by shearing,
which is not necessarily reflected by a change in size distribution. This results show that surface
area is a more important parameter than particle size.
2.3.5 pH
One way to optimise digester performance is to ensure that it operates at a proper pH. This
is a capital parameter as it is a sign of well-being of the bacterial population. In this aim, the
two-phase configuration of an AD process enables each to be optimized separately. Lagerkvist
and Chen (1992) have studied reactors simulating landfill, and reported a pH of 5.3 and 7.4,
respectively, in the acidogenic and methanogenic phase. It is, however, generally accepted that
hydrolysis is optimum at pH 6 - 6.5 (Vieitez and Ghosh, 1999), and acidification at pH 5.8 -
6.2 (Zoetemeyer et al., 1982b), although the acid-forming bacteria can also grow well at pH 5
(Eastman and Ferguson, 1981). In contrast, it is generally accepted that methane production
from VFAs and lipids is optimal for a pH in the range 6.3 to 7.8 (Lay et al., 1999).
The effect of a drastic change in pH in the influent depends on the available alkalinity in the reac-
tor, the extent and duration of the imposed change, and the concentration of VFAs. Methanogens
are the most affected by changes in pH, while VFAs can still be produced at a pH below 6.5. The
sharp drop in the rate below 6.3 may be related to the fact that methane formation proceeds at
a slower rate than the production of organic acids. The sharp drop in the rate above 7.8 may be
41

Chapter 2. LITERATURE REVIEW
related to a shift in NH+4 to the toxic, unionised form. The pH is known to influence enzymatic
activity, because each enzyme is active only within a specific and narrow pH range, and displays
maximum activity at an optimum pH (Lay et al., 1997).
2.3.6 Alkalinity
The alkalinity is a measure of the capacity of the solution to neutralize acids. Optimal anaerobic
biotechnology is characterized by nearly neutral conditions. Process imbalance can be due to
low pH that can be caused by two sources of acidity, H2CO3 and VFAs. The major requirement
for a well-operating digester is the neutralization of the high carbonic acid concentration which
results from the high partial pressure of carbon dioxide in the reactor. The concentration of CO2
in the liquid phase is set by Henry’s law:
[
CO2(aq)
]
=pCO2
KCO2
(2.6)
where pCO2is the partial pressure in atmospheres, and KCO2
is the Henry constant (25.6 atm/M
at 20 ˚ C and 38.2 at 35 ˚ C). The carbonic acid formation is described by the following equations
valid at 20 ˚ C and an ionic strength of 0.65 M (Perrin, 1982; Soli and Byrne, 2002):
CO2(aq) + H2O ⇋ H2CO3(aq) K1 = 1.18 · 10−3 (2.7)
H2CO3(aq) ⇋ H+aq + HCO−
3(aq) K2 = 8.38 · 10−4 (2.8)
HCO−
3(aq) ⇋ H+aq + CO2−
3(aq) K3 = 4.2 · 10−11 (2.9)
Speece (1996) calculated that a minimum bicarbonate alkalinity of about 4000 mg/L was required
to neutralize the carbonic acid in solution at a carbon dioxide partial pressure of 0.3 atm and at
a ionic strength of 0.2 in an anaerobic digester operating at pH 7 and 35 ˚ C. The extra alkalinity
on top of that can then be used to neutralize VFAs produced by the anaerobic digestion. Many
factors will determine the available reserve alkalinity such as the effluent recycle, the alkalinity
present in the waste stream, the alkalinity generated by the degradation of proteins, the chronic
elevated VFA concentrations or supplementation by the operator. On the other hand, if the
alkalinity is excessively high, for instance due to a high protein content of the waste stream, the
pH will rise which can shift the equilibrium concentration of ammonia toward its toxic form and
inhibit the methanogens.
2.3.7 Solid Retention Time (SRT)
The Solids Retention Time (SRT) is an important parameter as it influences the process eco-
nomics. Its increase translates to a lower food to microorganism (F/M) ratio, which produces a
more stabilized organic matter. Kayhanian and Tchobanoglous (1992) report a better stability
when operating at a 30 days SRT than 15 days; biogas production and volatile solids removal
rates were higher at increased SRT. This latter observation was also made by Oleszkiewicz and
Poggi-Varaldo (1997). The SRT substantially influences the hydrolysis of particulate substrates;
the latter is often described by first-order kinetics, meaning that the hydrolysis rate decreases42

Chapter 2. LITERATURE REVIEW
with increasing SRT, which indicates a non degradable fraction (Eastman and Ferguson, 1981;
Gujer and Zehnder, 1983).
2.3.8 Total Solid Content (TS)
Water is essential for methane fermentation, as the nutrients for the microorganisms must dis-
solve in water before they can be assimilated. The moisture content may not only aid in bacterial
movement, but is also known to influence mass transport limitations in a high-solids bed, and
the balance between VFA production and the conversion of acids to methane. As the TS level is
increased, there is less water available for dilution and salt concentrations increase. Most munic-
ipal solid wastes are produced at solids concentrations greater than 10%. Batch reaction rates
were reported to have been severely limited at initial TS over 30% TS (Wujcik and Jewell, 1979)
with agricultural residues as feedstock. Methane production decreases considerably between 30
and 35% TS, while the major problem encountered is the buildup of VFAs (up to 33,000 mg/L at
55%TS) (Wujcik and Jewell, 1979; D’Addario et al., 1992). This phenomenon was also observed
by D’Addario et al. (1992) with OFMSW as a feedstock. At 5% initial TS, the VFAs reached a
plateau at 6 g VFA.L-1 after 8 days and methane was produced after 16 days. In contrast, at 20
% initial TS, the VFAs reached 24 g VFA.L-1 which resulted in high levels of nonionized acids
that inhibited the acidogenesis as well as the methanogenesis. This linear relationship was also
observed between VFAs and initial VS by Eastman and Ferguson with domestic primary sludge
as substrate (1981).
According to Vandevivere et al. (2003), the large majority (about 90%) of industrial applications
use one-stage processes and these are evenly split between ”dry” systems, where the waste are
digested as received, and ”wet” systems where the waste is slurried with water to ca. 12%TS.
The advantages of both systems are listed in Table 2.10:
Table 2.10: Advantages and disadvantages of high solids content (Wujcik and Jewell,1979; Vandevivere et al., 2003).
Advantages Disadvantages
• Much smaller reactor volumes • Slower anaerobic fermentation
• Less or no liquid effluent • More robust, thus more expensive pumpsand less water consumption(ca. 0.1m3/ton waste) and auxiliary equipment
• Smaller energy consumption for • Less water available for diluting the salts present,heating large volume thus salt concentration can reach toxic concentrations.
• Smaller dewatering equipment
• The plug flow ensure complete hygienizationof the waste (at thermophilic temperatures)
In terms of capital costs, dry and wet systems are comparable inasmuch as dry processes
require much smaller reactor volumes but more expensive equipment. In terms of biological
performance, dry systems can reach high biomass concentration and have proved reliable. From
a technical viewpoint, the dry systems appear more robust because frequent technical failures
due to sand, stones, plastics and wood were reported in wet systems (Vandevivere et al., 2003).
43

Chapter 2. LITERATURE REVIEW
2.3.9 Organic Loading Rate (OLR)
There is an optimum feed rate for a particular reactor which will produce maximum gas, and be-
yond which further increases in the quantity of substrate will not proportionately produce more
gas (Yadvika et al., 2004). Depending on the biodegradability of the feedstock, the Organic
Loading Rate (OLR) may vary over a wide range; Pavan et al. (2000b) have loaded up to 68.5
kg VS.m-3.d-1 with fruit and vegetables in a hydrolytic reactor. The optimum operating reten-
tion times were 2-3 days in the mesophilic hydrolytic reactor and 8-9 days in the thermophilic
methanogenic reactor.
Pavan et al. (2000a) investigated the treatment of OFMSW and biowastes in a thermophilic one-
stage wet system. They found a maximum sustainable OLR for mechanically-sorted OFMSW
equal to 9.7 kg VS.m-3.d-1. The same OLR was, however, unsustainable when the feed was
switched to source-separated biowaste, for which the maximum OLR was 6 kg VS.m-3.d-1. Wei-
land (1992) obtained a similar OLR value for highly biodegradable agro-industrial wastes under
mesophilic conditions. The authors suggested this was due to VFA inhibition. Raynal et al.
(1998) investigated the liquefaction of different vegetable solid wastes in different reactors and
noticed that the hydrolysis yield increased with the OLR and then reached a plateau at 6 g
COD.L-1.d-1, but the hydrolysis rate was linear with the loading rate. Oleszkiewicz and Poggi-
Varaldo (1997) have obtained a sustainable OLR of 9 kg VS.m-3.d-1 with a 30 % TS mixture of
paper, food waste,sewage sludge and potato industry wastes. This feedstock was characterised
by a high paper content (45% dry solids basis) but demonstrated a methane yield of 0.27 L.g-1
VS fed.
Besides these lab-scale experiments, two plants were started in 1999 for the biomethanization
of mechanically-sorted OFMSW with a one-stage wet process; the one in Verona was designed
with an OLR equal to 8 kg VS.m-3.d-1, while the one in The Netherlands has a design capacity
of 5 kg VS.m-3d-1. It is not clear what the bottleneck is that determines these OLR values.
Possible limiting factors are biomass concentration, mass transfer rate of substrate to bacteria,
or accumulation of inhibitory substances (Vandevivere et al., 2003).
2.3.10 Volatile Fatty Acids Inhibition
Researchers have found that VFA concentrations are one of the most important parameters in
AD (Hill et al., 1987; Ahring et al., 1995). The toxic effects of high VFA concentrations have been
studied and reported by several authors, and the resulting drop in pH is generally considered to
be the main cause of inhibition. Several authors believe that VFA inhibition is pH related, and
that the undissociated fraction is the inhibitor (Anderson et al., 1982; Baronofsky et al., 1984).
Wang and Wang (1984) reported that undissociated acetic acid was much more inhibitory than
the dissociated acetate ion; they mentioned that complete growth inhibition resulted when the
undissociated acetic acid concentration was between 0.04 and 0.05 M. Babel et al. (2004) found
that the inhibitory level of undissociated acids for acidogenesis was about 2300, 650, and 120
mg/L at pH 5, 6, and 7, respectively. Thus, undissociated acetic acid is responsible for growth
44

Chapter 2. LITERATURE REVIEW
inhibition at pHs lower than 6, while dissociated acetate ion plays a major role at pHs higher than
7 (Wang and Wang, 1984; Babel et al., 2004).
Baronofsky et al. (1984) studied the effect of undissociated acetic acid on acidogenesis, and
found that the acid production ceased at pH 5. They postulated that acetic acid produced by
the cell was responsible for acidification of the cytoplasm resulting in an inhibition of cellular
functions. Schwartz and Keller (1982) studied the production of acetic acid with a controlled
pH. The highest acetic acid concentration was about 15 and 20 g/L at pH 6 and 7, respectively.
Moreover, according to Yu and Fang (2003), operation at a pH of 4-5 favors the production of
propionate and hydrogen, whereas operation at pH 6-7 encourages the production of acetate
and butyrate. Thus, the authors recommend operation at a neutral pH range (6-7) because it will
naturally minimize the concentration of undissociated acids (Babel et al., 2004), and because it
will optimize the production of acetate (Yu and Fang, 2003).
Propionate is a common intermediate in the metabolism of complex organics. It is normally
converted to acetate and hydrogen, and this reaction is only possible if the hydrogen partial
pressure is below 100 ppm (Smith, 1986). Furthermore, the propionate conversion rate will
proceed much faster if there is a close proximity in granules or biofilm between the H2-producers
and the H2-utilizers. Excessive agitation can disrupt the granule structure, reducing the rate of
oxidation of fatty acids which can lead to digester instabilities. Elevated levels of propionate are
not necessarily due to excessive hydrogen because both acetate and hydrogen are inhibitory to
the propionate conversion process (Van Lier et al., 1996). Elevated concentrations of propionate
can be inhibitory to the acidogens as well as the methanogens, but acclimatisation of the bacteria
to levels up to 8000 mg/l have been reported (McCarty and Brousseau, 1963). In another study
(Hajarnis and Ranade, 1994), however, propionate was found to inhibit the methane production
at 5000 mg/L at neutral pH. Furthermore, when the pH was reduced the situation became worse
because unionized propionic is known to be more toxic.
2.3.11 Effect of Temperature
Several two-stage mesophilic/thermophilic studies have been described in the literature which
combined the benefits of the thermophilic process, i.e. higher OLR, higher pathogen and VS
removal (Oleszkiewicz and PoggiVaraldo, 1997; Schober et al., 1999) with the advantages of
mesophilic conditions (higher process stability and less VFA accumulation) (Rintala and Ahring,
1994; Gallert and Winter, 1997). In another study (Griffin et al., 1998), the thermophilic start-
up period was shorter and more stable, however, in several papers, thermophilic conditions did
not improve the yields (Gallert and Winter, 1997; Pavan et al., 2000b). The gas production
was higher at mesophilic temperatures because the solubility of carbon dioxide decreases at
higher temperature giving rise to a lower methane percentage in the biogas at thermophilic
temperatures. Another explanation could be the higher production of hydrogen in the biogas at
thermophilic temperatures but the authors did not quantify this.
Pavan et al. (2000b) studied the effect of temperature on the performance of a two-stage process
treating SS-OFMSW: increasing the temperature in the hydrolytic reactor up to thermophilic
45

Chapter 2. LITERATURE REVIEW
levels did not improve the yields nor the kinetics. Gallert and Winter (1997) also found that
the performance was not improved when comparing two CSTR treating SS-OFMSW at both
temperatures.
Another risk when operating at thermophilic temperatures is the accumulation of VFAs. Schober
et al. (1999) found concentrations of 0.6 (at OLR = 7.7 g VS.l-1.d-1) and 2.2 g/L (at OLR = 6 g
VS.l-1.d-1), respectively, at mesophilic and thermophilic conditions in a reactor treating kitchen
refuse. Even at higher OLRs, VFAs did not accumulate in the mesophilic digester. On the other
hand, thermophilic conditions enabled higher VS removals, compared to mesophilic conditions
in a one-stage reactor (Oleszkiewicz and PoggiVaraldo, 1997; Schober et al., 1999). In contrast,
Gallert and Winter (1997) obtained similar VS removal percentages at both temperatures.
Lettinga et al. (2001) report that a reduction in temperature causes a significant decrease in
the maximum growth and substrate utilization rates. This means that working at low tempera-
tures requires longer SRT and HRT for any type of reactor (Zeeman and Lettinga, 1999). For
instance, the performance of UASB treating wastewaters is highly limited by hydrolysis when
operating at temperatures between 5 and 20 ˚ C. Indeed, anaerobic digestion at temperatures
below 15 ˚ C is possible, but in this case a SRT of more than 75 days is required (Zeeman and
Lettinga, 1999). Zeeman (1991) found that methanogenesis could be achieved during anaerobic
digestion of cow manure at 15 ˚ C in a CSTR at retention times of 100 days, while it cannot at 50
days. O’Rourke (1968) showed that no significant methanogenesis occurred with the digestion
of sewage sludge at a SRT of 60 days at 15 ˚ C. Even at this long SRT, complete hydrolysis is
not expected (O’Rourke, 1968; Zeeman, 1991). Zeeman (1991) found that the hydrolysis per-
centage at 125 days batch digestion of cow manure to be 12, 14, 18, 27 and 45% at process
temperatures of 5, 10, 15, 25 and 30 ˚ C, respectively. Vanderlast and Lettinga (1992) found a
drop in the soluble COD removal efficiency from 53% at 20 ˚ C to 20% below 10 ˚ C. The authors
stated that this could be due to lower methanogenic activity and/or a limitation in the maximum
possible acidification of the soluble COD fraction.
Mahmoud et al. (2004) has stated that the hydrolysis rate constant of all kinds of solid substrates
in primary sludge is significantly affected by temperature. Moreover, this dependency can be
described by the Arrhenius equation when the enzyme concentration is not rate-limiting (Veeken
and Hamelers, 1999; Mahmoud et al., 2004).
Very few papers discuss the anaerobic fermentation of source-sorted organic fraction of mu-
nicipal solid waste (SS-OFMSW) at psychrophilic (below 15 ˚ C) temperatures. In one paper
(Bolzonella et al., 2005), it has been found that the first-order reaction constant for the hydrolysis
process, kh, was equal to 0.11 d-1 compared to values in the range 0.2 - 0.4 d-1 at mesophilic and
thermophilic temperatures. At psychrophilic temperatures, the predominant organic compounds
are lactic acid, alcohols and simple sugars. Moreover, the VFAs represent 15% of the soluble
COD, which is lower than in digesters operating at the same HRT and at higher temperatures.
46

Chapter 2. LITERATURE REVIEW
2.3.12 Ammonia Inhibition
Ammonia is the result of the degradation of proteins found in food waste and garden waste in
particular (Richards et al., 1991; Kayhanian and Tchobanoglous, 1992; Oleszkiewicz and Poggi-
Varaldo, 1997), and this can lead to an accumulation in processes treating MSW (Kayhanian and
Tchobanoglous, 1992; Weiland, 1992; Vandevivere et al., 2003). It is generally accepted that
ammonia concentrations of over 2-3 g kg-1 are inhibitory if not toxic to non-adapted systems,
especially where the pH is high enough to enable a significant fraction to be in the unionized
NH3 form which is the most toxic. The following equation describes the equilibrium:
NH+4 + OH−
⇋ NH3 + H2O (2.10)
When the pH is sufficiently high (above 7.5), the equilibrium is shifted to the right and the free
ammonia form predominates. There is a temperature and pH-dependent relationship between
free ammonia and ammonia (Anthonisen et al., 1976):
Free ammonia [mg/L] =[NH4 −N ] .10pH
exp 6334273+T + 10pH
(2.11)
The ionized form of ammonia is beneficial because the hydroxide produced in reaction 2.10 re-
acts with CO2, produced during AD, to form bicarbonate that will increase the buffering capacity:
CO2 + HOH ⇋ H2CO3 ⇋ H+ + HCO−
3 (2.12)
There are conflicting reports on the effect of total ammonia concentrations. It was reported that
concentrations between 1500 and 3000 mg/L were inhibitory at pH levels above 7.4, and those
in excess of 3000 were toxic regardless of pH (Han and Shin, 2004). Lay et al. (1997) found
that in the pH range of 6.5 to 8.5, methanogenic activity decreases with an increase in NH+4 -N
concentration, and dropped by 10% at a concentration of 1670-3720 mg NH+4 -N/L, 50% at 4090-
5550 and to zero at 5880-6600 mg NH+4 -N/L. However, the lag phase time was dependent on
the NH3 level, but not on NH+4 , and when NH3-N was higher than 500 mg/L, a notable shock
was observed; this confirms the known fact that the NH3 level is a more sensitive factor than the
NH+4 level for an unacclimatised bacterial system.
Some authors report different inhibition for unionized ammonia values depending on the tem-
perature, pH and bacterial adaptation capacity, but the inhibitory level should be close to 100 -
150 mg.L-1 (Speece, 1996; Gallert and Winter, 1997; Han and Shin, 2004). Many researchers
consider that the toxicity is associated with NH3-N depending on pH and that concentrations in
excess of ≈100 mg/L may cause severe toxicity (Han and Shin, 2004).
Several researchers found a possible inhibition of the microbial activity due to ammonia ac-
cumulation in processes treating MSW (Kayhanian and Tchobanoglous, 1992; Weiland, 1992;
Vandevivere et al., 2003). Kayhanian and Tchobanoglous (1992) report that their digester was
operational at total ammonia concentrations up to about 1000 mg.L-1, but was less stable. The
normal range for the three mass retention times studied was 300 to 600 mg.L-1.
It has been reported that the Valorga and the Dranco process remain stable at ammonia concen-
trations equal to 3 and 2.5 g.l-1, respectively. It has been speculated (Vandevivere et al., 2003)47

Chapter 2. LITERATURE REVIEW
that the sturdiness of the dry systems toward ammonia inhibition is due to the fact that microor-
ganisms are better shielded against toxicants; only restricted zones are affected by temporary
shock loads, leaving other ”pockets” little exposed to transient high levels of inhibitors. Wiegant
and Zeeman (1986) found that ammonia acts as a strong inhibitor of the formation of methane
from hydrogen, but had a relatively small effect on the formation of methane from acetate.
Inhibition studies have been carried out by Wujcik and Jewell (1979) by adding ammonia as
NH4Cl to digesters treating a mixture of newsprint paper and dairy manure at different TS per-
centages (10, 25 and 30%TS). It turned out that reactor performance, quantified by biogas pro-
duction rate, was not as seriously affected by increasing ammonia levels as it was by increased
TS levels. For instance, at 10%TS, the reactor with ammonia levels of 6000 mg.L-1 produced
gas at a rate faster than the reactor with 600 mg/L.
2.3.13 Struvite Precipitation
Precipitation of struvite (MgNH4PO4.6H2O) has been reported in anaerobic digesters because
all the ions required are normally present. Struvite precipitation occurs when the combined
concentration of the free ions Mg2+, NH+4 and PO3−
4 exceed the struvite solubility product pKS=-
log(KS) which is in the range 12.6 - 13.3 (Ohlinger et al., 1998). Availability of the three com-
ponents is controlled by the pH and the total dissolved concentrations of magnesium, ammonia
and phosphorus species. Therefore the product of solubility is strictly equal to:
KS =(
αMg2+γMg2+CmeasT,Mg
)
·(
αNH+
4
γNH+
4
CmeasT,NH3
)
·(
αPO3−
4
γPO3−
4
CmeasT,PO4
)
(2.13)
where α is the partition coefficient defined as the ratio of the free ion concentration and the total
dissolved species concentration. For instance, ammonia can either be present as free ammonia
(NH3) or as ammonium ion NH+4 , but only the latter is available for struvite formation depending
upon the pH. The bulk fluid ionic strength is employed to determine the activity coefficient γi
of each ion, and CmeasT,PO4
refers to the total dissolved species concentration. Thus the calcula-
tion of the solubility product is relatively complex. Instead, the product of the analytical molar
concentration of dissolved magnesium, ammonia-nitrogen and orthophosphate:
PS = CmeasT,Mg · Cmeas
T,NH3· Cmeas
T,PO4(2.14)
can easily be calculated which provides a point on the struvite solubility limit curve in Figure
2.3 for a known pH. The curves separate the undersaturation zone (below the curve) and the
supersaturation zone with respect to struvite formation at 25 ˚ C according to different models
and authors (Bube, 1910; Stumm and Morgan, 1970; Snoeyink and Jenkins, 1980; Ohlinger et
al., 1998). Curves 1 and 3 do not take the effect of ionic strength into account, whereas Curve
4 takes it into account as well as the formation of magnesium phosphate complexes and the
solubility constant found by Ohlinger et al. (1998).
Because heterogeneous nucleation requires a lower energy level than homogeneous nucleation,
struvite crystal embryos preferentially form on surfaces. The first preference for crystal forma-
tion is growth of existing struvite crystals. In systems without existing struvite crystals present,48
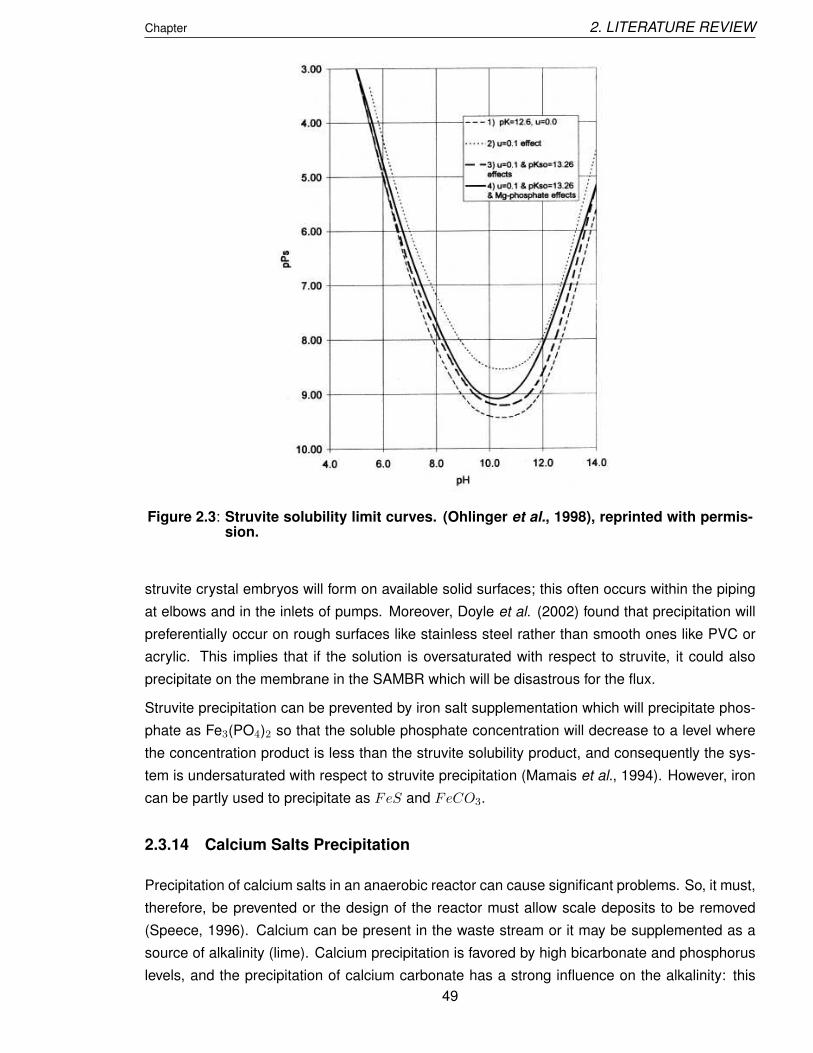
Chapter 2. LITERATURE REVIEW
Figure 2.3: Struvite solubility limit curves. (Ohlinger et al., 1998), reprinted with permis-sion.
struvite crystal embryos will form on available solid surfaces; this often occurs within the piping
at elbows and in the inlets of pumps. Moreover, Doyle et al. (2002) found that precipitation will
preferentially occur on rough surfaces like stainless steel rather than smooth ones like PVC or
acrylic. This implies that if the solution is oversaturated with respect to struvite, it could also
precipitate on the membrane in the SAMBR which will be disastrous for the flux.
Struvite precipitation can be prevented by iron salt supplementation which will precipitate phos-
phate as Fe3(PO4)2 so that the soluble phosphate concentration will decrease to a level where
the concentration product is less than the struvite solubility product, and consequently the sys-
tem is undersaturated with respect to struvite precipitation (Mamais et al., 1994). However, iron
can be partly used to precipitate as FeS and FeCO3.
2.3.14 Calcium Salts Precipitation
Precipitation of calcium salts in an anaerobic reactor can cause significant problems. So, it must,
therefore, be prevented or the design of the reactor must allow scale deposits to be removed
(Speece, 1996). Calcium can be present in the waste stream or it may be supplemented as a
source of alkalinity (lime). Calcium precipitation is favored by high bicarbonate and phosphorus
levels, and the precipitation of calcium carbonate has a strong influence on the alkalinity: this
49

Chapter 2. LITERATURE REVIEW
is because calcium carbonate precipitation will remove Ca2+ and CO2−3 from the solution. The
calcium ion will not influence alkalinity, but the alkalinity will decrease by 2 times the molar
concentration of CO2−3 .
The maximum concentration of calcium before precipitation can be predicted using the product
of solubility assuming that the interference of other ions can be neglected.
The equilibrium is given by the equation :
CaCO3(s) ⇋ Ca2+ + CO2−3 (2.15)
where the solubility product varies from Ksp = 3.7x10⁻⁹ to 8.7x10⁻⁹ at 25 ˚ C, depending on the
data source (Seely, 2008; Weast, 1963). As explained in the previous section, if precipitation
occurs it will preferentially form on surfaces such as the membrane in the SAMBR which could
be very detrimental for the flux.
2.3.15 Nutrient Requirements
It is known that severe limitation of nutrients N and P can have an adverse effect on the growth of
micro-organisms. Some authors argue that long-term digestion is not possible without nutrient
supplements (Pfeffer and Liebman, 1974; Diaz and Trezek, 1977; Kayhanian and Rich, 1995).
Rittman and McCarty (2001) suggested that nutrient limitations could lead to the release of a
large flow of organic molecules to the environment as a mechanism of dumping electrons that
could not be invested in biomass synthesis. In other words, if essential nutrients are present in
very low concentrations, soluble microbial products (SMP) might be produced to scavenge the
required nutrients.
Aquino and Stuckey (2003) showed that methanogenic microorganisms are more affected by the
lack of nutrients than the acidogenic and acetogenic bacteria, and they suggested that the latter
grow fast and compete with methanogens for the available nutrients. There was no accumulation
of glucose in the absence of nutrients, suggesting that fermentative bacteria could cope with
stressed conditions better than acetogenic and methanogenic population. Aquino and Stuckey
(2003) also showed that the lack of N and P resulted in a greater impact on the biochemical
methane potential test than the lack of vitamins and metal nutrients. Moreover, it resulted in the
highest SMP production.
Kayhanian and Rich (1995) have compared the digestion of MSW alone, MSW blended with
wastewater sludge and manure, and MSW blended with wastewater sludge and a synthetic
nutrient solution. They observed that the use of nutrients stabilized the process but failed to du-
plicate the enhanced gas production achieved with combined sludge and manure supplements.
They believed that the highly soluble chemicals were much more bio-available and eventually
artificially spiked the reactor. They concluded that the potential for complexation, the unknown
solubility, and the potential costs associated with the chemical solutions, may make chemical
addition a less attractive nutrient source for full-scale applications.
50
Chapter 2. LITERATURE REVIEW
2.3.16 Phase Separation
Several authors report two-phase treatment as more rapid and stable than single stage (Massey
and Pohland, 1978; Zoetemeyer et al., 1982a; O’Keefe et al., 1996; Vieitez and Ghosh, 1999).
However, two-stage systems are the most complex and expensive of all systems (Vandevivere et
al., 2003). Another benefit of the two-stage process, highlighted by Held et al. (2002), is the suc-
cessful elimination of the odour in the overall output of the process, which could not be achieved
in a CSTR alone. Their greatest advantage lies in the buffering of the OLR taking place in the
first stage, allowing a more constant feeding rate to the methanogenic second stage. This is a
substantial advantage in the case of substrates whose degradation is limited by methanogene-
sis rather than by hydrolysis, e.g. cellulose-poor kitchen waste (Pavan et al., 2000a; Pavan et
al., 2000b; Vandevivere et al., 2003). These wastes, being very rapidly acidified, tend to inhibit
methanogenesis in one-stage reactors when the feedstock is not adequately mixed, buffered
and dosed. This phenomenon has been experimentally observed by Pavan et al. (2000a): the
one-stage CSTR, fed with a rapidly hydrolyzable fruit and vegetable waste, failed at an organic
load of 3.3 kg VS.m-3.d-1, whereas the two-stage process remained stable at 7 kg VS.m-3.d-1.
Banks and Humphreys (1998) also recommend a two-stage operation for substrates offering low
natural buffering capacity such as a mixture of paper and wood as they could not maintain stable
operation in a single stage because VFAs could not be buffered leading eventually to souring.
This process and others treating MSW only or through co-digestion have been gathered in Table
2.11.
Many studies have focused on the two-stage configuration as it allows a separate optimization
in both reactors leading to better performance. The first stage usually takes place at a pH be-
tween 4.5 and 6, whilst the second stage operates in a pH range of 6.5 to 8.2 (Speece, 1996).
A strict separation of acidogenesis and methanogenesis is almost impossible without addition
of chemicals in order to control the pH. A good separation can be achieved when the VFA con-
centration is above 6 g.L-1 and pH below 5, but strictly-separated acidogenic and methanogenic
fermentation could not be maintained at the final stage when treating leaf biomass (Chanakya
et al., 1993). In another paper (Cho et al., 1995), methane production also took place in a leach
bed treating food wastes when the VFA level fell below 5 g.L-1. Lettinga and Hulshoff Pol (1991)
have recommended the selection of a HRT in the range 6 - 24 h. Under these conditions, there
will be an accumulation of VFAs in the acidogenic reactor.
The minimum solid residence time for methane production at mesophilic temperatures is approx-
imatively 2.5 to 4 days. Sometimes some methane is produced at much shorter retention times
because of the hydrogen-consuming bacteria which, according to Shea et al. (1968), have a
minimum cell residence time of 19 hours. This can explain why methane is produced in the first
reactor before the second one commences biogas production.
2.3.17 Recirculation of the Effluent
Liquor recycle features in a number of processes, and is important because it allows valuable
buffering capacity to be retained in the system, maintaining heat, nutrients and microorganisms51

Chapter 2. LITERATURE REVIEW
within the system (O’Keefe et al., 1992; Banks and Humphreys, 1998; Nordberg et al., 2006). It
also allows the toxic components in the feed and the VFAs in the reactor (Babel et al., 2004) to be
diluted, and to adjust the organic loading (Vieitez and Ghosh, 1999). Recirculation of the effluent
was used in anaerobic processes treating various kinds of wastewaters to provide alkalinity
in order to avoid failure of the acidogenic reactor (Borja et al., 1996; Banks and Humphreys,
1998). Leachate recirculation has been especially employed in reactors simulating landfills, or
directly in landfills, because it increased methane yields and lowered the treatment costs (Vieitez
and Ghosh, 1999; He et al., 2005a), but also provided alkalinity and moisture in the leach-bed
(O’Keefe et al., 1992; Nordberg et al., 2006).
In full-scale processes, it could be used not only to dilute the feed, but also to reduce the fresh
water consumption and storage capacity requirement (Nordberg et al., 2006). On the other hand,
liquid recycle could lead to a build-up of toxic or recalcitrant compounds such as ammonia (He et
al., 2005a), leading to an inhibition of hydrolysis, acidogenesis and methanogenesis (Nordberg
et al., 2006). Recirculation was not always found to be beneficial because of possible inhibition.
Nordberg et al. (2006) concluded, therefore, that it is necessary to adjust the degree of liquid
recirculation to reach an optimal process. However, apart from CSTR and leach-bed systems,
the behaviour of reactors with recirculation of the effluent from a MSW process is still not well
documented.
2.3.18 Stability of the Digestate
Mechanical-biological treatment of the OFMSW is now the main strategy to reduce biodegrad-
able MSW in waste in the UK and in Europe (Scaglia and Adani, 2008). It consists of me-
chanical pretreatment followed by an aerobic (composting-like process) or anaerobic process so
that waste impacts are reduced. These processes have attracted attention because they pro-
duced stabilized waste, which has a low impact when disposed in landfill (Adani et al., 2004).
As a result, biological stability after biological processing has gained particular interest recently.
However, compost quality is an important issue, and is related to the absence of phytotoxicity
and seed weeds and the presence of both organic and inorganic elements (Baffi et al., 2007).
Problems associated with compost include: odor production, self-heating, biogas production and
pathogen regrowth. Many of these aspects are related to microbial activity which is an aspect
that was investigated in this study. The following sections deal with the parameters affecting the
stability of the digestate.
Composting of organic wastes is a biooxidative process involving the mineralisation and par-
tial humification of the organic matter, leading to a stabilised final product, free of phytotoxicity
and pathogens and with certain humic properties (Zucconi and de Bertoldi, 1987). If the mate-
rial contains mainly recalcitrant or humus-like matter, it is not able to sustain microbial activity
and therefore, it is considered stable. Stability prevents nutrients from being tied up in rapid
microbial growth, allowing them to be available for plant needs. Beforehand, it must empha-
sized that phytotoxic compounds are produced by the microorganisms in unstable composts
(Zucconi et al., 1985). During the process aerobic bacteria, fungi and other microorganisms,
52

Chapter 2. LITERATURE REVIEW
including microarthropods, break down organic materials to stable, usable organic substances
called compost. Composting also implies volume reduction of the wastes, and the destruction
of weed seeds and pathogenic microorganisms. Amongst the advantages of compost, one can
cite (WRAP, 2005):
• Improving the soil structure and creating a better root environment for plants.
• Increasing moisture infiltration and moisture holding capacity in lighter soils.
• Providing a variety of nutrients (some in slow release forms) often reducing the need for
fertilizers.
• Providing organic matter to improve soil structure.
• Supplying beneficial bacteria which assist nutrient uptake and help suppress soil borne
diseases.
• Improving plant health, from germination, through growth and to maturity.
• Improving resistance to soil compaction and erosion.
• Improving the control of weeds when coarse particle grades are used as a mulch.
• Reduction of volume and moisture.
• Removal and control of odors
The composting process involves different stages, each of them are characterized by a differ-
ent population of microorganisms (Keener et al., 2000). During the first stage lasting 1-3 days
mesophilic bacteria and fungi degrade simple compounds such as sugars, amino acids, pro-
teins, etc., quickly increasing the temperature. Fungi are present during all the process but
predominate at water levels below 35% and are not active at temperatures higher than 60 ˚ C.
Then there is a thermophilic phase, where thermophilic microorganisms degrade fats, cellulose,
hemicellulose and some lignin; during this phase the maximum degradation of the organic mat-
ter occurs together with the destruction of pathogens. Finally, the cooling phase is characterised
by a decrease in the temperature due to a reduction of microbial activity associated with the
depletion of degradable organic substrates, the composting mass is re-colonised by mesophilic
microorganisms which are able to degrade the remaining sugars, cellulose and hemicellulose.
After this biooxidative phase, a maturation phase or curing, the humification of the organic matter
occurs, producing a mature compost with humic characteristics. Actinomycetes predominate
during stabilisation and curing, and together with fungi are able to degrade resistant polymers.
Thus, compost can be defined as the stabilised and sanitised product of composting which has
undergone an initial, rapid stage of decomposition, is beneficial to plant growth and has certain
humic characteristics, making the composting of waste a key issue for sustainable agriculture
and resource management (Zucconi and de Bertoldi, 1987; Jakobsen, 1995). The composting
53

Chapter 2. LITERATURE REVIEW
process yields humic acids with chemical and structural characteristics similar to those of the
more humified soil humic acids (Sanchez-Monedero et al., 2002).
While composting occurs naturally, efficient composting requires the control of several factors to
avoid nuisance problems such as odors and dust, and also for obtaining a quality product. The
control of parameters such as bulk density, porosity, particle size, nutrient content, C/N ratio,
temperature, pH, moisture and oxygen supply have been demonstrated to be key for composting
optimization since they determine the optimal conditions for microbial development and organic
matter degradation (Bernal et al., 2008). The relevancy of these parameters are detailed in the
following paragraphs.
The optimum pH is between 5.5 and 8 (de Bertoldi et al., 1983), and most materials are within
that range. However, N-losses by ammonia volatilisation can be relevant at pHs higher than
7.5, which can affect the C/N ratio. The optimum temperature range for composting is 40-65 ˚ C
(de Bertoldi et al., 1983), and temperatures above 55 ˚ C are required to kill pathogenic mi-
croorganisms. But if the temperature achieved exceeds the tolerance range of the thermophilic
decomposers, the effect is damaging for composting, and hence the regulation of temperature is
required for controlled composting. Excess heat removal can be achieved through several strate-
gies (Miller, 1992): controlling the size and shape of the composting mass; improved cooling and
favourable temperature redistribution by turning operations.
Particle size and distribution are critical for balancing the surface area for growth of microor-
ganisms and the maintenance of adequate porosity for aeration. The larger the particle size,
the lower the surface area to mass ratio. So compost with large particles does not decompose
adequately because the interior of the particles is difficult to access for the microorganisms, and
during decomposition particles may coat the surface with an impenetrable humified layer (Bernal
et al., 2008). However, if the particle size is too minute, void spaces are then reduced, resulting
in a reduced rate of gaseous diffusion (Jordan and Mullen, 2007). These factors are material
specific: particle size and distribution, shape, packing and moisture content control the porosity
of the composting mass.
The substrate porosity exerts a great influence on composting performance since appropriate
conditions of the physical environment for air distribution must be maintained during the process.
Porosity greater than 50% causes the pile to remain at a low temperature because energy lost
exceeds heat produced. Too little porosity leads to anaerobic conditions and odour generation.
The percentage of air-filled pore space of composting piles should be in the range of 35-50%
(Bernal et al., 2008).
Aeration is a key factor for composting because it controls the temperature, removes excess
moisture and carbon dioxide, and provides oxygen for the biological processes. The optimum
O2 concentration is between 15% and 20% (Miller, 1992). Controlled aeration should maintain
temperatures below 60-65 ˚ C, which ensures that enough oxygen is supplied (Finstein and Miller,
1985).
The optimum water content for composting varies with the waste to be composted, but generally
the mixture should be at 50-60% (Gajalakshmi and Abbasi, 2008). When the moisture con-
54

Chapter 2. LITERATURE REVIEW
tent exceeds 60% the diffusion of oxygen becomes an issue, and the process tends to become
anaerobic (Das and Keener, 1997). During composting a large quantity of water can evaporate,
to control temperature, and as water content diminishes the rate of decomposition decreases,
thus rewetting is often required in order to maintain the optimum moisture content for the micro-
bial activity.
Compost maturity and stability are often used interchangeably, however, they each refer to spe-
cific properties of these materials. Stability refers to a specific stage or decomposition or state
of organic matter during composting, which is related to the types of organic compounds re-
maining and the resultant biological activity in the material. Maturity is the degree or level of
completeness of composting and implies improved qualities resulting from ”ageing” or ”curing”
of a product. The UK Composting Association (Gilbert et al., 2001) defined maturity simply as
”the degree to which a compost has matured”, and mature compost as ”compost that does not
have a negative effect on seed germination or plant growth”. A great number of analysis exist
to assess the stability or maturity of a compost. Amongst the respiration techniques, the oxy-
gen uptake, the carbon dioxide production and the self-heating test can be cited (Bernal et al.,
2008). The aerobic respiration rate was selected by many authors as the most suitable param-
eter to assess aerobic biological activity and hence stability (Hue and Liu, 1995; Wallace et al.,
2005). Aerobic respiration rate is the only parameter that directly measures biological activity in
all composts at relatively low cost and is easily and quickly measured.
In aerobic conditions, one carbon atom derived from catabolism is attached to two oxygen atoms
to form carbon dioxide, releasing energy, including heat, in the process. Therefore, respira-
tion can be measured in several ways: carbon dioxide evolution, oxygen consumption and self-
heating, which are indicative of the amount of degradable organic matter still present and which
are related inversely to stabilization. However, carbon dioxide evolution is the most direct tech-
nique of compost stability because it measures carbon derived directly from the compost being
tested. Thus CO2 evolution directly correlates to aerobic respiration, the truest measure of res-
piration and aerobic biological activity (Kalamdhad et al., 2008).
With respect to the CO2 production rate the stability threshold established by the British Stan-
dards Institution (WRAP, 2005) is 16 mg CO2.g VS-1.day-1, whereas the one set by the European
Commission is 1000 ± 200 mg O2.kg VS-1.hr-1 (Commission, 2001), which is equivalent to 33
mg CO2.g VS-1.day-1. Below this level, it is deemed that the treated residual municipal waste is
not further biodegraded. For anaerobic digestion processes of municipal waste, it is required to
sanitize the digestate at 70 ˚ C for 1 hour or to compost it, i.e. keep it at 65 ˚ C for 7 days with 2
turnings which is also the sanitisation conditions set by the British Standards Institution. Hue and
Liu (1995) have established a maturity index of 120 mg CO2.kg VS-1.hr-1, which is equivalent to
2.88 mg CO2.g VS-1.day-1. Also Michel et al. (2004) and Wang et al. (2004) used the criterion of
CO2 evolution rate ≤ 0.5 mg CO2-C. g VS-1.day-1 to consider composts derived from manure as
stable materials, which is equivalent to 1.8 mg CO2.g VS-1.day-1. However, other quality criteria
apart from maturity determine the compost quality, such as pathogens, heavy metals, the plant
response, the presence of physical contaminants such as glass and plastic, and the presence of
stones.55
Chapter 2. LITERATURE REVIEW
2.3.19 Solid Waste Anaerobic Processes
Some one-stage and two-stages processes are listed in Table 2.11. The table is divided into
laboratory and bench scale on the one hand, and the pilot and full scale processes on the
other. For each process, the configuration is given along with the process temperature : M for
mesophilic and T for thermophilic. The operating loads are generally lower in bench-scale than
in full-scale plants where loading rates as high as 10 - 18 kg VS.m-3.d-1 are cited in the literature.
A direct comparison is difficult as commercial literature cites the best case studies after a long
operation period, and often does not specify the amount of recycled solids. Comparison is not
straightforward as, in some studies, no nutrients and/or no seed inoculum were added to the
system. This is often the case with leach bed process where a batch of MSW is loaded and
the reactor closed, which results in longer operating time, thus lower methane yields. In batch
systems, the dry waste (30-40%) is allowed to go through all degradation steps sequentially in
the digester. Very often, the leachate is recirculated in order to disperse the inoculant, nutrients
and acids. Batch reactors are simple and cheap, and require small quantities of water, however,
the OLR is generally low. Also the high VS removal percentages reported in laboratory and
bench scale processes should be interpreted with caution due to the better contact between
microorganisms and the more homogeneous substrate.
The VS removal efficiencies are in the range 50 - 70%, which indicates that 50 - 70% of the
VS is actually biodegradable VS. Nonetheless, some authors report only the COD removal in
the second reactor. As a result, COD removals of greater than 90% have been reported in two
phase systems (Anderson and Saw, 1992; He et al., 2005a), and COD removals of 75% have
been reported at 24 ˚ C (Kettunen et al., 1996).
56

Ch
ap
ter
2.
LIT
ER
AT
UR
ER
EV
IEW
Ta
ble
2.1
1:
MS
Wa
na
ero
bic
dig
es
tion
pro
ce
ss
es
.
Reference Process Operational parameters Process performancesand feedstock Configuration
HRT TS OLR GPR SGP CH4 VS removal
Lab and Bench scale Processes Reactor(s) [days] [%]h
g V S
L.day
i h
Lbiogas
L.day
i h
Lbiogas
g V Sfed
i
[%] [%]
(Anderson and Saw, 1992) 2 LB(M) F:30 0.15 (CH4)OFMSW UASB(M) 2 11(g COD) 0.12(CH4) 95(COD)
System 0.27 70(Kubler and Wild, 1992) CSTR (M) 2-3 20-25 19-74SS-OFMSW FF(M) 7 10 4 66-80 70(Rintala and Ahring, 1994) CSTR(T) 7.5 F:4.3 5.9 0.04(CH4) 9-29SS-OFMSW UASB(T) 16 9(COD) 0.25-0.31(COD) 79.5 68-81(COD)(Gallert and Winter, 1997) SS-OFMSW CSTR(M) 19 F:18.4 9.4 5.3 0.88(V Sdegraded) 67 64(Griffin et al., 1998) OFMSW+PS+WAS CSTR(M) 20 F:7 3.1 0.96 0.29 54±4 53(Banks and Humphreys, 1998) CSTR(M) 2.5 F:3 0.92(BVS)PW+Wood CSTR(T) 2.5
System 5 0.46(BVS) 0.33 53(Vieitez and Ghosh, 1999) LB(M) 16 0.31 0.026 48MSW PB(M) 0.075 48
System 295 0.046 0.27 46 30(Vieitez et al., 2000) LB(M) 16 0.27 0.06 0.023 38MSW PB(M) 0.03-0.027 70-80
System 524 0.13 0.045 0.34 50 54(Held et al., 2002) CSTR(M) 24 17.1 6 4 0.52 47 64MS-MSW AF(M) 6 12.2 (COD) 1.8 0.31 61 44(Hartmann and Ahring, 2005) OFMSW CSTR(T) 14-18 F:35.6 4 0.63-0.71 59.7 69-74(Castillo et al., 2005) OFMSW CSTR(M) 18 18 8.8 4.77 0.54 55 67.4(Angelidaki et al., 2006) OFMSW CSTR(T) 15 1.5 4.3 0.32(CH4)(Davidsson et al., 2007) SS-OFMSW CSTR(T) 15 5 2.8 0.3-0.4(CH4) 62 80(Elango et al., 2007) WAS+MSW CSTR(M) 25 1 2.9 0.36 68-72 88
Pilot and Full-scale Processes(Mata-Alvarez et al., 1992) MSW CSTR(T) 7.4 14.3 12.9 5.2 0.37 58 76.2(Kayhanian and Tchobanoglous, 1992) CSTR(T) 30 23-30 6-7(BVS) 5.3 0.8-0.9(BVS) 50 98(BVS)OFMSW CSTR(T) 25(Wellinger et al., 1992) FYV CSTR(T) 17 F:40 11.1 3.6 0.325 62(Cecchi et al., 1992) MS-OFMSW CSTR(T) 8.5 F:17.7 13.4 4.31 0.32 58.8(O’Keefe et al., 1992) MSW SEBAC (T) 42 F:56.5-80.2 3.2 1.02-1.11 0.32-0.35 55-60 48.9-52.4(Oleszkiewicz and PoggiVaraldo, 1997) CSTR(T) 21 30-35 9.1 6 0.2-0.27 55-60 44-53PW+KW+WAS+IPW(Pavan et al., 2000a) SS+MS-OFMSW CSTR(T) 11.2 25 9.7 6.2 0.5 57.9(Pavan et al., 2000b) CSTR(M) 6.6 F:8.2 12.6FV CSTR(T) 12.5 5.7
System 19.1 4.4 0.7 82(Vandevivere et al., 2003) Valorga 15-20 30 5 2.6 0.21-0.3(CH4) 50-70(Braber, 1995) MS-OFMSW (M)(Nallathambi, 1997)(Vandevivere et al., 2003) SS-OFMSW Kompogas(T) 13-25 30 0.21-0.3(CH4) 50-70(Vandevivere et al., 2003) MS-OFMSW Dranco(T) 14-21 31-57 12-15 2.8 0.187(CH4) 55 65(Nallathambi, 1997)(Vandevivere et al., 2003) Biocell LB(M) 14-21 40 3.6-5.1(Braber, 1995) SS-OFMSW
57

Chapter 2. LITERATURE REVIEW
Legend for Table 2.11
AF = Anaerobic Filter
CSTR = Continuously Stirred Tank Reactor
BVS = Biodegradable Volatile Solids
F = Feed
FF = Fixed-Film reactor
FYV = Fruits, Yard and Vegetables waste
GW = Garden Waste
GPR = Gas Production Rate
IPW = Industrial Potato Waste
KW = Kitchen Waste
LB = Leach-Bed
M = Mesophilic
MS-OFMSW = Mechanically-Sorted Organic Fraction of Municipal Solid Waste
PB = Packed Bed reactor
PS = Primary Sludge
PW = Paper Waste
SEBAC = Sequential Batch Anaerobic Composting reactor
SGP = Specific Gas Production
SS-OFMSW = Source-Sorted Organic Fraction of Municipal Solid Waste
T = Thermophilic
WAS = Waste Activated Sludge
2.4 ANAEROBIC MEMBRANE BIOREACTORS
2.4.1 Introduction
Two-phase systems designed with biomass retention devices display a larger resistance toward
toxicants and inhibitory substances due to the higher biomass concentrations. Another substan-
tial advantage is the higher OLR that can be applied in the methanogenic reactor because the
SRT can be set independently from the HRT. For instance, Kubler and Wild (1992) report val-
ues up to 10 and 15 kg VS.m-3.d-1 for the BTA and Biopercolat processes, respectively; thus
coupling membrane technology and a bioreactor is a sensible solution. The main advantages
include rapid start-up and a higher loading rate than classical technologies (Stephenson et al.,
2000), and combining in one unit the removal of COD, solids and nutrients, thus giving rise to
a small footprint. Furthermore, the membrane allows the high MW and slowly degradable com-
pounds to be kept in the reactor. Lower TOC concentrations in the permeate compared to the
bulk are due to a combination of biodegradation by the biofilm developed on the membrane sur-
face, and further filtration by the cake layer and narrowed pores (Choi and Ng, 2008). The main
characteristics of a MBR are listed and commented on in the next paragraphs.
Membranes bioreactors can have various configurations:
58
Chapter 2. LITERATURE REVIEW
• Submerged anaerobic membrane bioreactor (SAMBR): the membrane is submerged within
the reactor: in this kind of configuration, membrane cleaning is accomplished by recircu-
lating the biogas. The bubbles produced underneath the membrane scour it and alleviate
biofouling. The municipal sewage treatment plant at Porlock (UK) using Kubota mem-
branes achieves fluxes of 30 - 40 LMH (litres m-2hour-1) in aerobic MBRs using this design
(Victor, 2008).
• Sidestream membrane bioreactor: the membrane module is external to the reactor.
• ”add-on” membrane where the module filters the final effluent of a reactor which contains
low solids contents such as UASB reactors (Stephenson et al., 2000).
Sidestream membranes usually operate at higher crossflow velocities (1 - 5 m s-1), transmem-
brane pressures (TMP = 2-7 bars) and permeate flux (70 - 100 LMH) compared to the SAMBR,
but they generate more shear (Berube et al., 2006). This can lead to more cell lysis and extra-
cellular polymer production, which also causes biofouling; sidestream operation in a MBR can
lead to a 50% decrease in sludge activity after circulating the sludge 20 times, and a 90% loss
within 100 cycles (Brockmann and Seyfried, 1997). However, it was also found that performance
remained intact regardless of the degree of shear in an anaerobic side-stream MBR treating
swine manure (Padmasiria et al., 2007). This configuration has shown to be very effective in
treating different types of wastewaters but the use of crossflow filtration is costly (Al-Malack,
2006).
The main advantage of crossflow filtration is the limitation of cake build-up at the membrane
surface due to the shear stress caused by the tangential flow. In a sidestream configuration it
has been shown by several researchers that a higher crossflow velocity has a beneficial influence
on the flux as it increases the critical flux and reduce cake formation (Chen et al., 1997; Defrance
and Jaffrin, 1999) by decreasing the resistance associated with the polarization layer (Choo and
Lee, 1998): moreover, this technique prevents irreversible fouling. On the other hand, it creates
smaller particles that are more mobile and thus more susceptible to produce internal fouling
(Mackley and Sherman, 1992; Li et al., 1998; Choo and Lee, 1998).
The submerged configuration is usually preferred because of the low operating costs, the gentle
mixing and high efficiency. The operating TMP has been reported in the range 200 - 1000 mbar
for low strength wastewaters, whereas the bulk cross-flow velocity tends to be less than 0.6 m/s
(Berube et al., 2006). A COD removal efficiency of greater than 97% was achieved and retained
mixed liquor suspended solids (MLSS) concentrations were as high as 39,000 mg/L, while Hu
(2004) obtained nearly 90% COD removal in an SAMBR at 3 hours HRT. But there is still a
lack of understanding of the SAMBR regarding the effect of membrane properties on system
performance, hydrodynamic behaviour of biosolids, operational parameters, membrane fouling
and cleaning issues. There are numerous factors affecting membrane performance as shown in
Figure 2.4. Those are introduced in the following subsections.
59

Chapter 2. LITERATURE REVIEW
Figure 2.4: The parameters and interactions that influence process performance in ananaerobic membrane bioreactor (Akram, 2006; Meng et al., 2006).
2.4.2 Concentration Polarisation
Concentration polarisation (CP) is the tendency of solutes to accumulate on the membrane
surface within a concentration boundary layer, and this liquid film is stagnant since the liquid
velocity at the membrane itself is zero. This implies that the only mode of transport is diffusion,
and the solute concentration near the membrane increases exponentially with increasing flux.
Furthermore, due to CP permeation of the rejected materials through the membrane decreases;
however, the thickness of the layer decreases when turbulence is promoted. At high fluxes,
significant flux decline is observed for any membrane/wastewater combinations (Amy, 2008).
This can be attributed to a thicker CP layer, manifesting itself in the aggregation of humic sub-
stances in the boundary layer. Moreover, the addition of Ca2+ enhanced fouling by neutralizing
the negative charge of the anionic humic and fulvic acids, presumably promoting aggregation
and reducing fluxes.
2.4.3 Nominal Pore Size and Flux
Membrane performance and extent of fouling will obviously depend on the nominal pore size.
A ZeeWeed membrane with a pore size of 0.04 µm was used to treat leachates in an aerobic
60
Chapter 2. LITERATURE REVIEW
MBR unit operating with a stable flux of 2.1 LMH (Laitinen et al., 2006). In an anaerobic MBR
with sidestream membrane treating food wastewaters (He et al., 2005b), membranes with pore
sizes ranging from 20 to 70 kDa achieved fluxes of up to 70 LMH but performances decreased
below 20 LMH due to the high shear generated by the recirculation pump.
Hong et al. (2002) observed that the rate of permeate flux decline increased with increasing
membrane pore size or porosity. In other words, with MF the flux decreased sharply and more
rapidly compare to UF (Hong et al., 2002; Albasi et al., 2002; Le-Clech et al., 2003; Amy, 2008).
UF membranes were less prone to fouling by macromolecules because the smaller pores are
more impenetrable. In biological systems in particular, cell debris are in the same size range as
the MF pore size (Mercier-Bonin et al., 2001), which can explain why MF membrane are rapidly
fouled in MBRs. Le-Clech et al. (2003) also found a negative effect on the flux for a pore size
increasing from 0.01 to 0.1 micron.
On the other hand, Choo and Lee (1996a) used a membrane of 0.1 micron pore size to demon-
strate minimum fouling when compared to 1, 0.5 and 0.02 microns pore sized membranes.
However, Pouet and Grasmick (1995) identified the particles above 1 micron in a municipal
wastewater as principally responsible for fouling of a sidestream ceramic MF of sub-micron pore
size. This suggests that an optimal pore size exists due to the relationship between the size of
the membrane pore and fouling particles (Imasaka et al., 1989; Choo and Lee, 1996a). Several
teams have stated that particles with a size close to the membrane pore size are responsible
for flux decline (Pouet and Grasmick, 1995; Fane et al., 2000; Dosoretz and Boddeker, 2004).
Jeison and Van Lier (2007) reported that the small particles are likely to cause the changes in
attainable critical flux because back-transport mechanisms are strongly related to particle size:
smaller particles have a higher tendency to deposit over the membrane surface.
2.4.4 Fouling
2.4.4.1 Mechanisms: Fouling can occur by; adsorption or deposition of macromolecules onto
the membrane surface; by adsorption onto the pore surface; or, by complete pore-blocking. The
phenomenon is exacerbated by concentration polarisation as it increases the concentration of
macromolecules and particles in the vicinity of the membrane. In general, fouling unrelated
to biological growth can be attributed to two key components in the feed; proteins and col-
loidal/particulate materials. Fouling also depends on the interactions between the foulants and
the membranes. For instance, proteins can cause severe fouling in MF membranes, in particular
membranes made of hydrophobic polymers such as polypropylene. Several researchers (Kim
et al., 1992) have postulated that the extent of internal and external fouling seems to be gov-
erned by surface porosity and flux by membrane surface chemistry. Marshall et al. (1993) found
internal fouling to be promoted at lower fluxes.
Researchers often observe two phases in membrane fouling; a first phase where transmem-
brane pressure is proportional to the flux, while in the second phase, if the flux is over the critical
flux, irreversible fouling arises and manifests itself in a dramatic rise in TMP. Sub-critical oper-
ation does not guarantee, however, a constant TMP. In fact, there will be local clogging and as
61

Chapter 2. LITERATURE REVIEW
a result of the loss of permeable surface, the flux will locally raise above the critical flux which
explains the small increases in TMP with time (Cho and Fane, 2002). Jeison and van Lier (2006)
observed that sub-critical flux operation is an efficient way to control fouling and to achieve long-
term operation in the absence of chemical cleaning or maintenance; it is the flux below which
no fouling occurs. Under such conditions, an equilibrium is established between the incoming
particles moving towards the membrane by convective flow and returning particles moving away
from the membrane, due to back transport. This phenomenon where particles migrate away
from the wall in a dilute suspension and in laminar Poiseuille flow is known as the tubular pinch
effect (Aoki et al., 1979).
2.4.4.2 Fouling Constituents: With regards to particulate materials, their fouling potential will
depend on physicochemical conditions via hydrodynamic and surface force effects. Aggrega-
tion may be promoted at the boundary layer or within the membrane pore depending on the
magnitude of surface charges, which itself will vary with the pH and ionic strength. The nature
of colloidal behaviour and its sensitivity to surface forces makes particle aggregation difficult to
understand and therefore to predict. However, Li et al. (2003) have observed that cakes formed
marginally above the critical flux appear to be much less consolidated than cakes formed at
higher flux and TMP. That team has suggested that at high ionic strength bacterial re-suspension
occurs less easily because the bacterial electrical double layer is more suppressed allowing
closer packing and easier aggregation in the cake layer.
Extracellular Polymeric Substances (EPS) are metabolic products released by microorganisms.
The chemical composition of the EPS matrix is reported to be very heterogeneous, with carbo-
hydrates and proteins as the major compounds, but also lipids and nucleic acids (Meng et al.,
2006). EPS is a part of the so-called Soluble Microbial Products (SMPs) defined as the pool of
organic compounds that result from substrate metabolism and biomass decay during the com-
plete mineralization of simple substrates. Generally, it is recognized that SMPs excreted from
cells are the main foulants (Chang and Lee, 1998; Nagaoka et al., 1998; Li et al., 2003) because
they fill the void spaces between the particles in the cake (Hodgson et al., 1993; Li et al., 2003;
Chu et al., 2005). This is due to their molecular weight which is between 1 and 10 kDa.
Chang and Lee (1998) determined that a 40% reduction in EPS resulted in an equivalent reduc-
tion in the hydraulic cake resistance. It has also been suggested that EPS surrounding the cells
plays an important role in binding the cells in the cake layer (Hodgson et al., 1993; Li et al., 2003).
Finally, according to Meng et al. (2006), the increase of the dynamic viscosity of the mixed liquor
was caused again by the accumulation of EPS. Those substances can be subdivided into two
categories: bound EPS (sheaths, capsular polymers, condensed gel, loosely bound polymers
and attached organic material) and soluble EPS (soluble macromolecules, colloids and slimes).
The bound and soluble EPS include bacterially produced polymers, lysis products and hydrol-
ysis products (Nuengjamnong et al., 2005); soluble EPS is biodegradable and a product of the
dissolution of bound EPS; bound EPS is dissolved/hydrolysed by bacterial hydrolases. Nueng-
jamnong et al. (2005) demonstrated that EPS concentration increased with decreasing SRT, and
that the higher EPS amount at 8 days SRT resulted in greater specific cake resistance.62

Chapter 2. LITERATURE REVIEW
One way to divide EPS is related to the origin of EPS: utilization associated products (UAP)
associated with substrate metabolism and biomass growth and biomass associated products
(BAP) which come from cell lysis (Morgan et al., 1990; Frolund et al., 1996; Aquino and Stuckey,
2004). Nagaoka et al. (2001) studied EPS formation under intermittent feeding conditions in
aerobic systems (continuous feed vs. alternating feed/no feed) and concluded that BAP, which is
formed primarily under severe substrate limitations, has a higher fouling potential than substrate
utilization associated products.
Barker and Stuckey (1999) reviewed the literature and found that the following factors were be-
lieved to cause SMP production: concentration equilibrium across the cell membrane, starvation,
presence of an energy source, substrate-accelerated death, unavailability of a required nutrient,
relieving environmental stress, normal bacterial growth and metabolism. Other factors such as
feed strength, organic loading rate (OLR), hydraulic retention time (HRT), cell retention time and
temperature are also believed to affect SMP production.
Aquino (2004) showed that part of the SMP with high molecular weights (MW ≥ 10 kDa) is
likely to be cell wall fragments, internal cellular structures, proteins and nucleic acids. Such
biopolymers are believed to originate from different sources:(1) biological synthesis and excre-
tion and (2) lysis of bacterial cells, and also from the adsorption of organic matter, e.g. cellulose
and humic acids (Urbain et al., 1993), on flock surfaces (Morgan et al., 1990). In the SAMBR,
SMPs with low MW were found to be the major fraction of the effluent (Hu, 2004) and more
generally, SMP production increased when high VFA concentrations occurred after the HRT was
decreased, i.e. under shock loading.
2.4.4.3 Colloids: Colloids cover a wide size range, from a few nanometers to a few microm-
eters. They comprise clay minerals, colloidal silica, iron aluminium, and manganese oxides,
organic colloids and suspended matter, and calcium carbonate precipitates (Mahvi and Razavi,
2005; Boussu et al., 2006). They often carry electrical charges on their surface which in the case
of clay particles is negative. In fouling tests with a distillery waste, Choo and Lee (1996a) have
found that the final flux rate was independent of the material or pore size of the membrane used,
although a slight difference in the flux decline profiles was observed. A detailed analysis of the
fouling revealed that fine colloids were responsible for 80% of the total resistance, although they
accounted for only 5% of the total solids. It was found that colloids are rich in carbohydrates,
amino sugars and nitrogen (Amy, 2008).
2.4.4.4 Struvite Precipitation: Struvite is an inorganic precipitate with the chemical formula:
MgNH4PO4.6H2O. It has been reported by several investigators as playing a key role in flux
decline (Choo and Lee, 1996b; Kang et al., 2002). Kang et al. (2002) report that struvite was
found to have accumulated inside the pores of a zirconia skinned inorganic membrane and not
in an organic polypropylene membrane. Choo and Lee (1996b) also found that struvite plays
a significant role in the consolidation of biomass cakes on the membrane surface. Struvite is
expected to be a problem in MBRs treating MSW or the leachate because it contains all the
63

Chapter 2. LITERATURE REVIEW
elements required to form struvite. Struvite precipitation is also facilitated when pH increases,
and as a result acidic solutions are required to dissolve the inorganic foulant (Kang et al., 2002).
2.4.4.5 Membrane Material: The hydrophobicity of the membrane is thought to have an influ-
ence on membrane fouling as colloids generally have a negative charge. As a result, negatively
charged membranes can have less permeate flux decline than neutral or positively charged
membranes (He et al., 2005b). However, after a short while, the membrane surface becomes
coated and this surface is what is ”seen” by the organics in solution. Li et al. (2003) also ob-
served that the cake layer acted as a second dynamic membrane and that cake formation offered
the highest hydraulic resistance to permeation.
Relevant membrane properties include porosity characteristics, surface charge, hydrophilic-
ity/phobicity and rugosity. He et al. (2005b) investigated the influence of pore sizes with four
polyethersulfone UF membranes on fouling in a cross-flow mode. They observed that the mem-
brane with the greatest pore size had the highest rugosity which resulted in the highest flux
decline. Scanning electron microscope micrographs revealed that the ”valleys” on the mem-
brane surface provided many filling-in points to build up a fouling layer. For the same reason, the
hydraulic and chemical cleaning were more difficult with that membrane. Kang et al. (2002) also
observed a cake layer on a rough and fibrous polypropylene membrane and not on a smooth
inorganic membrane.
2.4.4.6 Biomass Concentration: A high biomass concentration can be obtained in a MBR be-
cause the microorganisms are rejected by the membrane, and this in turn leads to a better quality
effluent (Holler and Trosch, 2001). Al-Malack (2006) found a COD removal efficiency increas-
ing from 80 to 98% with biomass concentrations of 3, 5, 10 and 15 g.l-1. In other words, the
COD removal efficiency increased with an increase in the biomass concentration. Nonetheless,
Barker et al. (1999) found that an increased biomass concentration led to an increase in SMP
production. This has been confirmed more recently by Hu (2004) in a SAMBR using Kubota
membranes. Even with a gas backwashing strategy, the reactor loaded with 35 g.l-1 exhibited a
quicker rise in TMP as well as a final TMP three times higher compared to the reactor loaded
with 7 g.l-1; this clearly indicates that the additional fouling was due to the extra biomass. The
general consensus among the existing studies is that membrane fouling increases with increas-
ing MLSS concentration. However, some studies reported that fouling was independent of MLSS
until a certain value was reached: 30 - 40 g.l-1 (Yamamoto et al., 1989), 40 g.l-1 (Ross et al.,
1990), 3.6 - 8.4 g.l-1 (Hong et al., 2002). It is also likely that high biomass concentrations will
result in higher viscosity, and this is likely to have detrimental effect on flux and TMP (Barker et
al., 1999). This concentration can be as high as 39,000 mg/l (Al-Malack, 2006). Jeison and Van
Lier (2007) operated a SAMBR at 35,000 mg/L and reported a critical flux of 15 LMH. In addition
to biomass, the particulate matter present in the wastewater can also affect the flux. In a study
by Nghiem et al. (2006), fouling was found to increase linearly with organic matter concentration,
while the presence of a small amount of calcium may enhance fouling significantly.
64

Chapter 2. LITERATURE REVIEW
2.4.4.7 Consequences of Fouling: Stephenson et al. (2000) stated that most studies in the lit-
erature showed that the concentration of Soluble COD was consistently two or three times higher
in the reactor than observed in the effluent due to the rejection of COD by the membrane. This
has been reconfirmed recently by Hu (2004). This indicated that a large amount of dissolved
COD was retained by the thin polarization layer on the membrane surface, thus enhancing the
effluent quality substantially. Another observation is that the formation of this thin and porous
layer occurs as soon as the experiment starts. It should be highlighted that SMP constituted from
80 to 85% of the soluble effluent COD, dictating the effluent quality (Hu, 2004). Interestingly, sev-
eral researchers (Choo and Lee, 1996a; Hu, 2004) found that the cake layer acted as a second
dynamic membrane and led to a greater rejection of volatile fatty acids, but this phenomenon is
still not clearly understood.
2.4.4.8 Fouling Amelioration: Fouling can be reduced in various ways:
1. chemical cleaning of the membrane (this method requires the use of chemicals);
2. reduction of the flux below the critical flux (the critical flux is defined as the maximum sus-
tainable flux so that there is no colloidal deposition on the membrane). Colloidal deposition
is often responsible for irreversible fouling, i.e. the initial flux can not be recovered by sim-
ple cleaning methods (relaxation). When operating above the critical flux a cake layer is
not only formed, but the cake is also compacted which makes it hard to remove by sim-
ple techniques. At the critical flux, the rate of particle convection toward the membrane
surface is balanced by the rate of back transport. Hence, during sub-critical flux opera-
tion, particulate fouling should not occur with respect to time (Field et al., 1995; Cho and
Fane, 2002); in these conditions both TMP and flux remain constant (Howell, 1995). With
long-term operation, however, there will be local fouling so that the critical flux can be de-
fined as the highest flux for which TMP increases remains stable (Le-Clech et al., 2003).
When the TMP is no longer stable at each flux step and increases rapidly to indicate rapid
accumulation of foulants, this is usually referred to as the critical flux;
3. promotion of turbulence to break the hydrodynamic boundary layer, e.g. by gas sparg-
ing. Gas sparging consists of gently diffusing gas below the membrane so that the bub-
bles scour the membrane surface. It produces gentle mixing that promotes turbulence in
order to minimize the boundary layer responsible for the concentration polarisation phe-
nomenon. Several researchers have observed fouling minimization by gas sparging (Hong
et al., 2002; Li et al., 2005);
4. physical method; for instance, relaxation, liquid or gas backflushing, gas sparging;
5. addition of activated carbon to adsorb the colloids responsible for fouling. This has several
beneficial effects (Kim et al., 1998; Tsai et al., 2005): (i) PAC has an adsorptive affinity for
the removal of biologically resistant compounds; (ii) it provides an excellent surface for the
attachment of microorganisms; (iii) it reduces the effects of fluctuating loading of hazardous
chemical compounds; (iv) a turbulent flow regime in conjunction with the dynamic motion of65

Chapter 2. LITERATURE REVIEW
the incompressible PAC particles helps in depolarizing the membrane surface by promoting
back-diffusion; and (v) it increases the economic viability of the technology by controlling
permeate flux deterioration attributed to membrane fouling and concentration polarization.
The following paragraphs describe these methods.
Several researchers have observed fouling minimization by gas sparging (Hong et al., 2002; Li et
al., 2005) and other turbulence promoting techniques such as gas/liquid slug flow (Mercier-Bonin
et al., 2001) or polymeric particles (Imasaka et al., 1989).
With a synthetic low strength wastewater as feed for an anaerobic submerged membrane biore-
actor, Hu (2004) has shown that gas should be sparged as soon as there is a flux applied through
a Kubota membrane with 0.4 micron pore size. Otherwise, if the flux is too high, the cake will
be consolidated and the gas sparging will be inefficient to remove the cake. He also showed
that the TMP was minimal (0.1 bar) with the highest gas flowrate (15 LPM). It turned out that
this flowrate caused a cake with bigger particles than at lower flowrate, indicating that the small-
est particles produced at lower flowrates were responsible for the fouling and thus the increase
in TMP. Unfortunately, this flowrate was high enough to generate foam within the MBR, which
rendered the level control unit unreliable.
When using a Zenon hollow-fiber membrane with the same surface area and pore size, the TMP
was also smaller (0.05 bar) at higher sparging rates (10 LPM). With these membranes the slug
bubbles from the sparger created a shearing effect as well as a vigorous vibrating of the fibres,
which contributes to fouling control. Gas sparging is only effective up to a limit, i.e. there are
some forms of fouling that are resistant to gas sparging (Hong et al., 2002; Hu, 2004; Li et al.,
2005).
Relaxation is obtained by turning off the suction pump. Non continuous membrane operation has
been reported to significantly improve membrane productivity (Hong et al., 2002). This obser-
vation can be explained by the enhanced back transport of foulants under pressure relaxation.
During non-suction periods, the foulants not irreversibly attached to the membrane surface, dif-
fuse away from the membrane because of the concentration gradient. Furthermore, the effec-
tiveness of air scouring is greatly enhanced in the absence of transmembrane suction pressure,
resulting in a higher removal of foulants accumulated on the surface (Hong et al., 2002). The
effect of relaxation on a Kubota membrane fouling was not as substantial as a rise in TMP for
eight minutes ”on” followed by two minutes ”off” (Hu, 2004) with a critical flux equal to 17.5 LMH.
Permeate backwashing was somewhat more efficient but still gave rise to an increase in TMP.
Nevertheless, backwashing efficiency depends on the permeate pressure and this was limited
to 25 ml.min-1 in Hu’s work. It was found that the longer the backwashing period, the later the
TMP started to increase and after a certain time, backwashing could no longer remove foulants
(Hu, 2004), which has also been observed by Kuberkar et al. (1998). A long backwashing time
reduces the performance of the MBR because too much permeate loss will result. It has also
been postulated that backwashing could be responsible for the deposition of a layer on the back-
side of the membrane by compounds present in the permeate. This layer could also increase
the overall resistance of the membrane.66

Chapter 2. LITERATURE REVIEW
Another backflushing method consists in backwashing by means of gas. This method was much
more efficient than permeate backflushing with the Kubota membrane (Hu, 2004). The TMP was
around 0 bar for 4000 minutes of experiment when 12 minutes suction were followed by a six
minutes gas backwashing. The same result was obtained with the Zenon hollow fibres when gas
backwashing was used in conjunction with gas sparging at 10 LPM. However, the strategy was
twelve minutes suction followed by 6 minutes backwashing, which might not be economical in
a full-scale plant. In addition, the experiments were performed during 4000 minutes and there-
fore there is a lack of information concerning the long-term fouling. Finally, it should be pointed
out that the combination of sub-critical flux operation, the use of gas sparging and intermittent
gas backwashing was an effective method for fouling control with low strength synthetic wastew-
ater. This cleaning strategy might be completely inadequate with high-strength non-synthetic
wastewaters.
Powdered activated carbon (PAC) has been used in aerobic systems for wastewater treatment.
As fine colloids are responsible for a large fraction of the fouling (Choo and Lee, 1996a), it
has been suggested to promote the agglomeration of those particles using activated carbon.
PAC has been reported to increase COD removal by 22% and performed better than granular
activated carbon, probably due to the larger surface area of PAC (Hu, 2004). However, it is
not clear whether systems operating in the presence of PAC display less fouling because of
adsorption and flocculation of extractable EPS or because of a reduction in the excretion of EPS
from microorganisms (Kim et al., 1998).
Park et al. (1999) investigated the influence of PAC concentration on performance and found that
fouling decreased continuously with increasing PAC concentration up to 5 g.l-1. At 1.7 g PAC l-1,
Hu (2004) observed that the TMP was near 0 bar and steady with a sub-critical flux of 10 LMH. It
was suggested that PAC could have a scouring effect on the membrane. Unfortunately, a super-
critical flux of 20 LMH did not maintain the TMP around 0 and irreversible fouling occurred.
Studies on the use of activated carbon in anaerobic MBRs are scarce in the literature, and no
data was found concerning the concentration of PAC required to treat high-strength wastewaters.
Turbulent flow in conjunction with the dynamic motion of the incompressible PAC particles help
in depolarizing the membrane surface by promoting back-diffusion. Also, shock loads or toxic
concentrations of pollutants can be buffered as a result of their adsorption onto and diffusion into
the activated carbon particles. Systems operating in the presence of PAC display less fouling,
probably by adsorption and flocculation of extractable EPS. The lower EPS content might also
be caused by a reduction in the excretion of EPS from microorganisms (Kim et al., 1998).
2.4.5 Anaerobic Membrane Bioreactors for High Strength Wastewater and LeachateTreatment
COD removal efficiencies greater than 90% at a loading rate of 15 kg COD.m-3.d-1 have been
reported for a range of wastewaters treated with an anaerobic MBR (Stephenson et al., 2000),
and removal efficiency has also been shown to be reasonably stable over a wide range of loading
rates. For instance, Cadi et al. (1994) observed a decrease in COD removal of only 7% when the
loading rate increased from 7.7 to 24.2 kg COD.m-3.d-1. Typical HRTs range from 12 to 170 hours67

Chapter 2. LITERATURE REVIEW
depending on waste types. Anaerobic MBRs can therefore compete with traditional UASBs with
a typical OLR of 10 kg COD.m-3.d-1 and with expanded granular sludge bed reactor with a typical
design OLR of 20 kg COD.m-3.d-1 (Frankin, 2001). Fuchs et al. (2003) observed that a side-
stream anaerobic MBR treating high strength wastewater (9700 mg/L) can achieve more than
90% COD removal. For food wastewater (2 - 15 g COD/L), He et al. (2005b) reported 90%
COD removal at an OLR ≤ 2, and above 80% at an OLR between 2 and 4.5 kg COD.m-3.d-1,
while at an OLR ≥ 4.5, the removal rate dropped sharply. These low OLRs are presumably
due to the sidestream configuration that can cause shearing of the methanogenic granules and
results in lower activity. In a SAMBR, more than 90% COD removal was reported with high
strength brewery synthetic feed (20 g COD/L) at 20 hours HRT and 1.5-2 LMH (Akram, 2006).
Furthermore, 6 hours HRT was possible with the use of powered activated carbon.
Zayen et al. (2008) investigated the treatment of landfill leachate in an anaerobic sidestream
MBR, and a COD removal of 90% was achieved at a maximum OLR of 6.3 kg COD.m-3.d-1
and at 7 days HRT. The maximum flux through the ultrafiltration membrane was only 2.5 LMH.
Kurniawan et al. (2006a) obtained a TOC removal greater than 90% and a permeate flux of 24
LMH, but it dropped to 7 LMH after 20 hours using tubular ultrafiltration and PAC to treat landfill
leachate (≈ 3 g COD/L) in an aerated MBR. Rautenbach and Mellis (1994) also observed a flux
drop from 27 to 7 LMH in 50 days operation with a spiral wound nanofiltration module external to
an anaerobic MBR treating landfill leachate with a moderate strength of 1 to 4 g COD/L. Van Zyl
et al. (2007) operated a SAMBR at 17 hours HRT and OLR of 25 kg COD.m-3.d-1 and achieved
98% COD removal. The mixed liquor concentration was superior to 30 g TSS/L and flux through
the Kubota membrane was 2-3 LMH.
Anaerobic digestion of organic solids is also characterized by particulate COD which gener-
ates wastewater with a very high organic content. Some authors have treated wastewater with
high suspended solids concentrations. OLRs of 3-5 kg COD.m-3.d-1 were achieved with COD
removals of 80% or higher. For instance, Kimura (1991) has treated pulp and paper effluent
containing 15 g/L of TSS in the feed. Hogetsu et al. (1992) have treated wool scouring wastew-
ater containing 30.5 g/L of TSS of which 33% were biodegraded. A deterioration in the flux
was, however, observed for the first 40 days of operation from 37 to 23 LMH which then gradu-
ally decreased to 17 LMH after 210 days of service. Pig manures with 20 g/L total solids were
treated with more than 90% COD removal (Norddahl and Rohold, 2000). Particulate cellulose
has been treated in a UASB fitted with a cross-flow UF membrane, and there was no tendency
for cellulose to accumulate in the reactor at 2 days HRT and OLR of 2.5 kg COD.m-3.d-1 of which
50% was particulate COD (Harada et al., 1995). A COD removal of 98% could be maintained
and the flux decreased significantly but remained in the range 21-42 LMH due to frequent wash-
ings an replacement of membrane every 40-50 days of operation. Although the feed was non
refractory (cellulose and skimmilk 1:1), a build up in SCOD, namely to 1200 mg/l was observed
in the bulk of the reactor and this was attributed to SMPs released by bacteria and were refrac-
tory. These contributed to flux decline but did not appear in the permeate. Interestingly, due to
the long SRT, the net growth rate balanced with the autolysis, resulting in no apparent increase
in MLVSS. Moreover, it appears from Table 2.12 that side-stream configurations achieve higher
68

Chapter 2. LITERATURE REVIEW
fluxes because of the higher crossflow velocities, but this is often associated with lower OLR due
to a detrimental effect of the recirculation pump on methanogenic activity. For instance, after 60
days the OLR of 7.4 g COD/L.day has overloaded the process treating chicken slaughterhouse
effluent with a crossflow microfiltration unit (Fuchs et al., 2003). The flux for a submerged MBR
treating leachate is normally in the range 5 - 10 LMH (Robinson, 2005).
2.5 PHYSICO-CHEMICAL TREATMENT OF STABILISED LEACHATE
2.5.1 Introduction
Landfill leachate is a complex wastewater with considerable variations in both composition and
volumetric flow. The composition and concentration of contaminants are influenced by the type
of wastes deposited, by hydrogeological factors and mainly by the age of the landfill. In general
the leachate is highly contaminated with organic contaminants measured as chemical oxygen
demand (COD) and biological oxygen demand (BOD), with ammonia, halogenated compounds
and heavy metals and is thus toxic to the environment (Gotvajn et al., 2009). In addition, leachate
usually contains high concentrations of inorganic salts. Humic substances constitute an impor-
tant group of leachate organic matter. These substances are refractory anionic macromolecules
of moderate (1000 Da MW- fulvic acids) to high (10,000Da MW- humic acids) molecular weight
and they are the major contributors of residual COD of stabilised leachate (Wang et al., 2006b).
They contain both aromatic and aliphatic components with primarily carboxylic and phenolic
functional groups. Carboxylic functional groups account for 60 - 90% of all functional groups
(Hong and Elimelech, 1997). Alone humic acids in landfill leachates are just a COD and colour
problem but if it is discharged to conventional treatment processes like chlorination, carcinogenic
by-products like trihalomethane and haloacetic acid are formed (Lowe and Hossain, 2008).
In most cases, the first step of plants treating leachate is a biological process for ammonia,
COD, and BOD removal (Kurniawan et al., 2006b; Gotvajn et al., 2009). Biological processes
are effective for recent leachates containing mainly volatile fatty acids, but less so for stabilised
leachate. In most cases, stabilised leachate from the biological stage still shows high COD
values, because the 500-1000 molecular weight fulvic-like fraction increases with landfill age
(Chian, 1977), and after a biological treatment. This is due to the fact that stabilised leachates
bear a lower COD load than those from recent parts, but contain a higher concentration of refrac-
tory organic matter (Trebouet et al., 2001). According to experiments conducted by Bohdziewicz
et al. (2008), the ratio of BOD/COD for all investigated samples had a low value between 0.1
and 0.4, which means that the leachate was resistant to biodegradation, and the contaminants
cannot easily be neutralized using the activated sludge method. Usually, leachate is disposed of
in three ways (Robinson, 2005):
1. To sewer: where there is likely to be a restriction on ammonia and COD concentrations,
and inorganic compounds (Bohdziewicz et al., 2001; Gotvajn et al., 2009).
2. To a river: where there will more than likely be limits for BOD, COD, and suspended solids.
In many cases, there will also be a limit in chloride concentration level and perhaps nitrates.69

Ch
ap
ter
2.
LIT
ER
AT
UR
ER
EV
IEW
Ta
ble
2.1
2:
An
ae
rob
icM
em
bra
ne
Bio
rea
cto
rsfo
rh
igh
-stre
ng
thw
as
tew
ate
r/lea
ch
ate
.
Reference Membrane Wastewater Operational parameters Process performancesConfiguration
HRT MLTSS OLR Flux SGP CH4 COD rem.
Lab and Bench scale (gCOD/L) [days] [g/L]h
g COD
L.day
i
ˆ
L
m2.hr
˜
h
Lbiogas
g COD
i
[%] [%]
(Bohdziewicz et al., 2008) HF, MF, S(M) 10% Leachate 2 10 2.5 0.35-0.45 70 90(2.8-5)
(Jeison and van Lier, 2008) T, MF, S(T) VFAs (10) 8 hrs 35 30 7 98
(Akram, 2006) FS, MF, S(M) brewery (20) 20 hrs 12 24 1.5-4 98
(Abdullah et al., 2005) T, UF, SS(M) sewage (78) 7.8 21.8 10 6.9 66 95
(Kang et al., 2002) T, MF, SS(T) distillery (38.4) 13 2 3-3.5 105 95
(He et al., 2005b) FS, UF, SS(M) food (2-15) 60hrs 6-8 4.5 15.6 0.136 81-94
(Fuchs et al., 2003) T, MF, SS(M) Chicken 1.2 22 4.3 5-10 0.12-0.32 - 90slaughterhouse (CH4)(5.8-20.2)
(Choo and Lee, 1998) FS, UF, SS(T) Distillery(34.9) 23 3.2 1.5 10 - - 92
(Harada et al., 1995) FS, UF, SS(M) Cellulose(5) 2 16 (VSS) 2.5 21-42 0.48 80 98
Pilot and Full-scale
(Hogetsu et al., 1992) UF(M) Wool scouring 6.8 - 15 17 - 50(102.4)
(Kimura, 1991) FB, - (-) Pulp and paper - - - - - - 96(28)
(Norddahl and Rohold, 2000) T, UF (M) Pig Manure(30) 10 - 3 5 0.27-0.33 76 92
HF = Hollow Fibers; FS = Flat Sheet; T = Tubular; UF = Ultrafiltration; MF = Microfiltration; S = Submerged;SS = Sidestream; M = Mesophilic; T = Thermophilic; - = not reported; FB = Fluidized Bed
70

Chapter 2. LITERATURE REVIEW
3. By road tanker to alternative treatment sites. The charge for that disposal route is however
a deterrent (£12-18/m3).
Various physico-chemical methods, including adsorption, precipitation, oxidation, evaporation
and membrane filtration or combination of processes have been applied to remove COD from
leachate (Kurniawan et al., 2006b). Membrane filtration usually produces high quality effluent
using reverse osmosis but is very expensive. Nevertheless, Trebouet et al. (2001) have shown
that high pollutant removals can be achieved using nanofiltration especially in the case of old
leachates. Nanofiltration can run at lower pressures than reverse osmosis and therefore has
lower operating costs and less membrane fouling. Leachate has to be treated before being
discharged to enhance leachate stability (Robinson, 2005).
Biological treatment may not be able to achieve the permitted maximum COD levels for direct
or indirect discharge due to recalcitrant characteristics of organic carbon in the leachate (Chris-
tensen et al., 1992). As a result, the search for other effective and efficient technologies for the
treatment of stabilised landfill leachate has intensified in recent years.
2.5.2 Activated Carbon
Activated carbon adsorption is most commonly used for the removal of recalcitrant organic matter
from landfill leachate (Kurniawan et al., 2006b). It is basically a mass transfer process where a
substance is transferred from a liquid to a solid phase and becomes bound by physical or chem-
ical interactions. Due to its inherent properties which include large surface area, micro-porous
structure, high adsorption capacity, and surface reactivity, adsorption using granular activated
carbon (GAC) or powdered activated carbon (PAC) has been receiving considerable attention
for the removal of organic and inorganic pollutants from contaminated waste water.
In Greece, the adsorption of organic compounds from stabilised leachate was studied using 6 g/l
of PAC (Diamadopoulos, 1994), and about 95% COD with an initial concentration of 5700 mg/l
was removed. The Freundlich isotherm was found to be applicable for adsorption equilibrium,
thus suggesting that multilayer adsorption occurred on the surface of PAC. Gotvajn et al. (2009)
observed a 40% removal of organics from a tannery landfill leachate using 10 g/l of GAC, and
mainly non-biodegradable compounds were removed as the BOD/COD ratio increased after
GAC treatment; however, GAC could not remove chloride from leachate.
Generally activated carbon is effective for the removal of non biodegradable compounds from
leachate, but not ammonia. More than 90% of the COD can be removed with concentrations
ranging from 940-7,000 mg/l (Kurniawan et al., 2006b). However, the need for constant regen-
eration of the activated carbon column and the high cost of GAC may limit its application for the
treatment of landfill leachate in developing countries.
2.5.3 Coagulation-Flocculation
Coagulation destabilizes colloidal particles by the addition of a coagulant to increase the size of
the particle. Coagulation is followed by flocculation of unstable particles into bulky flocks so that71

Chapter 2. LITERATURE REVIEW
they can settle more easily; this technique facilitates the removal of suspended solids and colloid
particles from a solution. Overall, it is found that coagulation-flocculation techniques using iron
chloride are effective for the removal of organic compounds and heavy metals.
Coagulation-flocculation is an essential process to remove Refractory Organic Substances (ROS)
in wastewater treatment, either as a pretreatment before a biological step (Tatsi et al., 2003), or
as a final polishing treatment step (Ntampou et al., 2006). The negative charge of colloids, such
as that of dissolved humic acids, can react chemically with Fe (III) salts, forming Fe-humic acid
precipitates. At an appropriate iron to humic ratio, the negative charge of the humic molecules
is neutralized and settleable flocs are produced, depending on the pH and iron dosage. The ef-
fect of pH on coagulation-flocculation may be considered as a balance between two competitive
forces (Zhang and Wang, 2008): (i) between H+ and Fe3+ for interactions with organics ligands,
and (ii) between OH− and organic anions for interactions with Fe3+. At very low pHs, H+ out-
competes Fe3+ for organic ligands (Stephenson and Duff, 1996). As a result, some organic
acids do not precipitate resulting in low removal rates, and besides the residual soluble iron re-
mains high. At higher pHs, OH− compete with organic compounds for iron adsorption sites, and
precipitation of iron hydroxides occurs, mainly by co-precipitation. As a result, the soluble iron is
mainly in the form of Fe(OH)3 and the concentration of residual iron increases with pH (Zhang
and Wang, 2008).
Ntampou et al. (2006) have investigated the coagulation of leachate samples by the addition
of ferric chloride. Maximum COD removal rates (up to 72%) were achieved by the addition of
7 mM Fe which is equivalent to 1135 mg FeCl3/L. However, final COD values higher than 200
mg/L were obtained indicating the requirement of an additional treatment step. Aziz et al. (2007)
obtained 27% and 51% COD removal at FeCl3 doses of 200 and 1200 mg/L, respectively. More-
over, removals were better at pH 4 compared to pHs 6 and 12. Gotvajn et al. (2009) reached
25% COD removal at 1g/l of Al2(SO4)3, but efficiency dropped above 1g/l. This highlights the
better results at higher dosages, but performance decreases beyond a certain point due to parti-
cle restabilization (Yan et al., 2007). With FeCl3, the best results were 34% COD removal at pH6
and 1g/l. Above that concentration, an orange colour indicated a high ferric concentration. The
addition of 2.5 mg/l of polyelectrolyte increased the efficiency to 51%, but higher concentrations
were not effective. Zhang and Wang (2008) also observed better results at acidic pHs. The
optimum pH for iron chloride was found to be 5 which yielded a DOC removal of 52% at 4 g
FeCl3/L. When the pH was not adjusted (i.e. in the range 7.4-7.8), the removal was only 22%
at 5 g FeCl3/L. Previous studies show that COD removals are higher at higher dosages up to a
certain level, and acidic pH in the range 4-6. Adjustment of pH is usually made with HCl down
to the desired pH, but the subsequent addition of FeCl3 or Al2(SO4)3 can also further lower the
pH (Zhang and Wang, 2008; Gotvajn et al., 2009), which suggests that the pHs given in the
literature are indicative but not accurate.
When compared with aluminium sulphate, given similar doses (35 mM of Fe or Al) with an initial
COD concentration of 4100 mg/l, ferric chloride was found to give higher removal of organic
compounds (55%) than aluminum sulphate (42%) (Amokrane et al., 1997). From the literature,
the optimum coagulation-flocculation is obtained with iron chloride (1 - 4.8 g/l) under controlled72

Chapter 2. LITERATURE REVIEW
acidic pH (4-6). Under these conditions, the treatment gives 50 - 60% COD removal (Millot et
al., 1987; Trebouet et al., 2001). Moreover, organic matter after coagulation mainly consists of
low molecular weight (MW) compounds (Trebouet et al., 2001). Stabilised leachate coagulation
with FeCl3 eliminates all high MW compounds (≥ 5 kDa) but does not trap compounds with a
lower molecular weight (Chian, 1977). Unfortunately, the coagulation-flocculation of stabilised
leachate does not allow it to meet the discharge levels which means that another treatment is
often required. Polyelectrolytes can be added during the coagulation process to obtain higher
sedimentation rates, better water quality and lower sludge volume produced (Mahvi and Razavi,
2005). These are usually used at low dosage (max. 10 mg/l) because the residues in water may
be a health hazard. Cationic polymers are used as primary coagulants, whereas nonionic and
anionic polymers are used as coagulants aids. Mahvi and Razavi (2005) achieved over 90%
turbidity removal at dosage of 0.1 mg/L of an anionic polyelectrolyte.
2.5.4 Ultrafiltration (UF)
Due to the unique differences between ultra-filtration (UF) and reverse osmosis (RO) mem-
branes, UF has found a place in the removal of recalcitrant organic compounds and heavy metals
from landfill leachate. This treatment process has the ability to remove solutes with a molecular
weight range of 10,000-100,000, as well as inorganic substances through electrostatic interac-
tions between the ions and membranes. The significance of this membrane lies in its surface
charges which allow charged solutes smaller than the membrane pores to be rejected, along
with bigger neutral solutes and salts. Bohdziewicz et al. (2001) obtained 52% COD rejection
using UF, while Trebouet et al. (2001) found that at least nanofiltration is required to eliminate
ROS and obtain CODs lower than the requirements for discharge.
2.5.5 Ion Exchange Resins
This is a reversible interchange of ions between the solid and liquid phases where there is
no permanent change in the structure of the solid. Leachate should be treated biologically
prior to the application of ion exchange (Kurniawan et al., 2006b). It is highly effective for the
removal of non biodegradable compounds that contain humic substances, and in a study carried
out by Rodriguez et al. (2004), the removal of humic substances from stabilised leachate was
evaluated using ion exchange resins such as Amberlite XAD-8, XAD-4, and Amberlite IR-120
and granular activated carbon adsorption. GAC was found to achieve the highest removal of
COD (93%), followed by Amberlite XAD-8 (53%), XAD-4 (46%) and IR-120 (31%) at an initial
COD concentration of 1300 mg/l. The synthetic resins gave low COD removal due to the effect
of binding site competition with heavy metals from the leachate.
2.6 SUMMARY OF LITERATURE REVIEW
The OFMSW is a complex waste that includes cellulose, hemicellulose and lignin. Lignin is not
anaerobically degradable and forms a three-dimensional complex structure with cellulose and73

Chapter 2. LITERATURE REVIEW
hemicellulose, which renders these compounds less available to microorganisms. The percent-
age of lignin, and thus the biodegradability, depends on the proportion of paper and garden
waste and can vary widely. Nonetheless, many researchers have obtained methane yields in
the range 0.18 - 0.25 L CH4 STP/ g VS (Owens and Chynoweth, 1993; Chynoweth et al., 1993;
Chugh et al., 1999; Silvey et al., 2000). The anaerobic digestion of the OFMSW would be an an-
swer to the more and more severe legislation concerning landfilling. However, there is room for
improvement because digester technology for high solids waste has basically followed the con-
ventional approach used for sewage sludge digestion over the last 50 years. The result is that
the market is currently dominated (over 90%) by single tank designs (Vandevivere et al., 2003)
aimed at promoting good mixing. This approach has not adapted because the rate-limiting step
is the hydrolysis of the OFMSW, and very long HRTs are thus required, even at low loading rates.
The AD process is highly efficient in achieving COD removal, but removal depends on: biodegrad-
ability of organic materials, total solids content, temperature, alkalinity, the HRT and SRT, nutrient
supplementation, pH, ammonia accumulation and effluent recirculation. The efficiency will also
be positively affected if a pretreatment (aerobic, chemical, mechanical, enzymatic) has been
applied. The AD of the OFMSW in two reactors has been reported to be more stable than in
one (Massey and Pohland, 1978; Zoetemeyer et al., 1982a; O’Keefe et al., 1996; Vieitez and
Ghosh, 1999) because of the buffering of the OLR allowing a constant feed to the methanogenic
reactor (Pavan et al., 2000a; Pavan et al., 2000b; Vandevivere et al., 2003). When the feed
is highly variable in quality or quantity, a phase separation is also recommended because acid
production is not affected by feed concentration over a wide range, and the acid-forming bacteria
grow well at pH 5 (Eastman and Ferguson, 1981). It is also recommended to use two phases for
substrates with low natural buffering capacity such as a mixture of paper and wood (Banks and
Humphreys, 1998). VS removals of 50 - 70% are common for the OFMSW and these results are
typically achieved at HRTs between 15 and 25 days and OLRs between 6 and 12 g VS/L.day.
Full-scale plants generally operate at 5 - 8 g VS/L.day, and achieve around 55% VS removal at
similar HRTs (Gallert and Winter, 1997). Removals greater than 70% were found to be possible
at thermophilic temperatures and/or at OLRs below 4 g VS/L.day. VS destruction is also ex-
pected to be greater than 70% if the feedstock has been source-sorted which provides a higher
organic content, or if the feedstock consists of fruits and vegetables. However, for the second
stage treating the leachate, HRT as low as 2 days have been reported in an UASB (Anderson
and Saw, 1992). The COD removal in the second reactor is typically higher than 90% (Anderson
and Saw, 1992; He et al., 2005a).
A few studies mention the treatment of leachates in a membrane reactor where ultrafiltration
is used to prevent the blocking of RO membranes. Although these techniques are efficient in
terms of COD removal, they require high operating pressure. Permeate fluxes around 5 to
10 LMH were achieved with the ultrafiltration and nanofiltration of leachates (Rautenbach and
Mellis, 1994; Kurniawan et al., 2006a), but data are scarce for microfiltration under anaerobic
conditions and in presence of colloids and high molecular weight compounds. Side stream
anaerobic MBRs allowed greater permeate fluxes but these decline as cell lysis by shear from
the recirculation pump results in a loss of bacterial activity. To overcome these limitations, the
74

Chapter 2. LITERATURE REVIEW
feasibility and performance of a novel submerged anaerobic MBR has been examined where
the biogas is recirculated from the bottom of the reactor to provide large bubbles that scour
the flat sheet polypropylene membrane (0.4 microns). Past work with high strength wastewater
has shown that this SAMBR system can be operated at HRT as low as 20 hours and achieve
more than 90% COD removal (Akram, 2006). Although this reactor was found to be efficient
for high strength artificial wastewaters, no work has been done yet on actual wastewaters, nor
on leachates containing high molecular weight compounds. For this reason, the combination of
membranes and anaerobic bioreactors has drawn considerable attention due to their inherent
process advantages: they allow the uncoupling of HRT and SRT, retain the biomass within
the bioreactor, treat low strength wastewaters with high efficiency, achieve a stable removal
efficiency over a wide range of loading rates, and reduce land and operational costs by replacing
gravity sedimentation. Most studies have focused on the use of membranes to treat leachates,
but not to separate leachates from the OFMSW. In a hydrolytic reactor, the use of a membrane
will allow the recalcitrant compounds to be kept for a longer time within the reactor in order
to degrade them further. The proposed design of the HR for this study is novel because the
mechanical treatment is not a separate unit prior to the HR but is located within the reactor
itself as well as the filtration operation. Very little information is available on such a membrane
hydrolytic reactor that combines the hydrolysis of OFMSW and a filtration device together in one
unit; it is not known at which retention time this reactor can operate because it depends on the
permeate flux that the membrane can achieve.
2.7 OBJECTIVES OF THE STUDY
The aim of this thesis was to evaluate the feasibility of the degradation of OFMSW in a novel
2-phase anaerobic system. The system involves a hydrolytic reactor to solubilise the OFMSW
and promote the production of VFAs by acidogenic bacteria. A filter was used to retain the large
particles, allowing it to treat a higher loading than conventional CSTRs. The performance of
the HR was measured in terms of VS destruction and VFA yield, and stability under different
operating conditions. The effluent from the HR or leachate was treated in a SAMBR fitted with
a membrane allowing to retain the slow-growing methanogens. The performance of the SAMBR
was measured by methane production, COD and VFA removal efficiency and stability under
different operating conditions. More specific objectives were to:
• investigate the role of acetic acid in the chemical hydrolysis of the OFMSW;
• operate the HR in batch mode and benchmark its performance;
• operate the HR continuously at various SRT and HRTs in order to determine the minimum
SRT that provides satisfactory VS destruction along with a compliance with landfill accep-
tance criteria as a stabilised waste. In particular, respirometric tests and heavy metals
content will be carried out on the digestate withdrawn from the HR. The effect of ambient
temperature (20 ˚ C) on the HR performance will be investigated;
75

Chapter 2. LITERATURE REVIEW
• characterize the effluent of the HR: COD, VFA, molecular weight distribution, alkalinity;
• treat the effluent of the HR in a SAMBR and determine the effect of SRT and HRT on COD
removal, permeate flux and stability. The performance of the SAMBR will be assessed at
sub-mesophilic and psychrophilic temperatures in order to reduce further the operational
costs of the process;
• identify the main foulants of the membrane in the SAMBR;
• add an aerated MBR to treat the permeate of the SAMBR in order to study nitrification as
well as polishing performance in terms of COD removal;
• to apply Denaturing Gradient Gel Electrophoresis (DGGE) in order to study the evolution
of the archaeal and bacterial populations with the loading rate and compare the population
in the two reactors. Furthermore, the effect of SRT, HRT and lower temperatures on the
population of the HR and SAMBR will be investigated;
• characterize the effluent of the SAMBR: COD, VFA, MW distribution with size exclusion
chromatography, alkalinity and GC-MS analysis. Furthermore, adsorption and floccula-
tion/coagulation tests will be carried out with powdered activated carbon, iron chloride and
polymeric adsorbents in order to gain more understanding in the properties of leachate
constituents.
76

Chapter 3
MATERIALS AND METHODS
3.1 EXPERIMENTAL SETUP
3.1.1 Hydrolytic Reactor
Figure 3.1: 3-D view of the hydrolytic reactor and stirrer.
The hydrolytic reactor is a 20 liter cylinder made of acrylic sheet; a stainless steel mesh follows a
concentric arrangement inside the cylinder and has a grid of 1mm square holes. A stirrer moves
inside the mesh allowing two pieces of rubber to rub against it. Figure 3.1 shows the reactor and
the stirrer. The reactor is wrapped in a copper coil in which hot water is circulated and glass fiber
is used to cover the coil so that the reactor internal temperature is maintained at 35 ± 1 ˚ C. The
stirrer speed is set at 64 rpm.
3.1.2 Methanogenic Reactor
A schematic diagram of the experimental set up used for this study is shown in Figure 3.2. Each
submerged anaerobic membrane bioreactor (SAMBR) has a working volume of 3 litres, and is
made of acrylic panels. Each reactor contains a standing baffle designed to direct the fluid to
the upcomer and downcomer regimes. The reactors were maintained at 35 ± 1 ˚ C, and the
biomass was continuously mixed using headspace biogas that was pumped (Charles Austen
Pumps, Model B100SEC) through a stainless steel tube diffuser to generate coarse bubbles.
The bubbles push the sludge flow upward between the membrane module and the reactor wall
77

Chapter 3. MATERIALS AND METHODS
in the upper section. A flask (500 mL) was placed before the biogas pump in order to collect any
sludge going to the gas line due to excessive foaming or excess of liquid in the reactor so that
the biogas pump was protected against any liquid that could harm the mechanism.
Figure 3.2: Schematic diagram of the Submerged Anaerobic Membrane Bioreactor.
The sparging rate was controlled by a gas flowmeter (2 - 20 LPM, ColeParmer, USA) to minimise
membrane fouling. A data logging system (USB-1408FS, Measurement computing) was used to
monitor transmembrane pressure (PMP1400,1Bar A, Druck), and permeate flow rates (13 - 100
mL/min, Flow Sensor Ryton Sensor , McMillan). The membrane module (Kubota) had 0.1 m2 of
total surface area with a pore size of 0.4 micron. The membrane panel was comprised of a solid
acrylonitrile butadiene styrene support plate (5 mm thick) with a spacer layer between it, and a
welded flat sheet membrane, which was made of polyethylene, on both side. The membrane was
coated with a special chemical (10%w ethanol) to give a hydrophilic surface to the membrane.
3.2 ANALYTICAL METHODS
3.2.1 pH
pH was measured using a calibrated pH meter (Jenway, Model 3020). Values obtained were
accurate to within ±0.02 units.
3.2.2 Oxido-Reduction Potential
The oxido-reduction potential (ORP) was measured with a platinum-band ORP electrode (Cole-
Palmer, USA) connected to a Jenway 3020 pH meter. Values obtained were accurate to within
± 3 mV.
78

Chapter 3. MATERIALS AND METHODS
3.2.3 Biogas Composition and Production Rate
The composition of biogas was determined using a Shimadzu GC-TCD fitted with a Porapak
N column (1500 × 6.35 mm). The carrier gas was Helium set at a flow rate of 50 ml/min. The
column, detector and injector temperature were 28, 38 and 128 ˚ C, respectively. The peak areas
were calculated and printed out on a Shimazdu Chromatopac C-R6A integrator. Samples of 1 ml
were collected using 1 ml plastic syringes (Terumo). The coefficient of variation for 10 identical
samples was ± 2%.
In the HR, the gas production rate was measured using Tedlar bags connected on the top. To
empty the Tedlar bag, it was connected to the top of a column full of water. A valve at the
bottom of the column was then opened to let the water drain into a collection vessel as the gas
filled the column. The water stopped running when the Tedlar bag was empty which enabled
the volume of biogas produced to be measured. The percentage of methane was analyzed by
taking a sample at the top of the column. As this method measures a volume of gas that is
expanded due to sucking by water flowing down by gravity, the volume must be corrected using
the equation provided in Appendix B.
In the SAMBR, the gas production rate was measured using the water displacement method
with cylinders filled with water acidified with 2% (v/v) H2SO4 and 10% (w/v) NaCl according to
Agdag and Sponza (2007). The top of the SAMBR was connected to the top of the cylinders,
and when gas was produced the water left the cylinder from the bottom and was collected in
a vessel placed above it. A one-way valve was placed between the cylinder and the collection
vessel so that the water in the collection vessel did not exert any pressure on the gas in the
cylinder.
3.2.4 Volatile Fatty Acids (VFAs)
For acetic, propionic, n-butyric, iso-butyric, n-valeric, iso-valeric and n-caproic acids analysis,
the sample was filtered through a 0.2 micron filter, and then acidified by adding one drop of
concentrated sulphuric acid, and eventually analyzed using a Shimadzu Gas Chromatograph
with a flame-ionised detector and a SGE capillary column (12m x 0.53mm ID-BP21 0.5micron).
The mobile phase was helium and the injector, column and detector temperature were 200, 80
and 250 ˚ C, respectively. The relative standard deviation was ± 3% for ten identical samples.
3.2.5 Gas Chromatography - Mass Spectrometry (GC-MS)
For the GC-MS analysis, the analytes of interest (low molecular weight hydrophobic compounds)
were extracted using a solid phase extraction (SPE) procedure. The Oasis HLB cartridge
(Waters Corporation) was first conditioned with 3 mL methyl tertiary-butyl ether (MTBE), 3mL
methanol and 3 mL deionized water (DW). A sample (500mL) at pH 2 was then loaded onto
the cartridge and filtered dropwise. The cartridge was then washed with 3mL of 40% methanol
in DW to remove organic interferences, re-equilibrated with 3mL DW, washed with 3mL 10%
79

Chapter 3. MATERIALS AND METHODS
methanol/2% NH4OH to remove humic interferences and finally 6mL 10% methanol/90% MTBE.
The final matrix was then evaporated to 200 microliter.
The samples were then analyzed using a 5890 Series gas chromatograph equipped with an
autosampler and a 5970 mass spectrometry detector (Hewlett-Packard, USA). Analytes were
separated using a SGE HT5 column of 25m x 0.22mm with a film thickness of 0.1 micron. The
temperature program was: 50 ˚ C, hold 2 min, rate 8 ˚ C min-1 to 350 ˚ C, hold 30 seconds. Helium
was used as a carrier gas at a flowrate of 2 ml/min. The injector temperature was set at 270 ˚ C.
The MS was operated in the electron impact ionisation mode (70eV). The transfer line and ion
source temperatures were 290 ˚ C and 220 ˚ C, respectively, and the quadrupole was not heated.
Scan runs were made with a range from m/z 33 to 500. The chromatograms were analyzed
using the NIST05 library and the compound was deemed identified if the match percentage was
higher than 70%. A retention index (RI) was attributed to the unidentified peaks according to
Van den Dool and Kratz (1963):
RI = 100 ·
[
z +ti − tz
tz+1 − tz
]
(3.1)
where tz and tz+1 are retention times of the reference n-alkanes hydrocarbons eluting immedi-
ately before and after the chemical compound i. Table 3.1 lists the retention times of the n-alkane
hydrocarbon standard used in the Van den Doole-Kartz retention index equation. Regarding the
concentrations of the analytes, two sets of standards were run with o-hydroxybiphenyl and bis(2-
ethylhexyl)phthalate which are components detected in this study. Standards of 20, 2 and 0.2
mg/L were used to obtain the calibration with a coefficient of correlation R2 greater than 0.99 in
both cases. The limit of detection of the GC-MS used in this study was 50 ng/L.
Table 3.1: Retention times of standard hydrocarbons detected by the GC-MS used inthis study.
Retention time (min) Hydrocarbons Formula6.568 decane C10H227.256 undecane C11H249.219 dodecane C12H2611.083 tridecane C13H2812.866 tetradecane C14H3014.532 pentadecane C15H3216.109 hexadecane C16H3417.614 heptadecane C17H3619.014 octadecane C18H3820.44 nonadecane C19H4021.737 eicosane C20H4223.028 heneicosane C21H4424.16 docosane C22H4625.194 tricosane C23H4826.338 tetracosane C24H5027.337 pentacosane C25H5228.355 hexacosane C26H5429.33 heptacosane C27H5630.267 octacosane C28H5831.174 nonacosane C29H6032.074 triacontane C30H62
80

Chapter 3. MATERIALS AND METHODS
3.2.6 Particle Size Distribution
Particle size measurements were made using a Malvern Instruments Particle Size Analyser
Model 2600C with a helium neon laser. The standard deviation was within ± 5%. The value
reported for this parameter is the d(4,3) value, which is the volume mean diameter of particles,
which takes into account the number and volume of particles in a particular medium. This is
different from the Sauter mean d(3,2) which can be defined as the diameter of a sphere that has
the same volume/surface area ratio as a particle of interest .
3.2.7 Heavy Metals
All the glassware was washed with Aqua Regia (1 volume of concentrated HNO3 with 3 volumes
of concentrated HCl) prior to the experiment. For the determination of heavy metals in a solid
sample, Aqua Regia was used to digest a pre-weighted sample. The solution was heated for
1 hour with a watch glass and was not allowed to boil. After cooling, the watch glass and the
beaker were rinsed with distilled water and the final solution was filtered through a 0.45 micron
filter. A blank with deionized water was run following the same procedure. The sample and
blank were analyzed with PerkinElmer Optima 2000 DV Inductively Coupled Plasma - Optical
Emission Spectrometer (ICP-OES) in triplicate. The coefficient of variation is different for each
element and is given along with the results. The detection limit is given in Table 3.2 for each
element.
Table 3.2: Detection limits of heavy metals analyzed by Inductively Coupled Plasma -Optical Emission Spectrometer.
Element Detection Limit (ppb)Al 10B 10Cd 1Co 2Cr 2Cu 4Fe 1Mg 0.5Mn 1Mo 5Ni 5Pb 10V 5W 10Zn 2Na 5K 5Ca 0.5Mg 1
3.2.8 Ion Chromatography
The ions Na+, K+, Mg++, Ca2+, Cl−, NO−
2 , NO−
3 , PO3−4 , SO2−
4 were analysed using the DIONEX
Ion Chromatograph as described by the American Public Health Association (APHA, 1999). The
coefficient of variation for the ions listed above are respectively 2, 0.2, 0.5, 0.6, 1.1, 1.8, 1.8, 3.4
and 5.1 for 5 identical samples. The detection limit was between 50 and 100 ppb.81

Chapter 3. MATERIALS AND METHODS
3.2.9 Size Exclusion Chromatography (SEC)
For size exclusion chromatography (SEC), an Aquagel OH-40 column (Polymer Labs) was used
with deionised water as eluent delivered at a flowrate of 0.5 mL/min. The sample volume was 50
microliter, and the column was maintained at ambient temperature with a Shimadzu UV detector
set at 254 nm. Unbranched standards of polyethylene oxide (PEO) and polyethylene glycol
(PEG) and glucose were used to calibrate the system, hence the results obtained are quoted
relative to these linear standards detected by a Shimadzu refractive index detector.
3.2.10 Scanning Electron Microscope - Energy Dispersive X-ray (SEM-EDX)
Fouled membranes and sludge samples were analyzed by scanning electron microscopy (SEM)
and energy dispersive X-ray (EDX) spectroscopy. SEM samples were fixed overnight at 4 ˚ C in
3% glutaraldehyde and kept at pH 7.2 by a 0.1M phosphate buffer. Samples were then dehy-
drated in a graded ethanol/water series (10-30-50-70-90-100%) for 20 minutes at each concen-
tration, and then dried for a day at 30 ˚ C. Samples were sputtered-coated with gold or carbon
(30mA for 2.5 minutes, vacuum 0.2 Torr) prior to SEM/EDX analyses. Specimens were examined
and photographed under a scanning electron microscopy (JEOL JSM-5610LV). Energy Disper-
sive X-Ray analysis was conducted with an EDX-60 (Oxford instrument-incax-sight). The EDX
analyser was connected to a scanning electron microscope (model JSM-840A). More than one
point on the sample was analyzed by EDX. The exact number of replicates is given along with
the results.
3.2.11 Surface Area
The specific surface area and pore width were obtained from the Brunauer-Emmett-Teller (BET)
equation at 77.3K using a Micromeritics TRISTAR 3000 Analyzer. Prior to BET measurement,
samples were dried at room temperature for 3 days then degassed overnight under a nitrogen
flow at 50 ˚ C.
3.3 PHYSICO-CHEMICAL METHODS
3.3.1 Alkalinity
The alkalinity of wastewater is based on its acid-neutralizing capacity, and is the sum of all the
titratable bases. The measured value may vary significantly with the end-point pH used. The
method used in this study followed the procedure described in Standard Methods (APHA, 1999).
Alkalinity of samples were titrated potentiometrically to an end-point of pH 4.5 with 0.1 N H2SO4.
The sulphuric acid solution was prepared by dissolving 2.8 ml of concentrated sulphuric acid in
1L of deionised water. The coefficient of variation for 10 identical samples was within 2.7%. The
calculation of alkalinity is shown below:
Alkalinity asmg CaCO3/L =A×N × 50, 000
ml sample(3.2)
82

Chapter 3. MATERIALS AND METHODS
where: A= ml standard acid used, N= normality of standard acid.
3.3.2 Total Solids, Volatile Solids and Fixed Solids
The measurement of Total Solids (TS) and Volatile Solids (VS) was applied as described in
Standard Methods (APHA, 1999). Empty aluminium dishes were placed in a furnace at 550 ˚ C
for 1 hour. After cooling in a dessicator, the sample was injected into the pre-weighted dish,
and the liquid fraction evaporated overnight in an oven at 103-105 ˚ C until the weight stabilised.
The resulting weight was recorded for the measurement of TS and then the dish was placed
in a furnace at 550 ˚ C for 1 hour. For VS measurement, the final weight was then recorded
on removal from the furnace. Calculations were then performed as given in Standard Methods
(APHA, 1999). Fixed solids (FS) or ash percentage was simply obtained by difference. The
coefficient of variation for 10 identical samples was within 4%.
3.3.3 Total Suspended Solids and Volatile Suspended Solids
The measurement of Total Suspended Solids (TSS) and Volatile Suspended Solids (VSS) was
carried out according to Sections 2540-B and 2540-E of Standard Methods (APHA, 1999). First
three glass fiber filters (GFC, Whatman) were washed by filtering 20 mL deionized 3 times. The
filters were placed on aluminium dishes and placed in a furnace at 550 ˚ C for 1 hour. They
were then placed in a dessicator until needed. To measure TSS, a known volume of sludge
was filtered through the filter, and the liquid fraction was evaporated overnight in an oven at
103-105 ˚ C. They were then allowed to cool down in a dessicator. The resulting weight was
recorded for the measurement of TSS and then the tray was placed in a furnace at 550 ˚ C for 1
hour. For VSS measurement, the final weight was then recorded on removal from the furnace.
Fixed Suspended Solids was obtained by substracting VSS from TSS. Calculations were then
performed as given in Standard Methods (APHA, 1999). The coefficient of variation (COV) for
ten identical samples was 4%, 3.1% and 7.1% for TSS, VSS and FSS, respectively.
3.3.4 COD Measurement
The measurement of COD was based on the Standard Closed Reflux Colorimetric Method de-
scribed in Section 5220-D of Standard Methods (APHA, 1999). Digestion solution was first
prepared by adding 10.216 g of K2Cr2O7 (Merck), previously dried overnight at 103 ˚ C, 167 ml
of concentrated H2SO4 (Merck, UK) and 33.3 g of HgSO4 (Merck, UK) into 500 ml of distilled
water. The mixture was then left to cool at room temperature before diluting to 1000 ml. Sam-
ples of 1 ml were added to a Hach reflux tube, followed by 0.6 ml of digestion solution. Then
1.4 ml of sulphuric acid reagent (2.5% w/w silver sulphate in sulphuric acid) was carefully run
down the inside of the tube so that an acid layer was formed under the sample/digestion solution
layer. The tubes were tightly sealed and inverted three times to mix properly. The mixtures were
then refluxed in a Hach COD reflux reactor (Model 45600) at 150 ˚ C for 2 hours. After cooling,
83

Chapter 3. MATERIALS AND METHODS
the samples were analysed on a Shimadzu UV/VIS scanning spectrophotometer (Model UV-
2101/3101 PC) at a wavelength of 600 nm. Potassium hydrogen phthalate (KHP) (Merck, UK)
was used to prepare standard solutions in the range of 20-900 mg/l. KHP has a theoretical COD
of 1.176 mg O2/mg.
Soluble COD (SCOD) was obtained by centrifuging the samples at 10,000 rpm for 5 minutes
(Biofuge Stratos, Heraeus Instruments), then at 17,000 rpm for 20 minutes to ensure an easy
filtration through a 0.2 micron filter to remove fine suspended material and any residual biomass.
The coefficient of variance for ten identical samples was ± 2.6%.
Total COD (TCOD) was obtained by taking 1ml of sample and diluting it to 100 ml with deionised
water. Although the sample was blended for 1 minute in a 1L Waring blender, the presence
of particles in suspension made it difficult to take representative samples. The coefficient of
variance for ten identical samples was 9.9%.
3.3.5 Ammonia Measurement
The measurement of ammonia was carried out according to the Nesslerization method in Stan-
dard Methods (APHA, 1999). A sample of 0.25 ml was diluted with deionized water to 25 mL in
a volumetric flask. Three drops of mineral stabilizer (Hach Lange GmbH) were added followed
by three drops of polyvinyl alcohol dispersing agent (Hach Lange GmbH). The mixture was then
mixed by inverting the flask. One milliliter of Nessler reagent (VWR) was then added and the
yellow colour was then analyzed after ten minutes on the spectrophotometer at a wavelength of
495nm. The coefficient of variance for ten identical samples was ± 6.6%.
3.3.6 Total Nitrogen Measurement
The measurement of total Nitrogen was carried out according to the TN kit manual from Hach
Lange GmbH. An alkaline persulfate digestion converted all forms of nitrogen to nitrate. Sodium
metabisulfite was added after the digestion to eliminate halogen oxide interferences. Nitrate then
reacts with chromotropic acid under strongly acidic conditions to form a yellow complex with an
absorbance maximum at 410 nm. The coefficient of variance for ten identical samples was ±
5.5%.
3.3.7 Total Phosphorus Measurement
For the measurement of Total Phosphorus (TP) a known mass of sample was digested in a
mixture of hydrochloric and nitric acids (3:1) at 150 ˚ C until no solid particles were visible. The
digested acid mixture was then transferred to a 50 mL flask, 1 drop of phenolphtalein indicator
solution was added and sodium hydroxyde was added until a faint pink color appeared. Deion-
ized water was added to reach the 50 ml mark. The measurement of TP was then carried
out according to the vanadomolybdophosphoric acid colorimetric method described in Standard
Methods (APHA, 1999): in a dilute orthophosphate solution, ammonium molybdate reacts under
84

Chapter 3. MATERIALS AND METHODS
acid conditions to form a heteropoly acid, molybdophosphoric acid. In the presence of vana-
dium, yellow vanadomolybdophosphoric acid is formed. The intensity of the yellow colour is
proportional to phosphate concentration. the absorbance was read on a spectrophotometer at
470 nm. The coefficient of variance for ten identical samples was ± 0.6%.
3.3.8 Carbohydrates Measurement
Carbohydrates are hydrolysed by sulphuric acid; dextrose and phenol, in the presence of sul-
phuric acid, react further to produce a colored complex that is measured spectrophotometrically.
Samples of 0.4 ml were added to each test tube and then mixed well with 0.4 ml of 5% (w/v)
phenol (Sigma, UK). Two ml of H2SO4 was added to each test tube and left at room temper-
ature (18-26 ˚ C) for 20-30 minutes to allow color development. The content of each tube was
transferred to cuvettes and the samples were analysed on a Shimadzu UV/VIS scanning spec-
trophotometer (Model UV-2101/3101 PC) against the blank at a wavelength of 485 nm (Dubois
et al., 1956). Dextrose was used to prepare standard solutions in the range of 0 - 200 mg/l,
but the method gives a linear relationship for some five carbon sugars such as D-xylose and
D-arabinose. To convert into COD, 1g carbohydrates assumed as C6H12O6 is equivalent 1.07 g
COD (Sanders, 2001). The coefficient of variance was within 2.5% for ten identical samples.
3.3.9 Protein Measurement
A Protein kit (Stephenson’s modification) was purchased from Sigma, England (Kit no. P5656).
Samples of 1 ml were added to each tube with 1 ml of Lowry Reagent Solution. The samples
were mixed well and kept at room temperature for 20 minutes. With rapid and immediate mixing,
0.5 ml of Folin and Ciocalteu’s Phenol reagent was added to each tube and mixed well after
addition. These samples were left at room temperature for 30 minutes. The content of each tube
was transferred to cuvettes and the samples were analysed on a Shimadzu UV/VIS scanning
spectrophotometer (Model UV-2101/3101 PC) against the blank at a wavelength of 725 nm. The
detection limit was 5 mg/L, and the coefficient of variance within 3.6% for 10 identical samples.
As the precise chemical formula of the proteins detected was not determined, the percentage of
soluble COD represented by protein had to be estimated by assuming a stoichiometric conver-
sion factor of 1.5 which is derived from the typical formula of proteins (C16H24O5N4) presented
in Rittmann and McCarty (2001).
3.3.10 Ultrafiltration Tests
The sample was centrifuged (7000 rpm for 20 minutes) and then filtered through a 0.45 µm
filter before being analyzed for COD, proteins and carbohydrates. The quantitative molecular
weight distribution (MWD) of COD, proteins and carbohydrates was determined using a stirred
ultrafiltration cell (Series 8000, Model 8200, Amicon). Diaflo membranes (Amicon/Millipore) with
nominal MW cut-offs of 1, 10 and 300 kDa were employed in a parallel mode as described
elsewhere (Barker et al., 1999).
85
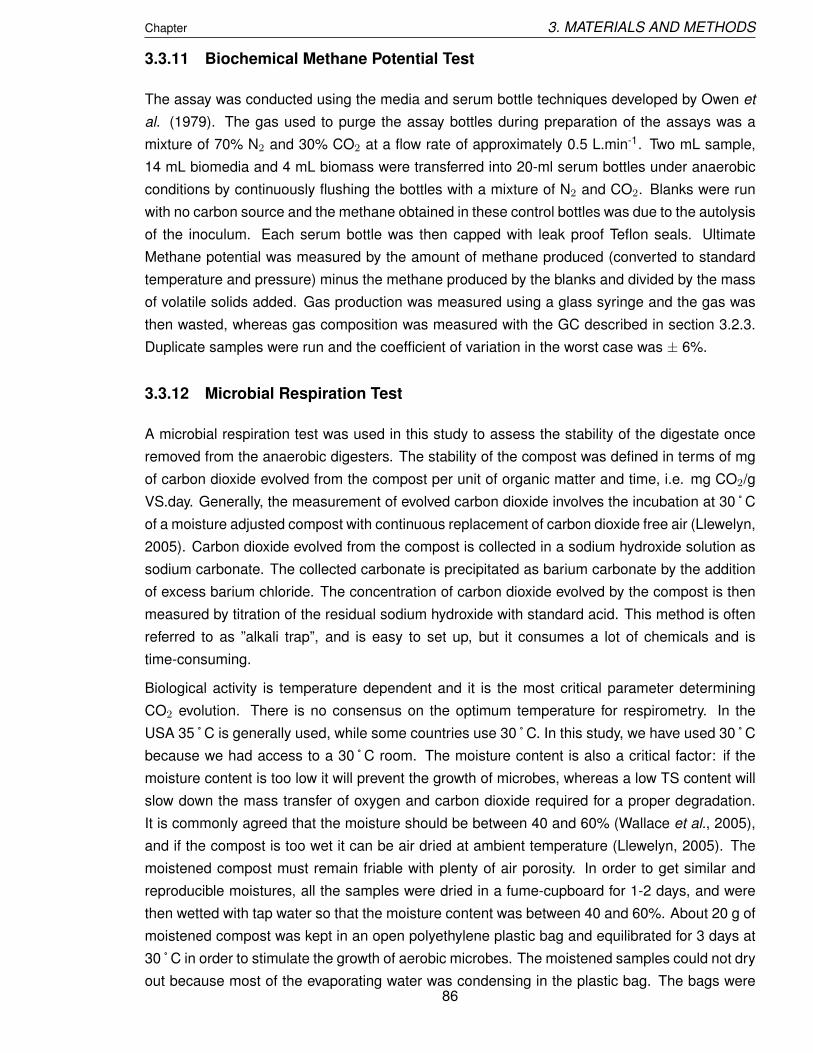
Chapter 3. MATERIALS AND METHODS
3.3.11 Biochemical Methane Potential Test
The assay was conducted using the media and serum bottle techniques developed by Owen et
al. (1979). The gas used to purge the assay bottles during preparation of the assays was a
mixture of 70% N2 and 30% CO2 at a flow rate of approximately 0.5 L.min-1. Two mL sample,
14 mL biomedia and 4 mL biomass were transferred into 20-ml serum bottles under anaerobic
conditions by continuously flushing the bottles with a mixture of N2 and CO2. Blanks were run
with no carbon source and the methane obtained in these control bottles was due to the autolysis
of the inoculum. Each serum bottle was then capped with leak proof Teflon seals. Ultimate
Methane potential was measured by the amount of methane produced (converted to standard
temperature and pressure) minus the methane produced by the blanks and divided by the mass
of volatile solids added. Gas production was measured using a glass syringe and the gas was
then wasted, whereas gas composition was measured with the GC described in section 3.2.3.
Duplicate samples were run and the coefficient of variation in the worst case was ± 6%.
3.3.12 Microbial Respiration Test
A microbial respiration test was used in this study to assess the stability of the digestate once
removed from the anaerobic digesters. The stability of the compost was defined in terms of mg
of carbon dioxide evolved from the compost per unit of organic matter and time, i.e. mg CO2/g
VS.day. Generally, the measurement of evolved carbon dioxide involves the incubation at 30 ˚ C
of a moisture adjusted compost with continuous replacement of carbon dioxide free air (Llewelyn,
2005). Carbon dioxide evolved from the compost is collected in a sodium hydroxide solution as
sodium carbonate. The collected carbonate is precipitated as barium carbonate by the addition
of excess barium chloride. The concentration of carbon dioxide evolved by the compost is then
measured by titration of the residual sodium hydroxide with standard acid. This method is often
referred to as ”alkali trap”, and is easy to set up, but it consumes a lot of chemicals and is
time-consuming.
Biological activity is temperature dependent and it is the most critical parameter determining
CO2 evolution. There is no consensus on the optimum temperature for respirometry. In the
USA 35 ˚ C is generally used, while some countries use 30 ˚ C. In this study, we have used 30 ˚ C
because we had access to a 30 ˚ C room. The moisture content is also a critical factor: if the
moisture content is too low it will prevent the growth of microbes, whereas a low TS content will
slow down the mass transfer of oxygen and carbon dioxide required for a proper degradation.
It is commonly agreed that the moisture should be between 40 and 60% (Wallace et al., 2005),
and if the compost is too wet it can be air dried at ambient temperature (Llewelyn, 2005). The
moistened compost must remain friable with plenty of air porosity. In order to get similar and
reproducible moistures, all the samples were dried in a fume-cupboard for 1-2 days, and were
then wetted with tap water so that the moisture content was between 40 and 60%. About 20 g of
moistened compost was kept in an open polyethylene plastic bag and equilibrated for 3 days at
30 ˚ C in order to stimulate the growth of aerobic microbes. The moistened samples could not dry
out because most of the evaporating water was condensing in the plastic bag. The bags were86

Chapter 3. MATERIALS AND METHODS
shaken every day to enhance the transfer of oxygen through the pores of the compost and ensure
that oxygen was not the limiting factor for microbial equilibration. The particle size of the compost
was in the range 5 - 15mm, which is similar to values reported in the literature (Hue and Liu,
1995; Popp and Fischer, 1998). There is a flush of biological activity when composted materials
with low moisture or that have dried out are wetted, e.g. for incubation. This flush appears to last
for 3 to 5 days before equilibrium metabolic activity is re-established. The adjustment of moisture
to 50% and the equilibration period of 3 days prior to starting the measurement of evolved carbon
dioxide was recommended in several documents (Leege and Thompson, 1997; Switzenbaum et
al., 2002; Llewelyn, 2005; Wallace et al., 2005). After 3 days of equilibration, a known mass of
compost was inserted into a brown bottle (500 mL) to keep the sample in the dark. The TS and
VS content of the compost was determined to know the mass of organic matter inserted in the
bottle for the respiration test. A rubber sleeve containing two pellets of sodium hydroxide was
placed in the neck of the bottle and finally the Oxitop measuring head was screwed on the bottle
to keep it air-tight. The analysis of evolved carbon dioxide was then taking place for four days as
recommended by several researchers (Leege and Thompson, 1997; Wallace et al., 2005).
The Oxitop system (WTW) was used to quantify the mass of evolved carbon dioxide through
a pressure sensor located in the Oxitop measuring head. When biomass is degrading organic
matter it is consuming the oxygen from the headspace and produces carbon dioxide that is pre-
cipitated with the pellets of sodium hydroxide to form Na2CO3. As a result, a vacuum is created
in the bottle which is proportional to the oxygen consumed by the bacteria. The OxiTop measur-
ing head measures and stores this pressure for 4 days once the measurement has started. The
OxiTop controller collects the pressure values from the measuring heads by infrared signals and
processes them. The formula shown below was used with the values from the OxiTop measuring
heads (GmbH, 2006):
mg O2/L =MMO2
R · Tm·
(
Vt − V
V+ α
Tm
To
)
· ∆p(O2) (3.3)
where MMO2is the molecular weight of oxygen (32000 mg/mol), R is the gas constant (83.144
l.mbar/mol.K), To is the reference temperature (273.15 K), Tm is the measuring temperature, Vt is
the bottle volume (mL), V is the sample volume (mL), α is the Bunsen absorption coefficient and
∆p(O2) is the difference of the oxygen partial pressure (mbar). The values were then converted
from mg of oxygen to mg of carbon dioxide by multiplying by 1.375 (44/32) considering that one
mole of oxygen is converted to one mole of carbon dioxide during the degradation of one mole
of carbon :
C + O2 → CO2 + Energy (3.4)
A control was run in order to check that the compost was not degraded under anaerobic condi-
tions. The compost that was equilibrated for 3 days in a plastic bag was placed in a 40 mL bottle
clamped with a rubber and an aluminium crimp to seal the bottle. A sample of the headspace
gas taken after 4 days confirmed that no methane had been produced which confirmed that our
method of the respirometric analysis of the compost was taking place under aerobic conditions.
The rate of carbon dioxide evolution over 4 days was calculated as the ratio of total CO2 evolved
(mg) and the mass of volatile solids incubated and divided by 4 days. Each sample was run87
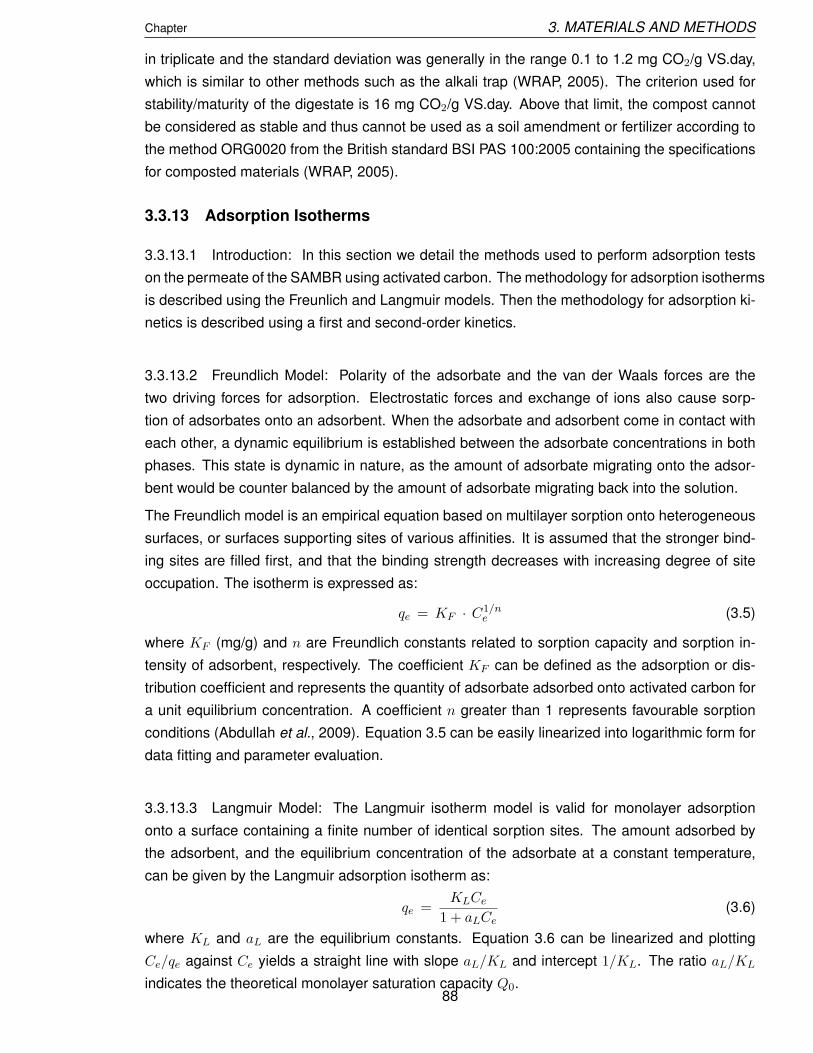
Chapter 3. MATERIALS AND METHODS
in triplicate and the standard deviation was generally in the range 0.1 to 1.2 mg CO2/g VS.day,
which is similar to other methods such as the alkali trap (WRAP, 2005). The criterion used for
stability/maturity of the digestate is 16 mg CO2/g VS.day. Above that limit, the compost cannot
be considered as stable and thus cannot be used as a soil amendment or fertilizer according to
the method ORG0020 from the British standard BSI PAS 100:2005 containing the specifications
for composted materials (WRAP, 2005).
3.3.13 Adsorption Isotherms
3.3.13.1 Introduction: In this section we detail the methods used to perform adsorption tests
on the permeate of the SAMBR using activated carbon. The methodology for adsorption isotherms
is described using the Freunlich and Langmuir models. Then the methodology for adsorption ki-
netics is described using a first and second-order kinetics.
3.3.13.2 Freundlich Model: Polarity of the adsorbate and the van der Waals forces are the
two driving forces for adsorption. Electrostatic forces and exchange of ions also cause sorp-
tion of adsorbates onto an adsorbent. When the adsorbate and adsorbent come in contact with
each other, a dynamic equilibrium is established between the adsorbate concentrations in both
phases. This state is dynamic in nature, as the amount of adsorbate migrating onto the adsor-
bent would be counter balanced by the amount of adsorbate migrating back into the solution.
The Freundlich model is an empirical equation based on multilayer sorption onto heterogeneous
surfaces, or surfaces supporting sites of various affinities. It is assumed that the stronger bind-
ing sites are filled first, and that the binding strength decreases with increasing degree of site
occupation. The isotherm is expressed as:
qe = KF · C1/ne (3.5)
where KF (mg/g) and n are Freundlich constants related to sorption capacity and sorption in-
tensity of adsorbent, respectively. The coefficient KF can be defined as the adsorption or dis-
tribution coefficient and represents the quantity of adsorbate adsorbed onto activated carbon for
a unit equilibrium concentration. A coefficient n greater than 1 represents favourable sorption
conditions (Abdullah et al., 2009). Equation 3.5 can be easily linearized into logarithmic form for
data fitting and parameter evaluation.
3.3.13.3 Langmuir Model: The Langmuir isotherm model is valid for monolayer adsorption
onto a surface containing a finite number of identical sorption sites. The amount adsorbed by
the adsorbent, and the equilibrium concentration of the adsorbate at a constant temperature,
can be given by the Langmuir adsorption isotherm as:
qe =KLCe
1 + aLCe(3.6)
where KL and aL are the equilibrium constants. Equation 3.6 can be linearized and plotting
Ce/qe against Ce yields a straight line with slope aL/KL and intercept 1/KL. The ratio aL/KL
indicates the theoretical monolayer saturation capacity Q0.88

Chapter 3. MATERIALS AND METHODS
3.3.14 Adsorption Kinetics
In order to observe the adsorption process over time, two kinetic models, first and second order
models, were proposed. These are the most common models being used to explain adsorption
kinetics (Nadeem et al., 2006).
3.3.14.1 First-order Model: The first-order equation can be written as:
dqt
dt= kf (qe − qt) (3.7)
where qt (mg/g) is the amount of adsorbate absorbed at time t (min), qe (mg/g) is the adsorption
capacity in equilibrium, and kf (min-1) is the rate constant for first order kinetics. After integration
and by applying the initial conditions qt=0 at t=0 and qt=qt at t=t, the equation becomes (Abdullah
et al., 2009):
log (qe − qt) = log qe −
(
kf t
2.303
)
(3.8)
3.3.14.2 Second-order Model: The second-order kinetics can be presented in the following
form:dqt
dt= ks (qe − qt)
2 (3.9)
where ks is the rate constant of second-order model (g/mg min). After integration and applying
initial conditions qt=0 when t=0 and qt=qt at t=t, the equation becomes (Abdullah et al., 2009):
t
qt=
1
ksq2e
+
(
1
qe
)
t (3.10)
The initial sorption rate, h at t=0 can be defined as h = ksq2e
3.4 MOLECULAR BIOLOGY METHODS: Denaturing Gel GradientElectrophoresis (DGGE)
The DNA from a mixed culture was extracted using the FastDNA SPin for soil kit from MP
Biomedicals. The PCR mixture (50 µL) contained 2 µL of each primer, 0.2 µL of the Taq Poly-
merase (Promega), 2 µL of dNTPs stock solution (10 µM), 5 µL of Taq buffer solution containing
MgCl2 and between 1 and 20 µL of DNA template. The final volume was adjusted to 50 µL
using DNA-free water. Archaeal DNA was amplified using a nested PCR reaction in a G-Storm
thermocycler. First, the DNA template was amplified using the primers 46F and 1017R in 25µL
PCR volume. The temperature program was: initial denaturation 95 ˚ C for 3 minutes, then 35
cycles of denaturation at 95 ˚ C for 1 minute, annealing at 40 ˚ C for 1 minute, elongation at 72 ˚ C
for 1 minute and the final elongation took place at 72 ˚ C for 7 minutes (Gray et al., 2002; Akar-
subasi et al., 2005). Then 1 microliter of the PCR product was used for the second PCR reaction
in 50 µL using the primers 344F-GC and Univ522R. The temperature program was: initial denat-
uration 95 ˚ C for 3 minutes, then 35 cycles of 95 ˚ C for 1 minute, 53 ˚ C for 1 minute, 72 ˚ C for 1
89
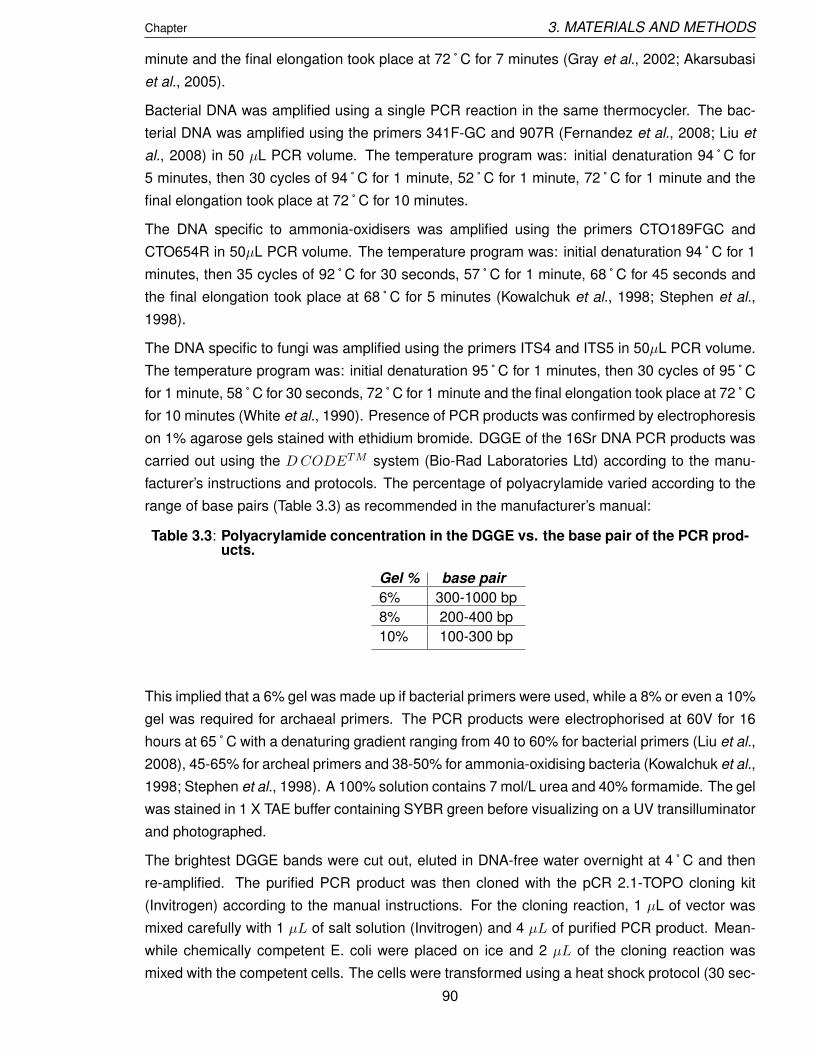
Chapter 3. MATERIALS AND METHODS
minute and the final elongation took place at 72 ˚ C for 7 minutes (Gray et al., 2002; Akarsubasi
et al., 2005).
Bacterial DNA was amplified using a single PCR reaction in the same thermocycler. The bac-
terial DNA was amplified using the primers 341F-GC and 907R (Fernandez et al., 2008; Liu et
al., 2008) in 50 µL PCR volume. The temperature program was: initial denaturation 94 ˚ C for
5 minutes, then 30 cycles of 94 ˚ C for 1 minute, 52 ˚ C for 1 minute, 72 ˚ C for 1 minute and the
final elongation took place at 72 ˚ C for 10 minutes.
The DNA specific to ammonia-oxidisers was amplified using the primers CTO189FGC and
CTO654R in 50µL PCR volume. The temperature program was: initial denaturation 94 ˚ C for 1
minutes, then 35 cycles of 92 ˚ C for 30 seconds, 57 ˚ C for 1 minute, 68 ˚ C for 45 seconds and
the final elongation took place at 68 ˚ C for 5 minutes (Kowalchuk et al., 1998; Stephen et al.,
1998).
The DNA specific to fungi was amplified using the primers ITS4 and ITS5 in 50µL PCR volume.
The temperature program was: initial denaturation 95 ˚ C for 1 minutes, then 30 cycles of 95 ˚ C
for 1 minute, 58 ˚ C for 30 seconds, 72 ˚ C for 1 minute and the final elongation took place at 72 ˚ C
for 10 minutes (White et al., 1990). Presence of PCR products was confirmed by electrophoresis
on 1% agarose gels stained with ethidium bromide. DGGE of the 16Sr DNA PCR products was
carried out using the D CODETM system (Bio-Rad Laboratories Ltd) according to the manu-
facturer’s instructions and protocols. The percentage of polyacrylamide varied according to the
range of base pairs (Table 3.3) as recommended in the manufacturer’s manual:
Table 3.3: Polyacrylamide concentration in the DGGE vs. the base pair of the PCR prod-ucts.
Gel % base pair
6% 300-1000 bp
8% 200-400 bp
10% 100-300 bp
This implied that a 6% gel was made up if bacterial primers were used, while a 8% or even a 10%
gel was required for archaeal primers. The PCR products were electrophorised at 60V for 16
hours at 65 ˚ C with a denaturing gradient ranging from 40 to 60% for bacterial primers (Liu et al.,
2008), 45-65% for archeal primers and 38-50% for ammonia-oxidising bacteria (Kowalchuk et al.,
1998; Stephen et al., 1998). A 100% solution contains 7 mol/L urea and 40% formamide. The gel
was stained in 1 X TAE buffer containing SYBR green before visualizing on a UV transilluminator
and photographed.
The brightest DGGE bands were cut out, eluted in DNA-free water overnight at 4 ˚ C and then
re-amplified. The purified PCR product was then cloned with the pCR 2.1-TOPO cloning kit
(Invitrogen) according to the manual instructions. For the cloning reaction, 1 µL of vector was
mixed carefully with 1 µL of salt solution (Invitrogen) and 4 µL of purified PCR product. Mean-
while chemically competent E. coli were placed on ice and 2 µL of the cloning reaction was
mixed with the competent cells. The cells were transformed using a heat shock protocol (30 sec-
90

Chapter 3. MATERIALS AND METHODS
onds at 42 ˚ C), then incubated for 1 hour at 37 ˚ C in S.O.C. medium and eventually spread onto
Luria-Bertani (LB) agar plates containing 50 µg/mL of Kanamycin to incubate overnight at 37 ˚ C.
The LB medium consisted of tryptone (10g/L), yeast extract (5g/L), NaCl (10g/L) and 15g/L of
agar in 1L deionized water. The pH was adjusted to 7 and the medium was autoclaved (120 ˚ C
for 20 min.). Kanamycin was added in a sterile environment. Three well-separated colonies were
picked from the plate using a pipette tip and were grown between 12 and 16 hours in LB medium
(without agar) at 37 ˚ C. The plasmid DNA was then purified using the purification kit from Qiagen
(QIAprep Spin Miniprep Kit) and the resulting DNA was then kept frozen until it was sent off for
sequencing (Cogenics, UK). DNA sequences analyses were performed using the BLAST server
of the National Center for Biotechnology Information (http://www.ncbi.nlm.nih.gov).
The Expect value (E) is a parameter that describes the number of hits one can ”expect” to see
by chance when searching a database of a particular size. It decreases exponentially as the
percentage of the match increases. Essentially, the E value describes the random background
noise. For example, an E value of 1 assigned to a hit can be interpreted as meaning that in
a database of the current size one might expect to see 1 match with a similar score simply by
chance. The lower the E-value, or the closer it is to zero, the more ”significant” the match is.
3.5 FEEDSTOCK COMPOSITION AND PROPERTIES
3.5.1 Composition
The simulated OFMSW used for this study was made up of paper, food wastes and garden
wastes. Kitchen wastes (KW) came from a canteen in Southampton university; the left-overs
were passed through a kitchen grinder and mixed in a large tank with a drill mixer and then
frozen until the experiment. The composition of the simulated paper waste used for the study is
listed in Table 3.4. Paper wastes were kept at room temperature. Garden waste was collected
from the Downend Quarry centralised composting site near Fareham (Hampshire, UK) and were
kept at 4 ˚ C until the experiment.
Table 3.4: Composition of the simulated paper waste used for the study.
Type of paper %
Newspaper 21.2
Magazine 12
Office paper 7.9
Card and paper packaging 10.5
Cardboard 1.2
Card non packaging 0.6
Liquid carton 1.4
Tissue paper 15.06
Paper plate 15.06
Toilet paper 15.06
TOTAL 100
91

Chapter 3. MATERIALS AND METHODS
The OFMSW feedstock used in this study consisted of 41.3% Kitchen Wastes (KW), 10.8% Gar-
den Wastes (GW) and 47.9% Paper Wastes (PW) on a wet basis. This composition comes from
an assessment scheme for kerbside collection of dry recyclables undertaken by the district of
Eastleigh in the UK. It was deemed a representative paper waste composition because East-
leigh has a good mix of socio-economic groups. Moreover, data of KW, GW and PW are given
for summer and winter months, allowing us to see the variation (mainly in garden waste) over
the seasons and to calculate an annual average. Finally, Eastleigh has a well established dry
recyclables collection of card, newspaper, cans, bottles etc and the data is set out so that actual
refuse (Total MSW minus recyclables) is available. This is desirable as legislation says that all
city councils in the UK now have to pick up at least two dry recyclables in their waste collections,
meaning that Eastleigh refuse MSW is representative of future MSW in the UK. The TS content
of the mixture of waste was adjusted with tap water to obtain the OFMSW feedstock at 10% TS.
In other words, to prepare 1kg of feedstock at 10%TS, about 830 g of tap water was blended
with 18.6g of GW, 71g of KW and 82g of PW.
3.5.2 Properties
3.5.2.1 Physico-Chemical Analysis: The SCOD for the KW, GW and PW was obtained by
drying the waste (105 ˚ C) overnight, grinding to obtain a powder and placing it in a dessicator
for one day. A suspension was thereafter prepared by mixing 2 g of waste per liter in a blender.
The suspension was then mixed with a magnetic stirrer for one day at ambient temperature and
then filtered through a paper filter (Fisherbrand QT280). The low SCOD/COD ratios in Table 3.5
show the poor tendency to dissolve and this tendency is even worse (8.4%) for the OFMSW. It
is hypothesized that most of the soluble material originates from the KW which has the highest
SCOD/COD ratio. Nopharatana et al. (2006) found a SCOD/TCOD ratio equal to 7% in a similar
experiment. Moreover, Table 3.5 reveals that the COD/VS ratio for the feed is about 1.3 g O2/g
VS, which is close to values found in the literature for OFMSW: 1.4 (Hartmann and Ahring, 2005;
Nopharatana et al., 2006), 1.284 (Anderson and Saw, 1992). The high ash content of garden
waste could be explained by the presence of sand and stones among the organic material.
In addition to COD tests, carbohydrate and protein concentrations were measured on filtered
(0.45 µm filter) and unfiltered samples of the simulated OFMSW feedstock. For the unfiltered
samples, carbohydrates, on a COD basis, represent 78%, whereas proteins represent only 7%,
as shown in Table 3.6, while the remaining fraction may be aromatic compounds, lipids, humic
and fulvic acids, etc. For the filtered samples (≤ 0.45 micron), the proportion of carbohydrates is
only 1.7% which implies that carbohydrates from the OFMSW are huge and complex molecules,
of which a tiny fraction is composed of small molecules that are solubilised. This is in line with
Nopharatana et al. (2006) who found that only 2% of the SCOD was made up of the simple
sugars, glucose and maltose, and VFAs like lactic and acetic acids. Table 3.6 also implies that
about 95% of the soluble fraction are not carbohydrates, nor proteins which means that most
of the soluble fraction consists of complex molecules which must be broken down into simpler
molecules before they can be taken up by microorganisms.
92
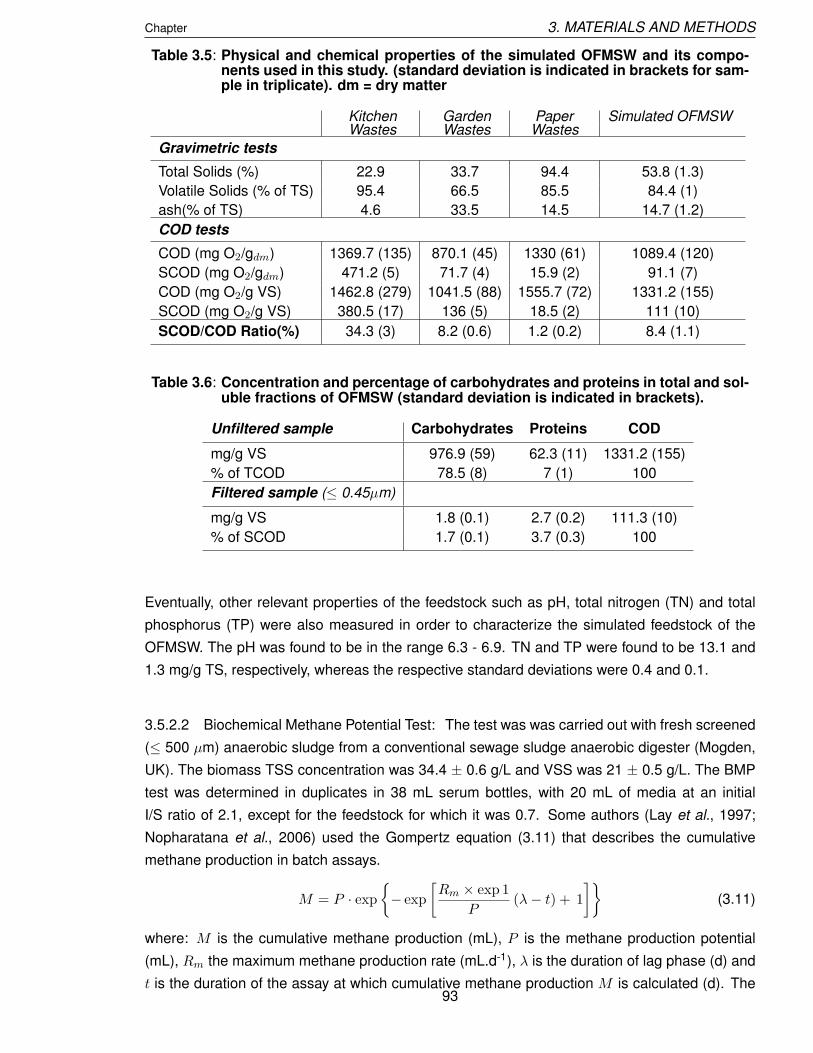
Chapter 3. MATERIALS AND METHODS
Table 3.5: Physical and chemical properties of the simulated OFMSW and its compo-nents used in this study. (standard deviation is indicated in brackets for sam-ple in triplicate). dm = dry matter
Kitchen Garden Paper Simulated OFMSWWastes Wastes Wastes
Gravimetric tests
Total Solids (%) 22.9 33.7 94.4 53.8 (1.3)
Volatile Solids (% of TS) 95.4 66.5 85.5 84.4 (1)
ash(% of TS) 4.6 33.5 14.5 14.7 (1.2)
COD tests
COD (mg O2/gdm) 1369.7 (135) 870.1 (45) 1330 (61) 1089.4 (120)
SCOD (mg O2/gdm) 471.2 (5) 71.7 (4) 15.9 (2) 91.1 (7)
COD (mg O2/g VS) 1462.8 (279) 1041.5 (88) 1555.7 (72) 1331.2 (155)
SCOD (mg O2/g VS) 380.5 (17) 136 (5) 18.5 (2) 111 (10)
SCOD/COD Ratio(%) 34.3 (3) 8.2 (0.6) 1.2 (0.2) 8.4 (1.1)
Table 3.6: Concentration and percentage of carbohydrates and proteins in total and sol-uble fractions of OFMSW (standard deviation is indicated in brackets).
Unfiltered sample Carbohydrates Proteins COD
mg/g VS 976.9 (59) 62.3 (11) 1331.2 (155)
% of TCOD 78.5 (8) 7 (1) 100
Filtered sample (≤ 0.45µm)
mg/g VS 1.8 (0.1) 2.7 (0.2) 111.3 (10)
% of SCOD 1.7 (0.1) 3.7 (0.3) 100
Eventually, other relevant properties of the feedstock such as pH, total nitrogen (TN) and total
phosphorus (TP) were also measured in order to characterize the simulated feedstock of the
OFMSW. The pH was found to be in the range 6.3 - 6.9. TN and TP were found to be 13.1 and
1.3 mg/g TS, respectively, whereas the respective standard deviations were 0.4 and 0.1.
3.5.2.2 Biochemical Methane Potential Test: The test was was carried out with fresh screened
(≤ 500 µm) anaerobic sludge from a conventional sewage sludge anaerobic digester (Mogden,
UK). The biomass TSS concentration was 34.4 ± 0.6 g/L and VSS was 21 ± 0.5 g/L. The BMP
test was determined in duplicates in 38 mL serum bottles, with 20 mL of media at an initial
I/S ratio of 2.1, except for the feedstock for which it was 0.7. Some authors (Lay et al., 1997;
Nopharatana et al., 2006) used the Gompertz equation (3.11) that describes the cumulative
methane production in batch assays.
M = P · exp
{
− exp
[
Rm × exp 1
P(λ− t) + 1
]}
(3.11)
where: M is the cumulative methane production (mL), P is the methane production potential
(mL), Rm the maximum methane production rate (mL.d-1), λ is the duration of lag phase (d) and
t is the duration of the assay at which cumulative methane production M is calculated (d). The93

Chapter 3. MATERIALS AND METHODS
parameters P , λ and Rm are estimated by applying a least squares fit of the above equation to
the experimental data set using the Solver in Excel.
Figure 3.3: Biochemical Methane Potential on the components and the feedstock ofOFMSW used in this study. markers: average of measurements; line: fittedusing Gompertz Equation; error bars: standard deviation of triplicates.
Figure 3.3 shows that all wastes display a lag phase due to the non acclimatised inoculum used
for the experiment. The biostabilization of the organic substrate in anaerobic batch reactors
is known to display a slow phase which is the necessary period for adaptation and beginning
of bacterial mass multiplication, and a rapid decomposition phase when the bacterial growth is
the highest (Lopes et al., 2004). The period of the lag phase is mainly influenced by the initial
concentration of microorganisms and substances stimulating the growth of bacteria (Lay et al.,
1997).
The lag phase, λ, however, is shorter for KW (5.8 days) and Feedstock (4.5 days) than for
PW (18.4 days) and GW (17.5 days). This lag phase may be explained by the close association
between cellulose and lignin in PW and GW, which impedes access to cellulose. This association
might prevent bacteria having direct access to hydrolyzable material which could explain why the
blank bottles produced more gas at the very beginning of the test. This translated to negative
values for PW and GW during the first twenty days. Interestingly, the lag phase for the Feedstock
was less than the one for KW. This is possibly due to the fact that the Feedstock was blended
to reduce the particle size and to take an homogeneous sample, and not the KW, or due to a
better C/N ratio for the combined waste. The hydrolysis might have thus been enhanced for the
feedstock, and gas production might have started earlier.
Kitchen Wastes are readily hydrolysed and converted to methane. The ultimate methane poten-
tial was 357 mL CH4/g VS, which corresponds to 66% (± 7) of the theoretical methane production94

Chapter 3. MATERIALS AND METHODS
based on its COD content. After 50 days, the bottle containing KW stopped producing methane
while blank bottles were still producing a little bit which explains why the curve decreased. This
biodegradability is consistent with Shin et al. (1993), Lee et al. (1997) and Zhang et al. (2007)
who found 356, 343 and 348 mL CH4/g VS, respectively.
Garden wastes are slowly biodegraded due to their high lignin content which is not degradable
under anaerobic conditions. The ultimate methane potential was estimated to be 113 mL CH4/g
VS, which is 33.1% (± 3) of the theoretical methane production based on the COD content of
that waste. This value is consistent with the 124 mL CH4/g VS found by Owens and Chynoweth
(1993).
Paper waste is heterogeneous because it is made up of easily degradable paper such as office
paper, but also less degradable paper such as newspaper. It is, however, degraded faster than
garden wastes and eventually reached 146.6 mL CH4/g VS, which corresponds to 27.9% (± 2) of
the theoretical methane production on a COD basis. The value of ultimate methane production
was close to the value reported in the literature (Owens and Chynoweth, 1993).
The feedstock had an intermediate behaviour, as expected because it consisted of a mixture
of the three wastes; the ultimate methane potential was estimated to be 239.1 mL CH4/g VS,
which is 45.5% (± 2) of the theoretical methane production based on the COD content of the
feedstock. The methane yield was consistent with values reported in the literature. For instance,
Nopharatana et al. (2006) found 0.24 l CH4/g VS.
As a conclusion to this test, the BMP revealed that 46% of COD of the feedstock was converted
to methane, which is close to the value found by Nopharatana et al. (2006) who carried out a
BMP test on the OFMSW (48%). Moreover, 87% of the total methane production was obtained in
32 days. Better performance could probably be obtained with an acclimatised biomass. After 177
days, all the bottles contained a gas in the head space with a methane percentage comprised
between 50 and 60%. All the experimental results and the Gompertz coefficients are gathered
in Table 3.7.
Table 3.7: Gompertz coefficients and experimental ultimate biodegradabilities.
Waste Gompertz coefficients BMP biodegradabilityP (mL CH4) Rm (ml CH4/day) λ (day) mL CH4/g VS %
KW 397.1 72.6 5.8 357.1 66
GW 127.4 13.6 17.5 113.7 33.1PW 175.2 63.1 18.4 146.6 27.9Feedstock 237 13.8 4.5 243.8 46
3.5.2.3 Effect of Biomass Acclimatisation on the Yield: Another BMP test was carried out on
the OFMSW to determine the influence of acclimatisation on the methane production rate. The
acclimatised biomass was taken from a 4-L chemostat batch-fed with leachate from OFMSW
and operating at 20 days HRT; the mixing was stopped 2 days prior to effluent removal in order
to let the biomass settle and to keep it within the chemostat. The leachate was produced in
95

Chapter 3. MATERIALS AND METHODS
another 4L chemostat batch fed with the OFMSW at an OLR of 1 g VS/L.day. The unacclimatised
biomass was taken from a drum containing anaerobic sludge from a conventional sewage sludge
anaerobic digester (Mogden, UK). In order to compare the two inocula, their VSS content was
adjusted to 0.5 g VSS/L and the BMP test was conducted in duplicates at an initial I/S ratio of
0.25.
Figure 3.4: Effect of the acclimatisation of the biomass on the Biochemical Methane Po-tential test of OFMSW. The error bars show the standard deviation.
Figure 3.4 shows that an acclimatised biomass resulted in a similar methane potential. However,
the lag phase (obtained by the Gompertz equation 3.11) was found to be significantly shorter
for the acclimatised biomass: 1.4 days versus 7 days. It is suggested that the acclimatised
biomass includes microorganisms producing more enzymes compared to the unacclimatised
ones. It can be seen that the unacclimatised inoculum gives a sluggish methane production
rate but eventually both curves reached similar ultimate biodegradability circa 250 ml CH4/g VS.
Based on the COD content, the biodegradability was 49.6 and 47.7% for the acclimatised and
the unacclimatised inocula, respectively.
The biochemical methane potential assay can be used to determine the hydrolysis constant if
the biodegradation kinetics is assumed to follow a first-order reaction according to (Lee et al.,
2009):
r = −k · S (3.12)
where k is the reaction rate constant (d-1), S is the substrate concentration (g VS/l) and t is the
time (days). Integrating Equation 3.12 with initial and final boundary conditions,
ln
(
S
S0
)
= −kt (3.13)
96

Chapter 3. MATERIALS AND METHODS
The production of methane is related to the substrate degradation by
S
S0=
Ymax − Y
Ymax(3.14)
where Y is the cumulative methane yield at time t and Ymax is the ultimate methane yield. From
Equations 3.13 and 3.14:
ln
(
Ymax
Ymax − Y
)
= kt (3.15)
Using the data from the BMP using acclimatised inoculum and by plotting Equation 3.15, the
slope gave the value of the hydrolysis constant as 0.21 d-1 (R2 = 0.976). Thus the kinetics of
gas production is satisfactorily predicted with the first-order model.
3.5.2.4 Heavy Metals: The heavy metals content of the OFMSW used in this study are listed
in Table 3.8. The high content of calcium, iron, sodium and potassium can be pointed out in this
table. These are presumably due to KW. Zhang et al. (2007) carried out an elemental analysis
of food waste and found concentrations of 21600, 766, 900 and 1400 ppm for calcium, iron,
potassium and magnesium, respectively.
Table 3.8: Heavy metal concentrations in the simulated MSW (standard deviation is in-dicated in brackets for sample in triplicate).
Element Ca Fe Na K Mg Znppm of TS 38698.66 (4733.6) 2325.39 (266.3) 2256.59 (265.5) 1848.02 (208.5) 821.34 (93.9) 588.17 (66.3)
Element Al Mn Cu Co B Pbppm of TS 551.94 (66.9) 88.75 (10) 47.79 (5.4) 45.16 (5.1) 25.73 (4.4) 8.93 (3.6)
Element W Ni Cr Cd V Moppm of TS 6.83 (0.9) 4.73 (0.9) 4.2 (0.5) 2.1 (0.2) ≤ 2.6 ≤ 2.6
97

Chapter 4
EFFECT OF ACETIC ACID ON THE
CHEMICAL HYDROLYSIS OF THE
OFMSW1
4.1 INTRODUCTION
Lignocellulosic substrates is a general term for material containing cellulose, hemicellulose and
lignin, and includes Municipal Solid Waste (MSW), wood, grass, leaves, paper, wheat straw,
etc. Most of the cellulose is organized into highly ordered crystalline regions, in which cellulose
chains or fibrils are so tightly packed that even water molecules scarcely penetrate; cellulose is
accordingly water insoluble. Less ordered portions of the assembly, called amorphous regions,
typically comprise about 5% of the cellulose microstructure (Bailey and Ollis, 1986). These amor-
phous regions are easily hydrolysed by, for example, acids; the crystalline regions on the other
hand are much more difficult to decompose. Hemicellulose is easily hydrolysed to soluble prod-
ucts even in hot water (Hendriks and Zeeman, 2009), however, the lignin casing which encloses
the polysaccharide components of biomass is much more recalcitrant. Lignin is a complex and
heterogeneous material and its random arrangement makes it very resistant to chemical and en-
zymatic attack. The lignocellulosic complex prevents enzymes from accessing the degradable
cellulose, and some studies have suggested that enzymes may adsorb preferentially onto lignin
which results in unproductive enzyme binding (Kristensen et al., 2007). As both accessibility of
enzymes to the solid matter and hydrolysis of complex compounds constitute the rate-limiting
step during anaerobic degradation (Eastman and Ferguson, 1981), pre-treatment of the sub-
strate is beneficial for the rate and extent of the anaerobic process, the biogas yield and mass
reduction of anaerobic sludge (Xiao and Clarkson, 1997; Delgenes et al., 2002).
Cellulose structure (crystallinity, specific surface area and degree of polymerisation) can be al-
tered by a variety of pre-treatments such as comminution (Hills and Nakano, 1984), γ-irradiation,
pyrolysis, ozonation, aerobic digestion, enzyme addition (Scheidat et al., 1999), thermal hydroly-
sis, wet air oxidation and acidic or caustic chemicals (Datta, 1981). Chemicals have been widely
used to break down the close association between cellulose and lignin, thereby increasing the
1Submitted in part for publication as Trzcinski, A.P. and Stuckey, D.C., ”Contribution of acetic acid to the hydrolysisof the Organic Fraction of Municipal Solid Waste”. Biomass and Bioenergy.
98
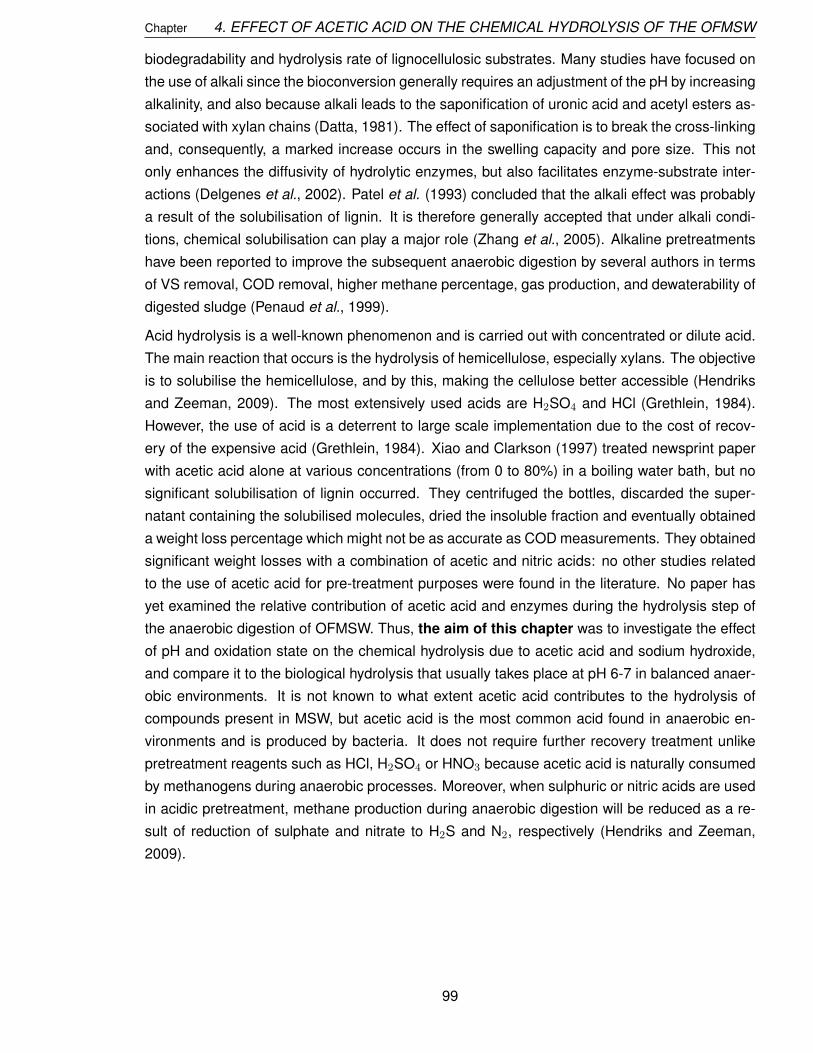
Chapter 4. EFFECT OF ACETIC ACID ON THE CHEMICAL HYDROLYSIS OF THE OFMSW
biodegradability and hydrolysis rate of lignocellulosic substrates. Many studies have focused on
the use of alkali since the bioconversion generally requires an adjustment of the pH by increasing
alkalinity, and also because alkali leads to the saponification of uronic acid and acetyl esters as-
sociated with xylan chains (Datta, 1981). The effect of saponification is to break the cross-linking
and, consequently, a marked increase occurs in the swelling capacity and pore size. This not
only enhances the diffusivity of hydrolytic enzymes, but also facilitates enzyme-substrate inter-
actions (Delgenes et al., 2002). Patel et al. (1993) concluded that the alkali effect was probably
a result of the solubilisation of lignin. It is therefore generally accepted that under alkali condi-
tions, chemical solubilisation can play a major role (Zhang et al., 2005). Alkaline pretreatments
have been reported to improve the subsequent anaerobic digestion by several authors in terms
of VS removal, COD removal, higher methane percentage, gas production, and dewaterability of
digested sludge (Penaud et al., 1999).
Acid hydrolysis is a well-known phenomenon and is carried out with concentrated or dilute acid.
The main reaction that occurs is the hydrolysis of hemicellulose, especially xylans. The objective
is to solubilise the hemicellulose, and by this, making the cellulose better accessible (Hendriks
and Zeeman, 2009). The most extensively used acids are H2SO4 and HCl (Grethlein, 1984).
However, the use of acid is a deterrent to large scale implementation due to the cost of recov-
ery of the expensive acid (Grethlein, 1984). Xiao and Clarkson (1997) treated newsprint paper
with acetic acid alone at various concentrations (from 0 to 80%) in a boiling water bath, but no
significant solubilisation of lignin occurred. They centrifuged the bottles, discarded the super-
natant containing the solubilised molecules, dried the insoluble fraction and eventually obtained
a weight loss percentage which might not be as accurate as COD measurements. They obtained
significant weight losses with a combination of acetic and nitric acids: no other studies related
to the use of acetic acid for pre-treatment purposes were found in the literature. No paper has
yet examined the relative contribution of acetic acid and enzymes during the hydrolysis step of
the anaerobic digestion of OFMSW. Thus, the aim of this chapter was to investigate the effect
of pH and oxidation state on the chemical hydrolysis due to acetic acid and sodium hydroxide,
and compare it to the biological hydrolysis that usually takes place at pH 6-7 in balanced anaer-
obic environments. It is not known to what extent acetic acid contributes to the hydrolysis of
compounds present in MSW, but acetic acid is the most common acid found in anaerobic en-
vironments and is produced by bacteria. It does not require further recovery treatment unlike
pretreatment reagents such as HCl, H2SO4 or HNO3 because acetic acid is naturally consumed
by methanogens during anaerobic processes. Moreover, when sulphuric or nitric acids are used
in acidic pretreatment, methane production during anaerobic digestion will be reduced as a re-
sult of reduction of sulphate and nitrate to H2S and N2, respectively (Hendriks and Zeeman,
2009).
99

Chapter 4. EFFECT OF ACETIC ACID ON THE CHEMICAL HYDROLYSIS OF THE OFMSW
4.2 EXPERIMENTAL AND ANALYTICAL DETAILS
4.2.1 Chemical hydrolysis
To study the influence of acidity/alkalinity of the medium on chemical hydrolysis, pHs 4, 5, 6, 7
and 9 were tested. Serum bottles of 120 mL were used as batch reactors, and a bottle labelled
”pH not controlled” (referred to as the control) was also run to investigate the potential benefits
of low or high pHs. The simulated OFMSW was prepared according to the protocol given in
Section 3.5. The OFMSW feedstock was autoclaved (120 ˚ C for 20 minutes) to sterilize the
OFMSW. Two grams of OFMSW slurry (equivalent to 200 mg of OFMSW on a dry matter basis
and approximately 170 mg on a volatile solids basis) were added to each bottle and tap water
was added to reach a final volume of 100ml. Preliminary tests revealed that acidogenic bacteria
could grow in the control bottle because the acetic acid concentration doubled in 2 days (data
not shown). Therefore, in order to study the effect of pH only, bacterial growth was inhibited by
adding K2Cr2O7 so that a final concentration of 100 mg Cr/l was obtained. Such a high chromium
level was deemed lethal according to Aquino and Stuckey (2004). The pH was then carefully
adjusted to 4, 5, 6, 7 and 9 by adding drops of diluted acetic acid or NaOH. The bottles were
placed on an orbital shaker at 30 ˚ C. All bottles were run in triplicate, and the values reported are
the mean of the 3 values. Samples for SCOD and acetic acid analysis were taken on day 2, 5, 10,
15, 20 and 25. After the sample was taken, the pH was readjusted if necessary, and the bottles
re-capped. The value of acetic acid was converted to COD by multiplying its concentration
by 1.07 (Aquino and Stuckey, 2004) and then subtracting it from the Soluble COD concentration
measured in order to obtain the actual SCOD concentration that reflects the chemical hydrolysis.
4.2.2 Enzymatic hydrolysis
To study the hydrolysis due to enzymes secreted by bacteria, an inoculum (TSS = 2.7 g/L, VSS
= 2.07 g/L) from a CSTR fed on the same substrate as the one in this study at 10 days HRT was
added with the two grams of OFMSW slurry so that an inoculum to substrate ratio (I/S) of 1.2 was
obtained. The inoculum was previously centrifuged at 3,000 rpm for 20 minutes in order to dis-
card the debris present in the supernatant. In order to study the hydrolysis, methanogenesis was
inhibited by adding Sodium Bromoethanesulfonate (BES) so that a final concentration of 10-5 M
of BES was obtained in the 100 mL bottle (Smith, 1983). The inhibition was regularly confirmed
by sampling the headspace gas by gas chromatography. The bottles were then filled to 100 mL
with biomedium defined by Owen et al. (1979) and flushed with a CO2/N2 mixture (30/70%) for 5
minutes to obtain anaerobic conditions. A biological control with inoculum, biomedium and BES
but no OFMSW was run as well and its SCOD was subtracted from the SCOD obtained from the
hydrolysis of OFMSW in order to obtain the SCOD that reflects enzymatic hydrolysis. The bot-
tles were capped with rubber septum-type stoppers which were secured with 20 mm aluminium
crimp seals, and placed on an orbital shaker at 30 ˚ C. All bottles were run in triplicate, and the
values reported are the mean of the 3 values.
100

Chapter 4. EFFECT OF ACETIC ACID ON THE CHEMICAL HYDROLYSIS OF THE OFMSW
4.3 RESULTS AND DISCUSSION
4.3.1 Chemical hydrolysis
The pH in the control bottle with no acid or alkali remained between 6.4 and 6.7, while the SCOD
increased from 250 mg/L on day 2 to 280 mg/L on day 25 (dotted line in Figure 4.1). The initial
SCOD was assumed to be zero as tap water was added to the bottles. The SCOD of 250 mg/L
on day 2 in the control thus represents the soluble compounds present in the OFMSW slurry
prepared for the experiment, plus some compounds possibly hydrolysed due to autoclaving the
OFMSW slurry. The effect of autoclaving the OFMSW prior to the experiment has been verified
by running two additional sets of bottles, with and without autoclaving the OFMSW. The SCOD in
the supernatant was 195 (± 18) and 200 (± 11) mg/l with and without autoclaving the feedstock,
respectively, thus showing no significant impact.
Figure 4.1: Experiment 1: Evolution of Soluble COD during chemical hydrolysis of MSWat different pHs under oxidative environments in comparison with bacterialhydrolysis of MSW. Oxido-reduction potentials are shown in brackets. Thedotted line is the control bottle. The error bars show the standard deviationof triplicate bottles.
The slight increase from 250 to 280 mg SCOD/L in the control bottle without acid/alkali is likely
to be due to the temperature and mixing effects that slowly decompose the waste with time.
Analysis of the headspace gas composition (before each sampling) revealed that no methane
was produced during the 25 days of experiment (data not shown). Furthermore, the acetic acid
concentration in the control remained at 10 mg/l during the whole run. These two arguments
reinforce the initial statement that the autoclave sterilized the OFMSW slurry and that chromium
addition prevented archaeal and bacterial growth, which confirmed that only the effect of chemi-
cal hydrolysis was investigated, and not bacterial hydrolysis.
101

Chapter 4. EFFECT OF ACETIC ACID ON THE CHEMICAL HYDROLYSIS OF THE OFMSW
The graph indicates that the curves of pH 5, 6, 7 and the control levelled out after 2 days at
very similar values showing that acetic acid concentrations in the range 50 - 500 mg/l had no
chemical effect on the solubilisation of the OFMSW. In contrast, at pH 4 we obtained an acetic
acid concentration of 1600 mg/l, and a significant solubilisation was observed compared to the
control. It was found that 20% of the COD became soluble whereas only 12% in the control and
at pH 7. Furthermore, the results indicate that undissociated acetic acid had a greater influence
than acetate ion in the enhanced solubilisation at pH 4. Indeed, the acetate ion concentration
was relatively similar in the pH 4, 5 and 6 bottles in the range 200 - 340 mg/l, while the undisso-
ciated acid concentration was 1400, 190 and 11 mg/l. This is because 85% of the acid is in the
undissociated form at pH 4 while at pH 5, 6 and 7 this fraction is 36, 5 and 0.5%, respectively.
Interestingly, on day 25 the pH 9 bottle had a significantly lower SCOD than the control. The
NaOH concentration used in this study was probably very low because diluted NaOH was added
dropwise to adjust the pH to 9, whereas pHs 12 and above are typically reported for alkaline
pretreatments (the dissolution of 1g NaOH in 1L tap water gives rise to pH12). This negative
effect of NaOH could possibly be due to the precipitation of NaOH with chromium which can
precipitate as chromium hydroxide. Esmaeili et al. (2005) reported that the optimum pH for
precipitating chromium in a tannery wastewater with NaOH was 8.5-9.5. When precipitating,
soluble organics might have been trapped in the hydroxide sludge (CrOH), thereby reducing the
SCOD in the supernatant. Another point is that pH 9 was particularly difficult to control and
frequent adjustments had to be made; the pH dropped systematically and sometimes ended up
between 7 and 8. This was probably due to the reaction with CO2 which consumed NaOH and
therefore brought the pH back to neutral:
2 NaOH(aq.) + 2 CO2 → 2 Na+ + 2HCO−
3 (4.1)
This was confirmed by a vacuum in the headspace when a gas sample was attempted to be
taken. Finally, the ORP in the bottle was measured, and the average value of the triplicates is
shown in brackets in Figure 4.1. It shows the tendency of a chemical species (e.g. Chromium)
to acquire electrons and thereby be reduced; the more positive the potential, the greater the
chromium’s affinity for electrons. The redox potential was the highest at pH 4 (+439 mV) and
the lowest at pH 9 (+155 mV). These different redox values cannot be attributed to the potas-
sium dichromate as each bottle received the same amount, but rather are due to the amount of
acetic acid/NaOH added to adjust the pH. Potassiun dichromate (K2Cr2O7) can be present as
dichromate(VI) Cr2O2−7 at low pHs or chromate(VI) CrO2−
4 at high pHs; chromium may also exist
as the ion Cr(III). However, thermodynamic factors indicate that in pure water at natural pH and
redox conditions, the Cr(VI) form will predominate (Elderfield, 1970). Bartlett and Kimble (1976)
have reported that Cr(VI) can react with dissolved oxidizable organic matter to form Cr(III). In the
present study, the high concentration of acetic acid in pH 4 bottles may have been responsible
for the high redox potential (+439 mV) which may in turn have caused the Cr(VI) to have a higher
tendency to oxidize the organic matter and thereby be reduced to Cr(III) compared to bottles at
lower redox potentials. However, in this study, the small quantity of Chromium (10 mg in each
bottle) is unlikely to be responsible for the enhanced solubilisation at pH 4. However, it seems
102

Chapter 4. EFFECT OF ACETIC ACID ON THE CHEMICAL HYDROLYSIS OF THE OFMSW
that acetic acid was responsible for the higher redox potential at pH 4 and this showed a higher
tendency to gain electrons from the MSW and thereby oxidise it to a significantly greater extent.
4.3.2 Enzymatic hydrolysis
Hydrolysis proceeds by adsorption of exocellular enzymes onto the particulate substrate, to-
gether with their reaction with the soluble substrate (Noike et al., 1985), and also by attachment
of the enzyme producing bacteria to the organic substrate particles (Vavilin et al., 1996). The
pH in the inoculated bottles was never adjusted, and remained between 6.3 and 6.5 throughout
the experiment: optimum pH for hydrolysis has been reported to be 6 - 6.5 (Vieitez and Ghosh,
1999). According to Zhang et al. (2005), pH 7 gives rise to the highest solubilisation and acidifi-
cation of kitchen wastes, and they also claimed that most of the protein was degraded to NH+4 at
pH 7, whereas amino acids predominated at other pH levels. He et al. (2006) also found that pH
7 or above favoured protein hydrolysis, higher protease activity and higher ammonia production.
As Figure 4.1 shows, the SCOD increased rapidly due the enzymatic activity of bacteria which
converted the particulate material into soluble molecules. The absence of a lag phase suggests
that the inoculum was well acclimatised to the substrate. After 10 days, the curve reached
a plateau meaning that the residual COD was hardly being hydrolysed. In this experiment,
enzymatic hydrolysis achieved 54% solubilisation of the total COD fed to the bottle and this was
significantly greater than the chemical hydrolysis at pH 4. The regular analysis of headspace gas
revealed that the methane content was around 0.1% at the beginning and reached a maximum
of 2% on day 25 showing that BES inhibition was working well, but its effect slightly decreased
after prolonged incubation in mixed culture. Nevertheless, it was calculated that the cumulative
methane released accounted for only 2 mg of the total COD balance taking into consideration
that 0.39 ml CH4 is produced per mg COD destroyed at 30 ˚ C. This confirmed that the BES
inhibition was efficient during the whole run due to negligible amounts of methane produced.
4.3.3 Reduced conditions
A similar experiment was carried out under reduced conditions, i.e. negative redox potentials
which are found in anaerobic environments. This time bottles were adjusted to pHs 4, 5, 6, 7
with acetic acid and pH 9 with NaOH, and the oxido-reduction potential was adjusted to between
-100 and -200 mV by means of a diluted Na2S.9H2O solution; potassium dichromate was also
added to avoid bacterial growth. These bottles were regularly adjusted over three days to reach
the required pH/redox equilibrium, and then the OFMSW was added and the experiment was
started. Separate bottles with inoculum (TSS = 11.8 g/L, VSS = 7.4 g/L and I/S = 4.4) and Owen
et al.’s (1979) biomedium were also prepared to compare the biological hydrolysis of MSW and
α-cellulose (Sigma-Aldrich) which were fed on the same COD basis assuming that α-cellulose
was C6H10O5.
Similarly to oxidative conditions, the results (see Figure 4.2) also indicate that there is a positive
effect of acetic acid at pH 4 on the chemical hydrolysis of the OFMSW, and again it was due to
103

Chapter 4. EFFECT OF ACETIC ACID ON THE CHEMICAL HYDROLYSIS OF THE OFMSW
Figure 4.2: Experiment 2: Evolution of Soluble COD during chemical hydrolysis of MSWat different pHs under a controlled reducing environment in comparison withbacterial hydrolysis of alpha-cellulose. The dotted line is the control bottle.The error bars show the standard deviation of triplicates.
the undissociated acid concentration: at pH 4 and 5, the acetate ion concentrations were similar
at 1450 and 1560 mg/l, respectively, while the undissociated acid concentration were 8800 and
820 mg/l, respectively, which resulted in about 770 mg/l SCOD in the supernatant at pH 4 versus
200 mg/l at pH 5. Moreover, the SCOD concentration at pH 4 was 125% greater than at pH 7,
and the solubilisation yield reached 32% at pH 4 while at other pHs and in the control it remained
in the range 8-15%. Results of experiments 1 and 2 carried out under oxidative and reduced
conditions, respectively, are gathered in Table 4.1.
An approximate mass of 170 mg VS was fed to each bottle which corresponds to a total COD
mass between 204 and 272 mg because the VS/COD ratio was in the range of 1.2 - 1.6. This
gives that the total COD concentration in each bottle was between 2040 and 2720 mg COD/l.
To reach pH 4 under reduced conditions, about 10g/l of acetic acid was required, which is a
6-fold increase compared to the concentration used for oxidative environments in the previous
experiment. However, the SCOD concentration reached a plateau after 5 to 10 days in both
experiments which shows that the chemical hydrolysis of undissociated acetic acid has a limited
effect that depends on the cellulose and hemicellulose available for chemical attack, and thus
depends on the feedstock.
An additional experiment was carried out in order to determine whether the enhanced solubilisa-
tion observed was due to the pH (H+ concentration) or the undissociated acetic acid concentra-
tion. With this in mind, three bottles were run at pH 4 using acetic acid with the same conditions
as previously described, while another set of bottles was run at pH 4 using H2SO4. To reach and
maintain pH 4 throughout the experiment using H2SO4 an equivalent volume equal to 0.077 ml
104

Chapter 4. EFFECT OF ACETIC ACID ON THE CHEMICAL HYDROLYSIS OF THE OFMSW
Table 4.1: Summary of solubilisation yields due to chemical hydrolysis obtained underoxidative and reduced conditions at various pHs and in comparison with bac-terial hydrolysis. The standard deviation is given in brackets.
Oxidative conditions Reduced conditions
Undissoc. SCOD in Solubil. Undissoc. SCOD in Solubil.Bottles Acetic acid supernatant Yield (%) Acetic acid supernatant Yield
Conc. (mg/l) Conc. (mg/l) (%)(mg/l) (mg/l)
Chemical Hydrolysis
Control 0 285 12(±1) 0 360 15(±2)
pH 4 1400 525 20(±2) 8830 770 32(±3)
pH 5 190 210 9(±1) 815 195 8(±1)
pH 6 11 320 13(±1) 45 330 14(±1)
pH 7 0.3 280 12(±1) 2 340 14(±1)
pH 9 0 140 6(±1) 0 230 10(±1)
Bacterial Hydrolysis
OFMSW - - - - 1285 54(±6)
α-cellulose - - - - 1530 64(±7)
was necessary, which corresponds to a concentration of less than 0.1% v/v. Figure 4.3 shows
that enhanced solubilisation of COD was obtained with acetic acid, whereas the OFMSW at pH
4 with sulphuric acid reached about 200 mg/l SCOD in the supernatant, which is similar to what
was observed for controls in experiments 1 and 2. Therefore, the results show that the chemical
hydrolysis of OFMSW was due to undissociated acetic acid and not the pH, but low pHs were
required to obtain high concentrations of undissociated acetic acid.
The biological hydrolysis of α-cellulose was significantly greater than MSW; these achieved 64
and 54% solubilisation of the total COD in the bottle, respectively. Alpha-cellulose is theoretically
100% degradable but microcrystalline regions may hinder the access of water and enzymes.
The crystallinity of α-cellulose was confirmed by the lower surface area (Table 4.2) compared to
MSW, and this can explain why the initial hydrolysis rate was slow compared to MSW during the
first five days. This is also probably due to the easily hydrolysed kitchen waste that contains very
little lignocellulosic material. Also, pure cellulose like the type used in this study is not found in
nature, and bacteria may have needed some time to acclimatise to this unusual form of cellulose.
The surface area was analysed with BET, and the values of samples (dried several days in an
oven at 105 ˚ C) from Experiment 2 are listed in Table 4.2 along with the pore width. Interestingly,
the enhanced solubilisation did not correlate with the surface area but instead with the pore
width which is calculated as four times the volume divided by the area. This measure indicates
that undissociated acetic acid acts as a swelling agent that can increase the pore width of the
lignocellulosic material. It is likely that undissociated acetic acid had a positive effect on the
solubilisation of kitchen waste because it contains little lignin, but maybe no effect on paper
105

Chapter 4. EFFECT OF ACETIC ACID ON THE CHEMICAL HYDROLYSIS OF THE OFMSW
Figure 4.3: Comparison of the chemical hydrolysis of the OFMSW at pH 4 with acetic acidand sulphuric acid. The error bars show the standard deviation of triplicates.
waste, which can explain why the enhanced solubilisation did not correlate with the surface
area.
Table 4.2: BET surface area and pore width of dried samples from Experiment 2 treatedunder different conditions. The standard deviation was less than 0.01.
Sample BET surface area Pore width (= 4·V/A)(m2/g) (nm)
OFMSW treated at pH 4 2.4 15.4
OFMSW treated at pH 5 3.7 12.5
OFMSW treated at pH 6 3.3 12.3
OFMSW treated at pH 7 4.1 13
OFMSW treated at pH 9 2.3 12.8
OFMSW at non controlled pH 3.9 13.2
Untreated OFMSW 1.2 8.2
Autoclaved OFMSW 1.2 7.7Untreated α-cellulose 1 11.8
4.3.4 Hydrolysis constant
The enzymatic hydrolysis experiment analysed in the previous section could actually be used as
a method to calculate the hydrolysis constant. For this purpose, first-order kinetics in substrate
was chosen to describe the mechanisms taking place during hydrolysis:
r = −k · S (4.2)
where r represents the reaction rate, k the hydrolysis constant and S the concentration of fer-
mentable particulate matter, for instance volatile solids. Conventional techniques for assessing106

Chapter 4. EFFECT OF ACETIC ACID ON THE CHEMICAL HYDROLYSIS OF THE OFMSW
Figure 4.4: Plot of ln (SCOD(t)) versus 1/t to find the intercept SCODmax in equation4.6 (top). Comparison between the experimental data and the SCOD valuesestimated with Equation 4.4 (bottom).
the hydrolysis constant in a batch reactor involves the analysis of dissolved COD and VFAs in
addition to methane production (Sanders et al., 2002; Lee et al., 2009). This method is time-
consuming and requires the use of a gas chromatograph for VFAs or methane content. The
method described in this section is based on the selective inhibition of one step of anaerobic
digestion (methanogenesis), so that only one analysis (SCOD) is sufficient to determine the hy-
drolysis constant, which is particularly useful if no GC is available in the laboratory. Moreover,
traditional measurement of methane production for calculation of the hydrolysis constant can
be wrong since lag-phase can occur due to inhibition of methanogens by hydrogen or by the
substrate itself. In this novel method, factors affecting methanogenesis are not relevant since it
107

Chapter 4. EFFECT OF ACETIC ACID ON THE CHEMICAL HYDROLYSIS OF THE OFMSW
Table 4.3: Values of the First-Order Kinetic Constant for Hydrolysis of Solid OrganicWastes or Sludge. n.a. = not available.
Value of k Temperature References(d-1) ( ˚ C)
0.18 30 This study
0.11 20 (Bolzonella et al., 2005)
0.11 - 0.15 20 (Moser-Engeler et al., 1999)
0.03 - 0.15 20 (Veeken and Hamelers, 1999)
0.081 - 0.139 35 (Zeeman et al., 1999)
0.25 35 (Traverso et al., 2000)
0.24 - 0.47 40 (Veeken and Hamelers, 1999)
0.01 - 0.2 55 (Christ et al., 2000)
0.1 - 0.25 n.a. (Vavilin et al., 1999)
is selectively inhibited, and therefore the calculation of the hydrolysis constant is based on the
truest definition of hydrolysis. The following kinetic expression was adapted from Redzwan and
Banks (2004) who used a similar expression for cumulative methane production in a batch-fed
anaerobic reactor:
SCOD(t) = SCODmax ·(
1− exp(
−k′t))
(4.3)
ln
(
SCODmax
SCODmax − SCOD(t)
)
= k′t (4.4)
where t is the time in days and SCODmax is the maximum cumulative SCOD production. As
highlighted by Redzwan and Banks (2004), the value of SCODmax cannot always be repre-
sented by the experimental maximum value of SCOD obtained at the end of a batch feed cycle.
To obtain an actual value for SCODmax would involve running the experiment for a longer period,
theoretically to infinity. To overcome this problem, a non-linear function was used (Vavilin et al.,
2000):
SCOD(t) = SCODmax · exp(m
t
)
(4.5)
ln (SCOD(t)) = ln (SCODmax) +m
t(4.6)
Values of the coefficients were determined from a plot of ln SCOD(t) against 1/t, and a good
correlation was obtained (R2 = 0.998). Using the value of SCODmax in equation 4.4, the value
of the hydrolysis constant was found to be equal to 0.18 d-1. However, this value is thought to be
underestimated because native microorganisms present in OFMSW were killed by autoclaving
before the experiment. Also, some SCOD might have been used for bacterial growth although
this is considered as negligible in batch anaerobic experiments due to their slow growth rates
(Sanders et al., 2002). However, the presence of air introduced during sampling might have
been responsible for some growth of aerobic and facultative bacteria. The value of 0.18 d-1 is
108

Chapter 4. EFFECT OF ACETIC ACID ON THE CHEMICAL HYDROLYSIS OF THE OFMSW
relatively close to the one found in Section 3.5.2.3 (=0.21 d-1) found by applying the conventional
method consisting of measuring the methane production.
Previous work on the hydrolysis constant of the OFMSW showed that the value ranges between
0.01 and 0.4 d-1 (see Table 4.3). However, a trend can be discerned in the literature; the hydrol-
ysis constant is close to 0.1 d-1 under psychrophilic conditions and goes up to some 0.2-0.3 d-1
in mesophilic or thermophilic environments (Bolzonella et al., 2005).
4.4 SUMMARY
In this chapter it has been shown that:
• Significant chemical hydrolysis by undissociated acetic acid can take place under oxidative
and reduced environments. An undissociated acid concentration of about 1.4 g/L allowed
20% of the COD fed to be solubilised under oxidative conditions, whereas only 12% was
achieved in the control. Under reduced environments the solubilisation yield at 8.8 g/l of
undissociated acid concentration reached 32%, which corresponded to a SCOD of about
770 mg/l in the supernatant. Surface area analysis revealed that acetic acid chemically
hydrolyses the OFMSW by increasing the pore width. However, low pHs were required
to obtain high concentrations of undissociated acetic acid; this could be a problem for
anaerobic digestion as undissociated acids can be inhibitory.
• The bacterial hydrolysis of the OFMSW reached 54% solubilisation, whereas α-cellulose
yielded 64% of SCOD.
• A novel method has been used to determine the hydrolysis constant of the OFMSW. By
selectively inhibiting methanogenesis, the evolution of hydrolysis can be followed by sim-
ple COD analysis only without using a gas chromatograph for VFAs or methane analysis.
Another advantage of the method is that it relies on the truest definition of hydrolysis be-
cause the value of the hydrolysis constant is not affected by potential delays in methane
production due to hydrogen since methanogenesis is inhibited. The hydrolysis constant
was found to be 0.18 d-1 which is close to literature data.
109

Chapter 5
BATCH TREATMENT OF THE OFMSW
IN A TWO-STAGE PROCESS1
5.1 INTRODUCTION
A major issue in the UK is the shortage of landfills where MSW is disposed of. Another issue
which is a consequence of landfilling is the percolating rainwater that leads to the generation
of a highly contaminated wastewater called leachate. Current technologies for treating leachate
include aerobic biological reactors but this technology requires large footprints and high costs
(Li and Zhao, 2003). Unlike aerobic treatment, anaerobic digestion (AD) is an energy producing
process that is becoming very attractive due to more restrictive legislation.
Many studies on the OFMSW involve the treatment of a batch in two successive tanks where the
leachate from the first one (called a leach-bed or landfill cell) is sprayed over the top of the sec-
ond tank after acidification has taken place (Vieitez and Ghosh, 1999). Leach bed systems are
technically simple but require a large footprint which make them comparable to aerobic compost-
ing. Moreover, they suffer from a slow and limited solubilisation because of channelling problems
(Vandevivere et al., 2003), and the absence of effective mixing which has been shown to be good
because it ensures intimate contact between microorganisms and substrate, and because it can
break the physical association existing in ligno-cellulosic material (Yadvika et al., 2004). One
technical shortcoming of leach bed and other batch systems, is the plugging of the perforated
floor, resulting in the blockage of the leaching process. However, this can be alleviated by means
of a bulking material such as wood chips (Vandevivere et al., 2003). Another disadvantage is
the instabilities resulting from an unbalanced population of microorganisms leading to souring
of these reactors. A consequence of these effects is the very long period required to stabilize
the OFMSW. For instance, Vieitez and Ghosh (1999) took 295 days to treat a batch of OFMSW,
Vieitez et al. (2000) took 524 days, He et al. (2005a) took 105 days, Poggi-Varaldo et al. (2005)
took 180 days, and Wang et al. (2006b) took 98 days. They suggested that the long time re-
quired was possibly due to inhibition from low pH and end-product accumulation such as fatty
acids. In contrast, shorter times and more reliable process performance can be achieved in a
Sequential Batch Anaerobic Composting Process (SEBAC) as an inoculum from a mature land-
1Submitted in part for publication as Trzcinski, A.P. and Stuckey, D.C., ”Anaerobic Digestion of the Organic Fractionof Municipal Solid Waste in a two-stage membrane process”. Water Science and Technology.
110

Chapter 5. BATCH TREATMENT OF THE OFMSW IN A TWO-STAGE PROCESS
fill cell is used to provide a balanced population of acidogenic and methanogenic bacteria, and
alkalinity to buffer pH (O’Keefe and Chynoweth, 2000). Some of these batch processes combine
a UASB with a packing material or a membrane module in order to retain more bacteria. For
instance, Jans et al. (1992) used an UASB combined with reverse osmosis and achieved over
90% COD removal.
In addition to high COD removal due to membrane rejection, the permeate of a membrane
system provides a stabilized leachate, i.e. a leachate with low BOD/COD ratio (less than 0.1)
consisting of soluble recalcitrant organics called humic substances, and a typical COD value in
the range of 500-1500 mg/L (Trebouet et al., 2001; Kurniawan et al., 2006b). Humic substances
are refractory anionic macromolecules of moderate (1000 Da - fulvic acids) to high (10,000Da
- humic acids) molecular weight (MW) and they are the major contributors of residual COD of
stabilized leachate (Wang et al., 2006b). The humic substances contain both aromatic and
aliphatic components with primarily carboxylic and phenolic functional groups (Trebouet et al.,
2001). According to the transformation pathway for lignin subunits proposed by Martin and
Haider (1971), the oxidation of side-chains of lignin structures is one of the major processes of
humification. The macro-molecule in the side chains of lignin is altered and oxidised through
time, resulting in an increase of oxidised aromatic acids and this process plays a significant role
in the formation of humic and fulvic acids in landfills. Chian (1977) found that high concentrations
of carbohydrates were present in the high MW fraction, whereas the low MW fraction contained
substantial quantities of aromatic hydroxyl and carboxylic groups.
Based on these considerations, the aim of this chapter was to investigate: (i) the use of a
novel anaerobic hydrolytic reactor (HR) where a stirrer moves inside a cylindrical mesh in order
to enhance hydrolysis by mixing and promoting intimate contact between bacteria and substrate
which should accelerate batch treatment; (ii) the use of a microfiltration membrane submerged
in the second anaerobic reactor where the leachate is stabilized and (iii) how is treatment with
these reactors related to the degree of humification of the leachate in terms of size exclusion
chromatography. The aim of this study was also to investigate the evolution with time of these
refractory organics during the batch treatment to see whether their concentration increases with
time due to the oxidation of side-chains of lignin structures.
5.2 EXPERIMENTAL AND ANALYTICAL DETAILS
5.2.1 Reactors
The HR (12.2L working volume) was an acrylic cylinder with a stainless steel mesh which fol-
lowed a concentric arrangement inside the cylinder, and had a grid of 1mm holes. The mesh
was fitted with a 150 micron polypropylene macrofilter (Spectrum Laboratories Inc.) in order to
uncouple the solid and the liquid residence times, respectively the SRT and the HRT. A stirrer
moved inside the mesh allowing two pieces of rubber to rub against the perforated mesh. The
speed of the stirrer was 40 rpm (Heidolph).
The reactors used in this study were connected in series, with the permeate of the submerged
111

Chapter 5. BATCH TREATMENT OF THE OFMSW IN A TWO-STAGE PROCESS
anaerobic membrane bioreactor being recycled to the hydrolytic reactor (Figure 1) in order to
maintain the moisture and alkalinity of the system. Both reactors were maintained at 35 ± 1 ˚ C.
The HR was batch-fed with 615 g of dry matter on day 1 (520 g VS), and with alkalinity (NaHCO3)
at a concentration of 4g equivalent CaCO3/L. Each day 0.68 liter of leachate was pumped from
the HR to the SAMBR giving rise to an HRT of 18 days and 4.4 days for the HR and the SAMBR,
respectively while the SRT in the HR was 50 days which is the duration of the batch. In the
SAMBR since on average 5 mL were taken for sampling every day, the SRT was circa 600
days. The biogas sparging rate was set at 5 liters per minute to minimize cake formation on
the membrane. A sustainable flux of 5.6 litres/(m2.hour) was applied with a transmembrane
pressure below 100 mbar.
Figure 5.1: Schematic diagram of the 2-phase process treating the organic fraction ofMunicipal Solid Waste.
5.2.2 Inoculation of Reactors
The HR was inoculated with three liters of sludge sieved through a 500 micron mesh (TSS=2.7g/L,
VSS=2.1g/L) from a CSTR fed on the same substrate as the one in this study at 10 days HRT.
The SAMBR was inoculated with a mixture of three different sludges in order to have a broad
range of bacteria; (i) from a 4L stirred tank batch-fed on effluents from a 4 litre hydrolytic reactor
at a HRT of 28 days. (ii) from a 4 litre stirred tank batch-fed (once a week) on a 8 g COD/L
feed with a composition given elsewhere (Nachaiyasit and Stuckey, 1995), except for the carbon
source which was a synthetic VFA mixture. The proportion of each VFA was based on the one
observed in the leachate of the 4 litre reactor described above. The ratio of the VFAs compared
to acetic acid was 1.2, 0.05, 0.22, 0.08, 0.23 for propionate, iso-butyrate, n-butyrate, iso-valerate,
n-valerate, respectively; (iii) from a SAMBR treating a synthetic brewery wastewater (4 g COD/L)
at 20 hours HRT with a composition given in Nachaiyasit and Stuckey (1995). The TSS and VSS
of the mixture of sludges was 8.3 and 5.7g/L, respectively.
112

Chapter 5. BATCH TREATMENT OF THE OFMSW IN A TWO-STAGE PROCESS
5.3 RESULTS AND DISCUSSION
5.3.1 Performance of the HR
The soluble COD (SCOD), total COD (TCOD) and VFAs in the HR effluent peaked together
around day 12 (Figure 5.2). From day 12 onwards the total VFA concentration decreased slowly,
as well as the SCOD, but the TCOD remained in the range of 15 to 20 g/L. This is due to the
lignin that is recalcitrant to hydrolysis and the remaining cellulose bonded to the lignin which is
only slightly accessible to enzymes. During the first 20 days, the SCOD/TCOD and VFAs/SCOD
ratios were typically between 50 and 70%, while towards the end of the run the ratios were
both below 30%. After day 34, the percentage of acidification calculated as the ratio of VFAs
(expressed as COD) to Soluble COD (Figure 5.3) also dropped suggesting that the remaining
soluble organics were hardly being hydrolysed any further into fermentable sugars and subse-
quently converted to VFAs.
The pH in the HR dropped to 5.85 when the VFAs peaked and then returned slowly to neutral
as the VFAs decreased. A more severe pH drop was avoided due to the recycling of the accu-
mulated alkalinity from the SAMBR, which highlights the advantage of keeping the effluent in the
process.
Figure 5.2: SCOD, TCOD and VFAs (as COD) in the hydrolytic reactor effluent (left axis).pHs profile in the HR and the SAMBR (right axis).
The main VFA produced was acetate at the beginning of the batch (Figure 5.4) and its concentra-
tion (≈ 3g/L) was far from inhibitory, while the pH of 6 did not inhibit acidogenesis as propionate
still increased until day 15. During the fermentation step, 80% (on a COD basis) of the amino
acids and sugars are converted to acetate, H2 and CO2, whereas 20% are converted to inter-
113

Chapter 5. BATCH TREATMENT OF THE OFMSW IN A TWO-STAGE PROCESS
Figure 5.3: Solubilisation and acidification efficiencies and methane percentage in theheadspace of the HR.
mediary products such as propionate and butyrate (Pavlostathis and Giraldo-Gomez, 1991a).
Propionate concentration was constant (2 g/L) from day 12 until day 34 as it is degraded at
a lower rate than acetate. This also indicates that during those 2 weeks propionate utilisers
might not have been sufficient in the HR and could not cope with the load due to their slow
growth kinetics (Houwen et al., 1990). Propionate oxidation is known to be the bottleneck re-
action during the methanogenesis of complex substrates because their growth rate is only 0.13
d-1 (Wallrabenstein et al., 1995). As the oxidation of propionate and butyrate is only thermody-
namically favourable at a very low hydrogen concentration (Zehnder, 1988), it is presumed that
hydrogen was the reason for the stagnant propionate levels. Another explanation for the stable
propionate concentration could be a dilution effect as the VFA rich effluent was continuously fed
to the SAMBR and the SAMBR permeate that was low in VFAs was continuously recycled to the
HR. Because of the recycle, the VFA concentration did not reach levels that would have been
found in a single stage process.
Acetic acid concentration started to decrease after day 9 due to acetoclastic methanogens and
this was associated with the methane percentage which increased to 20% in the HR headspace
on day 40 (Figure 5.3). Propionate concentration started to decrease after day 34. Among the
other VFAs, n-butyrate never exceeded 408 mg/L on day 12. The other VFAs were insignificant
with concentrations below 100 mg/L throughout the batch (data not shown).
On day 43, the macrofilter had to be removed due to mechanical problems, but very few VFAs
were produced afterwards and eventually VFA concentrations dropped to virtually zero on day
55.
114
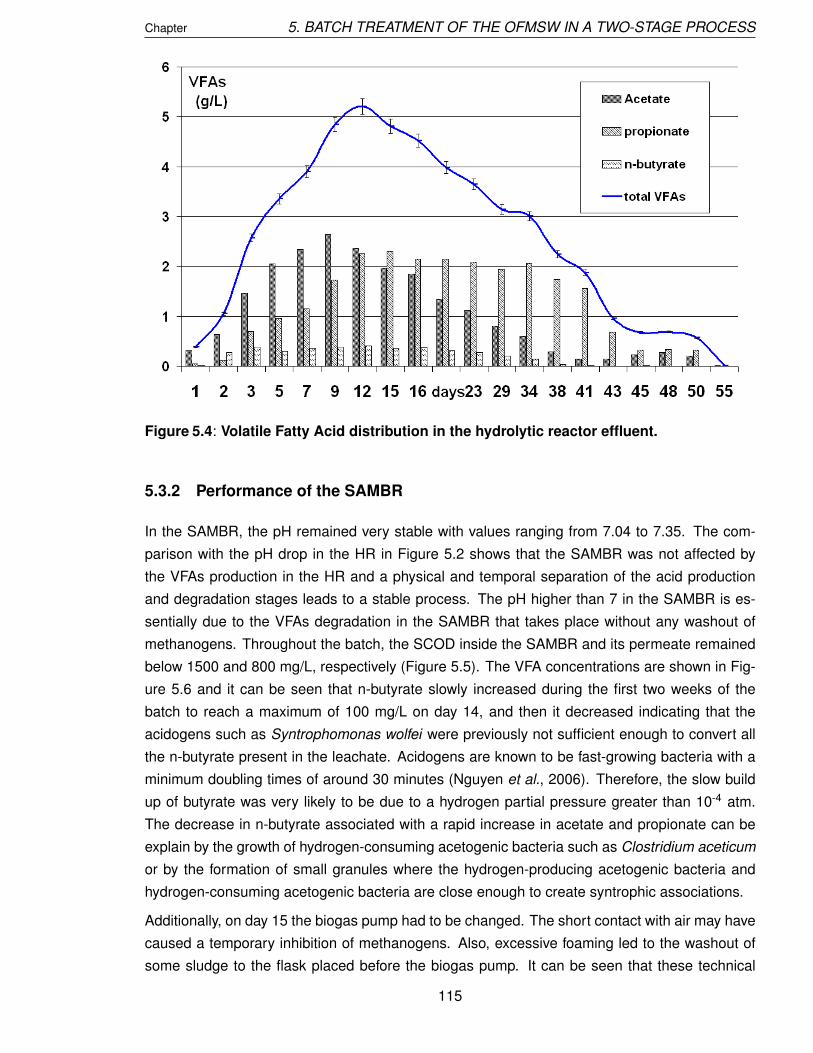
Chapter 5. BATCH TREATMENT OF THE OFMSW IN A TWO-STAGE PROCESS
Figure 5.4: Volatile Fatty Acid distribution in the hydrolytic reactor effluent.
5.3.2 Performance of the SAMBR
In the SAMBR, the pH remained very stable with values ranging from 7.04 to 7.35. The com-
parison with the pH drop in the HR in Figure 5.2 shows that the SAMBR was not affected by
the VFAs production in the HR and a physical and temporal separation of the acid production
and degradation stages leads to a stable process. The pH higher than 7 in the SAMBR is es-
sentially due to the VFAs degradation in the SAMBR that takes place without any washout of
methanogens. Throughout the batch, the SCOD inside the SAMBR and its permeate remained
below 1500 and 800 mg/L, respectively (Figure 5.5). The VFA concentrations are shown in Fig-
ure 5.6 and it can be seen that n-butyrate slowly increased during the first two weeks of the
batch to reach a maximum of 100 mg/L on day 14, and then it decreased indicating that the
acidogens such as Syntrophomonas wolfei were previously not sufficient enough to convert all
the n-butyrate present in the leachate. Acidogens are known to be fast-growing bacteria with a
minimum doubling times of around 30 minutes (Nguyen et al., 2006). Therefore, the slow build
up of butyrate was very likely to be due to a hydrogen partial pressure greater than 10-4 atm.
The decrease in n-butyrate associated with a rapid increase in acetate and propionate can be
explain by the growth of hydrogen-consuming acetogenic bacteria such as Clostridium aceticum
or by the formation of small granules where the hydrogen-producing acetogenic bacteria and
hydrogen-consuming acetogenic bacteria are close enough to create syntrophic associations.
Additionally, on day 15 the biogas pump had to be changed. The short contact with air may have
caused a temporary inhibition of methanogens. Also, excessive foaming led to the washout of
some sludge to the flask placed before the biogas pump. It can be seen that these technical
115

Chapter 5. BATCH TREATMENT OF THE OFMSW IN A TWO-STAGE PROCESS
Figure 5.5: SCOD and VFAs (as COD) within the SAMBR and in its permeate.
problems may have stressed the methanogens and led to a noticeable increase in acetic and
propionic acids in the permeate. After day 30 the VFA concentrations remained below 50 mg/L
in the reactor and its effluent, while the SCOD remained below 370 mg/L in the effluent. This
residual SCOD may be refractory molecules as well as SMPs produced by the bacteria. The
SCOD removal in the SAMBR (based on the SCOD in the HR effluent) was greater than 95%
throughout the experiment (Figure 5.7). The organic loading rate (OLR) to the SAMBR was
variable over time due to variability in the leachate TCOD concentration. Nevertheless, the
average OLR was 3.7 g COD/L.day with a maximum at 5.3 g COD/L.day on day 15 (Figure 5.7).
Regarding the methane content of the biogas, the first measurement on day 7 gave 58% which
confirmed the methanogenic activity of the SAMBR and emphasized the rapid start up of the
SAMBR. Afterward the methane content slowly increased to 68% at the end of the batch while
the CO2 and N2 content was 24.7 and 7.7 %(vol.), respectively.
5.3.3 Total and Volatile Solids Concentrations
The HR was started at a total and volatile suspended solids concentration of 49 and 41 g/L,
repectively. The TSS and VSS decreased to 25 and 24.5 g/L, respectively, after 41 days mean-
ing that solids were hydrolysed and solubilised (Figure 5.8): this is a 49 and 40% removal re-
spectively for TSS and VSS in the HR only.
Because the macrofilter used in the HR may have moved due to the stirrer, it is likely that solids
bigger than the 150 micron pore size of the macrofilter were pumped and transfered to the
SAMBR. Solids were indeed observed in the feeding tube to the SAMBR. As a result the increase
116

Chapter 5. BATCH TREATMENT OF THE OFMSW IN A TWO-STAGE PROCESS
Figure 5.6: Evolution with time of total VFAs, acetate, propionate and n-butyrate in thepermeate of the SAMBR.
in TSS and VSS in the SAMBR is partly due to the MSW fibers present in the leachate, and the
TSS and VSS removals aforementioned are therefore apparent removals. If the transfered solids
are taken into account, the actual TSS and VSS removals become 43 and 35%, respectively.
Two reasons may explain these low removals:(i) the inadequate amount of inoculum to start the
batch; the HR was started up at a very low inoculum to substrate ratio(I/S) of 0.01, which is far
below the minimum I/S ratio of 1 recommended for BMP tests; (ii) the HR was not continuously
stirred due to mixing problems; stirring a sludge at 5% TS required quite a lot of torque and the
macrofilter sometimes blocked the stirrer. But when the macrofilter was eventually removed at
the end of the batch (day 43) the sludge still contained thick solid pieces which rendered pumping
the leachate impossible. Therefore, it was concluded that for ease of pumping a macrofilter unit
was compulsory in the HR.
The inorganic fraction (Fixed Suspended Solids) in the HR also decreased at the beginning of
the batch which indicates that inorganic salts were transferred to the SAMBR. This was con-
firmed by the increase of FSS in the SAMBR until day 20 (Figure 5.9). In the HR, the VSS/TSS
ratio increased to high values (97%) because FSS were transferred to the SAMBR, and because
of bacterial growth in the HR which contributes to the volatile fraction. In the SAMBR, TSS, VSS
and FSS increased as expected because solids from the HR were fed to the SAMBR due to the
deficient macrofilter in the HR. The TSS, VSS and FSS increased significantly from 8.3 to 21, 5.7
to 14.7 and 2.5 to 6.3 g/L, respectively, which is almost a threefold increase. This was undoubt-
edly due to the lignin that is difficult to solubilise. Then around day 20, the three parameters
started to stabilise and decreased slowly. The solid particles were not hydrolysed completely
in the HR and were thus degraded further in the SAMBR. The VSS/TSS ratio slowly increased
117

Chapter 5. BATCH TREATMENT OF THE OFMSW IN A TWO-STAGE PROCESS
Figure 5.7: Evolution with time of the SCOD removal, the SCOD membrane rejection (leftaxis) and the organic loading rate in the SAMBR (right axis).
due to the VSS being fed to the SAMBR, the growth of bacteria, and a decrease of TSS due to
hydrolytic activity, or a combination of these phenomena. Interestingly, FSS did not accumulate
in the MBR as they seemed to stabilise at 4 g/L. This means that inorganic compounds are sol-
ubilised and returned to the HR at the same rate as the FSS enter the SAMBR. Based on the
FSS in both reactors it was found that FSS in the overall process decreased with time because
only the inorganics in suspension were measured. With time, the inorganics (phosphates, sil-
icates,... etc) were transformed into their solubilized forms and thus become part of the FDS
fraction (Fixed Dissolved Solids); in the overall process 82% of the FSS was removed and be-
come dissolved inorganics. These ashes can be used as essential nutrients for bacterial growth
or can become available for chemical precipitation.
5.3.4 Size Exclusion Chromatography (SEC)
It is well known that landfill leachate contains lignins, humic and fulvic acids which have a wide
molecular range distribution that might vary from as low as 2 to perhaps 300 kDa (Stevenson,
1982). The UV detector was set at 254 nm, which is a specific wavelength for aromatics; the UV
detector is limitated in detecting low UV-absorptivity components, such as proteins and polysac-
charides. Figure 5.10 shows the size exclusion chromatograms of the HR effluent, SAMBR bulk
and permeate on day 29 of the batch treatment which was deemed representative. Standards of
PEO and PEG up to 761.3 kDa were run to calibrate the system and a standard of glucose (0.18
kDa) was run as well. In size exclusion chromatography (SEC), high MW compounds should
elute from the column first and hence appear at low retention times, whilst small molecules,
118

Chapter 5. BATCH TREATMENT OF THE OFMSW IN A TWO-STAGE PROCESS
Figure 5.8: Evolution with time of total TSS, VSS, FSS and VSS/TSS ratio in the HR.
because of their deeper diffusion into the gel, should take longer to elute, therefore appearing
at longer retention times. It should be born in mind that only the organics that absorb UV light
at 254 nm could be detected in the results. These organics are aromatic molecules and are
refractory to anaerobic degradation. It can be seen from Figure 5.10 that the leachate produced
by the HR contained very high MW compounds (less than 7 minutes elution time) as these
were out of the calibration range. Interestingly, these high MW were not present in the SAMBR
and its permeate which indicates that these were degraded in the SAMBR. Molecules eluting
at 8 minutes were present at a low concentration in the bulk of SAMBR but not in its permeate,
presumably because of the membrane rejection. Medium MW molecules (between 9 and 13
minutes elution time, i.e. with a minimum of 58.4 kDa) were also detected but as a broad peak
because of the heterogeneous properties of the samples. Although the Y-axis in Figure 5.10
represents the voltage recorded by the UV detector, it can be assumed to a certain extent that
the signal is proportional to the concentration. With this in mind, the medium MW (between 9
and 13 minutes elution time) concentration was greater in the SAMBR due to the hydrolysis of
the high MW components present in the HR effluent. Low MW (between 16.9 and 18 minutes
elution time, i.e. between 1.9 kDa and 180 Da) were displayed as a narrow peak with a higher
concentration in the SAMBR permeate due to a further stabilization of the fulvic-like material in
the SAMBR.
Samples of the HR effluent and SAMBR permeate were taken regularly during the batch in order
to investigate the evolution with time of the MW distribution of the reactors effluent. Figure 5.11
reveals that high MW compounds (less than 7 minutes elution time) were present in the HR
effluent but they were slowly degraded throughout the batch. It is thought that these molecules
are carbohydrates and hydrolysable amino acids with unknown MW as they were out of the
calibration range. These high MW molecules did not appear in the SAMBR permeate which was
119

Chapter 5. BATCH TREATMENT OF THE OFMSW IN A TWO-STAGE PROCESS
Figure 5.9: Evolution with time of total TSS, VSS, FSS and VSS/TSS ratio in the SAMBR.
due to their complete hydrolysis to fermentable sugars or to recalcitrant molecules with lower
MWs. Molecules of medium MW (between 9 and 13 minutes elution time) slowly appeared
in the HR effluent but appeared first and at higher concentrations in the SAMBR permeate.
Presumably, the enzymatic activity was better due to a more stable pH in the SAMBR (Figure
5.2). Furthermore, the concentration of these medium MW molecules kept increasing in the HR
effluent whereas their concentration remained stable in the SAMBR permeate after about 20
days which shows that they were slowly hydrolyzed in the bulk of SAMBR. Low MW compounds
(between 1.9 kDa and 180 Da) were also observed in the HR effluent throughout the batch
treatment but their concentration remained relatively constant. Their concentration remained
also relatively constant with time in the SAMBR permeate, but at a higher concentration than in
the HR effluent suggesting again that the leachate was further stabilized in the SAMBR. Chian
(1977) also confirmed that the 500-10,000-MW fulvic-like fraction increases with landfill age and
that the high MW fraction decrease more rapidly with landfill age than the fulvic compounds
present in the 500-10,000 MW fraction, reflecting the greater stability of the latter.
5.3.5 Flux and Transmembrane Pressure
The Transmembrane Pressure (TMP) was recorded on a computer by means of a pressure
transducer fitted in the permeate line of the SAMBR. The TMP transducers used in this study
sent signals from 5 to 0 Volts which correspond to absolute pressure ranging from 0 to 1000
mbar. It means that a 5 volts is 0 mbar TMP. Practically, the signal for 0 mbar was slightly above
5 volts, sometimes up 5.5 volts so that the equation gave negative TMPs which was interpreted
as zero TMP. The equation used to convert voltages to TMP in millibar was:
TMP (mbar) = 1000 ·
(
1−V
5
)
(5.1)
120

Chapter 5. BATCH TREATMENT OF THE OFMSW IN A TWO-STAGE PROCESS
Figure 5.10: Size exclusion chromatograms of standard, HR effluent, SAMBR bulk andSAMBR permeate taken on day 29 of the batch treatment of the OFMSW.
where V is the voltage in volts.
Several flux experiments were carried out regularly during the continuous feeding of the SAMBR.
These experiments consisted in increasing stepwise the flux from 3-3.2 LMH to 5.6-5.8 and then
to 7.2-8.1 LMH until an increase was observed in TMP. High TMPs should be avoided as it
translates into the formation of a cake layer. Figure 5.12 displays the evolution with time of the
TMP between days 21 and 29 during which the MLTSS remained relatively constant between 15
and 20 g/L so that a proper flux/TMP analysis could be performed. On days 21 the TMP rose
sharply when an attempt was made to operate at a flux of 7.2 LMH; when the flux was restored
to 3 LMH, the TMP went back to virtually zero. On day 23, the flux was set at 5.6 LMH for a few
hours and the TMP reached a plateau at about 100 mbar, but when it was shocked to 7LMH the
TMP more than doubled. After a few hours the flux was set back at 5.6 LMH and even though
the TMP remained high for several hours, it eventually returned to zero but at a lower rate than
on day 21. This indicates that a fouling layer had built up, but after few hours of scouring it could
be removed even at a flux of 5.6 LMH which indicates reversible fouling at that specific flux.
After returning to steady state at low TMP values at a flux of 5.6 LMH, the sparging rate had
to be reduced on days 25 and 26 due to foaming inside the reactor. Foaming did not happen
in the SAMBR except when the sparging rate was higher than ≈10 LPM. This reduction in
sparging rate also led to a sharp increase in TMP values to 350 and 250 mbar on day 25 and 26,
respectively, but eventually TMP returned to low values after lowering the flux to 3 LMH. From
day 40 to day 44, the SAMBR was operating at a flux of 5.6 LMH with virtually zero TMP, and this
was obtained with a relatively high MLTSS of 16.4 g/L. This flux was sustainable with no TMP
change and can therefore be considered as below the critical flux. When operating at a flux of
7 LMH the TMP always increased rapidly. On days 44 and 50, an identical final experiment was
121
Chapter 5. BATCH TREATMENT OF THE OFMSW IN A TWO-STAGE PROCESS
Figure 5.11: Evolution of concentration of different groups of molecules during the batchtreatment of the OFMSW.
carried out according to the same stepwise increase in flux from 5.6 to 7.2 LMH. On day 44,
the TMP rose suddenly but returned to zero when the flux was reset at 5.6. On day 47, the flux
measured manually was exactly the same as on day 40 meaning that the experiment on day 44
had no detrimental impact on the flux. By contrast on day 50 the TMP could not return to 0 but
remained around 100 mbars even 2 days after the shock had taken place, indicating irreversible
fouling. This is typical of several cycles where the flux was increased and then decreased and
the plot of the TMP vs the flux during these cycles is called hysteresis (Howell et al., 2004). The
hysteresis effect means that fouling will slowly occur because there is a residual layer of fouling
that remains after each cycle.
A comparison of the TMP curve on days 44 and 50 shows that the increase is more significant
and faster in the case of day 50. This indicates that slow and irreversible fouling occurred during
normal operation between days 44 and 50 when no flux shock experiments were performed.
The fouling could be due to recalcitrant SCOD, colloids, or SMP production because of the lower
F/M ratio towards the end of the batch. Indeed at the end of the batch, cells could have lysed
because of starvation.
The tests showed that flux at 7.2-7.5 LMH was not sustainable as the TMP rose systematically
to 350 - 450 mbar and the flux had to be reduced to avoid operating at higher TMP values. When
the flux was returned to 5.6 LMH, TMP decreased to zero. At the end of the batch, around day
50, the TMP decreased to 100 mbar, suggesting that after such a long time, the TMP could not
go back to zero as easily as it did at the beginning. This is probably due to the slow irreversible
fouling of the pores of the membrane with time. Nonetheless, a sustainable flux of 5.6 LMH was
observed with low TMP. Therefore, the critical flux is thought to be around 6 LMH.
The fouling can also be explained by non homogeneous scouring of the membrane. Figure 5.14122

Chapter 5. BATCH TREATMENT OF THE OFMSW IN A TWO-STAGE PROCESS
Figure 5.12: Evolution with time of the transmembrane pressure (TMP) between days 21and 29.
shows the Kubota membrane at the end of the batch run; it can be seen that only one side was
properly scoured by the bubbles. This was due to the holes in the diffuser that were clogged
by an aggregation of sludge and stone which could be an inorganic precipitate such as struvite
or calcium carbonate. Only the first hole where the biogas pressure is the highest remained
unclogged which explains why the membrane was unevenly scoured.
Eventually, a cleaning procedure (Akram, 2006) was followed in order to determine the relative
contribution to fouling due to internal and external fouling. The external fouling is due to particle
deposition onto the membrane surface, while the internal fouling is due clogging by fine colloids
and dissolved organics inside the membrane pores. The flux was measured manually by col-
lecting the permeate for a given time through the membrane driven by a hydrostatic head of
Figure 5.13: Comparison of TMP evolution after a step increase in flux on day 44 and day50 of the batch.
123

Chapter 5. BATCH TREATMENT OF THE OFMSW IN A TWO-STAGE PROCESS
Figure 5.14: Kubota membrane partially scoured by biogas bubbles (left) and diffuser lo-cated at the bottom of the SAMBR (right).
liquid above the membrane that corresponded to 100 mbar TMP. The maximum flux of the virgin
membrane before the batch at that TMP was 240 LMH (=F4).
Table 5.1: Contribution of various components of fouling in the SAMBR. The standarddeviation is in brackets.
Components of Fouling Flux drop (LMH)
Virgin membrane Flux (F4) 240 (8)
Biofilm and Internal Fouling (F1) 234.4 (8)
Biofilm (F2) 118 (4)
Internal Fouling (F3) 117 (4)
The flux in the presence of internal and external fouling was measured manually with a fouled
membrane and subtracted from F4 to obtain the flux drop due to the combined effect of internal
and external fouling (F1). The biofilm was scraped from the membrane surface and the flux in the
presence of internal fouling alone was measured and subtracted from F4 to get the flux drop due
to internal fouling alone (F3). Flux drop due to biofilm alone (F2) was obtained by subtracting F1
and F3. Table 5.1 documents the contribution of each component of fouling. It can be seen that
98% of the clean water flux is lost because of the combined effect of the external and internal
fouling of the membrane. Moreover, the values of F2 and F3 show that half of the total fouling
was due to internal fouling and the other half due to external fouling. Previous work showed that
80% of the fouling was due to internal fouling and only 20% to the biofilm in a SAMBR treating
brewery wastewater (Akram, 2006). In this work, the contribution of external fouling is more
significant because of the leachate containing solid particles that can attach to the membrane
in addition to the bacteria. This means that it is worth trying to reduce the external fouling as
much as possible because of the significant fouling potential of a wastewater containing solid
particles. Afterwards, the membrane was chemically cleaned in a 1% oxalic acid + 1% sodium
hypochlorite solution to remove inorganic and organic foulants, respectively. The flux recovered
after cleaning was 202 ± 7.4 LMH which was a bit lower that the initial flux which suggests that124

Chapter 5. BATCH TREATMENT OF THE OFMSW IN A TWO-STAGE PROCESS
some foulants are difficult to remove and need stronger chemicals or longer time.
5.3.6 Biochemical Methane Potential (BMP)
Biochemical methane potential (BMP) analyses (Owen et al., 1979) were carried out on the
leachate from the HR on day 9 to assess its biodegradability (Figure 5.15). The characteristics
of the leachate on that day were a TCOD concentration of 20,219 mg/L, a SCOD/TCOD ratio of
0.65 and a VFAs/SCOD ratio of 0.48.
Figure 5.15: BMP of the soluble fraction (≤ 0.2 microns) and the total fraction of leachateon day 9 of the batch test. The error bars show the standard deviation.
Three bottles were fed with the soluble fraction of the leachate (≤ 0.2 microns), three were fed
with the total fraction containing particles and three were run with no carbon source to subtract
the methane produced by the inoculum itself. Based on the theoretical methane value of 1 g
COD (395 mL at 35 ˚ C) and the VFA concentration of the sample, the BMP test revealed that
51 % of the SCOD in the leachate was converted to methane, and moreover 93.4 % of the
methane produced was converted from the VFAs initially present in the sample which is an easy
substrate, while only 6.6% was converted to methane through the degradation of fermentable
sugars present in the leachate. This demonstrates the refractory character of the SCOD.
Regarding the total fraction of the leachate, all the methane produced originated from the VFAs
and no methane was produced from the particulate COD or the remaining SCOD. The particulate
COD might not have been hydrolyzed because of the lack of hydrolytic bacteria in the inoculum
used to seed the BMP bottles which for that reason appeared to be inappropriate. The inoculum
was taken from a 4 litre chemostat batch-fed (once a week) on a 8 g COD/L feed consisting
of peptone and meat extract (25% on a COD basis) and a synthetic VFA mixture (75% on a
COD basis). Nevertheless the BMP test showed that the SCOD and particulate COD were not
125

Chapter 5. BATCH TREATMENT OF THE OFMSW IN A TWO-STAGE PROCESS
inhibitory to the methanogens as no lag phase was observed during the test, and the two curves
displayed a similar initial rate of production.
5.4 SUMMARY
The results showed that:
• The treatment of a batch of OFMSW can take place in not more than 40-50 days because
of the complete retention of the slow-growing microorganisms using a membrane in the
second reactor. This was able to operate at a constant flux of 5.6 LMH with virtually zero
TMP and no significant flux decline over the 50 days. A stable process was obtained due
to the time and space separation in two different reactors; while the solids were hydrolyzed
in the first reactor and VFA concentration was increasing during the first ten days of the
batch, the slow-growing microorganisms had time to build up in the second reactor due to
the retention by the membrane, and thus these were not affected by pH changes in the first
reactor. The initial addition of alkalinity in the HR will not be required for the next batches
because the permeate from the SAMBR can be used to moisten a fresh batch of OFMSW.
• The total process (HR+SAMBR) achieved a TSS and VSS removal of 43 and 35%, re-
spectively. The VS concentration dropped by 40% in the HR due to hydrolysis and transfer
of solids to the SAMBR, and 74% of that was achieved after 23 days while TSS and VSS
concentrations increased in the SAMBR due to the transfer of solids. The main reasons
for the low removals was the inappropriate amount of inoculum and the mixing problems in
the HR.
• It was observed that the macrofilter was mandatory in the HR to be able to pump the
leachate out of the HR. However, fixing the macrofilter such that no particles bigger than
150 microns could pass into the HR effluent was very difficult, and moreover the macrofilter
was responsible for blocking the stirrer.
• Regarding the inorganics, it was found that the inorganics in suspension decreased in
the overall process meaning that inorganic molecules bound to the organic matter slowly
become part of the dissolved fraction as the organic matter is hydrolyzed. In fact, 82% of
the FSS was removed and become dissolved inorganics.
• The SAMBR was operating at a flux of 5.6 LMH with virtually zero TMP, and this was
obtained with a relatively high MLTSS of 16.4 g/L. This flux was sustainable with no TMP
change and can therefore be considered as below the critical flux. When operating at a
flux of 7 LMH the TMP always increased rapidly. Nonetheless, toward the end of the run a
TMP of 100 mbar indicated a slow irreversible fouling.
• The pH and the VFA concentration in the SAMBR showed that the SAMBR was not under
stress and could therefore operate at a higher loading rate and shorter HRTs during sub-
sequent batches. The SCOD removal in the SAMBR was greater than 95% throughout the
experiment at OLRs in the range 1-5.3 g COD/l.day.126
Chapter 5. BATCH TREATMENT OF THE OFMSW IN A TWO-STAGE PROCESS
• Soluble COD and TSS did not build up in the SAMBR showing that the membrane acted as
a barrier against large molecules and bacteria, thereby providing a stabilised leachate (≤
800 mg/l) from the very first days of the treatment whatever the SCOD and VFAs content
of the HR leachate.
• Size exclusion chromatography revealed that high MW compounds were completely de-
graded and did not appear in the SAMBR permeate. The end-products of the process
were medium MW humic acids as well as low MW fulvic acids, but their concentration
remained constant with time in the SAMBR permeate.
127

Chapter 6
CONTINUOUS TREATMENT OF LOW
STRENGTH LEACHATE IN A SAMBR1
6.1 INTRODUCTION
The batch treatment of the OFMSW in the previous chapter has shown several advantages of
two-stage anaerobic digestion. However, the OLR in the HR was very low because the HR was
fed in batch mode, i.e. once for the whole batch duration. In this chapter, the performance of the
process was investigated in a semi-continuous mode, i.e. the HR is fed once every day or every
two days.
AD of the OFMSW can take place either in dry or wet systems depending on the Total Solids
(TS) content of the reactor. For wet fermentation, the dry matter content is adjusted to 8-16%
by addition of process water, whereas for dry systems no or only little process water is added to
moisten the feedstock. An example of a full scale wet two-stage system is the Schwarting-Uhde
process which can sustain an OLR of up to 6 kg VS/m3.day, whereas a full scale dry 2-stage
process such as the BRV plant can achieve up to 8 kg VS/m3.day (Trosch and Niemann, 1999).
When a biomass retention scheme is added such as in the BTA and Biopercolat designs, an
OLR up to 15 kg VS/m3.day can be applied successfully (Wellinger et al., 1999; Gallert et al.,
2003). The biofilm growth in the second stage of the Biopercolat process allows the system to
run at an overall retention time of 7 days. In the BTA process, the HRT could be reduced to 5.7
days.
For laboratory and pilot scale anaerobic leachate treatment experiences, OLRs from 3 to 22 kg
COD/m3.day with COD removal efficiencies of 68 - 97% and HRTs between 1.5 and 2.6 days
have been reported previously (Henry et al., 1987; Kennedy et al., 1988; Chang, 1989). On
the other hand, aerobic leachate treatments found in the literature have been applied to leachate
with COD values between 3000 and 48,000 mg/L. COD removal efficiencies reported for aerobic
systems are higher than 70%, with HRTs ranging from 2.5 to 20 days (Boyle and Ham, 1974;
Cook and Foree, 1974; Uloth and Mavinic, 1977; Maris et al., 1984; Robinson and Maris, 1985).
However, less sludge is generated and less energy is required if an anaerobic step is followed by
1Published in part as Trzcinski, A.P. and Stuckey, D.C. (2009), ”Continuous treatment of the Organic Fraction ofMunicipal Solid Waste in an anaerobic two-stage membrane process with liquid recycle”. Water Research, 43(9),2449-2462.
128

Chapter 6. CONTINUOUS TREATMENT OF LOW STRENGTH LEACHATE IN A SAMBR
an aerobic one. In this process sequence the final aerobic stage serves as a post-treatment to
improve the final effluent quality (Hoilijoki et al., 2000; Agdag and Sponza, 2005). For instance,
Borzacconi et al. (1999) loaded a UASB at an OLR of 20 kg COD/m3.day at an HRT of 2 days and
achieved a COD removal greater than 80%; the subsequent aerobic rotating biological contactor
achieved 72% COD removal. Xu et al. (2008) removed 7% of the SCOD in an anaerobic filter,
while 82% was removed in the subsequent aerobic MBR at 9.5 days HRT. They pointed out
that most of the polycyclic aromatic hydrocarbons (PAHs) were biodegraded in the anaerobic
step. The final effluent, however, still contained 1,000 mg SCOD/L which suggests that there
were some biorefractory organics that were hardly removed by both biological processes and
the membrane process.
Another process advantage is the possibility of removing ammonia from leachate in the aerobic
step, but it is known that high influent COD promotes heterotrophic growth and inhibits ammo-
nium oxidation (Hanaki et al., 1990; Cheng and Chen, 1994). Different process configurations
have been reported for the simultaneous removal of COD and ammonia from landfill leachate.
Im et al. (2001) used an up-flow anaerobic biofilm reactor (36 ˚ C), an aerobic activated sludge
reactor (23 ˚ C) and a clarifier achieving an organic removal rate of 15.2 kg COD/m3.d in the
anaerobic reactor and ammonium removal rate of 0.84 kg N/m3.day in the aerobic reactor op-
erating at 4 days HRT. Agdag and Sponza (2005) obtained 98% COD removal of food waste
leachate at an OLR of 16 kg COD/m3.d in two UASBs (HRT=1.25 day) and an aerobic CSTR
used in sequence. Ninety nine percent of NH+4 was removed at 4.5 days HRT in the aerobic
CSTR. Chen et al. (2008a) used an anaerobic-aerobic moving-bed biofilm system and achieved
a COD removal of 92% at an OLR of 15.7 kg COD/m3.d, while 97% of NH4-N was removed
when the HRT of the aerobic step was more than 1.25 days. Jokela et al. (2002) obtained over
90% nitrification at 0.13 kg N/m3.day at 25 ˚ C and 1.4 day HRT in an upflow filter with crushed
bricks.
The objectives of this chapter were numerous: the effect of the inoculum on the behaviour of
the SAMBR was investigated; the stability of the SAMBRs and the AMBR was tested at different
HRTs and OLRs; and an AMBR operating at ambient temperature was set up to determine
whether the recalcitrants from the SAMBR could be biodegraded aerobically. After 200 days of
operation, another objective was to see if there was a build up of recalcitrants with time due to
the permeate recycle, or if there was slow degradation, and GC-MS analysis was performed to
determine what if any these recalcitrants were.
Another pertinent question related to continuous wet anaerobic fermentation process with ef-
fluent recycle is whether light metals ions (Na+, K+, Mg2+, Ca2+) and Cl−, PO3−4 , SO2−
4 and
ammonia accumulate to inhibitory levels (Gallert et al., 2003) and these parameters were there-
fore monitored throughout the 200 days of operation. Leachate recirculation over a tank filled
with MSW is relatively well documented (Bilgili et al., 2007; Hao et al., 2008), but recirculation
of stabilized leachate from membrane bioreactors is not. During anaerobic treatment of organic
wastes, approximately 100 - 170 L wastewater per ton of waste input are generated (Fricke et
al., 2007). Therefore, recycling the stabilized leachate to the head of a continuous wet process
treating OFMSW could significantly reduce the amount of wastewater produced, and reduce the129

Chapter 6. CONTINUOUS TREATMENT OF LOW STRENGTH LEACHATE IN A SAMBR
environmental impact of MSW disposal.
6.2 EXPERIMENTAL AND ANALYTICAL DETAILS
6.2.1 Reactors
The HR (10L working volume) was operated intermittently (15 min ON-15 min OFF) because
previous experiment (see Chapter 5) has shown that continuous stirring could lead to the over-
heating of the stirrer due to the high torque required to mix the sludge. The HR was fitted with a
50 micron stainless steel macro filter (Spectrum Laboratories Inc.) on the inside of the stainless
steel mesh (1 mm) in order to retain the large partially hydrolyzed particles and thereby separate
the coarse solids from the leachate being fed to the SAMBRs, so that the SRT and the HRT were
uncoupled .
The HR and SAMBR1 were connected in series: the leachate was fed to SAMBR1 and the
permeate from SAMBR1 was recycled to the HR in order to maintain the moisture and alkalinity
of the system. On day 45, SAMBR2 was fed on leachate in parallel with SAMBR1 in order to
compare the effect of inoculum on the start-up of SAMBR. The HR, SAMBR1 and SAMBR2 were
maintained at 35 ± 1 ˚ C. The biogas sparging rate was set at 5 L/min (LPM) to minimize cake
formation on the membrane. On day 130, an Aerobic Membrane Bioreactor (AMBR) operating at
ambient temperature (21-22 ˚ C) was started up to treat the permeate of SAMBR2. The permeate
of the AMBR was then returned to the HR. The two SAMBRs and the AMBR were three liter
reactors fitted with a Kubota polyethylene flat sheet membrane of 0.1 m2 of total surface and a
pore size of 0.4 microns.
6.2.2 Inoculation and start-up of Reactors
The HR was inoculated with 4L of biomass from a previous batch test in the HR at a residence
time of about 50 days (see Chapter 5). The inoculum was sieved through a 180 micron screen
and its TSS and VSS were 2.74 and 2.07 g/L, respectively. The HR was loaded with 400 g
OFMSW on a dry matter basis (≈ 340 g VS), and the volume was adjusted to 10L with tap
water containing NaHCO3 so that the HR was started up at 4,000 mg equivalent CaCO3/L of
alkalinity. The HR was then fed semi-continuously with a feedstock of 10% Total Solids that
was prepared by adding leachate from the HR to the simulated OFMSW in order to blend the
mixture and obtain a homogeneous slurry. Fresh tap water was only added to the HR to keep a
constant working volume. Until day 159, the HR was fed once every two days, then from day 160
onwards, it was fed once a day. The digestate from the HR was removed just before feeding, and
it was dewatered by hand compression over a 500 microns sieve. The liquid fraction was used
to moisten the fresh feedstock, while a fraction of the dewatered digestate was taken, weighed
and discarded to set a specific SRT in the HR.
SAMBR1 was inoculated with 0.5 L of seed from a SAMBR fed on leachate from the same
simulated OFMSW at a HRT of 4 days (see Chapter 5). The volume was adjusted to 3 L with the
130

Chapter 6. CONTINUOUS TREATMENT OF LOW STRENGTH LEACHATE IN A SAMBR
anaerobic biomedium defined in Owen et al. (1979) so that the initial TSS and VSS were 3.31
and 2.54 g/L, respectively.
SAMBR2 was inoculated with biomass from a 4 litre chemostat batch-fed (once a week) on a 8
g COD/L feed with a composition given elsewhere (Nachaiyasit and Stuckey, 1995). The feed
consisted of peptone and meat extract (25% on a COD basis) and a synthetic VFAs mixture
(75% on a COD basis). The ratios of the VFAs compared to acetic acid were 1.2, 0.05, 0.22,
0.08, 0.23 for propionate, iso-butyrate, n-butyrate, iso-valerate, n-valerate, respectively. These
ratios were typically observed in the raw leachate obtained in previous tests from the simulated
OFMSW. The supernatant of the chemostat was discarded and the settled solids were used to
inoculate SAMBR2. The volume was adjusted to 3L with the anaerobic biomedium defined in
Owen et al. (1979) so that the initial TSS and VSS were 2.56 and 1.78 g/L, respectively. The
AMBR was inoculated with biomass from a dye wastewater plant at an initial MLTSS and MLVSS
of 3 and 2.3 g/l, respectively. Air was used to mix the reactor content at 2 LPM.
6.3 RESULTS AND DISCUSSION
6.3.1 Performance of the Hydrolytic Reactor
6.3.1.1 Effect of the OLR on VS Removal: The TCOD in the leachate varied over a wide range,
between 4000 and 26,000 mg/l, possibly due to the HR being fed every two days until day 159,
intermittent mixing, and due to occasional stirring difficulties. It can be seen from Figure 6.1 that
the TCOD did not change with changes in OLRs from 0.5 to 16 g VS/L.day. However, the value
of TCOD did depend upon the occasional presence of solid particles in the sampling line at the
time of sampling. Similarly, the SCOD did not vary significantly when a step increase in OLR
was effected in the HR, and was always in the range 530 - 2900 mg/L. The low SCOD observed
in the leachate is thought to be due to poor hydrolysis because of the ligno-cellulosic type of
feedstock, and an inadequate amount of inoculum used to seed the HR.
The initial inoculum to substrate ratio (I/S) may also play a role during start up of anaerobic
digesters. The initial I/S ratio was 0.02 based on the initial load of 340 g volatile solids fed during
start up. Then the HR was fed continuously at an OLR of 0.5 g VS/L.day but with intermittent
mixing as well as occasional stirring difficulties at TS above 5 %. Table 6.1 presents the VS
removal percentages at the various OLRs and HRTs tested. The VS removal percentage was
calculated as follows:
V S removal% = 100% ·
{
1−mass V S removed + mass V S accumulated in HR
mass V S fed in HR
}
(6.1)
Where the masses were considered over a period longer than 15 days so that steady-state can
be assumed and the mass of VS accumulated in the HR is the difference between the mass of VS
in the HR at the beginning and the end of the period considered. The VS removal percentages
shown in Table 2 are 65.4, 43.8, 35.5, 22 and 13.8 % VS destruction at 0.5, 2, 4, 8 and 16 g
VS/L.day, respectively, assuming that the volatile solids production due to bacterial growth and
the transfer of volatile solids to the SAMBR were negligible.
131

Chapter 6. CONTINUOUS TREATMENT OF LOW STRENGTH LEACHATE IN A SAMBR
Figure 6.1: Evolution with time of TCOD, SCOD and VFAs in the effluent of the HR (leftaxis), and OLR and pH (right axis).
The transfer of volatile solids to the SAMBR was very limited thanks to the separation between
coarse solids and leachate by the perforated stainless steel mesh within the HR. Nevertheless, a
small fraction of solids could still pass through and be pumped to the SAMBRs. At the end of the
experiment large holes and rust were observed in the 50 micron stainless steel presumably due
to a low quality steel or due to pieces of wood in the GW that may have pierced the mesh. This
transfered VS fraction over 200 days was estimated as 37.8 and 69.3 g VS for SAMBR1 and
SAMBR2, respectively, which can be considered as negligible. For instance, during the period
at 16g VS/L.day (day 159 to day 199) the total VS mass transferred to SAMBR1 and SAMBR2
together equaled 91 g changing the VS removal % in the HR to 12.4 instead of 13.8. The former
is the actual VS removal in the HR, while the later could be named the ”apparent VS removal”
and in this study they were similar and thus the difference was neglected.
The low VS removal percentages were also due the low volatile solids retention times calculated
as the ratio of mass of volatile solids in the HR that is equal to X · V , where X is the VS
concentration in g/L in the HR and V is the HR working volume in L, and the mass of volatile
solids removed from the HR per day (W in g VS/day):
V S Retention T ime (days) =X · V
W(6.2)
Consequently, the anaerobic biodegradability of the digestate that was taken out of the HR was
consistent with the lower VS removal observed as the OLR was increased. The BMP of the
digestate was carried out at an I/S of 0.1-0.2 using the acclimatised sludge from SAMBR2 as
inoculum, and the ultimate biodegradability was found to be 167.7, 229.7 and 296.6 mL CH4/g
VS fed at OLRs of 0.5, 8 and 16 g VS/L.day, respectively.132

Chapter 6. CONTINUOUS TREATMENT OF LOW STRENGTH LEACHATE IN A SAMBR
Table 6.1: Comparison of volatile solids retention times, volatile solids removal per-centages, fresh water consumption, hydraulic retention times, percentagesof fresh water addition compared to recycled process water and digestatemethane potential at different organic loading rates in the hydrolytic reactor.n.a. = not applicable.
OLR (g VS/L.day) 0.5 2 4 8 16
Duration (days) 63 17 47 14 40
VS RT (days) 67.8 49 16.6 6.4 3.3
VS removal (%) 65.4 43.8 35.5 22 13.8
Average freshwater consumption 3.7 n.a 68 202 652(mL/day)
HRT (days) 15 9 7.8 4 2.2
% of fresh wateradded compared to 0.6 n.a 5 8 14recycled process water
Digestate methanePotential (mL CH4/g VS) 167±6.2 n.a n.a. 229.7±6.9 296.6±24
Table 6.1 also contains the HRT of the HR, i.e. the hydraulic retention time or leachate retention
time, which is the average retention time of a unit volume of liquid in the reactor and is calculated
as the ratio of the reactor volume and the leachate flowrate to the SAMBRs. Obviously, the lower
the HRT, the higher the flowrate of leachate to the SAMBRs and the more likely the acidification
of the HR can take place because methanogens do not have time to grow in sufficient amount
to degrade the VFAs in the HR. However, it is possible that the mesh inside the HR acts as a
bacterial support where methanogens can attach and form colonies with acidogens so that they
can survive on VFAs produced in the close environment. Figure 6.2 show the methane content
of the biogas produced in each reactor. It can be seen that methane started to be produced
very slowly compared to the SAMBR. The methane percentage increased gradually to circa
40% around day 100, but on day 112 the HR was opened and the 50 micron macrofilter was
removed and replaced by a new one which let some air into in the headspace. As a result, the
methane content dropped and remained low as the reactor had to be opened more frequently
due to technical issues such as mixing problems or solids that could not be removed from the
bottom pipe due to the high TS content.
6.3.1.2 Effect of the OLR on VFAs Production and Composition: The evolution and composi-
tion of VFAs over time in Figure 6.3 shows that acetate was the main VFA at steady-state, but
propionate became the main acid after the shock at 4, 8 and 16 g VS/L.day on days 101, 146
and 164, respectively, which is a few days after the organic shocks took place. The HRT also
affects the VFAs distribution because it was reduced to 4 and 2 days on day 146 and 164, re-
spectively. From day 160 onwards, the HR was fed every day at 16 g VS/L.day at HRTs ranging
from 4 to 1 days, and propionate remained the main acid until the end of the run. Gallert et al.
133

Chapter 6. CONTINUOUS TREATMENT OF LOW STRENGTH LEACHATE IN A SAMBR
Figure 6.2: Evolution of the methane content in the HR, in SAMBR1 inoculated with abiomass acclimatised to the leachate medium and in SAMBR2 inoculatedwith a inoculum enriched with methanogens in a synthetic medium of pep-tone, meat extract and VFAs. The arrows show when the HR was opened formaintenance work on the macrofilter.
(2003) also observed a higher and longer-lasting propionate accumulation when the HRT was
reduced from 7.1 days to 5.7 days at an OLR of 15 kg COD/m3.day; they correlated this with 1%
hydrogen in the off-gases. Propionate oxidation is know to be the bottle neck reaction during the
methanogenesis of complex substrates because their growth rate is only 0.13 d-1 (Wallraben-
stein et al., 1995), and they can be washed out at a HRT below 8 days (Gallert et al., 2003). The
pH dropped between 6 and 6.5 due to the OLR of 16 gVS/L.day applied after day 159, but with
the accumulated alkalinity (5,000 mg equivalent CaCO3/L on day 199) and the recycling of the
SAMBR1 and AMBR permeates, the pH did not drop any further, which highlights the advantage
of recycling the SAMBR permeate. A BMP test (I/S = 1.3) on the leachate on day 193 revealed
that 57 % (± 10%) of the leachate was converted to methane. The rest of the COD was either
not hydrolysable or converted to biomass.
6.3.1.3 Scanning Electron Microscopy of the Fibers in the HR: In order to gain more under-
standing of the hydrolysis process, a Scanning Electron Microscope was used to visualize the
fibers of the OFMSW. Since the KW is easily degraded, and since GW represented a small per-
centage of the feedstock, it can be assumed that the fibers originated from the PW. Different
magnifications were taken of both the virgin fibers taken from the feedstock, and the fibers from
the HR after anaerobic digestion. All the pictures are shown in Figure 6.4. The virgin fibers are
on the left-hand side (Pictures A, C, E and G), and the treated fibers are on the right-hand side
(Pictures B, D, F and H).
The pictures show evidence that the fibers are being peeled off and small nodules looking like
134

Chapter 6. CONTINUOUS TREATMENT OF LOW STRENGTH LEACHATE IN A SAMBR
Figure 6.3: VFA distribution in the effluent of the HR.
bacteria could be seen on the surface (Figure 6.5). The surface is much rougher than virgin
fibers which is due to bacterial hydrolysis that targets the cellulose and hemicellulose from the
fibrils, but it could also be due to the shear of the stirrer in the HR. Figures B and D show
that pieces up to 10 microns can be peeled from the main fiber, but still remain attached to it.
This could be the result of a partial hydrolysis of cellulose that was consumed until only lignin
remained accessible to enzymes.
Some holes were observed in the virgin fibers of picture E. This could be specific to a certain
type of fiber (cardboard, newspaper, office paper, etc.) or it could be the result of solubilisation
of hemicellulose during the autoclaving of the virgin fibers. Solubilisation of hemicellulose has
indeed been reported possible in hot water (Hendriks and Zeeman, 2009). Liao et al. (2004)
also observed holes in manure fibers before acid treatment and they attributed this to a partial
degradation of cellulose.
6.3.2 Performance of SAMBR1
6.3.2.1 Effect of the HRT on COD Removal: The OLR to the SAMBR was not constant be-
cause of the fluctuations in the TCOD of the leachate from the HR (Figure 6.1), and as a result
the SCOD in SAMBR1 (Figure 6.6) sometimes increased sharply over time. For instance, an
OLR to the SAMBR of 8 g COD/L.day was observed temporarily on day 164, and a decrease of
the HRT to 2.1 days led to a sharp peak of SCOD in the reactor but not due to VFAs build-up, in-
dicating that the hydrolysis was rate limiting. On day 185, a temporary OLR of 19.8 g COD/L.day
was also observed, but the stability of SAMBR1 at such a high OLR could not be assessed prop-
erly due to the transient character of the OLR. Despite the varying OLR, the permeate SCOD
(effluent SCOD in Figure 6.6) remained typically in the range 300-500 mg /L. A build up of the
SCOD was not observed and the SCOD was even found to decrease slightly on few a occasions.135

Chapter 6. CONTINUOUS TREATMENT OF LOW STRENGTH LEACHATE IN A SAMBR
Figure 6.4: Scanning Electron Microscopy of the virgin fibers (left) and treated fibers inthe HR (right).
136

Chapter 6. CONTINUOUS TREATMENT OF LOW STRENGTH LEACHATE IN A SAMBR
Figure 6.5: Close zoom on the fibers treated in the HR. This is probably bacterial aggre-gates attached to the fiber.
This can be partly attributed to the greater consumption of fresh water towards the end of the
run to keep up the volume in the HR (see Table 6.1), but the decline of SCOD was also due to
the very high MLTSS (28.7 g/L) at the end of the run, and was not due to the enhanced rejection
by the membrane because the SCOD in the bulk liquid was also found to decrease slowly.
Figure 6.6: SCOD and VFAs inside SAMBR1 and in its permeate (left axis). COD removalin SAMBR1 (right axis).
6.3.2.2 Effect of the TSS on the Flux: The COD removal remained circa 95% throughout the
run, while the VFA concentration was virtually zero, suggesting that the methanogenic population
could cope with an HRT as low as 1 day. However, SAMBR1 could not be operated in a sus-
tainable way at a HRT below 1.6-2.3 days due to a membrane flux limitation at 0.54-0.78 LMH.
137

Chapter 6. CONTINUOUS TREATMENT OF LOW STRENGTH LEACHATE IN A SAMBR
Figure 6.7: Evolution with time of the TSS, VSS, FSS and VSS/TSS ratio (top), and evolu-tion of the flux in SAMBR1 (bottom).
At an HRT below 2 days, the rate of particulate COD destruction became less than the feeding
rate, resulting in the build up of solids at the bottom of the reactor which eventually blocked the
diffuser and, on day 182 no more bubbles were scouring the membrane. At the same time,
the MLTSS increased to 28.7 g/L (Figure 6.7) which also badly affected the flux. This indicates
that the performance of the SAMBR treating leachate containing particles was limited to 1.6-2.3
days HRT by the hydrolysis and not the VFA degradation. Interestingly, as the HRT dropped
the inorganics in suspension followed the same trend as TSS and VSS with a sharp increase
to 13.6 g/L showing that at HRTs lower than 1 day the FSS build up in SAMBR. Again because
the hydrolysis of solids is too slow compared to the feeding rate, the inorganics bound to the
ligno-cellulosic matrix are not solubilised fast enough and build up. As a result the VSS/TSS
ratio plummeted to circa 50%. The transmembrane pressure (TMP) in SAMBR1 was virtually
zero until day 60.
SAMBR1 was treating leachate from day 0 to day 60 at a HRT of 5.5 day, at a stable flux of
138

Chapter 6. CONTINUOUS TREATMENT OF LOW STRENGTH LEACHATE IN A SAMBR
8.5 LMH and a MLTSS around 5 g/l with virtually zero TMP. The MLTSS could remain that low
because the HRT was 5.5 days which provide enough time for the hydrolysis to proceed without
noticeable build up in MLTSS. On day 24, it was attempted to increase the flux by increasing the
speed of the recycling pump but that led to a sharp increase in TMP to 450 mbar which indicates
that operation over the critical flux was taking place and that a cake layer was forming. Based on
the step increase in the recycling pump setting, it could be approximated that the flux was near
11 LMH which was thus deemed over the critical flux.
Between day 76 and day 105, the effect of the sparging rate on the COD rejection was investi-
gated using TMP data which were analysed in the corresponding section. After day 105, the flux
in SAMBR1 remained relatively stable at 3.5 LMH although the MLTSS varied over a wide range
(4 - 19 g/L). This can be explained by the increase in sparging rate to 10 LPM that results in the
resuspension of solids that settled down in the reactor at low sparging rate. On a few occasions
however, the sparging rate had to be reduced due to foaming problems which caused the solids
in suspension to settle down and this resulted in a lower apparent MLTSS. With this in mind, the
great variation in MLTSS should not be seen as a result of changing performance in the reactor
but rather as non-homogeneous sampling for MLTSS measurement.
The flux of 3.5 LMH was accompanied by TMP values of up to 500 mbar whereas the operation
after day 170 at a MLTSS of 28.7 was characterized by very low flux circa 0.5 LMH and very
high TMPs in the range 550 - 800 mbar (data not shown). Normal operation of the Kubota
membrane is associated with fluxes in the range 20-27 LMH at a maximum of 15 mbar TMP and
20 g TSS/L (Ramphao et al., 2004), but Van Zyl et al. (2007) reported a flux of 2-3 LMH at 36
g TSS/L when treating synthetic petrochemical effluent which is similar to what was observed in
this study although their TMP was much lower (50 mbar) probably due to the feed containing only
soluble organics. At such high MLTSS, it is thought that the diffuser was blocked due to the solids
settling at the bottom of the reactor. This led to a very reduced scouring of the membrane. In
order to lower the MLTSS and improve the flux, sludge was removed from SAMBR1 at an mean
rate of 90 ml/day after day 180 (SRT=33 days), but this did not help in reducing the MLTSS.
6.3.2.3 Effect of the Bulk COD on Membrane Rejection: The SCOD inside the reactor re-
mained higher than the effluent values throughout the experiment, which demonstrates that the
presence of a cake/gel layer on the membrane surface improves the effluent quality: this is in line
with previous work on the SAMBR (Akram, 2006; Choi and Ng, 2008). Nevertheless, membrane
rejection did not increase with time but varied according to the bulk SCOD. The rejection of solute
can be due to the dynamic layer formed by the foulant, and the attached biomass acts as a sec-
ondary filter. Choi and Ng (2008) observed that solute rejection rate increased with more severe
fouling. During fouling, pore blocking and pore narrowing can take place which would enhance
solute rejection. They also observed lower TOC in the permeate compared to the supernatant,
which they attributed to a combination of biodegradation by the biofilm (cake layer) developed
on the membrane surface and further filtration by cake layer and narrowed pores. Hence, lower
permeate concentration and faster permeability decline are observed as membranes are fouled.
139

Chapter 6. CONTINUOUS TREATMENT OF LOW STRENGTH LEACHATE IN A SAMBR
Membrane rejection was expressed as a percentage:
Rejection = 100% ·SCODbulk − SCODpermeate
SCODbulk(6.3)
In this study it was observed that the higher the bulk SCOD, the higher the rejection (Figure
6.8), which suggests that the high molecular weight COD is degraded in the bulk liquid until it
becomes small enough to pass through the membrane or the biofilm pores.
Figure 6.8: Correlation between the bulk SCOD in SAMBR1 and the membrane rejection.
6.3.3 Performance of SAMBR2
6.3.3.1 Effect of Inoculum on Start-Up: Previous studies (Akram, 2006) have shown that a
shorter start-up period and higher COD removal in SAMBRs can be obtained by increasing
organic load at a lower constant HRT rather than gradually decreasing the HRT at constant high
feed strength. This approach was followed to start up a SAMBR, although Akram (2006) used
a sucrose-based wastewater that is easily degradable, while the leachate used in this study
was lignocellulose-based. For an easily degradable substrate, VFA accumulation can occur in
the SAMBR due to the overloading of the methanogens and possibly the lack of syntrophic
associations necessary to degrade reduced intermediates. For this reason, prior inoculation into
a CSTR is helpful for the development of an active inoculum enriched in methanogens (Akram,
2006). With this in mind, an inoculum was fed on synthetic VFAs as the main carbon source
(75% on a COD basis) in a 4 litre chemostat prior to inoculating SAMBR2.
Prior to inoculating SAMBR2, a specific acidogenic activity test was conducted on the two differ-
ent inocula, the one from SAMBR1 and the one from the chemostat batch fed with meat extract,
peptone and synthetic VFAs. The test was determined in triplicate in 38 mL serum bottles, with
20 mL of media. The same amount of glucose was fed to both sets of bottles to result in 2 g140

Chapter 6. CONTINUOUS TREATMENT OF LOW STRENGTH LEACHATE IN A SAMBR
COD/L for the test at an I/S ratio of 1, and Figure 6.9 reveals that indeed the acidogenic and
methanogenic biomass of the inoculum fed with synthetic VFAs was more active than the inocu-
lum taken from SAMBR1 on a same MLVSS basis. Akram (2006) also reported a higher activity
from an inoculum taken from a CSTR compared to the SAMBR. The reason for this is the bigger
flocks formed in a gently mixed CSTR compared to the SAMBR where the shear rate is more
important. Several authors have identified strong mixing conditions and high shear forces as a
detrimental factor for VFA degradation since it supposedly affects microbial proximity, and there-
fore interspecies hydrogen and/or formate transfer (Kim et al., 2002; Brockmann and Seyfried,
1997).
As a result the smaller flocks in the SAMBR can release more hydrogen due to inefficient in-
terspecies hydrogen transfer, and this results in reduced methane production through the hy-
drogenotrophic reaction. This can also be due to the non-living fraction of MLVSS in the inocu-
lum from SAMBR1 as the MLVSS measurement does not distinguish the non-living VSS from
the living fraction. As a result, the inoculum from SAMBR1 was likely to contain less acidogens
and methanogens explaining the slower methane production rate during the first two days.
It is interesting to note that eventually the inoculum from SAMBR1 ended up producing signifi-
cantly more methane that the inoculum from the chemostat. With the inoculum from SAMBR1,
79% (±0.6) of the glucose was converted to methane, while that percentage reached 72.3%
(± 0.9) with the inoculum from the chemostat. This again can be explained by the amount of
VSS introduced into the BMP bottles. As the inoculum from SAMBR1 contained non-living VSS
consisting of lignocellulosic fibers, the actual living VSS was less than in the inoculum from the
chemostat. Therefore less COD was used for biomass growth and the spare COD could then
be metabolized to produce more methane. The extra methane produced could also come from
the lignocellulosic fibers that were present in the inoculum from SAMBR1, and that were further
hydrolyzed in the serum bottles. As the acidogenic test showed that the inoculum from a chemo-
stat fed on meat extract, peptone and synthetic VFAs was more active on a MLVSS basis, it was
hypothetized that it would be beneficial for the start up of the SAMBR in order to avoid VFA accu-
mulation. Also the smaller inoculum required to seed the SAMBR due to a higher methanogenic
activity would result in lower MLTSS concentrations for a successful start-up and maybe a better
flux. VFA concentrations in SAMBRs1 and 2 were both virtually zero. This indicates that an
inoculum acclimatised to VFAs does not bring further advantages regarding VFAs degradation
because both SAMBRs could start-up at a HRT of 5.2-5.7 days with no VFA accumulation.
Previous work on leachate from MSW has also shown that microorganisms grown in another
medium are unable to out-compete native solid waste microorganisms for the cellulose in a
foreign (leachate based) medium (O’Sullivan and Burrell, 2007). In this study the bacteria fed
on peptone and meat extract may have been inhibited when suddenly fed with leachate, or
merely may have not been able to metabolize lignocellulosic compounds causing a delay in
VFAs production; this would explain why the methane content of SAMBR2 displayed such a long
lag phase before reaching a normal value of 60% methane in the biogas (Figure 6.2).
Moreover, the methane content of the biogas in SAMBR2 gradually increased to a maximum
of 61% after 50 days, whereas in SAMBR1 it reached 60% after four days of operation and141

Chapter 6. CONTINUOUS TREATMENT OF LOW STRENGTH LEACHATE IN A SAMBR
Figure 6.9: Specific acidogenic activity test on the inoculum from SAMBR1 acclimatisedto the leachate medium and the inoculum from a 4 litre chemostat enrichedwith methanogens in a synthetic medium of peptone, meat extract and VFAs.Panel A: cumulative methane production per g COD fed. Panel B: cumulativemethane production per g MLVSS per day.
then slowly stabilized at values between 69 and 71% (Figure 6.2), which suggests that the
inoculum fed on synthetic VFA was not suitable for start-up because it did not contain hydrolytic
and acidogenic bacteria for a leachate medium. As a result, the slow production of VFAs was
translated into a slow increase in methane production. However, it could be argued that methane
percentage in the headspace is not a good indication of the methane production because it
depends on the carbon dioxide solubility, which in turn depends on the pH, alkalinity and buffer
capacity. In this case, the pH and the alkalinity (Figure 6.16) in SAMBR1 and SAMBR2 were
very similar which provides a sound prerequisite to compare headspace methane content.
142

Chapter 6. CONTINUOUS TREATMENT OF LOW STRENGTH LEACHATE IN A SAMBR
Furthermore, the bulk SCOD in SAMBR2 kept increasing during start-up from 100 mg/L on day
46 to 800 mg/L on day 73 after which it began to decrease. This strongly suggests that, for a
lignocellulosic-based feed, it is paramount to start up the SAMBR with a hydrolytic population
acclimatised to the leachate medium to avoid SCOD build up in the bulk. Eventually, no biogas
was produced in SAMBR2 until day 106 whereas the specific methane production in SAMBR1
was in the range 0.11 - 0.18 L CH4/g COD fed during the first 30 days.
6.3.3.2 Effect of the HRT on COD Removal: The HRT of the AMBR was equal to the HRT of
SAMBR2 because the two reactors were connected in series. The COD removal in SAMBR2
was 94.5% on average, and only 1.6% in the AMBR so that a total COD removal of 96.1% was
achieved. The VFA concentration was virtually zero inside SAMBR2 and the permeate, and thus
were omitted from Figure 6.10. No significant change in total COD removal efficiency of both
reactors was observed when the HRT was decreased from 5.2-5.7 to 0.37 days.
In a moving-bed biofilm reactor system with an anaerobic-aerobic arrangement, Chen et al.
(2008a) observed that at 1.5 days HRT the COD removal of the anaerobic reactor dropped to
81%, whereas the aerobic COD removal increased to 11%, but nonetheless the total COD of
the system remained stable. Although the contribution of the aerobic step to the total COD re-
moval of the system was low in this study because of the membrane rejection in SAMBR2 (1.6%
on average), it should be emphasized that on average 26% of the recalcitrants from SAMBR2
could be degraded aerobically in the AMBR. Bohdziewicz et al. (2001) reported less than 10%
aerobic biodegradation of anaerobically treated landfill leachate. The COD in the permeate of
the AMBR was approximately 300 mg/L at the end of the experiment, which is close to the 390
mg/L reported by Agdag and Sponza (2005). The SCOD in the bulk of the reactors as well as in
their permeate decreased slightly towards the end of the operating period.
6.3.3.3 Effect of the TSS on Flux: Figure 6.11 shows the evolution with time of the TSS, VSS
and the FSS. Interestingly, the initial flux in SAMBR2 was much higher than in SAMBR1; the
initial flux in SAMBR1 and 2 was 8.6 and 21.6 LMH, respectively although both reactors were
started up at similar TSS of 3.3 and 2.6 g/L for SAMBR1 and SAMBR2, respectively. The only
difference was in the different inoculum used to seed the SAMBRs. SAMBR2 was inoculated
with an inoculum almost free of colloids, whereas SAMBR1 was inoculated with bacteria accli-
matised to the leachate medium but containing colloids that are known to be detrimental for the
flux. Nonetheless, as SAMBR2 was fed on leachate containing colloids its flux also started to
decrease over time. As a result, the TMP started to rise so rapidly that the flux had to be reduced
manually. This was the case on day 50 where the TMP rose to 200 mbar, on day 53 where it
reached 250 mbar and the flux was reduced to 15.3 LMH. Again, on day 59 the TMP rose to 350
mbar and the flux was reduced to 12 LMH, which stabilized the TMP at 200 mbar. With time the
TMP rose again to 300 mbar on day 70 and the flux was reduced to 10.1 LMH to stabilize the
TMP between 150 and 200 mbar. This approach was also followed by other researchers (Howell
et al., 2004) in order to avoid serious fouling of the membrane. For relatively ideal wastewater
143

Chapter 6. CONTINUOUS TREATMENT OF LOW STRENGTH LEACHATE IN A SAMBR
Figure 6.10: SCOD inside and in the permeate of SAMBR2 (out) and AMBR at differentHRTs (top). COD removal in SAMBR2 and AMBR (bottom).
such as synthetic or municipal wastewater, the permeate rate is usually reduced if the TMP ex-
ceeds 10kPa (= 100 mbar) because this is equivalent to a 1m liquid head corresponding to the
typical liquid depth above the membranes in full size systems.
In only 30 days, its flux decreased to the same flux as in SAMBR1 meaning that the advantage
of a ”colloid free” inoculum was effective only for a short period. As in SAMBR1, the low HRT
resulted in the build up of MLTSS, MLVSS and FSS as well as the drop in the VSS/TSS ratio
over time. The operation after day 100 was characterized by an increase in TMP to reach 650
mbar on day 120. The TMP remained constant as well as the flux (around 5 LMH), although the
MLTSS increased gradually from 1 to 19 g/L on day 178, which emphasized the independence of
144

Chapter 6. CONTINUOUS TREATMENT OF LOW STRENGTH LEACHATE IN A SAMBR
the MLTSS on the flux in a certain range of values as reported by other researchers (Yamamoto
et al., 1989; Ross et al., 1990; Hong et al., 2002).
Then after day 180, the MLTSS went over 20 g/L, and even reached 46 g/L on day 195, which
eventually blocked the diffuser and no more bubbles could be seen scouring the membrane,
which was correlated with the TMP culminating at 850 mbar and the flux dropping to 0.5 LMH
until the end of the experiment. Thus, as in SAMBR1, at HRTs lower than 2 days, particulate
solids in the leachate built up at the bottom of the SAMBR eventually leading to the diffuser
blocking. During the last 20 days of the run, sludge from the bulk was removed in an attempt to
decrease the MLTSS in SAMBR2. On average, 130 ml were removed per day (SRT = 23 days),
but that was not enough to decrease the MLTSS as the feeding rate of particles was too high
compared to its removal rate.
6.3.4 Effect of the Biogas Sparging Rate on COD Rejection
Previous work on the SAMBR has shown that the presence of a biofilm is responsible for a
cleaner effluent (Akram, 2006; Choo and Lee, 1996b; Harada et al., 1995). Both SAMBRs were
fed on leachate at the same HRT of 5.2-5.7 days while the sparging was set at a low value in
order to investigate the effect of sparging rate on the rejection of COD by the membrane. Another
objective was to see how much time it takes to develop a biofilm and whether this biofilm could
result in an enhanced rejection and a lower permeate COD. This could have a significant impact
because it would mean that the permeate COD could be controlled by changing the sparging
rate and thereby obtain cleaner effluent. On day 76, the two SAMBRs were deemed to be at
steady state as they recovered from the sudden shock in OLR that made their COD rise to about
500 mg/L. The sparging rate was then set at 2LPM in both SAMBR. The MLTSS were relatively
low and constant around 5 and 1 g/L in SAMBR1 and 2, respectively.
It was observed that no significant change occurred and that the permeate SCOD remained
stable at around 350-360 mg/L in both reactors. In contrast, the TMP skyrocketed to circa 580
and 380 mbar, in SAMBR1 and SAMBR2, respectively (Figure 6.12). This indicated that the flux
became greater than the critical flux as soon as the sparging rate was reduced and that a cake
layer can form very quickly above the critical flux.
The flux was manually reduced to 6.1 and 7 LMH in SAMBR1 and SAMBR2, respectively,
to avoid operation at high TMP. The TMP went back to 150 and 100 mbar in SAMBR1 and
SAMBR2, respectively, and this TMP was probably not high enough to build a biofilm that would
have led to enhanced rejection, and as a result the permeate SCOD did not decrease. Although
the flux had been manually reduced to 6.1 LMH in SAMBR1, the TMP slowly increased to 650
mbar at which point the flux was only 5 LMH (measured on day 94). Thus a cake layer had
been formed at 6.1 LMH but at a much lower rate than at 8.3 LMH. The rate of increase in TMP
indicates the degree of compaction of the biofilm which can translate to denser cake layer and
COD rejection. The higher the rate of increase in TMP, the more compact the biofilm will be, and
the thicker the biofilm will be. Also the degree of compaction will determine the easiness and the
rate at which the biofilm can be removed if the sparging rate is increased. At very high TMPs,
145

Chapter 6. CONTINUOUS TREATMENT OF LOW STRENGTH LEACHATE IN A SAMBR
Figure 6.11: Evolution with time of the TSS, VSS, FSS and VSS/TSS ratio (top), and evolu-tion of the flux in SAMBR2 (bottom).
Elmaleh and Abdelmoumni (1997) also reported a decrease in permeate flux with an increase in
TMP which was attributed to the compaction of the foulant layer. Li et al. (2003) explained that
cakes formed at higher flux and TMP are much more consolidated than cakes formed marginally
above the critical flux.
In SAMBR2, although the flux had been manually reduced to 7 LMH, the TMP rose slowly to 400
mbar before day 87. On day 87, SAMBR 2 was set at a high sparging rate (8-10 LPM), while
the sparging rate in SAMBR1 remained unmodified. As a result, the TMP in SAMBR2 dropped
to virtually zero, while the permeate SCOD in SAMBR2 increased to about 440 mg/L on day
90 and remained stable while the permeate SCOD in SAMBR1 remained below 400 mg/L. It is
interesting to note that the increase of the sparging rate did not allow us to re establish the initial146

Chapter 6. CONTINUOUS TREATMENT OF LOW STRENGTH LEACHATE IN A SAMBR
Figure 6.12: Evolution with time of the TMP in SAMBR1 (top) and SAMBR2 (bottom).
flux in SAMBR2, although the TMP went back to zero. Therefore, it can be stated that in this
study low sparging rates even for a short period of time lead to irreversible fouling because of
internal fouling of the membrane pores. This is in contradiction with Vyrides and Stuckey (2009)
who observed no significant increase in TMP or decrease in flux when operating the biogas
pump in an intermittent mode (5 min OFF - 10 min ON) for 120 days. In our study, however,
low sparging rates were likely to increase the thickness of the concentration polarization layer
because of less turbulence, and this probably led to the aggregation of humic substances in the
boundary layer. Humic acids can adsorb to particulate matter in the cake layer which results in
a more compact and dense cake layer.
In addition, the coagulation with calcium may have been enhanced in the concentration po-
147

Chapter 6. CONTINUOUS TREATMENT OF LOW STRENGTH LEACHATE IN A SAMBR
larization layer where the concentration of humic acids is greater, resulting in the formation of
aggregates on the membrane. This can lead to a thicker cake layer because calcium facilitates
humic acids adsorption to particulate matter and membrane surfaces. Nghiem et al. (2006) also
observed a greater TOC rejection associated with an increase in calcium concentration. More-
over, the highest TOC rejection coincided with the highest level of fouling which is consistent with
our observations.
Eventually on day 97, the sparging rate in SAMBR1 was also set at 8-10 LPM but the effect on
the permeate COD was not immediate. In contrast, the effect of increasing sparging rate on the
TMP was immediate on day 97: it suddenly dropped to 100 mbar, but unfortunately, the sparging
rate could not be maintained at 10LPM due to foaming problems. Consequently, the TMP ended
up at 550 mbar and eventually the flux was reduced manually by decreasing the speed of the
recycle pump so that the flux was 3.5 LMH. As soon as the flux was lowered, the TMP went
back to low values on day 101. It was only on day 104 that the permeate SCOD also rose as
in SAMBR2 to values around 440 mg COD/L. Thus seven days (day 104-97) were necessary to
see the effect of sparging rate increase in SAMBR1 that kept the low sparging rate mode for 21
days (day 97-76), while it took only 3 (day 90-87) days in SAMBR2 that kept the low sparging
rate mode for 11 days (day 87-76).
The effect of the low sparging rate on the flux was immediate and detrimental. As can be seen
from Figure 6.7 for SAMBR1 and from Figure 6.11 for SAMBR2, the flux drop was 4.8 (8.3 to
3.5LMH) and 3 LMH (10 to 7LMH) for SAMBR 1 and 2, respectively. Thus the effect of the low
sparging rate was to block the pores while the partially clogged pores could still let the solutes
pass. As a result of the pore blocking mechanisms, fewer molecules could pass which caused
a significant increase in the bulk SCOD of both SAMBRs. Furthermore, the increase of the
sparging rate to 10LPM did not allow the initial flux to recover showing that irrecoverable fouling
occurred in both SAMBRs. The fouling was, however, worse for SAMBR1 because of the greater
degree of compaction due to the longer period at low sparging rate, and also because its MLTSS
was 5 times greater than that of SAMBR2 thus there was more material available in the bulk
liquid to build a cake.
Therefore, this experiment performed in duplicate in separate SAMBRs showed similar results;
when the sparging was set at a low rate (2 LPM), no significant change was noticed in the
permeate COD. This might be due to longer periods required to build up a cake layer under slow
TMP increase, and thereby obtain higher COD rejection and lower permeate COD. It is possible,
however, that as the TMP increases, the compaction of the cake would be such that the pores
of the biofilm will be so narrow that lower permeate COD will be obtained.
Although the permeate SCOD did not decrease significantly, the membrane rejection started to
increase significantly from day 80 onwards (Figure 6.13). Thus the effect of lowering the sparging
rate was not a decrease of permeate COD but instead an increase in membrane rejection due
to enhanced concentration polarization, keeping at the same time a constant permeate SCOD.
Choo and Lee (1996b) also concluded that cake compaction over time had more impact on the
SCOD rejection by the membrane.
148

Chapter 6. CONTINUOUS TREATMENT OF LOW STRENGTH LEACHATE IN A SAMBR
This sounds paradoxical but can be explained by the very wide range of molecular weight organ-
ics present in the bulk; while the lower MW can still pass through the biofilm and the membrane
and are responsible for the constant permeate SCOD, the higher MW cannot pass through the
pores and remain in the bulk which causes the membrane rejection to increase. These re-
sults are consistent with Choo and Lee (1996b) who, after the initial fouling of the membrane,
observed a decrease in the SCOD in the bulk and the permeate due to the inoculum accli-
matisation, but afterwards the permeate SCOD remained relatively constant for the rest of the
experiment and did not decrease any further although the flux was decreasing due to internal
fouling and cake layer compaction. This suggests that there is a limit below which the SCOD
concentration in the permeate can not be because the low MW recalcitrants which constitute the
SCOD will still be able to pass through the membrane pores.
Figure 6.13: Evolution with time of the SCOD rejection by the membrane in SAMBR1 andSAMBR2.
On the other hand, when the sparging rate was increased to 8-10 LPM, the permeate COD
increased typically from 360 to 440 mg/L due to a better scouring of the membrane, which
resulted in a thiner concentration polarization layer and a better diffusion through the biofilm.
Moreover, this increase in COD was faster for SAMBR2 that kept the low sparging mode for 11
days indicating that part of the cake layer can be easily scoured as indicated by the TMP that
went back to zero after the high sparging rate was applied. In contrast, in SAMBR1 the low
sparging rate mode was kept for 21 days, and due to the better compaction of the cake, the
removal of the reversible fouling was impossible or much slower as indicated by a persistently
high TMP, and as a result the effect of a higher sparging rate took longer to be noted. This
increase in permeate SCOD was, however, not correlated with a reduction in membrane rejection
in any of the SAMBRs shown in Figure 6.13.
Li et al. (2003) also concluded that the removal of the cake strongly depend on its age; if the
cake existed for a short period of time, the lift forces due to surface shear can break some of149

Chapter 6. CONTINUOUS TREATMENT OF LOW STRENGTH LEACHATE IN A SAMBR
the enmeshed bonding between the bacteria, allowing for the removal of the cake in the form
of flocs. On the other hand, if the cake has been built up for a longer period, the possibility of
breaking the enmeshment is reduced. The aggregation of the cake will also depend on ionic
strength: at high ionic strength, which is likely to be the case in landfill leachate, the electrical
double layer of bacteria is compressed resulting in more interaction and binding with molecules
which allows a dense biofilm. Nevertheless, the change in COD (about 80 mg/L) was relatively
small compared to the total COD concentration : this is a 20 % increase in permeate SCOD by
changing the sparging rate from 2 to 8-10 LPM.
6.3.5 Performance of the AMBR
6.3.5.1 Effect of the HRT on Nitrification: The sequential oxidation of NH+4 to NO−
3 involves
autotrophic NH3 oxidisers (AOB = ammonia-oxidising bacteria) and autotrophic NO−
2 oxidisers
(NOB = nitrite oxidising bacteria). In addition, heterotrophic bacteria can oxidise reduced forms
of organic N to NO−
3 (Prosser, 2007). Ammonia-nitrogen in the permeate of SAMBR2 varied be-
tween 45 and 215 mg/L. This concentration depends on the hydrolysis efficiency of proteins in
the HR which in turn varied according to the VS retention time and the HRT of the HR. Moreover,
the protein (only a few measurements were taken) concentration decreased whereas the ammo-
nia concentration increased when passing through the SAMBR, which means that the hydrolysis
of proteins was continuing in the SAMBR. Protein determination on days 115, 143, 171 and 199
gave a concentration circa 100 mg/L in the permeate of SAMBR 1 and 2, whereas it was around
200 mg/L in the leachate from the HR. Surprisingly, the concentration in the AMBR permeate
was still around 50 mg/L although proteins are known to be degraded readily. It was found in
the literature that the determination of proteins using the direct Lowry procedure can suffer from
interference due to other chemicals such as tris, ammonium sulfate, EDTA, sucrose, citrate,
amino acid and peptide buffers, and phenols. The procedure with protein precipitation, which
uses deoxycholate and trichloroacetic acid, eliminates all these interferences with the exception
of phenols (Bensadoun and Weinstein, 1976). As the procedure with protein precipitation was
not used in this work, it is thought that the remaining 100 mg/L in the SAMBR permeate as
well as the 50 mg/L in the AMBR permeate were recalcitrant phenolic or proteinaceous com-
pounds interfering with the protein analysis. The 50% degradation of these phenolic compounds
in the AMBR shows that further stabilization was taking place in the AMBR which supports the
polishing character of the AMBR demonstrated by the COD removal.
Figure 6.14 shows the evolution of inorganic nitrogen in the AMBR. Because the inoculum used
in this study came from a dye wastewater plant, it was assumed that it did not contain any
nitrifiers. As a result, ammonia-nitrogen was initially not converted to nitrite or nitrate. Ammonia
oxidisers may also have been inhibited by undissociated ammonia (NH3) which was in the range
14 - 23 mg NH3/L between days 136 and 146. Anthonisen et al. (1976) have observed that
free ammonia can inhibit ammonia oxidation to nitrite by Nitrosomonas and nitrite oxidation to
nitrate by Nitrobacter or Nitrospira in the range 10-150 and 0.1-1 mg NH3/L, respectively. The
temporary nitrite build-up may be explained by the inhibition of nitrite oxidisers due to the free
ammonia ranging from 0.1 to 0.4 between days 146 and 167. Inhibition of nitrifying organisms by150

Chapter 6. CONTINUOUS TREATMENT OF LOW STRENGTH LEACHATE IN A SAMBR
free nitrous acid (HNO2) is unlikely to have occurred as the concentration remained in the range
0.00084-0.0052 mg HNO2/L, which is far below the inhibitory range of 0.22 to 2.8 mg/L reported
by Anthonisen et al. (1976). The growth of Nitrobacter (or Nitrospira) was confirmed by the slow
decrease in nitrite which was correlated with a slow increase in nitrate.
Figure 6.14: Concentration over time of the organic and inorganic nitrogen in the perme-ate of the AMBR.
From day 171 onwards, on average 97.7% of the NH+4 -N was converted to nitrite and nitrate
in the AMBR at a maximum nitrogen loading rate of 0.18 g NH+4 -N/l.day and a HRT of 0.5 day.
According to Figure 6.14 the evolution of nitrogen is the one observed in batch mode (Anthonisen
et al., 1976) where the ammonia is sequentially converted to nitrite and then to nitrate. In full
scale continuous wastewater treatment plant nitrite is seldom found in the reactors because
the conversion of NO−
2 to NO−
3 is much faster than the conversion of NH+4 to NO−
2 . Therefore,
as long as the NOB species are present in the digester running continuously nitrite is almost
never found. In this study nitrite was found because the inoculum did not contain any nitrifiers,
and the presence of a membrane kept all the species in the reactor and thereby resulted in a
sequential reaction as if the AMBR was batch fed. Regarding the effect of the HRT, it can be
said that the growth of AOB and NOB was not impeded by the successive HRT shocks until
the shock to 0.99 day where the nitrite concentration did not reach zero which indicates that
this HRT could overload the NOB such as Nitrobacter. However, previous work has shown
that floc size for ammonia degradation is also important (Wittebolle et al., 2008) because a
close distance between the nitrite producers and nitrite oxidisers is required to obtain complete
nitrification. Wittebolle et al. (2008) have compared nitrification in a sequencing batch reactor
and a MBR, and found that residual nitrite in the MBR was correlated with smaller flocs. They
measured flocs of 1 to 40 microns in the MBR versus 300 microns in the sequencing batch
reactor. Because of the shear effect in the AMBR, it is possible that the residual nitrite was due
to a lack of syntrophic association between AOB and NOB. In our study particle size distribution151

Chapter 6. CONTINUOUS TREATMENT OF LOW STRENGTH LEACHATE IN A SAMBR
analysis was carried out in the AMBR, but particles of 1000 micron were detected which could
be inorganic precipitates, thus rendering the comparison with data in the literature difficult. In
another study (Shin et al., 2005), a temporary nitrite build-up in a MBR was associated with a
poor oxygen transfer in the dead space of the MBR. The authors also reported that nitrification
was better accomplished with pH control with HCl than without pH control.
In this study, the SCOD fed to the AMBR was relatively low (400-600 mg/L) which promoted the
growth of autotrophic bacteria. Because of the low organic content, high DO (1.6 mg/L) and
good mixing (1.4 LPM) optimal conditions were met for the growth and retention of autotrophic
AOB in the AMBR at a HRT as low as 0.37 day. In contrast, Chen et al. (2008a) and Im et al.
(2001) could not maintain nitrification at 1.5 and 2.7 days HRT, respectively, because the COD
concentration in the feed to the aerobic step sharply increased. Jokela et al. (2002) also ob-
served that nitrification efficiency dropped to below 20% when the COD concentration suddenly
increased at 1.4 d HRT. As a result, heterotrophs competed for oxygen with the autotrophs lead-
ing to a decrease in nitrification activity. The AMBR permeate containing circa 50 mg/L of nitrite
and the same concentration of nitrate was recycled to the HR where no nitrite or nitrate was
detected. This was confirmed by the NH+4 -N and TN analysis which gave close concentrations;
typically the TN was 10-15 mg/L greater than the NH+4 -N concentration in the HR effluent. The
discrepancy was organic nitrogen such as proteins, peptides, nucleic acids or urea; this strongly
suggests that denitrification took place in the HR. Another clue is obtained by comparing the TN
concentration of the AMBR effluent and the HR effluent; the latter was on average 67% lower
than the former which indicates substantial N removal.
At this point it is not clear whether Anammox species were responsible for the conversion of
nitrite or nitrate to gaseous nitrogen using ammonia that is the end product of protein degradation
from the OFMSW feedstock fed to the HR. It is known that NOB can convert nitrite to nitrate if
dissolved oxygen is present, and that heterotrophs will consume all the oxygen present in the
HR before the NOB could consume the oxygen. However, as the HR was frequently opened for
feeding and because of technical problems, it is possible that there was enough DO for NOB to
grow and coexist with heterotrophs. Figure 6.2 shows how often the HR was opened for technical
problems, and it can be seen that after day 160 there was no methane in the headspace. As
the DO was not measured in the HR, it is not clear whether NOB could have grown in the HR,
but denitrifiers on the other hand were likely to grow because of nitrate from the AMBR and
the carbon sources available. Moreover, the TN analysis also revealed that between 7 and
35% of the TN in the permeate of the AMBR was organic N and that organic N was slowly
incresing over time. Hence, heterotrophs could very likely have coexisted in the AMBR using
organic N for growth and recalcitrants as a sole carbon source, which may explain why the
AMBR acts as a COD-polishing step. On one hand there was organic N as a nitrogen source
for the heterotrophs in the AMBR, but on the other hand their increase suggests that these were
recalcitrant molecules containing amine groups.
6.3.5.2 Effect of the HRT on the TSS, VSS, FSS, pH and Flux: The AMBR was started up at
a TSS, VSS and FSS of 3, 2.3 and 0.7 g/l, respectively, and was fed with the stabilized leachate,152

Chapter 6. CONTINUOUS TREATMENT OF LOW STRENGTH LEACHATE IN A SAMBR
i.e. the permeate of SAMBR2. Hence the feed contained no solids in suspension. Figure 6.15
shows that the VSS/TSS decreased linearly with time because the biomass was either settling
out, attaching to the reactor’s panels, or was forming a biofilm on the membrane.
Figure 6.15: Evolution with time of the pH, flux, TSS, VSS, FSS (left axis) and the VSS/TSSratio (right axis) in the AMBR.
The pH started at 7.25 but then plateaued at circa 8.5. This is due to the carbon dioxide being
stripped out of the liquid phase due to air sparging while the reactor was open to the atmosphere.
The feed to the AMBR was saturated in CO2 because it was used in SAMBR2 to recirculate the
biogas at the bottom of SAMBR2 for mixing and scouring purposes.
The concentration is CO2 is set by Henry’s law:
[
CO2(aq)
]
=pCO2
KCO2
(6.4)
where pCO2 is the partial pressure in atmosphere and KCO2is the Henry constant.
in SAMBR2, as the biogas contains about 20% CO2, it can be said that the partial pressure
was 0.2 atm and the CO2 concentration in the liquid is therefore 5.24.10−3 M using Henry’s law
described in Equation 6.4. In the AMBR which is an open system, the partial pressure of CO2(g)
is relatively constant at 0.000355 atm (=355 ppm). Therefore, CO2(aq) is equal to 1.38.10−5 M.
This is almost 3 orders of magnitude less than in the SAMBR. In other words, as soon as the
feed enters the AMBR the carbon dioxide is stripped out to reach a new equilibrium according to
Henry’s law.
As a result of CO2 stripping the equilibrium of carbonic acid is changed and there is less dis-
solved carbon dioxide available for carbonic acid formation:
CO2(aq) + H2O ⇋ H2CO3(aq) (6.5)
153

Chapter 6. CONTINUOUS TREATMENT OF LOW STRENGTH LEACHATE IN A SAMBR
There is, therefore, less dissociation into protons according to the carbonic acid equilibrium,
which caused the pH to rise.
H2CO3(aq) ⇋ H+aq + HCO−
3(aq) (6.6)
HCO−
3(aq) ⇋ H+aq + CO2−
3(aq) (6.7)
Regarding the alkalinity, it can be defined as:
A =[
HCO−
3
]
+ 2[
CO2−3
]
+[
B(OH)−4]
+[
OH−]
+ 3[
PO3−4
]
+[
HPO2−4
]
+[
SiO(OH)−3]
−[
H+]
−[
HSO−
4
]
− [HF ] (6.8)
but this can often be approximated by:
A =[
HCO−
3
]
+ 2[
CO2−3
]
+[
OH−]
−[
H+]
(6.9)
because phosphates and silicate are negligible, and at pH = 8.5[
HSO−
4
]
and [HF ] are also
negligible. As carbon dioxide is stripped out of the system, the pH increases, but the removal
of carbon dioxide does not modify the alkalinity of the system. At pH 8.5, the ion HCO−
3 pre-
dominates over H2CO3 and CO2−3 . Thus when carbon dioxide is removed from the system, the
following equilibrium is shifted to the left:
CO2 + H2O ← HCO−
3 + H+ (6.10)
The alkalinity is not changed because the net reaction removes the same number of equivalents
of negatively contributing species (H+) as positively contributing species (HCO−
3 ). The precipi-
tation of calcium carbonate, however, has a strong influence on the alkalinity. This is because
carbonate is composed of CaCO3 and its precipitation will remove Ca2+ and CO2−3 from the
solution. The calcium ion will not influence alkalinity, but CO2−3 will decrease the alkalinity by 2
times the molar concentration of CO2−3 .
The precipitation of calcium carbonate was observed in our system, and the decrease of alkalin-
ity was confirmed by titrating the effluent from SAMBR2 and AMBR which were found to contain
2250 and 750 mg eq CaCO3/l, respectively (Figure 6.16). Borzacconi et al. (1999) have also
observed that calcium ions can precipitate as CaCO3 at a pH around 8.
The maximum concentration of calcium before precipitation can be predicted using the solubility
product assuming that the interference of other ions can be neglected. The equilibrium is given
by the equation :
CaCO3(s) ⇋ Ca2+ + CO2−3 (6.11)
where the solubility product varies from Ksp = 3.7·10-9 to 8.7·10-9 at 25 ˚ C, depending upon the
data source (Seely, 2008; Weast, 1963).
However, this equation must be taken along with the equilibrium of carbon dioxide with atmo-
spheric carbon dioxide (equation 2.6) and the equilibrium of bicarbonate and carbonic acid given
above (equations 6.5 to 6.7).
For the AMBR, it is assumed that the partial pressure of carbon dioxide is 3.5·10-4 atmospheres
and that the pH is 8.5. Therefore, according to Henry’s equation, CO2(aq) is equal to 1.38·10-5 M.154

Chapter 6. CONTINUOUS TREATMENT OF LOW STRENGTH LEACHATE IN A SAMBR
Figure 6.16: Evolution of the alkalinity as mg equivalent CaCO3 per litre in the effluent ofHR and the permeate of SAMBR 1, SAMBR2 and AMBR.
This results in a concentration of H2CO3 equal to 1.6.10-8 moles per liter taking into account the
dissociation constants given in Section 2.3.6 of the literature review which are valid for high ionic
strength. When H2CO3 is known, the remaining three equations together with (Perrin, 1982):
H2O ⇋ H+ + OH− K = 10−14.167 at 20o C (6.12)
make it possible to solve simultaneously for the unknown concentrations. If 4.47·10-9 is taken for
Ksp, the maximum solubility of Ca2+ in the AMBR is only 3.1 mg/L at pH 8.5. Furthermore, this
value shows a quadratic dependence with the concentration of H+ so that the maximum Ca2+
concentration is 100 times greater at pH 7 than at pH 8.
In SAMBR2 at 35 ˚ C, the pH was 7 and the partial pressure of carbon dioxide was 0.2 atm (max-
imum 20% CO2 in the headspace), and the CO2 concentration in the liquid phase is therefore
5.24·10-3 M. The solubility of calcium at pH 7 is circa 2850 mg/L, but because of the high partial
pressure of carbon dioxide the solubility in SAMBR2 was only 5.1 mg/L. Thus precipitation can
occur in the SAMBR as well as in the AMBR if the calcium concentration is greater than the
calculated values. If the pH increases to 7.3 due to high ammonia concentrations for instance,
the maximum solubility of calcium become 1.3 mg/L, while if acidification to pH 6.8 takes place
due to high VFA concentrations, it becomes 12.7 mg/L.
Figure 6.15 also shows that the flux in the AMBR was decreasing over time. Even though the
TMP could not be recorded because only 2 transducers were available for the SAMBRs, it is very
likely that calcium carbonate precipitating on the membrane was causing the flux to drop. Visual
inspection of the membrane indicated a hard, off-white, chalky deposit similar to limescale, and
contact with a drop of HCl provoked an immediate fizzing. A precipitate was also found in the
permeate tubing, and a sample was taken and washed with plenty of water and then dissolved155
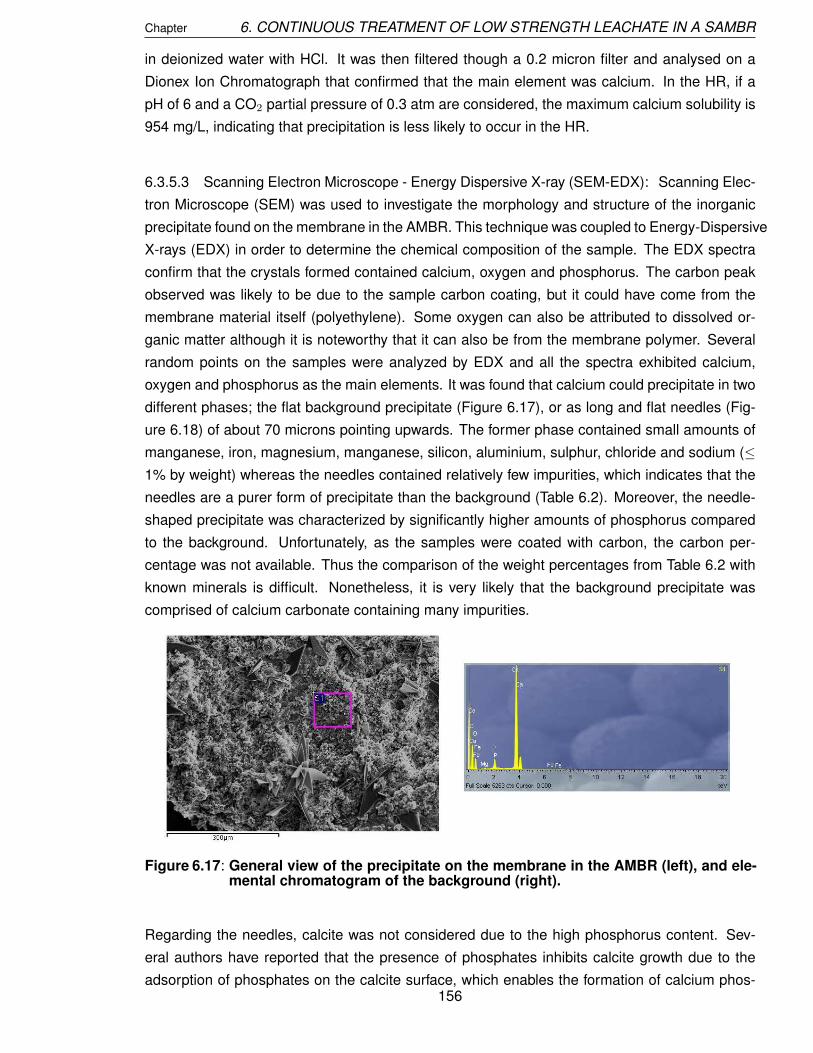
Chapter 6. CONTINUOUS TREATMENT OF LOW STRENGTH LEACHATE IN A SAMBR
in deionized water with HCl. It was then filtered though a 0.2 micron filter and analysed on a
Dionex Ion Chromatograph that confirmed that the main element was calcium. In the HR, if a
pH of 6 and a CO2 partial pressure of 0.3 atm are considered, the maximum calcium solubility is
954 mg/L, indicating that precipitation is less likely to occur in the HR.
6.3.5.3 Scanning Electron Microscope - Energy Dispersive X-ray (SEM-EDX): Scanning Elec-
tron Microscope (SEM) was used to investigate the morphology and structure of the inorganic
precipitate found on the membrane in the AMBR. This technique was coupled to Energy-Dispersive
X-rays (EDX) in order to determine the chemical composition of the sample. The EDX spectra
confirm that the crystals formed contained calcium, oxygen and phosphorus. The carbon peak
observed was likely to be due to the sample carbon coating, but it could have come from the
membrane material itself (polyethylene). Some oxygen can also be attributed to dissolved or-
ganic matter although it is noteworthy that it can also be from the membrane polymer. Several
random points on the samples were analyzed by EDX and all the spectra exhibited calcium,
oxygen and phosphorus as the main elements. It was found that calcium could precipitate in two
different phases; the flat background precipitate (Figure 6.17), or as long and flat needles (Fig-
ure 6.18) of about 70 microns pointing upwards. The former phase contained small amounts of
manganese, iron, magnesium, manganese, silicon, aluminium, sulphur, chloride and sodium (≤
1% by weight) whereas the needles contained relatively few impurities, which indicates that the
needles are a purer form of precipitate than the background (Table 6.2). Moreover, the needle-
shaped precipitate was characterized by significantly higher amounts of phosphorus compared
to the background. Unfortunately, as the samples were coated with carbon, the carbon per-
centage was not available. Thus the comparison of the weight percentages from Table 6.2 with
known minerals is difficult. Nonetheless, it is very likely that the background precipitate was
comprised of calcium carbonate containing many impurities.
Figure 6.17: General view of the precipitate on the membrane in the AMBR (left), and ele-mental chromatogram of the background (right).
Regarding the needles, calcite was not considered due to the high phosphorus content. Sev-
eral authors have reported that the presence of phosphates inhibits calcite growth due to the
adsorption of phosphates on the calcite surface, which enables the formation of calcium phos-156

Chapter 6. CONTINUOUS TREATMENT OF LOW STRENGTH LEACHATE IN A SAMBR
Figure 6.18: Zoom of the needle-shaped precipitate on the membrane in the AMBR (left),and its elemental chromatogram (right).
phates (Plant and House, 2002; Lin and Singer, 2005). Interestingly, it was observed in the SEM
picture (Figure 6.18) that indeed the needles seem to form on the background of calcite, and
grow perpendicular to the background. The high amount of phosphorus suggests that it could
be a calcium phosphate such as calcium hydrogen phosphate (or brushite CaHPO4.2H2O, Ksp =
10-6.69 (Montastruc et al., 2003)), dicalcium phosphate anhydrate (CaHPO4, Ksp = 10-6.9 (Mon-
tastruc et al., 2003)), amorphous calcium phosphate (Ca3(PO4)2, Ksp = 10-24 (Mamais et al.,
1994)), octacalcium phosphate (Ca4H(PO4)3.2.5H2O, Ksp = 10-49.6 (Montastruc et al., 2003)),
hydroxyapatite (Ca5(PO4)3OH, Ksp = 10-46.8 (Barat et al., 2008)) or carbonated hydroxyapatite
(Ca10(PO4)6(CO3)x(OH)2−2x, Ksp ≤ 1· 10-100 (Ito et al., 1997)). However, calcium phosphate pre-
cipitation follows the Ostwald rule, which states that the least thermodynamically stable phase
is the first one formed, which works as a precursor of the most stable phase (Montastruc et
al., 2003). In this case, carbonated hydroxyapatite would be the least thermodynamically stable
phase forming on the calcite background as a precursor for a more stable calcium phosphate.
Furthermore, the same authors (Montastruc et al., 2003) found that both dicalcium phosphate
dihydrate and amorphous calcium phosphate can crystallize at a pH lower than 7.3, and only
amorphous calcium phosphate at a pH higher than 7.3. Therefore, the more stable phase in this
study would either be dicalcium phosphate dihydrate or amorphous calcium phosphate.
Le Corre et al. (2005) and Doyle and Parsons (2002) observed that calcium ion can affect struvite
crystal growth and leads to the formation of an amorphous calcium phosphate. Therefore, it is
very likely that struvite precipitation did not occur because the available phosphates precipitated
with calcium on the membrane keeping the solution undersaturated with respect to struvite.
From all these considerations and from the light shed by other authors, it seems very likely that
the background was amorphous calcium carbonate and the presence of phosphates inhibited
calcite growth due to the adsorption of phosphates on the calcite surface, which enabled the
formation of calcium phosphates. The low level of impurities in these needles suggest that they
have a more crystalline structure which is why hydroxyapatite is the most likely. Chesters (2009)
obtained very similar SEM pictures with flat needles which he assumed to be hydroxyapatite
crystals. In the same paper, the authors report the use of a new anti-scalant (Genesys PHO :157

Chapter 6. CONTINUOUS TREATMENT OF LOW STRENGTH LEACHATE IN A SAMBR
Table 6.2: Weight percentages of several points of the background and the needle pre-cipitates.
Background Element
O Ca P Al Si S Fe Mg Cl Na Mn
Spectrum 1 46.7 47.98 2.32 0.64 1.09 0.28 0.99 0 0 0 0
Spectrum 2 38.95 55.23 2.08 0.3 1.06 0.28 1.49 0.31 0.29 0 0
Spectrum 3 45.03 50.3 3.43 0 0 0 0.66 0.57 0 0 0
Spectrum 4 55.93 33.55 6.66 0.26 0 0.17 0.82 0.77 0 0.82 1.02
Needles Element
O Ca P Al Si S Fe Mg Cl Na Mn
Spectrum 5 55.79 26.19 17.22 0.22 0.58 0 0 0 0 0 0
Spectrum 6 30.99 59.04 9.97 0 0 0 0 0 0 0 0
Spectrum 7 64.04 18.78 17.18 0 0 0 0 0 0 0 0
2-5 mg/L) to control calcium phosphate scale by inhibition mechanisms so that the solubility of
calcium phosphate is raised 150 times.
6.3.6 Particle Size Distribution
It is well known that particles having the same size as the membrane pore are particularly likely
to cause fouling. The particle size of the leachate and the contents of the SAMBR and AMBR
were measured and compared in Figure 6.19. It can be observed that the leachate is very
heterogeneous as it contains particles ranging from 0.3 microns to 1 mm. As expected, SAMBR1
and SAMBR2 also contains particles with a wide range of sizes including colloids below 0.4
microns which are presumably the particles responsible for pore blocking. The distribution of
the leachate and SAMBRs mixed liquor were bimodal with a peak at circa 1 micron and the
other at 10 microns, and a high proportion (90%) was below 48, 83 and 30 microns for the HR
effluent, SAMBR1 and SAMBR2 mixed liquor, respectively. No straightforward comparison could
be made between the leachate and the SAMBR bulks because of the heterogeneous character
of the leachate that contained bacterial flocs as well as lignocellulosic fibers. The comparison
between the volume percentages are also difficult as the accuracy of the MasterSizer 2000 is
within 5% and the peaks on Figure 6.19 are all smaller than 5%. However, the distribution of the
AMBR particles is such that 90% was below 632 microns with a mean diameter d(4,3) equal to
405 microns.
6.3.7 Salts
6.3.7.1 Introduction: The salts ions are Na+, K+, Mg2+, Ca2+, Cl−, PO3−4 , SO2−
4 , and it is
well known that high salt levels can cause bacterial cells to dehydrate due to osmotic pressure
and that Na+ is more toxic that any other salt on a molar basis. It is also known that the cation
determines the toxicity of salts (McCarty and McKinney, 1961). Sodium, potassium, magnesium,
158

Chapter 6. CONTINUOUS TREATMENT OF LOW STRENGTH LEACHATE IN A SAMBR
Figure 6.19: Particle size distribution of the leachate from the HR and the mixed sludgefrom SAMBR1, SAMBR2 and the AMBR.
calcium, phosphate and sulphate are present in the influent of anaerobic digesters and they
are all required for microbial growth. Moderate concentrations stimulate microbial growth, but
excessive amounts can cause inhibition or toxicity (Soto et al., 1993). Figure 6.20 shows the
evolution with time of the ions. Sulfate was omitted because its concentration remained below
10 mg/L in all reactor effluents throughout the 200 days. These results are discussed separately
in the following sections.
6.3.7.2 Sodium: Sodium is essential for methanogens and concentrations in the range 100-
200 mg/L were reported beneficial for the growth of mesophilic anaerobes (McCarty, 1964) be-
cause of its role in the formation of adenosine triphosphate or in the oxidation of NADH (Feijoo
et al., 1995). Sodium concentrations ranging from 3500 to 5500 mg/L can be moderately in-
hibitory and 8000 mg/L can be strongly inhibitory to methanogens at mesophilic temperature
depending on the adaptation period, antagonistic/synergistic effect, substrate and reactor con-
figuration (Kugelman and McCarty, 1964). He et al. (2006) report that 3.5-5.5 g/l and 2.5-4
g/l are the concentrations of sodium and potassium ions, respectively, that are optimal for AD.
Shin et al. (1995) showed that 2 to 10 g/L moderately inhibited the methanogenic activity, but
concentrations above 10 g/L strongly inhibits.
Although 8 g/l of Na+ and 12 g/l of K+ causes severe toxicity in the treatment of wastewaters,
methanogens have been reported to acclimate to high salts stress, such as 21.5 g/l Na+ and
53 g/l Na+. Furthermore, He et al. (2006) observed that 50 g/L Na+ inhibited acidogenesis but
surprisingly had the highest amount of substrate hydrolysed because of the highest α-amylase
159

Chapter 6. CONTINUOUS TREATMENT OF LOW STRENGTH LEACHATE IN A SAMBR
Figure 6.20: Concentration over time of Na+, K+, Mg2+, Ca2+, Cl−, PO3−4 in the HR effluent
and the permeate of SAMBR1, SAMBR2 and AMBR. The error bars representthe standard deviation.
activity at that concentration of Na+; the bacteria recovered at a concentration of 25 g/L. They
also observed that denitrification was optimal at pH 7 and that 50 g/L suppressed denitrifica-
tion. In another study, sodium was found to be more toxic to propionic acid-utilizing microorgan-
isms than acetate-utilizing and lignocellulose-degrading ones (Liu and Boone, 1991; Soto et al.,
1993). The literature gives confusing data regarding the optimal and inhibitory levels of salts,
and papers have focused more on inhibition studies in batch bottles rather than in continuous
systems. Indeed very little data is available for full-scale plants as ions are not systematically
measured to assess the health of anaerobic digesters.
In this study, HR and SAMBR1 started with a Na+ concentration of 1034 and 612 mg/L, respec-
tively, whereas SAMBR2 and AMBR started with a sodium concentration over 1.5 g/L due to160
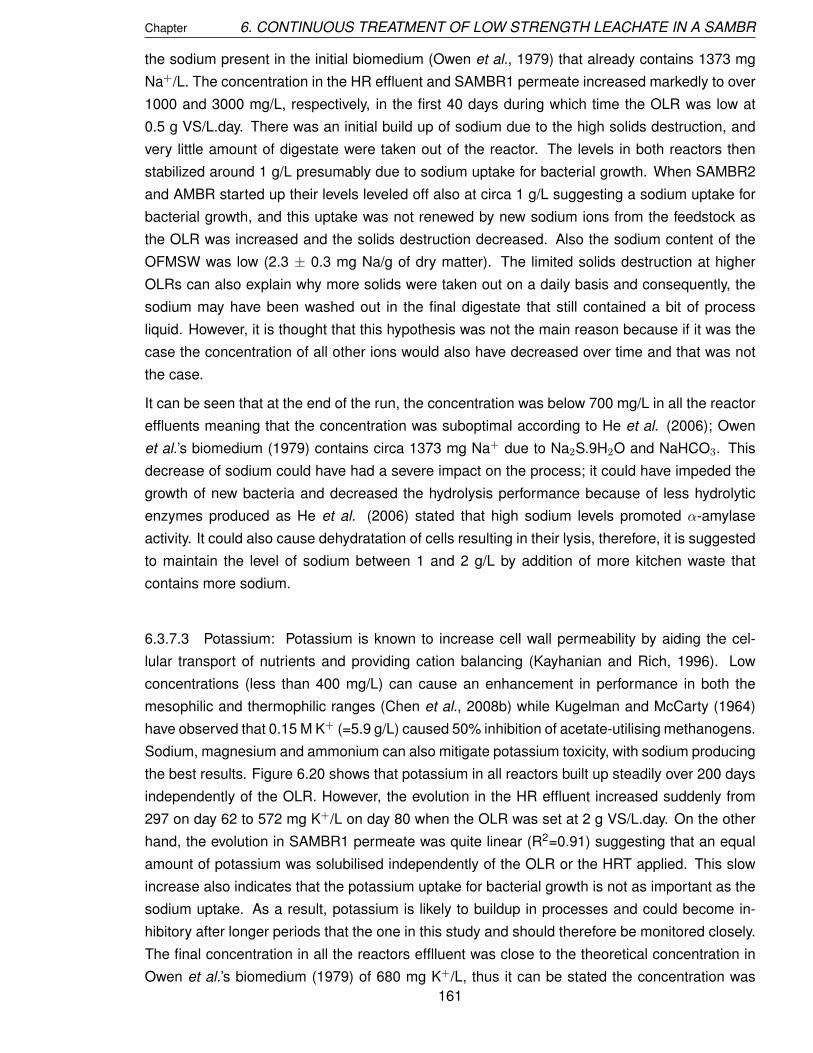
Chapter 6. CONTINUOUS TREATMENT OF LOW STRENGTH LEACHATE IN A SAMBR
the sodium present in the initial biomedium (Owen et al., 1979) that already contains 1373 mg
Na+/L. The concentration in the HR effluent and SAMBR1 permeate increased markedly to over
1000 and 3000 mg/L, respectively, in the first 40 days during which time the OLR was low at
0.5 g VS/L.day. There was an initial build up of sodium due to the high solids destruction, and
very little amount of digestate were taken out of the reactor. The levels in both reactors then
stabilized around 1 g/L presumably due to sodium uptake for bacterial growth. When SAMBR2
and AMBR started up their levels leveled off also at circa 1 g/L suggesting a sodium uptake for
bacterial growth, and this uptake was not renewed by new sodium ions from the feedstock as
the OLR was increased and the solids destruction decreased. Also the sodium content of the
OFMSW was low (2.3 ± 0.3 mg Na/g of dry matter). The limited solids destruction at higher
OLRs can also explain why more solids were taken out on a daily basis and consequently, the
sodium may have been washed out in the final digestate that still contained a bit of process
liquid. However, it is thought that this hypothesis was not the main reason because if it was the
case the concentration of all other ions would also have decreased over time and that was not
the case.
It can be seen that at the end of the run, the concentration was below 700 mg/L in all the reactor
effluents meaning that the concentration was suboptimal according to He et al. (2006); Owen
et al.’s biomedium (1979) contains circa 1373 mg Na+ due to Na2S.9H2O and NaHCO3. This
decrease of sodium could have had a severe impact on the process; it could have impeded the
growth of new bacteria and decreased the hydrolysis performance because of less hydrolytic
enzymes produced as He et al. (2006) stated that high sodium levels promoted α-amylase
activity. It could also cause dehydratation of cells resulting in their lysis, therefore, it is suggested
to maintain the level of sodium between 1 and 2 g/L by addition of more kitchen waste that
contains more sodium.
6.3.7.3 Potassium: Potassium is known to increase cell wall permeability by aiding the cel-
lular transport of nutrients and providing cation balancing (Kayhanian and Rich, 1996). Low
concentrations (less than 400 mg/L) can cause an enhancement in performance in both the
mesophilic and thermophilic ranges (Chen et al., 2008b) while Kugelman and McCarty (1964)
have observed that 0.15 M K+ (=5.9 g/L) caused 50% inhibition of acetate-utilising methanogens.
Sodium, magnesium and ammonium can also mitigate potassium toxicity, with sodium producing
the best results. Figure 6.20 shows that potassium in all reactors built up steadily over 200 days
independently of the OLR. However, the evolution in the HR effluent increased suddenly from
297 on day 62 to 572 mg K+/L on day 80 when the OLR was set at 2 g VS/L.day. On the other
hand, the evolution in SAMBR1 permeate was quite linear (R2=0.91) suggesting that an equal
amount of potassium was solubilised independently of the OLR or the HRT applied. This slow
increase also indicates that the potassium uptake for bacterial growth is not as important as the
sodium uptake. As a result, potassium is likely to buildup in processes and could become in-
hibitory after longer periods that the one in this study and should therefore be monitored closely.
The final concentration in all the reactors efflluent was close to the theoretical concentration in
Owen et al.’s biomedium (1979) of 680 mg K+/L, thus it can be stated the concentration was
161

Chapter 6. CONTINUOUS TREATMENT OF LOW STRENGTH LEACHATE IN A SAMBR
optimal in the process towards the end of the experiment.
6.3.7.4 Magnesium: The optimal Mg2+ concentration was reported to be 720 mg/L for the
anaerobic bacterium Methanosarcina thermophila (Schmidt and Ahring, 1993). High concentra-
tions have been shown to stimulate the production of single cells which is detrimental because
these are more sensitive to lysis and this is an important factor in the loss of aceticlastic activity
(Chen et al., 2008b). This study has shown that magnesium does not reach levels higher than
300 mg/L at all the OLRs tested. Although an increase was observed in the HR and SAMBR1
effluent when the OLR was changed to 2 g VS/L.day, the magnesium level remained relatively
stable at an OLR of 4 to 16 g VS/L.day between 100 and 150 mg/L, which is relatively close to
the level of 215 mg Mg2+/L in Owen et al.’s biomedium (1979). This indicates that the OFMSW
contains enough magnesium in itself and that no extra source would be required for optimal con-
centration. The level increased suddenly in all reactor effluents after day 178 due to an artificial
spike of trace elements based on Owen et al.’s biomedium (1979) in order to investigate the
effect of trace metal addition, but no positive or negative effect were observed.
6.3.7.5 Calcium: Calcium is known to be essential for the growth of certain strains of methanogens.
It is also important in the formation of microbial aggregates. However, excessive amounts lead
to the precipitation of carbonate and phosphate which may result in the scaling of reactors and
biomass and reduced specific methanogenic activity, loss of buffer capacity and essential nutri-
ents for anaerobic degradation (Chen et al., 2008b). Regarding the toxicity, the literature pro-
vides confusing data. No inhibitory effect was observed at 7000 mg Ca2+/L (Jackson-Moss et al.,
1989), but Kugelman and McCarty (1964) reported that moderate inhibition can happen at con-
centration ranging from 2500 to 4000 mg/L and that the optimum concentration for methanogens
was 200 mg/L. Concentrations greater than 300 mg/L were reported to be detrimental for biofilm
formation (Hulshoff Pol et al., 1983). Mathiesen (1989) found that calcium and magnesium sup-
plementation enhanced the methane production and foaming was avoided.
In this study calcium concentration was low (about 20 mg/L) for the first 100 days until the
OLR was set at 4 g VS/l.day on day 97. As the levels were very similar in HR effluent and
SAMBR1 permeate, it seems that precipitation did not occur because the calcium concentration
was too low. As a reference, Owen et al.’s biomedium (1979) contains 68 mg Ca2+/l in the
form of CaCl2.2H2O. Interestingly, the level started increasing very rapidly to 160 mg/L in the HR
effluent but the concentration in the other reactors remained much lower at about 60 mg/l, and
even decreased to 20 mg/L at the end of the run indicating precipitation of calcium carbonate in
the SAMBR and AMBR. The calcium concentration in the HR seems to be directly proportional
to the OLR applied suggesting that calcium salts are readily dissolved in the HR but it could be
also due to the lower pH in the HR that dropped below 6.5 after day 180. The concentration
reached 80 mg/L on day 178 but the increase after day 178 is also partly due to the artificial
spike of trace elements.
162

Chapter 6. CONTINUOUS TREATMENT OF LOW STRENGTH LEACHATE IN A SAMBR
6.3.7.6 Phosphate: PO3−4 was found at a relatively low concentration in all reactors, except
in the AMBR that started up at about 140 mg/L, presumably due to the level in the inoculum.
The concentration in the AMBR dropped down to low levels (20 - 40) like in the other reac-
tors. Phosphate is essential for bacterial growth because it is contained in DNA, but high levels
are not recommended because it can precipitate as struvite (NH4MgPO4.6H2O). Because phos-
phate concentration is usually lower than ammonia and magnesium in anaerobic digester, it will
determine whether struvite precipitates or not.
6.3.8 Size Exclusion Chromatography (SEC)
6.3.8.1 Introduction: Figure 6.21 presents the calibration curves used for the SEC. The stan-
dards with molecular weights (MW) greater than 219.3 did not appear as a single peak, and
could not be resolved using the column Aquagel 0H-40. An exponential curve was fitted to the
calibration standard and the following equation was obtained (R2 = 0.98):
MW (Da) = 4 · 1010 · exp {−0.9851 · t} (6.13)
where t is the elution time.
Figure 6.21: Calibration of the Size Exclusion Chromatography. The Y-axis is the ab-sorbance of the PEG and PEO standards on the refractive index detector.
Samples of the HR effluent and the SAMBR and AMBR permeates were taken regularly during
the continuous experiment in order to investigate the evolution with time of the MW distribution
in the reactor effluents. However, a first objective was to study the difference in MW between
the different reactors at a specific moment. Figure 6.22 Panel A shows the size exclusion chro-
matograms of the HR effluent, SAMBR1 bulk and permeate, SAMBR2 bulk and permeate and
AMBR bulk and permeate on day 192. This day was deemed representative of the situation in
the process because the SCOD in the SAMBR and AMBR was stable. All the chromatograms163

Chapter 6. CONTINUOUS TREATMENT OF LOW STRENGTH LEACHATE IN A SAMBR
contain two main peaks: one in a region of high MW (circa 11.5 min) and a second sharper peak
at low MW (around 17.5 min). A similar observation was made by Ortega-Clemente et al. (2008)
and Sierra-Alvarez et al. (1990). The former team was treating pulp mill effluents in an anaer-
obic fluidized bed reactor, while the latter treated soda pulp liquors of pine, spruce and wheat
straw in a UASB. They stated that the lignic fraction removed or biotransformed anaerobically
corresponds to low MW lignin derivatives.
The absorbance on the UV detector set at 254 nm was zero before 7.5 minutes and after 20
minutes. Panel B shows a zoom of the very high MW (t≤ 9 min) in order to understand the fate of
very high MW organics (MW≫ 200kDa). Panel B shows clearly that the very high MW organics
were dominant in the leachate fed to the SAMBRs; the bulk of the SAMBRs still contained some
of these molecules but considerably less. Interestingly, their permeate was absolutely free of
them which indicates a full rejection of these compounds by the membrane. As expected, the
AMBR bulk and permeate also did not contain any of these. These molecules eluting before 9
minutes are supposedly huge, but their MW cannot be determined accurately. Nevertheless an
extrapolation of the calibration curve would show that organics eluting at 8.4 minutes would have
a MW of 10,200 kDa, but this should be interpreted with caution since they are far out of the
calibration range (the standard of 219.3 kDa eluted at 12.3 minutes).
The medium MW compounds (11 to 13.2 minutes elution time) were in the range ≈800 to ≈90
kDa. It can be seen from Figure 6.22 Panel A that the absorbance of these compounds is greater
in the SAMBRs than in the HR as these medium MW compounds are likely to be the result
of the hydrolysis of the aforementioned high MW compounds eluting before 9 minutes. Thus
the medium MW compounds appear more concentrated than in the leachate due to a further
hydrolysis and stabilization of the leachate in the SAMBRs. The stabilization of recalcitrant
organics can also result in a higher degree of aromaticity that would also translate to a higher
absorbance at 254 nm.
Interestingly, the absorbance in the SAMBRs permeate is lower which is evidence that these
medium MW compounds were rejected by the membrane to some extent. For instance on day
192, based on the relative absorbance, there was a 16 and 18% rejection in SAMBR1 and
SAMBR2, respectively. Furthermore, the permeate peaks are sharper than the bulk peaks and
the HR effluent peak; it can be seen that SAMBR2 bulk has a wide peak that plateaus between
11.2 and 12.2 minutes while its permeate counterpart is between 11.7 and 12.2, thus showing
the rejection of the highest MW compounds amongst the medium MW compounds present in the
bulk. The highest standard (219.3 kDa) eluted at 12.3, but nonetheless if the calibration curve
is extrapolated beyond 12.3 minutes, it is calculated that elution times of 11.2 and 11.7 would
correspond to a MW of 646 and 395 kDa, respectively. As a result, the compounds in that range
of 395 - 646 kDa were more likely to be rejected by the membrane while the MW ≤ 395 kDa
were observed in the permeate.
The comparison between the ”SAMBR2 out” and ”AMBR bulk” curves indicates firstly that medium
MW compounds are further hydrolysed in the AMBR because they appear at a lower absorbance,
therefore at a lower concentration than in SAMBR2 permeate. Secondly, there is a slight shift
of the AMBR curves to the right (t = 12.7 min) compared to the SAMBR2 permeate curve that164

Chapter 6. CONTINUOUS TREATMENT OF LOW STRENGTH LEACHATE IN A SAMBR
Figure 6.22: (A) Size exclusion chromatograms of the HR effluent, SAMBR1, SAMBR2 andAMBR bulks permeates on day 192. (B) Zoom of the curves before 10 minutesof elution time.
peak at ≈ 11.8 - 12 min meaning that the medium MW molecules are further broken down in the
AMBR. In terms of MW, it can be stated that medium MW compounds in SAMBR2 permeate are
in the range 358 - 294 (11.8 ≤ t ≤ 12 min), while the AMBR bulk contained compounds of MW
in the range 198-134 kDa (12.4 ≤ t ≤ 12.8 min). The COD polishing in the AMBR was therefore
efficient on compounds of MW in the range 200 - 350 kDa.
Finally, all the samples exhibited a sharp peak with an elution time between 17.1 and 17.8
minutes, which is between the elution times of the standard 1.9 kDa (t=17 min) and 0.194 kDa
(19.2 min), and thus correspond to low MW compounds or fulvic acids. The difference between
these standards is very small in terms of MW and it is assumed that unknown peaks between
165

Chapter 6. CONTINUOUS TREATMENT OF LOW STRENGTH LEACHATE IN A SAMBR
Figure 6.23: (A) Evolution with time of the absorbance of medium MW compounds (11 to13.2 elution time, i.e. MW in the range 800 to 90 kDa) in the HR effluent andin the permeates of SAMBR1, SAMBR2 and AMBR. (B) Evolution with time ofthe absorbance of low MW compounds (17.1 to 17.8 elution time, i.e. MW inthe range 1900 to 900 Da) in the HR effluent and in the permeates of SAMBR1,SAMBR2 and AMBR.
these two standards are not significantly different. The low MW fraction of the HR effluent has
a greater absorbance than in SAMBR1 and SAMBR2 bulks. This could be due to the higher
concentration of aromatics being absorbed at 254 nm in the leachate compared to the SAMBRs
bulks.
The low MW fraction in the AMBR has a greater absorbance than in the SAMBR2 permeate
which could be due to the higher aromaticity of the former as fulvic acids are further degraded
in the AMBR. In the case of SAMBR2 and AMBR the absorbance was higher in the permeate
166

Chapter 6. CONTINUOUS TREATMENT OF LOW STRENGTH LEACHATE IN A SAMBR
than in the bulk which could mean that there was an increase in the concentration of these fulvic
acids in the permeate. However, it is more likely that the diffusion through the biofilm enables
them to be degraded further than in the bulk which provided a greater degree of aromaticity
that translated to a higher absorbance at 254 nm and was therefore not due to an increase in
concentration.
it is noteworthy that this rejection of medium MW and the higher degree of aromaticity of low MW
in the permeate of AMBR happened not only on day 192 but also on all the other days sampled
(days 136, 150, 164, 178 and 199). Regarding the evolution of the medium and low MW com-
pounds over the 200 days, it can be stated that overall there was no build up in the absorbance
in any effluent (HR, SAMBR1, SAMBR2 and AMBR). The panel A of Figure 6.23 shows the
evolution of the medium MW compounds, while panel B shows the low MW compounds. The
medium MW compounds in SAMBR1 followed a very similar evolution compared to the SCOD;
the absorbance increased slowly until day 136, then plateaued, and eventually, like the SCOD,
there was a decrease in absorbance after day 178 probably due to a lower concentration of all
organics caused by dilution with more fresh water at high OLRs. The evolution of medium MW
compounds in the HR, SAMBR2 and AMBR was more chaotic but eventually their absorbance
also decreased.
Interestingly, the absorbance of SAMBR2 was two times lower than that of SAMBR1 during
the startup. This suggests that in SAMBR1 the competent population of hydrolytic bacteria
acclimatised to the leachate medium was able to stabilize the organics by increasing their degree
of aromaticity, while this was not the case in SAMBR2. At startup SAMBR2 was virtually free
of recalcitrant organics due to its inoculum and because the volume was adjusted with synthetic
biomedium (Owen et al., 1979), and hence the concentration of organics with high aromaticity
was lower. Similarly, the absorbance of the AMBR at startup was considerably lower than in
the other reactors because of the unadapted bacterial population that could not stabilize the
refractory organics. In panel B for low MW compounds, the absorbance of SAMBR2 and AMBR
was lower than that of SAMBR1, again due to the unadapted inoculum and the organics-free
biomedium, but the difference was more significant for the medium MW compounds suggesting
that the increase of SCOD in SAMBR2 during startup was mainly due to the buildup of medium
MW compounds that could not be hydrolyzed, rather than the fulvic acids.
6.3.9 Gas Chromatography - Mass Spectrometry
6.3.9.1 Introduction: This technique can provide us with additional insights into the processes
taking place in the continuous treatment of OFMSW in two-stage membrane reactors. However,
it should be born in mind that library identification should be interpreted with caution as some-
times a high match can be wrong, and this can be detected by comparing the mass spectra
of the peak selected with the mass spectra of the proposed compounds. Moreover, a calibra-
tion line was drawn for o-hydroxybiphenyl and Bis (2-ethylhexyl)phthalate in order to gain more
information on the concentrations of these specific recalcitrants found in the reactors.
A control sample (referred as ’scrap’) consisted of 500 mL of DW in which small pieces of the
167
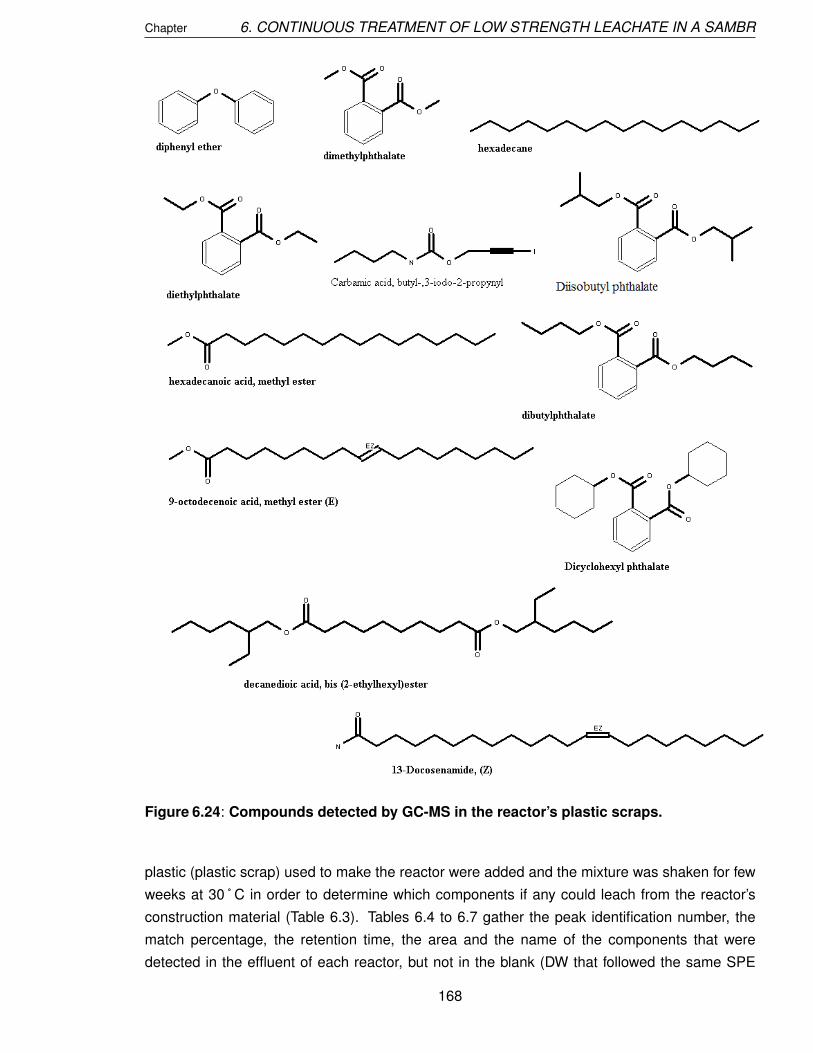
Chapter 6. CONTINUOUS TREATMENT OF LOW STRENGTH LEACHATE IN A SAMBR
Figure 6.24: Compounds detected by GC-MS in the reactor’s plastic scraps.
plastic (plastic scrap) used to make the reactor were added and the mixture was shaken for few
weeks at 30 ˚ C in order to determine which components if any could leach from the reactor’s
construction material (Table 6.3). Tables 6.4 to 6.7 gather the peak identification number, the
match percentage, the retention time, the area and the name of the components that were
detected in the effluent of each reactor, but not in the blank (DW that followed the same SPE
168

Chapter 6. CONTINUOUS TREATMENT OF LOW STRENGTH LEACHATE IN A SAMBR
Table 6.3: Compounds detected by GC-MS in the reactor’s plastic scraps.
Percentage Retention Compound Formulamatch time
78 11.808 diphenyl ether C12H10O
83 13 dimethylphthalate C10H10O4
97 14.5 hexadecane C16H34
93 15.304 diethylphthalate C12H14O4
97 16 Carbamic acid, butyl-,3-iodo-2-propynyl C8H12INO2
83 18.901 Diisobutyl phthalate C16H22O4
99 19.2 hexadecanoic acid, methyl ester C17H34O2
91 20.107 dibutylphthalate C16H22O4
92 21.198 9-octadecenoic acid, methyl ester (E) C19H36O2
78 26.5 Dicyclohexyl phthalate C20H26O4
91 28.5 decanedioic acid, bis (2-ethylhexyl)ester C26H50O4
98 28.725 13-Docosenamide, (Z) C22H43NO
protocol) nor the sample with plastic scraps. In addition, the last column comments on the
biodegradability by comparing the areas of the respective peaks.
6.3.9.2 HR Effluent: The analysis revealed that most of the compounds were below 10 µg/L
while only two compounds (Bisphenol A and unidentified compounds with RI = 2096) were in
the range 14 - 38 µg/L. The chromatograms revealed that butylated hydroxytoluene found in
the HR effluent was completely degradable because they were not found in both SAMBRs and
the AMBR effluents. However, previous work has shown that butylated hydroxytoluene can leach
from plastic and tubings (Shpiner, 2007), but it was not detected in our control sample containing
plastic scraps. Similarly, 8,11-octa decadienoic acid, methyl ester (peak ID 8), pentadecanoic
acid, 14-methyl, methyl ester (peak ID 7) and tridecanoic acid, 12-methyl-, methyl ester (peak ID
5) were three aliphatic molecules that were not detected in the SAMBR permeates due to their
complete degradation in this reactor.
Surprisingly, padimate O and the phenanthrene carboxylic acid that are aromatics and thus
considered as difficult to biodegrade were successfully degraded in the SAMBRs due to the
complete retention of bacteria. Most of PAHs (polycyclic aromatic hydrocarbons) in leachate
are stable and it is difficult to cleave the ring without oxygen. However, recent research has
shown that unsubstituted low molecular polycyclic aromatic compounds can be degraded under
nitrate-reducing, iron-reducing, sulfate-reducing and methanogenic conditions (Xu et al., 2008;
MacRae and Hall, 1998). MacRae and Hall (1998) showed that PAHs could be degraded under
denitrifying conditions as long as other nutrients were not limiting. The half lives of low molecular
weight PAH ranged from approximately 33-88 days. Degradation of high molecular weight PAH
was slower, or not observed. Half lives ranged from 143-812 days. Thus, the presence of nitrate
169

Chapter 6. CONTINUOUS TREATMENT OF LOW STRENGTH LEACHATE IN A SAMBR
Figure 6.25: Compounds detected by GC-MS in the HR effluent.
from the permeate of the AMBR may have assisted the degradation of the padimate and the
phenanthrene under nitrate-reducing conditions in the HR.
170

Chapter 6. CONTINUOUS TREATMENT OF LOW STRENGTH LEACHATE IN A SAMBR
Table 6.4: Recalcitrant compounds detected by GC-MS in the effluent from the HR. Inthe case of unidentified compounds, the retention index of the peak is given.
Peak Match Retention Recalcitrants in Formula PeakID % time HR effluent Area
1 93 13.36 butylated hydroxytoluene C15H24O 12281748
2 94 13.72 o-hydroxybiphenyl C12H10O 16062321
3 13.91 1462.7 26872283
4 93 16.03 benzophenone C13H10O 112030035
5 93 16.53 tridecanoic acid,12-methyl-, C15H30O2 34198411methyl ester
6 17.49 1691.5 56558115
7 99 19.14 pentadecanoic acid, C17H34O2 6274850414-methyl, methyl ester
8 99 21.11 8,11-octadecadienoic acid, C19H34O2 38295039methyl ester
9 21.27 1964.1 46078046
10 21.85 2008.9 95664113
11 94 22.48 Bisphenol A C15H16O2 570361325
12 22.98 2096.1 411285760
13 87 24.05 padimate O C17H27NO2 101864975
14 95 24.39 1-phenanthrene carboxylic acid C21H27O3 931278431,2,3,4,4a,9,10,10a -octahydro-1,4a-dimethyl-7-(1-methylethyl)-,methyl ester,[1R(1alpha,4abeta,10aalpha)]-
15 72 26.18 Bis (2-ethylhexyl)phthalate C24H38O4 171161815
6.3.9.3 SAMBR1 and 2 Permeates: Tables 6.4, 6.5 and 6.6 show that o-hydroxybiphenyl and
Bisphenol A can be considered as non biodegradable anaerobically because their areas in-
creased by 9 and 12% in SAMBR1, respectively. In SAMBR2 they increased by 123 and 15%,
respectively. The concentration of o-hydroxybiphenyl was found to be 10.2, 11.2 and 22.8 µg/L
in the HR, SAMBR1 and SAMBR2, respectively. Bisphenol A (CAS 80057) is a very common
compound found in landfill leachate and it is known as a potentially endocrine disrupting indus-
trial chemical (Wintgens et al., 2004; Schwarzbauer et al., 2002). It is found in epoxy resin and
is used as a stabilizer for polyvinyl chloride resin. Yasuhara et al. (1999) found that among
more than 100 organic compounds, Bisphenol A was at a very high concentration of 61.4 mg/L.
Wintgens et al. (2004) and Yamamoto et al. (2001) also found concentrations ranging up to
milligrams per liter in raw landfill leachate. Wintgens et al. (2004) stated that the high con-
centrations can be explained by leaching effects from polycarbonate plastics abundant in the
deposited waste. The conditions encountered in the landfill in terms of alkaline pH, mesophilic
temperature and high ionic strength might promote the leaching process. They used a pilot plant
MBR configuration including denitrification and two-stage nitrification with side-stream tubular
ultrafiltration that rejected 99% of bisphenol A. They reckon that it seems to be removed most
effectively by biodegradation in a system with high sludge age and complete retention of solids.
171

Chapter 6. CONTINUOUS TREATMENT OF LOW STRENGTH LEACHATE IN A SAMBR
Several authors have observed that the concentration of Bisphenol A tends to decrease over
time in a landfill (Asakura et al., 2004). In our study, bisphenol A was the main peak in the
HR effluent at a concentration estimated to be in the range 19-38 µg/L, while in the SAMBR1
and SAMBR2 its concentration increased to 21-44 µg/L. On the other hand, these authors have
observed that the concentration of Bis (2-ethylhexyl)phthalate remained at the same level. In
our study it was not detected in the blank and scrap, and its area more than doubled from the
HR effluent to SAMBR1 (+283%) and SAMBR2 (+179%) permeates, suggesting that it could be
secreted by bacteria themselves, or is the catabolic end product of non detected compounds. A
calibration line was obtained for Bis (2-ethylhexyl)phthalate (R2 = 0.99) and it revealed that the
concentration in SAMBR 1 and SAMBR2 was 1.4 and 1 mg/L, respectively. The concentration
in the HR and the AMBR was found to be 0.33 and 0.3 mg/l, respectively.
Some molecules were found to be slowly biodegradable because their areas decreased when
passing through both SAMBRs. These molecules were benzophenone which decreased by 81
and 73% in SAMBR1 and 2, respectively , plus unidentified compounds with retention indices
1462.7 and 2096.1 in SAMBR1 and 2008.9 and 2096.1 in SAMBR2.
Table 6.5: Recalcitrant compounds detected by GC-MS in the permeate of SAMBR1. Inthe case of unidentified compounds, the retention index of the peak is given.The last column comments on the anaerobic biodegradability by comparingthe peak area of the same compound in the HR effluent. NB = Non biodegrad-able, B = Biodegradable.
Peak % Ret. Recalcitrants in Formula Peak AnaerobicID Match time SAMBR1 permeate Area Biodegradability
16 11.68 1333.7 26996170 New
2 94 13.72 o-hydroxybiphenyl C12H10O 17502568 NB (+9%)
3 13.91 1462.7 14119684 B (-48%)
4 83 16.03 benzophenone C13H10O 21735256 B (-81%)
17 18.21 1742.3 15836896 New
18 78 18.99 N-phenethylbenzenesulfonamide C14H15NO2S 208608266 New
19 78 20.23 2,5-cyclohexadien-1-one,2,6 bis C16H24O 44712759 New(1,1-dimethylethyl)-4-ethylidene-
11 94 22.48 Bisphenol A C15H16O2 640395425 NB (+12%)
12 22.98 2096.1 179375192 B (-56%)
15 91 26.18 Bis (2-ethylhexyl)phthalate C24H38O4 655807845 NB (+283%)
6.3.9.4 SAMBR2 and AMBR Permeates: In comparing the SAMBR2 and AMBR permeates
it can be seen that phenol 2,4-bis(1,1-dimethylethyl) and N-phenethylbenzenesulfonamide were
not degraded aerobically because their areas were found to increase when passing through
the AMBR: their areas increased by 45 and 786%, respectively. The concentration of the latter
reached 44-87 µg/L in the AMBR. Mansouri et al. (2007) also found that phenol 2,4-bis(1,1-
dimethylethyl) was among the components that remained after an aerobic fixed bed process
172

Chapter 6. CONTINUOUS TREATMENT OF LOW STRENGTH LEACHATE IN A SAMBR
Table 6.6: Recalcitrant compounds detected by GC-MS in the permeate of SAMBR2. Inthe case of unidentified compounds, the retention index of the peak is given.The last column comments on the anaerobic biodegradability by comparingthe peak area of the same compound in the HR effluent. NB = Non biodegrad-able, B = Biodegradable.
Peak % Ret. Recalcitrants in Formula Peak AnaerobicID Match time SAMBR2 permeate Area Biodegradability
21 93 12.4 phenol 2,4-bis C14H22O 11305194 New(1,1-dimethylethyl)
2 94 13.72 o-hydroxybiphenyl C12H10O 35846178 NB (+123%)
22 94 15.69 benzenemethanol, C13H12O 36535074 Newalpha-phenyl
4 94 16.03 benzophenone C13H10O 29918768 B (-73%)
18 78 18.99 N-phenethylbenzenesulfonamide C14H15NO2S 147543256 New
19 78 20.23 2,5-cyclohexadien-1-one,2,6 bis C16H24O 44712759 New(1,1-dimethylethyl)-4-ethylidene-
10 21.85 2008.9 46417418 B (-50%)
11 95 22.48 Bisphenol A C15H16O2 655737185 NB (+15%)
12 22.98 2096.1 262561636 B (-36%)
15 91 26.18 Bis(2-ethylhexyl)phthalate C24H38O4 478178027 NB (+179%)
Figure 6.26: New compounds detected by GC-MS in the permeate of SAMBR1.
treating landfill leachate. As Bisphenol A was not found in the AMBR permeate, it can be stated
that it was fully biodegraded aerobically. This is in line with Asakura et al. (2004) who treated
raw leachate by aeration and found that bisphenol A decreased from 70.9 - 224 µg/l to 0.11-
0.24 µg/l in the effluent. This is also in line with the Biocatalysis / Biodegradation database
from the University of Minnesota (http:// umbbd.msi.umn.edu/index.html) that states that Bisphe-
nol A is metabolized by a Gram-negative aerobic bacterium (strain MV1) via a novel pathway.
The metabolism involves two primary pathways: a minor pathway, in which Bisphenol A is first
oxidised to a triol, and a major pathway, in which Bisphenol A is metabolized to form the interme-
diates 4-hydroxybenzoate and 4-hydroxyacetophenone that are converted to carbon dioxide and
173

Chapter 6. CONTINUOUS TREATMENT OF LOW STRENGTH LEACHATE IN A SAMBR
Figure 6.27: New compounds detected by GC-MS in the permeate of SAMBR2.
biomass (Spivack et al., 1994). Other intermediates of the degradation pathway of Bisphenol A
include toluene and vanillin.
Interestingly, some molecules were found to be non biodegradable in an anaerobic environment
but could be slowly biodegraded in the AMBR such as 2,5-cyclohexadien-1-one,2,6 bis(1,1-
dimethylethyl)-4-ethylidene- and Bis (2-ethylhexyl)phthalate. The former decreased by 68%
whereas the latter decreased by 67% in the AMBR. Bis (2-ethylhexyl)phthalate often referred
as DEHP is the most common plasticizer (Bauer and Herrmann, 1997). Several authors have
observed that the concentration of Bis (2-ethylhexyl)phthalate remains constant in a landfill
(Asakura et al., 2004; Sakamoto et al., 2000). Because Bis (2-ethylhexyl)phthalate has a high
octanol/water partition coefficient, it can be considered as hydrophobic and therefore is expected
to be removed when suspended solids are removed. In other words it tends to attach to biomass
more than hydrophilic compounds. Asakura et al. (2004) found that it could not be removed by
aeration, coagulation/sedimentation nor biological treatment.
It has been reported elsewhere that DEHP can be degraded by a common soil bacterium
(Rhodococcus rhodochrous) with an easily used carbon source, and that the final metabolites
are 2-ethylhexanol, 2-ethylhexanoic acid and phthalic acid (Horn et al., 2004; Nalli et al., 2003).
Moreover, 2-ethylhexanoic acid was observed to be particularly resistant to further degradation
and exhibited acute aquatic toxicity. However, in our study the DEHP concentration increased
in the SAMBRs, whereas its concentration was lower in the AMBR, but none of the metabolites
given in the paper of Horn et al. (2004) were found. This could be due to a different metabolic
pathway in the AMBR or because of their hydrophobicity; these metabolites were preferentially
attached to the sludge and hence were not detected. Nevertheless, new molecules appeared
in the AMBR permeate such as Diisobutyl phthalate and an unidentified peak with a retention
174

Chapter 6. CONTINUOUS TREATMENT OF LOW STRENGTH LEACHATE IN A SAMBR
index of 1510.6.
Moreover, the calibration line of Bis (2-ethylhexyl)phthalate was used to calculate the concentra-
tion of recalcitrants in the SAMBR2 and AMBR permeate. Then the COD equivalence of each
compounds were found to be very low when added together. As a matter of fact, the COD con-
centrations of recalcitrants in SAMBR2 and AMBR permeate was found to be equal to 17.7 and
20 mg/l, respectively, which contrast with the respective total COD concentrations of about 400
and 300 mg/l. Section 6.3.5 contains details indicating that recalcitrants proteinaceous com-
pounds in the SAMBR2 and AMBR permeates accounted for about 100 and 50 mg/l, which is
equal to 150 and 75 mg COD/l. Therefore, about 250 and 225 mg/l of the permeates are still
unknown compounds. The use of GC-MS is limited to the identification of non-polar, volatile
and thermostable compounds which explains why so little information was found in this study.
Techniques such as LC-MS or Matrix Assisted Laser Desorption Ionization-Time of Flight-Mass
Spectrometry (MALDI-ToF-MS) would certainly shed more light on the nature of the high MW
compounds that were not detected.
Table 6.7: Recalcitrant compounds detected by GC-MS in the permeate of the AMBR.In the case of unidentified compounds, the retention index of the peak isgiven. The last column comments on the aerobic biodegradability by com-paring the peak area of the same compound in the SAMBR2 permeate. NB =Non biodegradable, B = Biodegradable.
Peak % Ret. Recalcitrants in Formula Peak AerobicID Match time AMBR permeate Area Biodegradability
21 91 12.4 phenol 2,4-bis C14H22O 16343590 NB (+45%)(1,1-dimethylethyl)
23 14.7 1510.7 New
18 78 18.99 N-phenethylbenzenesulfonamide C14H15NO2S 1307129372 NB (+786%)
24 81 20.12 Diisobutyl phthalate C16H22O4 21287952 New
19 78 20.23 2,5-cyclohexadien-1-one,2,6 bis C16H24O 14309919 B (-68%)(1,1-dimethylethyl)-4-ethylidene-
15 91 26.18 Bis(2-ethylhexyl)phthalate C24H38O4 156613458 B (-67%)
6.3.9.5 Phthalates and Plasticizers: Plasticizers are compounds that are added to polymers
in order to improve the properties of a plastic such as increasing its flexibility, and several phtha-
lates were detected in this study. It has been demonstrated that plasticizers tend to leach from
solid polymer matrices into the environment (Fromme et al., 2002). For instance dimethylph-
thalate was found in the reactor plastic scrap but was not detected in the reactor indicating that
it could be readily biodegraded. Diethylphthalate was found at a similar level in the scrap and
in the HR effluent. The fact that it was not detected in the SAMBR permeates indicates that it
could be biodegraded completely thanks to the long solid retention times achieved in SAMBRs.
Dibutylphtalate was found in the anaerobic reactors but also in the scrap suggesting that it might
come from the reactor’s plastic. Interestingly, its area decreased greatly in the SAMBRs (from
270 million in HR effluent to 25.6 and 19.9 million in SAMBR1 and 2 permeate, respectively), and175

Chapter 6. CONTINUOUS TREATMENT OF LOW STRENGTH LEACHATE IN A SAMBR
was absent in the AMBR indicating that a great proportion of it can be degraded anaerobically
and totally degraded aerobically.
6.3.10 Denaturing Gel Gradient Electrophoresis (DGGE)
6.3.10.1 Archaea: In this chapter, archaeal DNA was amplified using the nested PCR reaction.
First, the DNA template was amplified using the primers 46F and 1017R. Then 1 microliter PCR
product was used for the second PCR reaction using the primers 344FGC and Univ522. The
objective was to investigate the differences if any between the archaeal population in the HR and
the SAMBR and the effect of the HRT on their evolution. As Figure 6.28 shows, there were only
three visible bands and with the exception of lane 5 the bands were more dominant in SAMBR1
(Lanes 5 to 10). Previous trials with archaeal primers gave very faint bands as is in Figure
6.28. Therefore, to be able to cut out some bands and identify any species it was decided to
run three PCR reactions in parallel for the sample SAMBR1 day 137 (lane 8) and to load the 3
times concentrated PCR product on the DGGE gel and thereby obtaining brighter bands. This
was indeed a good but time-consuming method to get bright bands as it can be seen that bands
in lane 8 (SAMBR1, day 137) are much brighter than in the other lanes. It is believed that the
bands in other lanes were very faint because of the small amount of DNA template used in the
PCR reaction; as a result all the archaeal species present in the bioreactor did not appear on
the DGGE gel. Nevertheless, the presence of bands indicates the predominant species in the
reactor. Bands a,b and c were cut from lane 8 but only band b could be identified successfully as
an organism from the genus Methanothrix named Methanosaeta sp. clone DI C03 (Accession
number AY454761.1, 100% match, E value = 0.82).
Because Methanosarcina was also found in the experiment described in the next chapters, it
was hypothesized that band c corresponded to Methanosarcina. If this is true it would mean that
Methanosarcina sp. develop preferentially in the HR where the acetate concentration is higher,
whereas Methanosaeta would be dominant in the SAMBR where acetate concentration is very
low. This is in line with Ehlinger et al. (1987) who stated that Methanosarcina sp. develop pref-
erentially throughout or in the inlet of reactors, wherever the acetate concentration was equal to
or higher than 350 mg L-1. When the acetate concentration falls below 350 mg L-1, Methanothrix
sp. becomes the prevailing species.
In the HR (lanes 1 to 5), only band c could be seen except on day 203 (Lane 5) where band a
and b also appear. The appearance of Methanosaeta in the HR could be due to the low acetate
concentration towards the end (below).
6.3.10.2 Bacteria: Bacterial DNA was amplified using a nested PCR reaction. First the DNA
was amplified using the primers 27F and 1492R. Then 1 microliter of PCR product was used as
template for the second PCR using the primers 338FGC and 518R. Again the bands were quite
faint even with triplicate PCR products with this combination of primers. Nevertheless, it can be
see from Figure 6.29 that the SAMBR2 started up on day 46 (Lane 5) with no dominant bacteria
although that sample contained DNA as it was checked on agarose gel beforehand. On day 119176

Chapter 6. CONTINUOUS TREATMENT OF LOW STRENGTH LEACHATE IN A SAMBR
Figure 6.28: Evolution with time of the archaeal population in the HR (Lane 1 to 5) andSAMBR1 (Lane 6 to 10). Lanes 1 and 6 = day 76; Lanes 2 and 7 = day 119;Lane 3 and 8 = day 137; Lane 4 and 9 = day 178; Lane 5 and 10 = day 203.
(Lane 4), three distinct dominant species of bacteria (bands a,c and d) could be distinguished,
and as the HRT was reduced the number of bands also diminished so that only two bands (c
and d) were visible on day 137 (lane 3) and later only 1 band (b) in lanes 1 and 2. Moreover
there was a significant shift in bacterial population as the HRT was decreased because band b
appeared only in lane 1 and 2, i.e. when the HRT was less than 4 days. Bands a, b, c and d
were cut and after cloning and sequencing as described in Materials and Methods (Chapter 3),
Table 6.8 was drawn.
Table 6.8: Bands cut from the DGGE gel using bacterial primers.
Band Closest Accession Genus Match EMatch Number % value
a uncultured bacterium U81676.2 unclassified Bacteroidales 100 1e-95
b uncultured bacterium EF589977.2 unclassified Bacteroidales 98 2e-92
c uncultured bacterium AY693829.1 unclassified Bacteroidales 100 1e-95
d uncultured bacterium EF559220.1 unclassified Bacteroidales 100 1e-95
As the bands on DGGE gel were quite faint using the nested PCR method mentioned above,
another combination of primers was tested: 341FGC and 907R. Figure 6.30 shows the same
samples amplified with the nested PCR in triplicate on the left hand side and the samples ampli-
fied using 341FGC and 907R on the right hand side. It is clear that the latter combination gave
rise to much brighter bands on an agarose gel, and the PCR products were therefore loaded on
a DGGE gel in Figure 6.31. It can be seen from Figure 6.31 that there is no band in lane 11 (day
177

Chapter 6. CONTINUOUS TREATMENT OF LOW STRENGTH LEACHATE IN A SAMBR
Figure 6.29: Evolution with time of the bacterial population in the SAMBR2 using nestedPCR 27F and 1492R then 338FGC and 518R. Lane 1 = day 203; Lane 2 = day178; Lane 3 = day 137; Lane 4 = day 119; Lane 5 = day 46.
46) which is when SAMBR2 was started. The bands could be seen only from lane 12 (day76)
onwards and became brighter on lane 13 (day119). This highlights the fact that SAMBR2 did not
start with the proper bacterial population and it took at least 30 days to get a similar population
as SAMBR1 in lane 6. This lack of bacteria for startup was correlated with an increase in bulk
SCOD as explained above. Unfortunately, the bright band at the top of the gel which is common
to all lanes indicates that some DNA could not migrate through the gel. This is because 40% as
a lower gradient was already too high. Another gel with a denaturing gradient of 30-70% was
run but the bands were all compressed at the top of the gel. A optimum gradient for these PCR
products would have been 20-60%.
6.3.10.3 Ammonia - Oxidisers: The DNA from ammonia-oxidising bacteria (AOB) was ampli-
fied using the primers CTO189F-GC and CTO654R. Bands a,b,c and d were cut from the DGGE
gel in Figure 6.32 and it was found that they all belong to the genus Nitrosomonas, except band d
which belong to the genus Nitrosospira. The details of the bands are given in Table 6.9. It is clear
from Figure 6.32 that there was no AOB species in Lane 4 which corresponds to a few days after
the AMBR was started up. This explains why there was no ammonia conversion in the AMBR at
the beginning. Then on lane 5 (day 178), two clear bands a (uncultured Nitrosomonas sp.) and
b (Nitrosomonas europaea ATCC 19718) can be seen as well as a faint band c (Nitrosomonas
sp. NM 41). Eventually on day 203 (lane 6), band b and c became more dominant as the HRT
was below 1 day. It is noteworthy that band a,b and c are all from the genus Nitrosomonas and
178

Chapter 6. CONTINUOUS TREATMENT OF LOW STRENGTH LEACHATE IN A SAMBR
Figure 6.30: Comparison between the nested PCR products (27F and 1492R then 338FGCand 518R) on the left hand side and the PCR products using primers 341FGC+ 907R on the right hand side. L=Ladder; Lane 1=SAMBR1 day119; Lane2=SAMBR1 day 137; Lane 3=SAMBR1 day 178; Lane 4=SAMBR1 day 203;Lane 5=HR day 76; Lane 6=HR day 119; Lane 7=HR day 137; Lane 8=HR day178; Lane 9=HR day 203; Lane 10=HR day 137; Lane 11=HR day 178; Lane12=HR day 203; Lane 13=SAMBR1 day 137; Lane 14=SAMBR1 day 178; Lane15=SAMBR2 day 137; Lane 16=SAMBR2 day 178; Lane 17=SAMBR2 day 203;Lane 18=AMBR day 137; Lane 19=AMBR day 178; Lane 20=AMBR day 203;B=blank
Figure 6.31: Evolution with time of the bacterial population in the HR (Lanes 1 to 5),SAMBR1 (Lanes 6 to 10), SAMBR2 (Lanes 11 to 16) and AMBR (Lanes 17 to 19)using primers 341FGC and 907R. Lane 1=HR day 76; Lane 2=HR day 119; Lane3=HR day 137; Lane 4=HR day 178; Lane 5=HR day 203; Lane 6=SAMBR1 day76; Lane 7=SAMBR1 day 119; Lane 8=SAMBR1 day 137; Lane 9=SAMBR1 day178; Lane 10=SAMBR1 day 203; B=blank; Lane 11=SAMBR2 day 46; Lane12=SAMBR2 day 76; Lane 13=SAMBR2 day 119; Lane 14=SAMBR2 day 137;Lane 15=SAMBR2 day 178; Lane 16=SAMBR2 day 203; Lane 17=AMBR day137; Lane 18=AMBR day 178; Lane 19=AMBR day 203.
179
Chapter 6. CONTINUOUS TREATMENT OF LOW STRENGTH LEACHATE IN A SAMBR
all are Nitrosomonas europaea - like species which are well known AOB. Interestingly, a band
was found in the HR but only on day 203, at the end of the run. This band d was found to be
Nitrosospira sp. Nsp40 which is an AOB and was not found in the AMBR. This is, however, con-
troversial as heterotrophs are known to be fast growing microorganisms and AOB would have
been unable to compete with them for oxygen present in the feedstock fed once a day in the HR.
It is suggested that at low DO levels, AOB used nitrite or nitrate as an artificial electron acceptor
and generate nitrous oxide gas (Ritchie and Nicholas, 1972).
Figure 6.32: Evolution with time of the population of AOB in the HR and the AMBR usingthe primers CTO189FGC and 654R. B=Blank; Lane 1=HR day137; Lane 2=HRday178; Lane 3=HR day203; Lane 4=AMBR day137; Lane 5=AMBR day178;Lane 6=AMBR day203;
The Nitrospira and Nitrobacter NOB species were not detected because the primers used were
specific to AOB. However, these NOB species were expected to be present in the AMBR be-
cause nitrite conversion to nitrate was observed from day 167 onwards. To gain more insight
into the nitrification process, it would have been useful to use primers specific to NOB such as
NSR1113F and NSR1264R for Nitrospira (Wang et al., 2007). Alternatively, Wittebolle et al.
(2008) have used a nested PCR where the first PCR amplifies specifically AOB whereas the
second PCR is performed with total bacterial primers (338FGC and 518R) that will amplify NOB
as well. It is possible that some AOB were missed due to the gradient (38-50%) used to make
up the gel. Other studies have used larger gradients (45-60%) when using primers CTO189FGC
and CTO654R (Wittebolle et al., 2008). It can be seen that band a is already at the top of the
gel and it is therefore possible that the low gradient (38%) was too high and did not allow some
bands to migrate and remained at the top of the gel. Also band d was at the bottom of the gel,
and thus it is possible that some bands were missed because they migrate further than band d
due to the high gradient (50%) being too low.
180

Chapter 6. CONTINUOUS TREATMENT OF LOW STRENGTH LEACHATE IN A SAMBR
Table 6.9: Bands cut from the DGGE gel using AOB primers.
Band Closest Accession Genus Match EMatch Number % value
a uncultured Nitrosomonas sp. AJ307985.1 Nitrosomonas 98 0
b Nitrosomonas europaea ATCC 19718 AL954747.1 Nitrosomonas 98 0
c Nitrosomonas sp. NM 41 AF272421.1 Nitrosomonas 97 0
d Nitrosospira sp. Nsp40 AY123787.1 Nitrosospira 100 0
6.4 SUMMARY
The following conclusions can be drawn from this chapter:
• The use of a membrane for leachate treatment had several advantages; the complete
retention of bacteria allowed for stable operation as no VFAs accumulated even when pro-
pionate was the predominant acid in the leachate. The COD removal was greater than
90% at a HRT of 1.6-2.3 days at a maximum OLR of 20 g COD/L.day. Even though the
influent COD of the leachate was constantly changing giving rise to a transitory F/M ratio
over time, the permeate COD from the SAMBR was typically between 300 and 500 mg/L
which can therefore be defined as a stabilised leachate. Because of the fluctuating prop-
erties of the leachate produced in the HR the process was deemed more representative
because the SAMBR treated a leachate with varying organic strength which is what can
happen on a full scale (Kraume et al., 2009).
• An inoculum fed on synthetic VFAs was not suitable for start-up because it did not contain
hydrolytic and acidogenic bacteria for a leachate medium. As a result, a slow production of
VFAs, and therefore a slow increase in methane production were observed. Furthermore,
the bulk SCOD in SAMBR2 kept increasing during start-up, which strongly suggests that,
for a lignocellulosic-based feed, it is paramount to start up the SAMBR with a hydrolytic
population acclimatised to the leachate medium to avoid SCOD build up in the bulk. The
DGGE picture confirmed this observation.
• The COD removal in SAMBR2 was 94.5% on average, and only 1.6% in the AMBR so
that a total COD removal of 96.1% was achieved at 0.4 day HRT. On average 26% of the
recalcitrants from SAMBR2 could be degraded aerobically in the AMBR.
• However, as in SAMBR1, at HRTs lower than 2 days, particulate solids in the leachate
built up at the bottom of the SAMBR eventually leading to the diffuser blocking. At MLTSS
beyond 20 g/l, the TMP culminated at 850 mbar and the flux dropped to 0.5 LMH until the
end of the experiment.
• The permeate COD cannot be lowered by decreasing the sparging rate. The main effect of
low sparging rate (2LPM) was the enhanced rejection of the membrane and the significant
flux drop while the permeate COD remained relatively constant. On the other hand, when181

Chapter 6. CONTINUOUS TREATMENT OF LOW STRENGTH LEACHATE IN A SAMBR
the sparging rate was increased to 8-10 LPM, the permeate COD increased typically from
360 to 440 mg/L due to a better scouring of the membrane, which resulted in a thiner
concentration polarization layer and a better diffusion through the biofilm. It is likely that
the time required to observe the increase in permeate COD depends on the compaction
of the cake layer. The increase in sparging rate allowed to recover the operation at 0 mbar
TMP but not the initial flux.
• The permeate of the SAMBR was low in COD and relatively constant which promoted
the growth of autotrophic bacteria in the subsequent AMBR so that 97.7% of the NH+4 -N
was removed at a maximum nitrogen loading rate of 0.18 kg NH+4 -N/m3.day. Complete
nitrification was not observed in the AMBR as the nitrite concentration did not reach zero.
This could be due to the low HRT (1 day) that could have overloaded the NOB such as
Nitrobacter, or because of the lack of close distance between the nitrite producers and
nitrite oxidisers which is required to obtain complete nitrification.
• The calcium in the leachate was found to precipitate in the AMBR because of the higher
pH. A sample taken from the membrane consisted most likely of pure hydroxylapatite
Ca5(PO4)3(OH) which had a needle shape, whereas the background of the precipitate con-
sisted more of nodules of calcium carbonate with traces of manganese, iron, magnesium,
aluminium, sulphur and sodium.
• The very high MW aromatic organics in the leachate fed to the SAMBRs were almost fully
degraded in the bulk of the SAMBRs. Moreover, their permeate was absolutely free of them
which indicates a full rejection of these compounds by the membrane. The medium MW
compounds in the range of 395 - 646 kDa were more likely to be rejected by the membrane
while the MW ≤ 395 kDa were observed in the permeate. Regarding the evolution of the
medium and low MW compounds over the 200 days, it can be stated that overall there was
no buildup in the absorbance in any effluent, showing that these aromatics could be slowly
degraded.
• Most of the recalcitrant compounds detected by GC-MS in the effluent of the HR were
below 10 µg/L, while only two compounds (Bisphenol A and unidentified compounds with
RI = 2096) were in the range 14 - 38 µg/L. The molecules o-hydroxybiphenyl and Bisphe-
nol A were found to be non biodegradable anaerobically because their areas increased
in SAMBR1 and SAMBR2. The concentration of the former was in the range 11 - 22
µg/L, while the latter was in the range 21-44 µg/L. Moreover, as Bisphenol A was not
found in the AMBR permeate, it can be stated that it was fully biodegraded aerobically.
Some molecules were found to be non biodegradable in an anaerobic environment, but
could be slowly biodegraded in the AMBR such as 2,5-cyclohexadien - 1 - one,2,6 bis(1,1-
dimethylethyl)- 4 -ethylidene- and Bis (2-ethylhexyl) phthalate. Nevertheless, the compo-
nent N-phenethylbenzenesulfonamide were found to build-up in the AMBR and reached
concentrations in the range 44-87 µg/L. Furthermore, new molecules appeared in the
AMBR permeate such as Diisobutyl phthalate.
182

Chapter 7
CONTINUOUS TREATMENT OF HIGH
STRENGTH LEACHATE IN A SAMBR1
7.1 INTRODUCTION
Previous experiments (Chapter 6) have shown that a successful start up of the SAMBR can
take place at 3 g MLTSS/L and 5.5 days HRT. The start up also depended on the presence of
hydrolytic and acidogenic bacteria acclimatised to the leachate medium. The flux in the SAMBR
was in the range 3-5 LMH and was unaffected by MLTSS up to 10-15 g/L, but concentrations
above 20 g/L proved to be detrimental for sound operation as it can block the diffuser, which
affects the TMP and flux. The lignocellulosic suspended solids in the leachate will build up in
the SAMBR because of the complete retention of solids, therefore, sludge should be removed
from the SAMBR to keep the MLTSS below 20 g/L, which will enable a stable flux of around 3-5
LMH. This permeate flux would allow the reactor to reach minimum HRTs of 0.25-0.42 days.
Very low HRTs are desirable because it means that more leachate can be treated per unit of
time, which results in a smaller reactor and less investment costs. The operation of the SAMBR
at a HRT of 0.4 days was found to be possible in the previous experiment in Chapter 6 without
SCOD accumulation at an OLR of 19 g COD/L.day. However, at the same time it should be born
in mind that sludge removals will lower the SRT and will cause a washout of useful hydrolytic
and methanogenic bacteria from the SAMBR. Also, greater fouling has been reported at lower
SRTs due to increasing concentrations of SMP (Amy, 2008; Judd, 2008). Nuengjamnong et
al. (2005) demonstrated that EPS concentrations increased with decreasing SRT, and that the
higher EPS amounts at 8 days SRT resulted in greater specific cake resistance compared to 80
days SRT. Therefore, a trade off between the SRT, the MLTSS and the COD removal should be
found at the lowest HRT as possible. Hence, the following experiment was aimed at finding
the best strategy for keeping a high COD removal in the SAMBR, but at the same time keeping
the MLTSS below 15-20 g/L in order to keep a stable flux.
Previous experiments (Chapter 6) showed a dramatic decrease in the VS removal percentage in
the HR when the OLR was increased up to 16 g VS/L.day. Because the main idea of this chapter
1Submitted in part for publication as Trzcinski, A.P., Stuckey, D.C. and Ray, M.J. ”Performance of a three-stagemembrane bioprocess treating the Organic Fraction of Municipal Solid Waste and evolution of its archaeal and bac-terial ecology”, Bioresource Technology.
183

Chapter 7. CONTINUOUS TREATMENT OF HIGH STRENGTH LEACHATE IN A SAMBR
was to investigate the behavior of the SAMBR under different SRTs, it was decided to feed the
HR at a constant OLR of 4 g VS/L.day which is a common baseline for the startup of reactors
treating organic solid waste. The effect of the SRT was also investigated in the HR, as well as
the effect of a temperature drop from 35 ˚ C to room temperature. This allowed us to benchmark
the performance of the HR in terms of VS removal. Anaerobic digestion at lower temperatures
is interesting because it allows the operational costs of the digester to be reduced. It is known
that lower temperatures can affect gas production rates because of the lower substrate affinity
of mesophilic bacteria under these conditions. At lower temperatures chemical and biological
reactions proceed much slower than under mesophilic conditions (30-40 ˚ C) (Lettinga et al.,
2001). Many researchers are engaged in studies on anaerobic digestion but relatively little work
has been done regarding the production of biogas at sub-mesophilic temperatures (15-25 ˚ C).
Table 7.1 shows different processes treating organic solid waste with their performances. Wellinger
and Kauffman (1982) have reported satisfactory biogas production from swine manure at tem-
peratures ranging from 15 to 20 ˚ C. Better results were obtained with microbial consortia accli-
matised to low temperatures. Sutter and Wellinger (1985) indicated that bacteria could adapt to
psychrophilic temperatures, but the gas production showed linear increase with increasing tem-
peratures. These authors are of the view that gross biogas production from a digester operating
at 20 ˚ C and retention time of 40-50 days is comparable to a digester operating at mesophilic
temperature but at half the retention time. Meher et al. (1994) have reported 0.148 m3 biogas/kg
TS degraded.day at 15 ˚ C (with temperature-adapted seed culture) using human waste. Chan-
dler et al. (1983) have reported biogas production in a lagoon to be 0.11 - 0.15 m3/m3/day at
11-22 ˚ C. Uemura and Harada (2000) observed that the extent of hydrolysis or in other words
the SCOD/TCOD ratio was significantly affected by decrease in temperature.
184

Ch
ap
ter
7.
CO
NT
INU
OU
ST
RE
AT
ME
NT
OF
HIG
HS
TR
EN
GT
HL
EA
CH
AT
EIN
AS
AM
BR
Ta
ble
7.1
:O
pe
ratio
na
lch
ara
cte
ristic
so
fs
ub
-me
so
ph
ilica
na
ero
bic
dig
es
ters
.
Substrate Reactor HRT T Gas CH4 VS/COD Reference(days) ( ˚ C) yield (%) Removal
m3/m3.day
Sewage UASB 0.19 13-25 - - -/70 (Uemura and Harada, 2000)
Cattle dung rubber balloon 55 9-25 0.92 54.3 32.5/- (Kanwar and Guleri, 1994)
Human waste Fixed dome 30 15 0.19 57 81/40 (Meher et al., 1994)
Night soil Floating dome 25 20 1.76 57/54 (Singh et al., 1993)
Cattle manure Continuous flow ≥ 40 5-10 (Zeeman et al., 1988)
Swine manure lagoon 50 11-22 0.11-0.15 (Chandler et al., 1983)
18
5

Chapter 7. CONTINUOUS TREATMENT OF HIGH STRENGTH LEACHATE IN A SAMBR
The recycling of digested permeate to the first stage of a two stage process has been reported
to reduce the costs of neutralizing additives, to increase the pH, improve the buffering capacity,
increase the biogas production and the methane content of the biogas (Jarvis et al., 1995).
Hence recycling of the SAMBR permeate will be evaluated. However, accumulation of inorganic
and organic compounds may occur after initiating recirculation of the effluent liquid. This will
cause a change in the digester environment and will continue until steady-state concentrations
of the different compounds are obtained. Jarvis et al. (1995) obtained a 10-fold increase and
a 3-fold increase in the degradation rate of mannitol and lactate, respectively, after initiating
recirculation, and mannitol degradation was closely related to hydrogen partial pressure. They
also observed a 10-fold increase in the number of hydrogenotrophic methanogens in the first
reactor due to effluent recycling. This led to shortened periods of high hydrogen partial pressure
following feeding, and a 20% increase in the total specific gas production.
7.2 EXPERIMENTAL AND ANALYTICAL DETAILS
7.2.1 Reactors
The HR was fitted with a 10 micron nylon filter (Spectrum Laboratories Inc.) on the outside of
the stainless steel mesh (1 mm) in order to retain the large partially hydrolyzed particles and
thereby separate the coarse solids from the leachate being fed to the SAMBRs; this enabled the
SRT and the HRT to be uncoupled. The SRT was calculated based on the mass of VS in the
digestate according to the equation:
SRTHR (days) =X · V
W(7.1)
where the numerator is the total mass of volatile solids in the HR that is equal to X · V where
X is the VS concentration in g/L in the HR and V is the HR working volume in L, and the
denominator is the mass of volatile solids in the digestate removed every day (W in g VS/day).
The digestate was removed before feeding and was manually dewatered by hand compression
through a 500 micron sieve to recover the remaining process liquid so that the use of fresh
water was minimized. A fraction of the dewatered digestate was discarded to set a specific SRT
in the HR. In order to allow stirring, the TS content in the HR was maintained below 10% by
daily withdrawal of digestate. The HR was maintained at 37 ± 1 ˚ C until day 101, and at room
temperature (20-22 ˚ C) from day 101 onwards. Tap water was added in the HR together with the
feed in order to keep the working volume at 10 L.
The SAMBR and the AMBR were maintained at 35 ± 1 ˚ C. The biogas sparging rate was set
at 5 L/min (LPM) to minimize cake formation on the membrane. The sludge that was taken out
of the SAMBR to set a specific SRT was fed to the HR to minimize solid post-treatments, but
also because the solids could still contain cellulose that can be transformed into biogas and also
useful bacteria. In other words, sludge wastage from the SAMBR can be used to continuously
re-inoculate the HR and thus result in an improved performance of the HR. The HR, the SAMBR
and the AMBR were connected in series: the leachate was fed to the SAMBR and the permeate
186

Chapter 7. CONTINUOUS TREATMENT OF HIGH STRENGTH LEACHATE IN A SAMBR
from the SAMBR was fed to the AMBR. The AMBR permeate was recycled to the HR in order
to maintain the moisture and alkalinity of the system, and also to dilute the incoming COD and
organic acids.
7.2.2 Inoculation of Reactors
The HR was inoculated with 9L of anaerobic sludge from a conventional full scale digester treat-
ing waste activated sludge (Mogden, UK) (MLTSS = 36.5 and MLVSS = 20.4 g/L). The final
volume was reached with 1L tap water with 200 g of OFMSW feedstock to reactivate the inocu-
lum. The HR was fed daily at a constant OLR of 4g VS/L.day throughout the experiment from day
2 onwards so the initial I/S was about 5. The SAMBR was started up on day 2 with 300ml sludge
from SAMBR1 from the previous experiment (Chapter 6), and the final volume was adjusted to
3L with the anaerobic biomedium defined in Owen et al. (1979). The initial MLTSS and MLVSS
were 6.6 and 3 g/L, respectively. The AMBR was inoculated from the aerobic sludge grown
during the previous experiment. The initial MLTSS and MLVSS were 3.6 and 2 g/L, respectively.
7.3 RESULTS AND DISCUSSION
7.3.1 Performance of the Hydrolytic Reactor
7.3.1.1 Start Up: The HR was operated at a SRT of 66 days based on the daily mass VS
withdrawn from the HR. The HRT in the HR was initially low at 2-3 days because it was attempted
to start up the SAMBR at a low HRT of 1.3 days. Low HRTs in the SAMBR will translate to low
HRT in the HR because more leachate is pumped per unit of time. However, this HRT was
not sustainable due to a rapid increase of suspended solids in the SAMBR, and was then set
circa 20 days in the HR. Although the HR was fed at a constant OLR of 4g VS/L.day a constant
strength was not observed in the leachate. Figure 7.1 shows that during start up the TCOD,
SCOD and VFAs gradually increased. As the inoculum was taken from a fridge, it is thought that
a period of 30-40 days was necessary to completely reactivate the inoculum.
The 10 micron nylon mesh placed in the HR was expected to separate the solids from the
leachate, but unfortunately solids were still observed in the tubing which indicates that the nylon
mesh had moved and let the solids migrate to the external zone of the HR where it could be
pumped. The hydraulic pressure exerted by the 10 litres could have pushed aside the nylon filter
if it was not attached tightly enough to the stainless steel mesh. On day 9, indeed the nylon
mesh had moved and had to be replaced manually. On day 14, the HR was opened again to fix
the nylon mesh. Afterward, the leachate appeared clear and with no particles which indicated
that the filter was not leaking anymore. The leaking of the filter has also caused a washout of
inoculum that was pumped to the SAMBR. On day 27, no leachate could be pumped from the
HR to feed the SAMBR. The cause was the complete fouling of the nylon mesh used to uncouple
the SRT and HRT in the HR. The nylon mesh was thus removed and the operation resumed with
the original stainless steel (1 - 1.5 mm holes). This failure indicated that a 10 micron filter was
not adequate in the HR to uncouple the SRT from the HRT as it could not provide sufficient187

Chapter 7. CONTINUOUS TREATMENT OF HIGH STRENGTH LEACHATE IN A SAMBR
amounts of leachate, and that its fouling was very quick even with the rubbers fitted on the stirrer
in order to brush the surface of the mesh. This is in line with Walker et al. (2009) who also found
that a 10 micron mesh quickly became blocked.
During start up a rapid pH drop in the HR from 7.2 on day 5 to 6 on day 9 was observed (Panel
C, Figure 7.1). This indicates that as the inoculum became active again the fermentable sugars
were converted to VFAs resulting in a pH drop due to the insufficient alkalinity (3800 mg eq.
CaCO3/L on day 14). The required alkalinity for CO2 neutralization only was found to be 3400
mg/L at pH 7.2 by calculation. Thus there was not enough reserve alkalinity because there was
2500 mg VFA/l on day 10 which would have required an additional 2000 mg/L of bicarbonate
alkalinity to keep the pH at 7.2. The pH even reached 5.5 on day 17, and to avoid a further
drop, small doses of alkalinity (20-30 g of NaHCO3) were added on days 17, 18, 19, 21 and 23.
The alkalinity increased then to 5300 on day 21 and the pH became 5.8. The effect of sodium
bicarbonate on the pH was not as straightforward as expected because the VFA concentration
kept increasing at the same time (up to 8600 mg/L as COD on day 24, Panel A, Figure 7.1), thus
the addition of sodium bicarbonate did not produce any reserve alkalinity but was totally used
to neutralize a fraction of the VFAs, which explains why the pH did not rise immediately. The
operation at a pH as low as 5.5 in the HR was not detrimental for acid production which is in
line with the literature that states that the optimal pH range for the acid phase is 4 - 6.5 (Speece,
1996).
188

Chapter 7. CONTINUOUS TREATMENT OF HIGH STRENGTH LEACHATE IN A SAMBR
Figure 7.1: Panel A: Evolution with time of TCOD, SCOD and VFAs (as COD) in the efflu-ent of the HR at different temperatures and SRT. Panel B: Evolution with timeof the distribution of VFAs in the effluent of the HR. Panel C: Evolution withtime of the pH (left axis) and the alkalinity (right axis). The error bars indicatethe standard deviation.
189
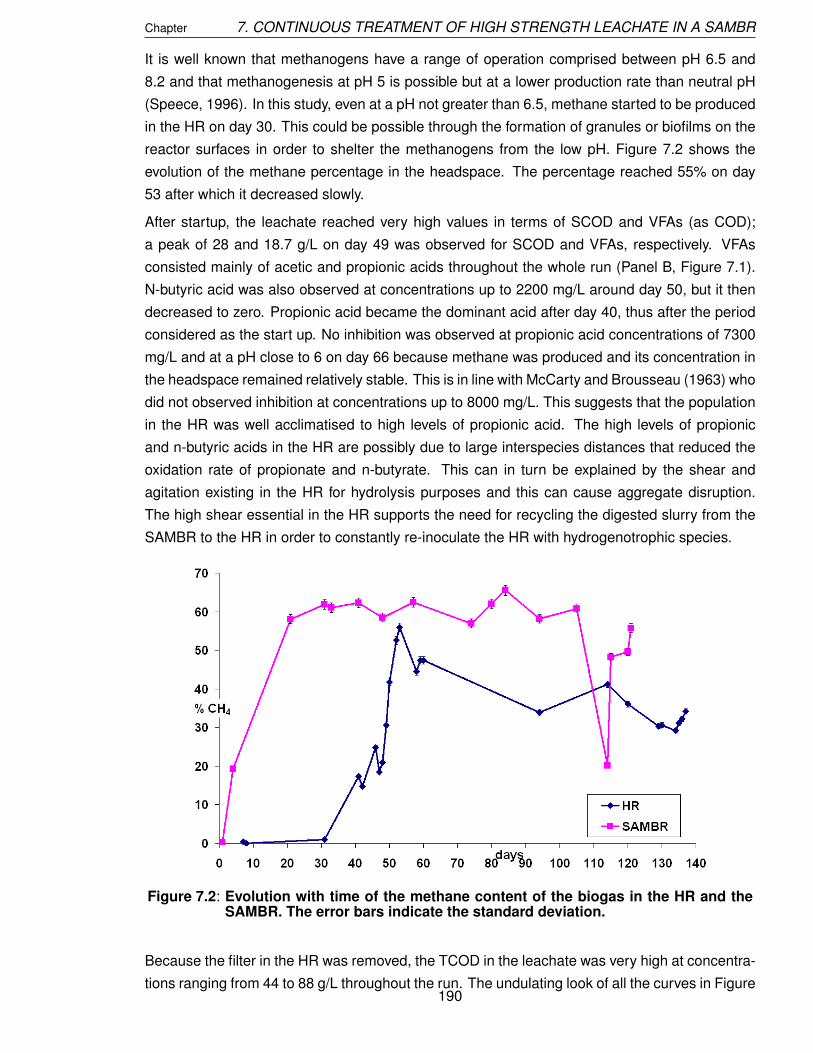
Chapter 7. CONTINUOUS TREATMENT OF HIGH STRENGTH LEACHATE IN A SAMBR
It is well known that methanogens have a range of operation comprised between pH 6.5 and
8.2 and that methanogenesis at pH 5 is possible but at a lower production rate than neutral pH
(Speece, 1996). In this study, even at a pH not greater than 6.5, methane started to be produced
in the HR on day 30. This could be possible through the formation of granules or biofilms on the
reactor surfaces in order to shelter the methanogens from the low pH. Figure 7.2 shows the
evolution of the methane percentage in the headspace. The percentage reached 55% on day
53 after which it decreased slowly.
After startup, the leachate reached very high values in terms of SCOD and VFAs (as COD);
a peak of 28 and 18.7 g/L on day 49 was observed for SCOD and VFAs, respectively. VFAs
consisted mainly of acetic and propionic acids throughout the whole run (Panel B, Figure 7.1).
N-butyric acid was also observed at concentrations up to 2200 mg/L around day 50, but it then
decreased to zero. Propionic acid became the dominant acid after day 40, thus after the period
considered as the start up. No inhibition was observed at propionic acid concentrations of 7300
mg/L and at a pH close to 6 on day 66 because methane was produced and its concentration in
the headspace remained relatively stable. This is in line with McCarty and Brousseau (1963) who
did not observed inhibition at concentrations up to 8000 mg/L. This suggests that the population
in the HR was well acclimatised to high levels of propionic acid. The high levels of propionic
and n-butyric acids in the HR are possibly due to large interspecies distances that reduced the
oxidation rate of propionate and n-butyrate. This can in turn be explained by the shear and
agitation existing in the HR for hydrolysis purposes and this can cause aggregate disruption.
The high shear essential in the HR supports the need for recycling the digested slurry from the
SAMBR to the HR in order to constantly re-inoculate the HR with hydrogenotrophic species.
Figure 7.2: Evolution with time of the methane content of the biogas in the HR and theSAMBR. The error bars indicate the standard deviation.
Because the filter in the HR was removed, the TCOD in the leachate was very high at concentra-
tions ranging from 44 to 88 g/L throughout the run. The undulating look of all the curves in Figure190

Chapter 7. CONTINUOUS TREATMENT OF HIGH STRENGTH LEACHATE IN A SAMBR
7.1 is noteworthy due to the addition of large amounts of fresh water on a single day rather than
a small addition every day. The addition of a large quantity of fresh water in one go may have
resulted in the dilution of TCOD, SCOD, VFAs, alkalinity and a change in pH. In fact, the drops
of SCOD and VFAs on days 28, 34 and 49 can all be attributed to fresh water addition on the
same day or a few days before sampling. The average fresh water addition was 150 mL/day.
Stirring problems occurred between day 70 and day 86 leading to a sharp decrease in SCOD
(25 to 15 g/L) and VFAs (14 to 3 g/L) highlighting the importance of mixing for proper hydrolysis
and acidogenesis.
The gas production rate was measured on days 58,59 and 60 using a Tedlar bag connected to a
fitting on the top of the HR. The empty bag was connected to the HR just after feeding (evening),
and the volume was measured when the bag appeared to be full, the bag was emptied and
reconnected to the HR. The biogas production in the HR was in the range 12.2-14.7 l STP of
biogas per day of which 5.3-6.7 L STP was methane. This corresponds to a methane yield in
the range 130-165 ml CH4 STP/g VS in the HR only. Now, if the gas production in the SAMBR
is also taken into account, it was found that 2.1 L of biogas at 62% methane was produced in
12 hours on day 57. This is equivalent to 2.42 L CH4 l STP in 24 hours. Thus the contribution
of the SAMBR was 60 mL CH4 STP/g VS, but because only one measurement was obtained no
standard deviation can be calculated for this value. Thus the total methane yield was in the range
190-225 mL CH4 STP/g VS, of which about 70% was obtained in the HR under the conditions
present at that moment: OLR = 4 g VS/L.day, SRT = 66 days, HRT = 20 days, T = 35 ˚ C. It is
noteworthy that this yield was relatively close to the ultimate biodegradability obtained in BMP
bottles after 242 days which was 216 mL CH4 STP/g VS (see Chapter 3, Section 3.5.2.2). Hence
the HR+SAMBR system was able to produce almost the maximum quantity of methane at a SRT
of 66 days compared to 242 days in BMP bottles.
It has been previously reported that recycling the effluent from the second stage to the first
stage has reduced the costs of neutralizing additives, increased the pH, improved the buffering
capacity, increased the biogas production and the methane content of the biogas in the hydrolytic
reactor (Jarvis et al., 1995). It is speculated that such methane yields were possible thanks to
the daily recycle of digested slurry from the SAMBR (30 mL/day) that re-inoculated the HR on
a daily basis with methanogens. Although the HR was operating at a SRT of 66 days and HRT
of 20 days, methanogens were likely to grow in the HR under such conditions, but the pH in the
range 5.5 to 6.5 in the HR might have been inhibitory. The closer syntrophic distances in the
granules from the SAMBR may have sheltered the methanogens from the lower pH in the HR.
7.3.1.2 Effect of Temperature on Performance: The HR was operated at 35 ˚ C at a constant
OLR of 4g VS/L.day and a SRT of 66 days until day 99. The VS removal was calculated from
day 28 to day 99 to ignore the effect of the start up. The VS removal was calculated according
to the following equation:
V S% = 100% ·
{
1−mass V S rem. + mass V S acc. + mass V S transfered
mass V S fed in HR
}
(7.2)
191

Chapter 7. CONTINUOUS TREATMENT OF HIGH STRENGTH LEACHATE IN A SAMBR
Where the masses were considered over the period day 28 to 99. The ”mass VS rem.” refers to
the mass of VS in the digestate that is withdrawn every day. The ”mass of VS acc.” in the HR
is the difference between the mass of VS in the HR at the beginning and the end of the period
considered, or in other words the accumulated VS mass. The ”mass of VS transfered” is the
mass of VS that was not degraded in the HR and that resulted in a build up in the SAMBR. It is
calculated as the difference of the total mass of VS in the SAMBR on day 99 minus the mass
VS on day 28. This calculation assumes that the bacterial growth is negligible compared to the
transfer of VS to the SAMBR. This holds true because of the high solid content of the leachate fed
to the SAMBR and the low growth rate in anaerobic digesters. The VS destruction was found to
be 75% at a relatively high solids retention time of 66 days and a HRT of 20 days. This is similar
to Hartmann and Ahring (2005) who obtained 69-74% VS removal at a HRT of 14-18 days and an
OLR of 4 g VS/L.day. However, they obtained these results at thermophilic temperatures. In this
study, the uncoupling of SRT and HRT allowed to obtain similar performances as thermophilic
reactors.
On day 101, the recirculation of hot water in the copper coil placed around the HR was stopped
so that the HR was operating at room temperature (22 ˚ C) until the end of the experiment. The
VS destruction dropped to 50%, while the SRT and HRT remained unchanged at 66 days and 20
days, respectively. A significant and immediate effect of the temperature drop was the decrease
of VFAs from 8.9 g/L on day 98 to 2.1 g/L on day 101 as it can be seen on Panel B in Figure
7.1. This drop (-76%) is too significant to be explained by fresh water addition based on the
volume of water added on day 99. This drop in VFAs compared to the SCOD concentration is
in line with Bolzonella et al. (2005) who noticed that VFA concentartions dropped to 15% of
the SCOD when the temperature was in the range 14-22 ˚ C. In this study the VFA/SCOD ratio
was in the range 14 - 27% at 22 ˚ C compared to acidification yields in the range of 50 - 90%
at 35 ˚ C. Similarly, the SCOD decreased from 15.6 g/L on day 98 to 10 g/L on day 101. This
indicates that the hydrolysis rate was strongly affected by the decrease in temperature. This was
correlated with a build up of TCOD and thus a decrease in the liquefied fraction of the leachate
(SCOD/TCOD ratio) which is consistent with Uemura and Harada (2000) who observed a drop
in the SCOD/TCOD ratio in the range 37-56% at 19-22 ˚ C. In this study, the SCOD/TCOD ratio
dropped from 35 % on day 98 to only 16% at the end of the experiment.
7.3.1.3 Effect of SRT on Performance: On day 115, the SRT was lowered to 38 days, while the
HRT was kept around 20 days. This is a normal HRT for conventional digesters where the SRT is
equal to the HRT. The effect of lowering the SRT in the HR was a drop in the VS removal to 45%.
This drop was expected as at lower SRTs a given mass spends less time in the HR compared
to at higher SRTs. The percentage removal dropped only by 5% due to the uncoupling of the
SRT and HRT. In the present experiment, it was attempted to lower the HRT on a few occasions,
but for a few days only as flux problems arose in the SAMBR. It is noteworthy that fresh water
was added at the mean rate of 150 mL per day throughout the experiment and there was no
significant difference under the three conditions tested (SRT = 66 days and 37 ˚ C, SRT = 66
days and 22 ˚ C and SRT = 38 days and 22 ˚ C). This can be explained by the fact that a lot of
192

Chapter 7. CONTINUOUS TREATMENT OF HIGH STRENGTH LEACHATE IN A SAMBR
water was lost due to evaporation in the AMBR that was open to the atmosphere and maintained
at 35 ˚ C throughout the experiment.
The effect of recycling the permeate of the AMBR and the excess sludge from the SAMBR was to
maintain the alkalinity in the system, which resulted in a slow build up throughout the experiment
(Panel C, Figure 7.1). It reached 9600 mg equivalent CaCO3/l on day 105 which enabled the
pH to remain above 6 until the end of the run. This was due to the alkalinity generated by the
degradation of proteins from the OFMSW. It can be calculated that at 35 ˚ C, pH 7 and a biogas at
30% CO2, a minimum of alkalinity of 4000 mg/l is required only for CO2 neutralization (Speece,
1996). Therefore, the reserve alkalinity that can be used for VFAs neutralisation was equal
to the difference, thus sufficient to neutralize about 6700 mg of VFAs as acetic acid. Another
consequence in this study was the build up of recalcitrant TCOD after day 100 (Figure 7.1,
Panel B) because of the low SRT tested in the SAMBR which meant that more sludge from the
SAMBR was recycled to the HR. Also the hydrolysis of the TCOD was slowed due to the HR
kept at ambient temperature.
Regarding the gas production rate, the average methane production in the HR was 1.74 L CH4
STP/day, which was much lower than on days 57-60 (Section 7.3.1.1) due to the lower temper-
ature and mass retention time. Besides, there was virtually no gas produced in the SAMBR due
to excessively low SRT which caused the build up of SCOD in the bulk. This will be detailed in
the next section dealing with the performance of the SAMBR (Section 7.3.4). Consequently, the
methane yield became very low at 43 ml CH4 STP/g VS for the whole process after day 115.
Thus the recycling of digested slurry from the SAMBR and the filtrate from the AMBR did help to
maintain the pH between 6 and 7 in the HR, but was inefficient at maintaining the gas production
rate due to the low temperature.
7.3.1.4 Size Fractionation of the Leachate: In order to gain more understanding of the leachate
fed to the SAMBR, 200 microliters of the HR effluent on day 49 was loaded an an Aquagel OH-40
using the same equipment as for size exclusion chromatography. The SCOD of the sample was
28,100 mg COD/l of which 66% were VFAs. Deionized water was used as the mobile phase at
a flowrate of 0.5 ml/min. In addition, a Pharmacia Fractionator (Pharmacia LKB-FRAC-100) was
placed after the HPLC to collect the ten consecutive fractions of the leachate separated by the
Aquagel column according to the MW. The COD of each fraction was then analyzed. The ten
fractions according to the elution times with the corresponding MW (calculated using Equation
6.13) and their respective COD proportion are listed in Table 7.2.
It can be calculated from the table that 91% of the COD content of the leachate had a MW smaller
than 15 kDa. Furthermore, 56% of the COD was in the range 40 - 800 Da which are very likely
to be VFAs. These acids have a MW in the range 46 Da (Formic acid) to 116 (hexanoic acid).
This fraction can also contain lactic acid (90 Da), glycerol (92 Da), glucose (180 Da) and other
long chain fatty acids. Some low MW acids or alcohols might have ended up in the next fraction
with eluted later between 21 and 24 minutes and having a MW less or equal than circa 40 Da.
These can be formic acid, ethanol (46 Da) and methanol (32 Da). The COD % associated with
193

Chapter 7. CONTINUOUS TREATMENT OF HIGH STRENGTH LEACHATE IN A SAMBR
Table 7.2: Fractionation of the leachate from the HR on day 49.
Fraction (min) MW range (Da) COD (%)
0 - 3 MW ≥ 294,000 2.6
3 - 6 MW ≥ 294,000 1.3
6 - 9 MW ≥ 294,000 1.2
9 - 12 MW ≥ 294,000 1
12 - 15 15,300 ≤ MW ≤ 294,000 2.5
15 - 18 800 ≤ MW ≤ 15,300 9.5
18 - 21 41 ≤ MW ≤ 800 56.1
21 - 24 MW ≤ 41 21.7
24 - 27 MW ≤ 41 2.8
27 - 30 MW ≤ 41 1.2
organics eluting after 24 minutes are questionable because these would have a MW less than
2 Da. Similarly, values associated with organics eluting before 9 minutes are questionable due
to the inacurracy of COD analysis at low concentrations. Nevertheless, it can be stated that
organics with MWs greater than 15 kDa are a very small proportion (less than 10%), while the
proportion of organics with MWs between 800 Da and 15 kDa are about 10%, and these are
likely to be carbohydrates and proteins.
7.3.2 Stability of the Digestate
7.3.2.1 Evolution of the Respirometric Activity of the Digestate: Throughout the run, the diges-
tate taken from the HR was assessed in terms of stability. It was hypothesized that if the solids
residence time was long enough in the HR, the residual digestate would be stable, i.e. would re-
lease little carbon dioxide because most of the readily hydrolysable materials would have been
degraded anaerobically in the HR. However, it is also expected that some aerobic bacteria or
mould/fungi will be able to grow on the digestate because it still contains organic matter.
It can be seen from Figure 7.3 that almost all the samples released considerably more CO2
after 3 days of aeration than the 16 mg CO2 g VS-1.d-1 recommended for a stable compost
(Horizontal line) defined by the British standard BSI PAS 100:2005 (WRAP, 2005). In fact, the
first two samples during the start up of the HR were below the limit, but it is thought to be due
to the large mass (10g) of digestate being incubated. If large amount of digestate is incubated,
it can result in stratification where the zones at the bottom are not aerated, while the top layer
has a good access to the oxygen of the headspace. For the subsequent samples, masses of 2
to 5 g only were incubated in the bottles. The digestates taken out of the HR on days 34 and
115 were also below the limit but it is not clear why. Factors such as moisture content, porosity,
particle size or shaking could have affected the respiration rate or the extent of degradation.
It also seems that the temperature and the SRT in the HR had no effect on the respiration rate
of the digestate. There was no apparent link between the respiration rate of the digestate and194
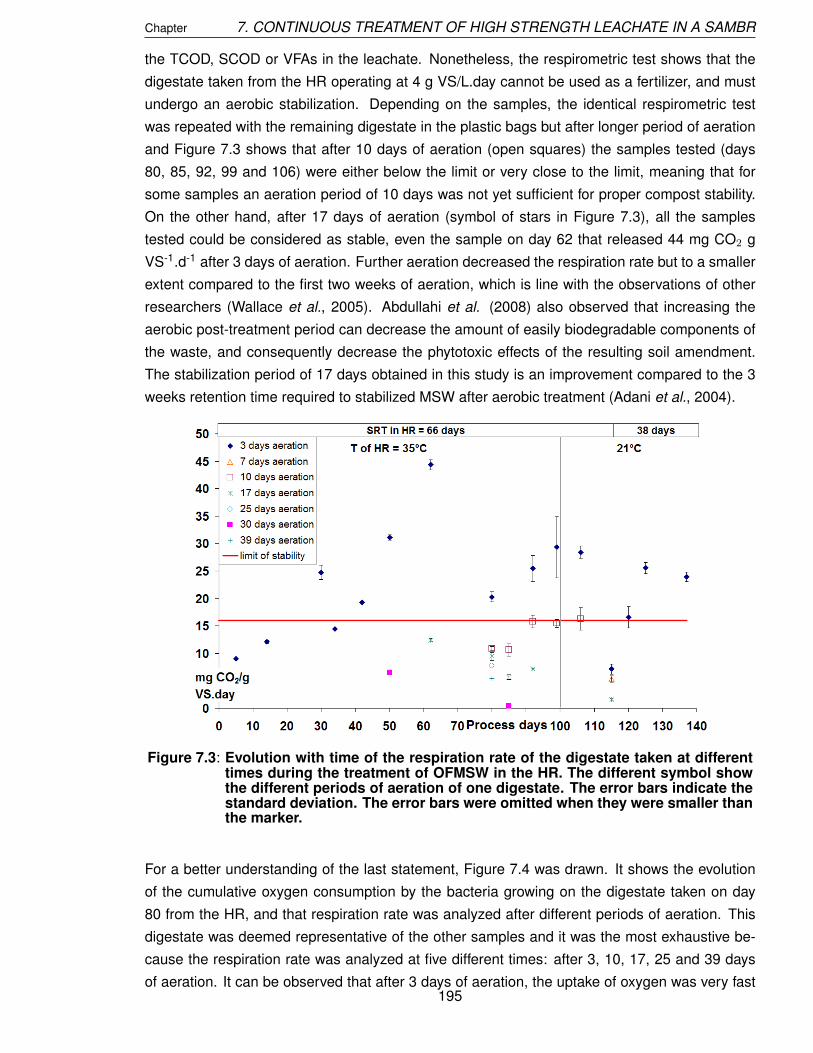
Chapter 7. CONTINUOUS TREATMENT OF HIGH STRENGTH LEACHATE IN A SAMBR
the TCOD, SCOD or VFAs in the leachate. Nonetheless, the respirometric test shows that the
digestate taken from the HR operating at 4 g VS/L.day cannot be used as a fertilizer, and must
undergo an aerobic stabilization. Depending on the samples, the identical respirometric test
was repeated with the remaining digestate in the plastic bags but after longer period of aeration
and Figure 7.3 shows that after 10 days of aeration (open squares) the samples tested (days
80, 85, 92, 99 and 106) were either below the limit or very close to the limit, meaning that for
some samples an aeration period of 10 days was not yet sufficient for proper compost stability.
On the other hand, after 17 days of aeration (symbol of stars in Figure 7.3), all the samples
tested could be considered as stable, even the sample on day 62 that released 44 mg CO2 g
VS-1.d-1 after 3 days of aeration. Further aeration decreased the respiration rate but to a smaller
extent compared to the first two weeks of aeration, which is line with the observations of other
researchers (Wallace et al., 2005). Abdullahi et al. (2008) also observed that increasing the
aerobic post-treatment period can decrease the amount of easily biodegradable components of
the waste, and consequently decrease the phytotoxic effects of the resulting soil amendment.
The stabilization period of 17 days obtained in this study is an improvement compared to the 3
weeks retention time required to stabilized MSW after aerobic treatment (Adani et al., 2004).
Figure 7.3: Evolution with time of the respiration rate of the digestate taken at differenttimes during the treatment of OFMSW in the HR. The different symbol showthe different periods of aeration of one digestate. The error bars indicate thestandard deviation. The error bars were omitted when they were smaller thanthe marker.
For a better understanding of the last statement, Figure 7.4 was drawn. It shows the evolution
of the cumulative oxygen consumption by the bacteria growing on the digestate taken on day
80 from the HR, and that respiration rate was analyzed after different periods of aeration. This
digestate was deemed representative of the other samples and it was the most exhaustive be-
cause the respiration rate was analyzed at five different times: after 3, 10, 17, 25 and 39 days
of aeration. It can be observed that after 3 days of aeration, the uptake of oxygen was very fast195

Chapter 7. CONTINUOUS TREATMENT OF HIGH STRENGTH LEACHATE IN A SAMBR
indicating that the microbial population was growing exponentially on the digestate.
Figure 7.4: Evolution with time of the respiration rate of the digestate after different pe-riods of aeration. The error bars were omitted for clarity when they weresmaller than the marker.
After 10 days of aeration, the microbes were still consuming the oxygen at a high rate but be-
cause there was less available cellulose, the extent of degradation was much less than at the
beginning of the aeration process. After 17 and 25 days of aeration, the initial oxygen uptake
was sluggish but there was still available carbon for microbial activity. The sudden peaks along
the curves indicate a sudden drop in the pressure within the bottle, while the curve going down
indicates an increase in the gas pressure. The peak could indicate a sudden oxygen uptake due
to the rapid growth of bacteria or mould followed by a sudden release of carbon dioxide. The
production of other gases such as ammonia or nitrous oxide that cannot be fixed by the sodium
hydroxide pellets is not excluded. Bernal et al. (2008) have reported that loss of nitrogen can
occur by NH3 volatilisation. Thus the sudden increases could also be due to oxygen uptake for
nitrification.
Another biological phenomenon that can take place within compost is a rise in the temperature
due to endogenous activity, and some researchers report compost temperatures reaching 60-
70 ˚ C. In our system, the mass of digestate (maximum 5 grams) was very small compared to the
gas enclosed in the bottle (≈ 500 mL), thus such high temperatures were probably not achieved.
After 39 days of aeration, there was considerably less available carbon and the microbial pop-
ulation entered a starvation period. Moreover, no peaks were observed for this period, which
suggests that their presence in the curves at 17 and 25 days of aeration was due to a very high
microbial activity.
196

Chapter 7. CONTINUOUS TREATMENT OF HIGH STRENGTH LEACHATE IN A SAMBR
7.3.2.2 Effect of Incubation Temperature on Respirometric Activity of the Digestate: The effect
of the incubation temperature on the stability of the digestate was investigated. The digestate
withdrawn from the HR on day 115 was incubated for 7 days at 65 ˚ C and a control was run
at the normal temperature of 30 ˚ C. Sixty-five is the minimum temperature recommended for
the sanitisation of composting materials. The sanitisation step serves as the control for human,
animal and plant pathogens. The BSI PAS100:2005 (WRAP, 2005) provides recommendations
for how to achieve sanitisation. In addition to a minimum of 65 ˚ C for 7 days, the compost must
also be kept at more than 50% moisture content and the compost must be mixed/turned at least
two times to ensure that the entire batch has been exposed to sanitising conditions.
Table 7.3: Respiration rate of the digestate taken on day 115 and aerated at 65 and 30 ˚ C.In the last two rows, comparison between aeration at 20 and 30 ˚ C of thecompost taken on day 132. The standard deviation is in brackets. n.a. = notavailable.
Aeration Incubation Respirationtime (days) temperature ( ˚ C) Rate (mg CO2.g VS-1.d-1
3 30 7.16 (0.9)
7 65 0.34 (0.2)
7 30 5.34 (0.6)
15 1 week at 65, then 0.11 (n.a.)1 week at 30
15 30 1.6 (0.3)
7 20 22.8 (2.3)
7 30 17.7 (1.4)
Table 7.3 lists the respiration rate of the digestate on day 115 with and without sanitisation, and
it can be seen that the sanitisation process considerably decreases the respiration rate due to
better stabilisation at thermophilic temperatures. Moreover, after one week of sanitisation the
pasteurized compost was aerated at 30 ˚ C along with the control kept for 2 weeks at 30 ˚ C in
order to determine whether microbial activity could take place in the pasteurized digestate. The
answer was no; the microbial activity of the pasteurized digestate after 1 week aeration at 30
˚ C was still lower than the control. In fact, the values obtained corresponded to a very mature
compost according to the maturity index established by several authors. Hue and Liu (1995)
have established a maturity index of 2.88 mg CO2.g VS-1.day-1, whereas Michel et al. (2004)
and Wang et al. (2004) used the criterion of CO2 evolution rate ≤ 1.8 mg CO2.g VS-1.day-1. This
indicates that the digestate from the HR was a suitable compost after the sanitisation step which
is required by both the European Commission (Commission, 2001) and the British Standard
Institution (WRAP, 2005).
The last two rows of Table 7.3 contain the respiration rate of the digestate of day 132 incubated
at room temperature and in the 30 ˚ C room. It was found that the results are not significantly
different if the compost is aerated at 20 or 30 ˚ C. Comparison of the curve of cumulative oxygen
uptake versus the days of measurement (data not shown) did not show any difference regarding
the initial activity, the initial slope of the two curves being very similar at both temperatures.
197

Chapter 7. CONTINUOUS TREATMENT OF HIGH STRENGTH LEACHATE IN A SAMBR
7.3.2.3 Effect of the Reactor on the Respirometric Activity of the Digestate: As the effect of the
SRT was investigated in the HR as well as in the SAMBR, it is interesting to compare the stability
of the solids withdrawn from the HR and the SAMBR. On day 120, the SAMBR sludge was
centrifuged in an attempt to decrease the solid content. Based on the volatile solids withdrawn
from the SAMBR, it was calculated that the SRT was about 35 days in the SAMBR at that
time, thus similar to the SRT in the HR. The solids were then dried and equilibrated following
the same procedure as the digestate withdrawn from the HR. After 4 days of measurement
using the Oxitop system, it was found that the respiration rates were 16.6 and 8.2 mg CO2.g
VS-1.d-1 for the digestate from the HR and the SAMBR, respectively, whereas the respective
standard deviations were 1.9 and 1.1. This respirometric test showed that the solids taken
from the SAMBR were further degraded than in the HR, leaving less biodegradable material
available during the aeration process and resulting in a significantly lower production of carbon
dioxide, about 50% less. Furthermore, the initial rate of CO2 production was slower in the case
of the digestate from the SAMBR (data not shown), suggesting that the remaining ligno-cellulose
complex was more recalcitrant which did not foster microbial activity as much as on the digestate
from the HR although both digestates had a similar retention time in their respective reactors.
Moreover, the solids from the SAMBR could be considered as completely stabilized because
the respiration rate was lower than the limit defined above. However, the CO2 production from
both digestate is also due to cell biomass degradation in addition to cellulose and hemicellulose
degradation.
7.3.2.4 Effect of Particle Size on the Respirometric Activity of the Digestate: The literature
revealed that respirometric tests are usually carried out with digestate with particle size in the
range 4-10 mm (Hue and Liu, 1995; Popp and Fischer, 1998). In a research report, the samples
were just passed through a 20 mm sieve (WRAP, 2005). No report investigating the effect of
particle size on respirometric activity was found in the literature. As it is known that the particle
size of the digestate can affect gas exchange during the aeration process, the effect of the parti-
cle size of the digestate was investigated. The digestate withdrawn on day 137 was fractionated
according to the particle size of the digestate: less than 0.75 cm, between 0.75 and 1.1 cm and
bigger than 1.1 cm. The latter fraction was, however, limited by the diameter of the bottle neck
which was 1.5 cm. Each fraction was equilibrated for 3 days with the identical moisture content.
It was found that the particle sizes tested did not influence the respiration rate in a significant
way. The respiration rates were 24, 19.8 and 22.3 mg CO2.g VS-1.d-1, respectively, for the frac-
tion greater than 1.1 cm, the one between 0.75 and 1.1 cm and the one below 0.75 cm. Their
respective standard deviations were 0.9, 1.2 and 1.8 using triplicates. The initial production rate
was similar for the 3 fractions suggesting that there was no lag phase in the production of carbon
dioxide or mass transfer limitations in the large particles.
198

Chapter 7. CONTINUOUS TREATMENT OF HIGH STRENGTH LEACHATE IN A SAMBR
7.3.3 Heavy Metals Content of the Digestate from the HR
On day 34 of the experiment the digestate from the HR was dried at 105 ˚ C and the heavy metal
content determined according to the method described in Chapter 3 after digestion with aqua
regia. The results are gathered in Table 7.4 along with the compliance criteria for compost and
stabilised biowaste established by the European Commission (EC) (Commission, 2001) and
the British Standard Institution (BSI) (WRAP, 2005). According to the European Commission,
”compost or digestate of Class 1 shall be used according to the best agronomic practice without
any specific restriction. Compost or digestate of Class 2 shall be used in quantity not exceeding
30 tonnes dry matter per hectare on a three-year average”. The stabilized Biowaste, on the other
hand, can be used as a component of an artificial soil or in those land applications that are not
destined to food or fodder crops production (such as final landfill cover, landscape restoration
in old and disused mines, anti-noise barriers, road construction, golf course, etc.). The criteria
given by the BSI are the minimum qualities that the compost must fulfil for general use such
as soil improver, mulch, growing medium, turf dressing, topsoil, etc. The table reveals that the
metal content of the digestate was far below the limits, and this low metal level can obviously
be attributed to the fact that a simulated OFMSW was used in this study, and accordingly it
contained no batteries or industrial waste that could affect the metal content of the digestate.
Table 7.4: Heavy metals content of the digestate from the HR and comparison with thecompliance criteria for compost and stabilised biowaste established by theEuropean Commission (EC) and the British Standard Institution (BSI). Thestandard deviation is given in brackets.
Digestate Compliance criteriaElement mg/kg dry matter EC BSI
Class I Class II
Zn 18.8 (0.2) 200 400 400
Pb 2.5 (0.3) 100 150 200
Cd 0 (0.01) 0.7 1.5 1.5
Ni 4.6 (0.06) 50 75 50
Cu 51.4 (0.5) 100 150 200
Cr 20.2 (0.1) 100 150 100
7.3.4 Performance of the SAMBR
7.3.4.1 Effect of SRT on Performance: In this section the effect of excess sludge removal was
investigated. Figure 7.5 shows the evolution of the SRT versus the HRT. The HRT was deter-
mined by the available flux, but because it dropped rapidly, low HRTs could not be maintained
for very long and the HRT had to be re-increased on many occasions. Previous results in Chap-
ter 6 have shown that a successful start up can take place at a HRT of 5.5 days. Thus in this
experiment it was attempted to start up at a low HRT of 1.3 days in order to investigate the
performance of the SAMBR during start up using an acclimatised inoculum from the previous
experiment. The SRT was set at 95 days by removing sludge daily from the SAMBR.
199

Chapter 7. CONTINUOUS TREATMENT OF HIGH STRENGTH LEACHATE IN A SAMBR
Figure 7.5: Panel A: Evolution with time of SCOD and VFAs in bulk and permeate (leftaxis), and the COD removal (right axis). Panel B: Evolution with time of theSRT (left axis), and the HRT in the SAMBR (right axis). The error bars indicatethe standard deviation.
During the 20 first days, it can be seen that the leachate was not stabilised because the SCOD
was between 1 and 2 g/L and VFAs were up to 1 g/L in the bulk. This indicated that methanogens
were not as active as hydrolytic and acidogenic bacteria during start up, which can be at-
tributed to the fact that the inoculum was left dormant for a period of 1-2 months. Furthermore,
methanogens might not have been in sufficient number to balance the production of fatty acids.
The predominance of propionic acid over acetic acid in the SAMBR shows, however, that it is
more likely that there was an insufficient amount of propionate oxidizers in the inoculum. The
first twenty days have shown that an efficient start up can not take place at a HRT of 1.3 even
200

Chapter 7. CONTINUOUS TREATMENT OF HIGH STRENGTH LEACHATE IN A SAMBR
with an inoculum acclimatised to the leachate medium but that was left dormant for a long period.
After 20 days, the VFA concentration dropped to below 30 mg/L and the SCOD in the permeate
was below 600 mg/L, thus respecting the criteria for a stabilized leachate. With 20 days as
start up period, it can be said that the SAMBR can start up more rapidly than the HR due to the
complete retention of bacteria by the membrane. This is a very interesting feature of the SAMBR
when considering that UASB reactors typically need long start up periods such as 2 - 4 months
(Najafpour et al., 2006). Shorter start up renders SAMBRs more attractive through saving of
time and cost. Meanwhile, the HRT was increased to 3.9 days on day 17 and then to 9.6 on day
24 due to an insufficient flux from the HR. This indicates that a pore size of 10 microns for the
filter in the HR leads to inappropriate flowrates to feed the SAMBR at a decent HRT. The filter in
the HR was removed on day 27 but the HRT in the SAMBR was still at 9.6 days.
The SCOD and VFA concentration remained stable until day 50 meaning that operation at a
SRT of 95 days and HRT of 9.6 days was possible with a SCOD removal greater than 95%. On
day 57, the SRT was halved to 45 days while the HRT remained at 9.6 days. This drop in SRT
had an immediate impact on VFA removal as their concentration went over 1 g/L, and on SCOD
removal as its concentration went to 3 g/L. Interestingly, due to cake formation on the membrane
the effluent was relatively unaffected by the shock as its SCOD concentration remained circa
600 mg/L. The value of SCOD and VFAs on day 70 was lower which tends to indicate that the
SAMBR could recover from the SRT shock to 45 days. On day 72, a simultaneous shock of SRT
to 25 days and HRT to 2 days was disastrous because the SCOD skyrocketed to 10 g/L and
the VFA concentration reached 1.5 g/L. This time the permeate COD was affected by the shock
because it reached 6.6 g/L, and as a result the SCOD removal plummeted to between 50 and
60%.
On day 77, the HRT was set back to 9.6 days because the flux in the SAMBR was not sufficient
to sustain that HRT. This allowed the system to return to normal levels in terms of SCOD and
VFAs. On day 85, the HRT was set at 3.7 to determine whether the system could cope with
that HRT and the same SRT of 25 days. Although the VFA concentrations remained low (≤ 500
mg/L), the bulk SCOD was in the range 5-6 g/L meaning that the hydrolysis rate was slower than
the feeding rate, and thus the system could not cope at 3.7 days HRT because of SCOD build
up. The same observation was made at a SRT of 12.5 days after day 104.
In conclusion, the system was found to be stable at SRTs down to 45 days and HRT of 9.6 days.
At lower SRTs, the VFAs were found to remain low due to attachment of methanogens on the
membrane or reactor’s panels, except when a simultaneous HRT shock to 2 days and a SRT
shock to 25 days was applied. When the SRT was lowered to 12.5 days, the VFA concentration
remained below 200 mg/L. In contrast, the SCOD built up in the bulk at every HRT tested when
the SRT was less than 45 days. The SCOD did not build up when the SRT was greater than
45 days and at a minimum HRT of 3.9 days. This is due to the washout of hydrolytic bacteria
at SRTs lower than 45 days and although hydrolytic bacteria are fast growing, they could not
compensate for the feeding rate.
Regarding the methane content of the biogas, the SAMBR started producing methane very
201

Chapter 7. CONTINUOUS TREATMENT OF HIGH STRENGTH LEACHATE IN A SAMBR
quickly compared to the HR, although it was shown previously that most of the biogas (about
70%) is produced in the first stage, but the second stage allows the first one to operate in a
stable way. The retention of bacteria by the membrane in the SAMBR allows a population of
methanogens to develop quicker than without a membrane. Therefore, it is hypothesized that
the recycling of the excess sludge to the HR was beneficial because it can partly compensate
for the washout of bacteria via the digestate withdrawn, and the leachate. In other words, the
excess sludge from the SAMBR can be used to re-inoculate the HR, inasmuch as the SRT in the
SAMBR is greater than 45 days as it was found that at that SRT and a HRT of 3.9 days a SCOD
removal greater than 95% was obtained.
7.3.4.2 Effect of SRT on MLTSS and Flux: As the nylon mesh in the HR was leaking during
startup, a very thick leachate (TS = 4 - 6%) was fed to the SAMBR which as a result of the low
HRT made the MLTSS rise very quickly (Figure 7.6). This was linked to a rapid drop in the flux
from 6.6 to 1 LMH in a mere 35 days of operation. Furthermore, the TMP increased as the flux
decreased to eventually reach values in the range 750 - 850 mbar after day 35 (data not shown).
Nghiem et al. (2006) stated that higher particulate matter concentration resulted in a thicker cake
layer: moreover, they found that a small amount of calcium could significantly enhance fouling.
It is well known that calcium can act as a coagulant via charge neutralization and complexation-
bridging between macro-organics, and we speculate that the size of the flocs will depend on
the concentration of calcium and organics. However, the coagulation is likely to take place on
the membrane since the concentration of humic acids is greater near the membrane, in the
concentration polarization layer. Furthermore, the increase in MLTSS beyond 20 g/l is linked
with an increase in viscosity in the bulk liquid which also contributes to reduce the flux (Akram,
2006).
After day 66, the recycle pump and biogas pump was stopped 1 hr before taking out sludge
to let the solids settle down, but this has no effect on the MLTSS. This was equivalent to a
relaxation strategy of 23 hours ON and 1 hour OFF. This strategy was, however, clearly not
effective because it was started only on day 66 and because the filtration period was too long for
the relaxation period to be useful. Strategies of filtration-relaxation with the timing 8 min ON - 2
min OFF were reported as more appropriate in the literature (Grelot et al., 2009).
After day 60, the flux decreased further and some occasions it was not possible to get any flux,
except when the rotation of the recycle pump was inverted so that a backflushing strategy was
tested. The backflushing allowed us to measure the flux but return to virtually zero after some
time.
The MLTSS was found to increase at SRTs greater than 25 days due to the large amount of
lignocellulosic fibers present in the leachate. The rate of increase was directly proportional to
the HRT: the rate of increase in MLTSS at a HRT of 1.3 during the start up was much greater
than at 9.6 days HRT. At 25 days SRT, however, the MLTSS decreased from 71 to 56 g/L, but
then increased again due to the HRT shocks. At 12.5 days SRT, the MLTSS could be reduced
from 77 to 50 g/L, but this was inefficient as no change was observed in the flux.
202

Chapter 7. CONTINUOUS TREATMENT OF HIGH STRENGTH LEACHATE IN A SAMBR
Figure 7.6: Panel A: Evolution with time of the MLTSS, MLVSS, MLFSS (left axis) andMLVSS/MLTSS ratio (right axis). Panel B: Evolution with time of the pH (leftaxis), and the flux (right axis). The error bars indicate the standard deviation.
After day 104, another technique was tested in order to decrease the MLTSS in the SAMBR.
Instead of daily sludge removal that was found to be not efficient in reducing the MLTSS and that
led to SCOD build up at SRTs lower than 45 days, a centrifugation technique was used. On day
114, the whole reactor content was centrifuged at 3000 rpm for 30 minutes. The supernatant
was re-injected into the SAMBR, whereas the solids were discarded. Tap water was added in
the SAMBR because the supernatant was less than 3L. This addition of fresh water obviously
diluted the SCOD, which explains why the SCOD dropped at the end of the run. Although the
MLTSS was not measured right after the centrifugation, the MLTSS dropped from 65.7 g/L before
centrifugation to 41.6 g/L on day 119, thus giving rise to a limited reduction. Another attempt was
made on day 120 but this led to similar results, as the speed of centrifugation may not have been
sufficient for a proper separation. A disadvantage of this technique was the drop of methane in
the biogas due to the introduction of some air during the procedure. Figure 7.2 shows a drop
203

Chapter 7. CONTINUOUS TREATMENT OF HIGH STRENGTH LEACHATE IN A SAMBR
from 61 to 20% on day 114, but the system restored the anaerobic conditions very quickly. This
is explained by the presence of facultative hydrolytic bacteria that consumed the oxygen very
quickly.
Figure 7.6 displays the change in the MLVSS/MLTSS ratio and the inorganics concentration
in suspension in the SAMBR. The former plateaued at 75% after the start up indicating that
75% of the sludge was made of organic material, i.e. OFMSW and bacteria. The inorganics in
suspension accounted for 25% of the reactor content and its concentration remained in the range
10-20 g/L throughout the run. This in contrast with the organic matter in suspension (MLVSS)
that increased considerably. This indicates that the inorganics were decomposed and solubilised
at a higher rate than the lignocellulosic material, and as a result no build up of inorganics was
observed in the SAMBR. The solubilisation of inorganics can result in high concentrations of ions
and this can lead to precipitation onto the membrane if the product of the molar concentrations
is greater than the solubility product.
Granular activated carbon (GAC) (Product PK025-1, Norit) was added in small doses of 1 g
on days 102, 104 and 115 in an attempt to reduce the bulk SCOD and thereby increase the
flux, but no effect was noticed, either on the bulk SCOD or on the flux. It is believed that the
concentration of GAC in this study was too low in view of the SCOD concentrations encountered
with high strength landfill leachate. Also the effect was negligible on a membrane already fouled.
7.3.4.3 Particle Size Distribution of the Solids and the Supernatants in the HR and the SAMBR:
Particle size analysis has been carried out on the supernatant and the residual solids from the
effluent from the HR and from the SAMBR bulk in order to gain more insight in the particle size
distribution (PSD) of the colloids and solids from each reactor.
The supernatant from each reactor has been obtained after centrifuging about 50 ml of the
reactor content for 30 minutes at 3000 rpm and filtering the liquid through a 10 microns filter in
order to isolate the colloids and macro-solutes. The PSD of the solids was obtained after taking
1g of the centrifugated solids and resuspend it in deionized water and vortex it for 5 seconds.
Figure 7.7: Panel A: Particle Size Distribution of the supernatant of the HR and theSAMBR obtained after centrifugation and filtration through a 10 micron fil-ter. Panel B: Particle Size Distribution of the solids of the HR and the SAMBRobtained after centrifugation and resuspension of 1g in deionized waster
204

Chapter 7. CONTINUOUS TREATMENT OF HIGH STRENGTH LEACHATE IN A SAMBR
Figure 7.7 shows on Panel A the PSD of the supernatant while Panel B shows the PSD of the
solids. It can be seen on Panel A that there is no great difference in the PSD of the colloids
and macro solutes from both reactors. The only small difference is that the SAMBR particles as
small as 0.07 microns whereas the HR effluent goes down to 0.09 microns, but the accuracy of
the particle size analyser at such small sizes is questionable. The main characteristic of both
PSD is the bi-modal distribution with a peak at 0.1-0.2 microns and a broader peak at 1 microns.
The latter peak could be free bacteria, i.e. bacteria not attached to other bacteria as part of a
flock or granule. The first peak at 0.1-0.2 microns is too small to be bacteria is therefore very
likely to be colloids. It is clear that the colloidal fraction from the HR is not significantly reduced
when passing through the SAMBR, only slightly shifted to smaller sizes. Furthermore this type
of curve reveals that 68% of the particles in the supernatant (≤ 10 µm) were equal or less than
0.4 microns which is the pore size of the membrane in the SAMBR, thus 68% of the particles
are potential foulants which is consistent with the flux drop observed in the SAMBR.
The panel B shows that the solids from the HR have a broad PSD ranging from submicron levels
to 1000 microns particles. The SAMBR solids in contrast exhibit a narrow peak at about 1 mm
which could be the non degradable fraction of the leachate or aggregate of bacteria and cellulose
fibers. The particles below 1000 microns are significantly less than in the leachate indicating a
hydrolysis of these particles in the SAMBR, which is in line with other results in this work.
7.3.5 Performance of the AMBR
As expected, the AMBR acted as a COD polishing step as well as an ammonia removal unit
throughout the whole experiment. During the startup (0 to 20 days), the SAMBR permeate
contained up to 2 g COD/L but this remaining COD was eliminated in the AMBR (Figure 7.8),
showing that the AMBR can assist the SAMBR during start up and thereby achieve high COD
removals from the very first days and decrease the start up period required to treat the leachate
from the HR. Based on the SCOD content of the leachate, the SCOD removal was always greater
than 90% thanks to the AMBR.
On day 72, the AMBR remained relatively stable during a simultaneous SRT and HRT shock in
the SAMBR that led to a permeate containing 6-7 g COD/l (1 to 2 g VFAs/l). The SCOD in the
AMBR increased from 500 to 800 mg/L due to the shock, which was relatively small compared to
the magnitude of the COD to treat; the OLR to the AMBR increased suddenly to 3 g COD/L.day
between the days 72 to 77 while it was typically 0.06 g COD/L.day if the period day 20 to 70 is
considered with a COD of 600 mg/L in the SAMBR permeate. As a result, the COD removal in
the AMBR temporarily increased to 90% between days 72 and 77, and this indicates that the
AMBR can also assist the SAMBR in cases where the anaerobic step can not cope with an
organic shock which is in line with other researchers (Xu et al., 2008).
Moreover, the ammonia removal was not affected by the COD load during these days. The
ammonia nitrogen coming out of the SAMBR was typically in the range 200 - 500 mg N/L, which
resulted in a Nitrogen loading rate (NLR) to the AMBR equal to or lower than 0.07 g N/L.day,
except between days 72 and 77 when it reached 0.24 g N/L.day; the ammonia removal remained
205

Chapter 7. CONTINUOUS TREATMENT OF HIGH STRENGTH LEACHATE IN A SAMBR
Figure 7.8: Panel A: Evolution with time of the SCOD in the bulk and permeate (left axis)and the COD removal percentage in the AMBR (right axis). Panel B: Evolutionwith time of the flux (left axis) and the pH in the AMBR (right axis). The errorbars indicate the standard deviation of triplicates.
above 95% throughout the run, and thus the AMBR bulk and permeate consisted of nitrite and
nitrate. The sum of NO−
2 -N and NO−
3 -N correlated with the total amount of ammonia-nitrogen fed
to the AMBR (within the range of accuracy), indicating that the evaporation of NH3 was negligible
although the pH was above 9 (Figure 7.8). Moreover, the residual nitrite (maximum 25% of the
total inorganic nitrogen) indicates that the nitrification was not complete in the AMBR, possibly
due to a lack of syntrophic association between AOB and NOB because of the high shear in the
AMBR or inhibition of NOB by the high temperature (35 ˚ C).
Unfortunately, after day 80 the AMBR remained practically unfed due to flux problems as well
206

Chapter 7. CONTINUOUS TREATMENT OF HIGH STRENGTH LEACHATE IN A SAMBR
as a high HRT and low SRT in the SAMBR. Also because the AMBR was operated at 35 ˚ C,
its liquid level was low due to evaporation of the water which translated to an increase in COD
concentration above 1 g/L. After day 80, the COD removal was not calculated for that reason.
The COD rejection by the membrane was virtually zero in the AMBR because the COD of the
bulk was found to be very close to the permeate SCOD, indicating that the MW of the recalcitrants
was too low to be rejected, and that the biofilm on the membrane could not degrade these
refractory organics when they diffused through the biofilm. During the whole experiment the
MLTSS, MLVSS and MLFSS in the AMBR remained below 3, 2 and 1 g/L, respectively (data not
shown). The flux was initially 7 LMH, but plateaued to values between 2 and 3 LMH after 30
days.
7.3.6 Scanning Electron Microscopy of the Fibers in the HR and SAMBR.
Figure 7.9 displays pictures of the fibers from the HR and the SAMBR that were analyzed with the
Scanning Electron Microscope in order to gain more insight into the mechanisms of hydrolysis.
Pictures A, C, E and G were taken on the fibers from the HR whereas pictures B, D, F and H
were taken from the fibers from the SAMBR. These pictures show evidence that there are two
main mechanisms of hydrolysis of lignocellulosic fibers in the OFMSW: pictures A, C, E and G
show that fibers are peeled off to some extent. This peeling can also be due to the shear effect of
the stirrer. The effect of peeling results in fibers with discontinuous and rough surfaces. Picture
G also shows colonies of bacteria embedded in a matrix of exopolymers on the surface of the
fibers.
The second effect is clearer on pictures from the SAMBR on the right-hand side of Figure 7.9
where more pictures with holes in the fibers were found. The second hydrolytic effect consists
in enlarging holes existing in the fiber structure. These holes were found in the virgin fibers after
autoclaving, and it is not clear whether these holes were due to the autoclave conditions, or to
partial degradation of the paper waste before preparing the OFMSW feedstock. Nevertheless,
the holes found on the virgin fibers in Figure 6.4 in Section 6.3.1.3 had a diameter smaller than
2 microns, whereas the holes in the fibers from the SAMBR had a diameter up to 5 microns as
can be seen in picture F from Figure 7.9. Besides, the holes in Figure 7.9 do not have a regular
and circular shape indicating a preferential enzymatic attack on the edges of the holes where
cellulose or hemicellulose is accessible. This is supported by Picture H showing a rod-shaped
microorganism colonizing the hole.
It is speculated that the second hydrolysis mechanism is taking place because the external layer
of the fiber is too hard to degrade. Thanks to the holes, the enzymes can have access to the
underlying layers of the fibers that still contain cellulose and hemicellulose. This succession of
layers exposed to the bulk through the formation of holes can clearly be seen again in picture
H. Song et al. (2005) reported holes in crystalline cellulose treated with rumen fluid and stated
that these holes allow the movement of nutrients to biofilm microorganisms and movement of
solubilised carbon to non-cellulolytic microorganisms.
207
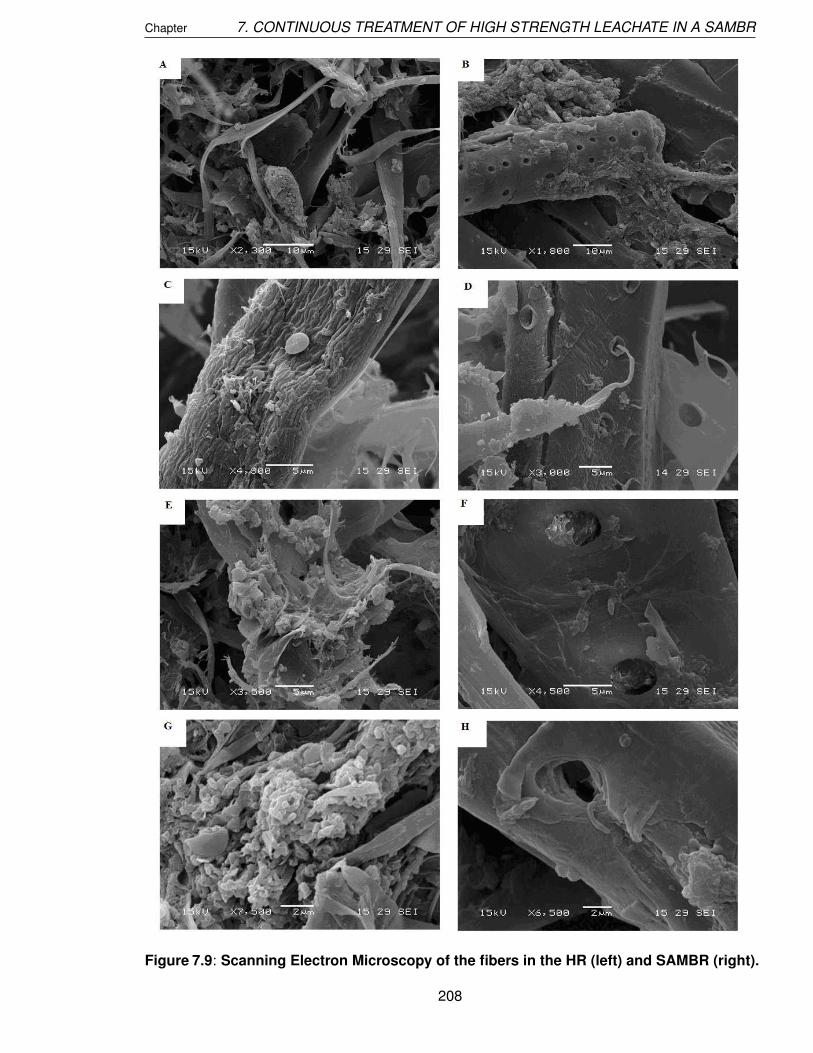
Chapter 7. CONTINUOUS TREATMENT OF HIGH STRENGTH LEACHATE IN A SAMBR
Figure 7.9: Scanning Electron Microscopy of the fibers in the HR (left) and SAMBR (right).
208
Chapter 7. CONTINUOUS TREATMENT OF HIGH STRENGTH LEACHATE IN A SAMBR
7.3.7 Contribution of Organic and Inorganic Materials to Fouling.
A cleaning procedure (Akram, 2006) identical to the one performed in Section 5.3.5 of Chapter
5 was performed in order to determine the relative contribution to fouling due to internal and
external, organic and inorganic fouling.
Flux drop due to organic biofilm alone (F2) was obtained by subtracting F1 (combined internal
and external fouling) and F3 (external inorganic layer and internal fouling). Table 7.5 documents
the contribution of each component of fouling. It can be seen that 98.4% of the clean water flux
is lost because of the combined effect of the external and internal fouling of the membrane. The
flux F3 (without the external biofilm removed by the sponge and hot water) was only 13.6 LMH
which means that 94% of the flux drop was due to external inorganic combined with internal
fouling. This indicates that the external organic (F2) fouling played a minor role in total fouling
(less than 4%).
Afterward, the membrane was chemically cleaned in a 1% sodium hypochlorite solution for 2
hours to remove organic foulants. This can be organic materials remaining on the external
surface and organic foulants inside the membrane pores. The flux recovered after cleaning was
only 43 ± 0.9 LMH which is considerably lower that the initial flux which suggests that organic
material played a minor role for internal and external fouling. In fact, the total flux drop due to
inorganic fouling regardless of internal or external material (F5) can be calculated by substracting
it from F4, which gives 208.2 LMH.
The membrane was then soaked in a 1% oxalic acid solution (pH ≤ 2) for 2 hours to remove
inorganic foulants. The Kubota company recommends soaking the membrane panel in 1% ox-
alic acid for 1 hour for inorganic fouling. Although the membrane was left for 2 hours at that
concentration, the flux measured afterward was only 60 LMH. This suggests that inorganic and
organic foulants may be combined together which make inefficient the use of sodium hypochlo-
rite and oxalic acid separately. Another explanation could be that the main canal collecting the
permeate in the lumen side of the membrane was partly clogged with large precipitates and that
the concentration of oxalic acid and the length of the treatment may not have been appropriate
to dissolve the precipitate and clear the lumen so that the treatment with oxalic acid did not allow
to recover the pure water flux of the virgin membrane as expected.
The last two attempts consisted in using 1% hydrochloric acid for 2 hours and then 1% hy-
drochloric acid with 1% sodium hypochlorite for 4 hours. The prenultimate attempt resulted in
a flux of 94 LMH, while the last one resulted in a flux of 106 LMH. The last attempt did not act
very efficiently which suggests that the length of the treatment was not the issue. Thus, it is rec-
ommended to use more concentrated solution of acid with a better agitation during the cleaning
process.
The same procedure was followed for the membrane that was in the AMBR. It appeared that the
inorganic fouling was not as significant as in the SAMBR, presumably because the precipitation
occurred first in the SAMBR. Similarly to the membrane from the SAMBR, the original flux in the
membrane from the AMBR could not be recovered even with hydrochloric acid instead of oxalic
acid. The flux after HCl cleaning was 183 LMH which is still lower than the 250 LMH of the209

Chapter 7. CONTINUOUS TREATMENT OF HIGH STRENGTH LEACHATE IN A SAMBR
Table 7.5: Contribution of various components of fouling in the SAMBR and the AMBR.
Components of Fouling Flux drop (LMH ± standard deviation)
SAMBR AMBR
Virgin membrane Flux (F4) 251.2 ± 6 251.2 ± 6
External and Internal Fouling (F1) 247.1 ± 6.5 196.4 ± 8.8
external organic layer (F2) 9.5 ± 13.9 (≤ 4%) 76 ±16 (30%)
external inorganic layer and internal Fouling (F3) 237.6 ± 7.4 (94%) 120.4 ± 7.2 (48%)
inorganic fouling (external and internal) (F5) 208.2 ± 7.4 (83%) 81.2 ± 8.5 (32%)
virgin membrane. Therefore, it was attempted to clean the membrane with both the hydrochloric
acid and the sodium hypochlorite solutions at 1% for 2 hours. The resulting flux was 211 LMH
which indicates that the membrane could still be cleaned, but it is not clear whether the remain-
ing foulants were aggregates of organic colloids associated with inorganic precipitates, or only
inorganics that cannot be dissolved completely probably due to the low concentration of the acid
or the lack of agitation in the lumen side of the membrane that prevents the acidic solution from
accessing the precipitates. Therefore, for a full recovery of the flux it is suggested to leave the
membrane in a stronger acidic and alkaline solutions together with a mild agitation. This would
in turn consume more chemicals and result in higher costs.
7.3.8 Scanning Electron Microscope - Energy Dispersive X-ray (SEM-EDX)
The Scanning Electron Microscope (SEM) was used to investigate the morphology and structure
of the inorganic precipitate found in the permeate line from the SAMBR. This technique was
coupled to Energy-Dispersive X-rays (EDX) in order to determine the chemical composition of
the precipitate. The sample was coated with gold, four sites scanned, and the weight percentage
of the four spectrum are given in Table 7.6.
Figure 7.10: View of the inorganic precipitate on the permeate side of the SAMBR (left)and elemental chromatogram (right).
210

Chapter 7. CONTINUOUS TREATMENT OF HIGH STRENGTH LEACHATE IN A SAMBR
Table 7.6: Weight percentages of the inorganic precipitates in the permeate side of theSAMBR and comparison with known calcium precipitates.
Spectrum/Mineral Elements %(Molar Mass) organic
content
C O Mg Ca Fe H
Spectrum 1 19.7 50.91 0.47 28.23 0.69 ? ?
Spectrum 2 15.65 51.5 0.45 31.71 0.69 ? ?
Spectrum 3 17.44 54.24 0.5 27.09 0.33 ? ?
Spectrum 4 16.65 53.36 0.56 28.92 0.51 ? ?
Calcite CaCO3 (100.087) 12 47.96 0 40.05 0 0 59.96
Dolomite CaMg(CO3)2 (184.4) 13.03 52.06 13.18 21.74 0 0 65.09
Monohydrocalcite CaCO3.H2O 10.17 54.2 0 33.94 0 1.71 66.08(118.09)
Ikaite CaCO3.6H2O (208.18) 5.77 69.17 0 19.25 0 5.81 80.75
Table 7.6 also contains the theoretical weight percentage of known minerals containing calcium
: anhydrous calcium carbonate or calcite, dolomite, monohydrocalcite and ikaite. However, it
is not clear from the table which mineral actually precipitated because the sample percentages
vary within 4%, and there was coprecipitation with magnesium and iron. Some oxygen can also
be attributed to dissolved organic matter. This means that the oxygen percentage actually due
to calcium carbonate was overestimated. Moreover the inaccuracy of the technique increases
with inhomogeneous and rough samples. However, dolomite is unlikely to have precipitated
because of the low percent of magnesium in the unknown sample compared to the 13% present
in Dolomite. Calcium carbonate was suggested first but its carbon content is a bit lower, whereas
its calcium content is slightly higher than the sample. On the other hand the two hydrated
forms of calcium carbonate, monohydrocalcite and ikaite do not match the sample perfectly.
Nonetheless, these forms contain hydrogen that cannot be detected by the EDS technique.
As a result, the percentage are slightly overestimated because they do not take hydrogen into
account.
Because the precipitate was still unknown, it was decided to run the sample on a Bruker AXS
using X-Ray Fluorescence technology (XRF). It only analyzed inorganics (Table 7.7), and it can
be seen that the percentage of calcium is very similar to the one given by the EDX (≈ 28%),
but with a much smaller statistical error. The analysis also showed that impurities such as
phosphorus, silicon, magnesium, iron, sulphur, potassium, manganese and aluminium could
coprecipitate, but most importantly, the analysis revealed that 29% of the sample was inorganic
thus 71% was organic (C, O and H). By comparing this with the last column in Table 7.6, it
was found that the mineral that is the closest to the 71% is actually monohydrocalcite with 66%.
Furthermore, monohydrocalcite is also known for its bizarre occurrences, which include inside
the otoliths of the tiger shark, the bladder of a guinea pig (Catherine et al., 1977), and the
final stages of decomposition of the putrefying flesh of the giant saguaro cactus (Garvie, 2003).
These occurrences suggest a biochemical origin is possible.
211

Chapter 7. CONTINUOUS TREATMENT OF HIGH STRENGTH LEACHATE IN A SAMBR
Table 7.7: Weight percentages of the inorganic precipitate in the permeate side of theSAMBR
Element weigth % statistical error %
Ca 28.03 0.3P 0.427 1.8
Si 0.349 2.1Mg 0.214 1.6
Fe 0.0618 3.8
S 0.0357 5.8K 0.031 5.5
Mn 0.028 6Al 0.018 9.7
SUM 29.26
In biological systems, some authors have reported that the precipitated minerals were related to
the bacterial metabolism and, consequently, could be considered biologically induced (Gonzalez-
Munoz et al., 2008). Amino acid metabolism results in the release of ammonia and CO2 that
increases the pH and CO2−3 concentration, creating an alkaline environment that favored car-
bonate precipitation. This precipitation may be also related to heterogeneous nucleation on
negatively charged points of biological structures. These functional groups are able to attract
positive ions such as Ca++. Methanogenesis and bacterial sulfate reduction has been associ-
ated with microbial dolomite precipitation (Van Lith et al., 2003; Wright and Wacey, 2005; Wright
and Oren, 2005). These studies suggest strongly that a biofilm on the membrane or panels of
the SAMBR could have triggered the precipitation of calcite preferentially on these places. Mi-
cro pH probes would have allowed us to measure the pH in the biofilm in order to confirm this
hypothesis.
7.3.9 Ions
The variation of the ion concentration in the HR effluent, SAMBR permeate and AMBR permeate
over time is shown in Figure 7.11. It can be seen that the sodium concentration was considerably
higher than in the previous Chapter (Section 6.3.7) partly due to the fact that NaHCO3 was added
on days 17, 18, 19, 21 and 23 to control the pH. This led to concentrations up to 3.5 g/L in the
HR and the SAMBR, but no inhibition was noticed at that concentration. The sodium levels then
started to decrease over time whereas it plateaued at 4500 mg/L in the AMBR. Although a fifty
times dilution was required to analyze the sodium because the Dionex Ion chromatograph gives
a linear response only up to 200 mg/L, the concentration in the AMBR was significantly higher
than in the SAMBR.
As previously observed (Chapter 6, Section 6.3.7), the potassium concentration was similar in all
the reactors, and slowly increased. Jarvis et al. (1995) also found an increase in potassium from
2.1 to 4-5 g/L in both reactors of a two-stage process treating silage with effluent recirculation.
In the same study, the sodium concentration remained low at 0.15 g/L in both reactor before and
212

Chapter 7. CONTINUOUS TREATMENT OF HIGH STRENGTH LEACHATE IN A SAMBR
Figure 7.11: Evolution of the ions concentration in the HR effluent, SAMBR permeate andAMBR permeate. From top to bottom and left to right: sodium, potassium,magnesium, calcium, chloride, phosphate and sulfate. The error bars indicatethe standard deviation.
after initiating the effluent recycle, supposedly due to the low sodium content of silage.
The magnesium level remained between 100 and 200 mg/L in all the reactors, while the phos-213

Chapter 7. CONTINUOUS TREATMENT OF HIGH STRENGTH LEACHATE IN A SAMBR
phate concentration varied according to the reactor; typically below 20 mg/L in the SAMBR, and
above 60 mg/L in the AMBR, while the HR effluent was in between. This is in contradiction with
normal biological nutrient removal processes where phosphate-accumulating organisms (PAOs)
accumulate phosphate in excess of normal metabolic requirements, then under anaerobic con-
ditions they will release the stored orthophosphates. Hence, with this in mind, the concentration
should have been greater in the permeate of the SAMBR. However, it is suggested that the
discrepancy between the HR effluent and SAMBR permeate was due to calcium phosphate pre-
cipitation on the membrane as was observed on the membrane of the AMBR in the previous
chapter (Chapter 6), and accordingly the phosphate levels were lower in the SAMBR permeate.
This is in line with Kim et al. (2007) who observed low levels of residual PO4-P and they attributed
this to calcium that might preferentially react with orthophosphates to produce hydroxyapatite,
dicalcium phosphate or octacalcium phosphate. Borzacconi et al. (1999) also observed that cal-
cium can form complexes with organic matter, orthophosphates and polyphosphates which will
diminish the phosphorus available for the microorganisms. The higher concentration of phos-
phate and other ions in the AMBR is thought to be due to water evaporation because the AMBR
was maintained at 35 ˚ C and was open to the atmosphere.
Since the ammonium ion concentration and the pH were also known, it is possible to predict if
struvite can be formed in the SAMBR. If the maximum concentration of NH+4 , Mg2+ and PO3−
4 is
taken, which were 646, 171 and 36 mg/L, respectively, the pPS= −log(PS) defined in Equation
2.14 in Section 2.3.13 is equal to 7 which gives a point below the solubility curve at a pH of 7.2,
thus in the zone of undersaturation of Figure 2.3. Besides, as the solubility is greater at 35 ˚ C
than at 25 ˚ C (Bhuiyan et al., 2007), the curves can be shifted upwards for a temperature of 35 ˚ C
which strengthens the previous conclusion. Thus in the present study, struvite is unlikely to have
precipitated and the low available phosphate was the main reason. It was confirmed using the
Struvite Tool equilibrium chemistry computer model developed by Ohlinger et al. (1998) that
struvite precipitation would not occur at a pH below 7.5 given the conditions aforementioned
(Ohlinger, 2008). This was confirmed by Stratful et al. (2001) who noticed that no struvite
occurred at pH 7 with concentrations of magnesium, ammonium and orthophosphate equal to
187, 266 and 742 mg/L, respectively, while only a minute amount was produced at pH 7.5.
Moreover, Mg2+ and PO3−4 did not build up in the reactors over time and NH+
4 was continuously
degraded in the AMBR.
All the ions were not problematic to the process except calcium. It can be seen from Figure
7.11 that the calcium concentration in the HR effluent was greater than 200 mg/L throughout the
run. It even reached 1.4 g/L on day 63. This is in line with the value of 976 mg/L found in a
real landfill leachate in Tunisia (Zayen et al., 2008). In contrast, the concentration in the SAMBR
and the AMBR was below 20 mg/L, meaning that the rest of the calcium had precipitated. The
maximum solubility of calcium under the conditions encountered in the SAMBR has already been
established in the previous chapter, and the values of calcium in the permeate of the SAMBR
confirmed the calculation made in the previous chapter that demonstrated that the maximum
solubility of calcium was 5 mg/L.
In the AMBR at 35 ˚ C, the pH gradually increased to 9.5 probably due to a higher HRT com-214
Chapter 7. CONTINUOUS TREATMENT OF HIGH STRENGTH LEACHATE IN A SAMBR
pared to the previous chapter where the pH was 8.5. As a result of the higher pH, the solubility
becomes only 0.03 mg/L, meaning that all the remaining calcium would have precipitated in the
AMBR. This was indeed observed as very low values of calcium were detected in the perme-
ate of the AMBR. It is noteworthy that all the concentrations were significantly lower for the last
measurement (day 119) in the SAMBR because tap water was added after centrifugation of the
sludge on day 114. It is also known that calcium can act as a coagulant by neutralizing the
charge of colloids. Calcium can thus form aggregates with macro-organics and the size of the
flocs will depend on the calcium concentration. At high concentrations it is hypothesized that
large and compact aggregates will be formed. Moreover, as the concentration of humic acids is
greater near the membrane in the concentration polarization layer, it is very likely that the cal-
cium will form aggregates on the membrane because of the higher density of negatively charged
solutes near the membrane. However, in colloidal systems at lower calcium concentrations such
as the AMBR, smaller flocs will be formed and this can result in dense cake layer or pore block-
ing. This is consistent with the observations of Waite et al. (1999) who found a much larger
fraction of small aggregates under low ionic strength compared to high ionic strength where
most of the aggregates were much larger. Furthermore, Li et al. (2003) and Ma et al. (2001)
claimed that the electrical double layer around bacteria is compressed at high ionic strength,
which results in more interactions between the bacteria and the molecules, and this leads to a
further stabilization of the cake layer.
Finally, the sulfate concentration varied according to the reactor. Its concentration in the HR
effluent was constant at 20 mg/L throughout the run which is beneficial to the process because
S−− is an obligate nutrient requirement for anaerobic reactors (Speece, 1996). Several authors
have emphasized the positive effect of 20 mg S−−/L on the effluent COD or the methane pro-
duction (Capestany et al., 1977). Concentrations as low as 60 mg/L have been reported to be
inhibitory for sulfate-reducing bacteria (SRB) and methanogens (Parkin et al., 1990), but the
range of concentrations that cause 50% inhibition is from 100 to 250 mg/L (Speece, 1996). The
presence of sulfate in the HR indicates that the process treating the OFMSW is self sufficient
with respect to sulfate and that no sulfide supplementation is required for stable operation. The
sulfate concentration was lower in the SAMBR possibly through reduction of sulfate to sulfide
by SRB and the sulfide then left the SAMBR as gaseous hydrogen sulfide or precipitated with
heavy metals due to their low solubility products (Morel, 1983). It is noteworthy that the reduction
of sulfate to sulfide was incomplete as Figure 7.11 shows that sulfate was still detected in the
SAMBR permeate. This can be due to the inhibition of acetate utilizing SRB by H2S (Speece,
1996).
7.3.10 Denaturing Gel Gradient Electrophoresis (DGGE)
7.3.10.1 Archaea: Archaeal DNA was amplified using the nested PCR technique with ARCH
46F and ARCH 1017R as first set of primers and then 344FGC and Univ522R. Figure 7.12
shows the evolution of the archaeal population in the HR. Eleven bands were cut out but only
nine could be identified, and these are listed in Table 7.8. Three species belonging to the genus
Methanosarcina were identified. These are two Methanosarcina mazeii (band b and g) with dif-215

Chapter 7. CONTINUOUS TREATMENT OF HIGH STRENGTH LEACHATE IN A SAMBR
ferent accession numbers and Methanosarcina barkeri (band e). Moreover, bands b and e are
among the dominant species in the HR. The genus Methanosarcina includes the most metabol-
ically diverse species of methanogenic archaea. Whereas most methanogenic species grow
by obligate CO2 reduction with H2, methyl reduction with H2, aceticlastic fermentation of ac-
etate, or methylotrophic catabolism of methanol, methylated amines, and dimethylsulfide, most
Methanosarcina spp. can grow by all four catabolic pathways (Maeder et al., 2006). It is also
known that it dominates at acetate concentration greater than 350 mg/L (Ehlinger et al., 1987).
Figure 7.12: Evolution with time of the archaeal population in the HR using the primersARCH46F and ARCH1017R then 344FGC and Univ522R. Lane 1 = day 35; Lane2 = day 99; Lane 3 = day 137; Lane 4 = Blank.
Methanobacterium Congolense (band a) is a close relative to Methanobacterium bryantii and
Methanobacterium formicicum. The Methanobacterium Congolense was first found during the
methanogenic fermentation of cassava peel in Congo and is known for its ability to utilize 2-
propanol or 2-butanol as hydrogen donors for the reduction of CO2 to produce methane (Cuzin
et al., 2001). Its optimum pH and temperature range for growth is pH 7.2 and between 37 and
42 ˚ C. As the HR was operated at room temperature after day 100, it is hypothesized that this
microorganism did not survive as the temperature became too low for its growth. Moreover,
Cuzin et al. (2001) who isolated the strain observed that the cells are rods and occurring indi-
vidually or in pairs, but rarely in chains and small aggregates. This could explain why it did not
survive in that environment without a synthrophic association because it did not have the ability
to form aggregates as readily as other species. The low temperature and the inability to form
aggregates support the hypothesis that it did not survive in the HR and this translated to a band
of lower intensity in Lane 3 (day 137).
Methanobacterium formicicum (band d) was also found but as a much brighter band on the216

Chapter 7. CONTINUOUS TREATMENT OF HIGH STRENGTH LEACHATE IN A SAMBR
DGGE gel. It can also produce methane from H2 and CO2, but it differs from Methanobacterium
Congolense because it can use formate as the sole source of carbon and energy for growth
(Bryant and Boone, 1987). Methanobacteriales, mainly Methanobacterium formicicum, are fre-
quently observed in anaerobic digesters (Godon et al., 1997). In some studies, Methanobac-
teriales were shown to represent the majority of the hydrogenophilic methanogens in anaer-
obic bioreactors (McHugh et al., 2003; Leclerc et al., 2004). In this study it was found that
Methanobacterium formicicum (band d) and Methanosarcina barkeri (band e) were present
throughout the experiment, and were not affected by the changes in SRT or temperature. It
can be thus inferred that these are psychotrophic archaea, i.e. they can withstand thermal fluc-
tuations. This suggests that a syntrophic association was taking place with hydrogen-producing
acetogens such as Syntrobacter Wolinii or Syntrophomonas Wolfei, but the presence of these
species was not confirmed by the DGGE of bacterial DNA in the next section. The hydrogen pro-
duced by these acetogens was presumably metabolized by the hydrogenotrophic methanogen
Methanobacterium formicicum and possibly by Methanosarcina barkeri, thus providing an en-
vironment with low hydrogen concentrations that is favourable for the acetogenic bacteria. The
acetogens could therefore degrade propionate, butyrate, ethanol and other long chain fatty acids
into acetate, which was then converted to methane by Methanosarcina barkeri.
The end of the start up in the HR correspond to lane 1 of Figure 7.12 which is the archeal
population on day 35. The two main bands were then Methanobacterium formicicum (band d)
and Methanosarcina barkeri (band e) and these could cope at the concentrations of acids en-
countered during the start up which were not greater than 3000 mg/L. Later, concentrations of
up to 7000 mg/L of propionic acids were observed (Figure 7.1, Panel B) which indicates that
the hydrogen conversion rate was not fast enough or in other words that the distance between
hydrogen-producing and hydrogen-consuming species was not short enough or that the num-
ber of hydrogenotrophs were not present in sufficient amounts. The response of the system
can be seen on Lane 2 of Figure 7.12 (day 99) where several new species appeared such
as: Methanobacterium Congolense (band a), Methanosarcina mazeii (band b), Uncultured ar-
chaeon clone (band f) and Methanosarcina mazeii (band g). The recycling of digested slurry
from the SAMBR was then 240 mL/day (SRT of SAMBR = 12.5 days). This recirculation rate
would have been sufficient for Methanobacterium Congolense (band a) to appear in the HR be-
cause it is known that effluent recycle promotes the growth of hydrogenotrophs (Jarvis et al.,
1995). Methanobacterium formicicum on the other hand was able to appear in the HR as soon
as day 35 when the recirculation rate from the SAMBR was only 30 mL/day (SRT of SAMBR =
90-100 days).
A microorganism from the genus Methanobrevibacter (Band c) appeared as a bright band a in
the DGGE gel, but only towards the end of the experiment (Lane 3 = day 137) when the HR
was operated at ambient temperature. It is a close parent to Methanobrevibacter Ruminantium
that can use hydrogen and formate as a sole electron donor for methanogenesis and growth
(Balch et al., 1979). The appearance of this hydrogenotrophic methanogen coincided with the
appearance of Methanosarcina mazeii as a bright band (Band b), suggesting another syntrophic
association with a hydrogen-producing acetogen, but this association appeared only when the
217

Chapter 7. CONTINUOUS TREATMENT OF HIGH STRENGTH LEACHATE IN A SAMBR
HR was operated at 20 ˚ C.
The species Methanospirillum hungatei (Band h) and Methanoculleus sp. (Band i) appeared
as faint bands at the end of the experiment (Lane 3 = day 137) when the HR was operated at
ambient temperature, although they also seem to be present in the first lane (day 35) as very faint
bands. These are other hydrogen scavengers (Muller et al., 2008) and they presumably appear
to help in keeping low interspecies distance at 20 ˚ C. It is possible that they were present in the
first lane thanks to the recirculation of slurry from the SAMBR (30 mL/day). The presence or
absence of hydrogenotrophs as well as the brightness of their band could be linked with the pH
as it is known that they are inhibited at pHs below 6 (Schink, 1997), and the pH in the HR was in
the range 5.5 - 6.5 throughout the experiment, and was thus below 6 on a few occasions.
Methanoculleus sp. was found to be the predominant hydrogenotrophic methanogen in two-
phased biogas reactors treating silage (Klocke et al., 2008). Moreover, the authors observed no
differences in composition between the two stages, but there was differences in the proportion
of acetotrophic and hydrogenotrophic methanogens, and in the most dominant species within
one fermenter.
From our study it is clear that syntrophic associations played an important role in the HR because
two of the four brightest bands were hydrogenotrophic methanogens (Methanobrevibacter and
Methanobacterium formicicum), whereas the other two were from the genus Methanosarcina.
Furthermore, among the nine bands cut, only three species belonged to the genus Methanosarcina,
while the remaining six were hydrogenotrophic methanogens. Two different syntrophic associa-
tions include Methanobacterium formicicum (band d) and Methanobrevibacter (Band c) as the
obligate hydrogenotrophic methanogens. However, the latter was only observed at 20 ˚ C. The
predominance of some hydrogenotrophic at lower temperatures is consistent with Connaughton
et al. (2006) who observed that anaerobic digestion in the sub-mesophilic range favours hydro-
genetrophic methanogenesis as one of its main routes of methane production.
It is hypothesized that the other hydrogenotrophic methanogens identified in this study played a
minor role compared to the two main ones identified as Methanobrevibacter and Methanobac-
terium formicicum, and they are postulated to constitute a reserve of hydrogenotrophic species
which can help in degrading the excessive hydrogen or formate in case of organic shock if the
two main hydrogenotrophs could not cope.
7.3.10.2 Bacteria: Almost all the bands detected in the SAMBR were also seen in the HR, es-
pecially in the initial sample in lane 1 of Figure 7.13 where the number of bands was the largest.
This suggests that the population in the SAMBR was strongly influenced by the population of the
HR due to the bacteria also present in the leachate. Nevertheless, all the species in the leachate
did not survive in the SAMBR. In fact only a few microorganisms remained active in the SAMBR
throughout the run such as bands a, b and d.
The band a in Figure 7.13 was identified as the anaerobic cellulolytic bacterium Ruminococcus
flavefaciens is one of the critically important inhabitants in the rumen (Sadanari et al., 2008). It is
known that members of this genus can degrade cellulose by producing cellulase that is excreted218

Chapter 7. CONTINUOUS TREATMENT OF HIGH STRENGTH LEACHATE IN A SAMBR
Table 7.8: Bands cut from the DGGE gel using archaeal primers.
Band Closest Accession Genus Match EMatch Number % Value
a Methanobacterium Congolense AF233586 Methanobacterium 99 2e-68
b Methanosarcina mazeii DQ987528 Methanosarcina 98 6e-67
c Unc. Methanobrevibacter sp. AY454734 Methanobrevibacter 99 3e-69
d Methanobacterium formicicum EU544028 Methanobacterium 98 6e-67
e Methanosarcina Barkeri CP000099 Methanosarcina 99 3e-69
f Unc. archaeon clone EU591672 unclassified 99 3e-69Methanobacteriaceae
g Methanosarcina mazeii DQ649324 Methanosarcina 99 3e-69
h Methanospirillum hungatei AY196683 Methanospirillum 98 6e-67
i Methanoculleus sp. EU544029 Methanoculleus 98 7e-66
outside the cell, whereas members of the genus Fibrobacter contain a periplasmic cellulase to
break down cellulose. Because of this, cells of Fibrobacter must remain attached to the cellulose
fibril while digesting it (Madigan and Martinko, 1984). However, in our study Fibrobacter was not
found.
Two very close parents of Ruminococcus flavefaciens (bands a and c) were found in common in
the SAMBR and the HR. They were present in the SAMBR throughout the whole run at every
HRT and SRT tested, presumably because they were present in the leachate fed to the SAMBR.
In contrast, they were not so active in the HR and bands a and c eventually disappeared in Lane
3 on day 137 when the HR was operated at room temperature. This strongly suggests that the
drop in the VS removal in the HR at room temperature was due to the inadequate conditions for
Ruminococcus flavefaciens. There were fewer bands with less intensity in lane 3 which presum-
ably means that some species could not survive under these conditions. This explains why less
carbohydrate was fermented and less acetate, succinate and lactate were produced after day
100. These faint bands on Lane 3 also coincided with the drop in VFAs that occurred after the
temperature drop in the HR. The presence of Ruminococcus flavefaciens in the reactors clearly
contradicts the literature that stated that Fibrobacter succinogenes, R. albus and Ruminococcus
flavefaciens species are among the most important cellulose degrading bacteria in the rumen,
while in landfills and anaerobic digesters other species of Firmicutes, primarily Clostridia, tend
to be dominant (O’Sullivan et al., 2007).
This indicates that the diversity was very similar in both reactors but the activity was relatively
different with brighter bands in the SAMBR, which could be due to the stable and neutral pH
in the SAMBR. This hypothesis is supported by the more stabilized digestate from the SAMBR
compared to the HR in terms of respiration rate. Band d was identified as Spirochaeta sp.
Buddy. Previous Spirochaeta related sequences have also been reported from anaerobic di-
gesters treating wine distillation waste (Godon et al., 1997) and mesophilic and thermophilic
methanogenic sludges (Sekiguchi et al., 1998). Fernandez et al. (1999) found that the bac-
219

Chapter 7. CONTINUOUS TREATMENT OF HIGH STRENGTH LEACHATE IN A SAMBR
Figure 7.13: Evolution with time of the bacterial population in the HR, SAMBR and AMBR.Lane 1 = HR, day 35; Lane 2 = HR, day 99; Lane 3 = HR, day 137; ; Lane 4 =SAMBR, day 66; Lane 5 = SAMBR, day 94; Lane 6 = SAMBR, day 125; Lane 7= AMBR, day 125; Lane 8 = replicate of lane 7.
terial and archaeal community were dominated by Spirochaeta and Methanobacterium formici-
cum, respectively in a stable reactor fed with glucose. These bacteria are obligately/facultatively
anaerobic and chemoorganotrophic in nature. Members of this genus ferment carbohydrates
and produce acetate, succinate and lactate (Garrity, 2005), but also hydrogen and carbon diox-
ide (Fernandez et al., 1999). Figure 7.13 shows that it was found in the SAMBR at all times,
whereas it was present in the HR only on day 35 (Lane 1). After day 35 Spirochaeta sp. Buddy
was not found in the HR, possibly due to the lower pH. The presence of Spirochaeta sp. Buddy
in the SAMBR under all the conditions supports the idea that hydrolysis was taking place in the
SAMBR. McInerney (1988) reported that Spirochaeta isovalerica could degrade branched-chain
amino acids (valine, leucine, and iso-leucine) to the corresponding branched-chain fatty acids.
Ariesyady et al. (2007) found that members of Chloroflexi, Syntrophomonas and Methanosaeta
groups were in charge of the degradation of glucose, butyrate and acetate, respectively, in a
full-scale anaerobic sludge digester. Furthermore, the propionate-utilizing microbial community
consisted of Betaproteobacteria, Smithella and Syntrophobacter. In this study none of these
species were found although acetate and butyrate were found in the HR.
The technique cannot differentiate between dead and living cells; band intensity is not always
correlated with population density, as DNA extraction efficiencies vary between microorganisms
(Prakitchaiwattana et al., 2004), and also because the primers can amplify some species more
than others resulting in different intensities of the bands on a DGGE gel (Wittebolle et al., 2008).
Furthermore, the number of species decreased over time in both reactors suggesting after some
220

Chapter 7. CONTINUOUS TREATMENT OF HIGH STRENGTH LEACHATE IN A SAMBR
acclimatisation period a small number of species was becoming the most dominant. Bands f,
g, h and i in Table 7.10 were exclusively found in the AMBR indicating its bacterial population
was very different than the one in the SAMBR. Band i was identified as a member of the genus
Hyphomicrobiaceae that are known to be chemoorganotrophic on one-carbon compounds such
as methanol, methylamine, formaldehyde and formate (Madigan and Martinko, 1984). All that is
needed for that microorganism to grow is a mineral salts medium lacking organic carbon, and it
can use nitrate as electron acceptor under anoxic conditions.
Table 7.9: Bands from the SAMBR using bacterial primers. The microorganisms under-lined were also found in the HR.
Band Closest Accession Genus Match EMatch Number % Value
a Ruminococcus flavefaciens AM748742 Ruminococcus 99 0
b Uncultured anaerobic AY953168 unclassified 98 0bacterium Bacteroidales
c Ruminococcus flavefaciens AF030450 Ruminococcus 99 0
d Spirochaeta sp. AF357916 Spirochaeta 99 0
e Uncultured bacterium clone EF686989 unclassified Bacteria 99 0
Table 7.10: Bands cut from the DGGE gel of AMBR using bacterial primers.
Band Closest Accession Genus Match EMatch Number % Value
f Nitrosomonas halophila AF272413 Nitrosomonas 99 0
g Pseudomonas sp. EU246844 Pseudomonas 98 0
h Hyphomonas sp. AM990830 Hyphomonas 97 0
i Uncultured Hyphomicrobiaceae EF662713 Hyphomicrobiaceae 97 0bacterium clone
7.3.10.3 Ammonia - Oxidisers: Figure 7.14 shows the evolution of the population of ammonia-
oxidising bacteria in the HR and the AMBR. Although the species could not be identified, the
clear band appearing in the AMBR as well as the HR indicates that there is a common microor-
ganism present in both reactor. However, that specific band was brighter in the case of the
AMBR. The AOB population did not change drastically in the HR and the main microorganism
did not seem to be affected by the drop of temperature in the HR.
7.3.10.4 Fungi: It is known that fungi have a great capability to degrade lignocellulosic wastes
by producing ligninolytic enzymes under microaerobic and anaerobic conditions (Durrant, 1996;
Pavarina and Durrant, 2002). Furthermore, the work of Silva et al. (2008) provides data demon-
strating the ability of fungi to degrade PAHs under low-oxygen conditions. White-rot ligninolytic
basidiomycete fungi, such as Pleurotus ostreatus, Phanerochaete chrysosporium, Trametes
221

Chapter 7. CONTINUOUS TREATMENT OF HIGH STRENGTH LEACHATE IN A SAMBR
Figure 7.14: Evolution with time of the population of ammonia-oxidisers in the HR andAMBR. Lane 1 = HR, day 35; Lane 2 = HR, day 99; Lane 3 = HR, day 137; Lane4 = AMBR, day 72; Lane 5 = AMBR, day 125.
spp., Bjerkandera spp., and Coriolopsis spp. are considered good producers of complex ligni-
nolytic extracellular enzymes (peroxidases and phenoloxidases) that are effective not only for
the degradation of lignin but also for the degradation of several aromatic compounds due to the
nonspecificity of these enzymatic systems (Tekere et al., 2005; Tortella et al., 2005).
In this study fungi were detected on the digestate taken out of the HR as well as in the HR, in
the walls of the reactor and the stainless steel mesh upper part that was not submerged in the
sludge. The presence of fungi in the HR indicates that they grow in low-oxygen environments
on a support where there is lignocellulosic materials. In order to identify the species from the
digestate, the fungi was isolated on an agar plate and incubated at 30 ˚ C until the plate was fully
covered. Then about 1 square centimeter close to the edge of the plate was cut and re isolated
on a new agar plate. After that the plate was covered, the DNA was extracted using the DNA
extraction method detailed in Chapter 3. PCR reactions to generate fragments for sequencing
were carried out in a thermocycler (G-Storm) with ITS5 as forward primer and ITS4 as reverse
primer (Gardes and Bruns, 1993; White et al., 1990). Reaction mixtures were prepared accord-
ing to the recipe given in Materials and Methods. The PCR product was purified using the PCR
purification kit before it was sent off for sequencing (Cogenics, UK).
The fungus was identified as Galactomyces geotrichum (accession number DQ683112.1) and
it was previously associated with common reed (Wirsel et al., 2001). Galactomyces geotrichum
and Geotrichum candidum were also found to produce dye-decolorizing peroxidases (Lee et al.,
2000; Jadhav et al., 2008). Geotrichum candidum is classified as mesophiles and was reported
to grow on various substrates such as vegetable, fruit, kitchen waste, garden waste, municipal
solid waste and sewage sludge. Geotrichum sp. is also mesophiles but was reported to grow on
garden waste, mushroom compost, vermicompost, cattle manure and forestry waste (Ryckeboer
et al., 2003).
222

Chapter 7. CONTINUOUS TREATMENT OF HIGH STRENGTH LEACHATE IN A SAMBR
Pavarina and Durrant (2002) observed that Geotrichum sp. prefer lower oxygen concentrations
for growth and enzyme production. Lignocellulolytic activities were observed and the fermenta-
tive capability of this strain was demonstrated because ethanol and nongaseous fermentation
products were detected. Ryckeboer et al. (2003) confirmed that the genus Geotrichum can
degrade crystalline cellulose, carboxymethyl cellulose and bioplastics, but not hemicellulose nor
lignin.
7.4 SUMMARY
The results showed that:
• In the HR fed daily at 4 g VS/l.day the VS destruction was found to be 75% at a relatively
high solids retention time of 66 days and a HRT of 20 days. Under these conditions the
total methane yield was 208 mL CH4 STP/g VS, of which 71% was obtained in the HR. At
room temperature the VS destruction dropped to 50%, while the SRT and HRT remained
unchanged. When the SRT was reduced to 38 days, the VS removal dropped to 45% and
the methane yield became very low at 43 ml CH4 STP/g VS. Therefore, SRT of minimum
60 days are recommended to achieve at least 70% VS removal at 20 days HRT.
• 91% of the COD content of the leachate had a MW smaller than 15 kDa. Furthermore,
56% of the COD was in the range 40 - 800 Da which are very likely to be VFAs.
• An efficient start up at 1.3 days was not possible with an acclimatised inoculum that was
left dormant for a long period. The analysis of VFAs revealed that propionate was dominant
indicating that the propionate oxidizers were not in sufficient number to treat the leachate
at a MLVSS of 3 g/L in the SAMBR and at a HRT of 1.3 days. Therefore, it is suggested
that an appropriate HRT would be 3 to 5 days to start up the SAMBR at 2-3g MLVSS/L
if the inoculum is acclimatised. If the inoculum is active and acclimatised to the leachate
medium, lower HRTs could be applied.
• The SAMBR was found to be stable at SRTs down to 45 days. At lower SRTs, the VFAs
were found to remain low due to attachment of methanogens on the membrane or reactor’s
panels, except when a simultaneous HRT shock to 2 days and a SRT shock to 25 days
was applied. When the SRT was lowered to 12.5 days, the VFA concentration remained
below 200 mg/L. In contrast, the SCOD built up in the bulk at every HRT tested when the
SRT was less than 45 days. The SCOD did not build up when the SRT was greater than
45 days and at a minimum HRT of 3.9 days.
• the SAMBR started producing methane very quickly (within 1 week) compared to the HR.
The excess sludge from the SAMBR can be used to re-inoculate the HR, inasmuch as the
SRT in the SAMBR is greater than 45 days as it was found that at that SRT and a HRT of
3.9 days a SCOD removal greater than 95% was obtained.
223

Chapter 7. CONTINUOUS TREATMENT OF HIGH STRENGTH LEACHATE IN A SAMBR
• Regarding the flux, the main factor that affected the performance was the concentration
of solids in suspension and the precipitation of inorganics on the membrane. Above 20 g
MLTSS/L, the flux dropped rapidly and was not recoverable with the techniques used such
as higher biogas sparging rates, relaxation, backflushing, and activated carbon addition.
The chemical cleaning did not allow us to recover the full flux of the virgin membrane at 1%
sodium hypochlorite, oxalic acid and hydrochloric acid for a period of 2 hours. The major
contribution (83%) of the flux drop was due to inorganic precipitates on the membrane,
while it was not the main factor of the flux drop in the AMBR (32%), mainly because the
calcium precipitated first in the SAMBR. The precipitate in the permeate line was found to
be monohydrocalcite, which is a hydrated form of calcium carbonate.
• The main factor affecting SAMBR performance was the solid content of the leachate. The
flux dropped to 1 LMH in only 35 days of operation at MLTSS greater than 30 g/L. Solids
build up in the SAMBR could not be avoided by sludge removals or bulk centrifugation.
Therefore, an efficient separation of solids and leachate must take place in the HR. The
10 micron nylon sheet used in this experiment did not allow enough leachate to percolate
through to the SAMBR at a HRT of 4 days, and sometimes the leachate flowrate was
not constant at higher HRT. Thus this pore size was too low for a filter in the HR to be
operational.
• Molecular biology techniques allowed us to understand in a deeper way the evolution of mi-
croorganims found in two - stage processes treating OFMSW. It appeared that syntrophic
associations took place in the HR because of the presence of obligate hydrogenotrophic
methanogens and hydrogen - consuming acetotrophs: (i) Methanobacterium formicicum
and Methanosarcina barkeri ; (ii) Methanobrevibacter and Methanosarcina mazeii, but
these microorganisms were only detected at ambient temperature.
• Regarding the bacterial population it was found that the SAMBR and the HR shared a
similar diversity due to the inoculation of the SAMBR by the HR because of the microor-
ganisms present in the leachate. Then over time the population changed and the diversity
was reduced to a smaller number of more active species. Some species like Spirochaeta
sp. Buddy could only survive in the SAMBR, but not in the HR.
• The drop in VS removal in the HR at room temperature was correlated with the disappear-
ance of some bands, while some other became fainter such as Ruminococcus flavefaciens
which is a critical microorganism found in the rumen of animals. This microorganism was
found in the HR at a SRT of 66 days and HRT of about 20 days, while it was found in the
SAMBR at a SRT of 12.5 days and HRT of about 5 days.
224

Chapter 8
CONTINUOUS TREATMENT OF
LEACHATE IN A SAMBR-MABR1
8.1 INTRODUCTION
In this chapter, attempts were made to treat both the COD and the nitrogen in a Submerged
Anaerobic Membrane Bioreactor - Membrane Aerated Bioreactor (SAMBR - MABR). Membrane-
attached biofilm systems represent a relatively new form of bioreactor, in which submerged
membranes are used to deliver gas to the base of an active biofilm. These systems are attractive
as they provide significant operational and economic advantages over processes that rely on
bubble-diffusers. Such advantages include minimal stripping of volatile organic compounds in
wastewater applications, high gas transfer efficiencies, controlled delivery of explosive gases,
the development of unique biofilm ecologies that allow for simultaneous aerobic and anaerobic
processes in a single reactor, and the provision of a well-defined surface area for mass transfer
(Shanahan and Semmens, 2006). Moreover, there is no need to add an external carbon source
to perform denitrification as the wastewater COD can be used by denitrifiers in the outer layer of
the biofilm (Timberlake et al., 1988).
The concept of completely autotrophic nitrogen removal in a single reactor is based on the com-
bination of partial nitrification and Anammox. In the biofilm of a MABR, the ammonia-oxidising
bacteria (AOB) are active in the inner aerobic region of the membrane-biofilm interface while
Anammox bacteria or denitrifiers would be dominant in the anoxic region of biofilm-liquid inter-
face (Yamagiwa et al., 1998). Oxygen is supplied to the membrane interior and diffuses through
pores in the membrane fabric to the base of the biofilm, while nutrients diffuse from the bulk
into the biofilm at the liquid-biofilm interface (Gong et al., 2008). In contrast, oxygen concen-
trations are highest at the membrane and decrease towards the outside of the biofilm. This
counterdiffusion of substrates leads to strata of micro-niches across the biofilm depth, which
may simultaneously provide favourable conditions for both nitrification (near the membrane) and
denitrification (near the biofilm-liquid boundary) within a single biofilm (Satoh et al., 2004).
The amount of oxygen supplied is proportional to the intramembrane pressure so the DO con-
1Submitted in part for publication as Trzcinski, A.P. and Stuckey, D.C. ”Gas Chromatography-Mass Spectrometry(GC-MS) analysis of landfill leachate recalcitrants from the permeate of a Submerged Anaerobic Membrane Biore-actor (SAMBR) operating at low temperatures.”, Water Research.
225

Chapter 8. CONTINUOUS TREATMENT OF LEACHATE IN A SAMBR-MABR
centration in a MABR system can be controlled by adjusting the pressure (Terada et al., 2003; Hu
et al., 2008). Casey et al. (2000b) investigated the effect of intramembrane oxygen pressure on
the performance of a MABR and found that biofilm thickness and intramembrane pressure were
the most important parameters influencing performance. There is a critical thickness beyond
which dual substrate limitations come into effect, thus impeding the transport of both limiting
substrates.
Thus the first objective of this chapter was to experiment with the feasibility of growing a nitri-
fying biofilm on a Kubota membrane by permeate recirculation over the critical flux to promote
nitrifier attachment, and then to incorporate this Kubota membrane with the biofilm in a con-
ventional SAMBR fed with leachate and pressurize it with pure oxygen, while a second Kubota
membrane is used for permeate extraction during leachate treatment in the SAMBR. Growing
a nitrifying biofilm on a flat-sheet dual sided membrane is not very well documented as most
of the nitrifying biofilm studies were carried out on end sealed hollow fibers. Furthermore, the
method used to grow and promote attachment of the nitrifiers has not been reported anywhere
else to our knowledge, and could be a further advantage due to the rapidity of forming a biofilm
compared to traditional methods.
The second objective of this chapter was to investigate the operation of the SAMBR treating
leachate at ambient and psychrophilic temperatures. Heating of anaerobic reactors obviously
requires energy and capital expenditure, and hence digestion of wastewater at low temperatures
(5-10 ˚ C) would be desirable to lower costs. The development of high rate anaerobic reactor
designs such as the SAMBR, ABR and UASB containing high biomass concentrations should
enable the biomass to operate at lower temperatures where the specific rate per unit of biomass
is lower. The rate of anaerobic digestion generally follows the Arrhenius equation, i.e. the lower
the temperature, the lower the microbial activity. Lower temperatures can result in an exhaustion
of cell energy, a leakage of intracellular substances or complete lysis (Kashyap et al., 2003).
The acidogenic phase is the least affected by temperature variations due to its lower activation
energy. In order to gain more knowledge the compounds that built up during low temperature
shocks were identified using GC-MS.
Many researchers have reported strong effects of temperature on microorganisms, where lower-
ing the operational temperature led to a decrease in the maximum specific growth and substrate
utilization rates. Under psychrophilic conditions (10-15 ˚ C), chemical and biological reactions
proceed much slower than under mesophilic conditions (30-40 ˚ C) (Lettinga et al., 2001). The
low temperatures were reported to affect biogas production, methanogenic activities and micro-
bial community composition.
COD removal efficiencies are typically in the range 93 - 99% at mesophilic temperatures, but
when the temperature is decreased to ambient, a few studies have reported lower COD removal
efficiencies. 65 - 75% COD removal was achieved in a UASB (Upflow Anaerobic Sludge Blanket)
treating leandfill leachate at ambient temperatures (Kettunen and Rintala, 1998). At 24 ˚ C, a
COD removal of up to 75% was achieved with a 10 h HRT. The highest organic loading rate
applied was 10 kg COD.m-3.d-1 at 24 ˚ C (Kettunen et al., 1996). Connaughton et al. (2006)
treated synthetic VFAs-based wastewater in an expanded granular sludge bed (EGSB) loaded226

Chapter 8. CONTINUOUS TREATMENT OF LEACHATE IN A SAMBR-MABR
with 24.64 kg COD.m-3.d-1 at a HRT of 4.88h and an operating temperature of 18 ˚ C. They found
that anaerobic digestion in the psychrophilic range favours hydrogenotrophic methanogenesis
as one of its main routes of methane production.
In a more recent study on psychrophilic performance of an EGSB - anaerobic filter bioreactor
treating VFAs-based wastewater, COD removals and methane concentrations exceeded 80 and
65%, respectively, at an applied OLR of 10 kg COD.m-3.d-1 between 9.5 and 15 ˚ C (McKeown et
al., 2009). Moreover, at a temperature in the range 4-10 ˚ C, an OLR of 3.75-5 kg COD.m-3.d-1
could be applied with 82% COD removal, and 70% methane in the biogas.
Studying the response of anaerobic reactors to low temperature is vital, especially when the
temperature change affects the rate-limiting step by altering the growth rate of individual species,
and hence changes the predominant group of microorganisms in the long run (Nachaiyasit and
Stuckey, 1997). As kinetic constants and hence performance of reactors is affected significantly
by reactor configuration and type of culture, it would be interesting to study the effect of low
temperature (10 ˚ C) on the performance and the population of the SAMBR.
8.2 EXPERIMENTAL AND ANALYTICAL DETAILS
8.2.1 Reactors
The speed of the stirrer in the HR was 40 rpm (Heidolph), and was operated intermittently (15
min ON-45 min OFF). The HR was maintained at 37 ± 1 ˚ C. In addition to the usual stainless
steel mesh of 1.5 mm diameter circular holes used in previous chapters, an additional nylon
mesh with square holes of 1.5mm was wrapped around the stainless steel one in order to have
a second barrier against large particles. The succession of circular holes followed by squares
ones was useful because the second barrier of squares holes could retain particles that were
not retained by the first barrier. The nylon filter was long enough to wrap around the stainless
steel cylinder twice so that two layers of nylon were actually filtering the leachate. Furthermore,
these additional macrofilters did not significantly impede the flow of liquid because they had the
same size as the first barrier. These layers of identical macrofilters with relatively large holes of
1.5 mm were found to be more suitable for leachate filtration compared to the 10 micron pore
size filter used in the previous chapter that led to complete clogging. The attempt consisting
of fixing the nylon macrofilter to the inner side of the stainless steel support was unsuccessful
because it came in contact with the stirrer which broke the filter. The excess of leachate in the
outer zone was recirculated (about 1-2 litres per day) to the top of the HR to avoid keeping the
liquid stagnant in the outer zone. The process liquid tended to stay in the outer zone by gravity
because the stirrer pushed the liquid outwards; but too much liquid in the outer zone was not
desirable because the liquid was needed in the inner zone for mixing.
This combination of circular holes and squares ones was designed to keep the large particles in
the inner zone of the HR whilst the liquid could flow to the outer zone and thereby uncouple the
HRT (based on the flowrate of leachate pumped from the outer zone of the HR) and the SRT
(based on the removal of solids from the inner zone of the HR). In addition to the screening in
227

Chapter 8. CONTINUOUS TREATMENT OF LEACHATE IN A SAMBR-MABR
the HR, the leachate pumped from the HR was centrifuged (1500 rpm for 20 minutes) daily and
the supernatant was poured into an intermediate tank from which the SAMBR were fed. This
ensured a leachate with low suspended solids levels and with a constant feed strength during
one day which allowed more accurate determinations of the OLR and the methane yields in the
SAMBR to be made.
The SAMBR-MABR was a three liter reactor fitted with a new Kubota membrane. Instead of a
baffle in a conventional SAMBR, a second Kubota polyethylene flat sheet membrane covered by
a biofilm of nitrifiers was fitted onto the baffle panel of the reactor and the outlet was connect to
a pressure regulator (0-140mbar, Bellofram, USA) fed with pure oxygen (BOC). The absence of
the baffle meant that there was no upflow and downflow regime in the SAMBR-MABR. No sludge
was wasted from the SAMBR-MABR except for sampling so that the SRT was around 300 days.
The temperature of the SAMBR-MABR was 35 ˚ C until day 94. On day 95, the temperature was
20-22 ˚ C and then 10 ˚ C after day 100.
In order to compare the performance of the SAMBR-MABR, a SAMBR was run as a control to
compare the ORP values. The temperature of the SAMBR-MABR was 35 ˚ C until day 94. On
day 95, the temperature was 20-22 ˚ C and then 10 ˚ C after day 100. The biogas sparging rate
was set at 5 L/min (LPM) to minimize cake formation on the membrane. The SAMBR was a three
liter reactor fitted with a new Kubota membrane. The sludge that was taken out of the SAMBR
to set a specific SRT was fed back to the HR.
The HR, the SAMBR and the SAMBR-MABR were connected in series: the leachate was fed to
the SAMBR and the SAMBR-MABR, and the permeate from the SAMBR and the SAMBR-MABR
was recycled to the HR in order to maintain the moisture and alkalinity of the system, and also
to dilute the incoming COD and organic acids.
8.2.2 Inoculation and start-up of Reactors
The HR was inoculated with 10L of anaerobic sludge that was left dormant for two months after
the end of the previous run (Chapter 7). The HR was fed daily at a constant OLR of 4g VS/L.day
from day 1 onwards with the feedstock of OFMSW. The initial TS and VS content were 3.9%
and 2.7%, respectively. Fresh tap water was added daily in the HR with the feedstock in order to
keep a constant working volume. The conventional SAMBR running in parallel with the SAMBR-
MABR was started up together with the HR on day 1 with 800 ml sludge from the SAMBR from
the previous experiment (Chapter 7), and the final volume was adjusted to 3L with the anaerobic
biomedium defined in Owen et al. (1979). The initial MLTSS and MLVSS were 4.4 and 3.2
g/L, respectively. The SAMBR-MABR was started up on day 34 with 800 ml anaerobic sludge
from the SAMBR from the previous experiment (Chapter 7), and the final volume was adjusted
to 3L with the anaerobic biomedium defined in Owen et al. (1979). Six grams of Powdered
Activated Carbon (PAC, SAE2 from Norit) was added on day 34 so that a concentration of 2
g/L was obtained in the SAMBR-MABR. The initial MLTSS and MLVSS were 5.2 and 3.9 g/L,
respectively.
228

Chapter 8. CONTINUOUS TREATMENT OF LEACHATE IN A SAMBR-MABR
8.3 RESULTS AND DISCUSSION
8.3.1 Performance of the Hydrolytic Reactor
8.3.1.1 Introduction: During start up the suspended solids content of the leachate was still
quite high (26 g TSS/L on day 3), although it was filtered within the HR by the stainless steel
mesh followed by the nylon mesh. The TS content within the mesh of the HR was 39.1 g/L which
indicates that a rejection of suspended solids took place in the HR thanks to the macrofilters.
However, this rejection was not sufficient because a leachate containing 26 g TSS/l would have
provoked problems in the SAMBR due to the build up of suspended solids as observed in the
previous chapters. Therefore, the leachate had to be centrifuged (3000 rpm for 20 minutes)
so that the solids in suspension reached 4.7 g/L. The measurement of TSS of the leachate
after filtration on day 91 gave 21.9 g/L and the TS in the inner zone of the HR was 76g/L,
confirming again that solids in suspension were rejected by the combination of filters used in
this chapter. Unfortunately, the TSS of the leachate was not measured on a regular basis in this
study because it was not one of the objectives of this experiment, and a proper analysis of the
rejection by the macrofilter would be impossible here.
However, the levels of suspended solids in the leachate revealed that it could not be fed to the
SAMBR as such, and that a centrifugation step was therefore required to avoid the problems
encountered in the previous chapters. To avoid this costly additional pre-treatment, it would be
worth investigating the filtration of the leachate with a macrofilter in the range 0.1 - 0.2 mm which
would further decrease the levels of suspended solids in the leachate. Walker et al. (2009)
investigated the performance with 30, 100 and 140 micron coarse meshes, and observed higher
TMP for the 30 micron mesh. However, these authors still observed suspended particles (1-2
mm) larger than the pore size (100 micron), and explained it by the fact that long fibers could
pass through the mesh lengthways, possibly being pushed through by the brushing action. This
indicates that the optimum mesh size for the HR is probably in the range 30 - 100 micron.
8.3.1.2 Effect of SRT on VS Removal: The start up was characterized by high particulate COD
as shown by the large difference between the TCOD and SCOD curves in Figure 8.1, panel A.
Unfortunately, the rod of the paddle stirrer broke down on day 44 due to the grip and the torque
applied by the motor. Another paddle stirrer with one branch instead of two was used until day
71 after which the original paddle stirrer was replaced with a new rod welded in our workshop.
This will explain the sudden increase in TCOD of the leachate on day 74.
The VFA concentration did not exceeded 3 g/L which was not sufficient to make the pH drop
below 6.9. A VS removal of 71% was achieved during the first 25 days at an OLR of 4 g VS/L.day
and a SRT of 124-218 days. Similar VS was obtained between days 26 and 46 at the same OLR
but at a SRT of 70 - 94 days and a HRT between 9 and 12 days. These VS removal percentages
around 70% are similar to what was found in the previous chapter in which the SRT was 66 days
and the HRT 20 days. On day 43, the VFA concentration suddenly more than doubled to 4.8 g/L
(Panel B, Figure 8.1) which resulted in the pH dropping to about 5.5.
229

Chapter 8. CONTINUOUS TREATMENT OF LEACHATE IN A SAMBR-MABR
Figure 8.1: (A)Evolution with time of the TCOD (after centrifugation), SCOD and VFAs (asCOD) of the leachate at different HRTs and OLRs. (B) Evolution with time ofthe distribution of VFAs in the leachate. (C) Evolution with time of the pHand the ORP of the leachate from the HR. The error bars show the standarddeviation.
230

Chapter 8. CONTINUOUS TREATMENT OF LEACHATE IN A SAMBR-MABR
The concentration of VFAs and particulate COD in the leachate (Panel A, Figure 8.1) then de-
creased significantly after day 46 when the SRT was reduced from 70 to 20 days due to the
OLR being increased to 10 g VS/L.day. The extent of hydrolysis was considerably reduced at
20 days SRT compared to 70 in the HR which led to a low VS removal of 39% as can be seen
in Table 8.1. This low VS removal was clearly attributed to the reduced amount of time given to
the substrate to degrade in the HR. This resulted in less particulate COD small enough to pass
through the holes of the nylon mesh. It is also possible that the rejection of suspended solids by
the macrofilter improved due to the attachment of fibers and bacteria acting as a second filter.
The shock on day 46 also influenced the ORP potential of the leachate (Panel C, Figure 8.1).
Before day 46 the ORP was relatively low with values typical of anaerobic reactors (around -350
to -400 mV) because the SRT (70-90 days) and HRT (9-12 days) were long enough to deplete all
the oxygen present. In contrast, after day 46 when the SRT and HRT were much shorter, 20 and
4.5 days, respectively, there was less time to consume all the oxygen which resulted in ORPs
in the range -200 to -150 mV. On day 64, the SRT in the HR was further decreased to 6-7 days
while the HRT was kept at 4.5 days but this emphasized even more the importance of the SRT
on VS removal as the latter dropped further to 26%. The VFA concentration also dropped which
enabled the pH to increase to neutral. In addition, the HR had to be opened on day 72 because
the paddle within the HR had broken down, which would have decreased the CO2 content of the
headspace and resulted in the pH going above 7.
Hence, this experiment demonstrated that the SRT can not be lowered to 20 days as this results
in low VS removals. The SRT had to be reduced to avoid a build up of TS in the HR because the
OLR had been increased. This indicates that an OLR of 10 g VS/L.day was too high for the HR
because the ligno-cellulosic waste could not be solubilised fast enough. Furthermore, the drop
in the VS removal was linked to an increase in fresh water consumption because more solids
were withdrawn daily which had to be compensated for by water to keep the volume constant.
Finally, from day 87, the HR was fed daily with Kitchen Waste (460 g wet KW/day) and garden
waste (18.6 g wet GW/day), but in such an amount that the OLR was kept constant at 10 g
VS/L.day. The paper waste was omitted from the feedstock in order to increase the OLR to the
SAMBR and investigate the limit of the SAMBR in terms of OLR. The kitchen waste content of
this new feedstock became 460 g/day which should be compared to 70 g/day that was fed in the
OFMSW feedstock previously. The daily amount of garden waste (18.6 g/day) was not changed.
Figure 8.1, Panel A shows that the SCOD and VFAs levels rapidly increased after the feedstock
was changed to KW and GW, indicating that KW were readily solubilised. The pH dropped
rapidly but seems to have stabilised at 5.5 due to the low HRT that translated to a rapid removal
of the VFAs to the SAMBR and the SAMBR-MABR which prevented a further drop in pH. A
SRT of 23 days with a HRT of 2.4 were sufficient to reach 81% VS destruction (Table 8.1).
The same removal was obtained at 1.8 days HRT that was applied from day 99 until the end
of the experiment. The VFA distribution in Panel B of Figure 8.1 shows that the concentration
of fatty acids usually not found at significant concentrations such as n-valeric, n-butyric and n-
caproic acids increased to 710, 730 and 300 mg/L, respectively. This is likely to be due to the
higher amounts of long chain fatty acids normally found in food waste. This final experiment231

Chapter 8. CONTINUOUS TREATMENT OF LEACHATE IN A SAMBR-MABR
demonstrated that a high destruction rate of KW+GW could take place in the HR at a SRT of 23
days and HRT of 1.8 days with an OLR of 10 g VS/L.day.
Table 8.1: Volatile Solids removal percentages at different conditions in the hydrolyticreactor. The penultimate column is the Biochemical Methane Potential of thedigestate (standard deviation). The last column is the VS removal based onthe BMP of the solid digestate. FWC = Fresh Water Consumption.
Substrate Process Duration OLR SRTHR HRT VS rem. FWC BMP digestate VS rem.
Days (Days)gV SL.day days days % ml/day ml CH4/g VS %
OFMSW 1-25 25 4-5 124-218 9-12 71 30 88.3 (23) 64
OFMSW 26-46 20 4-5 70-94 9-12 68-71 40 66 (7) 73
OFMSW 47-63 16 10 17-20 4.5 39 250 141.7 (6) 42
OFMSW 64-85 21 10 6-7 4.5 26 580 196.7 (4) 19
KW+GW 87-106 19 10 23 1.8 81 380 432.2 (4) /
8.3.1.3 Effect of SRT on Digestate Anaerobic Biodegradability: Several BMP tests were car-
ried out on the digestate in order to investigate the residual anaerobic biodegradability of the
digestate withdrawn from the HR. The ultimate biodegradabilities are included in Table 8.1. It
is clear from the table that the SRT had a strong effect on the residual biodegradability of the
digestate. Interestingly, if the residual methane obtained from the digestate is put in parallel with
the BMP of the feedstock determined in Chapter 3, Section 3.5.2.2, the percentage that was
biodegraded and which hence does not appear in the BMP of the digestate matches relatively
well the VS removal listed in the table. For instance, the BMP of the digestate from day 26 to 46
was 66 ml CH4/g VS and since the ultimate biodegradability of the feedstock is 244 ml CH4/g VS,
it can be stated that 73% of the feedstock VS was converted to methane in the process, while
27% (=66/244) of the degradable VS was still in the digestate as shown by its BMP of 66 ml
CH4/g VS. The 73% calculated from the BMPs values (the feedstock and the digestate) matches
relatively well the VS removal of 68 - 71% that is obtained by doing a VS balance on the HR with
the amount of VS put in and withdrawn from the HR.
Thus the BMP of the digestate is another way to calculate the VS removal percentage in a
process treating organic waste. The VS removals based on the BMP of the digestate were
useful in this study to confirm the VS percentages calculated. The main difference between the
two techniques, however, is that the one using the BMP of the digestate requires the BMP of
the feedstock and provide the VS destruction on a single day only, which is the day when the
digestate was used to carry out the BMP test. In contrast, the VS balance method calculates
the VS removal considering a long period of time (about 20 days in this study) during which VS
removals can be assumed to be at steady state.
The very high BMP obtained from the digestate at the end of the run with kitchen waste as the
main substrate suggests that the digestate was contaminated with leachate high in VFAs. This
is possible since the TS content of the digestate was only around 20% after centrifugation, thus
232

Chapter 8. CONTINUOUS TREATMENT OF LEACHATE IN A SAMBR-MABR
still containing 80% by weight of process liquid. Another reason might be that some feedstock
spent less time than the SRT in the HR due to short-circuiting to the outer zone of the HR where
it was then pumped to be centrifuged. The solid residue after centrifugation was then taken
as the digestate. The VS removal based on the BMP of the digestate during the period where
kitchen waste was fed (last row and last colum of Table 8.1) could not be calculated because
the digestate BMP was greater than the BMP of KW found in Materials and Methods (357 ml
CH4/g VS). This is clearly impossible and confirms that the digestate taken during that period
was contaminated with fresh substrate and possibly leachate containing VFAs.
8.3.1.4 Effect of SRT on Digestate Respiration Rate: Throughout the run, the digestate taken
from the HR was assessed in terms of stability. Its respiration rate was measured as described
in Section 3.3.12 in the Materials and Methods. Figure 8.2 shows that at 4 g VS/L.day and with
a retention time greater than 70 days, all the digestate emitted carbon dioxide at a rate lower
than 25 mg CO2 g VS-1.d-1 after 3 days of aeration. Some digestates were even below the 16
mg CO2 g VS-1.d-1(Horizontal line) recommended for a stable compost according to the British
standard BSI PAS 100:2005 (WRAP, 2005).
Figure 8.2: Effect of SRT on the respiration rate of the digestate taken at different timesduring the treatment of OFMSW in the HR. The different symbols show thedifferent periods of aeration of one digestate. The error bars indicate thestandard deviation. The error bars were omitted when they were smaller thanthe marker.
In contrast, when the SRT was less than 20 days due to an increase in the OLR to 10 g VS/L.day,
all the digestates displayed a respiration rate greater than 25 after three days of aeration, and
even greater than 30 mg CO2 g VS-1.d-1 when the SRT dropped to 6 - 7 days. These higher
respirometric activities were associated with lower VS removal in the HR at these SRTs. Further-
more, after 15 to 24 days of aeration all the samples were below the limit of stability, suggesting
233

Chapter 8. CONTINUOUS TREATMENT OF LEACHATE IN A SAMBR-MABR
that after 2-3 weeks of aeration, the digestate will be below the limit even when the VS removal
was low in the HR.
Eventually, after day 86 the HR was fed at 10 g VS/L.day of mainly kitchen waste and the conse-
quences on the digestate were quite surprising. Although the HR achieved more than 80% VS
removal in 23 days retention time which is normal for this type of waste, the digestate was sig-
nificantly more active in terms of respiration rate. The measurement after three days of aeration
actually failed because it went over the measuring range of the Oxitop controller. However, the
respiration rate after 3 days aeration could be evaluated between 45 and 70 mg CO2 g VS-1.d-1.
The respiration rates after 15-24 days (triangles in Figure 8.2) also showed a very high micro-
bial activity with values around 50 - 60 mg CO2 g VS-1.d-1. Then after 28 - 47 days of aeration
they decreased to values between 15 and 20 mg CO2 g VS-1.d-1, thus not considered as stable
yet. This suggests that there might have been easily degradable substrate remaining after 23
days retention time in the HR, or that some of the feedstock was short-circuiting and appeared
in the digestate after less than 23 days retention time. Since the digestate was dewatered to
approximately 20% TS, it is possible that the high activity was due to the remaining leachate in
the digestate which still contained significant amounts of VFAs and easily degradable substrates
due to insufficient dewatering of the digestate. This remaining leachate in the digestate might not
be significant when the substrate was the OFMSW, but it could have been when the feedstock
was changed to kitchen waste. Thus, to ensure normal metabolic activity of the digestate, it is
recommended firstly to make sure that the feedstock is not short-circuiting and indeed remains
in the digester for the period of time defined by the SRT and secondly, the digestate should be
dewatered to much higher TS content than these reached in this study.
8.3.1.5 Effect of TS percentage on Digestate Activity: The method used in this study relies on
the fact that the maximum activity of the digestate is expressed at a moisture content between
40 and 60%. However, during the course of the respirometric test, the water evaporates in the
bottle kept at 30 ˚ C. In order to investigate the extent of the evaporation during the test, the TS of
the digestate was measured before and after the respirometric test. The moisture content was
60.7 and 45.4% before and after the test, respectively, which shows that a 15% loss in moisture
occurred though the 4 days of the test. However, even at the end of the test the moisture content
remained in the optimum range. Hence, it can be stated that the moisture content will remain
valid through the test inasmuch as the initial moisture is relatively close to the upper value of the
range.
In order to gain more insight into the influence of the TS content, additional tests were carried
out using the same digestate but with a different TS content. Two different samples were used,
namely the digestates taken from the HR on days 74 and 85. The samples were moistened with
different amount of tap water and left to equilibrate for 3 days before the respirometric activity
was measured. The carbon dioxide emission rate is shown in Figure 8.3, and it can be seen that
TS content in the range 27 - 43% gave similar results. These TS values correspond to moisture
contents in the range 57 - 73%. Hence the results demonstrate that the respiration rate was
similar for moisture content in the range 57 - 73%.234

Chapter 8. CONTINUOUS TREATMENT OF LEACHATE IN A SAMBR-MABR
Figure 8.3: Effect of the TS content on the respiration rate of the digestate from the HR.The error bars show the standard deviation.
In contrast, when the moisture content was 40% and less (TS ≥ 60%), the microbial activity was
significantly lower. This is due to the sample being too dry and some zones of the samples might
not be wetted at all resulting in less available carbon for growth and metabolic activity. Digestates
that have a moisture content below 30-35% may be biologically dormant (WRAP, 2005).
8.3.1.6 Effect of SRT on the Heavy Metals content of the Digestate: Although several stud-
ies have shown that the use of stabilized MSW residues from a variety of processes (primarily,
composting) in agriculture has many benefits to soil, crops and the environment (Prabpai et al.,
2009), concerns still persist regarding their content of potentially hazardous heavy metals. If
excessive loads of pollutants are introduced with the application of low-quality waste, soil fertility
may be adversely affected, ground-water quality threatened, and the food chain contaminated
(McBridge, 1995). Among the elements, the most important to consider in terms of food chain
contamination are As, Cd, Hg and Pb. Simultaneously, some micronutrient elements (e.g., Cu,
Cr, Ni, Zn) may be toxic to both plants and animals at high concentration (McLaughlin et al.,
1999). The bioavailability to plants of heavy metals depends on a number of physical and chem-
ical factors in the soil. These include soil properties, e.g., pH, organic matter content, redox
potential, cation exchange capacity (CEC), sulphate, carbonate, hydroxide, soil texture and clay
content (Prabpai et al., 2009). Apart from these factors, metal absorption by plants is influenced
by the characteristics of the plants themselves which are complicated and not clearly understood.
It is likely that contaminants such as heavy metals will remain in the waste unless leached out.
More than 99.9% of metals are reported as still found in the residual solids of landfill (Bozkurt et
al., 1999). The heavy metals (HM) content of the digestate is an important criterion to assess
the quality of compost. Compost can be mature according to various legislation, but if the HM
content is too high it will be rejected as a fertilizer because heavy metals can accumulate in the235

Chapter 8. CONTINUOUS TREATMENT OF LEACHATE IN A SAMBR-MABR
soil and aquifers.
For the sake of completeness, the limit for mercury is also given in Table 8.2 although it was
not analyzed in this study. The table puts in parallel the SRT, the VS removal percentages, the
fresh water consumption rate and the OLR with the HM of the digestate as these factors were
considered to be the main ones influencing HM concentrations. The longer the SRT, the lower
the concentration of HM in the digestate should be because of the greater extent of hydrolysis
and solubilisation of heavy metals in the liquid fraction followed by the precipitation as sulfide if
S−− is present in the reactor.
Table 8.2: Heavy metals content of the digestate from the HR under various SRTs andfresh water consumption rates (F.W.C), and comparison with the compliancecriteria for compost and stabilised biowaste established by the EuropeanCommission (EC) and the British Standard Institution (BSI). The standard de-viation is given in brackets. ND = not determined.
HR conditions and performances Compliance criteria
Period 1-25 26-46 47-63 64-85 87-106
VS 71 68-71 39 26 81rem.
FWC 30 40 240 580 380 EC BSI
SRT 124-218 70-94 17-20 6-7 23 Class I Class II Biowaste
Metals Concentration (mg/kg dry matter)
Zn 77.9(2) 72.4(0.9) 65.6(1) 38.2(3) 76.9(2) 200 400 1500 400
Pb 15(4) 11.5(6) 13.4(4) 5.3(4) 4.9(6) 100 150 500 200
Cd 0(0.04) 0(0.04) 0(0.04) 0(0.04) 0(0.04) 0.7 1.5 5 1.5
Ni 50(0.6) 61.2(3) 58.2(0.9) 22.8(0.7) 49.8(1) 50 75 150 50
Cu 54.9(0.9) 48.3(2) 46.2(0.8) 30(0.4) 25.1(0.4) 100 150 600 200
Cr 187.6(4) 162.2(9) 203.4(2) 77(1) 118.6(4) 100 150 600 100
Hg ND ND ND ND ND 0.5 1 5 1
It was expected to find significantly greater HM concentrations at 10 g VS/L.day than at 4 g
VS/L.day but this was not observed. It was even found that the zinc and copper content de-
creased as the SRT decreases and the OLR increased (Table 8.2). The lower concentration is
likely to be the result of dilution caused by the greater fresh water consumption at lower SRT.
It was observed that the Zn, Pb, Cd and Cu contents were below the compliance criteria of the
Class I compost defined by the European Commission (Commission, 2001). According to the
European Commission, ”compost or digestate of Class I shall be used according to the best
agronomic practice without any specific restriction”. However, the Ni content was equal or above
50 mg/kg dry matter (dm) in 4 out of the 5 samples tested which means that it should be clas-
sified as a digestate of Class II. According to the European Commission (Commission, 2001),
”Compost or digestate of Class II shall be used in quantity not exceeding 30 tonnes dry matter
per hectare on a three-year average”. Nevertheless, the chromium content being above 100
mg/kg dry matter (dm) in 4 out of the 5 samples tested, the digestates obtained in this study236

Chapter 8. CONTINUOUS TREATMENT OF LEACHATE IN A SAMBR-MABR
should be rather defined as a ”Biowaste” according to the criterion given by the European Com-
mission: ”the stabilized Biowaste can be used as a component of an artificial soil or in those
land applications that are not destined to food or fodder crops production (such as final landfill
cover, landscape restoration in old and disused mines, anti-noise barriers, road construction,
golf course, etc.)”. The criteria given by the BSI are the minimum qualities that the compost
must fulfil for general use such as soil improver, mulch, growing medium, turf dressing, topsoil,
etc. Given the values of nickel and chromium in this study, the digestate can not be used as
compost as defined by the BSI.
Nonetheless, it is believed that the high Ni and Cr contents are due to the paddle stirrer that
broke down during this study. The paddle was made of stainless steel thus containing nickel and
chromium and the rod of the paddle was continuously spoiled due to the grip of the rotor so that
the thickness of the rod decreased over time and eventually broke on day 44. Another paddle
stirrer with one branch instead of two was used until day 71 after which the original paddle stirrer
was replaced with a new rod welded in our workshop. It is possible that some chromium and
nickel leached from the stainless steel and that a small amount was solubilised in the leachate
after long periods of time and hence appeared in the digestate.
Moreover, the HM analysis carried out in the previous chapter (Section 7.3.3) on the digestate
obtained at the same OLR of 4 gVS/L.day and similar SRT of 66 days revealed that the nickel and
chromium levels were 4.6 and 20.2 mg/kg dm, respectively, which suggests that the increased
concentrations observed in this chapter could be the result of the gradual attrition of the stainless
steel with time. Moreover, the comparison with the heavy metal content of the feedstock (Table
3.8 in Chapter 3) revealed that such high values of Ni and Cr were impossible given the initial
content of the feedstock that was found to be circa 4 mg/kg dm. This strengthens the hypothesis
of an external source. The Zn content was found to decrease tenfold compared to the feedstock
content presumably due to solubilisation, whereas the copper content remained similar, i.e. circa
50 mg/kg dm. The Cadmium content dropped from 2 mg/kg dm in the feedstock to 0 in the
digestate.
From this study, it could not be demonstrated that the digestate produced after anaerobic diges-
tion of the OFMSW can be used as compost because of the high levels of nickel and chromium
that excludes our compost from the Class I and the BSI criteria. Further tests should be carried
out to confirm that these metals originate from the stainless steel paddle stirrer rather than from
the OFMSW.
8.3.2 Formation and Performance of a Nitrifying Biofilm
In conventional biofilm reactors, nitrifying organisms may be excluded from the oxic layer due
to the faster growths of heterotrophs (Casey et al., 1999). As a result, substantial nitrification
only occurs when the carbon substrate loading rate of the wastewater is low. Therefore, prior
to starting the SAMBR-MABR, a biofilm of nitrifiers was first grown on a Kubota membrane in
an aerated reactor in batch mode at 30 ˚ C with a synthetic ammonia wastewater. To inoculate
the aerobic reactor, an aerobic population of nitrifiers from the AMBR in the previous chapter
237

Chapter 8. CONTINUOUS TREATMENT OF LEACHATE IN A SAMBR-MABR
(Chapter 7) was used.
A synthetic feed was used based on Gong’s recipe (2008) and is shown in Table 8.3 and contains
200 mg nitrogen in the form of ammonium chloride. Before feeding the pH was adjusted to 7.6
- 7.8 with NaHCO3 because this pH range is commonly cited as the optimum pH for nitrifiers
(Hagopian and Riley, 1998). No organic substrate was added to favor the growth of autotrophic
AOB (Feng et al., 2007).
Table 8.3: Synthetic ammonia wastewater used in this study to grow autotrophic nitri-fiers on the Kubota membrane.
Amount for 1L feed Chemical
0.76 g NH4Cl
0.211 g KH2PO4
0.995 g NaHPO4
0.3 g CaCl2.2H2O
0.2 g MgSO4.7H2O
1.25 mL trace elements solution
Amount for 1L trace element solution Chemical
15 g EDTA
0.43 g ZnSO4.7H2O
0.24 g CoCl2.6H2O
0.99 g MnCl2.4H2O
0.25 g CuSO4.5H2O
0.22 g NaMoO4.2H2O
0.19 g NiCl2.6H2O
0.014 g H3BO3
0.05 g NaWO4.2H2O
The reactor was run in batch mode with the biomass in suspension mixed by air sparged from the
diffuser at the bottom, and the permeate from the membrane was recycled into the reactor. The
flux was set at the maximum in order to operate over the critical flux and thereby grow a biofilm
onto the membrane relatively quickly. Over 15 days the ammonium nitrogen was measured daily,
and a new synthetic feed was prepared when the ammonia had been consumed. A typical curve
(Curve A) of ammonia degradation over time with biomass in suspension is shown in Figure 8.4.
Nitrifiers are well known for their proclivity to excrete extracellular polymers and embed in a
slime matrix. This lipopolysaccharide coating allows for adhesion by lending stability to a mi-
crobial biofilm (Hagopian and Riley, 1998). After 15 days a dark brown biofilm could be seen
on the membrane. The permeate recirculation was then stopped and the residual biomass in
suspension was removed and replaced by the synthetic feed. The biofilm was then fed with the
same synthetic wastewater for one month and curves B, C and D in Figure 8.4 were obtained at
different initial concentrations of ammonia nitrogen. The large degree of variation between the238

Chapter 8. CONTINUOUS TREATMENT OF LEACHATE IN A SAMBR-MABR
Figure 8.4: Evolution of the ammonia-nitrogen concentration vs time during several testson a nitrifying biofilm grown on a Kubota membrane.
three curves is due to initial disturbances such as pH and initial ammonia concentrations that
precluded exact replication. It is also possible that some biomass was sloughed from the biofilm
during the batch and was removed when a new synthetic solution was fed. Nonetheless, these
three curves show that the nitrifiers attached on the membrane could use the dissolved oxygen in
the bulk to degrade ammonia. The decrease in ammonia was correlated by an increase in nitrate
concentration (data not shown), and a temporary build up of nitrite was sometimes observed.
Regarding the kinetics, the maximum ammonia removal rate was obtained with Curve C at 50
mg NH+4 -N.m-2.h-1. This is similar to the nitrification rate obtained by Brindle and Stephenson
(1996), but with 30-50 mg NH+4 /l in the synthetic wastewater. The rate of ammonia oxidation
depends strongly on substrate concentrations. For instance, a trickling filter supplied with 2 mg
NH+4 -N.l-1 and air had a maximum ammoniacal-nitrogen removal rate of 18 mg.m-2.h-1 (van Rijn
and Rivera, 1990), while another with levels of 80 mg NH+4 -N.l-1 and pure oxygen achieved 500
mg.m-2.h-1 (Siegrist and Gujer, 1987). Yamagiwa et al. (1998) reported that nitrification rates in
conventional biofilm processes were in the range 20 - 60 mg.m-2.h-1.
After one month with air sparging for mixing and oxygen supply the next test consisted in sparg-
ing the bulk with nitrogen and pressurising the lumen of the Kubota membrane with pure oxygen
in order to determine whether the biofilm could utilize molecular oxygen supplied through the
membrane pores. Curve E (Figure 8.4) shows the kinetic of ammonia degradation under these
conditions. It can be seen that the degradation rate is slower compared to oxygen supplied from
the bulk. Nevertheless, the dissolved oxygen was zero after 13 and 40 hours which shows that
the decrease in ammonia was due to oxygen uptake from the membrane lumen. However, the
nitrification rate was found to be only 11 mg NH+4 -N.m-2.h-1 which is much lower than some val-
ues reported in the literature such as 210 mg NH+4 -N.m-2.h-1 achieved by a biofilter fed at 50 mg
239

Chapter 8. CONTINUOUS TREATMENT OF LEACHATE IN A SAMBR-MABR
NH+4 -N.l-1 (Hagopian, 1995). After six months their kinetics became 1450 mg .m-2.h-1 which was
due to a seven-fold increase in biomass under non competitive, undisturbed conditions. Brindle
et al. (1998) obtained a specific nitrification rate of 225 mg .m-2.h-1 in a MABR.
When the units are normalized to the surface area of an inert attachment media (i.e. mg.m-2.h-1)
what is being measured is actually an empirical, diffusional limitation (Tanaka and Dunn, 1982),
and the lower value obtained in this preliminary study suggests that there was a strong diffusional
limitation possibly due to the high degree of compaction of our biofilm. Molecular diffusion and
electrostatic ion interactions act across concentration gradients in biofilms, bringing a spatially
and temporally non-uniform medium to buried cells. The gradient profile is a function of, among
other things, thickness, composition and velocity of the water over the biofilm (Hagopian and
Riley, 1998).
Eventually, for the last test (Curve F), one liter was removed from the reactor at the end of the
previous test (Curve E) and one liter of leachate from the HR containing ammonia was fed. The
reactor bulk was then flushed with nitrogen for five minutes and then the headspace gas was
used to mix the bulk in order to turn slowly to anaerobic conditions. The initial ammonia nitrogen
concentration was 150 mg/L and it decreased to 25 mg/L in 88 hours with nitrite and nitrate
remaining below 20 mg/L which meant that ammonia in the leachate could be degraded and
that denitrification occurred as well thanks to the COD present in the leachate. The ORP was
found to be between -23 and -57 mV during this last test indicating that anoxic conditions were
predominating, presumably due to nitrite and nitrate found at concentrations below 20 mg/L.
Since nitrification and denitrification took place in the biofilm attached on the aerated membrane
as indicated during the aforementioned batch tests, it was decided to remove the membrane with
the biofilm and incorporate it into a SAMBR with a new Kubota membrane dedicated to permeate
extraction. The aerated membrane was pressurized by connecting the Kubota membrane to
pure oxygen. The intramembrane pressure was set at 10 mbar using a pressure regulator.
The oxygen was allowed to bubble through water in a flask placed before the SAMBR-MABR in
order to saturate the gas with water vapour and thereby avoid condensation within the Kubota
membrane.
8.3.3 Performance of the SAMBR-MABR
The SAMBR-MABR was fed with centrifuged leachate from the HR from day 34 onwards. The
initial HRT was set at 19 days to allow some time for the nitrifiers to acclimatise to the continuous
feeding of leachate. Although it can be seen from Figure 8.5, Panel A that the SCOD removal
was over 90%, the ammonia kept increasing in the effluent of the SAMBR-MABR and no ammo-
nia degradation was observed even when it was in batch mode from day 39 to 45. The feeding
resumed on day 46 at a HRT of 13.8 days, but as nitrite and nitrate were not detected it was
assumed that the degradation of ammonia in the SAMBR-MABR was a failure.
Possible causes are numerous; inhibition of AOB by free ammonia (FA) can occur at concen-
trations as low as 10 mg/L (Anthonisen et al., 1976), but many researchers consider that the
inhibitory level should be close to 100 - 150 mg.L-1 (Speece, 1996; Gallert and Winter, 1997;240

Chapter 8. CONTINUOUS TREATMENT OF LEACHATE IN A SAMBR-MABR
Figure 8.5: Panel A : Evolution of the SCOD, acetate and propionate concentration inthe bulk of the SAMBR-MABR (left axis), and the SCOD removal percentage(right axis) under various HRTs and temperatures. Panel B: Evolution of theammonia-nitrogen and nitrite-nitrogen in the HR and SAMBR-MABR effluents.Panel C: Evolution of the flux and pH (left axis) and the ORP (right axis) in theSAMBR-MABR. The error bars show the standard deviation.
241
Chapter 8. CONTINUOUS TREATMENT OF LEACHATE IN A SAMBR-MABR
Han and Shin, 2004). In this study FA never exceeded 11 and 10 mg/L on days 41 and 78, re-
spectively. Therefore, inhibition by FA was not plausible. The biofilm developed might have had a
low cell density due to its rapid formation. The biofilm was created in batch mode and might not
be acclimatised to continuous feeding due to a higher F/M ratio. The pH in the SAMBR-MABR
was not controlled and was in the range 6.9 - 7 while the optimum pH for nitrifiers is known to
be in the range 7.6 - 7.8 (Brindle et al., 1998; Hagopian and Riley, 1998). On day 39 two grams
of NaHCO3 were added and the pH reached 8 on day 41 and then circa 7.3 on day 43, and
thereafter, but no changes were observed.
The mass transfer of ammonia through the layers of the biofilm might have been poor. In order to
be degraded, ammonia must diffuse through the biofilm to reach the layer of autotrophic nitrifiers
that have direct access to the molecular oxygen from the membrane pores. If ammonia can not
diffuse through the biofilm because it is compacted, the nitrification reaction will be ammonia-
limited and nitrification will not occur. This can happen when the biofilm concentration exceeds
10 g m-2 (Brindle et al., 1998), or when biofilm thickness exceeds 1000-3000 microns (Casey et
al., 2000a; Hu et al., 2008), but these parameters were not measured in this study. Furthermore,
nitrifying biofilms are heavily overgrown by heterotrophs, and pH and oxygen concentration gra-
dient problems are exacerbated (Hagopian and Riley, 1998). As ammonia must diffuse through
the layers to reach the autotrophic nitrifiers, it is possible that the heterotrophic bacteria in the
outer layers of the biofilm consume all mineral nitrogen present for assimilation in cell material
(Verhagen and Laanbroek, 1991). This will depend upon the C/N ratio and there is a critical C/N
ratio at which all the ammonia will be consumed by heterotrophic bacteria. At a C/N ratio below
the critical value, heterotrophs will be carbon limited and the surplus of ammonium is available
for nitrification. The compaction of the biofilm may be important in this study as the biofilm
was created under high recycle flux through the membrane. Biofilm thickness and/or density is
known to contribute an increased resistance to mass transfer near the membrane surface, and
may lead to decreased gas fluxes (Shanahan and Semmens, 2006).
One problem observed was the increased pressure in the headspace due to the formation of
biogas which in turn applied pressure on the aerated membrane such that some bulk liquid
was observed in the lumen of the aerated membrane on a few occasions. Although the oxygen
intramembrane pressure was increased to 75 mbar on day 73, and then to its maximum (140
mbar) on day 91, water was still seen in the lumen side. This would mean that the oxygen
had to diffuse through the water before it could be used by the nitrifiers on the biofilm which
would have translated to an oxygen-limited nitrification, hence explaining why ammonia was
not converted. Moreover, as the biofilm thickness was expecting to increase over time, the
intramembrane pressure increase on day 73 and 91 were likely to be insufficient.
In their MABR, Gong et al. (Gong et al., 2008) obtained nitrification by applying an intramem-
brane oxygen pressure in the range 150 - 400 mbar in a dead-end hollow fiber, thus ten times
greater than in our study. Similarly, Hu et al. (2008) and Terada et al. (2003) applied an in-
tramembrane pressure of 300 and 200 mbar,respectively. These authors treated low strength
wasterwater thus producing little amounts of biogas. In our system, the pressure in the headspace
generated by biogas production from high strength wastewater could not counteract the oxygen242
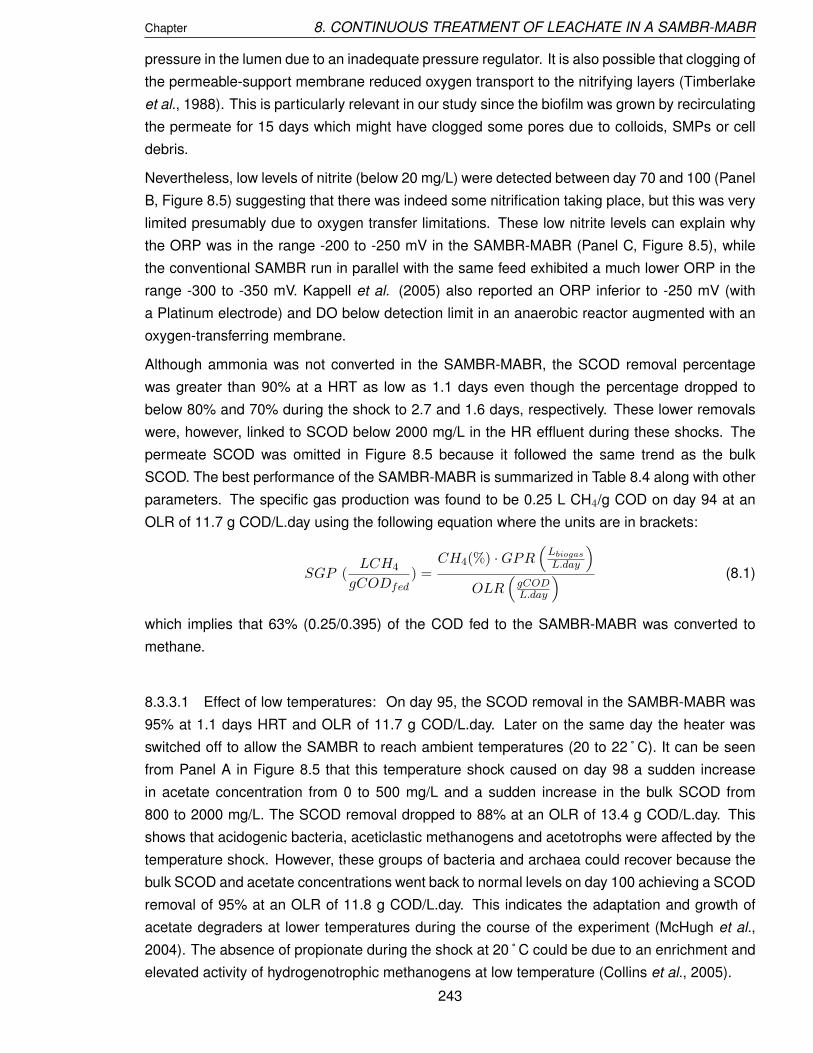
Chapter 8. CONTINUOUS TREATMENT OF LEACHATE IN A SAMBR-MABR
pressure in the lumen due to an inadequate pressure regulator. It is also possible that clogging of
the permeable-support membrane reduced oxygen transport to the nitrifying layers (Timberlake
et al., 1988). This is particularly relevant in our study since the biofilm was grown by recirculating
the permeate for 15 days which might have clogged some pores due to colloids, SMPs or cell
debris.
Nevertheless, low levels of nitrite (below 20 mg/L) were detected between day 70 and 100 (Panel
B, Figure 8.5) suggesting that there was indeed some nitrification taking place, but this was very
limited presumably due to oxygen transfer limitations. These low nitrite levels can explain why
the ORP was in the range -200 to -250 mV in the SAMBR-MABR (Panel C, Figure 8.5), while
the conventional SAMBR run in parallel with the same feed exhibited a much lower ORP in the
range -300 to -350 mV. Kappell et al. (2005) also reported an ORP inferior to -250 mV (with
a Platinum electrode) and DO below detection limit in an anaerobic reactor augmented with an
oxygen-transferring membrane.
Although ammonia was not converted in the SAMBR-MABR, the SCOD removal percentage
was greater than 90% at a HRT as low as 1.1 days even though the percentage dropped to
below 80% and 70% during the shock to 2.7 and 1.6 days, respectively. These lower removals
were, however, linked to SCOD below 2000 mg/L in the HR effluent during these shocks. The
permeate SCOD was omitted in Figure 8.5 because it followed the same trend as the bulk
SCOD. The best performance of the SAMBR-MABR is summarized in Table 8.4 along with other
parameters. The specific gas production was found to be 0.25 L CH4/g COD on day 94 at an
OLR of 11.7 g COD/L.day using the following equation where the units are in brackets:
SGP (LCH4
gCODfed) =
CH4(%) ·GPR(
Lbiogas
L.day
)
OLR(
gCODL.day
) (8.1)
which implies that 63% (0.25/0.395) of the COD fed to the SAMBR-MABR was converted to
methane.
8.3.3.1 Effect of low temperatures: On day 95, the SCOD removal in the SAMBR-MABR was
95% at 1.1 days HRT and OLR of 11.7 g COD/L.day. Later on the same day the heater was
switched off to allow the SAMBR to reach ambient temperatures (20 to 22 ˚ C). It can be seen
from Panel A in Figure 8.5 that this temperature shock caused on day 98 a sudden increase
in acetate concentration from 0 to 500 mg/L and a sudden increase in the bulk SCOD from
800 to 2000 mg/L. The SCOD removal dropped to 88% at an OLR of 13.4 g COD/L.day. This
shows that acidogenic bacteria, aceticlastic methanogens and acetotrophs were affected by the
temperature shock. However, these groups of bacteria and archaea could recover because the
bulk SCOD and acetate concentrations went back to normal levels on day 100 achieving a SCOD
removal of 95% at an OLR of 11.8 g COD/L.day. This indicates the adaptation and growth of
acetate degraders at lower temperatures during the course of the experiment (McHugh et al.,
2004). The absence of propionate during the shock at 20 ˚ C could be due to an enrichment and
elevated activity of hydrogenotrophic methanogens at low temperature (Collins et al., 2005).
243

Chapter 8. CONTINUOUS TREATMENT OF LEACHATE IN A SAMBR-MABR
Table 8.4: Comparison of the best performance obtained in the SAMBR-MABR and theconventional SAMBR at 35 ˚ C. GPR = Gas Production Rate, SGP = SpecificGas Production.
Parameter SAMBR-MABR Conventional SAMBR
SRT (days 300 30-50
HRT (days) 1.1 1.5
SCOD removal (%) 95.5 95.2
OLR (gCODL.day ) 11.7 8
MLTSS (g/L) 10.2 15
MLVSS (g/L) 7.2 9.5
ORP (mV) -200...-250 -300...-350
CH4 (%) 62.8-70.5 63.9-72.6
GPR (lbiogas/l.day) 4.5 2.8
SGP (l CH4)/g CODfed) 0.25 0.24-0.28
The specific gas production then became 0.14-0.16 L CH4/g COD compared to a value of 0.25
at 35 ˚ C. Moreover, the gas production rate (GPR) dropped from 4.5 L biogas/L.day at 35 ˚ C
to 2.4-3 at 20 ˚ C. This shows that some of the particulate COD fed could not be hydrolyzed at
20 ˚ C to be converted to methane.
Then on day 100, the temperature was further decreased to 10 ˚ C using a chiller (Model RC400,
Grant). This caused an immediate rise in bulk SCOD, acetate and propionate concentrations.
Akram (2006) also observed that acetate and propionate were the dominant VFAs when a shock
to 15 ˚ C took place. Other VFAs such as n-butyric, n-valeric and n-caproic acids also increased
to maximum of 140 mg/L (data no shown). This shows that this time the acetogenic bacteria in
charge of degrading the VFAs into acetate were also affected in addition to acidogenic bacteria,
acetotrophs and aceticlastic methanogens. This is consistent with Nachaiyasit and Stuckey
(1997) who observed that acetogens and methanogens were the most affected groups.
Furthermore, the rise in VFAs was accompanied by a drop in pH to 6.6 on day 105 and a drop in
flux from 4.5 to 0.4 LMH (Panel C, Figure 8.5) due to the build up of SCOD in the bulk. Harada et
al. (1995) stated that soluble organics were the primary factor that determined the formation of
a gel layer and thus flux decline, and not the MLTSS. In our study the MLTSS remained around
10-11 g/l after day 90 while the bulk SCOD increased several fold which supports Harada’s
observations. As a result of the temperature drop the SCOD removal percentage dropped to 44%
at an OLR of 14.1 g COD/L.day on day 106 and the specific gas production dropped to 0.015
l CH4/g COD which is a ten-fold reduction from 20 to 10 ˚ C emphasizing the lower metabolic
activity at 10 ˚ C. It is known that psychrophilic temperatures can decrease the number of viable
microorganisms in addition to the reaction rate of biomass (Tian et al., 1994). This can result
in poor performance in cases where mesophilic bacteria do not grow well under psychrophilic
temperatures.
244
Chapter 8. CONTINUOUS TREATMENT OF LEACHATE IN A SAMBR-MABR
After day 106 the feeding was stopped and in batch mode, the SCOD and VFAs levels decreased
showing that the anaerobic degradation of leachate at 10 ˚ C was possible, but at a lower rate.
From days 106 to 113 when the SAMBR-MABR was run in batch mode, the acetate concentra-
tion decreased from 2180 to 680 mg/L (-1500 mg/L) in 7 days whereas the propionate degra-
dation rate was only 83 mg/L in 7 days demonstrating the lower degradation rate of propionate
at 10 ˚ C. This is in line with Langenhoff and Stuckey (2000) who stated that propionate degrad-
ing bacteria are more affected by temperature than the acetate degrading archaea in the long
term. Propionate degradation has also been identified as the rate-limiting step in psychrophilic
anaerobic digestion (Collins et al., 2003), particularly during acetate build-up. Connaughton et
al. (2006) have observed that a change in the ratio of acetate and propionate correlated with
a shift in the archaeal and bacterial community structure within an EGSB-AF. This persistently
high acetate and propionate levels at low temperature, even after long periods, has been ob-
served before (Matsushige et al., 1990; Akram, 2006). This is due to the Ks for acetate and
propionate that increases dramatically at low temperatures, and hence there is a certain mini-
mum concentration below which the acetate and propionate cannot go (Lawrence and McCarty,
1970). There is also the fact that the maximum specific substrate utilization rate (U ), maximum
microbial growth rate (µmax) and the bacterial decay rate constant (kd) decrease with decreas-
ing temperature in accordance with the Arrhenius equation. The increase in Ks and decrease
in µmax results in a decline in the rate of reaction according to Monod’s kinetics, and caused the
appearance of individual VFAs inside the SAMBR-MABR.
Moreover, the decrease in bulk SCOD in batch mode gave rise to an increase in flux from 0.4
on day 105 to 1.1 LMH on day 113 demonstrating that the flux drop due to high bulk SCOD was
partly reversible. It can be seen in Panel C of Figure 8.5 that the flux was strongly influenced by
the temperature. This is in line with Jin et al. (2009) who treated brackish water with RO and
observed that colloids had a dramatically greater size at 15 ˚ C and it resulted in dramatically
higher cake layer specific resistances such that observed flux decline was more severe at 15
than at 35 ˚ C.
8.3.4 Performance of the Conventional SAMBR
The conventional SAMBR was started up from day 1 at a HRT of 3.7 - 4.6 days. Figure 8.6, Panel
A shows that the start up at this HRT was successful in terms of VFA removal, but nevertheless
a temporary SCOD build up occurred in the bulk probably due to the fact that the inoculum
was left dormant for two months and needed some time to ”wake up”. Moreover, the addition
of Powdered Activated Carbon (PAC, SAE2 from Norit) on day 21 did help to reduce the bulk
SCOD during the start up. However, the effect on the permeate SCOD (Panel A) and the flux
(Panel B) was negligible.
The conventional SAMBR was operated at a SRT in the range 30-50 days and a SCOD removal
percentage between 79 and 95% was achieved at a minimum HRT of 1.5 days and an OLR
of 8 g COD/L.day. Because of this SRT, the 2 g/L PAC added during the start up is likely to
have been removed from the SAMBR, and no PAC was added after the start up to keep up
245

Chapter 8. CONTINUOUS TREATMENT OF LEACHATE IN A SAMBR-MABR
Figure 8.6: Panel A : Evolution of the SCOD, acetate and propionate concentration in thebulk and the permeate SCOD of the conventional SAMBR (left axis), and theSCOD removal percentage (right axis) under various HRTs and temperatures.Panel C: Evolution of the flux and pH (left axis) and the ORP (right axis) in theconventional SAMBR. The error bars show the standard deviation.
the PAC concentration. Unfortunately, after day 90 the flux was too low to maintain that HRT
and the SRT was further reduced. After day 95, the SCOD removal percentage was calculated
using the bulk SCOD concentration instead of the permeate SCOD. On day 95 the flux was
zero so that the HRT was equal to the SRT (1.5 days). Because of the excessively low SRT,
the conventional SAMBR did not cope with the temperature shock to 20 ˚ C, in contrast to the
SAMBR-MABR where the SRT was kept constant at 300 days. This demonstrates the benefits
of maintaining a high biomass concentration in the reactor to compensate for their low activity
at lower temperatures. The SCOD removal decreased even further when the HRT was reduced
246

Chapter 8. CONTINUOUS TREATMENT OF LEACHATE IN A SAMBR-MABR
to 1.1 days, and this was confirmed by the specific gas production falling to 0.08 l CH4/g COD
and 0.04 l CH4/g COD at 20 and 10 ˚ C, respectively. The ORP in the conventional SAMBR was
in the range -300 to -350 mV, except after day 90 where the SRT was probably too low to allow
the bacteria to consume the residual dissolved oxygen or degrade the compounds containing
oxygen in the leachate from the HR.
The best performance at 35 ˚ C in the SAMBR-MABR and the conventional SAMBR is detailed in
Table 8.4. It is clear from the table that the operation at a ORP potential in a higher range (-200
to -250 mV) did not impede methanogenesis in the SAMBR-MABR, and that similar methane
yields were obtained in both reactors. This is in line with Jenicek et al. (2008) who observed
that the presence of limited amounts of oxygen in the digester does not destroy the digestion
process .
8.3.4.1 Effect of PAC addition: In order to gain more understanding of the PAC adsorption
mechanisms a sample of the permeate of the SAMBR was extracted on the Oasis cartridge
according to the protocol described in Section 3.2.5 before and after PAC addition on day 21. In
order to let the PAC reach equilibrium, the sample after PAC addition was taken on day 23. The
abundance of the peaks detected by GC-MS were compared and an estimated removal due to
PAC adsorption is given in Table 8.5.
Table 8.5: Compounds detected in the SAMBR by GC-MS and removal percentages byPAC adsorption based on the abundance.
match % compounds % removal
78 benzophenone 100
91 phenol,2-(1-phenylethyl)- 91
94 3,5-di-tert-butyl-4-hydroxyphenylpropionic acid 51
93 Bisphenol A 85
91 1-Phenanthrenecarboxylic acid, 1,2,3,4,4a,9,10,10aoctahydro-1,4a-dimethyl-7-(1-methylethyl)- 100, methyl ester, (1R,4aS,10aR)
94 1-Phenanthrenecarboxylic acid, 1,2,3,4,4a,9,10,10a-octahydro-1,4a-dimethyl-7- 88(1-methylethyl)-, (1R,4aS,10aR)-
86 Bis (2-ethylhexyl)phthalate 76
90 7-oxodihydroabietic acid, methyl ester 73
92 Benzenamine, 4-octyl-N-(4-octylphenyl)- 65
It can be seen from the table that some compounds were completely removed by the PAC as
these were not detected on the chromatogram after PAC addition. Interestingly, 85 and 76% of
Bisphenol A and Bis (2-ethylhexyl)phthalate, respectively, could be removed by adsorption onto
PAC. The adsorbability of the compounds is a function of the hydrophobicity of the molecules;
the more hydrophobic the molecules the higher the tendency to be adsorbed onto the PAC to
decrease the surface in contact with water. Other researchers have observed the high removal247
Chapter 8. CONTINUOUS TREATMENT OF LEACHATE IN A SAMBR-MABR
(over 90%) of endocrine disrupting chemicals using activated carbon (Westerhoff et al., 2005;
Bolong et al., 2009). Furthermore, non polar compounds (log P ≥ 2) are better removed than
polar compounds.
The adsorption of Bisphenol A and Bis (2-ethylhexyl)phthalate is interesting in the SAMBR as
they are known to be non degradable anaerobically, and their concentrations were found to
increase by 12 to 15% and 180 to 280%, respectively, in the SAMBRs in Chapter 6. Their ad-
sorption onto PAC is favoured because of their high partition coefficient (log P equal to 3.4 and
8.7, respectively), meaning that they are very hydrophobic. The high removal of the phenan-
threnecarboxylic acids (100 and 88%) can be explained by their structure which is made up of 3
rings, with one being aromatic. This structure results in a very high hydrophobicity (log P = 6.3 to
6.75), and a very low solubility of about 2 mg/L. For comparison the partition coefficient log P of
ethanol is -0.2 (very hydrophilic) and benzene is 2 (hydrophobic) (source: SciFinder Scholar, val-
ues calculated using Advanced Chemistry Development (ACD/Labs) Software V9.04 for Solaris
( 1994-2009 ACD/Labs)).
It was observed in Figure 8.6 Panel A that the addition of PAC caused a decrease in the bulk
SCOD from 2380 to 1550 mg/L, but the SCOD then returned to the initial levels after 5 days
suggesting that the PAC had reached saturation and could not adsorb anything more. Zhang and
Zhou (2005) found that the adsorption capacity of activated carbon was reduced with increasing
concentration of humic acids. Moreover, the adsorption capacity of the PAC could be estimated
based on the mass SCOD adsorbed. The SCOD concentrations were 2380 and 1645 mg/L on
day 21 and 22 respectively. Since 4200 mg SCOD were fed between day 21 and 22 (SCOD
leachate = 5000 mg/L and HRT = 3.6 days) and assuming a 69% SCOD degradation (SCOD
removal on day 18), there was an additional 430 mg/L recalcitrant SCOD in the bulk. So the total
SCOD was thus 2815 mg/L and because the residual SCOD was 1645 mg/L, there was thus
1170 mg/L adsorbed onto 2g PAC/L, thus achieving 585 mg SCOD adsorbed per gram PAC.
This is much higher than the results obtained in batch studies in Chapter 9. This is probably
due to the simultaneous sorption and biodegradation of soluble organics on the PAC particles
(Pirbazari et al., 1996), and also because the SCOD concentration was higher in the continuous
system than in the batch experiment. This is because the concentration gradient decreases with
time in batch tests, whereas the concentration gradient is kept high in continuous operation.
The effect of PAC addition on the particle size distribution (PSD) of colloids in the bulk in shown in
Figure 8.7. The sample after PAC addition was taken on day 22, thus one day after PAC addition
and the samples were filtered through a 0.45 micron filter in order to see only the colloidal
fraction of the mixed liquor from the SAMBR. It can be seen that although there is a shift in
the PSD toward smaller colloids due to adsorption onto PAC, the extent of the shift is not very
significant as the error bars show. This can be due to the high concentration of colloids (SCOD
= 2380 mg/L and PAC = 2g/L) in the bulk. The high concentration of colloids and the continuous
feeding of colloids at a HRT of 4 days can explain why the effect on the PSD (Figure 8.7) and
consequently on the flux (Panel B, Figure 8.6) were negligible.
248

Chapter 8. CONTINUOUS TREATMENT OF LEACHATE IN A SAMBR-MABR
Figure 8.7: Particle size Distribution of the colloidal fraction in the SAMBR before andafter PAC addition. The error bars show the standard deviation.
8.3.5 Gas Chromatography - Mass Spectrometry
8.3.5.1 Introduction: In order to gain more insight into which molecules are recalcitrant and
accumulate in the SAMBR, and the molecules that can be degraded due to the aerated biofilm,
GC-MS analyses were carried out in the SAMBR-MABR and the conventional SAMBR. The
effect of low temperature was also investigated in order to determine which compounds build up
during the temperature shock that led to an increase in the bulk SCOD.
8.3.5.2 Compounds from the reactor and equipment: Firstly, a brand new SAMBR with new
tubing and membrane was used and operated with deionized water only for 1 week at 35 ˚ C in
order to determine which components if any leach from the reactor plastic and the tubing during
normal operation of the SAMBR. For this purpose, deionized water was fed to the SAMBR, with
permeate taken out as well. The compounds that were detected are listed in Table 8.6. The
alkanes detected are likely to come from the oils and waxes used to manufacture the pieces of
acrylic sheets (Barkston Plastics, UK) in our workshop, whereas the phthalates and phenols are
likely to come from the plastic itself.
8.3.5.3 Compounds in the HR effluent: The HR effluent was run on the GC-MS but unfortu-
nately only 100 ml of effluent could be loaded on the Oasis cartridge instead of 500 mL used
for the other samples. As a result, there were only a few peaks detected, and these are listed
in Table 8.7. The main compounds detected in the HR effluent are long chain fatty acids as
expected because kitchen waste was fed to the HR when the sample was taken (after day 87).
249

Chapter 8. CONTINUOUS TREATMENT OF LEACHATE IN A SAMBR-MABR
Table 8.6: Compounds detected in the SAMBR operating at 35 ˚ C with deionized water.
match % Compounds Formula
87 phenol, m-tert-butyl- C10H14O
87 phenol,2,6-bis(1,1-dimethylethyl)- C14H22O
98 hexadecane C16H34
97 octadecane C18H38
93 benzenepropanoic acid, 3,5-bis (1,1-dimethylethyl) C18H28O3-4-hydroxy-, methyl ester
95 Eicosane C20H42
94 dibutyl phthalate C16H22O4
83 octacosane C28H58
95 Benzamine, 4-octyl-N-(4-octylphenyl)- C28H43N
Table 8.7: Recalcitrants compounds detected by GC-MS in the effluent of the HR.
Match Retention Recalcitrants in Formula% time HR effluent
87 9.5 Octanoic acid C8H16O2
94 11.366 nonanoic acid C9H18O2
97 13.197 n-decanoic acid C10H20O2
95 26.589 hexanedioic acid, bis (2-ethylhexyl) ester C22H42O4
81 31.7 1,19-Eicosadiene C20H38
8.3.5.4 Compounds in the SAMBR-MABR: It can be seen from Table 8.8 that several com-
pounds started to build up when the SAMBR was operated at 20 ˚ C compared to 35 ˚ ; among
these, phenol,2-chloro - 4 - (1,1 - dimethylethyl), 6-tert-butyl-2, 4-dimethylphenol, Benzophe-
none, Tri(2-chloroethyl)phosphate and Benzensulfonamide, N-butyl concentrations were found
to increase at 20 ˚ C. In contrast, the concentration of 3,5-di-tert-butyl -4-hydroxyphenyl, Bisphe-
nol A and Phenanthrenecarboxylic acid all decreased at 20 ˚ C. This shows that the utilization
rate of compounds was differently affected by the drop in temperature. Nonetheless, the SCOD
removal remained over 90% at 20 ˚ C indicating that the increase or decrease in concentration
of the detected components had negligible impact on the SCOD removal.
Paradoxically, in this chapter the concentration of Bisphenol A (BPA) was observed to decrease
at 20 ˚ C and was not even detected at 10 ˚ C, while in Chapter 6 it was observed that BPA built up
in the SAMBR and then was degraded in the AMBR. The reason for this is not clear since BPA is
known to be non degradable in landfills, and is often found at ppm levels (Yasuhara et al., 1999).
However, a possible explanation could be that some bacteria managed to mutate and become
able to degrade Bisphenol A because the inoculum used to start up the new experiment in this
chapter was obtained from the previous run. Ogawa et al. (2005) found that BPA at an initial
concentration in the range 0.05 - 10 µg/L could be biodegraded anaerobically in 30 days at 9-
250

Chapter 8. CONTINUOUS TREATMENT OF LEACHATE IN A SAMBR-MABR
Table 8.8: Recalcitrant compounds detected by GC-MS in the permeate of the SAMBR-MABR at different temperatures. The percentage of increase or decrease iscalculated based on the area of the peaks. ND = not detected.
Match Ret. Recalcitrants in Formula 35 ˚ C 20 ˚ C 10 ˚ C% time the SAMBR-MABR +7 days
batch
87 11.41 nonanoic acid C9H18O2 ND ND from HR
96 11.72 phenol,2-chloro-4- C10H13ClO +260% ND(1,1-dimethylethyl)
97 13.03 n-decanoic acid C10H20O2 ND ND from HR
90 15.3 6-tert-butyl-2,4-dimethylphenol C12H18O +0% ND
91 17.7 Benzophenone C13H10O +25% ND
91 19.62 2H-pyran-2-one,6-heptyltetrahydro C12H24O ND ND
91 19.63 Tri(2-chloroethyl)phosphate C6H12Cl3O4P +46% ND
94 20.61 Benzensulfonamide, N-butyl C10H15NO2S +22% -15%
95 21.71 3,5-di-tert-butyl-4-hydroxyphenyl C17H26O3 -6% NDpropionic acid
78 21.91 phthalic acid, butyl 4-octyl ester C19H20O4 ND ND
97 24.39 Bisphenol A C15H16O2 -19% ND
86 26.59 hexanedioic acid, C22H42O4 ND NDbis(2-ethylhexyl) ester
94 26.59 hexanedioic acid C6H10O4 ND -57%
1-Phenanthrenecarboxylic acid,1,2,3,99 27.58 4,4a,9,10,10a-octahydro-1,4a-dimethyl- C20H28O2 -92% ND
7-(1-methylethyl)-,(1R,4aS,10aR)-
83 31.64 1,19-Eicosadiene C20H38 ND ND from HR
99 35.28 hexadecanoic acid, C32H64O2 ND NDhexadecyl ester
22 ˚ C. The aerobic biodegradation, on the other hand, took only 72 hours. Another reason could
be that PAC used in this study in the SAMBR-MABR assisted in the degradation of Bisphenol A
by forming biological coated powdered activated carbon.
Some new compounds that appeared at 10 ˚ C, but not at mesophilic temperatures can be found
in the last column such as nonanoic acid, n-decanoic acid and 1,19-Eicosadiene that are long
chain fatty acids also found in the HR effluent. This means that their hydrolysis could not take
place in the SAMBR-MABR at 10 ˚ C. The compounds 2H-pyran-2-one,6-heptyltetrahydro, ph-
thalic acid, butyl 4-octyl ester, 1,19-Eicosadiene and hexadecanoic acid, hexadecyl ester were
also not detected at mesophilic temperatures, and can thus be considered as recalcitrants pro-
duced in the SAMBR-MABR under psychrophilic conditions even when the SAMBR-MABR was
left in batch mode. Hexanedioic acid was not detected at 35 ˚ C, but appeared at 20 ˚ C and could
be degraded at 10 ˚ C in batch mode. It is noteworthy to say that some compounds detected at
20 ˚ C were not detected at 10 ˚ C, presumably because the reactor was left in batch mode for
7 days before the sample for GC-MS analysis was taken, and degradation could have occurred
251

Chapter 8. CONTINUOUS TREATMENT OF LEACHATE IN A SAMBR-MABR
during that time.
Table 8.9: Recalcitrants compounds detected by GC-MS in the permeate of the conven-tional SAMBR at 35 and 20 ˚ C. The percentage of increase or decrease iscalculated based on the area of the peaks. ND = not detected.
Match Ret. Recalcitrants in Formula 35 ˚ C 20 ˚ C% time the SAMBR
97 7 phenol,4-methyl C7H8O ND new
90 10.18 Octanoic acid C8H16O2 ND from HR
96 11.72 phenol,2-chloro-4-(1,1-dimethylethyl) C10H13ClO ND
70 12.56 nonanoic acid C9H18O2 ND from HR
96 13.8 n-decanoic acid C10H20O2 ND from HR
81 14.2 decanoic acid, 2-methyl C11H22O2 ND new
99 14.53 2,5-cyclohexadiene-1,4-dione C14H20O2 ND2,6-bis(1,1-dimethylethyl)
94 14.6 undecanoic acid C11H22O2 ND new
97 15.9 dodecanoic acid C12H24O2 ND new
90 16.4 2H-Pyran-2-one,tetrahydro-6-pentyl C10H18O2 ND new
95 17.59 benzophenone C13H10O -17%
90 18.93 tridecane C13H28 ND
87 19.6 delta nonalactone C9H16O2 ND new
90 19.63 Tri(2-chloroethyl)phosphate C6H12Cl3O4P -6%
94 20.64 Benzensulfonamide, N-butyl C10H15NO2S -30%
97 21.73 3,5-di-tert-butyl-4-hydroxyphenyl C17H26O3 -39%propionic acid
90 23.13 phosphetane,2,2,3,4,4-pentamethyl C14H21O2P ND-1-phenoxy-,1-oxide
96 24 nonadecane C19H40 ND new
97 24.34 Bisphenol A C15H16O2 -72%
96 26.3 tetracosane C24H50 ND new
91 26.59 hexanedioic acid, C22H42O4 NDbis(2-ethylhexyl) ester
96 27.3 heneicosane C21H44 ND new
1-Phenanthrenecarboxylic acid, 1,2,3,99 27.67 4,4a,9,10,10a- octahydro-1,4a-dimethyl C20H28O2 ND
-7-(1-methylethyl)-, (1R,4aS,10aR)-
95 29.3 docosane C22H46 ND new
8.3.5.5 Compounds in the conventional SAMBR: The compounds detected at 35 and 20 ˚ C
are shown in Table 8.9. There is a considerable increase in the number of peaks detected in the
conventional SAMBR presumably due to the lower SRT in this reactor. Among the recalcitrants
found at 35 ˚ C there is tridecane that is considered as easily degradable because it is aliphatic.252

Chapter 8. CONTINUOUS TREATMENT OF LEACHATE IN A SAMBR-MABR
At 20 ˚ C, the compounds octanoic acid, nonanoic acid and n-decanoic acid present in the HR
effluent could not be hydrolyzed in the conventional SAMBR. In contrast, in the SAMBR-MABR
they were completely hydrolyzed and only appeared when operating at 10 ˚ C. Among the new
molecules detected in the conventional SAMBR at 20 ˚ C there were long chain fatty acids such
as undecanoic acid and dodecanoic acid, but also long chain alkanes such as tetracosane and
heneicosane. Nevertheless several compounds detected at 35 ˚ C were still partly degraded at
20 ˚ C such as benzophenone, Benzensulfonamide, N-butyl and Bisphenol A.
8.3.6 Denaturing Gel Gradient Electrophoresis (DGGE)
8.3.6.1 Archaea: The archaeal population from the HR, SAMBR-MABR and the conventional
SAMBR was analyzed using the DGGE technique as described in Material and Methods, and
the gel picture taken is shown in Figure 8.8. Unfortunately, only bands 4 and 9 on the picture
could be identified as Methanosaeta and Methanosarcina mazeii species, respectively.
Figure 8.8: Evolution with time of the archaeal population in the HR (left), conventional SAMBR(middle) and SAMBR-MABR (right) using the primers ARCH46F and ARCH1017Rthen 344FGC and Univ522R.
In the HR, the archaeal population was not different from that in the SAMBR. It was found that
three or four species were dominant and these were the same as the ones found in the SAMBR
and the SAMBR-MABR. Methanosarcina mazeii was found in the HR on day 85, possibly be-
cause of the sludge recycled from the SAMBR that contained Methanosarcina mazeii on day
85. On day 113, Methanosarcina mazeii was not found although VFAs were found at high con-
centrations because the HR was fed with kitchen waste (and a small amount of garden waste)
at 10g VS/L.day. This could be due to their washout at the low HRT of 1.8 days in the HR. Only
two dominant bands were seen on day 113 in the HR.
In the conventional SAMBR, the archaeal diversity was lower than in the SAMBR-MABR. There
were a maximum of five or six bands detected in the former, while the latter had up to 12 bands.253

Chapter 8. CONTINUOUS TREATMENT OF LEACHATE IN A SAMBR-MABR
The lower SRT in the conventional SAMBR seems to be the main reason for this, but nev-
ertheless the lower archaeal diversity did not impede VFA degradation as their concentrations
remained low until the shock to low temperatures. On day 113 the brightness was clearly weaker
suggesting a lower activity of the archaea at 10 ˚ C, and this was associated with a build up of
VFAs in the bulk. Band 6 was the only one with a greater intensity at psychrophilic temperatures
which means that it was a psychrotolerant archaea. Eventually on day 115, the SAMBR was
opened and a sample from the biofilm on the membrane was taken. It can be seen that the
bands on lane 115A were more intense than in the bulk at 10 ˚ C (Lane SAMBR day 113) which
could mean that the biofilm sheltered the methanogens from the low temperatures. However,
this greater intensity could be linked to the greater density of archaea in the biofilm because the
DGGE technique does not differentiate between live cells from inactive ones.
In the SAMBR-MABR, it can be seen that bands were found even though the reactor was oper-
ated at an ORP in the range -250 to -200 mV indicating a low concentration of oxygen or oxidised
solutes. The SAMBR-MABR could start-up at a relatively high HRT of 19 days with only two main
species; however, with time the number of bands increased to 12 as the HRT was reduced to
1.1 days at 35 ˚ C. There was no difference in the archaeal population when paper waste was
omitted from the feedstock fed to the HR after day 87 because there is no difference between
the samples taken on day 85 and 92.
The sample taken on days 85 and 92 were the samples containing the most bands but only
two dominant species. Interestingly, after only 8 days, the population changed radically as the
temperature was set at 20 ˚ C. The number of bands not only decreased to 5 bands, but the
brightness changed; band number 1 became brighter, band 2 and 5 lost some of their intensity
and bands 3 and 4 (Methanosaeta) remained as faint as previously. This shows that different
species will respond differently to the shock from 35 to 20 ˚ C. While the archaea in band 1
became presumably more active at 20 ˚ C, the other species are likely to have lost some intensity
due to lower activity. This theory was supported by the fact that on day 113 the bands 2,3,4
(Methanosaeta) and 5 were fainter which correlated with the build up of VFAs at 10 ˚ C due to
lower growth rate and metabolic activity of archaea at such low temperature. Surprisingly, band 1
did not loose its intensity which suggests that this species was psychrotolerant, while the bands
2,3,4 and 5 were mesophilic Archaea struggling at psychrophilic temperatures. Overall, it was
observed that two main species were found at mesophilic temperatures while there were three
or four main species at lower temperature but with a weaker brightness.
The penultimate lane (day 115B) on Figure 8.8 shows the archaeal population present on the
biofilm formed on the Kubota membrane used for permeate extraction. The sample was taken
at the end of the experiment when the SAMBR-MABR was opened on day 115. It can be seen
that bands 4 (Methanosaeta) and 5 in that lane were brighter than in the bulk suggesting that
attached archaea such as Methanosaeta and Methanosarcina mazeii in the biofilm could have
a better resistance to psychrophilic conditions that their counterparts in the bulk. However, it
should be born in mind that the greater brightness could be due to higher cell concentrations on
the biofilm than in the bulk, and not necessarily because of higher activity.
Finally, the last lane (day 115C) is the archaeal population found in the biofilm formed on the254

Chapter 8. CONTINUOUS TREATMENT OF LEACHATE IN A SAMBR-MABR
aerated Kubota membrane. The presence of strict anaerobes such as archaeal species on
the aerated membrane is possible because the oxygen could have been consumed by other
bacteria in close contact with the membrane while the outer layers of the biofilm could have
been completely anaerobic.
Table 8.10: Identified bands from the DGGE gel using archaeal primers.
Band Closest Accession Genus Match EMatch Number % value
4 Uncultured Methanosaeta sp. AM998443.1 Methanothrix 98 1e-27
9 Methanosarcina mazeii strain LM5 DQ987528.1 Methanosarcina 100 1e-70
8.3.6.2 Bacteria: Figure 8.9 shows the bacterial population in the HR, conventional SAMBR
and the SAMBR-MABR. The most diverse population was observed on day 64 in the SAMBR-
MABR. The population did not change significantly between day 85 and 92, although the leachate
changed in composition on day 87 because kitchen waste was fed to the HR with no more paper
waste. In contrast, the population changed drastically when the SAMBR-MABR was operated at
20 ˚ C on day 100 and some bands (3,4,10,11,12) became slightly more apparent on day 113 at
10 ˚ C. Among these, band 3 was previously found in mammal guts (Ley et al., 2008), and band 4
was found in a digester treating cattle waste (Ueki et al., 2007, Community structure of bacteria
in a methanogenic fermenter of cattle waste and some characteristics of fermentative bacterial
isolates, unpublished; http://www.ncbi.nlm.nih.gov). Band 4 was found to belong to the genus
Anaerovorax which belongs to the phylum Firmicutes. This phylum is known to be important for
the digestion of polysaccharides and oligosaccharides (Krause et al., 2008). It includes several
genera of anaerobic microorganisms with cellulolytic activity. Moreover, the most abundant class
of the phylum Firmicutes is Clostridium. The Sphingobacteriales found in band 1 belongs to the
phylum Bacteroidetes. Krause et al. (2008) observed that Firmicutes was the most abundant
phylum, followed by Bacteroidetes in an anaerobic digester treating maize silage, green rye and
chicken manure.
Band 11 was identified as a Syntrophaceae also found in a hydrocarbon-degrading microbial
consortia (Penner et al., 2008, Molecular characterization of hydrocarbon-degrading methanogenic
microbial consortia from oil sands tailings settling basin in Northern Alberta, Canada, unpub-
lished; http://www.ncbi.nlm.nih.gov). Interestingly, band 11 appeared to belong to the genus
Smithella that Ariesyady et al. (2007) found to be a propionate-utilizing bacterium. This Syn-
trophaceae from the genus Smithella could be one of the key microorganism in this process
because propionate was found to build up very frequently in the HR in the previous chapters,
probably due to the absence of this bacterium. Paradoxically, band 11 became more intense on
day 113 (10 ˚ C) and on the biofilm on day 115 which corresponds to period where propionate
was found in the bulk. It is possible that at lower temperature this Syntrophaceae was the only
propionate-oxidiser able to survive but they were not in sufficient number to keep the propionate
levels low. Therefore, it is suggested to supplement this bacterium to the SAMBR during low
255

Chapter 8. CONTINUOUS TREATMENT OF LEACHATE IN A SAMBR-MABR
Figure 8.9: Evolution with time of the bacterial population in the HR (left), conventionalSAMBR (middle) and SAMBR-MABR (right) using the primers 341F-GC and907R.
256

Chapter 8. CONTINUOUS TREATMENT OF LEACHATE IN A SAMBR-MABR
Table 8.11: Identified bands from the DGGE gel using bacterial primers.
Band Closest Accession Genus Match EMatch Number or Family % value
1 Sphingobacteriales bacterium FJ177530.1 Sphingobacteriales 95 0HU1-GD23
2 Uncultured sulfate-reducing EF592769.1 unknown 99 0bacterium clone 2R1C02
3 Uncultured bacterium EU464444.1 Pasteuriaceae 99 0clone AFEL aai29c07 Incertae Sedis
4 Clostridiaceae bacterium AB298771.2 Anaerovorax 97 0FH042
5 Spirochetales bacterium EU498367.1 Spirochaetaceae 98 0
6 Uncultured Hydrogenophaga EU887786.1 Hydrogenophaga 99 0sp. clone 5IISN
7 Ralstonia sp. P-4CB2 AF229890.2 Ralstonia 98 0
8 Ralstonia sp. P-4CB2 AF229890.2 Ralstonia 96 1e-162
9 Uncultured bacterium CT574194.1 unclassified 99 0clone 060B11 B SD P93 Bacteroidetes
10 Uncultured bacterium EF515599.1 Prevotella 99 0clone 30g04
11 Uncultured Syntrophaceae EU522633.1 Smithella 98 0bacterium clone Alk2-2B
12 Uncultured bacterium EF515599.1 Prevotella 99 0clone 30g04
13 Propionibacteriaceae AB298752.2 unclassified 100 0bacterium SH081 Propionibacteriaceae
14 unidentified
15 Uncultured bacterium EF515658.1 Prevotella 99 0clone 31f06
16 Brachymonas denitrificans EU434494.1 Brachymonas 99 0strain b316
17 Uncultured bacterium DQ443951.1 100 1e-177clone G-25
18 Uncultured bacterium EF515599.1 Prevotella 99 0clone 30g04
19 Uncultured bacterium EF515599.1 Prevotella 99 0clone 30g04
20 Uncultured bacterium EF515599.1 Prevotella 99 0clone 30g04
21 Thauera phenylacetica EU434481.1 Thauera 99 0strain b284
temperature studies. Similarly to what was observed for archaea, the bands were very bright in
the biofilm (lane 115 B) probably due to a higher cell density on the biofilm than in the bulk at
10 ˚ C. Unfortunately, there was no band in lane 115C because no DNA was seen on agarose
gel probably due to a failed PCR reaction for that sample.
257

Chapter 8. CONTINUOUS TREATMENT OF LEACHATE IN A SAMBR-MABR
The Spirochetales found in band 5 belongs to the phylum Spirochaetes. In this study, this bac-
teria was found to survive at all HRTs in the SAMBR-MABR, but disappeared as soon as the
temperature dropped to 20 ˚ C as it was not seen on day 100. However, a faint band could be
guessed in the biofilm (Lane 115B), suggesting that it survived in the biofilm. Amongst the other
species detected in the SAMBR-MABR, it is worth highlighting the presence of a sulfate reduc-
ing bacteria (SRB) in band 2 on day 64 only. This is thought to be due to the higher ORP in
the SAMBR-MABR. The literature revealed that microaerobic conditions can be used to remove
hydrogen sulfide from the biogas (Jenicek et al., 2008), but H2S was not measured in this study
to confirm sulfate reduction in the SAMBR-MABR.
Another occurrence was the species from the genus Ralstonia found in bands 7 and 8. The
Ralstonia sp. P-4CB2 in particular was reported as a member of a bacterial consortium capable
of degrading 4-chlorobenzoate and 4-bromobenzoate under denitrifying conditions (Song et al.,
2002). However, in general these bacteria are reported to be hydrogen-oxidising bacteria. A
bacterium from the genus Hydrogenophaga was also found in band 6 of the SAMBR-MABR. Hy-
drogenophaga is a genus of Comamonad bacteria, several of which were formerly classified in
the genus Pseudomonas (Willems, 1991). Some species are chemolithotrophic at the expense
of hydrogen or carbon dioxide. They use oxygen as a terminal electron acceptor, but some
species can also use nitrates. Almost all hydrogen bacteria are facultative chemolithotrophs,
meaning that they can also grow chemoorganotrophically with organic compounds as energy
sources (Madigan and Martinko, 1984). Uchida et al. (2008) reported the presence of Coma-
monad bacteria in landfill leachate as they are known to play significant roles in biodegradation of
aromatic compounds, in denitrification, and in the bioremediation of contaminated environments.
These occurences demonstrate that in the SAMBR-MABR there was a rather unusual pathway
used to get rid of hydrogen. In typical anaerobic digesters, hydrogen is removed by hydrogen-
consuming acetogenic bacteria such as Clostridium aceticum and by hydrogen-oxidising ace-
totrophs which produce methane.
The bacterial population in the sludge from the wastewater treatment plant in Mogden (UK) is
shown in the lane referred as MS (Mogden Sludge) in Figure 8.9. The Mogden sludge was used
to start up the HR in Chapter 7. The HR was then left dormant for two months before starting
the experiment described in this chapter. The species found in the Mogden sludge were an
unclassified Bacteroidetes in band 9 and Propionibacteriaceae bacterium SH081 in band 13.
These species were not found anywhere else indicating that an important change in bacterial
population occurred in the reactors used in this study.
As far as the conventional SAMBR is concerned, the bacteria Brachymonas denitrificans was
found in band 16 on day 2. It is an aerobic chemoorganotrophic bacterium able to denitrify
and can also remove phosphorus (Shi and Lee, 2007). The last band in Table 8.11 was found
to be Thauera phenylacetica and it was detected in the conventional SAMBR in day 2. This
bacteria is a nitrate-reducing bacteria capable of anaerobically degrading methoxylated aromatic
compounds with a bacterium from the genus Clostridium (Mechichi et al., 2005). The Thauera
strain was found to use metabolic intermediates such as protocatechuate, acetate and butyrate
as a carbon source anaerobically or aerobically in the presence of nitrate. Their presence on day258
Chapter 8. CONTINUOUS TREATMENT OF LEACHATE IN A SAMBR-MABR
2 only is likely to be due to the inoculum kept in aerobic dormant conditions as these bacteria
were not seen in the SAMBR after day 2, i.e. after that all the oxygen was consumed during start
up. In the conventional SAMBR no bands were seen on day 85 because no DNA was seen on
the agarose gel. This is likely to be due to a failed PCR reaction because archaea were detected
on day 85. On day 113, DNA was detected on agarose gel but as a faint band, and no band
could be seen on the DGGE gel, probably due to insufficient amounts of DNA. Nonetheless,
bands were observed on the biofilm developed on the membrane of the conventional SAMBR
(Lane day 115A of SAMBR) which suggest that most of the degradation occurring in the SAMBR
towards the end of the experiment was due to the bacteria attached to the biofilm.
In the HR, band 17 was identified as Uncultured bacterium clone G-25 that was detected in
a study where lactate and sulfate were degraded in a CSTR in which acidogenic and sulfate-
reducing bacteria were detected (Zhao et al., 2008). The presence of this bacteria in our system
suggests that SRB could have also been present in the HR as they were in the SAMBR-MABR on
day 64 (band 2 in Table 8.11). Although it was not analyzed in our process, lactate concentration
could have increased when kitchen waste were fed at 10g VS/L.day after day 87. Sulfate, on
the other hand, never exceeded 30 mg/L in the HR effluent throughout the experiment, and its
concentration did not significantly increased after kitchen waste started to be fed.
Bands 10, 12, 18, 19 and 20 were all found to belong to the genus Prevotella and according to
their intensities, it can be stated that they were dominant species in the HR from day 64 and they
became more dominant bands with time. Madigan and Martinko (1984) reported that Prevotella
ruminicola is a starch decomposer found in the rumen, and their fermentation products are
formate, acetate and succinate.
8.3.6.3 Ammonia-oxidisers: All the DNA samples from the SAMBR - MABR, conventional
SAMBR and HR were amplified using the primers CTO189 FGC and CTO 654R for ammonia
- oxidising bacteria (AOB). The agarose and DGGE gels confirmed that AOB were only found
in the SAMBR-MABR. Figure 8.10 shows the evolution with time of AOB in the SAMBR-MABR.
Although there was a lot of smearing on the picture, bands 1 to 6 were cut and identified in
Table 8.12. It is clear from the picture and the table that AOB from the genera Nitrosomonas
and Nitrosospira were present in the SAMBR-MABR due to the biofilm grown on the aerated
Kubota membrane as described at the beginning of this chapter. Band 1 appeared to belong to
the genus Smithella and this is probably due to non-specific amplification during PCR reaction.
Bands 2,3,4 and 5 (or 6) appeared in the bulk on day 49, 64 and 85 probably due to detachment
from the biofilm when operation in the SAMBR-MABR started. On day 100 and 113, at 20 and
10 ˚ C, respectively, they were barely visible. In contrast, the bands appeared very bright on lane
115B corresponding to the sample collected on the aerated membrane. Bands can also be seen
on lane 115A corresponding to the Kubota membrane used for permeate extraction which is
probably due to the close proximity with the aerated membrane (6 mm).
It appears from the brightness of the bands that the cell density of AOB was important, but on the
other hand the brightness did not correlate with a high activity of AOB because ammonia was
259

Chapter 8. CONTINUOUS TREATMENT OF LEACHATE IN A SAMBR-MABR
not degraded successfully in the SAMBR-MABR. Thus brightness is not equal to activity as the
DGGE technique can not differentiate active from inactive cells. Their presence on the biofilm
confirmed the attachment of AOB to the Kubota membrane. Moreover, the attachment was
efficient since the rising bubbles could not scour and remove the AOB since they were detected
in the sample taken on day 115, i.e. at the end of the experiment. This shows that the technique
used in this study to create the biofilm had worked; it consisted in recirculating the permeate at
a flux over the critical flux so that biological attachment was promoted. The recirculation was
easy to operate and took only two weeks. This way of biofilm formation could easily be scale
up. For instance, a large Kubota membrane could simply be submerged in the nitrification tank
of a wastewater plant, and connected to a pump for permeate extraction so that a biofilm will
form. Once the biofilm has the desired thickness, the membrane can be incorporated in an
anaerobic reactor and oxygen should be pumped in the lumen in order to achieve nitrification in
the anaerobic reactor.
Figure 8.10: Evolution with time of the ammonia-oxidising bacterial population in theSAMBR-MABR using the primers CTO189F GC and CTO654R.
8.4 SUMMARY
The results showed that:
• The centrifugated leachate was low enough in TSS so that no significant build up of MLTSS
occurred in the SAMBR as the MLTSS remained around 10 g/l at 1.1 day HRT. The 5 g/l of
suspended solids in the leachate should be used as a threshold for further studies on the
macrofilter placed in the HR.
• A SCOD removal of over 90% was achieved at 1.1 days HRT in the SAMBR-MABR, but
simultaneous nitrification was not observed presumably due to ammonia or oxygen transfer
limitations. Nonetheless, a biogas production rate of 4.5 L biogas/L.day was observed at
260

Chapter 8. CONTINUOUS TREATMENT OF LEACHATE IN A SAMBR-MABR
Table 8.12: Identified bands from the DGGE gel using primers for ammonia-oxidisingbacteria.
Band Closest Accession Genus Matching EMatch Number % Value
1 Uncultured bacterium DQ093899.1 Smithella 98 0clone ga29
2 Nitrosomonas CP000450.1 Nitrosomonas 99 0eutropha C91
3 Ammonia-oxidising AY135356.1 Nitrosomonas 99 0bacterium NS500-9
4 Unc. Nitrosospira sp. EU327541.1 Nitrosospira 97 4e-10
5 Unc. bacterium EU542425.2 unclassified 99 0clone Er-MS-1 Methylophilaceae
6 Nitrosospira sp. EnI299 EF175101.1 Nitrosospira 98 0
an OLR of 11.7 g COD/L.day at 35 ˚ C. At 300 days SRT, the SAMBR-MABR achieved over
90% removal at 1.1 days HRT at 20 ˚ C. The OLR was then 13.4 g COD/L.day and the gas
production rate dropped to 2.4-3 at 20 ˚ C due to the lower substrate utilization rate. At
10 ˚ C the SCOD and VFAs built up in the bulk due to lower degradation rates, especially
for propionate.
• Some compounds became recalcitrants under psychrophilic conditions such as nonanoic
acid, n-decanoic acid and 1,19-Eicosadiene that are long chain acids also found in the
HR effluent. Moreover, some new recalcitrants were found to appear only in the SAMBR-
MABR under psychrophilic conditions such as 2H-pyran- 2 -one,6 -heptyltetrahydro, ph-
thalic acid butyl 4-octyl ester and hexadecanoic acid, hexadecyl ester.
• The performance of the conventional SAMBR was limited to a SCOD removal percent-
age between 79 and 95% at a minimum HRT of 1.5 days and a maximum OLR of 8 g
COD/L.day. The COD removal could not be maintain at lower HRTs, and a temperature of
20 ˚ C due to the lower SRT in the range 30 - 50 days. PAC addition (2 g/l) in the conven-
tional SAMBR lowered the bulk SCOD for few days but then reached saturation and the
SCOD increased back to the initial value. Nevertheless, among other molecules PAC could
remove were 85 and 76% of Bisphenol A and Bis (2-ethylhexyl)phthalate, respectively, that
are two recalcitrants under anaerobic conditions.
• The number of peaks detected by GC-MS in the conventional SAMBR was considerably
higher than in the SAMBR-MABR due to the lower SRT in this reactor. At 20 ˚ C, the
compounds octanoic acid, nonanoic acid and n-decanoic acid present in the HR effluent
could not be hydrolyzed in the conventional SAMBR. In contrast, in the SAMBR-MABR
they were completely hydrolyzed and only appeared when operating at 10 ˚ C.
• In the conventional SAMBR the archaeal diversity was lower than in the SAMBR-MABR
due to a lower SRT. Nevertheless, the lower archaeal diversity did not impede VFAs degra-
dation as their concentrations remained low until the shock to low temperatures. VFAs261

Chapter 8. CONTINUOUS TREATMENT OF LEACHATE IN A SAMBR-MABR
degradation was complete inasmuch as one or two dominant species were present as was
the case in the conventional SAMBR. Similarly, the SAMBR-MABR could start-up VFA
degradation with only two main species. Then with time the number of bands increased to
12 as the HRT was reduced to 1.1 days at 35 ˚ C. This high diversity helped the SAMBR-
MABR maintain low VFA concentrations even at 20 ˚ C, which was not the case in the
conventional SAMBR.
• In the conventional SAMBR, the archaeal population changed radically as the temperature
was set at 20 ˚ C, but not in the SAMBR-MABR. At 10 ˚ C the bands such as Methanosaeta
and Methanosarcina Mazeii were more intense in the membrane biofilm of both reactors
than in the bulk which could mean that the biofilm sheltered the methanogens from the low
temperatures.
• Regarding the bacterial community, members the genus Prevotella were found to be the
dominant species in the HR at SRT as low as 6-7 days and 1.8 days HRT, and they became
more dominant with time.
• The most diverse bacterial population was found in the SAMBR-MABR. The population did
not change significantly when the feed was changed to kitchen waste, but changed dras-
tically when the SAMBR-MABR was operated at 20 ˚ C. Some bands became brighter at
20 ˚ C such as members of the genus Anaerovorax, Smithella and Prevotella. In particular,
the bacterium Syntrophaceae from the genus Smithella is a propionate oxidising bacteria,
and as such could be one of the key microorganism in the process because propionate
was found to build up very frequently in the HR in the previous chapters, probably due to
the absence of this bacterium. Similarly to what was observed for Archaea, the bands were
very bright in the biofilm (lane 115 B) probably due to a higher cell density on the biofilm
than in the bulk at 10 ˚ C.
• A bacterium from the genus Hydrogenophaga was also found in the SAMBR-MABR which
suggested another route for hydrogen degradation than the degradation by archaea to
produce methane.
• Nitrosomonas and Nitrosospira species were present in the SAMBR-MABR due to the
biofilm grown on the aerated Kubota membrane, but this did not correlate with ammonia
degradation.
262

Chapter 9
CHARACTERISATION OF THE SAMBR
PERMEATE AND POST TREATMENT
TECHNIQUES1
9.1 INTRODUCTION
Effluent wastewater from the SAMBR does not meet regulatory standards for discharge into the
environment. Although the permeate from the SAMBR was recycled to the HR, it is relevant
to understand and characterize these Refractory Organic Substances (ROS) because they will
be present in the final digestate withdrawn from the HR, and therefore they could still have
an environmental impact. The purpose of this chapter was to determine the best physico-
chemical treatment most suitable for further reducing the organic content of this effluent stream,
and to gain more fundamental understanding of the properties of the ROS coming out of the
SAMBR.
Batch adsorption experiments were carried out using adsorbents like powdered activated carbon
(PAC), granular activated carbon (GAC) and polymeric adsorbents, to determine the optimum
conditions and mode of operation, kinetics and the most suitable adsorbent for organic matter
reduction. Coagulation-flocculation tests were also carried out on a batch scale to study the
effect of FeCl3 on the removal of organics, and also to compare the effect of coagulation with
adsorption.
Finally anaerobic toxicity assays (ATA) were carried out on certain plasticizers present in the
submerged anaerobic membrane bioreactor (SAMBR) effluent, namely o-hydroxybiphenyl, Bis-
2-Ethylhexyl phthalate (DEHP), and 2,6 - di -tert- butyl- 4- (dimethylaminomethyl) phenol, to
determine their effects on the microbial culture in the reactor.
1Submitted in part for publication as Trzcinski, A.P. and Stuckey, D.C. ”Characterisation of the permeate of aSubmerged Anaerobic Membrane Bioreactor (SAMBR) treating landfill leachate and comparison of post-treatmenttechniques.”, Bioresource Technology.
263

Chapter 9. CHARACTERISATION OF THE SAMBR PERMEATE
9.2 EXPERIMENTAL AND ANALYTICAL DETAILS
9.2.1 GAC and PAC properties
The GAC used in this study (PK 0.25-1 from Norit) was a granular activated carbon, which can
be used in a large range of liquid purification applications. It had a specific surface area of
775 m2/g and had an alkaline pH which means that its internal surface had been impregnated
with an alkaline chemical that optimizes the existing properties of the activated carbon giving
a synergism between the chemicals and the carbon. This alkaline property was verified by
soaking the GAC (10g/L) in deionized water at pH 6.8 (unmodified pH) and 2.1 (pH adjusted
with HCl) and the resulting pHs were 9.7 and 4.65, respectively, highlighting the fact the GAC
will increase the pH depending on the neutralization capacity of the solution. The Iodine number
was 600 which was relatively low and indicates a relatively low micropore volume available for
adsorption, thus it is not ideal for the adsorption of low MW compounds. The methylene blue
adsorption is 11g/100g which is relatively low and does not indicates a dense mesopore (2 to 5
nm) structure which adsorbs medium size molecules. Various properties of the GAC and PAC
are listed in Table 9.1:
Table 9.1: Properties of the GAC and PAC used in this study.
Properties GAC PAC
Name PK025-1 SAE2
Surface area BET (m2/g) 775 925
Methylene Blue adsorption (g/100g) 11 12
Iodine number 600 850Particle size≥ 1 mm (18 mesh) (% mass) 10 -
≤ 0.25 mm (60 mesh) (% mass) 5 -
≥ 150 µm (% mass) - 3
Effective size (µm) 300 22
Uniformity coefficient 1.9 -
Ash (mass %) 15 -
pH Alkaline Alkaline
Moisture (max. mass %) 2 6
9.2.2 Effect of pH
Batch adsorption was performed in three 25 ml flasks which contained 25ml of filtered SAMBR
effluent through a 0.45 micron filter and 125 mg of powdered activated carbon (PAC). The effect
of pH on the adsorption process was observed at pH 2, 7 and 12. Twenty-four drops of HCl
(12N) were added to the filtered effluent to change it from pH 8 to pH 2, four drops of HCl (12N)
to pH 7 and then twenty drops of NaOH (0.1N) to pH 12, before the addition of PAC. A magnetic
stirrer was then dropped into each flask and the mixture stirred at 200 rpm at room temperature.
Initial samples were collected from the three flasks before addition of PAC, then after one hour of
264
Chapter 9. CHARACTERISATION OF THE SAMBR PERMEATE
stirring and finally after twenty-four (24) hours. The experiments were carried out for twenty-four
hours to ensure that equilibrium had been attained. All samples were filtered using a 0.45 micron
filter prior to COD analysis in order to minimize interference of the carbon fines with the analysis.
9.2.3 Effect of Concentration
To study the effect of a change in concentration on the adsorption, the concentration of PAC in
the effluent was varied using concentrations of 1, 5 and 10 g/l without adjusting the pH of the
solution and agitation speed. The process was then carried out as outlined above to obtain the
COD values for the various PAC concentrations.
9.2.4 Performance of Two Different Types of Activated Carbon
The performance of two different types of activated carbon PAC and GAC namely SAE2 and PK-
025, respectively (both from Norit carbons), was studied by keeping the conditions of adsorption
for the two activated carbons similar (pH8, concentration 10 g/l, room temperature and stirring
speed). Samples were taken after 5, 15, 30 minutes, 1 hr and 24 hrs.
9.2.5 Effect of Powdered Activated Carbon on Various Fractions of Effluent
PAC was used to study the adsorption of various fractions of the effluent. The effluent was
separated in term of MWs into greater than 50 kDa, between 10 and 50 kDa, between 1 and
10 kDa, and less than 1 kDa using the Amicon cell and ultrafiltration membranes of specific
molecular cut-offs of 50, 10 and 1kDa as described in Section 3.3.10. 10 g/l of PAC was then
added to these various fractions and samples were taken after 5, 15, 30 minutes, 1 hr and 24
hrs.
9.2.6 Coagulation / Flocculation Tests
Experiments were carried out in volumetric flasks of 25 mL capacity. In a typical coagulation
run, the appropriate dosage of FeCl3 was added directly to 25 ml of filtered SAMBR effluent (≤
0.45 microns) while stirring at 200 rpm. An initial sample before iron chloride addition was taken
and then subsequently at 1 hour and 24hours. The sample was then filtered using a 0.45 micron
filter and analyzed with respect to COD.
To study the effect of pH on coagulation of organic compounds using FeCl3, pH was varied from
5, 8 and 9; 1g/l of FeCl3 was then added to the effluent SAMBR sample. The pH was changed
to acidic pH using H2SO4, and NaOH to change to alkaline solutions. Effect of concentration
change was studied using various concentrations of FeCl3 0.5 g/l, 1g/l and 3g/l respectively at
pH 5. Samples were filtered through a 0.45 micron filter before being analyzed for COD.
Effect of various Magnafloc polyelectrolytes such as E24 (Inverse emulsion range), MF10 (an-
ionic powder), LT31 (cationic), MF333 (non-ionic) and MF4240 (anionic) were also studied as
265
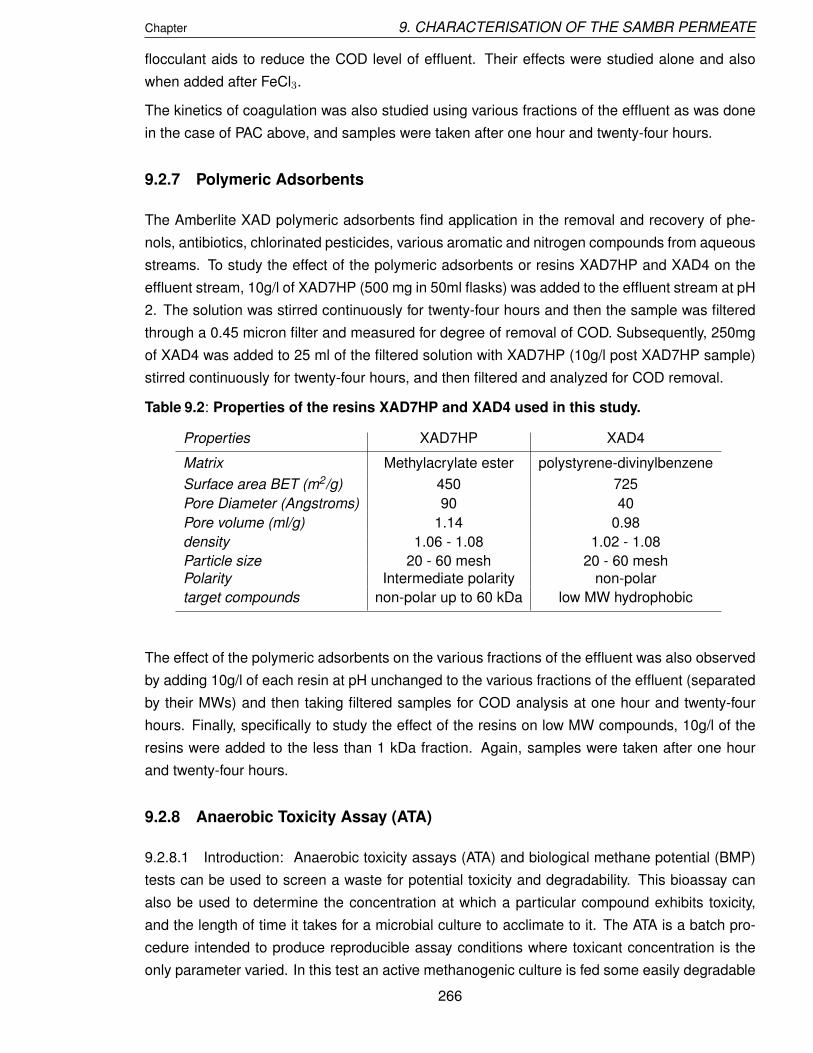
Chapter 9. CHARACTERISATION OF THE SAMBR PERMEATE
flocculant aids to reduce the COD level of effluent. Their effects were studied alone and also
when added after FeCl3.
The kinetics of coagulation was also studied using various fractions of the effluent as was done
in the case of PAC above, and samples were taken after one hour and twenty-four hours.
9.2.7 Polymeric Adsorbents
The Amberlite XAD polymeric adsorbents find application in the removal and recovery of phe-
nols, antibiotics, chlorinated pesticides, various aromatic and nitrogen compounds from aqueous
streams. To study the effect of the polymeric adsorbents or resins XAD7HP and XAD4 on the
effluent stream, 10g/l of XAD7HP (500 mg in 50ml flasks) was added to the effluent stream at pH
2. The solution was stirred continuously for twenty-four hours and then the sample was filtered
through a 0.45 micron filter and measured for degree of removal of COD. Subsequently, 250mg
of XAD4 was added to 25 ml of the filtered solution with XAD7HP (10g/l post XAD7HP sample)
stirred continuously for twenty-four hours, and then filtered and analyzed for COD removal.
Table 9.2: Properties of the resins XAD7HP and XAD4 used in this study.
Properties XAD7HP XAD4
Matrix Methylacrylate ester polystyrene-divinylbenzene
Surface area BET (m2/g) 450 725
Pore Diameter (Angstroms) 90 40
Pore volume (ml/g) 1.14 0.98
density 1.06 - 1.08 1.02 - 1.08
Particle size 20 - 60 mesh 20 - 60 meshPolarity Intermediate polarity non-polar
target compounds non-polar up to 60 kDa low MW hydrophobic
The effect of the polymeric adsorbents on the various fractions of the effluent was also observed
by adding 10g/l of each resin at pH unchanged to the various fractions of the effluent (separated
by their MWs) and then taking filtered samples for COD analysis at one hour and twenty-four
hours. Finally, specifically to study the effect of the resins on low MW compounds, 10g/l of the
resins were added to the less than 1 kDa fraction. Again, samples were taken after one hour
and twenty-four hours.
9.2.8 Anaerobic Toxicity Assay (ATA)
9.2.8.1 Introduction: Anaerobic toxicity assays (ATA) and biological methane potential (BMP)
tests can be used to screen a waste for potential toxicity and degradability. This bioassay can
also be used to determine the concentration at which a particular compound exhibits toxicity,
and the length of time it takes for a microbial culture to acclimate to it. The ATA is a batch pro-
cedure intended to produce reproducible assay conditions where toxicant concentration is the
only parameter varied. In this test an active methanogenic culture is fed some easily degradable
266

Chapter 9. CHARACTERISATION OF THE SAMBR PERMEATE
compound, in this case acetic acid and various concentrations of potential toxins known gener-
ally as plasticizers. A decrease in the rate of methane production with increasing concentration
of the test compound is an indication of toxicity. The effect of three plasticizers commonly found
in the effluent stream of the submerged anaerobic bioreactor namely; o-hydroxybiphenyl, Bis(2-
Ethylhexyl)phthalate and 2,6 - di -tert- butyl- 4- (dimethylaminomethyl) phenol was assessed.
Briefly, o-hydroxybiphenyl is an organic compound that consists of two linked benzene rings
and a phenolic hydroxyl group. It is a white or buff-colored, flaky crystalline solid. It is con-
tained in varying concentrations in a multitude of products under the trade names Chemcide,
Cotane Dowicide, Nipacide, Preventol, Torsite, among others (Coelhan et al., 2009). It displays
low acute toxicity in animal experiments. Nevertheless, it has been found to cause bladder
cancer in male rats after chronic exposure to dietary doses up to 4% (Hiraga and Fujii, 1984).
O-hydroxybiphenyl is included on the list of chemicals recognized by the State of California as
carcinogens (EPA, 2007). Bis(2-Ethylhexyl)phthalate, commonly abbreviated DEHP, is an or-
ganic compound and the most important ”phthalate”; it is produced on a massive scale by many
companies due to its good plasticizing properties. DEHP is a disruptive endocrine compound
(Benotti et al., 2009). 2,6 - di -tert- butyl- 4- (dimethylaminomethyl) phenol is a colorless viscous
liquid, and was reported to increase the activities of cholinesterase in blood of rats and mice
suggesting an enzyme-inducing effect (Cao et al., 1982). Their molecular formulae and physical
properties are given in Table 9.3 below, and their effect on the metabolism of a carbon source
for methane gas production was studied using the anaerobic toxicity assay.
Table 9.3: Properties of the plasticizers used for the ATA test in this study.
Plasticizer o-hydroxybiphenyl DEHP 2,6 - di -tert- butyl- 4-(dimethylaminomethyl) phenol
Molecular formula C12H10O C24H38O4 C17H29NO
CAS number 90-43-7 117-81-7 88-27-7
Molecular weight 170.21 390.56 263.42
LD50 (mg/kg) 1050 1370 343
Density 1.293 0.98 0.95
log P 2.94 8.7 4.6
Solubility (g/L) 0.26 10-4 6.1 at pH7
9.2.8.2 ATA Procedure: Various concentrations of each plasticizer representing 200, 20, 2,
0.2, 0.02 and 0.002 mg/l were prepared in duplicates for each plasticizer. Fourty mg of acetic
acid was put in each 20 ml bottle to act as a carbon source. A total volume of 20 ml of inoculum,
bio-medium (Owen et al., 1979) and plasticizer was added to each bottle while flushing with
carbon dioxide/nitrogen gas (30/70) and sealed off immediately after. The inoculum (2 ml in
each bottle) was taken from the SAMBR described in Section 8.3.4 of Chapter 8; its MLTSS and
MLVSS were 22.9 and 16.9 g/L, respectively.
267

Chapter 9. CHARACTERISATION OF THE SAMBR PERMEATE
The blank was made by adding 2 ml of inoculum and 18ml of biomedium without any carbon
source or plasticizer while the controls were prepared using acetic acid as carbon source but
no plasticizer. Various concentrations of plasticizers were introduced into each bottle, and the
20 ml volume was made up using acetic acid as the carbon source, a constant volume of 2 ml
of inoculum, and an appropriate volume of biomedium. The percentage of methane and gas
produced were obtained as described in Materials and Methods.
9.3 RESULTS AND DISCUSSION
9.3.1 Batch Adsorption Test Using Activated Carbon
9.3.1.1 Effect of activated carbon dosage: The effect of adsorbent dose on the removal of
organics from the SAMBR was studied at pH unchanged (pH8). It was found that 1, 5 and 10
g GAC/L resulted in 36, 70 and 80% COD removal, respectively after 24 hours. With the PAC,
COD removals of 39, 72 and 84% at dosages of 1, 5 and 10g/L, respectively. Results obtained
from varying concentrations of adsorbent from 1, 5 and 10 g/l indicated that at a concentration
of 10 g/l the adsorption of organics from the effluent produced better results when compared to
the other two concentrations. This is in line with results obtained in the literature, which shows
better adsorption with increasing dose of adsorbent, GAC or PAC (Gotvajn et al., 2009). The
maximum adsorption capacity observed in this study was 269 and 288 mg COD/g GAC and
PAC, respectively.
9.3.1.2 Effect of pH on adsorption of GAC: The pH of the medium is also an important factor
that may influence the uptake of the adsorbate. The chemical properties of both adsorbate and
adsorbent may vary with pH, thus it is important to study the effect of pH on adsorption with
activated carbon. The pH was tested using a GAC dosage of 5 g/l, and the optimum pH for GAC
was observed to be at the unchanged pH value of the effluent stream, at pH 8 (Figure 9.1). At
this pH, the highest COD removal was obtained (70%). However, as the pH increased to 12
there was a decrease in COD removal. This is due to the fact that at higher pH values there
is competition between the organics and the OH− ions for the adsorption sites. However, the
smaller OH− ions secure a better avenue to be adsorbed to produce metal hydroxide layers that
inhibit adsorption of further organics from the SAMBR permeate.
The effect of the solution pH is extremely important when the adsorbing species is capable
of ionizing in response to the pH. It is well known that organic compounds adsorb poorly on
activated carbon when they are ionized. This explains the common observation that non-ionised
forms of acidic and basic compounds adsorb much better than their ionized counterparts on
activated carbon. Acidic compounds hence adsorb better at low pHs and basic species adsorb
better at high pHs.
Another factor which affects pH of adsorption is the nature of the adsorbent, which is determined
by the pH of the point zero charge of the adsorbent (which is the pH when the charge on the
activated carbon surface is zero, pHpzc). At a solution pH lower than the pHpzc, the total surface
268

Chapter 9. CHARACTERISATION OF THE SAMBR PERMEATE
Figure 9.1: Effect of pH on COD removal percentage with 5g/L of GAC.
charge would be positive, whereas at a higher solution pH, it would be negative. The adsorption
potential of the adsorbent is higher when the total surface charge is positive, that is when the
solution pH is lower than the pHpzc of the activated carbon. This indicates that the pKa of
GAC must be higher than the pH 8 of the solution. At pH 12, the organic uptake was lower
due to electrostatic repulsion between the negative surface charge and the solute species in
the solution, whereas at pH 8 the solute species were undissociated and dispersion interactions
predominated, thereby increasing electrostatic attraction between the solute species and the
adsorption sites.
Therefore, from the results obtained there is an indication that the pKa of the GAC used was
greater than 8, but less than 12. At pH 8 adsorption of the organics was based mainly on
the decrease in negative charge or increase in positive charge on the activated carbon, which
would decrease any surface ROS repulsive interaction, as opposed to pH 12 where an increase
in negative charge on the activated carbon and competition between increased OH− ions and
the organics both contribute to reduce the COD removal capacity of the GAC. One would expect
therefore to have better adsorption at a higher pH than 2 following the decreased negative charge
on the activated carbon and also less interference from OH−, but this is not the case because
at lower pH values, the organic compounds become ionized and this reduces their adsorption
capacity.
9.3.1.3 Adsorption Isotherm Models: The equilibrium adsorption onto GAC and PAC was an-
alyzed using Langmuir and Freundlich isotherms, and the data are shown in Table 9.4. The
regression correlation coefficient R2 was used to determine the linear equation best fit. Based
on R2, Freundlich was found to describe the best adsorption for both GAC and PAC, thus show-
ing a multilayer adsorption on a heterogeneous adsorbent which is also observed in most studies
with activated carbon (Kurniawan et al., 2006b; Diamadopoulos, 1994). Based on the KF value
of the Freundlich model, a higher adsorption capacity of PAC was confirmed.
269

Chapter 9. CHARACTERISATION OF THE SAMBR PERMEATE
Table 9.4: Isotherm constants of Langmuir and Freundlich models for adsorption ontoGAC and PAC used in this study.
GAC PAC
Langmuir
KL 0.366 0.459
aL -0.00087 -0.00058
R2 0.94 0.947
FreundlichKF 0.0875 0.213
n 0.766 0.852
R2 0.999 0.997
9.3.1.4 Adsorption Kinetics: The adsorption rate constant (kf ) and equilibrium adsorption ca-
pacity (qe) of the first-order model were calculated from the slope and intercept of the plots of
log(qe − qt) against t. The initial sorption rate (h), the equilibrium adsorption capacity (qe) and
the second-order rate constants (ks) were obtained from the slope and intercept of the plots of
t/qt against t. Summary of the results are reported in Table 9.5. Since the calculated correlation
coefficients are closer to unity for the second-order model than first-order one, the adsorption
kinetics could be explained better by the second-order kinetic model for both GAC and PAC. In
particular, the value of h highlights the faster adsorption of PAC compared to GAC as there is a
twelve-fold increase in the initial adsorption rate.
Table 9.5: Kinetic constants for adsorption onto GAC and PAC used in this study.
GAC PAC
First-order
kf (min-1) 0.036 0.035
qe (mg/g) 32.07 13.56
R2 0.848 0.435
Second Order
h (mg/g min) 15.02 182.98
ks (g/mg min) 0.005 0.058
qe (mg/g) 54.55 56.11
R2 0.999 1
9.3.2 Other Factors Influencing the Adsorption Capacity
The removal of organics also depends on the size and surface area of activated carbon used
and this effect was studied using different types of activated carbon. PAC has finer particles and
greater surface area, while GAC has more coarse particles. It was observed that adsorption
kinetics and capacity increased as the surface area of adsorbent increased as can be seen from
the steepness in the slope of the PAC as compared to GAC in Figure 9.2.
Adsorption using both types of activated carbon (PAC and GAC) was very fast, and after about 15270

Chapter 9. CHARACTERISATION OF THE SAMBR PERMEATE
Figure 9.2: Comparison of adsorption kinetics and capacity of GAC and PAC at 10g/l. Theerror bars indicate the standard deviation.
minutes of contact between adsorbate and adsorbent 73% of organics were removed (in the case
of PAC). After about 1 hour of contact, equilibrium had been established and the adsorption rate
did not change much in 24hrs for both PAC and GAC. At equilibrium 76 and 79% of organics had
been successfully removed using GAC and PAC, respectively, causing the COD of the effluent
to decrease from 745 to 180 and 160 mg/l in 24hrs for GAC and PAC, respectively.
9.3.3 Controls
The control experiments were intended to demonstrate that the change in COD of the SAMBR
permeate was due to the addition of the different types of activated carbon and no other cause
(biological degradation, evaporation, precipitation). As was demonstrated in the graph below
(Figure 9.3) when the sample of the effluent was left to stand for 24 hours (referred to as the
”SAMBR control”), there was no appreciable change in its COD. This shows that there is no fur-
ther biodegradation of the sample by microorganisms, implying either that there are no microbes
present in the effluent or that the substances present in the effluent are recalcitrant and hence
not available to the microbes to degrade.
Glucose (500 mg/l) was also left at room temperature for 24 hrs (referred as ”glucose control”),
and there was no appreciable change in COD content, however when GAC (10 g/l) was added to
the glucose solution over a period of 24 hours, the COD value was shown to have been reduced.
Similar results were obtained with PAC (10g/l) with glucose (500 mg/l). This shows that changes
in the COD content of the effluent was not as a result of the activity of microbes either present in
the effluent, or in the environment, but solely as a result of the addition of activated carbon. The
relatively low adsorption of glucose was likely to be due to its low MW, and because it is a polar
and aliphatic compound.271

Chapter 9. CHARACTERISATION OF THE SAMBR PERMEATE
Figure 9.3: Control experiment for adsorption using activated carbon.
9.3.4 Effect of PAC on Various Fractions of Effluent
The light brown-yellow colour of the effluent results from high MW substances which are difficult
to degrade because of its humic nature. A marked difference in colour was observed among
the various MW fractions, with the low MW fraction (≤ 1kDa) being the fraction with least colour.
This visual observation suggests that the colour was mainly due to compounds larger than 1kDa.
Furthermore, Table 9.6 reveals that the use of a 1 kDa membrane to treat the SAMBR permeate
would result in 75% COD removal, but the 1 kDa permeate still contained about 290 mg/l of
COD. Wang et al. (2006a) also concluded that large MW ROS were the major COD components
of aged raw landfill leachate, and that ROS with MWs larger than 1 kDa were the major colour
contributors.
Thus UF membrane treatment does not seem to be able to reach COD levels for discharge,
which is in agreement with Trebouet et al. (2001) who found that at least nanofiltration was
required to meet COD levels for discharge. Results of the experiment on adsorption of various
fractions of the effluent show that when the contact time between the various fractions of the
effluent and PAC was left for a long time (24 hours), the COD removal percentage for the various
fractions was approximately the same, according to Table 9.6.
From the results obtained in these experiments, PAC is able to adsorb high and low MW sub-
stances, but the kinetics of adsorption are not totally the same. For compounds with MWs
greater than 1 kDa, the COD removal percentage reached at least 70% after only 5 minutes
and continued increasing, whereas for compounds smaller than 1 kDa the removal was slightly
lower at 65% after 5 minutes and still 62% after 15 minutes, showing a slower adsorption rate.
Moreover, some low MW compounds were able to desorb probably due to the lower strength
interactions with the PAC as the COD removal dropped to 46% after 30 minutes. However, as
272

Chapter 9. CHARACTERISATION OF THE SAMBR PERMEATE
Table 9.6: COD proportions (left column) of the SAMBR permeate divided into variousfractions according to the MW (middle column) and the percentage removalof each fraction on PAC (10g/L) after 24 hours (right column).
COD % Molecular weight % COD removalfraction (kDa) on PAC
24.6 X ≤ 1 78.5 (after 1 hour)
20.4 1 ≤ X ≤ 10 79.2
32 10 ≤ X ≤ 50 85.5
23 X ≥ 50 82.6
time of contact increased about 80% of all the various MW fractions could be removed by PAC.
Unfortunately, the bottle with compounds smaller than 1 kDa broke during the experiment and
the final value could not be obtained. Nevertheless, the COD removal was 78.5% after 1 hour.
Figure 9.4: Evolution with time of the COD removal percentage of various MW fractionson PAC 10g/l.
This is due to the fact that larger molecules are preferentially adsorbed onto PAC than smaller
molecules (Barker et al., 1999). These large MW pollutants can adsorb directly in the macrop-
ores of the PAC due to a strong affinity with PAC due to their high hydrophobicity, whereas low
MW molecules need to diffuse into the micropores to find free adsorption sites, and their lower
affinity does not warrant adsorption, and may even cause desorption as the decrease in COD
removal showed. Nevertheless, as the contact time increased the micropores of the activated
carbon gradually became saturated with the lower MW substances which had gradually pene-
trated the narrow pores of the PAC. Therefore, it was shown that the compounds with higher
MWs are preferentially adsorbed due to stronger hydrophobic interactions with the PAC surface.
However, the maximum uptakes were independent of the size of the adsorbate molecules.
273

Chapter 9. CHARACTERISATION OF THE SAMBR PERMEATE
9.3.5 Effect of Various Adsorbents and Coagulants on Removal of Low MolecularWeight Substances
Since the rate-limiting step of the adsorption was the adsorption of low MW compounds (≤ 1
kDa) from the SAMBR permeate it was decided to investigate the removal of these compounds
using other adsorbents and coagulants, namely GAC, iron chloride (1g/l) and resins (10g/l) at
pH 8. Initially the adsorption of the low MW compounds using the two different types of activated
carbon showed that GAC was a better adsorbent of the ≤ 1 kDa compounds, with the removal
rising to approximately 68% as compared with PAC which had a removal of approximately 62%.
This could be explained as a result of the macroporous nature of GAC as opposed to the micro-
porous nature of PAC. Hence, the low MW particles easily penetrate the pores of the GAC and
are preferentially adsorbed faster than high MW compounds onto PAC. However, because of
differences in the pore volume and surface area of the two adsorbents, with increase in contact
time, PAC is able to adsorb comparatively more amounts of lower MW compounds than GAC,
which has a smaller pore volume as well as surface area.
Figure 9.5: Evolution with time of the COD removal percentage of the low MW fraction(less than 1 kDa) from the SAMBR permeate with various adsorbents andcoagulants.
Results obtained with the less than 1 kDa effluent fraction showed that PAC had the highest ad-
sorption efficiency of about 67% COD removal after 24 hours of contact, followed by GAC (64%),
XAD7HP (48%), XAD4 (40%) and then FeCl3 (30%). The adsorption of low MW compounds was
more effective using activated carbon as opposed to polymeric adsorbents as a result of their
larger surface areas, and hence smaller pore size which are effective for the removal of low MW
compounds.
Coagulation using FeCl3 removed very little of the low MW compounds. The test with iron chlo-
ride was repeated at pH 5 but gave the same result, hence indicating that the pH of the solution
did not make any difference to the coagulation of the low MW compounds.
As far as the polymeric adsorbents were concerned, it can be seen in Figure 9.5 that XAD7HP
performed better than XAD4. The pore size, surface area, polarity, contact time, pH and the274
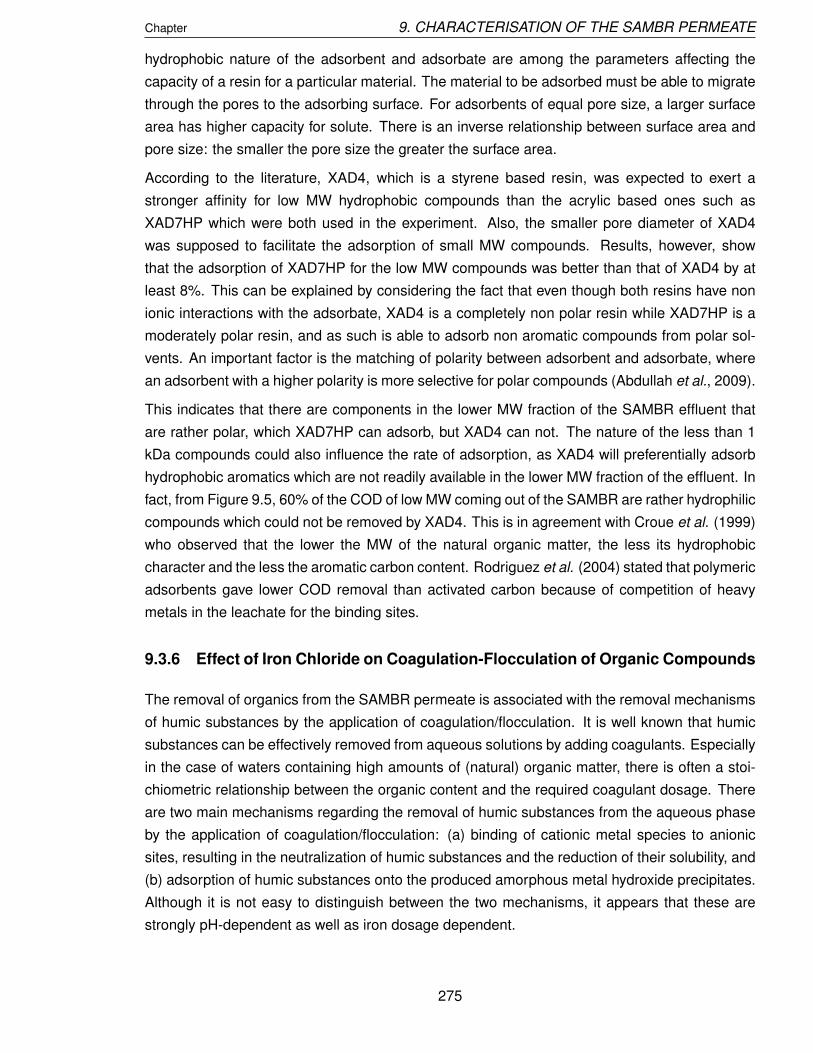
Chapter 9. CHARACTERISATION OF THE SAMBR PERMEATE
hydrophobic nature of the adsorbent and adsorbate are among the parameters affecting the
capacity of a resin for a particular material. The material to be adsorbed must be able to migrate
through the pores to the adsorbing surface. For adsorbents of equal pore size, a larger surface
area has higher capacity for solute. There is an inverse relationship between surface area and
pore size: the smaller the pore size the greater the surface area.
According to the literature, XAD4, which is a styrene based resin, was expected to exert a
stronger affinity for low MW hydrophobic compounds than the acrylic based ones such as
XAD7HP which were both used in the experiment. Also, the smaller pore diameter of XAD4
was supposed to facilitate the adsorption of small MW compounds. Results, however, show
that the adsorption of XAD7HP for the low MW compounds was better than that of XAD4 by at
least 8%. This can be explained by considering the fact that even though both resins have non
ionic interactions with the adsorbate, XAD4 is a completely non polar resin while XAD7HP is a
moderately polar resin, and as such is able to adsorb non aromatic compounds from polar sol-
vents. An important factor is the matching of polarity between adsorbent and adsorbate, where
an adsorbent with a higher polarity is more selective for polar compounds (Abdullah et al., 2009).
This indicates that there are components in the lower MW fraction of the SAMBR effluent that
are rather polar, which XAD7HP can adsorb, but XAD4 can not. The nature of the less than 1
kDa compounds could also influence the rate of adsorption, as XAD4 will preferentially adsorb
hydrophobic aromatics which are not readily available in the lower MW fraction of the effluent. In
fact, from Figure 9.5, 60% of the COD of low MW coming out of the SAMBR are rather hydrophilic
compounds which could not be removed by XAD4. This is in agreement with Croue et al. (1999)
who observed that the lower the MW of the natural organic matter, the less its hydrophobic
character and the less the aromatic carbon content. Rodriguez et al. (2004) stated that polymeric
adsorbents gave lower COD removal than activated carbon because of competition of heavy
metals in the leachate for the binding sites.
9.3.6 Effect of Iron Chloride on Coagulation-Flocculation of Organic Compounds
The removal of organics from the SAMBR permeate is associated with the removal mechanisms
of humic substances by the application of coagulation/flocculation. It is well known that humic
substances can be effectively removed from aqueous solutions by adding coagulants. Especially
in the case of waters containing high amounts of (natural) organic matter, there is often a stoi-
chiometric relationship between the organic content and the required coagulant dosage. There
are two main mechanisms regarding the removal of humic substances from the aqueous phase
by the application of coagulation/flocculation: (a) binding of cationic metal species to anionic
sites, resulting in the neutralization of humic substances and the reduction of their solubility, and
(b) adsorption of humic substances onto the produced amorphous metal hydroxide precipitates.
Although it is not easy to distinguish between the two mechanisms, it appears that these are
strongly pH-dependent as well as iron dosage dependent.
275

Chapter 9. CHARACTERISATION OF THE SAMBR PERMEATE
9.3.6.1 Effect of pH on Coagulation: Effluent pH value is approximately 8, and the humic
substances are negatively charged, whereas Fe3+ ions are positively charged which results in
charge neutralization of the humic substances. The pH values were changed to 5, 8 and 9, while
using a constant concentration of 1 g/l FeCl3, and the COD removal percentages were 28, 6
and 2%, respectively. These results show that optimum COD removal was obtained at a pH of
5 which is in agreement with results obtained in the literature (Zhang and Wang, 2008; Aziz et
al., 2007). The high concentration of positive soluble Fe species and positive FeOH at acidic
pH increased the probability of adsorption and charge neutralization interactions with refractory
organic substances (ROS) indicating the domination of a sorption mechanism as the primary
mechanism for the removal of organic matter. Acidification causes a decrease in stability and
as a result increases the natural coagulation of molecules. Increasing pH promotes deprotona-
tion of humic substances (increasing negatively charged species), and decreases the positive
charge on metal coagulants.
9.3.6.2 Effect of Coagulant Dosage: Iron (III) compounds accomplish destabilisation of col-
loids by three mechanisms: (1) double-layer compaction; (2) adsorption and charge neutralisa-
tion which includes coordination; and (3) enmeshment in sweep flocs. The amount of electrolyte
required to achieve coagulation by double-layer compaction is practically independent of the con-
centration of colloids in the dispersion. Sweep-floc coagulation is characterized by an inverse
relationship between the optimum coagulant dosage and the concentration of colloids to be re-
moved. Destabilisation by adsorption and charge neutralization is stoichiometric so the required
dosage of coagulant increases as the concentration of colloids increases.
Figure 9.6: Evolution with time of the COD removal percentage of the organics with 0.5,1 and 3 g/l FeCl3 at pH5.
However, results obtained by varying the coagulant concentration from 0.5, 1 and 3 g/l show
276

Chapter 9. CHARACTERISATION OF THE SAMBR PERMEATE
an increase in COD removal of about 18% initially as the concentration of coagulant increases
from 0.5 to 1 g/l, but as the concentration further increases from 1 to 3 g/l, the COD removal
decreased by about 10%. This gives an optimum concentration of coagulant between 1 and 3
g/l. This may be due to a possible restabilisation of colloids that occurs due to a charge reversal
of the colloids as the concentration of the coagulant increases beyond 1 g/l. It was also observed
that the increase in contact time reduced the stability of colloids formed as could be seen from
the percentage of COD removed at time 1hr and 24hrs, respectively. Therefore, for coagulation
using FeCl3 the maximum contact time should not be more than 1hr for effective coagulation.
The low percentage removal observed in our study contradicts the 70% COD removal observed
by Ntampou et al. (2006) at 1.1 g FeCl3/l. Aziz et al. (2007) obtained 27% and 51% COD removal
at FeCl3 dosage of 200 and 1200 mg/L, respectively, which suggests that our iron dosage was
maybe not optimal or that the nature of the SAMBR permeate makes it less prone to coagulation.
9.3.6.3 Effect of Polyelectrolyte Addition on Flocculation/Coagulation: Polyelectrolytes are poly-
mers with ionisable groups. In polar solvents such as water, these groups can dissociate, leaving
charges on polymer chains and releasing counterions into solution. Examples of polyelectrolytes
include polystyrene sulfonate, polyacrylic and polymethacrylic acids and their salts. Electrostatic
interactions between charges lead to the rich behavior of polyelectrolyte solutions which is qual-
itatively different from those of uncharged polymers. The Magnafloc flocculants used were E24,
MF10, LT31, MF33 and MF 4240 at a concentration of 0.5 mg/l. When they were used alone
(with no FeCl3), a COD removal of 5% was obtained with all five polyelectrolytes indicating that
their charge had no substantial effect.
Then, the effect of the polyelectrolytes was studied to determine their effects on the coagulation
of organic compounds with FeCl3 (1g/l, pH5). The results obtained showed that the addition
of polyelectrolytes had a positive effect on the percentage COD removal. After 30 minutes of
addition of FeCl3 and the flocculants there was COD removals of 44 to 46% as compared with
only about 32% with FeCl3 acting alone. This is similar to Gotvajn et al. (2009) who achieved
34% with 1g/l FeCl3 alone, and 51% with FeCl3 with 2.5mg/l polyelectrolyte. The enhanced re-
moval is due to the fact that polyelectrolytes can form additional inter-molecular bonds (bridging
effect) (Baraniak et al., 2004; Mahvi and Razavi, 2005). After 30 minutes contact time, there was
not much difference in COD removal among the various polyelectrolytes used. The addition of
polyelectrolyte therefore increases the rate of COD removal within a very short time interval. Al-
though there was no significant difference amongst the polyelectrolytes, LT31 was used to study
the effect of varying polyelectrolyte concentration on efficiency of coagulation/ flocculation.
9.3.6.4 Effect of Polyelectrolyte Concentration: A dosage of 1g/l FeCl3 was added to the sam-
ple initially, then after 20 minutes, 0.5 mg/l of polyelectrolyte LT31 was added to the sample. In
this case, unlike the previous experiment, the flocculant was not added at the same time as the
coagulant. This way, the individual effects of both coagulant and flocculant can be studied. It
was observed that after 20 mins (addition of only FeCl3), the COD removed was 39%. Then one
minute after addition of LT31 a further 4% in COD removed was observed after which a longer277

Chapter 9. CHARACTERISATION OF THE SAMBR PERMEATE
contact time did not give any further increase in COD removal, thus achieving a total removal of
43%. To study the effect of a variation in the concentration of LT31, the same concentration of
FeCl3 was added to the sample, but this time 5 mg/l of polyelectrolyte was used. It was observed
in this case that after 20mins (addition of only FeCl3), the COD removed was 34%, and after the
addition of polyelectrolyte, a further 13% in COD removal was obtained, thus achieving a total
removal of 47%. Therefore, increasing the polyelectrolyte concentration did not significantly in-
crease the amount of COD removed, which is in line with Gotvajn et al. (2009), and the increase
in contact time beyond 30 minutes did not increase the amount of COD removed.
9.3.7 Anaerobic Toxicity Assay (ATA)
Interference with the metabolism of methanogenic cultures can manifest itself in several different
ways in these tests. If the test compound is extremely toxic, it may kill all the micro organisms
responsible for at least one step in the metabolic sequence. In a slightly less severe situation,
the test compound may totally or partial inhibit microbial metabolism. If the compound does not
completely inhibit metabolism, some bacterial activity will continue, and the culture may eventu-
ally detoxify or acclimate to the compound, allowing a return to the same specific metabolic rate
as in the absence of toxicant. If the toxicant can be degraded to methane by the culture after
some acclimation period, the evidence of toxicity in an ATA may be either a decreased initial gas
production or a lag phase before gas production begins. In either case, the toxic effects should
diminish with time and the ultimate gas production will reflect the additional gas generated by
utilization of the test compound. One other possible result of the ATA is that the production of
CH4 gas may continue without any effect of the test compound. This may occur with or without
any utilisation of the test compound, and would be apparent if the gas production were equal to
or greater than that in the controls.
278

Chapter 9. CHARACTERISATION OF THE SAMBR PERMEATE
Figure 9.7: Anaerobic Toxicity Assay on 2,6 - di -tert- butyl- 4- (dimethylaminomethyl)phenol, Bis(2-Ethylhexyl)phthalate and o-hydroxybiphenyl. The maximumstandard deviation was 0.2 ml.
279

Chapter 9. CHARACTERISATION OF THE SAMBR PERMEATE
Results obtained from the ATA in Figure 9.7 show that 2,6 - di -tert- butyl- 4- (dimethylaminomethyl)
phenol was comparatively non toxic at all the various concentrations studied. This is because
the presence of the test compound did not affect the metabolic rates of the methanogens evi-
denced by gas production at the same rate or at a greater rate than the controls. Results show
that at concentrations of 0.002, 0.02, 0.2, 2 and 20 mg/l there was no inhibitory effect as a result
of the plasticizer, with methane production as much as that of the control at all times. However,
with the 200 mg/l concentration, there was a slightly partial inhibition as the methane production
was more sluggish until day 14 (about half the control on day 14) before it acclimated and then
returned to the same specific rate as in the absence of the plasticizer on day 21.
With Bis(2-Ethylhexyl)phthalate, it was observed that there was no inhibitory effects of the test
compound on the rate of methane production. This is because at all times the volume of methane
produced was equal to or greater than the volume of methane produced by the control. The
presence of the test compound did not interfere with metabolic rate. DEHP has a relatively high
hydrophobicity (log P = 8.7) which make it ”stick” to the biomass. It could also stick to the glass
walls, in which case the toxicity may not be evaluated.
O-hydroxybiphenyl was found to be the most toxic of the three plasticizers tested. As results
show the slower methane production before day 21 compared to the control. At concentration of
200 mg/l, there was a very severe inhibition and it took more than thirty days for the microbes to
acclimmate and begin metabolizing the acetic acid to produce methane gas.
In all cases studied, except for DEHP for which there was hardly any effect on metabolic rate,
it can be deduced that the duration of the period of no gas production generally increases with
toxicant concentration, and the most interesting part of this work is that in all cases where tox-
icity occurred, the organisms eventually acclimate to the toxicant and gas production returns to
normal. From theoretical calculations, the ultimate volume of CH4 gas that can theoretically be
produced from the metabolism of acetic acid by microorganisms is approximately 16.8 ml (40
mg acetic acid is 42.7 mg COD and 42.7 mg COD x 0.395 ml CH4/mg COD = 16.8 ml CH4 at
35 ˚ C). If it is considered that 10% of the COD is taken for bacterial growth and maintenance
(Bull et al., 1983), there should be about 15 ml produced from the control. The blank produced
2.6 ml methane due to cell lysis because no carbon source was fed which is not the case in
the control bottle. This emphasizes the limitation of biodegradability test as the blank reflects
an auto-lysis phenomenon due to starvation, whereas the other bottles do not experience this
unless the bottles are left for a very long period after the carbon source has been depleted.
Therefore, the blank value should not be substracted from the sample bottles as in Figure 9.7.
In that case, 2.6 ml should be added to the ultimate values shown in Figure 9.7 and as a result
it can be stated that the control produced 12.7 + 2.6 = 15.3 ml which is more realistic.
Now, it is interesting to know whether the methane production was due to acetic acid only or if the
plasticizer was also biodegraded. if the 200 mg/l concentration is considered, there was 4 mg of
each plasticizer fed to the 20 ml bottle and the theoretical COD content can be calculated as 11.2,
10.3 and 10.5 mg COD, respectively, for 2,6 - di -tert- butyl- 4- (dimethylaminomethyl) phenol,
DEHP and o-hydroxybiphenyl. Hence, if the compounds were biodegraded there should be circa
25% additional methane production (10-11 mg COD in addition to the 40 mg of acetic acid). As280

Chapter 9. CHARACTERISATION OF THE SAMBR PERMEATE
a result, a cumulative methane production of about 20-21 ml should have been observed if the
plasticizer was converted to methane too.
Polymers such as the plasticizers used in this study are potential substrates for heterotrophic mi-
croorganisms. Polymer biodegradability depends on MW, crystalline and physical forms. Gen-
erally, an increase in MW results in a decline of polymer degradability by microorganisms. In
contrast, monomers, dimers, and oligomers of a polymer’s repeating units are much more eas-
ily degraded and mineralized. High MWs result in a sharp decrease in solubility making them
unfavourable for microbial attack because bacteria require the substrate be assimilated through
the cellular membrane and then further degraded by cellular enzymes.
Within the limits of experimental error, this additional methane was not obtained with 2,6 - di
-tert- butyl- 4- (dimethylaminomethyl) phenol and DEHP because of the close value between
the control and the 200 mg/l curve. DEHP is known to be barely biodegradable (Bauer and
Herrmann, 1997). Asakura et al. (2004) found that it could not be removed by aeration, co-
agulation/sedimentation nor biological treatment. However, for o-hydroxybiphenyl at 200 mg/l,
although there was a strong delay in methane production, the ultimate value was indeed 25%
greater than the control. Thus, o-hydroxybiphenyl was biodegraded and the long lag phase might
have been an adaptation period necessary to co-metabolize acetic acid and o-hydroxybiphenyl.
This is in agreement with previous studies where o-hydroxybiphenyl was found to be biode-
graded by Pseudomonas species via successive steps (Furukawa et al., 1987; Suske et al.,
1999). The reason why it was found in the SAMBR effluent is likely to be due to its very small
concentrations which makes its degradation by bacteria unfavourable due to high Ks values.
9.3.8 Size Exclusion Chromatography Results
Size Exclusion Chromatography (SEC) uses a porous gel to separate molecules of different
sizes. It is generally used to separate biological molecules, and to determine MWs and MW dis-
tributions of polymers. In SEC, higher MW compounds elute faster than lower MW compounds
because molecules that are smaller than the pore size can diffuse deeper into the pores, and
therefore have a longer transit time than larger molecules that cannot enter the pores. Large
molecules elute together as the first peak in the chromatogram. This condition is called total
exclusion. Molecules that can enter the pores will have an average residence time in the gel
pores that depends on the molecules size and shape. Standards are shown in Figure 9.8.
9.3.8.1 Effect of pH on the initial sample: The SEC results in Figure 9.8 show that when the
effluent sample pH was changed to 2, all the high MW compounds in the sample were converted
to low MW by acid hydrolysis, while the low MW ones were further reduced to lower MWs. When
the pH was adjusted to 7, the height of the high MW compounds peak decreased while the
low MW one increased meaning that some high MW compounds were hydrolyzed but not all.
However, at pH 12 there was an increase in abundance of both high and low MW compounds
compared to the concentration of the original sample. This is no clear why. It could be due to
281
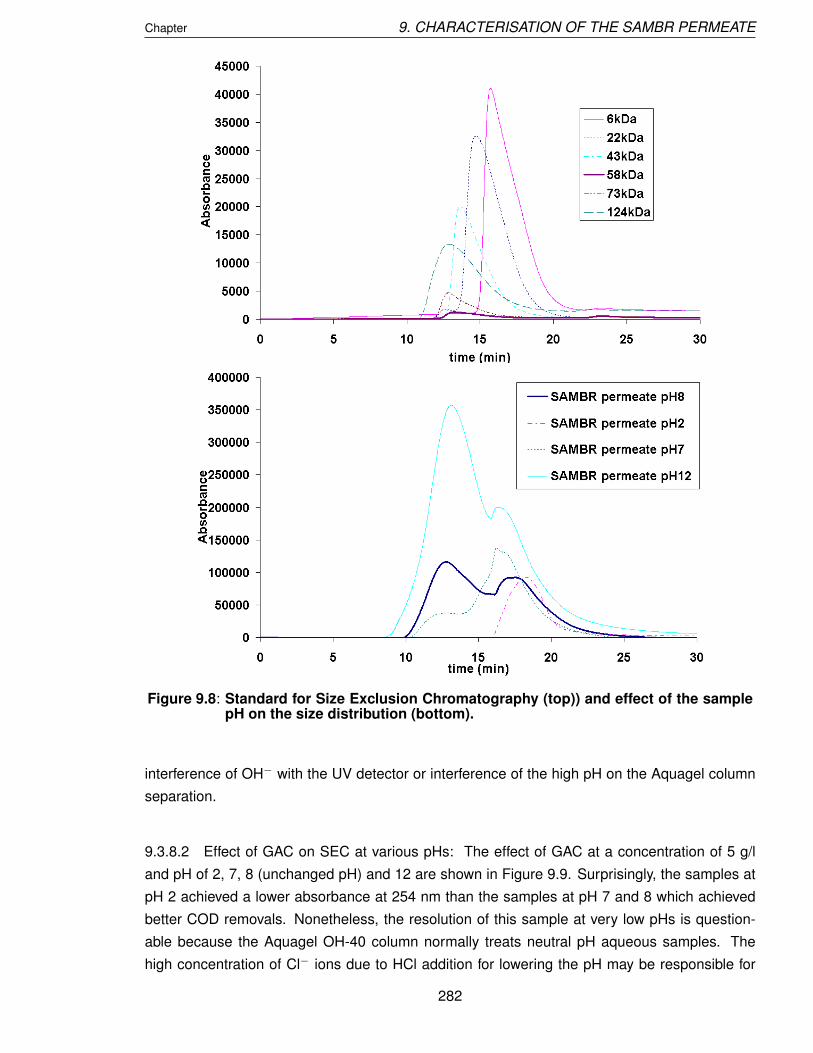
Chapter 9. CHARACTERISATION OF THE SAMBR PERMEATE
Figure 9.8: Standard for Size Exclusion Chromatography (top)) and effect of the samplepH on the size distribution (bottom).
interference of OH− with the UV detector or interference of the high pH on the Aquagel column
separation.
9.3.8.2 Effect of GAC on SEC at various pHs: The effect of GAC at a concentration of 5 g/l
and pH of 2, 7, 8 (unchanged pH) and 12 are shown in Figure 9.9. Surprisingly, the samples at
pH 2 achieved a lower absorbance at 254 nm than the samples at pH 7 and 8 which achieved
better COD removals. Nonetheless, the resolution of this sample at very low pHs is question-
able because the Aquagel OH-40 column normally treats neutral pH aqueous samples. The
high concentration of Cl− ions due to HCl addition for lowering the pH may be responsible for
282

Chapter 9. CHARACTERISATION OF THE SAMBR PERMEATE
Figure 9.9: Effect of GAC on size distribution at various pHs.
interfering with the UV absorbance. Indeed, with the pH 2 sample, negative absorbances were
obtained which has no physical meaning and were omitted on the graphs. At pH 7, given the
same concentration of GAC, both high and low MW compounds were effectively removed.
9.3.8.3 Effect of PAC and GAC dosage on SEC: Results obtained from Figure 9.10 show
that both GAC and PAC were efficient in removing both high and low MW compounds, and the
efficiency was highest at a concentration of 10 g/l, as compared to concentrations of 1 and 5 g/l,
respectively; this is consistent with observations made with COD analysis. However, the graphs
also show that PAC worked better for both high and low MW compounds in terms of the amount
of aromatics removed from the original effluent.
9.3.8.4 Kinetics of PAC and GAC on SEC: The kinetics of adsorption onto GAC and PAC at
10 g/L was studied in terms of COD in section 9.3.2. In this section, it was studied in terms of
size distribution. Figure 9.11 confirmed that both high and low MW compounds were adsorbed
from the very first minutes of contact time. However, PAC removed low MW aromatics much
faster than GAC. The COD removal by PAC during the first 5 minutes is mainly due to low MW
aromatics removal. Furthermore, the adsorption of these low MW aromatics reached equilibrium
very quickly as no more adsorption took place after only 5 minutes. This indicates that there is a
fraction of low MW aromatics that could not be removed no matter how long the contact time. Due
to the high PAC concentration it is unlikely to be a saturation of the PAC micropores. Instead, it is
thought to be due to the nature of these low MW aromatics that are hydrophilic and will not adsorb
onto PAC. DeWalle and Chian (1974) also found that the low MW fraction, consisting of mostly
polar organic compounds, were poorly adsorbed. PAC could remove about 80% of high and low
MW aromatic compounds. The COD analysis revealed that these unadsorbable hydrophilic low283

Chapter 9. CHARACTERISATION OF THE SAMBR PERMEATE
Figure 9.10: Effect of GAC (top) and PAC (bottom) dosage on size distribution after 24hours of contact time.
MW compounds accounted for 20% of the total low MW (≤ 1 kDa). These compounds are likely
to be responsible for membrane fouling when PAC was added to the SAMBR in Chapter 8, as
they could not be adsorbed onto PAC and no flux improvment was noticed in the SAMBR after
PAC addition. Indeed, Chen et al. (2007) found that low MW neutral hydrophilic compounds
were responsible for the slow flux decline of UF membranes.
Nonetheless, COD analysis in Section 9.3.2 had shown that for compounds smaller than 1 kDa
the COD removal was slightly lower at 65% after 5 minutes and still 62% after 15 minutes,
which demonstrated a slower adsorption rate. Therefore, from the COD and SEC analysis it
can be concluded that the kinetics of PAC adsorption depends mainly on the adsorption of
high MW aromatics, whereas the extent of adsorption is limited because of low MW hydrophilic284

Chapter 9. CHARACTERISATION OF THE SAMBR PERMEATE
Figure 9.11: Kinetics of GAC (top) and PAC (bottom) adsorption at 10 g/l.
compounds.
The adsorption of high MW aromatics was slower probably due to diffusional limitations, and
because high MW aromatics could not access the micropores in PAC and GAC. Large MW
ROS can affect adsorption kinetics through pore blockage (Humbert et al., 2007). The low MW
hydrophilic compounds do not suffer from diffusional problems, but from affinity problems with the
PAC. Thus, the rate-limiting step of adsorption onto PAC is the adsorption of high MW aromatics.
For GAC, the slower adsorption compared to PAC is due to slower adsorption of both high and
low MW aromatics because of the smaller surface area of GAC.
285

Chapter 9. CHARACTERISATION OF THE SAMBR PERMEATE
9.3.8.5 Effect of pH on coagulation-flocculation: Figure 9.12 shows that adjusting the pH of
the SAMBR permeate to 5 resulted in the hydrolysis of high MW aromatics and consequently
only one peak of low MW aromatics was obtained. This resulted in a higher COD removal as well
as a lower absorbance at pH 5 compared to pH 8 and 9 after 24 hours of contact time. Hence,
the effect of pH on COD removal was confirmed by SEC results. In this study, the removal of
high and low MW aromatics at pH 8 accounted for 38 and 34%, respectively, showing that COD
removal was due to coagulation of both high and low MW aromatics. This suggested that about
65% of aromatic compounds in the SAMBR permeate were uncharged humic substances, or
that the iron dosage was not stoichiometric with respect to humic substances.
Figure 9.12: Effect of pH on coagulation-flocculation with 1g/l FeCl3 (top) and effect ofFeCl3 dosage on coagulation-flocculation at pH 5 (bottom).
However, the SEC at 3g/l showed a greater removal of aromatics although the COD analysis286

Chapter 9. CHARACTERISATION OF THE SAMBR PERMEATE
had demonstrated a lower COD removal due to restabilization of colloids that may occur due to
a charge reversal of the colloids at this FeCl3 concentration. This implies that 3 g/l resulted in
greater removal of low MW aromatics, but was accompanied by a restabilization of low MW non
aromatic compounds, resulting in a lower COD removal.
9.3.8.6 Effect of Polymeric Adsorbents on Aromatic compounds removal: Figure 9.13 shows
that after the addition of XAD7HP high and low MW aromatics were removed; however, there
was not much difference in the amount of aromatics removed when XAD4 was added to the
filtered effluent from the XAD7HP-treated sample. Based on the absorbance, about 20% of high
MW aromatics were removed, whereas about 60% were removed of the low MW aromatics.
This indicates that a large fraction of the high MW compounds could not be removed because
of their MW. Indeed, XAD7HP is recommended for non-polar compounds up to 60 kDa. So
clearly the high MW compounds from the SAMBR permeate are too big to enter the pores of
XAD7HP for efficient removal. On the other hand, about 60% of low MW aromatic compounds
could be removed because of their hydrophobicity which indicates that 40% of low MW aromatic
are rather hydrophilic and exhibit a low affinity for XAD7HP. XAD4 used after XAD7HP could not
remove much more of the low MW compounds as most of them had already been removed by
XAD7HP.
Figure 9.13: Effect of polymeric adsorbents on aromatic compounds removal at pH 8.
9.4 SUMMARY
The results showed that:
• PAC and GAC were more effective in removing both low and high MW compounds from
the SAMBR effluent compared to both FeCl3 and the polymeric adsorbents.287

Chapter 9. CHARACTERISATION OF THE SAMBR PERMEATE
• PAC was effective in removing both high and low MW compounds from the SAMBR ef-
fluent. The removal of low MW aromatic compounds was fast (within 5 minutes), but not
complete; the lower adsorption rate observed in the COD analysis appears to be due to
low MW non-aromatic compounds. The kinetics of PAC adsorption depended mainly on the
adsorption of high MW aromatics, whereas the extent of adsorption was limited because
of low MW hydrophilic compounds. PAC could remove about 80% of high and low MW
aromatic compounds. These unadsorbable hydrophilic low MW compounds accounted for
20% of the total low MW (≤ 1 kDa). The main difference between GAC and PAC was the
kinetics of removal of low MW compounds that was faster in the case of PAC.
• Coagulation-flocculation with iron chloride could remove about 30-34% COD at pH 5 and
a dosage of 1g/l. Higher doses (3g/l) resulted in a greater removal of low MW aromatics,
but also in restabilisation of low MW non aromatic compounds due to a charge reversal of
the colloids, resulting eventually in a lower COD removal. Also short contact times were
found to produce better coagulation effects, as restabilization occurred as contact time was
increased.
• The addition of 0.5 mg/l polyelectrolyte improved the efficiency of the coagulation-flocculation
process as a COD removal of about 45% could be obtained; a ten-fold increase in the poly-
electrolyte concentration did not significantly improve the COD removal.
• Polymeric adsorbents resins are not as effective as activated carbon in removing high and
low MW fractions of the SAMBR effluent, and the efficiency depended on the nature of the
low MW fraction. 60% of low MW aromatic compounds could be removed by XAD7HP,
but this only accounted for 48% COD removal. The remaining COD was due to low MW
aromatics that are rather hydrophilic and exhibit a low affinity for XAD7HP. About 20% of
high MW aromatics were removed because XAD7HP is effective for non-polar compounds
up to 60 kDa. Its pores are too narrow for removal of high MW compounds in the SAMBR
permeate.
• ATA results showed no effect of concentrations in the range 0.002 to 20 mg/l for 2,6 -
di -tert- butyl- 4- (dimethylaminomethyl) phenol. However, at 200 mg/l a 50% drop in
methane production was observed on day 14 after which it returned to the same levels
as the control. No effects were noticed for Bis(2-Ethylhexyl)phthalate. These two plas-
ticizer were not biodegraded but did not impede methanogenesis at 200 mg/l. Finally,
for o-hydroxybiphenyl, a 75% drop in methane production was noticed at 20 mg/l on day
14, whereas no gas was produced at 200 mg/l before thirty days. After acclimation, o-
hydroxybiphenyl at 200 mg/l could be biodegraded resulting in a 25% increase in methane
production compared to the control.
288

Chapter 10
CONCLUSIONS AND FUTURE WORK
10.1 CONCLUDING DISCUSSION
The main aims of this study were to: evaluate the role of acetic acid in the chemical hydrolysis
of OFMSW; evaluate the feasibility of the degradation of OFMSW in a novel 2-phase anaerobic
system, and; to investigate the factors governing the performance of the HR and SAMBR. Based
on the experimental findings, the following points can be made:
10.1.1 investigation of the role of acetic acid in the chemical hydrolysis of theOFMSW
• It was found that at neutral pH and at small acetic acid concentrations (500 mg/l) there was
no significant chemical hydrolysis compared to the control. In contrast, at pH 4 the acetic
acid is in the undissociated form, and at high concentrations (8.8 g/L) the solubilisation
yield was 32% which is 2 times more than in the control showing that a fraction of the
cellulose and hemicellulose could be solubilised under these conditions. However, low
pHs required for these conditions are incompatible with the anaerobic digestion that takes
place at neutral pHs. Thus chemical hydrolysis is unlikely to occur in anaerobic digester
during normal operation.
10.1.2 Investigation of the effect of a macrofilter and performance of the HR op-erating at various SRT, HRTs and temperature.
• The various tests with a macrofilter in the HR have shown that a 10 micron filter was
inappropriate as the leachate flowrate from the HR was not sufficient to go below 4 days
HRT in the SAMBR. Macrofilters with a pore size greater than 150 microns were also
inappropriate due to large particles being present in the leachate which then built up in the
SAMBR. Therefore, it is thought that the optimum mesh should be between 10 and 100
microns. A threshold for TSS in the leachate was found to be 5 g/L as explained in Chapter
8 as no MLTSS build up was observed in the SAMBR at 1.1 day HRT.
• The most important parameter for VS removal in the HR was the SRT. Minimum SRTs of
50-60 days are recommended to achieve at least 75% VS removal. This was possible at
a HRT of 9-12 days and an OLR of 4 g VS/l.day with a methane yield of 0.16 l/g VS in the289

Chapter 10. CONCLUSIONS AND FUTURE WORK
HR and 0.15-0.23 l/g COD in the SAMBR. Increasing the SRT to beyond 100 days did not
significantly increase the VS removal in the HR. However, at an OLR of 10 g VS/l.day in the
HR the SRT had to be reduced due to build up of TS in the HR that impeded the stirring.
Below 20 days SRT, the VS removal was between 30 and 40%. With kitchen waste as the
main substrate, however, an OLR of 10 g VS/l.day was achieved with 81% VS removal at
23 days SRT and 1.8 days HRT.
• At ambient temperature (20-22 ˚ C) the VS removal in the HR dropped to 50% at 66 days
SRT. The VS removal dropped to 45% at 38 days SRT and ambient temperature.
• The operation of the HR at 2.2 days HRT was possible in Chapter 6 without a pH drop
because the OFMSW does not acidify readily even when an OLR of 16 g VS/l.day was
applied. Nonetheless, the VS removal in that case was only 14%.
• At 4 g VS/L.day and with a solids retention time greater than 70 days, the digestate taken
from the HR emitted carbon dioxide at a rate lower than 25 mg CO2 /g VS.d after 3 days
of aeration. Some digestates were even below the threshold of 16 mg CO2 /g VS.d recom-
mended for a stable compost according to the British standard BSI PAS 100:2005 (WRAP,
2005). In contrast, when the SRT was less than 20 days due to an increase in the OLR
to 10 g VS/L.day, the digestates displayed a respiration rate greater than 25 after three
days of aeration, and even greater than 30 mg CO2 g VS-1.d-1 when the SRT dropped to
6 - 7 days. These higher respirometric activities were associated with lower VS removal in
the HR at these SRTs. Furthermore, after 15 to 24 days of aeration all the samples were
below the limit of stability. When the digestate was pasteurized for 7 days at 65 ˚ C, a very
mature compost was obtained.
10.1.3 Characterisation of the archaeal and bacterial populations using Denatur-ing Gradient Gel Electrophoresis (DGGE)
• Molecular biology techniques allowed us to understand in a deeper way the evolution of
microorganisms found in two-stage processes treating OFMSW. It was found that syn-
trophic associations took place in the HR with obligate hydrogenotrophic methanogens and
hydrogen-consuming acetotrophs such as: (i) Methanobacterium formicicum and Methanosarcina
barkeri ; (ii) Methanobrevibacter and Methanosarcina mazeii, but these microorganisms
were only detected at ambient temperature. Regarding the bacterial population it was
found that the SAMBR and the HR shared a similar diversity due to the inoculation of the
SAMBR by the HR because of the microorganisms present in the leachate. Then over time
the population changes and the diversity was reduced to a smaller number of more active
species. Some species like Spirochaeta sp. could only survive in the SAMBR, but not in
the HR. The drop in VS removal in the HR at room temperature was correlated with the
disappearance of some bands, while some other became fainter such as Ruminococcus
flavefaciens which is a critical microorganism found in the rumen of animals.
• Using molecular techniques in Chapter 8, it was found that in the conventional SAMBR
290
Chapter 10. CONCLUSIONS AND FUTURE WORK
the archaeal diversity was lower than in the SAMBR-MABR due to lower SRT. Neverthe-
less, the lower archaeal diversity did not impede VFAs degradation as their concentrations
remained low until the shock to low temperatures. Thus VFA degradation was complete
inasmuch as one or two dominant species were present as was the case in the conven-
tional SAMBR. Similarly, the SAMBR-MABR could start-up VFA degradation with only two
main species. Then with time the number of bands increased to 12 as the HRT was re-
duced to 1.1 days at 35 ˚ C. This high diversity helped the SAMBR-MABR to keep low VFA
concentrations even at 20 ˚ which was not the case in the conventional SAMBR. In the
conventional SAMBR, the archeal population changed radically as the temperature was
set at 20 ˚ C, but not in the SAMBR-MABR. At 10 ˚ C the bands such as Methanosaeta
and Methanosarcina mazeii were more intense in the membrane biofilm of both reactors
than in the bulk which could mean that the biofilm sheltered the methanogens from the low
temperatures.
• Regarding the bacterial community, members the genus Prevotella were found to be the
dominant species in the HR, and they became more dominant with time. It was found
that the most diverse population was found in the SAMBR-MABR. The population did not
change significantly when the feed was changed to kitchen waste, but changed drastically
when the SAMBR-MABR was operated at 20 ˚ C. Some bands became brighter at 20 ˚ C
such as members of the genus Anaerovorax, Smithella and Prevotella. In particular, the
bacterium Syntrophaceae from the genus Smithella is a propionate oxidising bacteria, and
as such could be one of the key microorganisms in the process because propionate was
found to build up very frequently in the HR in the previous chapters, probably due to the
absence of this bacterium. Similarly to what was observed for Archaea, the bands were
very bright in the biofilm (lane 115 B) probably due to higher cell density on the biofilm than
in the bulk at 10 ˚ C. It was also found that Spirochetales could survive at all HRTs in the
SAMBR-MABR, but disappeared as soon as the temperature dropped to 20 ˚ C. However,
it was still found in the biofilm at 10 ˚ C. A bacterium from the genus Hydrogenophaga was
also found in the SAMBR-MABR which suggested another route for hydrogen degradation
than the degradation by archaea to produce methane. Using primers for AOB it was found
that Nitrosomonas and Nitrosospira species were present in the SAMBR-MABR due to the
biofilm grown on the aerated Kubota membrane.
10.1.4 Treatment of the effluent of the HR in a SAMBR and determination of theeffect of SRT, HRT and temperature on COD removal, permeate flux andstability
• The SAMBR was found to remain stable at an OLR up to 19.8 g COD/l.day and at a HRT of
0.4 day, while the COD removal was 95%. However, the performance was not sustainable
due to membrane flux limitations when the MLTSS went beyond 20 g/l due to an increase
in viscosity and inorganics concentration.
• Regarding the start up of the SAMBR with two different inocula, it was found that the inocu-
lum fed on synthetic VFAs was not suitable for start-up because it did not contain hydrolytic291

Chapter 10. CONCLUSIONS AND FUTURE WORK
and acidogenic bacteria for a leachate medium. As a result, a slow production of VFAs,
and therefore a slow increase in methane production were observed. For a lignocellulosic-
based feed, it is paramount to start up the SAMBR with a hydrolytic population acclimatised
to the leachate medium to avoid SCOD build up in the bulk.
• The SAMBR was found to be stable at SRTs down to 45 days. At lower SRTs, the VFAs
were found to remain low due to attachment of methanogens to the membrane or reactor
panels, except when a simultaneous HRT shock to 2 days and a SRT shock to 25 days
was applied. When the SRT was lowered to 12.5 days, the VFA concentration remained
below 200 mg/L. In contrast, the SCOD built up in the bulk at every HRT tested when the
SRT was less than 45 days. The SCOD did not build up when the SRT was greater than 45
days and at a minimum HRT of 3.9 days. This is due to the washout of hydrolytic bacteria
at SRTs lower than 45 days, and although hydrolytic bacteria are fast growing, they could
not compensate for the feeding rate.
• It was found that the SAMBR started producing methane very quickly (within 1 week) com-
pared to the HR. Even though the influent COD of the leachate was constantly changing
giving rise to a transitory F/M ratio over time, the permeate COD from the SAMBR was typ-
ically between 300 and 500 mg/L which can therefore be defined as a stabilised leachate.
The start up of the SAMBR was possible at 4-5 days HRT with an acclimatised inoculum.
The excess sludge from the SAMBR can be used to re-inoculate the HR, inasmuch as the
SRT in the SAMBR was greater than 45 days. This sludge recycle is thought to have fos-
tered the presence of hydrogenotrophic methanogens in the HR as 6 out of 9 bands were
hydrogenotrophs while the other three belonged to the genus Methanosarcina. Alterna-
tively, the predominance of hydrogenotrophs such as Methanobrevibacter and Methanobac-
terium Formicicum could have been due to the ambient temperatures in the HR that have
been reported to favour hydrogenotrophic methanogenesis as the main route for methane
production.
• The SAMBR could achieve 90% COD removal at 22 ˚ C at an OLR of 13.4 g COD/l.day and
1.1 days HRT. However, some particulate COD could not be hydrolysed as indicated by a
methane yield that dropped from 0.25 l/g COD at 35 ˚ C to 0.14-0.16 l/g COD at 22 ˚ C.
10.1.5 Identification of the main foulants of the membrane in the SAMBR andAMBR
• With regards to the flux, the main factor that affected the performance was the concentra-
tion of solids in suspension and the precipitation of inorganics on the membrane. Above
20 g MLTSS/L, the flux dropped rapidly and was not recoverable with the techniques used
such as higher biogas sparging rates, relaxation, backflushing, and activated carbon addi-
tion. The chemical cleaning did not allow us to recover the full flux of the virgin membrane
at 1% sodium hypochlorite, oxalic acid and hydrochloric acid for a period of 2 hours. The
major contribution (83%) of the flux drop was due to inorganic precipitates on the mem-
brane, while it was not the main factor of the flux drop in the AMBR (32%), mainly because292

Chapter 10. CONCLUSIONS AND FUTURE WORK
the calcium precipitated first in the SAMBR. The precipitate was found to be hydroxylapatite
or monohydrocalcite, which is a hydrated form of calcium carbonate.
• A sample taken from the membrane consisted of pure hydroxylapatite Ca5(PO4)3(OH)
which had a needle shape, whereas the background of the precipitate consisted more
of nodules of calcium carbonate with traces of manganese, iron, magnesium, aluminium,
sulphur and sodium.
10.1.6 Investigation of nitrification of COD-polishing of an aerated MBR treatingthe permeate of the SAMBR
• The COD removal in the SAMBR was 94.5% on average, and only 1.6% in the AMBR so
that a total COD removal of 96.1% was achieved at 0.4 day HRT (Chapter 6). On average
26% of the recalcitrants from SAMBR2 could be degraded aerobically in the AMBR.
• The permeate of the SAMBR was low in COD and relatively constant which promoted
the growth of autotrophic bacteria in the subsequent AMBR so that 97.7% of the NH4-N
was removed at a maximum nitrogen loading rate of 0.18 kg NH4-N/m3.day. Complete
nitrification was not observed in the AMBR as the nitrite concentration did not reach zero.
This could be due to the low HRT (1 day) that could have overloaded the NOB such as
Nitrobacter, or because of the lack of close distance between the nitrite producers and
nitrite oxidisers which is required to obtain complete nitrification.
10.1.7 Characterisation of the effluent of the SAMBR and adsorption and floccu-lation/coagulation tests
• The very high MW aromatic organics in the leachate fed to the SAMBRs were almost fully
degraded in the bulk of the SAMBRs. Moreover, their permeate was absolutely free of them
which indicates a full rejection of these compounds by the membrane. The medium MW
compounds in the range of 395 - 646 kDa were more likely to be rejected by the membrane
while the MW ≤ 395 kDa were observed in the permeate. Regarding the evolution of the
medium and low MW compounds over the 200 days, it can be stated that overall there was
no buildup in the absorbance in any effluent, showing that these aromatics could be slowly
degraded.
• Most of the recalcitrant compounds detected by GC-MS in the effluent of the HR were
below 10 µg/L, while only two compounds (bisphenol A and unidentified compounds with
RI = 2096) were in the range 14 - 38 µg/L. The molecules o-hydroxybiphenyl and Bisphe-
nol A were found to be non biodegradable anaerobically because their areas increased
in SAMBR1 and SAMBR2. The concentration of the former was in the range 11 - 22
µg/L, while the latter was in the range 21-44 µg/L. Moreover, as bisphenol A was not
found in the AMBR permeate, it can be stated that it was fully biodegraded aerobically.
Some molecules were found to be non biodegradable in an anaerobic environment, but
293

Chapter 10. CONCLUSIONS AND FUTURE WORK
could be slowly biodegraded in the AMBR such as 2,5-cyclohexadien - 1 - one,2,6 bis(1,1-
dimethylethyl)- 4 -ethylidene- and bis (2-ethylhexyl) phthalate. Nevertheless, the compo-
nents of N-phenethylbenzenesulfonamide were found to build-up in the AMBR and reached
concentrations in the range 44-87 µg/L. Furthermore, new molecules appeared in the
AMBR permeate such as Diisobutyl phthalate.
• PAC and GAC were more effective in removing both low and high MW compounds from
the SAMBR effluent compared to both FeCl3 and the polymeric adsorbents.
• PAC was effective in removing both high and low MW compounds from the SAMBR ef-
fluent. The removal of low MW aromatic compounds was fast (within 5 minutes), but not
complete; the lower adsorption rate observed in the COD analysis appears to be due to
low MW non-aromatic compounds. The kinetics of PAC adsorption depended mainly on the
adsorption of high MW aromatics, whereas the extent of adsorption was limited because
of low MW hydrophilic compounds. PAC could remove about 80% of high and low MW
aromatic compounds. These unadsorbable hydrophilic low MW compounds accounted for
20% of the total low MW (≤ 1 kDa). The main difference between GAC and PAC was the
kinetics of removal of low MW compounds that was faster in the case of PAC.
• Coagulation-flocculation with iron chloride could remove about 30-34% COD at pH 5 and
a dosage of 1g/l. Higher doses (3g/l) resulted in a greater removal of low MW aromatics,
but also in restabilisation of low MW non aromatic compounds due to a charge reversal of
the colloids, resulting eventually in a lower COD removal. Also short contact times were
found to produce better coagulation effects, as restabilisation occurred as contact time was
increased.
• The addition of 0.5 mg/l polyelectrolyte improved the efficiency of the coagulation-flocculation
process as a COD removal of about 45% could be obtained; a ten-fold increase in the poly-
electrolyte concentration did not significantly improve the COD removal.
• Polymeric adsorbent resins are not as effective as activated carbon in removing high and
low MW fractions of the SAMBR effluent, and the efficiency depended on the nature of the
low MW fraction. 60% of low MW aromatic compounds could be removed by XAD7HP,
but this only accounted for 48% COD removal. The remaining COD was due to low MW
aromatics that are rather hydrophilic and exhibit a low affinity for XAD7HP. About 20% of
high MW aromatics were removed because XAD7HP is effective for non-polar compounds
up to 60 kDa. Its pores are too narrow for removal of high MW compounds in the SAMBR
permeate.
• ATA results showed no effect of concentrations in the range 0.002 to 20 mg/l for 2,6 -
di -tert- butyl- 4- (dimethylaminomethyl) phenol. However, at 200 mg/l a 50% drop in
methane production was observed on day 14 after which it returned to the same levels
as the control. No effects were noticed for bis(2-Ethylhexyl)phthalate. These two plasti-
cizer were not biodegraded but did not impede methanogenesis at 200mg/l. Finally, for
o-hydroxybiphenyl, a 75% drop in methane production was noticed at 20 mg/l on day294

Chapter 10. CONCLUSIONS AND FUTURE WORK
14, whereas no gas was produced at 200 mg/l before thirty days. After acclimation, o-
hydroxybiphenyl at 200 mg/l could be biodegraded resulting in a 25% increase in methane
production compared to the control.
10.2 RECOMMENDATIONS FOR FUTURE WORK
Since the OFMSW used in this work was a simulated one it would be interesting to use the
same process but with industrial leachate that contains more toxicants such as heavy metals
and endocrine disrupting compounds. The stability of the SAMBR in their presence should be
investigated. The presence of glass, stones and branches in the OFMSW feedstock should also
be investigated as it could damage the mesh in the HR. The performance of the HR should be
investigated in terms of cellulase and other enzymes activity to understand in a more fundamen-
tal manner changes in the microbial ecology and physiology of the system in relation to process
operating conditions. The production of enzymes should be correlated with specific bacteria us-
ing DGGE techniques so that these microorganisms could be introduced in the HR for a shorter
start up period and greater VS removals. This would allow us to tune the HR so that cellulase
production is maximum. Also, the solid digestate taken from the HR should be characterized in
terms of plant growth and phytotoxicity, as well as bacterial and fungal populations. The selec-
tion of the best fungi/microorganisms would enable us to inoculate the digestate so that shorter
aeration periods can be applied to obtain a mature compost. The characterisation of the diges-
tate chemistry using solid-state NMR spectroscopy, infrared Fourier transform spectroscopy and
off-line pyrolysis coupled to GC-MS are also needed in future work on the OFMSW (Spaccini
and Piccolo, 2009).
One of the main restrictions of the SAMBR was the available flux. One way to alleviate this issue
is to use a macrofilter in the HR to provide a particle-free leachate. As the meshes used on
this study were inappropriate the use of mesh with a pore size in the range 10 - 100 microns
should be further investigated, and the filtered leachate should be less than 5 g/L to avoid MLTSS
build up in the SAMBR. One of the main problems encountered with the SAMBR is the difficulty
to distinguish bacterial VSS from organic fibers from the OFMSW using the traditional MLVSS
method described in Standard Methods (APHA, 1999). As a result the F/M ratio in the SAMBR
could not be determined in this study. Therefore, the use of methods for lignin, hemicellulose and
cellulose should be applied in the HR and SAMBR to determine the F/M ratio in each reactor,
and to investigate the cellulose and hemicellulose degradation in the process.
Another technique to alleviate the fouling in the SAMBR would be to change the depth of the
membrane module in the SAMBR; membrane fouling could be lessened in the upper zone due
to the reduced MLTSS if the biogas sparger is just below the membrane module so that the
mixed liquor and undigested fibers could settle down to the lower zone where they could be
removed periodically. This has been proved to be technically possible for a synthetic wastewater
(Kim et al., 2008), and it would be worth trying with leachate.
Due to the configuration of the SAMBR the growth of hydrogenotrophic and acetoclastic methanogens
was favoured because of their complete retention by the membrane. It was found that the re-295

Chapter 10. CONCLUSIONS AND FUTURE WORK
circulation of slurry from the SAMBR to the HR at a rate as low as 30 mL/day (SRT of SAMBR
= 90 - 100 days) promoted the growth of hydrogenotrophic organisms in the HR, even at am-
bient temperatures. However, it is not clear whether the lower temperature in the HR or the
sludge recycle from the SAMBR was responsible for this predominance of hydrogenotrophs in
the HR. This could help to consume the hydrogen during the start up period and increase the
methane content of the biogas in the HR. Another suggestion to accelerate the start up would
be to pump the H2 rich biogas from the HR to the SAMBR where the hydrogenotrophs would
consume it quicker than if it remained in the HR. This is thought to decrease the start up period
substantially.
Since many problems were encountered during this work due to calcium precipitation onto the
membrane of the SAMBR, new solutions must clearly be found before this process can be scaled
up. One of the ideas would be to install an additional tank where lime is added to raise the pH
and induce the precipitation of calcium carbonate. Another way would be to acidify the leachate
so that calcium remains soluble. This could be done with sulphuric acid which is usually used to
acidify the water before reverse osmosis in order to avoid calcium precipitation (Chesters, 2009).
However, this could result in the precipitation of calcium sulphate instead. Another way would be
use iron chloride which can also decrease the pH but also remove the colloids that also badly
affect the flux in the SAMBR. Finally, the use of the new anti-scalant (Genesys PHO : 2-5 mg/L)
should be investigated as it has been reported to raise the solubility of calcium phosphate 150
times (Chesters, 2009). This last option would be the most economic as the anti-scalant could
just be added to the HR.
One objective of Chapter 8 was to achieve simultaneous removal of COD and nitrogen in a
SAMBR-MABR. Although the presence of AOB was confirmed on the aerated membrane by
DGGE, ammonia was not converted due to ammonia or oxygen transfer limitations. More tests
are required in order to investigate this promising process. The configuration of the reactor
should perhaps be modified to create an upcomer and a downcomer in the reactor so that a
proper liquid velocity is obtained over the biofilm. Also, the oxygen regulator should be changed
to enable it to reach higher pressures than the ones tested in this study. This would enable us
to test methanogenesis at ORPs in the anoxic range (-50 to -150 mV) in order to investigate its
potential advantages such as sulfate reduction.
The GC-MS analysis carried out in this work allowed us to determine the low MW recalcitrants
found in the HR, SAMBR and AMBR permeate. Chapter 8 dealt with the compounds that be-
come recalcitrant when the temperature are lower and when the SRT is lower. However, no
information is given regarding the high MW compounds of the leachate, and techniques such
as Liquid Chromatography coupled to Mass Spectrometer (LC-MS) should be tried since it in-
creases the window for detection, allowing for the identification of more polar and thermo unsta-
ble compounds that could not be detected by GC-MS. Reverse phase chromatography using C-8
and C-18 columns can also be used to identify the organics of different hydrophobicity and their
adsorption by PAC. Another technique that seems to be very useful for the detection of high MW
compounds is Matrix Assisted Laser Desorption Ionization-Time of Flight-Mass Spectrometry
(MALDI-ToF-MS). This would allow us to gain more knowledge about these compounds.296
Chapter 10. CONCLUSIONS AND FUTURE WORK
The application of quantitative molecular method such as fluorescence in situ hybridization
(FISH) in which tagged DNA oligomers are used to probe intact microbial communities, should
be used to investigate the spatial distribution of Archaea, Bacteria and ammonia-oxidizer bac-
teria within the biofilm of the SAMBR-MABR. Specific nucleic acid probes can be applied to
quantitatively describe each member and identify the members of the dominant population. This
provides an opportunity to couple microbial population structure and the functional characteris-
tics of anaerobic reactors.
297

Chapter 11
BIBLIOGRAPHY
298

Bibliography
Abdullah, A. G. L., Idris, A., Ahmadun, F. R., Baharin, B. S., Emby, F., Noor, M. J. M. M., and
Nour, A. H. (2005) . A kinetic study of a membrane anaerobic reactor (MAR) for treatment of
sewage sludge. Desalination 183(1-3), 439–445
Abdullah, M. A., Chiang, L., and Nadeem, M. (2009) . Comparative evaluation of adsorption ki-
netics and isotherms of a natural product removal by Amberlite polymeric adsorbents. Chem-
ical Engineering Journal 146(3), 370–376
Abdullahi, Y. A., Akunna, J. C., White, N. A., Hallett, P. D., and Wheatley, R. (2008) . Investigating
the effects of anaerobic and aerobic post-treatment on quality and stability of organic fraction
of municipal solid waste as soil amendment. Bioresource Technology 99(18), 8631–8636
Adani, F., Tambone, F., and Gotti, A. (2004) . Biostabilization of municipal solid waste. Waste
Management 24(8), 775–783
Agdag, O. N. and Sponza, D. T. (2005) . Anaerobic/aerobic treatment of municipal landfill
leachate in sequential two-stage up-flow anaerobic sludge blanket reactor (UASB)/completely
stirred tank reactor (CSTR) systems. Process Biochemistry 40(2), 895–902
Agdag, O. N. and Sponza, D. T. (2007) . Co-digestion of mixed industrial sludge with municipal
solid wastes in anaerobic simulated landfilling bioreactors. Journal of Hazardous Materials
140(1-2), 75–85
Ahn, W.-Y., Kang, M.-S., Yim, S.-K., and Choi, K.-H. (2002) . Advanced landfill leachate treat-
ment using an integrated membrane process. Desalination 149(1-3), 109–114
Ahring, B. K., Sandberg, M., and Angelidaki, I. (1995) . Volatile Fatty-Acids as Indicators of
Process Imbalance Is Anaerobic Digesters. Applied Microbiology and Biotechnology 43(3),
559–565
Akarsubasi, A. T., Ince, O., Kirdar, B., Oz, N. A., Orhon, D., Curtis, T. P., Head, I. M., and Ince,
B. K. (2005) . Effect of wastewater composition on archaeal population diversity. Water
Research 39(8), 1576–1584
Akram, A. (2006) . Stability and performance improvement of a Submerged Anaerobic Mem-
brane Bioreactor (SAMBR) for wastewater treatment. PhD thesis. Imperial College London.
Al-Malack, M. H. (2006) . Determination of biokinetic coefficients of an immersed membrane
bioreactor. Journal of Membrane Science 271(1-2), 47–58
Albasi, C., Bessiere, Y., Desclaux, S., and Remigy, J. C. (2002) . Filtration of biological sludge
by immersed hollow-fiber membranes: influence of initial permeability choice of operating
conditions. Desalination 146(1-3), 427–431
Amokrane, A., Comel, C., and Veron, J. (1997) . Landfill leachates pretreatment by coagulation-
flocculation. Water Research 31(11), 2775–2782
299

Chapter BIBLIOGRAPHY
Amy, G. (2008) . Fundamental understanding of organic matter fouling of membranes. Desali-
nation 231(1-3), 44–51
Anderson, G. K., Donnelly, T., and McKeown, K. J. (1982) . Identification and Control of Inhibition
in the Anaerobic Treatment of Industrial Wastewaters. Process Biochemistry 17(4), 28
Anderson, G. K. and Saw, C. B. (1992) . Leach-bed two-phase anaerobic digestion of municipal
solid waste. In: F. Cecchi, J. Mata-Alvarez, and F. G. Pohland (eds.), International Symposium
on anaerobic digestion of solid waste. Venice, Italy
Angelidaki, I. and Ahring, B. K. (1999) . Methods for increasing the biogas potential from the
recalcitrant organic matter contained in manure. In: J. Mata-Alvarez, A. Tilche, and F. Cecchi
(eds.), Second International Symposium on Anaerobic Digestion of Solid Wastes. Vol. 1. pp
375–380. Grafiques 92. Barcelona
Angelidaki, I., Alves, M. M., Bolzonella, D., Borzacconi, L., Guwy, A. J., Kalyuzhnyi, S., Jenicek,
P., Campos, L., and Van Lier, J. B. (2008) . Defining the biomethane potential (BMP) of solid
organic wastes: a proposed protocol for batch assays. In: 5th Symposium on the Anaerobic
Digestion of Solid Waste and Energy Crops. Hammamet, Tunisia
Angelidaki, I., Chen, X. X., Cui, J. B., Kaparaju, P., and Ellegaard, L. (2006) . Thermophilic
anaerobic digestion of source-sorted organic fraction of household municipal solid waste:
Start-up procedure for continuously stirred tank reactor. Water Research 40(14), 2621–2628
Anthonisen, A. C., Loehr, R. C., Prakasam, T. B. S., and Srinath, E. G. (1976) . Inhibition of
Nitrification by Ammonia and Nitrous-Acid. Journal Water Pollution Control Federation 48(5),
835–852
Aoki, H., Kurosaki, Y., and Anzai, H. (1979) . Study on the Tubular Pinch Effect in a Pipe Flow : I.
Lateral migration of a single particle in laminar poiseuille flow. Bulletin of The Japan Society
of Mechanical Engineers 22(164), 206–212
APHA (1999) . Standard Methods for the Examination of Water and Wastewater. American
Public Health Association. Washington D.C
Aquino, S. F. (2004) . Formation of soluble microbial products (SMP) in anaerobic reactors during
stress conditions. PhD thesis. Imperial College London.
Aquino, S. F. and Stuckey, D. C. (2003) . Production of soluble microbial products (SMP) in
anaerobic chemostats under nutrient deficiency. Journal of Environmental Engineering-Asce
129(11), 1007–1014
Aquino, S. F. and Stuckey, D. C. (2004) . Soluble microbial products formation in anaerobic
chemostats in the presence of toxic compounds. Water Research 38(2), 255–266
Ariesyady, H. D., Ito, T., and Okabe, S. (2007) . Functional bacterial and archaeal community
structures of major trophic groups in a full-scale anaerobic sludge digester. Water Research
41(7), 1554–1568
Asakura, H., Matsuto, T., and Tanaka, N. (2004) . Behavior of endocrine-disrupting chemicals in
leachate from MSW landfill sites in Japan. Waste Management 24(6), 613–622
Asinari Di San Marzano, C. M., Binot, R., Bol, T., Fripiat, J. L., Hutschemakers, J., Melchior, J. L.,
Perez, I., Naveau, H., and Nyns, E. J. (1981) . Volatile fatty acids, an important state param-
eter for the control of the reliability and the productivities of methane anaerobic digestions.
Biomass 1(1), 47–59300

Chapter BIBLIOGRAPHY
Aziz, H. A., Alias, S., Adlan, M. N., Fafidah, A., and Zahari, M. S. (2007) . Colour removal from
landfill leachate by coagulation and flocculation processes. Bioresource Technology 98(1),
218–220
Babel, S., Fukushi, K., and Sitanrassamee, B. (2004) . Effect of acid speciation on solid waste
liquefaction in an anaerobic acid digester. Water Research 38(9), 2417–2423
Baffi, C., Dell’Abate, M. T., Nassisi, A., Silva, S., Benedetti, A., Genevini, P. L., and Adani, F.
(2007) . Determination of biological stability in compost: A comparison of methodologies.
Soil Biology and Biochemistry 39(6), 1284–1293
Bailey, J. E. and Ollis, D. F. (1986) . Biochemical Engineering Fundamentals. McGraw-Hill
Chemical Engineering. McGraw-Hill Book Co.. Singapore. 2nd edition
Balch, W. E., Fox, G. E., Magrum, L. J., Woese, C. R., and Wolfe, R. S. (1979) . Methanogens:
reevaluation of a unique biological group. Microbiol. Mol. Biol. Rev. 43(2), 260–296
Banks, C. J. and Humphreys, P. N. (1998) . The anaerobic treatment of a ligno-cellulosic sub-
strate offering little natural pH buffering capacity. Water Science and Technology 38(4-5),
29–35
Baraniak, B., Niezabitowska, M., Pielecki, J., and Wojcik, W. (2004) . Evaluation of usefulness
of Magnafloc M-22S flocculant in the process of obtaining protein concentrates from peas.
Food Chemistry 85(2), 251–257
Barat, R., Bouzas, A., Marti, N., Ferrer, J., and Seco, A. (2008) . Precipitation assessment in
wastewater treatment plants operated for biological nutrient removal: A case study in Murcia,
Spain. Journal of Environmental Management 90(2), 850–857
Barker, D. J., Mannucchi, G. A., Salvi, S. M. L., and Stuckey, D. C. (1999) . Characterisation
of soluble residual chemical oxygen demand in anaerobic wastewater treatment effluents.
Water Research pp 2499–2510
Barker, D. J. and Stuckey, D. C. (1999) . A review of soluble microbial products (SMP) in wastew-
ater treatment systems. Water Research 33(14), 3063–3082
Barnes, D., Bliss, P. J., Grauer, B., Kuo, E. M., Robbins, K., and McLean, G. (1983) . Pre-
treatment of high-strength wastewaters by an anaerobic fluidized bed process. 1. Overall
performance. Environmental technology letters 4(5), 195–202
Baronofsky, J. J., Schreurs, W. J. A., and Kashket, E. R. (1984) . Uncoupling by Acetic-Acid Lim-
its Growth of and Acetogenesis by Clostridium thermoaceticum. Applied and Environmental
Microbiology 48(6), 1134–1139
Bartlett, R. J. and Kimble, J. M. (1976) . Behavior of chromium in soils, I. Trivalent forms. J.
Environ. Qual. 5, 379–383
Bauer, M. J. and Herrmann, R. (1997) . Estimation of the environmental contamination by ph-
thalic acid esters leaching from household wastes. Science of The Total Environment 208(1-
2), 49–57
Benotti, M. J., Trenholm, R. A., Vanderford, B. J., Holady, J. C., Stanford, B. D., and Snyder, S. A.
(2009) . Pharmaceuticals and Endocrine Disrupting Compounds in U.S. Drinking Water.
Environmental Science and Technology 43(3), 597
Bensadoun, A. and Weinstein, D. (1976) . Assay of Proteins in Presence of Interfering Materials.
Analytical Biochemistry 70(1), 241–250301

Chapter BIBLIOGRAPHY
Bernal, M. P., Alburquerque, J. A., and Moral, R. (2008) . Composting of animal manures
and chemical criteria for compost maturity assessment. A review. Bioresource Technology
doi:10.1016/j.biortech.2008.11.027
Berube, P. R., Hall, E. R., and Sutton, P. M. (2006) . Parameters governing permeate flux in
an anaerobic membrane bioreactor treating low-strength municipal wastewaters: A literature
review. Water Environment Research 78(8), 887–896
Bhuiyan, M. I. H., Mavinic, D. S., and Beckie, R. D. (2007) . A solubility and thermodynamic
study of struvite. Environmental Technology 28, 1015–1026
Bilgili, M. S., Demir, A., and Ozkaya, B. (2007) . Influence of leachate recirculation on aerobic and
anaerobic decomposition of solid wastes. Journal of Hazardous Materials 143(1-2), 177–183
Bohdziewicz, J., Bodzek, M., and Gorska, J. (2001) . Application of pressure-driven membrane
techniques to biological treatment of landfill leachate. Process Biochemistry 36(7), 641–646
Bohdziewicz, J., Neczaj, E., and Kwarciak, A. (2008) . Landfill leachate treatment by means of
anaerobic membrane bioreactor. Desalination 221(1-3), 559–565
Bolong, N., Ismail, A. F., Salim, M. R., and Matsuura, T. (2009) . A review of the effects of
emerging contaminants in wastewater and options for their removal. Desalination 239(1-3),
229–246
Bolzonella, D., Fatone, F., Pavan, P., and Cecchi, F. (2005) . Anaerobic fermentation of organic
municipal solid wastes for the production of soluble organic compounds. Industrial and Engi-
neering Chemistry Research 44(10), 3412–3418
Boone, D. R. and Bryant, M. P. (1980) . Propionate-degrading bacterium, Syntrophobacter wolinii
sp. nov. gen. nov. from methanogenic ecosystems. Applied and environmental microbiology
40(3), 626–632
Borja, R., Banks, C. J., and Sanchez, E. (1996) . Anaerobic treatment of palm oil mill effluent
in a two-stage up-flow anaerobic sludge blanket (UASB) system. Journal of Biotechnology
45(2), 125–135
Borzacconi, L., Lopez, I., Ohanian, M., and Vinas, M. (1999) . Anaerobic-aerobic treatment of
municipal solid waste leachate. Environmental Technology 20(2), 211–217
Boussu, K., Belpaire, A., Volodin, A., Van Heasendonck, C., Van der Meeren, P., Vandecasteele,
C., and Van der Bruggen, B. (2006) . Influence of membrane and colloid characteristics on
fouling of nanofiltration membranes. Journal of Membrane Science 289(1-2), 220–230
Boyle, W. C. and Ham, R. K. (1974) . Biological Treatability of Landfill Leachate. Journal Water
Pollution Control Federation 46(5), 860–872
Bozkurt, S., Moreno, L., and Neretnieks, I. (1999) . Long-term fate of organics in waste deposits
and its effect on metal release. The Science of The Total Environment 228(2-3), 135–152
Braber, K. (1995) . Anaerobic digestion of municipal solid waste: A modern waste disposal
option on the verge of breakthrough. Biomass and Bioenergy 9(1-5), 365–376
Brindle, K. and Stephenson, T. (1996) . Nitrification in a bubbleless oxygen mass transfer mem-
brane bioreactor. Water Science and Technology 34(9), 261–267
Brindle, K., Stephenson, T., and Semmens, M. J. (1998) . Nitrification and oxygen utilisation in a
membrane aeration bioreactor. Journal of Membrane Science 144(1-2), 197–209
Brockmann, M. and Seyfried, C. F. (1997) . Sludge activity under the conditions of crossflow302
Chapter BIBLIOGRAPHY
microfiltration. Water Science and Technology 35(10), 173–181
Bryant, M. P. and Boone, D. R. (1987) . Isolation and Characterization of Methanobacterium
formicicum Mf. International Journal of Systematic Bacteriology 37(2), 171–171
Bube, K. (1910) . Uber magnesiumammoniumphosphat. Z. Anal. Chem 49, 525–596
Bull, P. S., Evans, J. V., Wechsler, R. M., and Cleland, K. J. (1983) . Biological technology of the
treatment of leachate from sanitary landfills. Water Research 17(11), 1473–1481
Cadi, Z., Huyard, H., Manem, J., and Moletta, R. (1994) . Anaerobic-Digestion of a Synthetic
Waste-Water Containing Starch by a Membrane Reactor. Environmental Technology 15(11),
1029–1039
Cao, C., Zhang, S., and Zhang, X. (1982) . Toxicological study of four hindered phenol antioxi-
dants. Beijing Yixueyuan Xuebao 14(2), 105–109. Journal written in Chinese.
Capela, I. F., Azeiteiro, C., Arroja, L., and Duarte, A. C. (1999) . Effects of pre-treatment (com-
posting) on the anaerobic digestion of primary sludges from a bleached kraft pulp mill. In: J.
Mata-Alvarez, A. Tilche, and F. Cecchi (eds.), Second International SYmposium on Anaerobic
Digestion of Solid Wastes. Vol. 1. pp 113–120. Grafiques 92. Barcelona
Capestany, G. J., McDaniels, J., and Opgrande, J. L. (1977) . Influence of Sulfate on Biological
Treatment of Phenolbenzaldehyde Wastes. Journal Water Pollution Control Federation 49(2),
256–261
Casey, E., Glennon, B., and Hamer, G. (1999) . Review of membrane aerated biofilm reactors.
Resources, Conservation and Recycling 27(1-2), 203–215
Casey, E., Glennon, B., and Hamer, G. (2000a) . Biofilm development in a membrane-aerated
biofilm reactor: Effect of flow velocity on performance. Biotechnology and Bioengineering
67(4), 476–486
Casey, E., Glennon, B., and Hamer, G. (2000b) . Biofilm development in a membrane-aerated
biofilm reactor: effect of intra-membrane oxygen pressure on performance. Bioprocess Engi-
neering 23(5), 457–465
Castillo, M. E. F., Cristancho, D. E., and Victor Arellano, A. (2005) . Study of the operational
conditions for anaerobic digestion of urban solid wastes. Waste Management 26(5), 546–
556
Catherine, H., Skinner, K., Osbaldiston, G. W., and Wilner, A. N. (1977) . Monohydrocalcite in a
guinea pig bladder stone, a novel occurrence. American Mineralogist 62, 273 – 277
Cecchi, F., Vallini, G., Pavan, P., and Bassetti, A. (1992) . Management of macroalgae from
Venice lagoon through anaerobic co-digestion and co-composting with MSW.. In: F. Cecchi,
J. Mata-Alvarez, and F. G. Pohland (eds.), International Symposium on anaerobic digestion
of solid waste. Venice, Italy
Chanakya, H. N., Borgaonkar, S., Rajan, M. G. C., and Wahi, M. (1993) . Two phase fermentation
of whole leaf biomass to biogas. Biomass and Bioenergy 5(5), 359–367
Chandler, J. A., Hermes, S. K., and Smith, K. D. (1983) . A low cost 75 kW covered lagoon biogas
system. In: Energy from Biomass and Wastes VII. p. 23. Lake Buena Vista, FL, Institute of
Gas technology, Chicago
Chang, I. S. and Lee, C. H. (1998) . Membrane filtration characteristics in membrane-coupled
activated sludge system - the effect of physiological states of activated sludge on membrane303

Chapter BIBLIOGRAPHY
fouling. Desalination 120(3), 221–233
Chang, J. E. (1989) . Treatment of Landfill Leachate with an Upflow Anaerobic Reactor Combin-
ing a Sludge Bed and a Filter. Water Science and Technology 21(4-5), 133–143
Chen, S., Sun, D., and Chung, J.-S. (2008a) . Simultaneous removal of COD and ammonium
from landfill leachate using an anaerobic-aerobic moving-bed biofilm reactor system. Waste
Management 28(2), 339–346
Chen, V., Fane, A. G., Madaeni, S., and Wenten, I. G. (1997) . Particle deposition during mem-
brane filtration of colloids: Transition between concentration polarization and cake formation.
Journal of Membrane Science 125(1), 109–122
Chen, Y., Cheng, J. J., and Creamer, K. S. (2008b) . Inhibition of anaerobic digestion process:
A review. Bioresource Technology 99(10), 4044–4064
Chen, Y., Dong, B. Z., Gao, N. Y., and Fan, J. C. (2007) . Effect of coagulation pretreatment on
fouling of an ultrafiltration membrane. Desalination 204(1-3), 181–188
Cheng, S. S. and Chen, W. C. (1994) . Organic-Carbon Supplement Influencing Performance of
Biological Nitritification in a Fluidized-Bed Reactor. Water Science and Technology 30(11),
131–142
Chesters, S. P. (2009) . Innovations in the inhibition and cleaning of reverse osmosis membrane
scaling and fouling. Desalination 238(1-3), 22–29
Chian, E. S. K. (1977) . Stability of Organic-Matter in Landfill Leachates. Water Research 11(2),
225–232
Cho, B. D. and Fane, A. G. (2002) . Fouling transients in nominally sub-critical flux operation of
a membrane bioreactor. Journal of Membrane Science 209(2), 391–403
Cho, J. K., Park, S. C., and Chang, H. N. (1995) . Biochemical Methane Potential and Solid-State
Anaerobic-Digestion of Korean Food Wastes. Bioresource Technology 52(3), 245–253
Choi, J.-H. and Ng, H. Y. (2008) . Effect of membrane type and material on performance of a
submerged membrane bioreactor. Chemosphere 71(5), 853–859
Choo, K. H. and Lee, C. H. (1996a) . Effect of anaerobic digestion broth composition on mem-
brane permeability. Water Science and Technology 34(9), 173–179
Choo, K. H. and Lee, C. H. (1996b) . Membrane fouling mechanisms in the membrane-coupled
anaerobic bioreactor. Water Research 30(8), 1771–1780
Choo, K. H. and Lee, C. H. (1998) . Hydrodynamic behavior of anaerobic biosolids during
crossflow filtration in the membrane anaerobic bioreactor. Water Research 32(11), 3387–
3397
Christ, O., Wilderer, P. A., Angerhofer, R., and Faulstich, M. (2000) . Mathematical modelling of
the hydrolysis of anaerobic processes. Water Science and Technology 41, 61
Christensen, T. H., Cossu, R., and Stegmann, R. (1992) . Biological processes. In: T. H.
Christensen, R. Cossu, and R. Stegmann (eds.), Land filling of waste: leachate. pp 185–228.
Elsevier Science. UK
Chu, L. B., Yang, F. L., and Zhang, X. W. (2005) . Anaerobic treatment of domestic wastewater
in a membrane-coupled expended granular sludge bed (EGSB) reactor under moderate to
low temperature. Process Biochemistry 40(3-4), 1063–1070
Chugh, S., Chynoweth, D. P., Clarke, W., Pullammanappallil, P., and Rudolph, V. (1999) . Degra-304

Chapter BIBLIOGRAPHY
dation of unsorted municipal solid waste by a leach-bed process. Bioresource Technology
69(2), 103–115
Chynoweth, D. P., Haley, P., Owens, J., Teiweira, A., Welt, B., Rich, E., Townsend, T., and Choi,
H.-L. (2002) . Anaerobic digestion for reduction and stabilization of organic solid wastes
during space missions: Laboratory studies. Society of Automotive Engineers
Chynoweth, D. P. and Jerger, D. E. (1985) . Anaerobic Digestion of Woody Biomass. Develop-
ments in Industrial Microbiology 265, 235–246
Chynoweth, D. P., Turick, C. E., Owens, J. M., Jerger, D. E., and Peck, M. W. (1993) . Biochemical
Methane Potential of Biomass and Waste Feedstocks. Biomass and Bioenergy 5(1), 95–111
Clarkson, W. W. and Xiao, W. (2000) . Bench-scale anaerobic bioconversion of newsprint and
office paper. Water Science and Technology 41(3), 93–100
Coelhan, M., Yu, J. T., and Roberts, A. L. (2009) . Presence of the biocide ortho-phenylphenol
in canned soft drinks in the United States and Germany. Food Chemistry 112(2), 515–519
Collins, G., Foy, C., McHugh, S., and O’Flaherty, V. (2005) . Anaerobic treatment of 2,4,6-
trichlorophenol in an expanded granular sludge bed-anaerobic filter (EGSB-AF) bioreactor at
15 ˚ C. FEMS Microbiology Ecology 53(1), 167–178
Collins, G., Woods, A., McHugh, S., Carton, M. W., and O’Flaherty, V. (2003) . Microbial commu-
nity structure and methanogenic activity during start-up of psychrophilic anaerobic digesters
treating synthetic industrial wastewaters. FEMS Microbiology Ecology 46(2), 159–170
Commission, E. (2001) . Working document: biological treatment of biowaste, 2nd
draft. Technical report. [Online]. Available from: http://www.compost.it/www/pubblicazioni
on line/biod.pdf. p.22
Connaughton, S., Collins, G., and O’Flaherty, V. (2006) . Development of microbial community
structure and activity in a high-rate anaerobic bioreactor at 18 ˚ C. Water Research 40(5),
1009–1017
Cook, E. N. and Foree, E. G. (1974) . Aerobic Biostabilization of Sanitary Landfill Leachate.
Journal Water Pollution Control Federation 46(2), 380–392
Croue, J.-P., Violleau, D., Bodaire, C., and Legube, B. (1999) . Removal of hydrophobic and
hydrophilic constituents by anion exchange resin. Water Science and Technology 40(9),
207–214
Cuzin, N., Ouattara, A. S., Labat, M., and Garcia, J. L. (2001) . Methanobacterium congolense
sp. nov., from a methanogenic fermentation of cassava peel.. International Journal of Sys-
tematic and Evolutionary Microbiology 51(2), 489–493
D’Addario, E., Pappa, R., Pietrangeli, B., and Valdiserri, M. (1992) . The acidogenic digestion of
the organic fraction of municipal solid waste for the production of liquid fuels. In: F. Cecchi, J.
Mata-Alvarez, and F. G. Pohland (eds.), International Symposium on anaerobic digestion of
solid waste. Venice, Italy
Das, K. and Keener, H. M. (1997) . Moisture Effect on Compaction and Permeability in Composts.
Journal of Environmental Engineering 123(3), 275–281
Datta, R. (1981) . Acidogenic fermentation of corn stover. Biotechnology and Bioengineering
23, 61–77
Davidsson, A., Gruvberger, C., Christensen, T. H., Hansen, T. L., and Jansen, J. L. (2007) .305
Chapter BIBLIOGRAPHY
Methane yield in source-sorted organic fraction of municipal solid waste. Waste Management
27(3), 406–414
de Bertoldi, M., Vallini, G., and Pera, A. (1983) . The biology of composting: A review. Waste
Management and Research 1(2), 157–176
de Bok, F. A. M., Plugge, C. M., and Stams, A. J. M. (2004) . Interspecies electron transfer in
methanogenic propionate degrading consortia. Water Research 38(6), 1368–1375
DEFRA (2005) . Municipal Waste Management Survey 2003/2004. Technical report. Department
for Environment, Food and Rural Affairs
DEFRA (2008) . Municipal Waste Management Statistics. Technical report. Department for
Environment, Food and Rural Affairs
Defrance, L. and Jaffrin, M. Y. (1999) . Comparison between filtrations at fixed transmembrane
pressure and fixed permeate flux: application to a membrane bioreactor used for wastewater
treatment. Journal of Membrane Science 152(2), 203–210
Delgenes, J. P., Penaud, V., and Moletta, R. (2002) . Pretreatments for the enhancement of
anaerobic digestion of solid wastes. In: J. Mata-Alvarez (ed.), Biomethanization of the organic
fraction of municipal solid wastes. IWA Publishing. London
Delgenes, J. P., Penaud, V., Torrijos, M., and Moletta, R. (1999) . Thermochemical pre-treatment
of an industrial microbial biomass: effect of sodium hydroxide addition on COD solubilization,
anaerobic biodegradability and generation of soluble inhibitory compounds. In: J. Mata-
Alvarez, A. Tilche, and F. Cecchi (eds.), 2nd International Symposium on Anaerobic Digestion
of Solid Wastes. pp 121–128. Grafiques 92. Barcelona
Dewalle, F. B. and Chian, E. S. K. (1974) . Removal of Organic-Matter by Activated Carbon
Columns. Journal of the Environmental Engineering Division-Asce 100(NEE5), 1089–1104
Diamadopoulos, E. (1994) . Characterization and treatment of recirculation-stabilized leachate.
Water Research 28(12), 2439–2445
Diaz, L. F. and Trezek, G. J. (1977) . Biogasification of a selected fraction of municipal solid
wastes. Compost Science 18, 8–13
Dierick, B. (2006) . Marketing Engineer OWS Dranco. Personnal communication.
Dolfing, J. and Bloemen, W. G. B. M. (1985) . Activity measurements as a tool to characterize
the microbial composition of methanogenic environments. Journal of Microbiological Methods
4(1), 1–12
Dosoretz, C. G. and Boddeker, K. W. (2004) . Removal of trace organics from water using a
pumped bed-membrane bioreactor with powdered activated carbon. Journal of Membrane
Science 239(1), 81–90
Doyle, J. D., Oldring, K., Churchley, J., and Parsons, S. A. (2002) . Struvite formation and the
fouling propensity of different materials. Water Research 36(16), 3971–3978
Doyle, J. D. and Parsons, S. A. (2002) . Struvite formation, control and recovery. Water Research
36(16), 3925–3940
Dubois, M., Gilles, K. A., Hamilton, J. K., Rebers, P. A., and Smith, F. (1956) . Colorimetric
Method for Determination of Sugars and Related Substances. Analytical Chemistry 28, 350–
356
Durrant, L. R. (1996) . Biodegradation of lignocellulosic materials by soil fungi isolated under306
Chapter BIBLIOGRAPHY
anaerobic conditions. International Biodeterioration and Biodegradation 37(3-4), 189–195
Eastman, J. A. and Ferguson, J. F. (1981) . Solubilization of Particulate Organic Carbon during
the Acid Phase of Anaerobic Digestion. Journal Water Pollution Control Federation 53(3),
352–366
Ehlinger, F., Audic, J. M., and Faup, G. M. (1987) . Relationship between the Concentration of
Acetate in the Feed and the Composition of a Biofilm in an Anaerobic Filter. Environmental
Technology Letters 8(4), 197–207
Elango, D., Pulikesi, M., Baskaralingam, P., Ramamurthi, V., and Sivanesan, S. (2007) . Pro-
duction of biogas from municipal solid waste with domestic sewage. Journal of Hazardous
Materials 141(1), 301–304
Elderfield, H. (1970) . Chromium speciation in seawater. Earth Planet Sci. Lett. 9, 10–16
Elmaleh, S. and Abdelmoumni, L. (1997) . Cross-flow filtration of an anaerobic methanogenic
suspension. Journal of Membrane Science 131(1-2), 261–274
EPA (2007) . Chemicals Known to Cause Cancer or Reproductive Toxicity. Techni-
cal report. State of California, Environmental Protection Agency [Online]. Available from:
http://www.oehha.ca.gov/prop65/prop65 list/files/P65single092807.pdf
Esmaeili, A., Mesdaghi, A. N., and Vazirinejad, R. (2005) . Chromium (III) Removal and Recovery
from Tannery Wastewater by Precipitation Process. American journal of Applied Sciences
2(10), 1471–1473
Fane, A. G., Beatson, P., and Li, H. (2000) . Membrane fouling and its control in environmental
applications. Water Science and Technology 41(10-11), 303–308
Feijoo, G., Soto, M., Mendez, R., and Lema, J. M. (1995) . Sodium Inhibition in the Anaerobic-
Digestion Process - Antagonism and Adaptation Phenomena. Enzyme and Microbial Tech-
nology 17(2), 180–188
Feng, Y.-J., Tseng, S.-K., Hsia, T.-H., Ho, C.-M., and Chou, W.-P. (2007) . Partial nitrification of
ammonium-rich wastewater as pretreatment for anaerobic ammonium oxidation (Anammox)
using membrane aeration bioreactor. Journal of Bioscience and Bioengineering 104(3), 182–
187
Fernandez, A., Huang, S. Y., Seston, S., Xing, J., Hickey, R., Criddle, C., and Tiedje, J. (1999) .
How stable is stable? Function versus community composition. Applied and Environmental
Microbiology 65(8), 3697–3704
Fernandez, N., Diaz, E. E., Amils, R., and Sanz, J. L. (2008) . Analysis of microbial community
during biofilm development in an anaerobic wastewater treatment reactor. Microbial Ecology
56(1), 121–132
Field, R. W., Wu, D., Howell, J. A., and Gupta, B. B. (1995) . Critical Flux Concept for Microfiltra-
tion Fouling. Journal of Membrane Science 100(3), 259–272
Finstein, M. and Miller, F. C. (1985) . Principles of composting leading to maximization of de-
composition rate, odor control, and cost effectiveness. In: J. Gasser (ed.), Composting of
Agricultural and Other Wastes. pp 13–26. Elsevier Applied Science Publications. Barking,
Essex
Frankin, R. J. (2001) . Full-scale experiences with anaerobic treatment of industrial wastewater.
Water Science and Technology 44(8), 1–6307

Chapter BIBLIOGRAPHY
Fricke, K., Santen, H., Wallmann, R., Huttner, A., and Dichtl, N. (2007) . Operating problems in
anaerobic digestion plants resulting from nitrogen in MSW. Waste Management 27(1), 30–43
Frolund, B., Palmgren, R., Keiding, K., and Nielsen, P. H. (1996) . Extraction of extracellular
polymers from activated sludge using a cation exchange resin. Water Research 30(8), 1749–
1758
Fromme, H., Kuchler, T., Otto, T., Pilz, K., Muller, J., and Wenzel, A. (2002) . Occurrence of
phthalates and bisphenol A and F in the environment. Water Research 36(6), 1429–1438
Fuchs, W., Binder, H., Mavrias, G., and Braun, R. (2003) . Anaerobic treatment of wastewater
with high organic content using a stirred tank reactor coupled with a membrane filtration unit.
Water Research 37(4), 902–908
Furukawa, K., Arimura, N., and Miyazaki, T. (1987) . Nucleotide sequence of the 2,3-
dihydroxybiphenyl dioxygenase gene of Pseudomonas pseudoalcaligenes. J. Bacteriol.
169(1), 427–429
Gajalakshmi, S. and Abbasi, S. A. (2008) . Solid Waste Management by Composting: State of
the Art. Critical Reviews in Environmental Science and Technology 38(5), 311 – 400
Gallert, C., Henning, A., and Winter, J. (2003) . Scale-up of anaerobic digestion of the biowaste
fraction from domestic wastes. Water Research 37(6), 1433–1441
Gallert, C. and Winter, J. (1997) . Mesophilic and thermophilic anaerobic digestion of source-
sorted organic wastes: effect of ammonia on glucose degradation and methane production.
Applied Microbiology and Biotechnology 48(3), 405–410
Gardes, M. and Bruns, T. D. (1993) . ITS Primers with Enhanced Specificity for Basidiomycetes -
Application to the Identification of Mycorrhizae and Rusts. Molecular Ecology 2(2), 113–118
Garrity, G. M. (2005) . Bergey’s Manual of Systematic Bacteriology. Springer. New York. 2nd
edition
Garvie, L. (2003) . Decay-induced biomineralization of the Saguaro cactus. American Mineralo-
gist 88, 1879–1888
Gellens, V., Boelens, J., and Verstraete, W. (1995) . Source Separation, Selective Collection
and in-Reactor Digestion of Biowaste. Antonie Van Leeuwenhoek International Journal of
General and Molecular Microbiology 67(1), 79–89
Ghosh, S. and Klass, D. L. (1978) . Two-phase anaerobic digestion. Process biochemistry 13(4),
15
Gilbert, E. J., Riggle, D. S., and Holland, F. D. (2001) . Large-scale composting: a practical
manual for the UK. Composting Association. UK
GmbH, W. (2006) . System OxiTop Control: Operating Manual. GmbH
Godon, J. J., Zumstein, E., Dabart, P., Habouzit, F., and Moletta, R. (1997) . Molecular microbial
diversity of an anaerobic digester as determined by small-subunit rDNA sequence analysis.
Applied and Environmental Microbiology 63, 2802–2813
Gomez, X., Cuetos, M., Cara, J., Moran, A., and Garcia, A. (2005) . Anaerobic co-digestion of
primary sludge and the fruit and vegetable fraction of the municipal solid wastes: Conditions
for mixing and evaluation of the organic loading rate. Renewable Energy 31(12), 2017–2024
Gong, Z., Liu, S., Yang, F., Bao, H., and Furukawa, K. (2008) . Characterization of functional mi-
crobial community in a membrane-aerated biofilm reactor operated for completely autotrophic308

Chapter BIBLIOGRAPHY
nitrogen removal. Bioresource Technology 99(8), 2749–2756
Gonzalez-Munoz, M. T., De Linares, C., Martinez-Ruiz, F., Morcillo, F., Martin-Ramos, D., and
Arias, J. M. (2008) . Ca-Mg kutnahorite and struvite production by Idiomarina strains at
modern seawater salinities. Chemosphere 72(3), 465–472
Gotvajn, A. Z., Tisler, T., and Zagorc-Koncan, J. (2009) . Comparison of different treatment
strategies for industrial landfill leachate. Journal of Hazardous Materials 162(2-3), 1446–
1456
Gray, N. D., Miskin, I. P., Kornilova, O., Curtis, T. P., and Head, I. M. (2002) . Occurrence and
activity of Archaea in aerated activated sludge wastewater treatment plants. Environmental
Microbiology 4(3), 158–168
Grelot, A., Tazi-Pain, A., Weinrich, L., Lesjean, B., and Grasmick, A. (2009) . Evaluation of a
novel flat sheet MBR filtration system. Desalination 236(1-3), 111–119
Grethlein, H. E. (1984) . Acid hydrolysis review. In: G. L. Ferrero, M. P. Ferranti, and P. H.
Naveau (eds.), Anaerobic Digestion and Carbohydrate Hydrolysis of Waste. pp 14–31. Else-
vier Applied Science Publishers
Griffin, M. E., McMahon, K. D., Mackie, R. I., and Raskin, L. (1998) . Methanogenic population
dynamics during start-up of anaerobic digesters treating municipal solid waste and biosolids.
Biotechnology and Bioengineering 57(3), 342–355
Gujer, W. and Zehnder, A. J. B. (1983) . Conversion processes in Anaerobic Digestion. Water
science and technology 15(8-9), 127–167
Hagopian, D. S. (1995) . The effect of Hyperoxic Conditions on Activity and Assimilation in a
Nitrition Bio-Reactor. Ph.D. thesis. University of Maine.
Hagopian, D. S. and Riley, J. G. (1998) . A closer look at the bacteriology of nitrification. Aqua-
cultural Engineering 18(4), 223–244
Hajarnis, S. R. and Ranade, D. R. (1994) . Effect of propionate toxicity on some methanogens
at different pH values and in combination with butyrate. In: 7th International Symposium on
Anaerobic Digestion. p. 46. South Africa
Han, S. K. and Shin, H. S. (2004) . Performance of an innovative two-stage process converting
food waste to hydrogen and methane. Journal of the Air and Waste Management Association
54(2), 242–249
Hanaki, K., Wantawin, C., and Ohgaki, S. (1990) . Effects of the Activity of Heterotrophs on
Nitrification in a Suspended-Growth Reactor. Water Research 24(3), 289–296
Hao, Y.-J., Wu, W.-X., Wu, S.-W., Sun, H., and Chen, Y.-X. (2008) . Municipal solid waste
decomposition under oversaturated condition in comparison with leachate recirculation. Pro-
cess Biochemistry 43(1), 108–112
Harada, H., Momonoi, K., Yamazaki, S., and Takizawa, S. (1995) . Application of anaerobic-UF
membrane reactor for treatment of a wastewater containing high strength particulate organ-
ics. Water Science and Technology 30(12), 307–319
Harper, S. R. and Pohland, F. G. (1986) . Recent Developments in Hydrogen Management during
Anaerobic Biological Waste-water Treatment. Biotechnology and bioengineering 28(4), 585–
602
Hartmann, H. and Ahring, B. K. (2005) . Anaerobic digestion of the organic fraction of municipal309

Chapter BIBLIOGRAPHY
solid waste: Influence of co-digestion with manure. Water Research 39(8), 1543–1552
Hartmann, H., Angelidaki, I., and Ahring, B. K. (1999) . Increase of anaerobic degradation
of particulate organic matter in full-scale biogas plants by mechanical maceration. In: J.
Mata-Alvarez, A. Tilche, and F. Cecchi (eds.), Second International SYmposium on Anaerobic
Digestion of Solid Wastes. Vol. 1. pp 129–136. Grafiques 92. Barcelona
Hasegawa, S., Shiota, N., Katsura, K., and Akashi, A. (2000) . Solubilization of organic sludge
by thermophilic aerobic bacteria as a pretreatment for anaerobic digestion. Water Science
and Technology 41(3), 163–169
He, P. J., Lu, F., Shao, L. M., Pan, X. J., and Lee, D. J. (2006) . Effect of alkali metal cation on the
anaerobic hydrolysis and acidogenesis of vegetable waste. Environmental Technology 27(3),
317–327
He, R., Shen, D. S., Wang, J. Q., He, Y. H., and Zhu, Y. M. (2005a) . Biological degradation of
MSW in a methanogenic reactor using treated leachate recirculation. Process Biochemistry
40(12), 3660–3666
He, Y. L., Xu, P., Li, C. J., and Zhang, B. (2005b) . High-concentration food wastewater treatment
by an anaerobic membrane bioreactor. Water Research 39(17), 4110–4118
Held, C., Wellacher, M., Robra, K.-H., and Gubitz, G. M. (2002) . Two-stage anaerobic fermen-
tation of organic waste in CSTR and UFAF-reactors. Bioresource Technology 81(1), 19–24
Hendriks, A. T. W. M. and Zeeman, G. (2009) . Pretreatments to enhance the digestibility of
lignocellulosic biomass. Bioresource Technology 100(1), 10–18
Henry, J. G., Prasad, D., and Young, H. (1987) . Removal of organics from leachates by anaer-
obic filter. Water Research 21(11), 1395–1399
Hill, D. T., Cobb, S. A., and Bolte, J. P. (1987) . Using Volatile Fatty-Acid Relationships to Predict
Anaerobic Digester Failure. Transactions of the Asae 30(2), 496–501
Hills, D. J. and Nakano, K. (1984) . Effects of particle size on anaerobic digestion of tomato solid
wastes. Agricultural Wastes 10(4), 285–295
Hiraga, K. and Fujii, T. (1984) . Induction of tumours of the urinary bladder in F344 rats by dietary
administration of o-phenylphenol. Food and Chemical Toxicology 22(11), 865–870
Hobson, P. N. (1987) . A model of some aspects of microbial degradation of particulate sub-
strates. Journal of Fermentation Technology 65(4), 431–439
Hodgson, P. H., Leslie, G. L., Schneider, R. P., Fane, A. G., Fell, C. J. D., and Marshall, K. C.
(1993) . Cake Resistance and Solute Rejection in Bacterial Microfiltration - the Role of the
Extracellular-Matrix. Journal of Membrane Science 79(1), 35–53
Hogetsu, A., Ishikawa, T., Yoshikawa, M., Tanabe, T., Yudate, S., and Sawada, J. (1992) .
High-Rate Anaerobic-Digestion of Wool Scouring Waste-Water in a Digester Combined with
Membrane-Filter. Water Science and Technology 25(7), 341–350
Hoilijoki, T. H., Kettunen, R. H., and Rintala, J. A. (2000) . Nitrification of anaerobically pretreated
municipal landfill leachate at low temperature. Water Research 34(5), 1435–1446
Holler, S. and Trosch, W. (2001) . Treatment of urban wastewater in a membrane bioreactor at
high organic loading rates. Journal of Biotechnology 92(2), 95–101
Hong, S. and Elimelech, M. (1997) . Chemical and physical aspects of natural organic matter
(NOM) fouling of nanofiltration membranes. Journal of Membrane Science 132(2), 159–181310

Chapter BIBLIOGRAPHY
Hong, S. P., Bae, T. H., Tak, T. M., Hong, S., and Randall, A. (2002) . Fouling control in activated
sludge submerged hollow fiber membrane bioreactors. Desalination 143(3), 219–228
Horn, O., Nalli, S., Cooper, D., and Nicell, J. (2004) . Plasticizer metabolites in the environment.
Water Research 38(17), 3693–3698
Houwen, F. P., Plokker, J., Dijkema, C., and Stams, A. J. M. (1990) . Syntrophic propionate
oxidation. In: J.-P. Belaich, M. Bruschi, and J.-L. Garcia (eds.), Microbiology and Biochemistry
of Strict Anaerobes Involved in Interspecies Hydrogen Transfer. Plenum Press. New York,
USA
Howell, J. A. (1995) . Subcritical Flux Operation of Microfiltration. Journal of Membrane Science
107(1-2), 165–171
Howell, J. A., Chua, H. C., and Arnot, T. C. (2004) . In situ manipulation of critical flux in a
submerged membrane bioreactor using variable aeration rates, and effects of membrane
history. Journal of Membrane Science 242(1-2), 13–19
Hu, S., Yang, F., Sun, C., Zhang, J., and Wang, T. (2008) . Simultaneous removal of COD and
nitrogen using a novel carbon-membrane aerated biofilm reactor. Journal of Environmental
Sciences 20(2), 142–148
Hu, Y.-C. (2004) . Submerged Anaerobic Membrane Bioreactor (SAMBR) for Wastewater treat-
ment. PhD thesis. Imperial College London.
Hue, N. V. and Liu, J. (1995) . Predicting Compost Stability. Compost Science and Utilization
3(2), 8–15
Hulshoff Pol, L. W., de Zeeuw, W. J., Velzeboer, C. T. M., and Lettinga, G. (1983) . Granulation
in UASB reactors. Water Science and Technology 15, 291–304
Humbert, H., Gallard, H., Suty, H., and Croue, J.-P. (2007) . Natural organic matter (NOM)
and pesticides removal using a combination of ion exchange resin and powdered activated
carbon (PAC). Water Research 42(6-7), 1635–1643
Im, J.-h., Woo, H.-j., Choi, M.-w., Han, K.-b., and Kim, C.-w. (2001) . Simultaneous organic and
nitrogen removal from municipal landfill leachate using an anaerobic-aerobic system. Water
Research 35(10), 2403–2410
Imasaka, T., Kanekuni, N., So, H., and Yoshino, S. (1989) . Cross-Flow Filtration of Methane
Fermentation Broth by Ceramic Membranes. Journal of Fermentation and Bioengineering
68(3), 200–206
Ito, A., Maekawa, M., Tsutsumi, T., Ikazaki, F., and Tateishi, T. (1997) . Solubility product of
OH-carbonated hydroxyapatite. Journal of Biomedical Materials Research 36(4), 522–528
Jackson-Moss, C. A., Duncan, J. R., and Cooper, D. R. (1989) . The effect of calcium on anaer-
obic digestion. Biotechnol. Lett. 11(3), 219–224
Jadhav, S. U., Kalme, S. D., and Govindwar, S. P. (2008) . Biodegradation of Methyl red by
Galactomyces geotrichum MTCC 1360. International Biodeterioration and Biodegradation
62(2), 135–142
Jakobsen, S. T. (1995) . Aerobic decomposition of organic wastes 2. Value of compost as a
fertilizer. Resources, Conservation and Recycling 13(1), 57–71
Jans, J. M., Schroeff, A., and Jaap, A. (1992) . Combination of UASB pre-treatment and reverse
osmosis. In: T. H. Christensen, R. Cossu, and R. Stegmann (eds.), Landfilling of Waste311

Chapter BIBLIOGRAPHY
Leachate. pp 313–321. Elsevier. Amsterdam
Jarvis, A., Nordberg, A., Mathisen, B., and Svensson, B. H. (1995) . Stimulation of conver-
sion rates and bacterial activity in a silage-fed two-phase biogas process by initiating liquid
recirculation. Antonie Van Leeuwenhoek International Journal of General and Molecular Mi-
crobiology 68(4), 317–327
Jeison, D. and Van Lier, J. B. (2006) . Cake layer formation in anaerobic submerged membrane
bioreactors (AnSMBR) for wastewater treatment. Journal of Membrane Science 284(1-2),
227–236
Jeison, D. and Van Lier, J. B. (2007) . Anaerobic wastewater treatment and membrane filtration:
a one night stand or a sustainable relationship?. In: 11th IWA World Congre on Anaerobic
Digestion. Brisbane, Australia
Jeison, D. and van Lier, J. B. (2008) . Feasibility of thermophilic anaerobic submerged membrane
bioreactors (AnSMBR) for wastewater treatment. Desalination 231(1-3), 227–235
Jenicek, P., Keclik, F., Maca, J., and Bindzar, J. (2008) . Use of microaerobic conditions for the
improvement of anaerobic digestion of solid wastes. In: Vth International Symposium on the
anaerobic digestion of Solid Waste and Energy Crops. Hammamet, Tunisia
Jin, X., Jawor, A., Kim, S., and Hoek, E. M. V. (2009) . Effects of feed water temperature on
separation performance and organic fouling of brackish water RO membranes. Desalination
239(1-3), 346–359
Jokela, J. P. Y., Kettunen, R. H., Sormunen, K. M., and Rintala, J. A. (2002) . Biological nitrogen
removal from municipal landfill leachate: low-cost nitrification in biofilters and laboratory scale
in-situ denitrification. Water Research 36(16), 4079–4087
Jordan, S. N. and Mullen, G. J. (2007) . Enzymatic hydrolysis of organic waste materials in a
solid-liquid system. Waste Management 27(12), 1820–1828
Judd, S. (2008) . The status of membrane bioreactor technology. Trends in Biotechnology 26(2),
109–116
Kalamdhad, A. S., Pasha, M., and Kazmi, A. A. (2008) . Stability evaluation of compost by
respiration techniques in a rotary drum composter. Resources, Conservation and Recycling
52(5), 829–834
Kang, I. J., Yoon, S. H., and Lee, C. H. (2002) . Comparison of the filtration characteristics
of organic and inorganic membranes in a membrane-coupled anaerobic bioreactor. Water
Research 36(7), 1803–1813
Kanwar, S. S. and Guleri, R. L. (1994) . Performance evaluation of a family-size, rubber-balloon
biogas plant under hilly conditions. Bioresource Technology 50(2), 119–121
Kappell, A. S., Semmens, M. J., Novak, P. J., and LaPara, T. M. (2005) . Novel application of
oxygen-transferring membranes to improve anaerobic wastewater treatment. Biotechnology
and Bioengineering 89(4), 373–380
Kashyap, D. R., Dadhich, K. S., and Sharma, S. K. (2003) . Biomethanation under psychrophilic
conditions: a review. Bioresource Technology 87(2), 147–153
Kaspar, H. F. and Wuhrmann, K. (1978) . Kinetic parameters and relative turnovers of some
important catabolic reactions in digesting sludge. Applied and environmental microbiology
36(1), 1–7312

Chapter BIBLIOGRAPHY
Kayhanian, M. (1995) . Biodegradability of the Organic Fraction of Municipal Solid-Waste in a
High-Solids Anaerobic Digester. Waste Management and Research 13(2), 123–136
Kayhanian, M. (1999) . Ammonia inhibition in high-solids biogasification: An overview and prac-
tical solutions. Environmental Technology 20(4), 355–365
Kayhanian, M. and Rich, D. (1995) . Pilot-scale high solids thermophilic anaerobic digestion of
municipal solid waste with an emphasis on nutrient requirements. Biomass and Bioenergy
8(6), 433–444
Kayhanian, M. and Rich, D. (1996) . Pilot-scale high solids thermophilic anaerobic digetion of
municipal solid waste with an emphasis on nutrient requirements. Fuel and Energy Abstracts
37(3), 237–237
Kayhanian, M. and Tchobanoglous, G. (1992) . Pilot investigations of an innovative two-stage
anaerobic digestion and aerobic composting process for the recovery of energy and compost
from the organic fraction of MSW. In: F. Cecchi, J. Mata-Alvarez, and F. G. Pohland (eds.),
International Symposium on anaerobic digestion of solid waste. p. 181. Venice, Italy
Keener, H. M., Dick, W. A., and Hoitink, H. A. J. (2000) . Composting and beneficial utilization
of composted by-product materials. In: W. A. Dick (ed.), Land Application of Agricultural,
Industrial, and Municipal By-Products. Soil Science Society of America, Inc.. Madison
Kennedy, K. J., Hamoda, M. F., and Guiot, S. G. (1988) . Anaerobic Treatment of Leachate
Using Fixed Film and Sludge Bed Systems. Journal Water Pollution Control Federation 60(9),
1675–1683
Kettunen, R. H., Hoilijoki, T. H., and Rintala, J. A. (1996) . Anaerobic and sequential anaerobic-
aerobic treatments of municipal landfill leachate at low temperatures. Bioresource Technology
58(1), 31–40
Kettunen, R. H. and Rintala, J. A. (1998) . Performance of an on-site UASB reactor treating
leachate at low temperature. Water Research 32(3), 537–546
Kim, D., Ryu, H.-D., Kim, M.-S., Kim, J., and Lee, S.-I. (2007) . Enhancing struvite precipitation
potential for ammonia nitrogen removal in municipal landfill leachate. Journal of Hazardous
Materials 146(1-2), 81–85
Kim, J. S., Lee, C. H., and Chun, H. D. (1998) . Comparison of ultrafiltration characteristics
between activated sludge and biological activated carbon (BAC) sludge. Water Research
32(11), 3443–3451
Kim, J. Y., Chang, I. S., Shin, D. H., and Park, H. H. (2008) . Membrane fouling control through
the change of the depth of a membrane module in a submerged membrane bioreactor for
advanced wastewater treatment. Desalination 231(1-3), 35–43
Kim, K. J., Fane, A. G., Fell, C. J. D., and Joy, D. C. (1992) . Fouling Mechanisms of Membranes
During Protein Ultrafiltration. Journal of Membrane Science 68(1-2), 79–91
Kim, M., Ahn, Y. H., and Speece, R. E. (2002) . Comparative process stability and efficiency of
anaerobic digestion; mesophilic vs. thermophilic. Water Research 36(17), 4369–4385
Kimura, S. (1991) . Japan’s aqua renaissance ’90 project. Water Science and Technology 23,
7–9
Klocke, M., Nettmann, E., Bergmann, I., Mundt, K., Souidi, K., Mumme, J., and Linke, B. (2008)
. Characterization of the methanogenic Archaea within two-phase biogas reactor systems313

Chapter BIBLIOGRAPHY
operated with plant biomass. Systematic and Applied Microbiology 31(3), 190–205
Kowalchuk, G. A., Bodelier, P. L. E., Heilig, G. H. J., Stephen, J. R., and Laanbroek, H. J. (1998)
. Community analysis of ammonia-oxidising bacteria, in relation to oxygen availability in soils
and root-oxygenated sediments, using PCR, DGGE and oligonucleotide probe hybridisation.
Fems Microbiology Ecology 27(4), 339–350
Kraume, M., Wedi, D., Schaller, J., Iversen, V., and Drews, A. (2009) . Fouling in MBR: What use
are lab investigations for full scale operation?. Desalination 236(1-3), 94–103
Krause, L., Diaz, N. N., Edwards, R. A., Gartemann, K.-H., Kromeke, H., Neuweger, H., Puhler,
A., Runte, K. J., Schluter, A., Stoye, J., Szczepanowski, R., Tauch, A., and Goesmann, A.
(2008) . Taxonomic composition and gene content of a methane-producing microbial com-
munity isolated from a biogas reactor. Journal of Biotechnology 136(1-2), 91–101
Kristensen, J. B., Borjesson, J., Bruun, M. H., Tjerneld, F., and Jorgensen, H. (2007) . Use of
surface active additives in enzymatic hydrolysis of wheat straw lignocellulose. Enzyme and
Microbial Technology 40(4), 888–895
Kuberkar, V., Czekaj, P., and Davis, R. (1998) . Flux enhancement for membrane filtration of
bacterial suspensions using high-frequency backpulsing. Biotechnology and Bioengineering
60(1), 77–87
Kubler, H. and Wild, M. (1992) . The BTA-process high rate biomethanisation of biogenous solid
wastes. In: F. Cecchi, J. Mata-Alvarez, and F. G. Pohland (eds.), International Symposium on
anaerobic digestion of solid waste. p. 535. Venice, Italy
Kugelman, I. J. and McCarty, P. L. (1964) . Cation toxicity and stimulation in anaerobic waste
treatment. J. Water Pollut. Control Fed. 37, 97–116
Kurniawan, T. A., Lo, W.-H., and Chan, G. Y. (2006a) . Degradation of recalcitrant compounds
from stabilized landfill leachate using a combination of ozone-GAC adsorption treatment.
Journal of Hazardous Materials 137(1), 443–455
Kurniawan, T. A., Lo, W.-H., and Chan, G. Y. S. (2006b) . Physico-chemical treatments for
removal of recalcitrant contaminants from landfill leachate. Journal of Hazardous Materials
129(1-3), 80–100
Lagerkvist, A. and Chen, H. (1992) . Control of anaerobic degradation of MSW by enzyme
addition. In: F. Cecchi, J. Mata-Alvarez, and F. G. Pohland (eds.), International Symposium
on anaerobic digestion of solid waste. p. 75. Venice, Italy
Laitinen, N., Luonsi, A., and Vilen, J. (2006) . Landfill leachate treatment with sequencing batch
reactor and membrane bioreactor. Desalination International Congress on Membranes and
Membrane Processes 191(1-3), 86–91
Langenhoff, A. A. M. and Stuckey, D. C. (2000) . Treatment of dilute wastewater using an anaer-
obic baffled reactor: Effect of low temperature. Water Research 34(15), 3867–3875
Lawrence, A. W. and McCarty, P. L. (1970) . Unified basis for biological treatment design and
operation. J. Sanit. Engin. Div., ASCE 96, 757–778
Lay, J. J., Lee, Y. J., and Noike, T. (1999) . Feasibility of biological hydrogen production from
organic fraction of municipal solid waste. Water Research 33(11), 2579–2586
Lay, J. J., Noike, T., Endo, G., and Ishimoto, S. (1997) . Analysis of environmental factors
affecting methane production from high-solids organic waste. Water science and technology314

Chapter BIBLIOGRAPHY
36(6-7), 493–500
Le-Clech, P., Jefferson, B., and Judd, S. J. (2003) . Impact of aeration, solids concentration and
membrane characteristics on the hydraulic performance of a membrane bioreactor. Journal
of Membrane Science 218(1-2), 117–129
Le Corre, K. S., Valsami-Jones, E., Hobbs, P., and Parsons, S. A. (2005) . Impact of calcium on
struvite crystal size, shape and purity. Journal of Crystal Growth 283(3-4), 514–522
Leclerc, M., Delgenes, J. P., and Godon, J. J. (2004) . Diversity of the archaeal community in
44 anaerobic digesters as determined by single strand conformation polymorphism analysis
and 16S rDNA sequencing. Environmental Microbiology 6(8), 809–819
Lee, D. H., Behera, S. K., Kim, J. W., and Park, H. S. (2009) . Methane production potential
of leachate generated from Korean food waste recycling facilities: A lab-scale study. Waste
Management 29(2), 876–882. 5th Asian-Pacific Landfill Symposium OCT 22-24, 2008 Sap-
poro, JAPAN
Lee, J. P., Park, S. C., and Rhee, S. W. (1997) . The effect of ammonia and sodium chloride on
the anaerobic digestion of food waste. Journal of Korean Society of Environmental Engineers
19(9), 1185–1192. in Korean
Lee, T. H., Aoki, H., Sugano, Y., and Shoda, M. (2000) . Effect of molasses on the production
and activity of dye-decolorizing peroxidase from Geotrichum candidum. Journal of Bioscience
and Bioengineering 89(6), 545–549
Leege, P. B. and Thompson, W. H. (1997) . Test Methods for the Examination of Composting
and Compost. The US Composting Council. Bethsda, Maryland, USA
Lettinga, G. and Hulshoff Pol, L. W. (1991) . UASB-process design for various types of wastew-
aters. Water science and technology 24(8), 87–107
Lettinga, G., Rebac, S., and Zeeman, G. (2001) . Challenge of psychrophilic anaerobic wastew-
ater treatment. Trends in Biotechnology 19(9), 363–370
Ley, R., Hamady, M., Lozupone, C., Turnbaugh, P. J., Ramey, R. R., Bircher, J. S., Schlegel,
M. L., Tucker, T. A., Schrenzel, M. D., Knight, R., and Gordon, J. I. (2008) . Evolution of
mammals and their gut microbes. Science 320(5883), 1647–1651
Li, H., Fane, A. G., Coster, H. G. L., and Vigneswaran, S. (1998) . Direct observation of particle
deposition on the membrane surface during crossflow microfiltration. Journal of Membrane
Science 149(1), 83–97
Li, H., Fane, A. G., Coster, H. G. L., and Vigneswaran, S. (2003) . Observation of deposition
and removal behaviour of submicron bacteria on the membrane surface during crossflow
microfiltration. Journal of Membrane Science 217(1-2), 29–41
Li, X. Z. and Zhao, Q. L. (2003) . Recovery of ammonium-nitrogen from landfill leachate as a
multi-nutrient fertilizer. Ecological Engineering 20(2), 171–181
Li, Y. Z., He, Y. L., Liu, Y. H., Yang, S. C., and Zhang, G. J. (2005) . Comparison of the filtration
characteristics between biological powdered activated carbon sludge and activated sludge in
submerged membrane bioreactors. Desalination 174(3), 305–314
Liao, W., Liu, Y., Liu, C., and Chen, S. (2004) . Optimizing dilute acid hydrolysis of hemicellulose
in a nitrogen-rich cellulosic material-dairy manure. Bioresource Technology 94(1), 33–41
Lin, Y. P. and Singer, P. C. (2005) . Inhibition of calcite crystal growth by polyphosphates. Water315

Chapter BIBLIOGRAPHY
Research 39(19), 4835–4843
Lissens, G., Vandevivere, P., De Baere, L., Biey, E. M., and Verstraete, W. (2001) . Solid waste
digestors: process performance and practice for municipal solid waste digestion. Water Sci-
ence and Technology 44(8), 91–102
Liu, S. T., Yang, F. L., Gong, Z., Meng, F. G., Chen, H. H., Xue, Y., and Furukawa, K. J. (2008) .
Application of anaerobic ammonium-oxidizing consortium to achieve completely autotrophic
ammonium and sulfate removal. Bioresource Technology 99(15), 6817–6825
Liu, Y. and Boone, D. R. (1991) . Effects of salinity on methanogenic decomposition. Bioresource
Technology 35(3), 271–273
Llewelyn, R. H. (2005) . Development of standard laboratory based test to measure compost
stability - Annex A. Research report ORG0020. WRAP
Lopes, W. S., Leite, V. D., and Prasad, S. (2004) . Influence of inoculum on performance of
anaerobic reactors for treating municipal solid waste. Bioresource Technology 94(3), 261–
266
Lowe, J. and Hossain, M. M. (2008) . Application of ultrafiltration membranes for removal of
humic acid from drinking water. Desalination 218(1-3), 343–354
Ma, H. M., Hakim, L. F., Bowman, C. N., and Davis, R. H. (2001) . Factors affecting membrane
fouling reduction by surface modification and backpulsing. Journal of Membrane Science
189(2), 255–270
Mackley, M. R. and Sherman, N. E. (1992) . Cross-Flow Cake Filtration Mechanisms and Kinet-
ics. Chemical Engineering Science 47(12), 3067–3084
MacRae, J. D. and Hall, K. J. (1998) . Biodegradation of polycyclic aromatic hydrocarbons (PAH)
in marine sediment under denitrifying conditions. Water Science and Technology 38(11),
177–185
Madigan, M. T. and Martinko, J. M. (1984) . Biology of microorganisms. Pearson Benjamin
Cummings. USA. brock edition
Maeder, D. L., Anderson, I., Brettin, T. S., Bruce, D. C., Gilna, P., Han, C. S., Lapidus, A., Met-
calf, W. W., Saunders, E., Tapia, R., and Sowers, K. R. (2006) . The Methanosarcina bark-
eri Genome: Comparative Analysis with Methanosarcina acetivorans and Methanosarcina
mazei Reveals Extensive Rearrangement within Methanosarcinal Genomes. Journal of Bac-
teriology 188(22), 7922–7931
Mahmoud, N. (2002) . Anaerobic pre-treatment of sewage under low temperature (15 ˚ C) con-
ditions in an integrated UASB-Digester system. PhD Thesis. Wageningen University, The
Netherlands.
Mahmoud, N., Zeeman, G., Gijzen, H., and Lettinga, G. (2004) . Anaerobic stabilisation and
conversion of biopolymers in primary sludge - effect of temperature and sludge retention
time. Water Research 38(4), 983–991
Mahvi, A. H. and Razavi, M. (2005) . Application of Polyelectrolyte in Turbidity Removal from
Surface Water. American Journal of Applied Sciences 2(1), 397–399
Mamais, D., Pitt, P. A., Cheng, Y. W., Loiacono, J., and Jenkins, D. (1994) . Determination of
Ferric-Chloride Dose to Control Struvite Precipitation in Anaerobic Sludge Digesters. Water
Environment Research 66(7), 912–918316

Chapter BIBLIOGRAPHY
Mansouri, L., Bousselmi, L., and Ghrabi, A. (2007) . Degradation of recalcitrant organic contam-
inants by solar photocatalysis. Water Science and Technology 55(12), 119–125
Maris, P. J., Harrington, D. W., and Chismon, G. L. (1984) . Leachate Treatment with Particular
Reference to Aerated Lagoons. Water Pollution Control 83(4), 521–538
Marshall, A. D., Munro, P. A., and Tragardh, G. (1993) . The Effect of Protein Fouling in Micro-
filtration and Ultrafiltration on Permeate Flux, Protein Retention and Selectivity - a Literature-
Review. Desalination 91(1), 65–108
Martin, J. and Haider, K. (1971) . Microbial activity in relation to soil humus formation. Soil
Science 111, 54–63
Massey, M. L. and Pohland, F. G. (1978) . Phase Separation of Anaerobic Stabilization by Kinetic
Controls. Journal Water Pollution Control Federation 50(9), 2204–2222
Mata-Alvarez, J., Cecchi, F., Pavan, P., and Bassetti, A. (1992) . semi-dry thermophilic anaerobic
digestion of fresh and pre-composted organic fraction of MSW. Digester performance. In: F.
Cecchi, J. Mata-Alvarez, and F. G. Pohland (eds.), International Symposium on anaerobic
digestion of solid waste. Venice, Italy
Mathiesen (1989) . Ca and/or Mg soap solution in biogas production. WO8900548 (Patent)
Matsushige, K., Inamori, Y., Mizuochi, M., Hosomi, M., and Sudo, R. (1990) . The Effects of
Temperature on Anaerobic Filter Treatment for Low-Strength Organic Waste-Water. Environ-
mental Technology 11(10), 899–910
McBridge, M. B. (1995) . Toxic metal accumulation from agricultural use of sludge: are USEPA
regulations protective?. Journal of Environmental Quality 24, 5–18
McCarty, P. L. (1964) . Anaerobic waste treatment fundamentals. Public works 95(9), 107–112
McCarty, P. L. and Brousseau, M. H. (1963) . Effect of high concentrations of individual Volatile
Acids in Anaerobic Treatment. In: 18th Annual Purdue Industrial Waste Conference. p. 283.
Purdue
McCarty, P. L. and McKinney, R. (1961) . Salt toxicity in anaerobic digestion. J. Water Pollut.
Control Fed. 33, 399–415
McFarlane, P. N. and Pfeffer, J. T. (1981) . Biological Conversion of Biomass to Methane. Techni-
cal Report SERI/TR-98357-1. Department of Civil Engineering, University of Illinois, Urbana,
Illinois, USA
McHugh, S., Carton, M., Collins, G., and O’Flaherty, V. (2004) . Reactor performance and
microbial community dynamics during anaerobic biological treatment of wastewaters at 16-
37 ˚ C. FEMS Microbiology Ecology 48(3), 369–378
McHugh, S., Carton, M., Mahony, T., and O’Flaherty, V. (2003) . Methanogenic population
structure in a variety of anaerobic bioreactors. FEMS Microbiology 219, 297–304
McInerney, M. J. (1988) . Anaerobic hydrolysis and Fermentation of Fats and Proteins. In: J. B.
Zehnder (ed.), Biology of Anaerobic Microorganisms. Wiley-Liss. New-York
McInerney, M. J., Bryant, M. P., and Pfenning, N. (1979) . Anaerobic bacterium that degrades
fatty acids in syntrophic association with methanogens. Archives of microbiology 122(2),
129–135
McKeown, R. M., Scully, C., Mahony, T., Collins, G., and O’Flaherty, V. (2009) . Long-term
(1243 days), low-temperature (4-15A ˚ C), anaerobic biotreatment of acidified wastewaters:317

Chapter BIBLIOGRAPHY
Bioprocess performance and physiological characteristics. Water Research 43(6), 1611–
1620
McLaughlin, M. J., Parker, D. R., and Clarke, J. M. (1999) . Metals and micronutrients - food
safety issues. Field Crops Research 60(1-2), 143–163
Mechichi, T., Patel, B. K. C., and Sayadi, S. (2005) . Anaerobic degradation of methoxylated
aromatic compounds by Clostridium methoxybenzovorans and a nitrate-reducing bacterium
Thauera sp. strain Cin3,4. International Biodeterioration and Biodegradation 56(4), 224–230
Meher, K. K., Murthy, M. V. S., and Gollakota, K. G. (1994) . Psychrophilic Anaerobic Digestion
of Human Waste. Bioresource Technology 50(2), 103–106
Meng, F., Zhang, H., Yang, F., Zhang, S., Li, Y., and Zhang, X. (2006) . Identification of ac-
tivated sludge properties affecting membrane fouling in submerged membrane bioreactors.
Separation and Purification Technology 51(1), 95–103
Mercier-Bonin, M., Daubert, I., Leonard, D., Maranges, C., Fonade, C., and Lafforgue, C. (2001)
. How unsteady filtration conditions can improve the process efficiency during cell cultures in
membrane bioreactors. Separation and Purification Technology 22-3(1-3), 601–615
Michel, J. F. C., Pecchia, J. A., Rigot, J., and Keener, H. M. (2004) . Mass and nutrient losses
during the composting of dairy manure amended with sawdust or straw. Compost Science
and Utilization 12, 323–334
Miller, F. C. (1992) . Composting as a process based on the control of ecologically selective
factors. In: J. F. B. Metting (ed.), Soil Microbial Ecology, Applications in Agricultural and
Environmental Management. pp 515–544. Marcel Dekker, Inc.. New York
Millot, N., Granet, C., Wicker, A., Faup, G. M., and Navarro, A. (1987) . Application of Gel
Permeation Chromatography processing system to landfill leachates. Water Research 21(6),
709–715
Miron, Y., Zeeman, G., van Lier, J. B., and Lettinga, G. (2000) . The role of sludge retention
time in the hydrolysis and acidification of lipids, carbohydrates and proteins during digestion
of primary sludge in CSTR systems. Water Research 34(5), 1705–1713
Montastruc, L., Azzaro-Pantel, C., Biscans, B., Cabassud, M., and Domenech, S. (2003) . A
thermochemical approach for calcium phosphate precipitation modeling in a pellet reactor.
Chemical Engineering Journal 94(1), 41–50
Morel, F. M. M. (1983) . Principles of Aquatic Chemistry. Wiley-Interscience Publication
Morgan, J. W., Forster, C. F., and Evison, L. (1990) . A Comparative-Study of the Nature of
Biopolymers Extracted from Anaerobic and Activated Sludges. Water Research 24(6), 743–
750
Moser-Engeler, R., Kuhni, M., Bernhard, C., and Siegrist, H. (1999) . Fermentation of raw
sludge on an industrial scale and applications for elutriating its dissolved products and non-
sedimentable solids. Water Research 33(16), 3503–3511
Mosey, F. E. (1983) . Mathematical modelling of the anaerobic digestion process: regulatory
mechanisms for the formation of short-chain volatile acids from glucose. Water science and
technology 15, 209–232
Mudrack, K. and Kunst, S. (1986) . Anaerobic Processes for Treatment of Sewage and Sewage
Sludge. In: E. H. Ltd. (ed.), Biology of Sewage treatment and Water Pollution Control. John318

Chapter BIBLIOGRAPHY
Wiley and Sons
Muller, N., Griffin, B. M., Stingl, U., and Schink, B. (2008) . Dominant sugar utilizers in sediment
of Lake Constance depend on syntrophic cooperation with methanogenic partner organisms.
Environmental Microbiology 10(6), 1501–1511
Nachaiyasit, S. and Stuckey, D. C. (1995) . Microbial Response to Environmental-Changes in
an Anaerobic Baffled Reactor (ABR). Antonie Van Leeuwenhoek International Journal of
General and Molecular Microbiology 67(1), 111–123
Nachaiyasit, S. and Stuckey, D. C. (1997) . Effect of low temperatures on the performance of an
anaerobic baffled reactor (ABR). Journal of Chemical Technology and Biotechnology 69(2),
276–284
Nadeem, M., Mahmood, A., Shahid, S. A., Shah, S. S., Khalid, A. M., and McKay, G. (2006) .
Sorption of lead from aqueous solution by chemically modified carbon adsorbents. Journal
of Hazardous Materials 138(3), 604–613
Nagaoka, H., Kono, S., and Hamaya, S. (2001) . Fouling mechanism considering production
of utilization and biomass-associated extracellular polymers in membrane bioreactor. In:
Preprints IWA 2nd World Water Congress. Berlin
Nagaoka, H., Yamanishi, S., and Miya, A. (1998) . Modeling of biofouling by extracellular poly-
mers in a membrane separation activated sludge system. Water Science and Technology
38(4-5), 497–504
Najafpour, G. D., Zinatizadeh, A. A. L., Mohamed, A. R., Hasnain Isa, M., and Nasrollahzadeh,
H. (2006) . High-rate anaerobic digestion of palm oil mill effluent in an upflow anaerobic
sludge-fixed film bioreactor. Process Biochemistry 41(2), 370–379
Nallathambi, G. V. (1997) . Anaerobic digestion of biomass for methane production: A review.
Biomass and Bioenergy 13(1-2), 83–114
Nalli, S., Cooper, D. G., and Nicell, J. A. (2003) . Biodegradation of plasticizers by Rhodococcus
rhodochrous. Biodegradation 13(5), 343–352
Neves, L., Oliveira, R., and Alves, M. M. (2004) . Influence of inoculum activity on the bio-
methanization of a kitchen waste under different waste/inoculum ratios. Process Biochemistry
39(12), 2019–2024
Nghiem, L. D., Oschmann, N., and Schafer, A. I. (2006) . Fouling in greywater recycling by direct
ultrafiltration. Desalination 187(1-3), 283–290
Nguyen, P., Kuruparan, P., and Visvanathan, C. (2006) . Anaerobic digestion of municipal solid
waste as a treatment prior to landfill. Bioresource Technology 98(2), 380–387
Noike, T., Endo, G., Chang, J. E., Yaguchi, J. I., and Matsumoto, J. I. (1985) . Characteristics of
Carbohydrate Degradation and the Rate-Limiting Step in Anaerobic-Digestion. Biotechnology
and Bioengineering 27(10), 1482–1489
Nopharatana, A., Pullammanappallil, P. C., and Clarke, W. P. (2006) . Kinetics and dynamic
modelling of batch anaerobic digestion of municipal solid waste in a stirred reactor. Waste
Management 27(5), 595–603
Nordberg, . (2003) . Review of European policies affecting implementation of anaerobic diges-
tion. In: A.-N. network (ed.), AD-nett II Workshop. Sopron, Ungern
Nordberg, A., Jarvis, A., Stenberg, B., Mathisen, B., and Svensson, B. H. (2006) . Anaerobic319

Chapter BIBLIOGRAPHY
digestion of alfalfa silage with recirculation of process liquid. Bioresource Technology 98(1),
104–111
Norddahl, B. and Rohold, L. (2000) . The Biorek concept for the conversion of organic effluent
to enrgy, concentrated fertilizer and potable water. Technical report. [Online]. Available from:
http://www.bioscan.dk/The BIOREK Concept May 2000.pdf
Novak, J. T. and Carlson, D. A. (1970) . KINETICS OF ANAEROBIC LONG CHAIN FATTY ACID
DEGRADATION. Journal Water Pollution Control Federation 42(11), 1932–1970
Ntampou, X., Zouboulis, A. I., and Samaras, P. (2006) . Appropriate combination of physico-
chemical methods (coagulation/flocculation and ozonation) for the efficient treatment of land-
fill leachates. Chemosphere 62(5), 722–730
Nuengjamnong, C., Kweon, J. H., Cho, J., Polprasert, C., and Ahn, K.-H. (2005) . Membrane
fouling caused by extracellular polymeric substances during microfiltration processes. De-
salination 179(1-3), 117–124
Nyns, E. J. and Gendebien, A. (1992) . Landfill gas: from environment to energy. In: F. Cecchi,
J. Mata-Alvarez, and F. G. Pohland (eds.), International Symposium on anaerobic digestion
of solid waste. p. 315. Venice, Italy
Ogawa, H., Kitamura, H., and Miyata, N. (2005) . Biodegradation of endocrine disrupting chem-
icals in aerobic and anaerobic sludges. Jpn J Water Treat Biol 41, 83–92
Ohlinger, K. N. (2008) . Struvite Tool equilibrium chemistry computer model (Personal Commu-
nication)
Ohlinger, K. N., Young, T. M., and Schroeder, E. D. (1998) . Predicting struvite formation in
digestion. Water Research 32(12), 3607–3614
O’Keefe, D. M. and Chynoweth, D. P. (2000) . Influence of phase separation, leachate recycle
and aeration on treatment of municipal solid waste in simulated landfill cells. Bioresource
Technology 72(1), 55–66
O’Keefe, D. M., Chynoweth, D. P., Barkdoll, A. W., Nordstedt, R. A., Owens, J. M., and Sifontes,
J. (1992) . Sequential batch anaerobic composting. In: F. Cecchi, J. Mata-Alvarez, and
F. G. Pohland (eds.), International Symposium on anaerobic digestion of solid waste. p. 117.
Venice, Italy
O’Keefe, D. M., Owens, J. M., and Chynoweth, D. P. (1996) . Anaerobic composting of crab-
picking wastes for byproduct recovery. Bioresource Technology 58(3), 265–272
Oleszkiewicz, J. A. and PoggiVaraldo, H. M. (1997) . High-solids anaerobic digestion of mixed
municipal and industrial waste. Journal of Environmental Engineering-Asce 123(11), 1087–
1092
O’Rourke, J. T. (1968) . Kinetics of Anaerobic Waste Treatment at Reduced Temperatures. PhD
Thesis. Stanford University.
Ortega-Clemente, A., Caffarel-Mendez, S., Ponce-Noyola, M. T., Barrera-Cortes, J., and Poggi-
Varaldo, H. M. (2008) . Fungal post-treatment of pulp mill effluents for the removal of recalci-
trant pollutants. Bioresource Technology 100(6), 1885–1894
O’Sullivan, C. A. and Burrell, P. C. (2007) . The effect of media changes on the rate of cellulose
solubilisation by rumen and digester derived microbial communities. Waste Management
27(12), 1808–1814320

Chapter BIBLIOGRAPHY
O’Sullivan, C. A., Burrell, P. C., Clarke, W. P., and Blackall, L. L. (2007) . The effect of biomass
density on cellulose solubilisation rates. Bioresource Technology 99(11), 4723–4731
Owen, W. F., Stuckey, D. C., Healy, Jr., J. B., Young, L. Y., and McCarty, P. L. (1979) . Bioassay
for monitoring biochemical methane potential and anaerobic toxicity. Water Research 13(6),
485–492
Owens, J. M. and Chynoweth, D. P. (1993) . Biochemical Methane Potential of Municipal Solid
Waste (MSW) Components. Water Science and Technology 27(2), 1–14
Padmasiria, S. I., Zhanga, J., Fitchc, M., Norddahld, B., Morgenroth, E., and Raskin, L. (2007) .
Methanogenic population dynamics and performance of an anaerobic membrane bioreactor
(AnMBR) treating swine manure under high shear conditions. Water Research 41(1), 134–
144
Park, H., Choo, K. H., and Lee, C. H. (1999) . Flux enhancement with powered activated carbon
addition in the membrane anerobic bioreactor. Separation Science and Technology 34, 2781–
2792
Parkin, G. F., Lynch, N. A., Kuo, W. C., Vankeuren, E. L., and Bhattacharya, S. K. (1990) . Inter-
action between Sulfate Reducers and Methanogens Fed Acetate and Propionate. Research
Journal of the Water Pollution Control Federation 62(6), 780–788
Patel, V., Desai, M., and Madawar, D. (1993) . Thermochemical pretreatment of water hyacinth
for improved biomethanation. Applied Biochemistry Biotechnology 42, 67–74
Pavan, P., Battistoni, P., Cecchi, F., and Mata-Alvarez, J. (2000a) . Performance of thermophilic
semi-dry anaerobic digestion process changing the feed biodegradability. Water Science and
Technology 41(3), 75–81
Pavan, P., Battistoni, P., Cecchi, F., and Mata-Alvarez, J. (2000b) . Two-phase anaerobic diges-
tion of source sorted OFMSW (organic fraction of municipal solid waste): performance and
kinetic study. Water Science and Technology 41(3), 111–118
Pavarina, E. and Durrant, L. R. (2002) . Growth of lignocellulosic-fermenting fungi on different
substrates under low oxygenation conditions. Applied biochemistry and biotechnology 98,
663–677
Pavlostathis, S. G. and Giraldo-Gomez, E. (1991a) . Kinetics of Anaerobic treatment. Water
Science and Technology 24, 35–39
Pavlostathis, S. G. and Giraldo-Gomez, E. (1991b) . Kinetics of anaerobic treatment: A critical
review. Critical reviews in Environmental Control 21, 411–490
Penaud, V., Delgenes, J. P., and Moletta, R. (1999) . Thermo-chemical pretreatment of a
microbial biomass: influence of sodium hydroxide addition on solubilization and anaerobic
biodegradability. Enzyme and Microbial Technology 25(3-5), 258–263
Perrin, D. D. (1982) . Ionisation Constants of inorganic acids and bases in aqueous solutions.
Pergamon Press. UK. 2nd edition edition
Pfeffer, J. T. and Liebman, J. C. (1974) . Biological conversion of organic refuse to methane.
Technical Report UILU-ENG-74-2019 NSF/RANN/SE/GI/39191/PR/75/2. Dept. of Civil Engi-
neering, Univ. of Illinois, Urbana
Phillips, P. S., Barnes, R., Bates, M. P., and Coskeran, T. (2005) . A critical appraisal of a UK
county waste minimisation programme: The requirement for regional facilitated development321

Chapter BIBLIOGRAPHY
of industrial symbiosis/ecology. Resources, Conservation and Recycling 46(3), 242–264
Pirbazari, M., Ravindran, V., Badriyha, B. N., and Kim, S.-H. (1996) . Hybrid membrane filtration
process for leachate treatment. Water Research 30(11), 2691–2706
Plant, L. J. and House, W. A. (2002) . Precipitation of calcite in the presence of inorganic
phosphate. Colloids and Surfaces A: Physicochemical and Engineering Aspects 203(1-3),
143–153
PoggiVaraldo, H. M., Alzate-Gaviria, L. M., Perez-Hernandez, A., Nevarez-Morillon, V. G., and
Rinderknecht-Seijas, N. (2005) . A side-by-side comparison of two systems of sequencing
coupled reactors for anaerobic digestion of the organic fraction of municipal solid waste.
Waste Management and Research 23, 270–280
Popp, L. and Fischer, P. (1998) . New method for rapid determination of compost maturity. Acta
Horticulturae 450, 237–244
Pouet, M. F. and Grasmick, A. (1995) . Microfiltration of urban wastewater: the role of the
different organic fraction in fouling the membrane. In: Euromembrane ’95. Vol. II. pp 482–
486. University of Bath, Bath, U.K.
Prabpai, S., Charerntanyarak, L., Siri, B., Moore, M. R., and Noller, B. N. (2009) . Effects of
residues from municipal solid waste landfill on corn yield and heavy metal content. Waste
Management 29(8), 2316–2320
Prakitchaiwattana, C. J., Fleet, G. H., and Heard, G. M. (2004) . Application and evaluation of
denaturing gradient gel electrophoresis to analyse the yeast ecology of wine grapes. FEMS
Yeast Research 4(8), 865–877
Prosser, J. I. (2007) . The ecology of Nitrifying bacteria. In: H. Bothe, S. J. Ferguson, and W. E.
Newton (eds.), Biology of the Nitrogen Cycle. Elsevier. Amsterdam, The Netherlands
Pullammanappallil, P. C., Chynoweth, D. P., Lyberatos, G., and Svoronos, S. A. (2001) . Stable
performance of anaerobic digestion in the presence of a high concentration of propionic acid.
Bioresource Technology 78(2), 165–169
Ramphao, M., Ekama, G. A., Lakay, M. T., Mafungwa, H., and Wentzel, M. C. (2004) . The
performance and kinetics of biological nitrogen and phosphorus removal with ultra-filtration
membranes for solid-liquid separation. UCT MSc Thesis. University of Cape Town
Raposo, F., Banks, C. J., Siegert, I., Heaven, S., and Borja, R. (2006) . Influence of inoculum
to substrate ratio on the biochemical methane potential of maize in batch tests. Process
Biochemistry 41(6), 1444–1450
Rautenbach, R. and Mellis, R. (1994) . Waste water treatment by a combination of bioreactor
and nanofiltration. Desalination 95(2), 171–188
Raynal, J., Delgenes, J. P., and Moletta, R. (1998) . Two-phase anaerobic digestion of solid
wastes by a multiple liquefaction reactors process. Bioresource Technology 65(1-2), 97–103
Redzwan, G. and Banks, C. (2004) . The use of a specific function to estimate maximum
methane production in a batch-fed anaerobic reactor. Journal of Chemical technology and
Biotechnology 79, 1174–1178
Richards, B. K., Cummings, R. J., Jewell, W. J., and Herndon, F. G. (1991) . High Solids Anaer-
obic Methane Fermentation of Sorghum and Cellulose. Biomass and Bioenergy 1(1), 47–53
Rintala, J. A. and Ahring, B. K. (1994) . A 2-STAGE THERMOPHILIC ANAEROBIC PROCESS322

Chapter BIBLIOGRAPHY
FOR THE TREATMENT OF SOURCE SORTED HOUSEHOLD SOLID-WASTE. Biotechnol-
ogy letters 16(10), 1097–1102
Ritchie, G. A. F. and Nicholas, D. J. (1972) . Identification of Sources of Nitrous-Oxide Pro-
duced by Oxidative and Reductive Processes in Nitrosomonas europaea. Biochemical Jour-
nal 126(5), 1181–1191
Rittman, B. E. and McCarty, P. L. (2001) . Environmental biotechnology: Principles and applica-
tions. McGraw-Hill Int. Editions. London
Robinson, A. H. (2005) . Landfill leachate treatment. In: 5th International Conference on Mem-
brane Bioreactors. Cranfield University, UK
Robinson, H. D. and Maris, P. J. (1985) . The treatment of leachates from domestic waste in
landfill sites. Journal of the Water Pollution Control Association 57(1), 30–38
Rodriguez, J., Castrillon, L., Maranon, E., Sastre, H., and Fernandez, E. (2004) . Removal
of non-biodegradable organic matter from landfill leachates by adsorption. Water Research
38(14-15), 3297–3303
Ross, W. R., Barnard, J. P., Leroux, J., and Devilliers, H. A. (1990) . Application of Ultrafiltra-
tion Membranes for Solids - Liquid Separation in Anaerobic-Digestion Systems - the ADUF
Process. Water S.A. 16(2), 85–91
Ryckeboer, J., Mergaert, J., Vaes, K., Klammer, S., De Clercq, D., Coosemans, J., Insam, H.,
and Swings, J. (2003) . A survey of bacteria and fungi occurring during composting and
self-heating processes. Annals of Microbiology 53(4), 349–410
Sadanari, J., Brulc, J. M., Levy-Assaraf, M., Rincon, M. T., Flint, H. J., Berg, M. E., Wilson,
M. K., White, B. A., Bayer, E. A., Lamed, R., and Borovok, I. (2008) . Cellulosome gene
cluster analysis for gauging the diversity of the ruminal cellulolytic bacterium Ruminococcus
flavefaciens. FEMS Microbiology Letters 285(2), 188–194
Sakamoto, H., Souda, I., and Fukui, H. (2000) . Detected Bisphenol A from landfill sites. In: Pro-
ceedings of the 11th annual conference of the Japan Society of Waste Management Experts.
pp 1098–1100 (in japanese)
Sanchez-Monedero, M. A., Cegarra, J., GarcAa, D., and Roig, A. (2002) . Chemical and struc-
tural evolution of humic acids during organic waste composting. Biodegradation 13(6), 361–
371
Sanders, W. T. M. (2001) . Anaerobic hydrolysis during digestion of complex substrates. PhD
Thesis. Wageningen University, The Netherlands.
Sanders, W. T. M., Veeken, A. H. M., Zeeman, G., and van Lier, J. B. (2002) . Analysis and
optimization of the anaerobic digestion of the organic fraction of municipal solid waste. In:
J. Mata-Alvarez (ed.), Biomethanization of the organic fraction of municipal solid wastes. pp
63–90. IWA Publishing
Satoh, H., Ono, H., Rulin, B., Kamo, J., Okabe, S., and Fukushi, K.-I. (2004) . Macroscale
and microscale analyses of nitrification and denitrification in biofilms attached on membrane
aerated biofilm reactors. Water Research 38(6), 1633–1641
Scaglia, B. and Adani, F. (2008) . An index for quantifying the aerobic reactivity of municipal solid
wastes and derived waste products. Science of The Total Environment 394(1), 183–191
Scheidat, B., Kasche, V., and Sekoulov, I. (1999) . Primary sludge hydrolysis under addition323

Chapter BIBLIOGRAPHY
of hydrolytic enzymes. In: J. Mata-Alvarez, A. Tilche, and F. Cecchi (eds.), Second Interna-
tional SYmposium on Anaerobic Digestion of Solid Wastes. Vol. 1. pp 161–168. Grafiques
92. Barcelona
Schink, B. (1997) . Energetics of syntrophic cooperation in methanogenic degradation. Microbi-
ology and Molecular Biology Reviews 61(2), 262–280
Schmidt, J. E. and Ahring, B. K. (1993) . Effects of magnesium on thermophilic acetate-
degrading granules in upflow anaerobic sludge blanket (UASB) reactors. Enzyme and Mi-
crobial Technology 15(4), 304–310
Schober, G., Schafer, J., Schmid-Staiger, U., and Trosch, W. (1999) . One and two-stage diges-
tion of solid organic waste. Water Research 33(3), 854–860
Schwartz, R. D. and Keller, F. A. (1982) . Acetic-Acid Production by Clostridium thermoaceticum
in pH-Controlled Batch Fermentations at Acidic pH. Applied and Environmental Microbiology
43(6), 1385–1392
Schwarzbauer, J., Heim, S., Brinker, S., and Littke, R. (2002) . Occurrence and alteration of
organic contaminants in seepage and leakage water from a waste deposit landfill. Water
Research 36(9), 2275–2287
Seely, O. (2008) . Selected Solubility Products and Formation Constants at 25 ˚ C. Technical
report. http://www.csudh.edu/oliver/chemdata/data-ksp.htm
Sekiguchi, Y., Kamagata, Y., Syutsubo, K., Ohashi, A., Harada, H., and Nakamura, K. (1998)
. Phylogenetic diversity of mesophilic and thermophilic granular sludges determined by 16S
rRNA gene analysis. Microbiology-Sgm 144, 2655–2665
Shanahan, J. W. and Semmens, M. J. (2006) . Influence of a nitrifying biofilm on local oxygen
fluxes across a micro-porous flat sheet membrane. Journal of Membrane Science 277(1-2),
65–74
Sharma, S. K., Saini, J. S., Mishra, I. M., and Sharma, M. P. (1989) . Biogasification of woody
biomass: Ipomoea fistulosa plant stem. Biological Wastes 28(1), 25–32
Shea, T. G., Pretorius, W. A., Cole, R. D., and Pearson, E. A. (1968) . Kinetics of hydrogen
assimilation in the methane fermentation. Water Research 2(12), 833
Shi, H.-P. and Lee, C.-M. (2007) . Phosphate removal under denitrifying conditions by Brachy-
monas sp. strain P12 and Paracoccus denitrificans PP15. Canadian journal of microbiology
53(6), 727–737
Shin, H. S., Moon, M. J., Song, Y. C., and Bae, B. U. (1993) . A study on anaerobic treatability
of food waste using biodegradability test. Journal of Korean Society of Waste Management
10(1), 35–42. in Korean
Shin, H. S., Song, Y. C., and Paik, B. C. (1995) . Inhibtory effects of sodium ions on the anaerobic
degradation of food waste. Journal of Koren Solid Wastes Engineering Society 12(1), 50–57
Shin, J.-H., Lee, S.-M., Jung, J.-Y., Chung, Y.-C., and Noh, S.-H. (2005) . Enhanced COD and
nitrogen removals for the treatment of swine wastewater by combining submerged membrane
bioreactor (MBR) and anaerobic upflow bed filter (AUBF) reactor. Process Biochemistry
40(12), 3769–3776
Shiralipour, A. and Smith, P. H. (1984) . Conversion of biomass into methane gas. Biomass
6(1-2), 85–92324

Chapter BIBLIOGRAPHY
Shpiner, R. (2007) . Treatment of Produced Water by Waste Stabilisation Ponds. PhD thesis.
Imperial College London.
Siegrist, H. and Gujer, W. (1987) . Demonstration of mass transfer and pH effects in a nitrifying
biofilm. Water Research 21(12), 1481–1487
Sierra-Alvarez, R., Harbrecht, J., Kortekaas, S., and Lettinga, G. (1990) . The continuous anaer-
obic treatment of pulping wastewaters. Journal of Fermentation and Bioengineering 70(2),
119–127
Silva, I. S., Grossman, M., and Durrant, L. R. (2008) . Degradation of polycyclic aromatic hydro-
carbons (2-7 rings) under microaerobic and very-low-oxygen conditions by soil fungi. Inter-
national Biodeterioration and Biodegradation 63(2), 224–229
Silvey, P., Pullammanappallil, P. C., Blackall, L., and Nichols, P. (2000) . Microbial ecology of
the leach bed anaerobic digestion of unsorted municipal solid waste. Water Science and
Technology 41(3), 9–16
Singh, L., Maurya, M. S., Ram, M. S., and Alam, S. I. (1993) . Biogas production from night soil
- Effects of loading and temperature. Bioresource Technology 45(1), 59–61
Smith, D. P. (1986) . H2 in Anaerobic Processes. PhD thesis. Stanford University.
Smith, M. R. (1983) . Reversal of 2-Bromoethanesulfonate Inhibition of Methanogenesis in
Methanosarcina sp.. Journal of Bacteriology Nov. 1983, 516–523
Smith, M. R. and Mah, R. A. (1978) . Growth and Methanogenesis by Methanosarcina Strain
227 on Acetate and Methanol. Applied and Environmental Microbiology 36(6), 870–879
Snoeyink, V. L. and Jenkins, D. (1980) . Water chemistry. Wiley. New York
Soli, A. L. and Byrne, R. H. (2002) . CO2 system hydration and dehydration kinetics and the
equilibrium CO2/H2CO3 ratio in aqueous NaCl solution. Marine Chemistry 78(2-3), 65–73
Song, B., Kerkhof, L. J., and Haggblom, M. M. (2002) . Characterization of bacterial consortia
capable of degrading 4-chlorobenzoate and 4-bromobenzoate under denitrifying conditions.
FEMS Microbiology Letters 213(2), 183–188
Song, H., Clarke, W. P., and Blackall, L. L. (2005) . Concurrent microscopic observations and ac-
tivity measurements of cellulose hydrolyzing and methanogenic populations during the batch
anaerobic digestion of crystalline cellulose. Biotechnology and Bioengineering 91(3), 369–
378
Soto, M., Mendez, R., and Lema, J. M. (1993) . Sodium Inhibition and Sulfate Reduction in the
Anaerobic Treatment of Mussel Processing Wastewaters. Journal of Chemical Technology
and Biotechnology 58(1), 1–7
Spaccini, R. and Piccolo, A. (2009) . Molecular characteristics of humic acids extracted from
compost at increasing maturity stages. Soil Biology and Biochemistry 41(6), 1164–1172
Speece, R. E. (1996) . Anaerobic Biotechnology for Industrial Wastewaters. Archae Press.
Nashville, Tennessee, USA
Spivack, J., Leib, T. K., and Lobos, J. H. (1994) . Novel Pathway for Bacterial Metabolism of
Bisphenol-a - Rearrangements and Stilbene Cleavage in Bisphenol-a Metabolism. Journal of
Biological Chemistry 269(10), 7323–7329
Stephen, J. R., Kowalchuk, G. A., Bruns, M. A. V., McCaig, A. E., Phillips, C. J., Embley, T. M.,
and Prosser, J. I. (1998) . Analysis of beta-subgroup proteobacterial ammonia oxidizer pop-325

Chapter BIBLIOGRAPHY
ulations in soil by denaturing gradient gel electrophoresis analysis and hierarchical phyloge-
netic probing. Applied and Environmental Microbiology 64(8), 2958–2965
Stephenson, R. J. and Duff, S. J. B. (1996) . Coagulation and precipitation of a mechanical
pulping effluent. 1. Removal of carbon, colour and turbidity. Water Research 30(4), 781–792
Stephenson, T., Judd, S., Jefferson, B., and Brindle, K. (2000) . Membrane bioreactors for
wastewater treatment. IWA publishing. London
Stevenson, F. J. (1982) . Humus chemistry. Genesis, composition, reactions. John Wiley and
Sons
Stratful, I., Scrimshaw, M. D., and Lester, J. N. (2001) . Conditions influencing the precipitation
of magnesium ammonium phosphate. Water Research 35(17), 4191–4199
Strous, M., Heijnen, J. J., Kuenen, J. G., and Jetten, M. S. M. (1998) . The sequencing batch
reactor as a powerful tool for the study of slowly growing anaerobic ammonium-oxidizing
microorganisms. Applied Microbiology and Biotechnology 50(5), 589–596
Stumm, W. and Morgan, J. J. (1970) . Aquatic chemistry. Wiley-Interscience. New York
Suske, W. A., van Berkel, W. J. H., and Kohler, H.-P. E. (1999) . Catalytic Mechanism of 2-
Hydroxybiphenyl 3-Monooxygenase, a Flavoprotein from Pseudomonas azelaica HBP1. J.
Biol. Chem. 274(47), 33355–33365
Sutter, K. and Wellinger, A. (1985) . Methane production from cow manure at low temperatures.
Technical Report CH-4010. Basel, Switzerland
Switzenbaum, M. E., Pincince, A. B., Ddonovan, J., Epstein, E., and Farrell, J. B. (2002) . De-
veloping protocols for measuring biosolids stability. WERF. Alexandria, VA, USA
Tanaka, H. and Dunn, I. J. (1982) . Kinetics of Biofilm Nitrification. Biotechnology and Bioengi-
neering 24(3), 669–689
Tatsi, A. A., Zouboulis, A. I., Matis, K. A., and Samaras, P. (2003) . Coagulation-flocculation
pretreatment of sanitary landfill leachates. Chemosphere 53(7), 737–744
Tekere, M., Read, J. S., and Mattiasson, B. (2005) . Polycyclic aromatic hydrocarbon biodegra-
dation in extracellular fluids and static batch cultures of selected sub-tropical white rot fungi.
Journal of Biotechnology 115(4), 367–377
Terada, A., Hibiya, K., Nagai, J., Tsuneda, S., and Hirata, A. (2003) . Nitrogen removal character-
istics and biofilm analysis of a membrane-aerated biofilm reactor applicable to high-strength
nitrogenous wastewater treatment. Journal of Bioscience and Bioengineering 95(2), 170–178
Tian, S., Lishman, L., and Murphy, K. L. (1994) . Investigations into excess activated sludge
accumulation at low temperatures. Water Research 28(3), 501–509
Timberlake, D. L., Strand, S. E., and Williamson, K. J. (1988) . Combined aerobic heterotrophic
oxidation, nitrification and denitrification in a permeable-support biofilm. Water Research
22(12), 1513–1517
Tong, X. G., Smith, L. H., and McCarty, P. L. (1990) . Methane Fermentation of Selected Ligno-
cellulosic Materials. Biomass 21(4), 239–255
Tortella, G. R., Diez, M. C., and Duran, N. (2005) . Fungal diversity and use in decomposition of
environmental pollutants. Critical Reviews in Microbiology 31(4), 197–212
Traore, A. S., Fardeau, M. L., Hatchikian, C. E., Legall, J., and Belaich, J. P. (1983) . Energetics
of Growth of a Defined Mixed Culture of Desulfovibrio vulgaris and Methanosarcina barkeri -326

Chapter BIBLIOGRAPHY
Interspecies Hydrogen Transfer in Batch and Continuous Cultures. Applied and Environmen-
tal Microbiology 46(5), 1152–1156
Traverso, P. G., Pavan, P., Bolzonella, D., Innocenti, L., Cecchi, F., and Mata-Alvarez, J. (2000) .
Acidogenic fermentation of source separated mixtures of vegetables and fruits wasted from
supermarkets. Biodegradation 11, 407
Trebouet, D., Schlumpf, J. P., Jaouen, P., and Quemeneur, F. (2001) . Stabilized landfill leachate
treatment by combined physicochemical-nanofiltration processes. Water Research 35(12),
2935–2942
Trosch, W. and Niemann, V. (1999) . Biological waste treatment using the thermophilic
Schwarting-Uhde process. In: J. Mata-Alvarez, A. Tilche, and F. Cecchi (eds.), II Int. Symp.
on Anaerobic Digestion of Solid Waste. Vol. 2. pp 338–341. Barcelona
Tsai, H. H., Ravindran, V., and Pirbazari, M. (2005) . Model for predicting the performance of
membrane bioadsorber reactor process in water treatment applications. Chemical Engineer-
ing Science 60(20), 5620–5636
Uchida, M., Hatayoshi, H., Syuku-nobe, A., Shimoyama, T., Nakayama, T., Okuwaki, A., Nishino,
T., and Hemmi, H. (2008) . Polymerase chain reaction-denaturing gradient gel electrophoresis
analysis of microbial community structure in landfill leachate. Journal of Hazardous Materials
164(2-3), 1503–1508
Uemura, S. and Harada, H. (2000) . Treatment of sewage by a UASB reactor under moderate to
low temperature conditions. Bioresource Technology 72(3), 275–282
Uloth, V. C. and Mavinic, D. S. (1977) . Aerobic Bio-Treatment of a High-Strength Leachate.
Journal of the Environmental Engineering Division-Asce 103(4), 647–661
Urbain, V., Block, J. C., and Manem, J. (1993) . Bioflocculation in Activated-Sludge - an Analytic
Approach. Water Research 27(5), 829–838
Van de Graaf, A. A., de Bruijn, P., Robertson, L. A., Jetten, M. S. M., and Kuenen, J. G. (1996)
. Autotrophic growth of anaerobic ammonium-oxidizing micro-organisms in a fluidized bed
reactor. Microbiology 142, 2187–2196
Van Den Doole, H. and Kratz, P. (1963) . A generalization of the retention index system including
linear temperature programmed gas-liquid partition chromatography. J. Chromatography 11,
463–471
van Dongen, U., Jetten, M. S. M., and van Loosdrecht, M. C. M. (2001) . The SHARON-
Anammox process for treatment of ammonium rich wastewater. Water Science and Tech-
nology 44(1), 153–160
Van Lier, J. B., Martin, J. L. S., and Lettinga, G. (1996) . Effect of temperature on the anaer-
obic thermophilic conversion of volatile fatty acids by dispersed and granular sludge. Water
Research 30(1), 199–207
Van Lith, Y., Warthmann, R., Vasconcelos, C., and McKenzie, J. A. (2003) . Microbial fossilization
in carbonate sediments: a result of the bacterial surface involvement in dolomite precipitation.
Sedimentology 50(2), 237–245
van Rijn, J. and Rivera, G. (1990) . Aerobic and anaerobic biofiltration in an aquaculture unit-
Nitrite accumulation as a result of nitrification and denitrification. Aquacultural Engineering
9(4), 217–234327

Chapter BIBLIOGRAPHY
Van Zyl, P. J., Wentzel, M. C., Ekama, G. A., and Riedel, K. J. (2007) . Design and start-up of a
high rate anaerobic membrane bio-reactor for the treatment of a low pH, high strength, dis-
solved organic waste water. In: 11th IWA World Congress on Anaerobic Digestion. Brisbane,
Australia
Vandenberg, L., Patel, G. B., Clark, D. S., and Lentz, C. P. (1976) . Factors Affecting Rate of
Methane Formation from Acetic-Acid by Enriched Methanogenic Cultures. Canadian Journal
of Microbiology 22(9), 1312–1319
Vanderlast, A. R. M. and Lettinga, G. (1992) . Anaerobic Treatment of Domestic Sewage un-
der Moderate Climatic (Dutch) Conditions Using Upflow Reactors at Increased Superficial
Velocities. Water Science and Technology 25(7), 167–178
Vandevivere, P., De Baere, L., and Verstraete, W. (2003) . Types of anaerobic digesters for solid
wastes. In: J. Mata-Alvarez (ed.), biomethanization of the Organic Fraction of Municipal Solid
Wastes. pp 111–140. IWA publishing. London
Vavilin, V. A. and Angelidaki, I. (2005) . Anaerobic degradation of solid material: Importance of
initiation centers for methanogenesis, mixing intensity, and 2D distributed model. Biotechnol-
ogy and Bioengineering 89(1), 113–122
Vavilin, V. A., Lokshina, L. Y., Rytov, S. V., Kotsyurbenko, O. R., and Nozhevnikova, A. N. (2000)
. Description of two-step kinetics in methane formation during psychrophilic H2/CO2 and
mesophilic glucose conversions. Bioresource Technology 71, 195–209
Vavilin, V. A., Rytov, S. V., and Lokshina, L. Y. (1996) . A description of hydrolysis kinetics in
anaerobic degradation of particulate organic matter. Bioresource Technology 56(2-3), 229–
237
Vavilin, V. A., Rytov, S. V., and Lokshina, L. Y. (1999) . A balance between hydrolysis and
methanogenesis during the anaerobic digestion of organic matter. Microbiology 66, 712
Veeken, A. and Hamelers, B. (1999) . Effect of temperature on hydrolysis rates of selected
biowaste components. Bioresource Technology 69(3), 249–254
Verhagen, F. J. M. and Laanbroek, H. J. (1991) . Competition for Ammonium between Nitrifying
and Heterotrophic Bacteria in Dual Energy-Limited Chemostats. Applied and Environmental
Microbiology 57(11), 3255–3263
Victor (2008) . Membrane bioreactors: Ten years after. Filtration+Separation April 2008, 34–35
Vieitez, E. R. and Ghosh, S. (1999) . Biogasification of solid wastes by two-phase anaerobic
fermentation. Biomass and Bioenergy 16(5), 299–309
Vieitez, E. R., Mosquera, J., and Ghosh, S. (2000) . Kinetics of accelerated solid-state fermen-
tation of organic-rich municipal solid waste. Water Science and Technology 41(3), 231–238
Vyrides, I. and Stuckey, D. C. (2009) . Saline sewage treatment using a submerged anaerobic
membrane reactor (SAMBR): Effects of activated carbon addition and biogas-sparging time.
Water Research 43(4), 933–942
Waite, T. D., Schafer, A. I., Fane, A. G., and Heuer, A. (1999) . Colloidal Fouling of Ultrafiltra-
tion Membranes: Impact of Aggregate Structure and Size. Journal of Colloid and Interface
Science 212(2), 264–274
Walker, M., Banks, C. J., and Heaven, S. (2009) . Development of a coarse membrane bioreactor
for two-stage anaerobic digestion of biodegradable municipal solid waste. Water Science and328
Chapter BIBLIOGRAPHY
Technology 59(4), 729–735
Wallace, P., Cooper, B., Evans, T., Hollingworth, L., and Nichols, E. (2005) . Assessment of
options and requirements for stability and maturity testing of composts. Technical report.
WRAP (The Waste and Resources Action Programme)
Wallrabenstein, C., Hauschild, E., and Schink, B. (1995) . Syntrophobacter pfennigii spec. nov.,
a new syntrophically propionate-oxidizing anaerobe growing in pure culture with propionate
and sulfate. Arch Microbiol 164, 346–352
Wang, F., Xia, S.-q., Liu, Y., Chen, X.-s., and Zhang, J. (2007) . Community analysis of ammonia
and nitrite oxidizers in start-up of aerobic granular sludge reactor. Journal of Environmental
Sciences 19(8), 996–1002
Wang, F. Q., Smith, D. W., and El-Din, M. G. (2006a) . Aged raw landfill leachate: Membrane
fractionation, O3 only and O3/H2O2 oxidation, and molecular size distribution analysis. Water
Research 40(3), 463–474
Wang, G. and Wang, D. I. C. (1984) . Elucidation of Growth-Inhibition and Acetic Acid Production
by Clostridium thermoaceticum. Applied and Environmental Microbiology 47(2), 294–298
Wang, J., Shen, D., and Xu, Y. (2006b) . Effect of acidification percentage and volatile organic
acids on the anaerobic biological process in simulated landfill bioreactors. Process Biochem-
istry 41(7), 1677–1681
Wang, P., Changa, C. M., Watson, M. E., Dick, W. A., Chen, Y., and Hoitink, H. A. J. (2004) .
Maturity indices for composted dairy and pig manures. Soil Biology and Biochemistry 36(5),
767–776
Wang, Y. S., Byrd, C. S., and Barlaz, M. A. (1994) . Anaerobic Biodegradability of Cellulose and
Hemicellulose in Excavated Refuse Samples Using a Biochemical Methane Potential Assay.
Journal of Industrial Microbiology 13(3), 147–153
Weast, R. C. (1963) . Handbook of chemistry and physics : a ready-reference book of chemical
and physical data. CRC Press. Cleveland, Ohio. 44th edition
Weiland, P. (1992) . One- and two-step anaerobic digestion of solid agroindustrial residues. In:
F. Cecchi, J. Mata-Alvarez, and F. G. Pohland (eds.), International Symposium on anaerobic
digestion of solid waste. Venice, Italy
Wellinger, A. and Kaufmann, R. (1982) . Psychrophilic Methane Generation from Pig Manure.
Process Biochemistry 17(5), 26–30
Wellinger, A., Widmer, C., and Schalk, P. (1999) . Percolation - a new process to treat MSW.
In: J. Mata-Alvarez, A. Tilche, and F. Cecchi (eds.), Second International Symposium on
Anaerobic Digestion of Solid Wastes. Vol. 1. pp 15–322. Grafiques 92. Barcelona
Wellinger, A., Wyder, K., and Metzler, A. (1992) . Kompogas - A new system for the anaerobic
treatment of source separated waste. In: F. Cecchi, J. Mata-Alvarez, and F. G. Pohland (eds.),
International Symposium on Anaerobic Digestion of Solid Waste. Venice, Italy
Westerhoff, P., Yoon, Y., Snyder, S., and Wert, E. (2005) . Fate of endocrine-disruptor, phar-
maceutical, and personal care product chemicals during simulated drinking water treatment
processes. Environmental Science and Technology 39(17), 6649–6663
Wett, B. and Rauch, W. (2003) . The role of inorganic carbon limitation in biological nitrogen
removal of extremely ammonia concentrated wastewater. Water Research 37(5), 1100–1110329

Chapter BIBLIOGRAPHY
White, T. J., Bruns, T., Lee, S., and Taylor, J. (1990) . Amplification and direct sequencing of
fungal ribosomal RNA genes for phylogenetics. In: M. A. Innis, D. H. Gelfand, J. J. Sninsky,
and T. J. White (eds.), PCR Protocols: A Guide to Methods and Applications. pp 315–322.
Academic Press. New York
Wiegant, W. M. and Zeeman, G. (1986) . The mechanism of ammonia inhibition in the ther-
mophilic digestion of livestock wastes. Agricultural Wastes 16(4), 243–253
Wiesmann, U. (1994) . Biological nitrogen removal from waste water. Adv. Biochem. Eng. 51,
113–154
Willems, A. (1991) . Comamonadaceae, a new family encompassing the Acidovorans ribosomal
RNA complex, including variovorax paradoxus gen. nov., comb. nov., for Alcaligenes para-
doxus. International journal of systematic bacteriology 41(3), 445–450
Wintgens, T., Gallenkernper, M., and Melin, T. (2004) . Removal of endocrine disrupting com-
pounds with membrane processes in wastewater treatment and reuse. Water Science and
Technology 50(5), 1–8
Wirsel, S. G. R., Leibinger, W., Ernst, M., and Mendgen, K. (2001) . Genetic diversity of fungi
closely associated with common reed. New Phytologist 149(3), 589–598
Wittebolle, L., Vervaeren, H., Verstraete, W., and Boon, N. (2008) . Quantifying community
dynamics of nitrifiers in functionally stable reactors. Applied and Environmental Microbiology
74(1), 286–293
WRAP (2005) . Specification for composted materials (PAS 100:2005). Technical report.
[Online]. Available from: http://www.wrap.org.uk/downloads/Introduction to BSI PAS 100-
20052.b110c50a.2181.pdf
Wright, D. T. and Oren, A. (2005) . Nonphotosynthetic Bacteria and the Formation of Carbonates
and Evaporites Through Time. Geomicrobiology Journal 22(1), 27 – 53
Wright, D. T. and Wacey, D. (2005) . Precipitation of dolomite using sulphate-reducing bacteria
from the Coorong Region, South Australia: significance and implications. Sedimentology
52(5), 987–1008
Wujcik, W. J. and Jewell, W. J. (1979) . Dry Anaerobic Fermentation. In: 2nd Symposium on
Biotechnology in Energy Production and Conservation. Gatlinburg, USA
Xiao, W. and Clarkson, W. W. (1997) . Acid solubilization of lignin and bioconversion of treated
newsprint to methane. Biodegradation 8, 61–66
Xu, Y., Zhou, Y., Wang, D., Chen, S., Liu, J., and Wang, Z. (2008) . Occurrence and removal of or-
ganic micropollutants in the treatment of landfill leachate by combined anaerobic-membrane
bioreactor technology. Journal of Environmental Sciences 20(11), 1281–1287
Xue, Y., Yang, F. L., Liu, S. T., and Fu, Z. M. (2009) . The influence of controlling factors
on the start-up and operation for partial nitrification in membrane bioreactor. Bioresource
Technology 100(3), 1055–1060
Yadvika, S., Sreekrishnan, T. R., Kohli, S., and Rana, V. (2004) . Enhancement of biogas pro-
duction from solid substrates using different techniques–a review. Bioresource Technology
95(1), 1–10
Yamagiwa, K., Yoshida, M., Ito, A., and Ohkawa, A. (1998) . A new oxygen supply method for
simultaneous organic carbon removal and nitrification by a one-stage biofilm process. Water330
Chapter BIBLIOGRAPHY
Science and Technology 37(4-5), 117–124
Yamamoto, K., Hiasa, M., Mahmood, T., and Matsuo, T. (1989) . Direct Solid-Liquid Separation
Using Hollow Fiber Membrane in an Activated-Sludge Aeration Tank. Water Science and
Technology 21(4-5), 43–54
Yamamoto, T., Yasuhara, A., Shiraishi, H., and Nakasugi, O. (2001) . Bisphenol A in hazardous
waste landfill leachates. Chemosphere 42(4), 415–418
Yan, M., Wang, D., Qu, J., He, W., and Chow, C. W. K. (2007) . Relative importance of hydrolyzed
Al(III) species (Ala, Alb, and Alc) during coagulation with polyaluminum chloride: A case study
with the typical micro-polluted source waters. Journal of Colloid and Interface Science 316(2),
482–489
Yasuhara, A., Shiraishi, H., Nishikawa, M., Yamamoto, T., and Nakasugi, O. (1999) . Organic
components in leachates from hazardous waste disposal sites. Waste management and
research 17(3), 186
Yu, H. Q. and Fang, H. H. P. (2003) . Acidogenesis of gelatin-rich wastewater in an upflow
anaerobic reactor: influence of pH and temperature. Water Research 37(1), 55–66
Zayen, A., Aloui, F., Fki, F., Loukil, S., Bouaziz, M., Mnif, S., and Sayadi, S. (2008) . Anaerobic
Membrane Bioreactor for the treatment of Leachate from the landfill solid waste of Jebel
Chakir discharge in Tunisia. In: 5th International Symposium on the Anaerobic Digestion of
Solid Waste and Energy Crops. Hammamet, Tunisia
Zeeman, G. (1991) . Mesophilic and psychrophilic digestion of liquid manure. PhD Thesis.
Wageningen University, The Netherlands.
Zeeman, G. and Lettinga, G. (1999) . The role of anaerobic digestion of domestic sewage in
closing the water and nutrient cycle at community level. Water Science and Technology 39(5),
187–194
Zeeman, G., Palenzuela, A. R., Sanders, W. T. M., Miron, Y., and Lettinga, G. (1999) . Anaerobic
hydrolysis and acidification of lipids proteins and carbohydrates under methanogenic and
acidogenic conditions. In: J. Mata-Alvarez, F. Cecchi, and A. Tilche (eds.), II International
Symposium on the Anaerobic digestion of Solid Waste. pp 21–24. Barcelona, Spain
Zeeman, G., Sutter, K., Vens, T., Koster, M., and Wellinger, A. (1988) . Psychrophilic diges-
tion of dairy cattle and pig manure: Start-up procedures of batch, fed-batch and CSTR-type
digesters. Biological Wastes 26(1), 15–31
Zehnder, A. J. B. (1988) . Biology of Anaerobic Microorganisms. Wiley-Liss. New York
Zhang, B., Zhang, L. L., Zhang, S. C., Shi, H. Z., and Cai, W. M. (2005) . The influence of pH
on hydrolysis and acidogenesis of kitchen wastes in two-phase anaerobic digestion. Environ-
mental Technology 26(3), 329–339
Zhang, C. and Wang, Y. (2008) . Removal of dissolved organic matter and phthalic acid es-
ters from landfill leachate through a complexation-flocculation process. Waste Management
29(1), 110–116
Zhang, R., El-Mashad, H. M., Hartman, K., Wang, F., Liu, G., Choate, C., and Gamble, P. (2007) .
Characterization of food waste as feedstock for anaerobic digestion. Bioresource Technology
98, 929–935
Zhang, Y. and Zhou, J. L. (2005) . Removal of estrone and 17[beta]-estradiol from water by331
Chapter BIBLIOGRAPHY
adsorption. Water Research 39(16), 3991–4003
Zhao, Y., Ren, N., and Wang, A. (2008) . Contributions of fermentative acidogenic bacteria and
sulfate-reducing bacteria to lactate degradation and sulfate reduction. Chemosphere 72(2),
233–242
Zhu, L., O’Dwyer, J. P., Chang, V. S., Granda, C. B., and Holtzapple, M. T. (2007) . Structural
features affecting biomass enzymatic digestibility. Bioresource Technology 99(9), 3817–3828
Zoetemeyer, R. J., Arnoldy, P., Cohen, A., and Boelhouwer, C. (1982a) . Influence of Tempera-
ture on the Anaerobic Acidification of Glucose in a Mixed Culture Forming Part of a 2-Stage
Digestion Process. Water Research 16(3), 313–321
Zoetemeyer, R. J., van den Heuvel, J. C., and Cohen, A. (1982b) . pH influence on acidogenic
dissimilation of glucose in an anaerobic digestor. Water Research 16(3), 303–311
Zucconi, F. and de Bertoldi, M. (1987) . Compost specifications for the production and character-
ization of compost from municipal solid waste. In: M. de Bertoldi, M. P. Ferranti, P. L’Hermite,
and F. Zucconi (eds.), Compost: Production, Quality and Use. pp 30–50. Elsevier. Barking
Zucconi, F., Monaco, A., Forte, M., and de Bertoldi, M. (1985) . Phytotoxins during the stabi-
lization of organic matter. In: J. K. R. Gasser (ed.), Composting of Agricultural and Other
Wastes. pp 73–85. Elsevier Applied Science Publishers. Barking
332

Appendix A
Technical Drawings
333

Chapter A. Technical Drawings
334

Chapter A. Technical Drawings
335
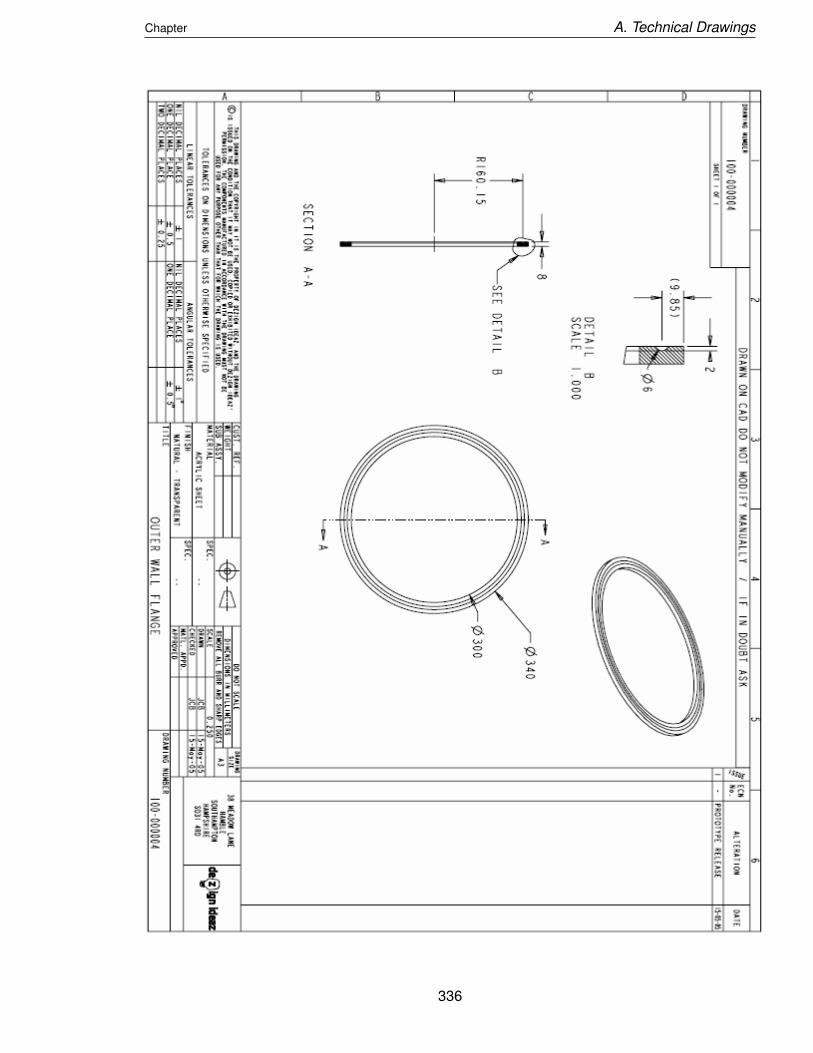
Chapter A. Technical Drawings
336

Chapter A. Technical Drawings
337

Chapter A. Technical Drawings
338

Chapter A. Technical Drawings
339

Chapter A. Technical Drawings
340

Chapter A. Technical Drawings
341

Chapter A. Technical Drawings
342

Appendix B
Measurement of gas volumes
Notation parameter UnitsV Volume m3
p Pressure PaT Temperature KelvinH Total height of column mh Height of the water in the column mA Cross-section of gasometer m2
m Mass kgρ volumetric mass kg/m3
Besides, the subscripts 1, 2, atm, stp, w and c refer to condition 1, condition 2, atmospheric,
standard conditions, water and column, respectively.
Saturated Vapour Pressure
A Pressure correction is included in these calculations to account for the vapour content of
biogas. This correction assumes that biogas acts as air does. The saturated vapour pressure
of water in air is only a function of temperature and will be referred to as pw(T ). This will be
approximated very closely by the following equation:
pw (T ) = 0.0711 (T − 273)3 − 0.2939 (T − 273)2 + 70.209 (T − 273) + 480.28 (B.1)343

Chapter B. Measurement of gas volumes
This gives saturated vapour pressure of water to within 0.2% for the range 10-40 ˚ C.
Description In this case, a column of water is located above a collection vessel. Gas bags
containing an unknown volume of gas are attached to the top of the column, and water drains
into the collection vessel as the gas enters at the top. This water is then weighed. The weight,
with measurements of the height of water in the column, can be used to calculate the volume of
gas that was in the bag.
A case where the gasometer already contains some gas is considered: conditions 1 and 2 refer
to before and after the unknown volume of gas has been introduced into the column.
Equations
Perfect Gas Law :P1V1
T1=
PstpVstp
Tstp(B.2)
Volume of gas V introduced into the column at standard conditions :
Vstp = V2,stp − V1,stp (B.3)
Pressure in gasometer (and same for condition 2):
P1 = Patm − ρwg (H − h) − Pw (Tatm) (B.4)
Relationship between heights :
h2 = h1 +Vw
A(B.5)
Volume of gas in column (and same for condition 2):
V1 =mw
ρw(B.6)
Volume of water displaced :
Vw = A · h1 +Vw
A(B.7)
Derivation
Assume:
T1 = T2 = Tatm
From Equation B.2 and the same for condition 2. Substituting into Equation B.3:
Vstp = V2,stp − V1,stp
=p2V2Tstp
Tatmpstp−
p1V1Tstp
Tatmpstp
=Tstp
Tatmpstp· (p2V2 − p1V1) (B.8)
Substituting for all unknowns in Equation B.8 from Equations B.4 and B.6:
344

Chapter B. Measurement of gas volumes
Vstp =Tstp
Tatmpstp{((patm − ρwg(H − h2)− pw(Tatm)) · (Ah2)) − ((patm − ρwg(H − h1)− pw(Tatm)) · (Ah1))}
=TstpA
Tatmpstp{((patm − ρwg(H − h2)− pw(Tatm)) · h2) − ((patm − ρwg(H − h1)− pw(Tatm)) · h1)} (B.9)
If the height at condition 1 is measured, an expression for the volume can be derived by substi-
tuting Equation B.5 and Equation B.7 into Equation B.9.
Vstp =TstpA
Tatmpstp
(
patm − pw(Tatm)− ρwg
(
H −
(
h1 +Vw
A
)))
·
(
h1 +Vw
A
)
− (patm − pw(Tatm)− ρwg(H − h1))h1 (B.10)
Values of H and A in this study were approximately 1.07 m and 0.0029 m2.
345
Recommended