1
MULTI-DISCIPLINARY ISSUES
TRANSCONTINENTAL INFRASTRUCTURE NEEDS TO 2030/2050
MUMBAI GATEWAY AREA CASE STUDY
OPPORTUNITIES AND CHALLENGES
FINAL REPORT
Contact persons:
Barrie Stevens: +33 (0)1 45 24 78 28, [email protected]
Pierre-Alain Schieb: +33 (0)1 45 24 82 70, [email protected]
Anita Gibson: +33 (0)1 45 24 96 72, [email protected]
March 2012

2
Note:
This paper contains content prepared by the OECD project team together with input on many
aspects prepared by representatives of the Overseas Infrastructure Alliance (OIA), India who were
members of the OECD project Steering Group.
A number of the reports consulted were prepared before the onset of the Global Financial
Crisis. The projections and related material from such reports needs to be reviewed for currency and
completeness and updated with more recent information where possible.

3
TABLE OF CONTENTS
CHAPTER 1 INTRODUCTION................................................................................................... 5
CHAPTER 2 OVERVIEW OF INDIAN PORTS AND KEY TRENDS IN PORT HANDLING 7
CHAPTER 3 MUMBAI GATEWAY AREA – SITUATION .................................................... 17
CHAPTER 4 HINTERLAND CONNECTIONS ........................................................................ 23
CHAPTER 5 LONGER TERM OUTLOOK AND GROWTH POTENTIAL ........................... 27
CHAPTER 6 MUMBAI AND JNPT PORTS – OPPORTUNITIES AND CHALLENGES ..... 29
CHAPTER 7 FUNDING OF PORTS IN INDIA ........................................................................ 59
CHAPTER 8 OPPORTUNITIES FOR INDIA’S MAJOR AND “NON-MAJOR” PORTS ...... 73
ANNEX A STUDY ON A MAJOR PORT – TUTICORIN ....................................................... 77
ANNEX B STUDY ON A MINOR PORT – MUNDRA PORT ................................................ 84

4

5
CHAPTER 1
INTRODUCTION
The Infrastructure Needs to 2030/2050 Project brought together experts from the public and
private sector to take stock of the long-term opportunities and challenges facing macro gateway and
corridor infrastructure (ports, airports, rail corridors, oil and gas pipelines etc.). The intention is to
propose a set of policy options to enhance the contribution of these infrastructures to economic and
social development at home and abroad in the years to come.
Case Studies were undertaken to explore current gateway situations and their outlook and provide
a solid basis for the development of policy option. This Case Study focuses in large measure on the
future opportunities and challenges facing ports in the Mumbai gateway area, which was chosen as a
principal target, following discussions with infrastructure experts in India.
The Mumbai Gateway Area encompasses the Mumbai and Jawaharlal Nehru (JPNT) Ports, the
Mumbai International Airport, the linkages from these important gateways to the City of Mumbai and
surrounding regions and their linkages via inland connections to the widely spread hinterland served
by these gateways.
Approach
Each Case Study was asked to address a common set of generic questions aimed at highlighting
the short, medium and longer-term infrastructure-related “challenges and opportunities” facing the
individual gateway ports and airports and their intermodal and inland connections.
Where funding was available, Case Studies included Workshops organised by the hosts that were
intended to generate the background information needed. They also facilitated the provision of advice
by experts on the ground and allowed in-depth discussion of the “challenges and opportunities” facing
the Gateway area.
Background information on the national context and the gateway area was important for all the
case studies and this one was no exception. Input was also needed from experts on the ground to be
able to answer the generic questions on “Challenges and Opportunities”.
The Mumbai Gateway Area Case Study was undertaken “offline” with the assistance of
exchanges between the OECD International Futures Programme (IFP) project team, the Overseas
Infrastructure Alliance (OIA) working group and through them a number of organisations and experts
in India.
The OECD IFP project team first drafted the Case Study papers and concentrated on the Mumbai
Gateway Area ports and their inland connections. OIA representatives of the Steering Group sought
out and provided updates on the Mumbai ports and also assembled and provided material on several
private sector ports, principally on the west coast

6
The Opportunities and Challenges paper includes responses to the Generic list of Questions on
“Challenges and Opportunities” prepared by the OECD project team, taking into account material in
the published reports consulted and with the assistance of inputs provided by the OIA Working Group.
Structure of the Case Study Report
The general structure of the report is as follows:
Chapter 2: provides a short Overview of Indian ports and port handling.
Chapter 3: covers the Mumbai Gateway area and its situation.
Chapter 4: deals with Hinterland connections
Chapter 5: provides advice on the longer term outlook for ports and their growth potential.
Chapter 6: Opportunities and challenges facing the Mumbai Gateway Area
Chapter 7: Funding ports in India
Chapter 8: Opportunities for India’s Major and Non-Major Ports
The material presented is mostly drawn from authoritative sources, such as the websites of the
different INDIAN Transport Ministries, the Infrastructure website of the Indian Planning Commission
and important transport sector documentation such as India’s National Transport Development Plan
(Port Sector) and research reports of rating agencies (ICRA, the Indian affiliate of Moody’s and
CRISIL, the Indian affiliate of S & P).
Background Document
A separate Background Document has also been prepared with the assistance of material
provided by the Overseas Infrastructure Alliance (OIA) India, providing broader insights for Indian
growth and transport demand.

7
CHAPTER 2
OVERVIEW OF INDIAN PORTS AND KEY TRENDS IN PORT HANDLING
Overview of Indian Ports
India is naturally endowed with a long coastline spanning 7 517 km.
The ports sector in India is divided into “Major Ports” and “Non-Major Ports” (minor) ports
which are under the jurisdiction of Central Government and State Governments respectively. The legal
framework governing the sector comprises the Indian Ports Act of 1908 and the Major Port Trusts Act
of 1963.
Major Ports which under Central jurisdiction are governed by policy and directives of the
Ministry of Shipping of the Government of India.
Minor Ports are under the State Governments’ jurisdiction and are governed by policy and
directives of respective State Governments’ nodal departments/agencies.
India has 12 major ports (the thirteenth one has been announced to be in Port Blair, Andaman &
Nicobar Islands, Indian Ocean) and around 200 non-major ports (including minor, intermediate and
captive ports) are located across nine maritime States. Of the non-major ports, around 66 are partly or
fully operational and these are mainly in the States of Gujarat, Andhra Pradesh, Goa, and Maharashtra.
Most of the major ports (except Ennore, which is a corporation owned by the Government of
India and Chennai Port Trust) are trusts while the minor ports are corporate entities, generally special
purpose vehicles (SPVs).
A map showing the Maritime States of India, the major Ports and a number of the other Ports of
India is set out below:

8
Figure 2.1. Map of maritime states and ports of India
Key trends and outlook
Past trends in cargo growth – robust except in 2008-09
According to the Report of the Ministry of Shipping, released in December 2010, the capacity of
major ports has increased from 574.77 million tonnes as on 31 March, 2009 to 616.73 million tonnes
as on 31 March, 2010. During the year 2009-2010, 13 PPP projects were awarded at the major ports
envisaging an amount of Rs. 2653.77 billion and a capacity of 65.65 MTPA. In addition, six PPP
projects have so far been awarded in the current financial year, since April till December 2010.
The year also saw the trend of non-major ports getting closer to major ports in capacities and
cargo handling. The Mundra Port in Gujarat has recently commissioned three berths having a
combined 60 million tonnes capacity (or 100 000 tonnes per day) for coal handling. As the country’s
shipping tonnage crossed the ten million GT mark, the demand on capacities of ports is likely to
increase further with economic growth.
A major development during the year, which will boost coastal shipping, is the implementation of
River-Sea Regulation. The Coastal Shipping Policy is under preparation by the Shipping Directorate
of the Ministry. The Policy will lay rules on cabotage and first right of refusal and implement various
recommendations.
9
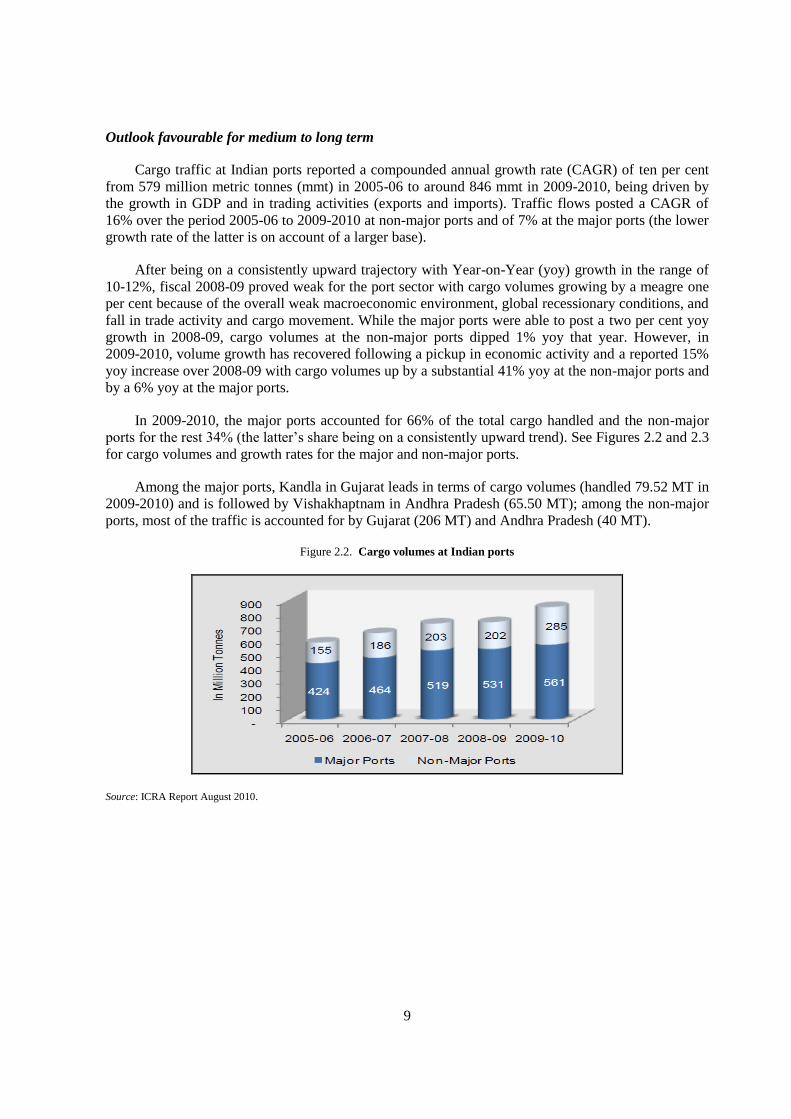
Outlook favourable for medium to long term
Cargo traffic at Indian ports reported a compounded annual growth rate (CAGR) of ten per cent
from 579 million metric tonnes (mmt) in 2005-06 to around 846 mmt in 2009-2010, being driven by
the growth in GDP and in trading activities (exports and imports). Traffic flows posted a CAGR of
16% over the period 2005-06 to 2009-2010 at non-major ports and of 7% at the major ports (the lower
growth rate of the latter is on account of a larger base).
After being on a consistently upward trajectory with Year-on-Year (yoy) growth in the range of
10-12%, fiscal 2008-09 proved weak for the port sector with cargo volumes growing by a meagre one
per cent because of the overall weak macroeconomic environment, global recessionary conditions, and
fall in trade activity and cargo movement. While the major ports were able to post a two per cent yoy
growth in 2008-09, cargo volumes at the non-major ports dipped 1% yoy that year. However, in
2009-2010, volume growth has recovered following a pickup in economic activity and a reported 15%
yoy increase over 2008-09 with cargo volumes up by a substantial 41% yoy at the non-major ports and
by a 6% yoy at the major ports.
In 2009-2010, the major ports accounted for 66% of the total cargo handled and the non-major
ports for the rest 34% (the latter’s share being on a consistently upward trend). See Figures 2.2 and 2.3
for cargo volumes and growth rates for the major and non-major ports.
Among the major ports, Kandla in Gujarat leads in terms of cargo volumes (handled 79.52 MT in
2009-2010) and is followed by Vishakhaptnam in Andhra Pradesh (65.50 MT); among the non-major
ports, most of the traffic is accounted for by Gujarat (206 MT) and Andhra Pradesh (40 MT).
Figure 2.2. Cargo volumes at Indian ports
Source: ICRA Report August 2010.

10
Figure 2.3. Cargo growth rate
Source: ICRA Report August 2010.
In terms of cargo composition, India’s basket over the years has diversified from the traditional
crude oil and iron ore to other cargo categories including coal, petroleum, oil and lubricants (POL),
and containers. In 2009-2010, of the total traffic handled at the major ports, POL accounted for the
most at 31%, followed by containers (18%); iron ore (18%), and coal (13%), as Figure 2.4 shows.
Figure 2.4. Cargo profile at major ports 2009-2010
Source: ICRA report August 2010.
Going forward, cargo growth is expected to continue on an upward trajectory over the medium to
long term, given the ongoing and proposed investments in the key user segments.

11
The cargos that are expected to drive growth
The cargos that are expected to drive the growth are (i) coal; (ii) containers; (iii) crude oil and
POL; (iv) fertilisers; and (v) steel products. The volume of iron ore, which is one of the major export
items at present, would continue to be a function of policy. Any restriction or ban on iron ore fines or
lumps (e.g. the state government of Karnataka put a ban this year), could impact ports and terminals,
where the share of iron ore cargo is high in the overall cargo mix. Traffic related to offshore
exploration and production activities and emerging trends of coastal shipping (for petroleum products
and dry bulk cargo) would be other revenue contributors for ports. Details are mentioned below:
Cargos driving future growth
i. Coal: Thermal coal imports in the country are expected to increase significantly in quantum, in light of the large
number of ongoing and proposed power projects including the likes of TATA Ultra Mega Power Project (UMPP,
i.e. super-critical projects having a capacity of 4 000 MW or more), Adani Power Limited’s Mundra and other projects;
Krishnapatnam UMPP and ventures proposed by JSW Energy Limited; Andhra Pradesh Power Generation Corporation
Limited; Tamil Nadu Electricity Board, amongst others. Besides, coking coal imports by a number of operating and
proposed steel plants would be another significant cargo contributor.
ii. Containers: The current under-penetration of containerisation in the Indian market vis-à-vis global standards reflects
the high potential for container cargo. Due to cost advantages and increasing trend of trans-shipment, the growth of
container traffic in India will be robust over the medium to longer term.
iii. Crude oil and POL: With a number of greenfield refineries in project stage and brownfield expansions being
implemented at existing refineries, the import of crude oil and export of surplus petroleum products are expected to be
major contributors to overall cargo volumes.
iv. Fertilisers: In light of the declining self sufficiency caused by stagnant production and increasing demand, import of
both finished product and fertiliser raw materials in the country is expected to remain high over the medium term.
v. Steel products: A number of mega steel projects have been proposed in the eastern part of the country and, once
commissioned, export of steel products is expected to emerge as a significant incremental cargo.
According to the projections on cargo in the Eleventh Five-Year Plan (2007-2012), India’s port
traffic would cross the 1 000 mmt mark with share of major ports around 739 mmt (refer Figure 2.4)
by 2011-12 which, considering the recovery trend in cargo growth in 2009-2010, appears plausible.
Throughput per port
Port throughput projections prepared for the Co-ordination of Business Plans Report 2007 are set
out below in Table 2.1 below.

12
Table 2.1. Projected cargo throughput at major ports
(Million Tonnes)
2011-2012 2025-2026
Kandla 98.13 204.51 Mumbai 76.13 128.61 JNPT 88.77 305.99 Mormugoa 52.25 78.30 New Mangalore 52.17 84.14 Cochin 24.63 53.49 Tuticorin 30.80 71.80 Chennai 64.17 87.11 Ennore 40.64 136.40 Visakhapatnam 81.70 146.80 Paradip 71.55 125.60 Kolkata 58.47 172.32
739.41 1 595.07
Source: Co-ordination of Business Plans Major Ports of India Volume 2, 2007.
As per the projections in the Table 2.1 above, it can be noted that most Eastern and Western ports
show high throughputs, due to their vicinity to the large hinterland in the North. The Southern ports
have a smaller hinterland, but they are located close to the main international shipping routes, which
could be an opportunity for the future. Compared to the National Maritime Development Plan 2006
forecast, CRISIL (2007 forecasts) predicted a port throughput which on average was 18% higher.
NOTE:
The forecasts of economic growth (e.g. growth in GDP), traffic growth (e.g. cargo volumes), infrastructure adequacy and
infrastructure needs set out in the Background paper were mostly prepared before the onset of the global financial crisis. The
economic and traffic growth estimates are, therefore, likely to be too high, in the short term at least.
The different dates at which the traffic volumes set out above may be reached are not likely to affect expectations concerning
the composition of the cargo. Given the rapid increases projected in container traffic which is expected to increase more than
other categories in aggregate, it was decided that the Mumbai Gateway Case Study would focus primarily on container
traffic, which is expected to present the greatest challenges and opportunities.
Figure 2.5 shows the growth expected in the container trade at Major ports in India. Figure 2.6
shows the container traffic growth at all Indian Ports including the minor ports.

13
Figure 2.5. Container traffic forecasts for all Indian ports
Source: CRISIL Report June 2010 on Container Ports in India.
Figure 2.6. Container traffic forecasts major ports
Source: CRISIL Report June 2010 on Container Ports in India.
With respect to the container market, there were advisory observations made by Rotterdam Port
Advisers in 2007, which are as follows
Limited capacity for container handling at all major ports.
The upcoming private ports may solve the capacity problem, although it should be
mentioned that not one of them is capable of handling several millions of TEUs in the near
future. Nevertheless, it may be expected that they will be the fastest within the country to
create capacity. Private participation is a noticeable option.
Investigate the possibility of developing container handling on east coast of India including
the southern part.
14
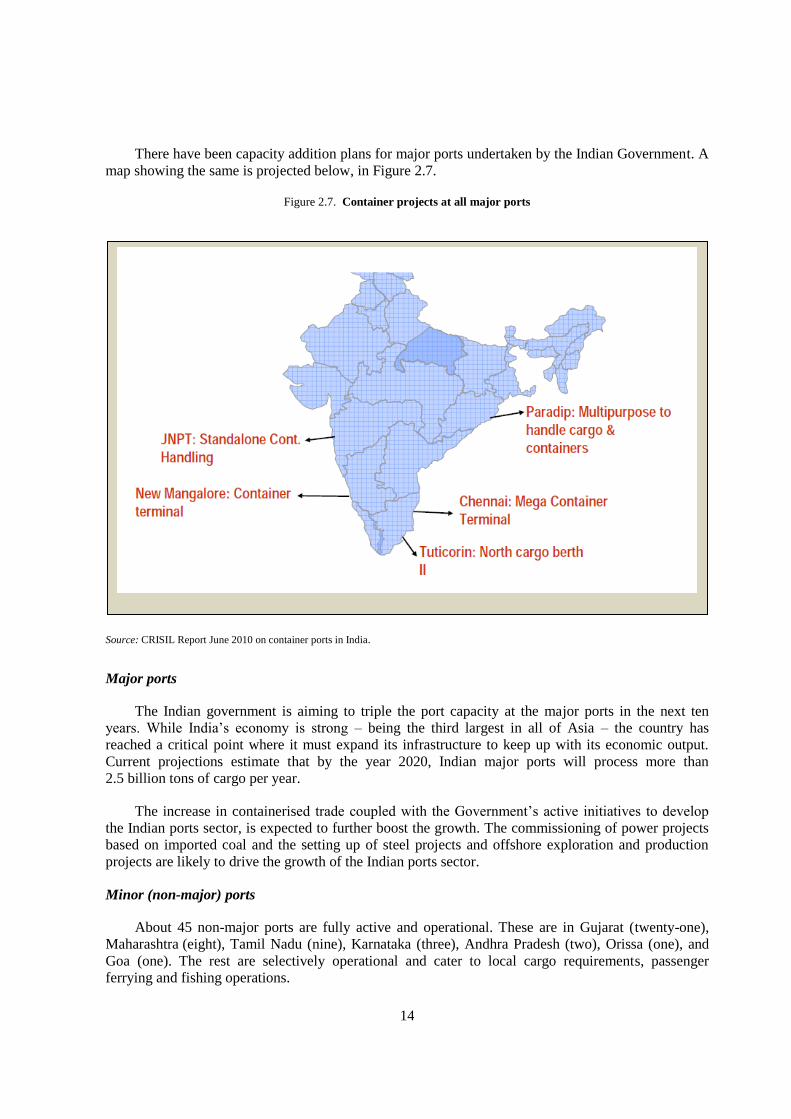
There have been capacity addition plans for major ports undertaken by the Indian Government. A
map showing the same is projected below, in Figure 2.7.
Figure 2.7. Container projects at all major ports
Source: CRISIL Report June 2010 on container ports in India.
Major ports
The Indian government is aiming to triple the port capacity at the major ports in the next ten
years. While India’s economy is strong – being the third largest in all of Asia – the country has
reached a critical point where it must expand its infrastructure to keep up with its economic output.
Current projections estimate that by the year 2020, Indian major ports will process more than
2.5 billion tons of cargo per year.
The increase in containerised trade coupled with the Government’s active initiatives to develop
the Indian ports sector, is expected to further boost the growth. The commissioning of power projects
based on imported coal and the setting up of steel projects and offshore exploration and production
projects are likely to drive the growth of the Indian ports sector.
Minor (non-major) ports
About 45 non-major ports are fully active and operational. These are in Gujarat (twenty-one),
Maharashtra (eight), Tamil Nadu (nine), Karnataka (three), Andhra Pradesh (two), Orissa (one), and
Goa (one). The rest are selectively operational and cater to local cargo requirements, passenger
ferrying and fishing operations.

15
A few of the non-major ports have been developed as relatively large ports (Mundra and Pipavav)
through private sector participation and attract a fair amount of cargo. These are comparatively newer
ports with modern facilities and smaller, better-trained workforces, and thus score high on efficiency
parameters.
There is an increased emphasis on development of Minor ports by state government authorities
through private participation. (Source: Indian Ports Association.)

16

17
CHAPTER 3
MUMBAI GATEWAY AREA – SITUATION
Mumbai Gateway Area
The Case Study Gateway area encompasses the different gateway port locations as well as the
principal inland routes and connections from these facilities.
Mumbai Gateway – Overview
This overview of the Mumbai Gateway outlines various aspects of Mumbai and JNPT ports
including their: historical context; current environment; competition; growth and development;
expectations/level of ambition, etc. Advice on the current structure and governance of the gateway
operations and relations with key stakeholders and the local community is also provided.
Mumbai Port
Historical context
Mumbai Port has a unique niche for itself in Indian commercial history. The port has completed
135 years of operations. For decades, Mumbai Port remained India's premier port. Even today, with
the development of other ports in the neighbourhood, it caters to about 11% of the total sea borne
handled by Major Ports of the country in terms of volume. It handles about 20% of POL traffic and
21% of General traffic handled by the Major Ports of India.
Geographic setting
The Port of Mumbai has long been the principal gateway of India. It lies midway on the west
coast of India, with a natural deep-water harbour covering 400 km2 protected by the mainland of
Konkan on its east and island of Mumbai on its west. The deep waters in the harbour provide secure
and ample shelter for shipping throughout the year.
Structure
The Port of Mumbai is administered by a statutory autonomous corporation known as the
Mumbai Port Trust. The Chairman, Deputy Chairman and 19 other Trustees, representing various
interests connected with Port activities such as Shippers, Labour, State Government, Railways, etc.,
constitute the Board which has overall supervision of the Port. The day-to-day administration,
however, is carried out by the Departments headed by professionals under the supervision and control
of the Chairman.
Jawaharlal Nehru Port (JNPT)
JNPT enjoys the locational advantage of being on the West Coast of India, a quay length of
2 000 metres for container handling (the operational three terminals put together), state-of-the-art
infrastructure at the terminals, adequate draft, backup area and other support services, speedy customs
18
clearance and importantly, excellent road and rail connectivity to the country’s major cargo generating
hinterlands. JNPT was set up in May 1989. It has emerged as the premier container handling port in
Southern Asia region handling 4.06 million TEUs during the year 2009-2010 and ranked in the top 30
of the world community of container handling ports.
Geographic setting
The JNPT is located midway on the West coast of India, close to the Mumbai Port. It is better in
terms of draft limitation than the Mumbai Port, due to which large container liners call at the port
throughout the year. The majority of the container transshipments to the Indian subcontinent are
routed through the JNPT.
Overall
For the port users, the three most important factors in choice of a port are location, efficiency and
infrastructure. In assessments reported in 2007, JNPT emerged as the best port, with Mumbai and
Mundra perceived to be the next best ports. JNPT was rated highly in terms of port efficiency,
infrastructure and hinterland connectivity. JNPT emerged as the main facilitator of India’s
international trade as it focussed on container traffic very early at a time when containerisation was at
a nascent stage in India.
JNPT was the first Major Port of India to leverage the benefits of Public Private Partnership
(PPP) in the Port Sector by commissioning the first private terminal, viz. Nhava Sheva International
Container Terminal (NSICT) (DP World) in the year 1999 and subsequently, another private terminal,
viz. M/s. Gateway Terminals India Private Ltd. (GTIPL) (Consortium of AP Moller Co & CONCOR,
the container corporation owned by Indian Railways) in the year 2006.
Mumbai Gateway – operational situation
A short description of the Gateway operational situation is provided below, highlighting matters
of direct interest, including: the nature of services provided; the major international and inland markets
served; the main inland (land and waterway) transport routes providing access to and connection from
the port; and the nature and location of port and inland intermodal connections and nodes.

19
Mumbai Port
The general layout of the Mumbai Port is shown below.
Figure 3.1. Mumbai port layout
Source: Rotterdam Advisers Report, 2007.
Operational details
There are three enclosed wet docks namely, Prince's, Victoria and Indira Docks, having a total
area of 46.30 hectares and quayage of 7 776 metres inside the wet basin and 853 metres along the
harbour wall. Besides the wet docks, there are, along the harbour front, a number of “Bunders” which
are open wharves and basins where the traffic carried by the sailing vessels is handled. These bunders
have extensive facilities for loading, unloading and storing the cargo and have an aggregate quayage
of 12 500 metres.
JNPT
Operational details
The JNPT is mainly a container cargo port, set up basically to handle container traffic. The port is
equipped with three berths with a linear quay length of 680 metres. These berths can handle container
vessel sizes of third generation.
It also has a 445 Long Shallow Draught Berth for vessels up to 170 metres LOA and up to
9.00 metres draught for handling Feeder Container Vessels, Dry Bulk (Fertiliser, Fertiliser raw
material, Sugar etc.) and General Cargo vessels.
Port handling – recent trends and short-term outlook
Mumbai Port
Mumbai is a multi-purpose port that handles liquid bulk, dry bulk, break bulk and containerised
cargos. Liquid bulk and break bulk are the main cargos. Recent trends indicate that the growth of
Mumbai Port has been slower than the overall growth of all Major Ports and especially when
compared with the neighbouring JNPT. Container handling in particular showed a declining trend over
the years with a diversion of the container traffic to JNPT across the Mumbai Bay. But it should not be

20
overlooked that Mumbai Port still continues to handle a substantial portion of POL, Iron & Steel,
Foodgrain, General Cargo and Edible Oil on the Western coast.
Traffic
The year 2009-2010 closed with a throughput of 54.54 million tonnes of cargo traffic as against
51.87 million tonnes in 2008-2009.
Container traffic
Mumbai Port handled 58 000 TEUs in 2009-2010 as against 92 000 in 2008-2009 and 118 000 in
2007-2008.
Future requirements
The traffic of Mumbai Port is projected to increase to 62.70 MTPA by 2013-14 and up to
69.39 MPTA for 2015-16 from the present level of 54.54 MPTA. The expansion proposals for
Mumbai Port include construction of two offshore container terminals having a capacity of 0.8 million
TEUs, container stacking facilities by developing container yard at the present Victoria and Prince’s
docks, redevelopment of Harbour Wall Berths to handle larger and deep draughted general cargo
vessels and a fifth oil berth. The port has plans to develop facilities for coastal ships.
JNPT
India’s increasing international trade necessitated the development of additional port and terminal
facilities to decongest the traffic at Mumbai Port. The need of an additional and alternative port in the
region to handle the increased traffic led to the development of JNPT in 1989. JNTP is now primarily
a container port. It handles 56% of the container throughput of India.
Total traffic handled during the year 2010 was 60.74 MMTA as against 57.29 MMTA in
2008-2009. At present, it is ranked among the top 30 container ports in the world. However, due to the
recent collision of two cargo ships in the common approach channel of Mumbai Port and JNPT and
consequent oil spill in August 2010 near Mumbai, leading to suspension of vessel traffic for nearly a
week at both the ports, there is a possibility that big container ships may be attracted towards Mundra,
due to the port’s modern facilities, and also proximity to the North Indian Hinterland.
Future requirements
Container traffic at JNPT is projected to increase to 10.9 m TEU by the year 2015-2016. The
development plans at JNPT include development of the 4th terminal, installation of a standalone
container handling facility with a quay length of 330 metres, and deepening and widening of entrance
channels to handle bigger vessels. It is estimated that the peak traffic volume generated due to port
activity would be to the tune of 3 668 PCUs per hour by 2015-16. This would require corresponding
augmentation of the road connectivity of the port.
Four-laning of highways connecting the port to the Hinterland, and construction of Dedicated
Freight corridors between JNPT and New Delhi for railways have been taken up to improve transport
connectivity.

21
Port transport connections
Mumbai Port
Railways
The Port of Mumbai owns and operates its own Railways, which are connected to the broad
gauge main lines of the Central and Western Railway at its Interchange Railway Yard at Wadala
within the City. The Railway runs about ten kilometres of straight route between Ballard Pier and
Wadala and has an extensive network of track of about 100 kilometres. It serves the Docks as well as
the important installations and factories on the Port Trust estates. It has its own fleet of five diesel
locomotives. For handling ICD traffic, a fully fledged RCD has been set up with facilities for
reception, stacking etc. of containers. It can handle two trains of 45 wagons with double dispatch
facilities.
Road
Even though the port is well served internally with a road network of over 126 km, owing to the
location of the port, which is on the edge of the island, the connectivity to the Hinterland has to be
done by the city roads only. As a result, most of the traffic from the port has to move in the night only
when the city traffic load is less.
JNPT
More than 40% of up-country cargo is being transported to Container Freight Stations (CFSs) for
carting; which is containerised at CFS and transported to JNPT for loading on the vessels. The CFS
Operators facilitate stuffing and de-stuffing for quick turnaround of containers to catch the vessels and
reduce the inventory cost for the shipping lines.
Rail
The port has already undertaken broad-gauging of railway tracks from JNPT to Panvel, the
nearest junction.
Road
JNPT is well connected to main hinterland through the National highway 4-B and State highway
SH-54. Refer to Figure 3.2 for road connectivity for JNPT
There are also projects undertaken for four-laning of the State highways linking the JNPT to the
hinterland. The projects planned as well as the existing links are shown in the schematic layout of
JNPT road and rail connectivity in Figure 3.3.

22
Figure 3.2. Road connectivity to JNPT
Source: JNPT.
Figure 3.3. Schematic layout of JNPT road and rail connectivity

23
CHAPTER 4
HINTERLAND CONNECTIONS
Transport is clearly a factor of fundamental importance in all-economic activities and the cost of
transport is one of the most significant variables affecting the market price of any commodity. The
transport/development relationship is essentially an interaction process and the results of the
interaction depend upon the type of economy involved. Economic development of a region may be
said to require a certain level of transport provision in order to maximize its development potential and
theoretically, there is an optimum transport capacity for a given level of development.
Transport infrastructure development in India
In terms of macroeconomic benefits of infrastructural investment, it is appreciated that while such
investment would sustain effective demand, it would also release structural constraints of the
economy. At present, the rate of infrastructure investment attained in India is low when compared to
the international standards and the requirements of the Indian economy. The foreign direct investments
along with domestic private investments could accelerate this growth significantly in the next coming
years. As a result, India can expect to witness a gradual but very significant increase in the
transportation network during the next decade by 2020.
Hinterland connections: Inland and intermodal transport
As in many other countries, probably one of the most important transport/logistics challenges
facing India is its trade and transport infrastructure. While considerable private sector investment is
now being directed into the development, expansion and modernisation of Indian ports, the country’s
road, rail and inland waterway systems have suffered from years of neglect and under-investment. The
average cost of freight is relatively high and India’s inadequate transport infrastructure is holding back
economic growth.
Transport connectivity
The development of a port depends on the connectivity between the existing transport networks
of the regions, which depends on good infrastructure facilities. Effective interconnection requires the
provision of integrated networks and services which are attractive to potential users. Their
development is likely to require co-operation among a range of transport authorities and service
providers in the public and private sectors.
Road/Port connectivity
Port and road connectivity are essential to land locked regions for their economic and social
development. The National Highways Development Programme (NHDP) of the Government of India
is managing port connectivity via roads to National Highways. Port authorities can also initiate road
connectivity projects themselves.

24
The NHDP plans to improve the quality and add to the length (about 13 150 km) of the national
highways, which would involve four or six-laning. The National Highways Authority of India (NHAI)
is implementing NHDP. The project has two important components
1. Golden Quadrilateral connecting Delhi-Mumbai-Chennai-Kolkata-Delhi; and
2. North-South Corridor connecting Kashmir to Kanyakumari including the Cochin-Salem spur
and East-West Corridor connecting Silchar to Porbander.
The length of the Golden Quadrilateral is 5 846 km.
The NHDP programme is also aiming to connect ten of the major ports (Haldia, Paradip,
Visakhapatnam, Chennai, Tuticorin, Cochin, New Mangalore, Mormugao, Jawaharlal Nehru and
Kandla) to NHDP highways by 357 km of roads with work under progress.
The Special Purpose Vehicle (SPV) project which has been awarded, which covers eight Major
port connectivity road projects namely, Mormugao, Haldia, JNPT, Tuticorin, Paradip, Cochin,
New Mangalore and Visakhapatnam and nine minor port road connectivity projects covering
268.55 km. The main objective of this project is to connect the ports and private industries and
companies in the port hinterland, for which it aims to attract private investors to participate in the
project.
Rail/Port connectivity:
Railways are very important links in the supply chain for global trade. The success of larger ports
will depend on a proper participatory role by railways. Indian ports face significant capacity
bottlenecks in terms of rail connectivity. In order to address these issues, the government initiated the
NRVY (National Rail Vikas Yojana) in 2002. The NRVY has implemented 21 projects involving port
connectivity across the country and strengthening of hinterland connectors.
Rotterdam Adviser’s Report 2007
The Port of Rotterdam Adviser’s report, 2007 provided the following comments:
The system of distribution containers and containerised cargos is highly concentrated with
most containers for Delhi and north India being routed through the Mumbai/JNPT port
complex. This route is already one of the busiest domestic freight arteries in the country.
With new container terminal developments in Gujarat and with decent rail connections to
and from the ports of Mundra and Pipapav, this situation is changing gradually.
The Consultants have presented many problems and projects related to hinterland
connectivity, most of them related to the direct vicinity of the port concerned.

25
Although the Port Trusts are obviously very well aware of the hinterland connectivity
problem within and directly outside the port, it is the impression of the Advisor that
relatively little effort is made to promote and lobby for an integrated transport system on a
national scale. This is clearly a responsibility of the national Government.
It is recommended that the Major Ports would take a more pro-active approach to safeguard
the smooth flow of cargo to the hinterland
Source: Co-ordination of Business Plans Major Ports of India Volume 2, 2007.
Mumbai
Proximity of the port to the city and the enormous growth of the urban centre, population and city
traffic, have gradually resulted in rising congestion in the connections of the port with the hinterland
by rail and road. Since crude and POL are the main commodities handled in the Mumbai port, the
main mode of hinterland transport is pipeline. A network of sub marine pipelines is used to transfer oil
and petroleum products to two oil refineries in the area. For the other cargos, road transport is the main
transport mode in spite of the congestion. The relatively minor role of the railways in cargo transport
is a result of the heavy burden of the suburban passenger rail traffic. At present, the Mumbai Port
Trust gets only a two hour window in the night to move the cargo traffic by trains from and to the Port.
An improvement is planned in the form of development of a dedicated rail freight corridor
(Wadala/Kurla) to move cargo in and out of the City. Consultants have recommended to have an
additional three dedicated lines constructed. Similarly, plans exist to improve the road transport
system. Consultants stress the urgency of the hinterland connections and warn that any substantial
delay in the implementation in road implementation projects would have an adverse impact on road
traffic and result in major congestion in particular considering new port projects recommended.
JNPT
The port is well connected with the national rail and road networks. Road represents the major
share in the hinterland transport (72%). Rail cargo is delivered to and received from Inland Container
Depots (ICDs) through trains that are operated by Concor. The ICDs are intermodal facilities where
goods and containers are delivered by road and transferred to freight trains headed for ports (or other
ICDs) or vice versa.
JNPT is linked with the national railway network through a lead line connecting the port with
Jasai station at nine km from the port. Container trains suffer substantial waiting time in view of
congestion and limitations in the railway system. The State and national highways join at Karal
junction when entering the JNPT.
The current road infrastructure is facing pressure leading to congestion at various places in the
port area. The Port has taken up four-laning of NH-4B, SH-54 and four-laning of Amra Marg of about
46 km at an estimated cost of Rs.3570 million – through an SPV formed between National Highway
Authority of India (NHAI), JNPT and CIDCO (The City and Industrial Development Corporation of
Maharashtra Ltd.).
The Dedicated Freight Corridor Corporation (I) Ltd. (DFCCIL) a Government of India enterprise
is planning to construct dedicated railway tracks for rail cargo traffic movement from JNPT to
New Delhi.

26
At present, the Port is connected to 38 Inland Container Depot (ICD) destinations throughout the
country (see Figure 3.4).
The destinations served are, Tughlakabad (Delhi), New Delhi, Jodhpur, Kakinada, Sabarmati
(Ahmedabad), Moradabad, Vadodra, Belanganj (Agra ), Kanpur, Mulund (Mumbai), Ludhiana,
Amingaon, Jaipur, Dronagiri, Whitefield (Bangalore), Chinchwad (Pune), Coimbatore, Tondiarpet
(Chennai), Shalimar (Kolkata), Madurai, Balasore, Sanathnagar (Hyderabad), Jamshedpur, Guuntur,
Nagpur, Anarpati, Aurangabad, Cochin, Bhusawal, Gwalior, Pithampur, Vizag, Kandla, Jodhpur,
Moradabad, Paradip and Tuticorin.
Key Inland Container Depot (ICD) locations are shown in Figure 4.1 below.
Figure 4.1. Inland container (ICD) destinations from JNPT
Source: Dedicated Freight Corridor Corporation of India Ltd. (DFCCIL).

27
CHAPTER 5
LONGER TERM OUTLOOK AND GROWTH POTENTIAL
Longer term outlook for regional/international demand
It is important to have assessments of the longer term outlook that highlight the growth potential
and market challenges facing the Mumbai Gateway Ports.
Desirably these will include:
Scenarios and gateway (area) forecasts and projections that have been prepared.
Expectations for growth and change in international and regional trade.
Likely developments in maritime and inland transport services and routes.
Any major changes in the nature or level of competition that the gateway could expect to
face.
Mumbai Port
The forecast for the Mumbai port for commodity wise traffic is shown in Table 5.1.
Table 5.1. Commodity-wise traffic projections
Source: Mumbai Port Trust.
28
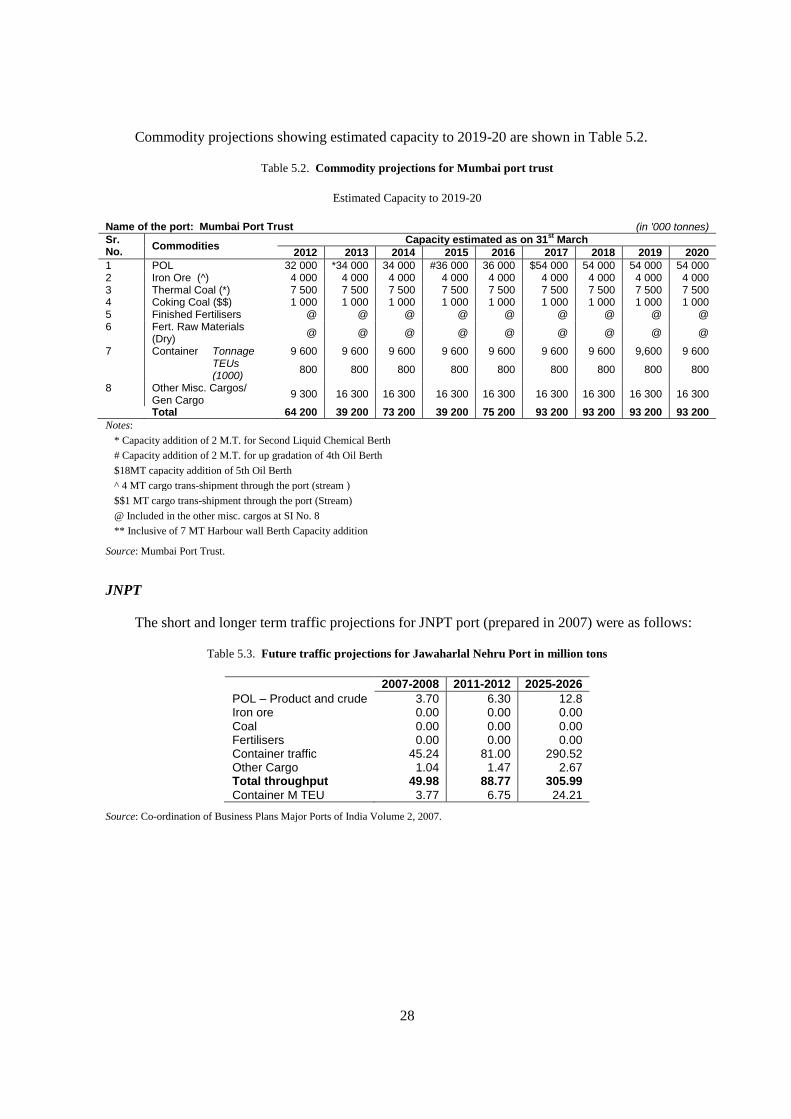
Commodity projections showing estimated capacity to 2019-20 are shown in Table 5.2.
Table 5.2. Commodity projections for Mumbai port trust
Estimated Capacity to 2019-20
Name of the port: Mumbai Port Trust (in '000 tonnes)
Sr. No.
Commodities Capacity estimated as on 31
st March
2012 2013 2014 2015 2016 2017 2018 2019 2020
1 POL 32 000 *34 000 34 000 #36 000 36 000 $54 000 54 000 54 000 54 000 2 Iron Ore (^) 4 000 4 000 4 000 4 000 4 000 4 000 4 000 4 000 4 000 3 Thermal Coal (*) 7 500 7 500 7 500 7 500 7 500 7 500 7 500 7 500 7 500 4 Coking Coal ($$) 1 000 1 000 1 000 1 000 1 000 1 000 1 000 1 000 1 000 5 Finished Fertilisers @ @ @ @ @ @ @ @ @ 6 Fert. Raw Materials
(Dry) @ @ @ @ @ @ @ @ @
7 Container Tonnage 9 600 9 600 9 600 9 600 9 600 9 600 9 600 9,600 9 600 TEUs (1000)
800 800 800 800 800 800 800 800 800
8 Other Misc. Cargos/ Gen Cargo
9 300 16 300 16 300 16 300 16 300 16 300 16 300 16 300 16 300
Total 64 200 39 200 73 200 39 200 75 200 93 200 93 200 93 200 93 200
Notes:
* Capacity addition of 2 M.T. for Second Liquid Chemical Berth
# Capacity addition of 2 M.T. for up gradation of 4th Oil Berth
$18MT capacity addition of 5th Oil Berth
^ 4 MT cargo trans-shipment through the port (stream )
$$1 MT cargo trans-shipment through the port (Stream)
@ Included in the other misc. cargos at SI No. 8
** Inclusive of 7 MT Harbour wall Berth Capacity addition
Source: Mumbai Port Trust.
JNPT
The short and longer term traffic projections for JNPT port (prepared in 2007) were as follows:
Table 5.3. Future traffic projections for Jawaharlal Nehru Port in million tons
2007-2008 2011-2012 2025-2026
POL – Product and crude 3.70 6.30 12.8 Iron ore 0.00 0.00 0.00 Coal 0.00 0.00 0.00 Fertilisers 0.00 0.00 0.00 Container traffic 45.24 81.00 290.52 Other Cargo 1.04 1.47 2.67 Total throughput 49.98 88.77 305.99
Container M TEU 3.77 6.75 24.21
Source: Co-ordination of Business Plans Major Ports of India Volume 2, 2007.

29
CHAPTER 6
MUMBAI AND JNPT PORTS – OPPORTUNITIES AND CHALLENGES
What are the implications of the global/regional projections and scenarios for the
gateway/transit hub area in question?
Global projections anticipate:
Continued global population growth for the period to 2050, with growth rates decreasing
over time. Global GDP will continue to increase and could double over the period to 2030.
By 2050, global GDP could grow three or four-fold – while GDP in China and India could
increase seven to eight times. Global GDP per capita could grow by up to 187% over the
period 2005-2030. The largest absolute increases in GDP per capita will be in OECD
developed countries but the fastest growth rates will be in developing countries.
Global population billions
Global GDP (USD – trillions)
Global GDP per capita (USD 2009)
2007 6.465 69 780 10 500 2015 7.295 89 179 12 213 2030 8.247 138 939 16 722 2050 9.191 232 151 25 372
Sources: UN Pop Div.; IEA 2009, 2008.
Projections for India anticipate:
Continued strong growth in population to 2050. Rapid GDP growth – and rapid increases in
GDP PC.
India population billions
India GDP (USD – trillions)
India GDP per capita (USD 2009)
2007 1.165 3 113 2 800 2015 1.294 5 349 4 133 2030 1.485 12 638 8 513 2050 1.614 25 638 15 887
Sources: UN Pop Div.; IEA 2009, 2008.
Taken together, these global and regional increases in demographic and economic factors are
expected to drive huge increases in economic activity, trade and related transport requirements for
India generally. Whether trade and related freight transport grow at a higher rate than economic
growth depends to an extent on the composition of Indian GDP growth – and the services and product
proportions in particular.
Mumbai gateway area demand is also likely to increase very substantially over the next ten years
– and even more so over the period to 2030 and 2050. The population of Mumbai is forecast to
increase strongly over the period to 2030 and beyond, as follows: 19 million (2007), 26.4 million
(2025) and possibly 38 million (2050).
Implications for the Gateway Area
The economic outlook for the Mumbai gateway area is expected to be very positive – provided:
the necessary trade and transport infrastructure is developed and available at the time required; the

30
necessary maritime and inland transport services are provided efficiently at the time required; and the
Mumbai gateway facilities remain competitive with other ports/possible supply chain routings.
Assuming no major new routes or infrastructure developments, how is the competitiveness of
the hub/gateway/area likely to change in future – and how will this affect the evolution of global
supply chains and throughput volumes?
Overview
The Port of Rotterdam’s Summary Report on “Co-ordination of Business Plans” (2007) advised:
“The six major ports on the West coast cater to the hinterland comprising almost half of the
country. The primary hinterland being serviced is first of all the state where the port lies.
Beyond that, the ports of Mumbai, JNPT and Kandla compete for the Northern land-locked
states of Punjab, Rajasthan, Haryana, Delhi and Madhya Pradesh. The comparatively
Southern ports of Mormugao, New Mangalore and Cochin cater to the Southern states of
Goa, Karnataka and Kerala on the Western coast. Due to the proximity of Gujarat to the
Northern states and initiatives taken by smaller ports like Mundra and Pipavav, the Major
Ports like Mumbai and JNPT have been facing increasing pressure over the last few years.
Mumbai, which has most of the areas around Mumbai and large parts of Maharashtra as its
captive market, is now facing stiff competition from the smaller ports in the vicinity like
Dighi and Dharamtar – mainly on account of the similar cargo profile and also due to traffic
constraints for roads and rail connectivity to the ports as explained in the background
document.”
Competitive position locally
The Port of Rotterdam’s Summary Report 2007 advised that by far the largest potential growth in
maritime transport for India as a whole and for the Mumbai gateway ports is container traffic. This is
a market in which JNPT is very successful. Mumbai does not handle significant container volumes
presently but has plans to develop facilities to allow it to handle some container traffic.
In relation to Mumbai’s competitive position, the Rotterdam Summary Report noted:
“Mumbai’s competitive positioning with respect to the Major Ports of India (as well as the
minor ports) on the Western coast would be largely determined by its ability to – (1) increase
its present cargo throughput across various commodities and (2) attract and retain
port-users”.
Table 6.1. Profile of ports competing with Mumbai
Major ports Minor ports
Kandla Dry bulk, POL, general cargo Mundra Cement containers, bauxite
JNPT Containers, POL Pipavav Containers
Cochin POL, general cargo, containers Dharamtar Dry bulk, coal, scrap iron, sulphur
Mormugao General cargo, coal, iron ore, liquid bulk
Dighi Bauxite, manganese, sand, assorted metals
New Mangalore General cargo, POL, LPT, iron ore, edible oil, cements

31
The Rotterdam Summary Report’s advice provided in respect of JNPT was:
“The Northern and Western regions contribute to 70% of JNPT’s container traffic. Since the
start-up of JNPT, its market share of container traffic on the West Coast has steadily
increased to an actual 83.5% by the current year. It is questionable whether JNPT can
maintain this high market share in the years to come, with (new) competitors like Dighi,
Kandla, Mundra, Pipavav and Rewas. Although it may be expected that JNPT’s market share
will therefore decrease, in absolute numbers of TEU’s, a strong increase is still expected.
Mundra and Pipavav are considered to be the major competitors in the near future since they
are already operational and operated by private firms. There are also state-of-the-art
container cargo handling equipments installed, and other modern facilities present at the
Mundra and Pipavav ports, which give better cargo handling efficiency and lesser vessel turn
around times than JNPT. (Further, incidents like the collision of two vessels in August 2010
at JNPT/Mumbai Port in a narrow channel may also have an adverse affect on the future
volumes, as most of the larger vessels may be attracted to Mundra, due to its proximity to the
land locked hinterland of Northern Indian states). From an international point of view, ports
like Salalah and Colombo are also competitors. They may have a serious impact on JNPT’s
ambitions to attract more trans-shipment cargo. Moreover, JNPT is not closely located to the
main international shipping routes. The major ports of Cochin and Tuticorin are more
favourably placed in this respect. Both of them have ongoing container capacity expansion
projects or plans for the same and pose a challenge to JNPT’s trans-shipment strategy.”
Large post Panamax ships/Trans-shipment volumes
The entry of increasingly large post-Panamax liners raises at least two very important medium
term issues for the Mumbai Gateway ports. These are:
the ability of Mumbai Gateway ports to handle the largest liner ships being built (12 000+
TEUs)
the extent to which the Gateway area is likely to retain and/or attract trans-shipment traffic.
Many large capacity liners (more than 10 000 TEUs) are expected to come on to the international
shipping markets in the next few years. Based on orders placed before the global crisis, some 1 750
liners of this size were expected to be delivered over the period 2009-11. According to Drewry, delays,
deferrals and cancellations following the global financial crisis have reduced significantly the
deliveries now expected to be made over this period. Nonetheless, there will shortly be a very
substantial increase on large capacity liners. In many locations, this will require infrastructure adapted
to the increased size of these lines.

32
Table 6.2. Container traffic related infrastructure projects for Mumbai Port
Source: Mumbai Port Trust.
As shown in Table 6.2 above, Mumbai Port is planning to add an off-shore terminal which would
allow larger vessels to be berthed. There are also plans to convert the Victoria and Prince docks to
container stack yards, to serve the offshore container terminal. A proper road connectivity between the
container stack yard and the container terminal would also be constructed for easy and fast access.
For JNPT, there is a plan for the addition of a 4th container terminal which would substantially
enhance the container handling capacity of the port. The table below shows the estimated forecast in
the traffic due to addition of this planned 4th container terminal.
Table 6.3. Estimated traffic potential – 4th container terminal at JNPT
Mn TEUs
2010-2011 0.04
2011-2012 0.86
2012-2013 1.81
2013-2014 2.31
2014-2015 2.4 Source: JNPT Business report 2008.
The traffic throughput expected for the fourth terminal at JNPT is 0.04 million TEU going up to
its full capacity of 2.4 million TEU in the 4th year of operations, i.e. by 2014-15. Apart from this, the
port would also need to develop Container Freight Station (CFS) and other supporting infrastructure
(hinterland, etc.) for the expansion. These projects have been identified separately and should be
completed over time to ensure smooth operations of the terminal in phase one. JNPT would start
experiencing shortfalls of container handling capacity by 2014-15, when total traffic expected is
9.92 million TEUs as compared to present capacity of 8.75 million TEUs. In the years up to 2016-17,
this shortfall could increase up to up to 2.7 million TEUs. As a result, there exists a case to develop the
second phase of the 4th container terminal. Phase two of the 4th Terminal is proposed to be set up by
the year 2014-15 to overcome the shortfall perceived in 2014-15 and to handle the increase in traffic
expected in subsequent years. It is proposed that the terminal would have a quay length of 1 000 m
extending to the west of the 4th terminal phase one.

33
Figure 6.1. Fourth terminal and associated projects for JNPT
Figure 6.1 shows the layout of the proposed fourth container terminal along with associated
infrastructure adding projects planned for JNPT.
Associated with the increasing vessel size on the main trade routes, there could well be different
patterns of direct, by-passing and trans-shipment services. As noted in the Rotterdam report, Salalah
(Middle East) and Colombo (Sri Lanka) are competitive ports, closer to the main shipping lanes,
which for trans-shipment ware already placed in the 10-20 top global trans-shipment ports, based on
2008 Drewry estimates of trans-shipment volumes. Cochin and Tuticorin also have the location and
capacity to offer further options to international liner companies.
It would be very hard for Mumbai Port to become a trans-shipment port considering its limited
handling capacity even after the addition of the offshore terminal, as most of the traffic handled by this
port would cater only to the growing needs from the immediate Hinterland, which is mainly Mumbai.
However JNPT has opportunities to play a part in attracting some share of the trans-shipment
volumes. Tables 6.4 and 6.5 show the route, draft and quay length details and port facilities and
connectivity route details for JNPT compared to its competitors.

34
Table 6.4. Comparison of current facilities at JNPT with competitors
Source: JNPT Business report 2008.
35
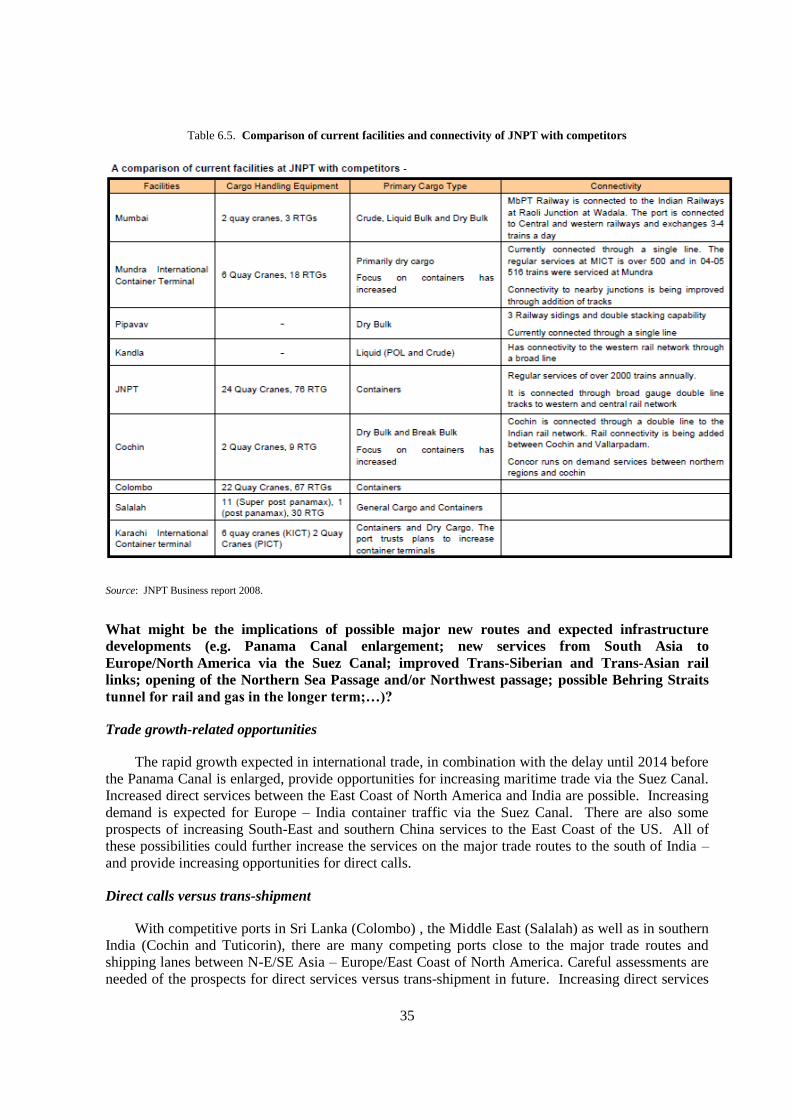
Table 6.5. Comparison of current facilities and connectivity of JNPT with competitors
Source: JNPT Business report 2008.
What might be the implications of possible major new routes and expected infrastructure
developments (e.g. Panama Canal enlargement; new services from South Asia to
Europe/North America via the Suez Canal; improved Trans-Siberian and Trans-Asian rail
links; opening of the Northern Sea Passage and/or Northwest passage; possible Behring Straits
tunnel for rail and gas in the longer term;…)?
Trade growth-related opportunities
The rapid growth expected in international trade, in combination with the delay until 2014 before
the Panama Canal is enlarged, provide opportunities for increasing maritime trade via the Suez Canal.
Increased direct services between the East Coast of North America and India are possible. Increasing
demand is expected for Europe – India container traffic via the Suez Canal. There are also some
prospects of increasing South-East and southern China services to the East Coast of the US. All of
these possibilities could further increase the services on the major trade routes to the south of India –
and provide increasing opportunities for direct calls.
Direct calls versus trans-shipment
With competitive ports in Sri Lanka (Colombo) , the Middle East (Salalah) as well as in southern
India (Cochin and Tuticorin), there are many competing ports close to the major trade routes and
shipping lanes between N-E/SE Asia – Europe/East Coast of North America. Careful assessments are
needed of the prospects for direct services versus trans-shipment in future. Increasing direct services

36
to Mumbai can be expected given the size of the origin and destination markets in Mumbai and its
catchment hinterlands. At the same time, as post-Panamax vessel sizes increase, there could be
increasing prospects for freight to and from Mumbai being transhipped from long haul international
services at one of the four southern container ports listed above, close to the major international
shipping lanes.
At Mumbai, it is expected there will be dredging to deepen the channels to accommodate post
panama vessels. Also, with development of an offshore terminal, there may be a possibility to attract
large container vessels. The offshore terminal is expected to be operated on a PPP basis, with private
companies operating there likely to have higher efficiency and better marketing strategies to attract
such volumes for trans-shipment to domestic hinterland. Coastal shipping jetties and the infrastructure
needed are planned, looking at possibilities for trans-shipment in container and other bulk cargos in
future.
For JNPT, however, a large amount of trans-shipment can be expected provided all infrastructure
development projects planned are completed on time. Timely implementation, however, will be an
issue. The Report of Comptroller & Auditor General of India (Report No. 3, 2009-2010, page 82,
dated 25 January, 2010) had this observation on projects undertaken for National Maritime
Development Board (NMDB):
“JNPT had planned 27 schemes (the highest among all ports) to be taken up by March 2009.
Out of these, only 11 schemes had been taken up and only five could be completed.”
In Southern India, Vallapadam Port – which is being developed by DP World and is likely to be
commissioned soon – may compete with Colombo for trans-shipment volume. New ports with larger
drafts in South India like Vizhimjam (23-27 metres draught, bidding process under way), Gangavaram
(on Eastern Coast, 21 metres draught, already commissioned) and Krishnapatnam (on Eastern Coast –
19 metres draught), in additional to new terminals at Tuticorin, Ennore, etc. can also be expected to
provide competition to operational container ports in Sri Lanka.
Possible new routes
The Mumbai Gateway area is not likely to be affected significantly by possible new trade routes
in the northern hemisphere but is expected to be a beneficiary changes of the improved and higher
frequency services also the major trade routes in its vicinity – especially between Asia/South Asia, the
Middle East and Europe. It could also be affected by new maritime projects in the Asia/South Asia
region.
Two new maritime projects, if developed, could have significant effects on the trans-shipment
business for India, which is largely shared by Colombo and Singapore Ports: These two projects are:
1. Sethusamudram Shipping Canal Project at the southern most tip of Indian sub-continent; and
2. the Thai (or Kra) Canal.

37
However, there is uncertainty about whether these two canal projects will proceed – and, if they
do, the implementation timing of these projects. Some insights are provided below:
1. The Sethusamudram Shipping Canal Project (SSCP) will provide a navigable sea route
connecting East and West coasts of India, reducing travel distance of more than 420 nautical
miles and 30 hours, benefitting mainly Tuticorin Port. The Government of India had
approved the project at an estimated cost of about Rs.24 billion, to be implemented by
Sethusamudram Corporation Ltd. of Government of India in 2005. However, it might be
difficult to implement the project in its fully-fledged form due to legal cases filed on
religious grounds, as the development would destroy the bridge (land form – Rama Sethu)
supposed to have been built by Lord Rama. Alternatively, if the canal is cut through
Rameswaram Island, new generation ships (more than 60 000 DWT or tankers above
150 000 DWT) cannot use the canal. In that case, the Colombo Port would be affected to the
extent of the ships which can navigate the canal. Tuticorin Trans-shipment container volume,
presently coming through Colombo, would be the first to be diverted to one of the new ports
in the lower East Cost of India, including Chennai or Ennore, from where these
trans-shipment cargos would get connected to main line vessels. If by then, the main line
services go through Thai Canal instead of Malacca Straits, there would be further impacts on
Colombo port traffic. Environmental Impact Assessment (EIA) of the SSCP project is
awaited in February 2011, besides clearance of legal cases, before further implementation of
the project can be undertaken.
2. The Thai Canal: The Thai Canal, or Kra Isthmus, is a plan to construct a 50-100 km canal
across Southern Thailand. It would save ships from sailing around Malay Peninsula and
through the narrow (and sometimes dangerous) Malacca Straits passage. The Thai Kra Canal
would reduce the voyage time on the major East/West Trunk routes considerably. There are
reports of Chinese Government interest in taking up this project for completion in ten years,
at an estimated cost of US$20-25 billion.
The Thai Kra Canal would make Sri Lankan ports like Trincomalee, Hambantota Harbour or
Oluwil, competitive as trans-shipment hubs, as they would be positioned directly in line with the Thai
Kra canal. Trincomalee, with 25 metres draught, would benefit significantly from both the Thai Kra
Canal and Sethu Samudram, as feeders from Tuticorin in India could connect cargo to super container
ships at Trincomalee. Trincomalee could also connect ports like Chennai, Ennore, Paradip, Kolkata
and Chittagong in Bangladesh as a trans-shipment port. Further, resumption of rail connections from
Trincomalee to Southern India through Danuskody would offer another outlet for Indian cargo.
Air Freight
The global outlook for air freight following the recession is for a relatively strong recovery and
then increasing air freight over the next ten years, with the possibility that international air freight
volumes could triple over the next 20 years. Given the projected air freight growth rates, the increases
in air freight volumes expected are larger than projected increases in maritime container volumes over
the same period. There will also be increasing shares of goods by value carried by international air
freight services. In the case of the Mumbai gateway area, the balance of demand between air freight
and maritime container volume and value shares will depend on the value of the goods needing to be
transported, the cost involved and the overall time taken from origin to destination. Assessments need
to be made of the options, taking into account: for air freight, the time taken, the cost and reliability of
air freight and associated ground and transport services; for maritime services, the time, cost and
reliability including inland transport connections. If air freight supply chains are more rapid and

38
reliable at acceptable costs than maritime ones, the proportions of air freight – particularly by value –
are likely to increase, possibly quite considerably.
Other possible transport connections
In the longer term, the outlook for the Mumbai gateway area – like other areas – could also be
affected by the development of new global maritime routes – as well as by the improvements made in
international land transport connections with neighbouring states/regions. However, in the case of the
Mumbai Gateway area, the impacts are considered likely to be rather small, given the very large and
relatively captive local and inland origin and destination markets that the Gateway area will continue
to serve.
Conclusions
The Mumbai Port can be expected to cater mainly to the growing demands of Mumbai itself, the
local hinterland of Mumbai and surrounding areas in Maharashtra – and be limited by constraints
related to its expansion and hinterland connectivity. Port constraints are also expected to limit its
ability to attract trans-shipment cargos. However, it may attract some domestic trans-shipment cargos
in containers, bulk, POL, etc., provided coastal shipping related developments are also completed as
planned. The Background Document provides information on proposed infrastructure developments at
Mumbai.
For JNPT, as far as coastal trans-shipment opportunity is concerned, an analysis by JNPT for its
Business report 2008 found that a number of factors impacted its attractiveness, including distances
from major shipping routes, other competing ports being developed and draft depths. As a result, the
port could look at trans-shipment options opportunistically rather than as a key focus area. Aligned to
the export import traffic focus, other potential value added services were examined which could
strengthen JNPT's positioning. Potential value added opportunities included distribution, logistics and
free trade areas.
What scope is there for the continued expansion of the major hubs/gateways in the gateway area
– and how would this compare on balance with options for increasing traffic on other
infrastructure facilities nearby?
According to the Port of Rotterdam Summary Report, there are mixed prospects for the continued
expansion of the ports in the Mumbai Gateway area.
Mumbai is rated highly in terms of – (1) location and (2) its ability to handle multiple types
of cargo. The primary constraints identified while dealing with the Mumbai Port were –
capacity constraints of berths to handle ships, labour inefficiency and evacuation of cargo
from port. The port users recommended certain measures to improve port competitiveness –
viz. reduction in tariff, alternate land usage (marina, cruise terminal etc.) and modernization
of equipment.
The Port of Rotterdam Adviser’s Comments included:
Although it is obvious that the location of the port in the almost captive market of 15 million
people is a strength of the port, it should be noted that adequate hinterland connectivity is an
absolute condition. Traffic jams in Mumbai are notorious, therefore there will always be the
threat that the cargo might go to another port in the vicinity.

39
More detailed information suggested there were plans to improve road and rail access to the
Mumbai Port, as required by the Government decisions of all ports taken after consideration of the
Report on Road and Rail Access to Ports. However, one of the most important of the road connections
depended on the transfer of required land to the Port, which had not been resolved for 16 years.
JNPT
The Rotterdam Co-ordination of Business Plans Report 2007 projected significant increases in
cargo throughput at JNPT over the period to 2025-26
As part of the business plan development exercise an action plan for the port was developed for
the next seven to eight years. This action plan was based on the short term goals identified:
Reaching 10 m TEUs of traffic at JNPT by 2015-16
To offer logistic services at JNPT by 2011-12
To improve efficiency in port operations by 2011-12
Strategy to achieve goals
A strategy to achieve the goals was outlined focussing on the following elements:
Cost: JNPT would endeavour to reduce costs by improving efficiency and thereby ensure
competitive services for user.
Customers: JNPT would attract and retain customers through addition of core and value
added services.
Geographies: JNPT would focus on the northern and Maharashtra region and would enable
traffic from the regions through planned development within and nearby the port.
Services: JNPT would provide value added services and would capture a larger share of the
logistics value chain. The strategy for achieving the goals would need to be supported by a
financial and commercial strategy.
Commercial Strategy: The commercial strategy deals with the three levers of customer
management, cost management and service offerings of the port. It is aimed at achieving
commercial success within the operating business environment through effective
management of customers and suppliers.
Over the longer term, it is envisaged that JNPT port will increasingly play the role of a landlord
with limited presence in port terminal operations (JNPCT). JNPT will evolve primarily into a landlord
port facilitating services by terminal operating companies and other providers. The solitary terminal
will be the responsibility of JNPT over the medium term horizon of the plan period.
Based on more recent assessments, the container traffic potential for the region around JNPT is
now expected to be around 25 m TEUs by 2026-27.

40
Estimates of the future traffic potential at JNPT took into account the proportion of traffic
expected to arrive at JNPT from various regions, based on a gravity model assessment and discussion
with port users.
However, JNPT faces expansion constraints and therefore the actual traffic at JNPT is expected
to be limited by the overall handling capacity (under the current geographical and policy restrictions)
at JNPT. A realistic estimate of the overall capacity for JNPT (under the current geographical and
policy restrictions) is considered to be around 10.90 m TEUs by 2016-17 at 70% occupancy. After
allowing for the capacity to be provided by upcoming new Minor ports, the higher container traffic
potential for the region suggests the need for an additional port in Maharashtra to handle potential
traffic for the larger hinterland.
Conclusions on Mumbai Gateway ports
The combination of serious hinterland access constraints at Mumbai, the lack of well developed
implementation plans for port capacity beyond 2016-17 at JNPT and Mumbai’s limited capacity to
handle containerised traffic suggest that, in the medium term, there must be real doubts about the
capacity of the Mumbai Gateway Ports to continue to expand capacity as required to cater for growing
demand.
Options for meeting demand at alternative locations (nearby)
As noted by the Report of the Comptroller & Auditor General of India (Report No. 3,
2009-2010), the implementation of various plans by Major Ports are significantly behind schedule,
giving opportunity to Minor ports to increase their market share.
The other options in the vicinity could be Dighi, Revas and Dharamtar. Dighi amongst these three
is set to come up first due to early start and is already operating partially.
Dighi port
DIGHI PORT, the first green field port in Maharashtra is being developed under a 50-year
“Build, Own, Operate, Share & Transfer (BOOST)” Concession Agreement signed with Maharashtra
Maritime Board (MMB) to finance, develop, market, operate and maintain the port. It is an
all-weather, deep draught, multi-purpose, multi-cargo, direct berthing port. Some facts about the Dighi
port are set out below;
Located in Raigad district in the state of Maharashtra on the West Coast of India
42 Nautical miles by sea and 160 km by road from Mumbai
Ideally located to serve the international and costal shipping routes
Capacity: 30 million tonnes
Land: Total 1 500 acres of land, scalable up to 3000 Acres
Draft : Uniform depth of 14.5 m

41
Waterfront: Total sheltered waterfront of five km (both banks combined) with a capacity to
build up to 16 berths.
Ability to cater to Bulk, Break-bulk, LNG, Liquid, Container and RORO cargos.
Road and rail connectivity
Dighi Port is well connected to National Highway (NH-17 Mumbai-Goa) via State Highways.
Alternate state highways are available to provide flexibility. Figure 6.2 shows the road connectivity.
Figure 6.2. Road connectivity to Dighi Port
Figure 6.3 below shows rail connectivity to the Dighi Port.
The Port has already signed a Memorandum of Understanding (MOU) with M/s Konkan Railway
Corporation Ltd. (KRCL) for development, operation and maintenance of port railway line, with a
total length of 47 km.
KRCL is a company, owned by the Indian Railways (Government of India) and the coastal State
Governments of Mahashtra, Goa, Karnataka and Kerala, responsible for the main 760 km. trunk line
running along a large part of the Western Coast of India. The Port Railway Line will connect to the
Konkan Railway Main Line at Indapur – Mangaon.

42
Figure 6.3. Rail connectivity to Dighi Port
What are the opportunities for enhanced efficiency, reliability and security of infrastructure use
– e.g. in terms of operational, organisational and technological innovation (intelligent logistics
etc.)?
Port efficiency parameters
“The efficiency of any port may be judged by the Parameters such as – Pre-Berthing
Detention Time (PBD), Non-Working Time at Berth (NWT), Turn Round Time (TRT) and
Output per Ship Berth Day (OSB) of the vessels. When making comparison on the basis of
indices of efficiency it is important to note that ports differ significantly in their
infrastructure, cargo mix, types of ships calling at the ports and nautical constraints etc. For
these reasons, comparison of the indices of efficiency parameter may not be appropriate.”
Source: Port of Rotterdam’s Summary Report on “Co-ordination of Business Plans” (2007).
JNPT was able to manage and handle cargo efficiently with Capacity Utilisation almost close to
100% during the period 1991-92 to 2007-08. Mumbai Port, on the other hand was not able to augment
port capacities after liberalisation, resulting in an increase in capacity utilisation between 1999-2000
and 2001-2002.
Turn-around time at JNPT and Mumbai port
Although both Mumbai Port and JNPT were able to improve Turn-Around Times at ports,
reduction in Turn-Around Time was faster in case of JNPT than Mumbai Port. This reflects JNPT’s

43
ability to adopt modern technology in better management of port systems compared to that of Mumbai
Port.
Source: Maharashtra Economic development council economic digest April 2010.
Figure 6.4. Turn around time for JNPT and Mumbai since 1993 up to 2008
Pre-berthing times in Mumbai and JNPT ports
Pre-berthing detention was very high for Mumbai Port as well as JNPT during the period 1993-94
to 2007-08. This is a result of poor rail-road-water connectivity to these ports. Port connectivity
projects have not kept pace with the increase in cargo and subsequent port specific capacity
improvements.
Source: Maharashtra Economic development council economic digest April 2010
This is illustrated in Figure 6.5 below.
Figure 6.5. Average pre-berthing time at Mumbai and JNPT from 1993 to 2008

44
Average output per berth
Average output per-ship berth day is on the rise at both for Mumbai port and JNPT,
notwithstanding a dip at both ports on this measure during 2006-07 and 2007-08, following the general
high capacity utilisation achieved during the earlier period 2002-03 to 2005-06.
Source: Maharashtra Economic development council economic digest April 2010.
Dwell times in ports
Inadequate port capacity and navigational aids, bunching of vessels, limited cargo handling
facilities, high down time of equipment, low labour productivity and shortage of storage space, all
contribute to the low efficiency of Indian ports.
The average dwell time, in 2005-06, at container terminals in Major Ports was 1.88 days for
imports and 3.78 days for exports compared to an international benchmark of 0.6 days at international
ports. The dwell time for dry bulk cargo in Indian ports was 38 days in case of imports and 27 days in
case of exports compared to an international benchmark of 14 days.
Key recommendations include: optimisation of cargo handling systems and equipment,
better maintenance scheduling, 24x7 working at ports, augmenting capacities at ports,
creating additional testing facilities, improving labour productivity, strengthening roads to
and within the ports, creating exclusive cargo freight corridors, implementing EDI and port
community system, single window environment for port users, simplification of documents,
etc.
Source: Reducing Dwell Time of Cargo in Ports, Planning Commission, 2007.
General efficiency comparison – JNPT and Mumbai Port versus other major Indian seaports
Although JNPT handles the majority of India’s container traffic, internationally it lags far behind
the giant container seaports like Hong Kong and Singapore in terms of traffic. During 2005,
International Ports and Harbours Association (IPHA) ranked JNPT on 30th position internationally.
Currently, the port stands 31st amongst top 100 container ports, according to the JNPT.
The Maharashtra Economic Development Council (MEDC), a think-tank established by
prominent Chambers of Commerce in Mumbai, has carried out a study on performance analysis of the
efficiencies of major seaports in the country (MEDC Economic Digest, April 2010). The MEDC study
attempts to rank Indian Major Seaports empirically on the basis of their economic performance and
tries to suggest policy changes for better working of major seaports in the future. The economic
efficiency of major seaports has been studied, considering technical performance, scale performance,
factor productivity and technological change. The results are outlined in the next few paragraphs.
Technical Efficiency is calculated at Constant Returns to Scale (CRS) and Variable Returns to
Scale (VRS). When calculating Technical Efficiency (VRS), pure technological efficiency change is
calculated at Variable Returns to Scale. In maritime economic terms, one can assess a seaport as
technically efficient only when it does not have either inadequate capacity or excess capacity. As per
the MEDC study, Port of Paradip can be called the least technical efficient seaport since it possesses
input slack, i.e. the seaport is performing with excess capacities (see Table 6.6). Alternatively, the
seaport can handle the same cargo with few inputs or can increase output with the same inputs.
Comparing JNPT and Mumbai Port, although JNPT is one of the technical efficient seaports in the

45
country, the Port needs to augment efforts to be technically efficient. That can be done by curbing
wastage (land and labour) and adding cargo handling capacity.
Table 6.6. Technical efficiency – major seaports
Efficient ports Inefficient ports
Kolkatta Chennai JNPT Cochin Kandla Mumbai Mormugao Tuticorin Vishakhapatnam New Mangalore Paradip
Source: Maharashtra Economic Development Council economic digest April 2010.
Technological change or efficiency is the ability to change the frontier production function.
Currently, except Vishakhapatnam & Chennai, no other seaport in the country possesses the technical
and financial flexibility to change its production frontier. On this basis, neither Mumbai Port nor
JNPT seaport are technologically efficient. See Table 6.7 for the listing of efficient and inefficient
ports on this measure.
Table 6.7. Technological change – major seaports
Efficient ports Inefficient ports
Chennai Kolkatta Vishakhapatnam Chennai JNPT Mumbai Tuticorin Kandla Mormugao New Mangalore Paradip
Source: Maharashtra Economic Development Council economic digest April 2010.
Scale Efficiency is the potential productivity gain from achieving optimal size of the firm. Scale
inefficiencies occur at Indian Major Seaports due to poor financial, physical and capacity related
problems. Comparing scale efficiencies at JNPT and Mumbai Port, JNPT had achieved scale
efficiency while Mumbai Port is not an efficient seaport from an economy of scale point of view.
Co-ordinated efforts on physical and capacity fronts are needed to achieve scale economies at Mumbai
seaport (see Table 6.8).
Table 6.8. Scale efficiency – major seaports
Efficient ports Inefficient ports
Kolkatta Chennai JNPT Cochin Vishakhapatnam Mumbai Kandla Tuticorin Mormugao New Mangalore Paradip
Source: Maharashtra Economic Development Council economic digest April 2010.
Total Factor Productivity is the general improvement in output keeping the factors of production
unchanged. Low Total Factor Productivity can be attributed to low performance related to capacity,
pre-berthing time, idle time to total time at berth and financial performance. As far as Total Factor

46
Productivity is concerned, JNPT falls among the efficient seaports unlike Mumbai Port, which has
relatively lower productivity of its factors of production. Refer to Table 6.9.
Table 6.9. Total Productivity factor – major seaports
Efficient ports Inefficient ports
Chennai Kolkatta JNPT Cochin Vishakhapatnam Mumbai Tuticorin Kandla Mormugao New Mangalore Paradip
Source: Maharashtra Economic Development Council economic digest April 2010.
Overall performance and ranking – India’s major seaports
The port of Vishakhapatnam on the East coast and JNPT on the West Coast fare better, compared
to all the other major seaports in the country. These two major seaports are efficient on all parameters
except for Technical Change related efficiency for JNPT. The port can further improve flexibility in
adopting innovative techniques to handle cargo. Considering the parameters like Technical Efficiency,
Scale Efficiency and Factor Productivity, the ports of JNPT and Vishakhapatnam stand out compared
to other major seaports in the country.
The other major ports of Kolkatta, Chennai, Kandla and Mormugao occupy the third position
jointly in the overall port rankings. The Port Trusts of Kolkatta, Kandla and Mormugao are not only
technically efficient but are also able to reap economies of scale. However, these ports lag behind
when it come to technological change. Even the Port Trusts of Kolkatta, Kandla and Mormugao are
not better performers, when it comes to factor productivity.
On the other hand, the Port Trust of Chennai is able to show positive Total Factor Productivity
(TFP) and is also in a position to adopt new technology. The remaining ports like those of New
Mangalore, Paradip, Cochin, Tuticorin and Mumbai require substantial efforts to become efficient.
Currently, these ports fall short on all the major port efficiency parameters considered and discussed
above.
Table 6.10. Overall performance and ranking – major seaports
Ports Rank
Vishakhapatnam 1 JNPT 2 Kolkatta 3 Chennai 3 Kandla 3 Mormugao 3 New Mangalore 4 Paradip 4 Cochin 4 Tuticorin 4 Mumbai 5
Source: Maharashtra Economic Development Council economic digest April 2010.

47
Comparison of JNPT and Mumbai Port
JNPT outperforms Mumbai Port in all the four aspects of efficiency, i.e. technical, innovative,
scale efficiencies and productivity. Even in the case of technological change, JNPT is in a position to
show better adaptability to new technology than Mumbai Port.
The basic factors responsible for Mumbai Port’s relatively lower performance on these measures
are:
Lower Investment resulting in inadequate capacity
Wastage of resources (Labour and Land). Mumbai Port is the seaport in the country that
employs the highest number of labour
Low Labour Productivity
Steps that Mumbai Port might take to improve its performance could include:
Improve investments and ultimately cargo handling capacities
Restrict labour growth
Increase labour productivity by training and IT application
More productive use of vacant port trust land.
Administrative efficiency
With the available adequate infrastructure, planning for vessels and cargo can be done 72 hours in
advance and through electronic means by shipping lines, haulers, freight forwarders, shippers and
government agencies.
Port Community Systems allow ordering of berths and pilot services, documentation, enquiry /
tracking and billing. The berth system, ship system, yard planning system and resource allocation
system along with the flow through gate can be operated electronically. This can be introduced and put
into operation at Indian ports only after a comprehensive introduction of EDI which will facilitate
paperless business transaction.
Mumbai is already equipped with a Vessel Traffic Management System (VTMS).
Source: Reducing Dwell Time of Cargo in Ports, Planning Commission, 2007.
Better performance of Indian Major Seaports – some possible policy options
The efficiency of India’s seaports is very critical for India’s trade competitiveness.
Better port operational arrangements could be expected to generate additional resources on the
one hand and reduce inefficiency and waste on the other hand.
One possible approach could be to move in the direction of the commercialisation of the major
seaports and the corporatisation of the major seaports, where appropriate. Based on experiences at

48
Rotterdam, consideration might be given to a longer term objective of having port corporations at the
major ports which are fully self funding.
Other general measures that could contribute to improved port infrastructure in the country might
include:
Investments in new technology.
Profit-oriented management systems to help reduce resource wastage and improve technical,
scale and factor efficiency.
Continuous monitoring of port performance; and
Improving business practices and business intelligence at major seaports.
What improvements are needed to intermodal freight connections and inland transport to
facilitate internationally competitive supply chain services via the gateway/transit hub?
Strengthen the roads to and within the ports
Make it mandatory for ports to invest in four lane RCC roads laid using state-of-the-art
technology within the port area. Ports to immediately implement unidirectional traffic flow
to eliminate criss-crossing and traffic congestion. Approach roads to ports to be of six lanes
with no surface crossings.
[Action: MOS/All Ports) Rec. 7.1.3 Time Frame: 31.12.2009].
Ports are currently engaged in capacity expansion and efficiency improvements aimed at
handling the growing volumes of cargo. However, congestion seems to persist at several
locations on account of delayed evacuation of cargo due to inadequate road and rail capacity.
This undermines the competitiveness of Indian industry and hurts the economy at large,
more particularly the hinterland that benefits from a robust growth in exports. Port
connectivity therefore, manifests dimensions that are far larger than the operation of a port
per se. [Source: Reducing Dwell Time of Cargo in Ports, 2007.]
Mumbai’s future requirements
The traffic of the Mumbai Port is projected to increase to 45.20 MTPA by 2013-14 from the
present level of 35.12 MTPA. The expansion proposals for the Port include construction of
two offshore container terminals having a capacity of 0.8 MTEUs, redevelopment of
Harbour Wall Berths to handle larger and deep drafted general cargo vessels and a fifth oil
berth. The port has plans to develop facilities for coastal ships. To ensure smooth flow of
traffic and to meet the future requirements, the Port has developed a programme of road and
rail improvements for improving connectivity.
JNPT’s future requirements
JNPT has been steadily growing as a major container hub port in this part of the world.
During the current financial year, the port has already crossed the two million TEU mark and
accounts for about 58% of total container traffic of the country. JNPT has already signed
concession agreement for shortly taking up development of third container terminal on BOT

49
basis with a capacity of 1.3 million TEUs. JNPT has plans to develop the 4th and 5th
terminals in the near future. The port is likely to handle about 73 million tonnes by 2013-14.
The port has developed a programme for improving road rail connectivity of the port. As per
recent traffic survey and traffic forecasting studies, it is estimated that the peak traffic
volume generated due to port activity would be to the tune of 3 668 PCUs per hour by
2015-16. This would require corresponding augmentation of road connectivity of the port. In
order to evaluate the requirement of augmenting rail connectivity of the port to meet the
demands of increased traffic, JNPT had engaged RITES for conducting a rail logistic study
for the planned development of JNPT. The port has developed a programme for improving
road rail connectivity of the port.
Source: Road Rail Connectivity of Major Ports, 2006.
Rail services and rail system for inland transport
The Port of Rotterdam’s Summary Report advises:
Port Planning (Page vi)
Cochin, Tuticorin, and possibly other ports: the backbone concept should be further
investigated. This was one of the very few innovative ideas brought forward by the
Consultants: the development of a railway connectivity for cargo that could be jointly
operated by the private sector and Major Ports. The Southern Major Ports are closest to the
main maritime shipping routes. This railway line would foresee in fast and reliable transport
of (mainly) containers to and from the North;
Financial Issues (Page ix)
Substantial investments in connectivity are needed and have an enormous positive effect on
the economic development of India. Ports can participate in these connectivity projects, for
instance, in the backbone concept.
Comment: It is considered Mumbai/JNTP ports should have the same opportunity as any other
Major Ports and private competitors to participate in upgraded rail connections and network
improvements.

50
What level of infrastructure investment is likely to be needed over time and what sources and
models of sustainable financing will be tapped?
General comments from Port of Rotterdam in their Main Report Volume 1 included:
Port facilities
● A land use plan was developed in most ports. However, a clear vision on port planning and phased development is lacking
for some ports.
● High BOF (berth occupancy factor) is accepted, sometimes it is the aim to maximise the BOF where in fact a lowering to
60-70% should be strived for. This means that congestion is accepted at the expense of port users (and eventually Indian
producers/consumers).
● Many ports are at or close to capacity and due to the constraints in available land, there are few possibilities to expand.
● Generally speaking, the productivity on the berths is on the low side, a capacity increase can be achieved through
mechanisation of cargo handling and other efficiency improvement measures. Ports also used to be “berth minded”:
constructing new berths before the capacity of the existing ones was increased. Fortunately there is presently a greater
consciousness regarding increasing capacity of existing facilities.
● The move to a door-to-door concept of containers is not considered.
● Short term projects are worked out well.
● Master plans are considered to a limited extent. A land use plan was developed in most ports. However, a clear vision on
port planning and phased development is lacking for some ports. Development of a detailed strategic port master plan –
beyond the scope of this project – was recommended for a few ports only.
Source: Co-ordination of Business Plans Major Ports of India Volume 2, 2007.
Funds available for investments required
Mumbai Port Trust Funds available (Rs. Billion)
Internal Funds 2014 56.74 Less: blocked for pensions 31.19 Available for Investments 2014 25.55 Equity and Borrowing Capacity 80.52 Available funds plus Borrowing Capacity 106.07
JNPT Funds available (Rs. Billion)
Internal Funds 2014 15.32 Less: blocked for pensions 0.50 Available for Investments 2014 14.83 Equity and Borrowing Capacity 64.81 Available funds plus Borrowing Capacity 79.63
Source: Summary Tables from Rotterdam Volume 2, 2007 report.
Mumbai (and Chennai) are opting for major container port development. Absolute priority
should be given to direct hinterland connections taking into account autonomous traffic
growth in these metropoles. Source: Co-ordination of Business Plans Major Ports of India
Volume 2, 2007.
Comment: The timing and level of investment required at the Mumbai and JNPT gateway ports
will increase in line with projected future demand increases. Large increases in funding will be

51
needed around five to ten years ahead of increased demand. The funds available for port development
would be greatly depleted if the ports were to contribute to/take equity in the improved rail
networks/services (as consultants suggested). So additional funding levels and sources would be
needed to allow this to happen.
What improvements are needed in policy and regulatory frameworks, institutional
arrangements and funding and financing approaches (equity, user charges etc.) to provide the
organisational structures and operational flexibility required to meet anticipated infrastructure
planning and investment needs?
Tariff setting
During the course of programme review, it was recognised that the on-going practice of
inviting bids on the basis of revenue share was not compatible with the “rate of return”
regulation based on “cost plus” approach and that the determination of tariffs on “cost plus”
basis did not provide the requisite incentives for improving efficiencies and reducing costs. It
was further recognised that the primary objective of the Port Trusts should not be the
maximisation of their rental revenues, as too much emphasis on this aspect would raise the
user charges to uneconomic levels. It was agreed that the aim should be to create adequate
capacity and promote competition so that efficient and reliable services are provided at
economic costs.
After extensive deliberations, it was recommended that the tariff structure for each project
should be determined prior to invitation of bids so as to enable the prospective bidders to
assess the potential revenue streams with greater predictability. Such an approach would also
eliminate the pitfalls associated with the “cost plus” structure. It was recommended that
tariffs could be based on the likely capital costs and operating expenses, assuming optimal
capacity utilisation and efficient functioning. An alternative could be to set tariffs at a level
equal to the average tariff at similar ports in the region. It was noted that the aberrations, if
any, in setting the tariffs upfront would get corrected in the competitive bid process. Such an
arrangement would not only ensure a transparent process of tariff determination but would
also eliminate the possibilities of regulatory capture. The recommendations of the Task
Force have since been considered and approved by the Committee on Infrastructure and the
tariffs are currently being set by the regulator prior to invitation of bids by the respective
Port Trusts for selection of Concessionaires.
Source: Tariff Setting for PPP projects in Major Ports, 2009.
Financial issues
Apart from a few Major Ports, the financial position of the Major Ports in general is good.
Observations:
Funds available for investments by ports: Over Rs. 200.00 billion in 2014; huge borrowing
capacity of over Rs. 400.00 billion in 2014.
Future pressure on tariffs due to competition: port tariffs are high due to the monopolistic
situation of the many ports. Tariffs will go down when competition gets stronger.

52
Pressure on revenue sharing in BOT contracts will take place due to competition. Revenue
shares are high due to monopolistic situation of the ports. Revenue shares will go down
when competition gets stronger.
Port development in India can be stimulated by lower costs and efficiency improvements,
i.e. by applying the landlord model.
Substantial investments in connectivity are needed and have an enormous positive effect on
the economic development of India. Ports can participate in these connectivity projects, for
instance, in the backbone concept.
TAMP-regulation is not stimulating efficiency.
Ports can also participate in other (private) ports when there is limited room for their own
expansion.
In particular, city-ports can think about expansion outside the city at alternate locations and
development of real estate at existing port.
Source: Tariff Setting for PPP projects in Major Ports, 2009.
The Adviser’s recommendations on the financial strategy to be followed are:
Decrease the tariffs in order to improve the competitive position and to benefit the port users
Decrease the revenue share in BOT contracts in order to attract terminal operators
Invest in port infrastructure according to the landlord port model, in order to decrease the
investment costs for the port operators, therewith making the port attractive for additional
operators as well (increase of competition). Terminal handling charges could then also be
lowered (beneficial for the port users)
Define and implement additional projects; especially in the period 2012-14.
Source: Tariff Setting for PPP projects in Major Ports, 2009.

53
Port organisation and institutional setting
For ports generally, the Rotterdam Report concluded:
The Consultants have all examined the situation with respect to the internal organisation of
the Port Trusts. The Adviser focused on the larger picture, which encompasses the relations
with the Ministry, the division of responsibilities and tasks between the Ministry and the Port
Trust, the necessary level of autonomy, and suggestions for a stronger involvement of the
private sector in the Indian ports.
The Adviser is of the opinion that a clear division of responsibilities and tasks, taking into
account an optimal (not maximum) level of autonomy, will form the foundation for the
future of the Major Ports in India. The present needs are:
There should be an incentive to more competition amongst the Major Ports
Delegation of powers and responsibilities
Autonomy in tariff setting and investing
Fast decision making process
Operational freedom
Professionalism
Port reform
There are five basic options for port reform. The following is recommended:
1. Improve port organisation. As Consultants have pointed out, there is ample room for
improvement.
2. Liberalisation: is already the case in JNPT and has worked out well. However, it is not
recommended for further activities. On the contrary, in case the port wants to pursue the
landlord model, the public container terminal would then be transferred to the private sector.
3. Commercialisation: delegation of powers and responsibilities from Ministry to ports. This is
the option where most benefits can be achieved. The shift to the landlord port management
model is the major activity to be undertaken, whereby the Port Trust will contract out
non-core business, port operations will be transferred to the private sector and whereby the
Port Trust will invest in infrastructure instead of the BOT operator in order to decrease costs
for port users. BOT’s should be avoided when sufficient funds are available.

54
4. Corporatisation: is a possible step after commercialisation, although less important. Ennore
is the only corporatised Major Port.
5. Privatisation aspects will take place when transferring to the landlord-management model
through the sale of superstructural assets. Another privatisation aspect could be the formation
of joint-ventures with private sector operators in the total transport chain to the hinterland.
Source: Co-ordination of Business Plans Major Ports of India, Volume 1 Main Report, 2007.
Corporatisation
The Port of Rotterdam Summary Report concluded:
Institutional setting: With liberalisation of economy, authorities have increasingly felt the
need to revisit the structure of India’s major sea ports to prepare them to meet changing
needs. Corporatisation of ports is one of the options being considered towards this end.
Corporatisation is seen as a major step forward which would lead to subsequent privatisation
or commercialisation of ports. Additionally, corporatisation is expected to result over time
in: functional autonomy, improved efficiency, faster decision-making and management
accountability.
The Government needs to come out with well-defined management contracts, put in place an
independent regulatory mechanism, and provide financial independence to the port
management, combined with accountability. But it should be noted that any initiative
towards corporatisation should have the full confidence and participation from all key
stakeholders; especially from the labour workforce which are in sizeable number at the major
ports.
Advantages of corporatisation: Disadvantages of corporatisation:
• independent tariff setting, • multiple reporting structures, • functional autonomy, • opposition from labour workforce, • governance standards as per Companies Act • loss of financial flexibility for concessional loans • improved efficiency, • faster decision-making, • flexibility to compete with private ports • management accountability Source: Co-ordination of Business Plans Major Ports of India, Volume 1 Main Report, 2007.
Action being taken
There has not been much movement on the issue of corporatisation, except for the possibility of
an Initial Public Issue (IPO) for disinvestment by Ennore (owned by the Government of India and
Chennai Port), which is the only corporatised major port. Rather, projects in PPP mode are being
undertaken by major ports. Minor ports like Mundhra are already corporatised.

55
What approaches and measures need to be taken to improve the involvement, co-operation and
co-ordination of stakeholders across the region, recognising the important contributions they
can make to meeting gateway objectives?
The following extract from the “Report on Reducing Dwell Time of Cargo in Ports”, 2007 gives
an indication of the importance of efficient and reliable gateway operations – and the wide range of
stakeholders who have an interest in seeing the port’s performance improved where possible:
All stakeholders to be benefited
Implementation of the recommendations is expected to benefit all stakeholders to a large extent
by way of reduction in transportation costs and also the country to sustain growth in the economy.
Given below are the benefits expected to accrue for the Nation and Stakeholders:
Nation
The reduction in dwell time will reduce the transportation cost of Indian goods. This, in turn,
will make Indian goods competitive in global markets. The image of an efficient maritime
infrastructure will enable the country to attract increased maritime trade, thereby improving
the nation’s share in the same.
Ports & terminals
Any reduction in dwell time will increase the capacity of ports and help in the optimization
of port capacity. This will enable the ports to utilise infrastructure in a better and more
efficient manner. Consequently, Turn Round Time for vessels will reduce, allowing ports to
attract and handle more vessels.
Importer/exporter
Reduction in dwell time will directly reduce the transit time for cargo. This will reduce both
transportation as well as inventory costs. Further, the timely delivery/receipt of goods to
clients will garner greater goodwill enabling the furtherance of business.
Source: Reducing Dwell Time of Cargo in Ports, Planning Commission, 2007.
More broadly, the Indian Government, like any national government, is responsible for
promoting the efficiency, safety, security and sustainability of all modes within the Indian transport
system. It has a crucial role in promoting India’s interests in international commerce, allowing India
to compete effectively in the global economy. The Indian Government also has important
transport-specific roles. It is responsible for the Port Trusts running (11 out of 12) Major ports on
which the Indian economy depends for its seaborne trade. It is also responsible for the major roads
and railways on which the ports depend for inland connections. The investments required to discharge
these responsibilities are considerable indeed.
Nevertheless, some important elements of the Indian ports system are owned and operated by
private operators. This applies increasingly in the case of the Mumbai gateway area where Mumbai
and JNPT ports are moving towards a landlord ports model with major terminals and new terminal
investments to be a private sector responsibility. In future, these two ports are likely to face increasing
competition from smaller ports, some of which will be privately developed or ports that have been
privatised.

56
Given the changes in prospect, clearly no one level of government is going to be fully responsible
for the India’s international gateways and the inland access via road, rail and intermodal networks that
is required.
No single level of government can unilaterally take the actions required to address all the
inter-connected issues that determine the success of a gateway port and its inland connections to the
widely spread hinterlands that the gateway port serves.
In future, co-ordinated action across all sectors and levels of government will be required. Given
the increased range of stakeholders, consideration needs to be given to a well adapted over-arching
policy framework and involvement of the stakeholders with the greatest interest in achieving the
changes needed.
How are “climate change”, “low carbon” and “green growth”-related policy objectives and
measures likely to affect the gateway/hub – and how can infrastructure investment best be
linked to “green growth” in particular?
In future, the Mumbai gateway will need to deal with international trade and transport
requirements not only for the local Mumbai population (large as that will become) but increasingly for
origins and destinations well outside the Mumbai area as well.
As outlined earlier, there will be large and sustained growth in demand in future years. Meeting
the anticipated demand will require a ramping up in traffic movements to, from and through the ports.
There are likely to be adverse impacts, in terms of noise, CO2 emissions, local pollution, traffic
congestion and other environmental consequences. These will be evident both locally in the vicinity of
the major ports and also on major trade corridors via all the major and key minor ports
With current policy interest in cutting CO2 emissions and promoting “Green Growth”, there will
also be expectations that action will be taken to ensure infrastructure makes an appropriate
contribution to the improved outcomes required.
Infrastructure contributions to “Green Growth”
Climate change, “low carbon” and “green growth”-related policy objectives are likely require a
focus on:
reducing fossil fuel energy consumption, lowering CO2 emissions
reducing pollution and noise impacts on local residents
reducing congestion and delays impacting on energy, pollution and transport efficiency
promoting the most environmentally friendly transport facilities and services, making best
use of the range of modal and inter-modal services available
adopting better standards where these are cost effective
promoting green taxes and economic instruments to achieve improved outcomes in these
areas

57
promoting the development of “green” infrastructure industries
encouraging users to adopt low carbon intensity practices and technology, when using the
infrastructure.
The environmental risks were highlighted recently by a chlorine gas leak from old consignments
in July 2010 at Mumbai Port. The operational risks were highlighted by an oil spill following the
collision of two ships near to Mumbai Port and JNPT in August 2010, which led to suspension of
vessel traffic for five days.
The new objectives are likely to impact on the action required in a number of important areas
e.g.:
Strategic planning for the massive increase in Indian port and transport infrastructure
capacity likely to be required beyond 2015, either within the existing Gateway area or at new
site(s) nearby able to make a significant contribution to meeting transport demand in the
medium to longer term.
The need to better protect local residents from the consequences of the development of
Mumbai gateway as one of the mega Indian Gateways.
The need for high quality inland rail connections to and from the Gateway area.
Even more broadly, the improved inland freight transport systems needed to move very large
increases in trade-related freight to and from the gateway ports (and airports) and between
major inland centres of economic activity.
Overall assessment
Conclusions
Global and regional increases in demographic and economic factors are expected to drive huge
increases in economic activity, trade and related transport requirements for India generally over the
period to 2030 and beyond. A significant share of the overall growth in port handling is expected to
occur at west coast ports.
The population of Mumbai is forecast to increase strongly over the period to 2030 and beyond,
i.e. 19 million (2007), 26.4 million (2025) and possibly 38 million (2050). The overall levels of
population and industry in the Mumbai gateway area and its hinterlands are likely to increase much
more. As a result, port and inland transport demand is likely to increase very substantially over the
next ten years – and even more so over the period to 2030 and 2050.
The economic and demographic outlook would be very positive for the Mumbai gateway area, if
the necessary maritime and inland transport services could be provided efficiently, and provided the
necessary trade and transport infrastructure could be developed and made available at the time
required.
In fact, the Mumbai Port can be expected to cater mainly to the growing demands of Mumbai
itself, the local hinterland of Mumbai and surrounding areas in Maharashtra. Its wider potential
opportunities seem likely to be limited by constraints related to its expansion and hinterland
connectivity. Port constraints are also expected to limit its ability to attract trans-shipment cargos.

58
JNPT also faces expansion constraints. Therefore the actual traffic at JNPT is also expected to be
limited by the overall handling capacity (under the current geographical and policy restrictions) at
JNPT. A realistic estimate of the overall capacity for JNPT (under the current geographical and policy
restrictions) is considered to be around 10.90 m TEUs by 2016-17 at 70% occupancy.
On the positive side, the Indian Government’s plans for new high capacity rail corridors between
Mumbai, Delhi and Kolkata could make a major contribution to inland rail freight transport in India.
Rail freight to and from Indian ports is likely to be improved considerably once rail freight services
are fully operational along the dedicated Mumbai/Delhi/Kolkata freight corridors. Other rail
improvements that free up capacity for freight transport capacity from the ports, particularly container
traffic to/from JNPT will also help.
In addition, there are structural and governance changes, such as landlord ports, competition in
port terminals and services and commercialisation and corporatisation of the two major ports, which
may be able to help improve the efficiency of the ports to international levels.
However, the combination of serious hinterland access constraints at Mumbai, the lack of well
developed implementation plans for port capacity beyond 2016-17 at JNPT and Mumbai’s limited
capacity to handle containerised traffic suggest that, in the medium term, there must be real doubts
about the capacity of the Mumbai Gateway Ports to continue to expand capacity as required to cater
for growing demand.
As a result, unless future rounds of strategic planning at the Mumbai gateway ports identify
feasible infrastructure solutions, it can be expected that increasing shares of overall growth in port
capacity and cargo will be accounted for elsewhere – most probably by “Minor Ports” and new private
sector ports.
The ports to the north of Mumbai Gateway, mainly in Gujarat, are likely to tap a larger share of
cargo bound for the hinterland of North India. Nearby also, the Minor ports Dighi, Revas and
Dharmatar appear to be well placed for expansion. These ports with shorter linkages to the Dedicated
Freight Corridor may benefit more in terms of incremental cargo.
The ports in South India are likely to get a larger share of the transshipment cargo, being closer to
the international maritime routes. For the Major ports, including the Mumbai Port and JNPT, the
capacity expansion and productivity improvement with its limited potential is likely to be realised
through PPP projects.

59
CHAPTER 7
FUNDING OF PORTS IN INDIA
Indian government policy framework
As outlined in Chapter 2, the ports sector in India is divided into “Major Ports” and “Non-Major
Ports” (minor) ports which are under the jurisdiction of Central Government and State Governments
respectively.
The legal framework governing the sector comprises the Indian Ports Act of 1908 and the Major
Port Trusts Act of 1963.
Major Ports which under Central jurisdiction are governed by policy and directives of the
Ministry of Shipping of the Government of India.
Minor Ports are under the State Governments’ jurisdiction and are governed by policy and
directives of respective State Governments’ nodal departments/agencies.
Major ports tariffs and business plans
A Tariff Authority for Major Ports (TAMP) has been constituted for regulating tariffs in major
ports and its functioning/role is being revised to ensure uniform and transparent norms relating to
fixing tariffs as well as prescribing quality of service for port authorities/terminal operators.
The Ministry of Shipping, Road Transport and Highways (MOSRTH) has recently formulated a
comprehensive National Maritime Development Programme (NMDP), which envisages various port
capacity improvements and hinterland connectivity projects across the 12 major ports over a ten-year
time frame. As part of the NMDP, MOSRTH has mandated that each of the twelve major ports should
develop a business plan that:
1. states a long-term vision for the port that builds on its core strengths;
2. establishes the goals to be achieved over the next seven years to satisfy this vision;
3. describes the strategy to be followed to achieve these goals;
4. provides a detailed plan of action to implement the strategy; and
5. identifies sources of financing for all proposed investments.
The Port business plan has also to provide the foundation for an annual planning process in order
to be able to adjust it regularly to changing circumstances. Implementation of the plan is to be
financed by private sector participation and internal Port Trust financial resources.
Port structures
The Government of India has adopted a “Landlord Port Model” but Port Trusts (authorities) still
operate terminals in competition with private operators. Since private participation in overall

60
investment has to have a major share, enabling a competitive environment that discourages
inefficiency is going to be critical in years to come.
Based on experience elsewhere, corporatisation of Port Trusts can be expected to provide better
accessibility to funds, create a board managed corporate entity and facilitate disinvestment.
Corporatisation of public ports in India has had mixed success to date. For example, Ennore, a
Major Port, has not done as well as private (minor) ports like Mundra and Pipavav. Where a particular
service does not generate a sufficient stream of revenue and is thus non-viable for total privatisation, a
joint venture route for attracting private investment and management expertise should be encouraged.
Source: Ministry of Finance report 2009, India.
Ennore Port’s plans for IPO
The only corporatised Major Port, the Ennore Port (a satellite port just outside the Chennai city) has two shareholders:
Government of India (68%) and Chennai Port Trust (32%). The Port has an Rs.16 billion capital expenditure programme over
the next five years, which includes building rail and road connectivity and deepening of approach channel to 20 metres for
handling capsize bulk carriers.
As the Port is a Mini – Ratna (Literally, “Mini Gem”) public sector undertaking (PSE) expected not to get a
government allocation of funds directly and rely on its own resources, the Port is exploring the option to float an Initial
Public Offer (IPO) for the expansion. The IPO would be in line with the Disinvestment Programme of the Government,
which seeks to raise Rs.400 billion through disinvestment. With the Ministry of Shipping planning to corporatise more ports
within its control, such a route may set the course for the rest of the Major ports.
Foreign investment
The Indian Government recently announced a series of measures to promote foreign investment
in the port sector as listed below (the Indian Ports Act, 1908, and the Major Ports Trust Act, 1963):
1. No approval required for foreign equity up to 51% in projects providing supporting services
to water transport, such as operation and maintenance of piers, loading and discharging of
vehicles.
2. Automatic approval for foreign equity up to 100% in construction and maintenance of ports
and harbours. However, if the total foreign equity investment exceeds $0.30 billion
(Rs.15 billion), the proposal will be referred to the Foreign Investment Promotion Board
(FIPB) of the Government of India.
3. Open tenders are to be invited for private sector participation on a Build-Operate-Transfer
(BOT) basis. Evaluation of bids will be based on the maximum licence period, which will
not exceed 30 years and at the end of the BOT period all assets will revert to the port in
accordance with the conditions of the agreement.
4. The Government has announced guidelines for private/foreign participation that permit
formation of a joint venture between major ports and foreign ports, between major ports and
minor ports, and between major ports and companies.

61
5. The measures are aimed at attracting new technology, fostering strategic alliances with
minor ports to create an optimal port infrastructure and enhancing private sector confidence
for funding of ports.
6. The guidelines permit the formation of a joint venture between:
a. a major port and foreign ports for the purposes of constructing new port facilities within
existing ports, improving productivity of existing ports, and development of new port;
b. a major port trust and a company or a consortium of companies where:
i. A company or a consortium of companies, selected through BOT bidding under the
guidelines of private sector participation alliances with a major port trust for
improving the viability of the scheme and/or to enhance the confidence of the private
sector.
ii. A company or a consortium of companies is selected under the scheme of
innovative/unsolicited proposals.
iii. Oil PSUs/a joint venture company of oil PSUs are/is selected for oil related port
facility as a port based industry.
Model Concession Agreement
One major development has been the new model concession agreement (MCA), which was
approved by the Union Government in January 2008. Under the new MCA, the port trust can now
directly approach the inter-ministerial Public Private Partnership Appraisal Committee (PPP-AC) for
final project approval without having to first acquire in principle approval. This will speed up the
process of inviting bids for new projects, as well as long pending port projects.
To provide a stable policy and regulatory framework, the existing model bid process including
the concessions agreements are being refined on the basis of the experiences gathered from the
existing PPP projects.
Private public partnerships in port sector development did not take off as expected during the
Tenth Plan (2002-2007). Policy initiatives need to be developed in respect of management control,
etc., to facilitate the formation of joint ventures.
In the case of non-major ports, the Government of India’s Viability Gap Funding (VGF) scheme
will have to be made compatible with the requirements and the operational imperatives of the sector so
as to enable the non-Major ports to access these funds.
Integrated approach to development of Major and Non-Major Ports
Maritime States Development Council (MSDC)
To have an integrated approach for the development of both Major and Non-Major Ports, the
Maritime States Development Council (MSDC) was constituted in May 1997 under the Chairmanship
of the Honorable Minister of Shipping. The Ministers in-charge of Ports in all Maritime States, Union
Territories of Puducherry, Andaman’s & Nicobar Administration, Daman & Diu and Lakshadweep are

62
its members. The deliberations and decisions of the MSDC provide the institutional framework for
co-ordinated development of Major and Non-Major Ports.
Source: Ministry of Finance Report 2009, India.
4. Port policy in Maritime States: examples
Examples of port policy are provided below for two maritime states: a. Gujarat and
b. Maharashtra
a. Gujarat State
Gujarat State is endowed with 1 215 km length of coastline that constitutes about one-sixth of the
total Indian coastline. Out of 41 ports located along its coastline, 40 are non-major ports while one
port, viz. Kandla, is a major port. Presently, 20 non-major ports in the state are handling cargo.
The overall growth in port cargo traffic in case of Gujarat was 5.9% during 2008-09 compared to
2% for overall cargo growth for India, reflecting its larger share of cargo bound for the hinterland of
the Northern India.
Objectives of integrated port policy
1. To increase Gujarat’s share in the export and import sectors in national and international
trade and commerce in pursuance of the policy of liberalisation and globalisation.
2. To reduce the burden on existing major ports on the western coast of India.
3. To provide port facilities to promote export oriented and port based industries which are
estimated to contribute 50% of the total industrial investment in Gujurat.
4. To attract private investment for the development of minor ports, BOOT framework has
been envisaged to provide:
a. Timelines of infrastructure creation,
b. Efficiency of operation and operational autonomy to the private sector,
c. Synchronization with hinterland development.
d. Government’s role to be maintained only in appropriate areas, and
e. Government financial liabilities to be kept to a minimum.
The development of a large number of minor ports in Gujarat attests to the efficacy of its Port
Policy.

63
b. Maharashtra State
Policy initiatives for port development
1. Development on BOOST basis. Developer’s selection on MOU basis or by tender if many
investors interested.
2. Concession period of 50 years.
3. Concessional wharfage.
4. Government land on lease, if available, at market valuation.
5. Equity participation by Government/MMB up to a maximum of 11% Road linkage to nearest
State Highway to be part funded by the State and rail connectivity by Developer.
6. Freedom to fix tariff
Policy guidelines for captive terminals
1. Land and site for jetty will be leased out for a period of 30 years
2. Development on Build, Operate & transfer (BOT) basis
3. No berthing dues from vessels calling at captive jetty
4. Wharfage charges as per the prescribed rates notified by the State Government
5. At the end of 30 years, the jetty, superstructure and facilities on jetty will revert back to
Maharashtra Maritime Board (MMB).
Source: Ministry of Finance Report 2009, India.
The states of Maharashtra, Karnataka and Andhra Pradesh have also seen development of a
number of captive and merchant ports, while others are following suit.
Investment
During the Tenth Plan (2002-2007) only about 4.86% of the fund allocation was utilised. The
acute shortfall particularly for Major Ports was due to failure of project formulation which delayed
implementation.

64
Eleventh Plan (2007-12)
The Approach Paper to the Eleventh Five Year Plan (2007-2012): “Towards Faster and More
Inclusive Growth (November, 2006)” by the Planning Commission proposed an annual average
growth target of 9% in terms of GDP for the Eleventh Plan and laid emphasis on following aspects for
the Port Sector.
1. to develop ports and related infrastructure to bring them to international standards in
turnaround time and cleaning of import and export cargos;
2. substantial capacity augmentation at major and minor ports;
3. a deep sea port to be developed and drafts of existing ports be deepened, where feasible,
through capital dredging;
4. bulk of capacity augmentation would be undertaken through public private partnership and
captive users; and
5. rail road connectivity of ports with the hinterlands to be improved on priority basis.
Projected investments into ports as per Eleventh Plan
Private sector participation in the Port Sector has gained momentum under the Eleventh Plan. So
far the Government has approved 25 private sector/captive investments during the last ten years for
Major Ports worth Rs. 115.82 billion with a capacity addition of 192 MTPA. Most on-going projects
are being implemented on a BoT basis under PPP mode. The actual capacity addition through private
participation has been 102.3 MTPA. The Government is planning to launch ten major expansion
projects which will add a capacity of 44 MTPA.
Figure 7.1. Investment forecast in 11th plan
Source: Ministry of Finance, India.

65
Under the National Maritime Development Programme, most of the major ports have formulated
their projects with the fund requirements and funding patterns under the five broad heads of
development process as:
1. Projects related to Port Development (construction of jetties berths etc.)
2. Procurement, Replacement or Upgrade of Port Equipment
3. Deepening of Channels for Improvements in Drafts
4. Projects related to Port Connectivity
5. Other related schemes
The Investments envisaged for the above projects are estimated at Rs. 530 billion, out of which
Rs. 35 billion is expected through Budgetary Support, Rs. 135 billion through Ports’ own Internal
Resources, Rs. 330 billion is likely to come from the Private sector and Rs. 30 billion from other
sources, which include investment by Ministry of Railway, NHAI (the Highway Authority), etc.
Source: Ministry of Finance Report 2009, India.
Two major government projects are under consideration:
Project “Sethusamundram”: This project is aimed at shortening the route between east coast
and west coast of India by dredging of the Palk Strait in Southern India. This would also
benefit the ports on Western coast, as trade route to Far East can be also shortened
considerably.
Project “Sagarmala”: US$22 billion project for the modernisation of major and minor ports
to boost coastal shipping and a long term view to de-congestion of roads, which would not
only reduce transport costs, but also reduce the consumption of fuels, contributing to
country’s cause towards environment.
Source: Indian Ports Association.
PPP frameworks/initiatives
The PPP process in Indian ports evolved from an unstructured regime in 2000 to a more
organised and predictable regime in 2007. The Model Concessions Agreement (MCA) was developed
after a rigorous consultative process. It serves both as a guideline and a template document for drafting
concession agreements, and has been one of the key milestones in the privatisation process. Many
major ports have drafted their individual concession agreements based on provisions of the MCA,
which are suitably modified to specific conditions.
Private Sector Participation in PPPs
The bulk of capacity augmentation in future is likely to be undertaken by way of PPPs and
captive users. New berths at major ports are likely to be constructed on PPP mode, except where
operational exigencies necessitate taking up development of new berths using the ports’ own
resources. In addition to areas already identified, possibilities for investment in maintenance, dredging
operations and pilotage are expected to be explored during the Eleventh Plan period.

66
Tariff regulation
One important development in the PPP process taken at the initiative of the tariff regulator – the
Tariff Authority for Major Ports (TAMP) – was to evolve and implement guidelines for upfront tariff
setting for PPP projects at major ports. In the previous regimes, ceiling tariffs were revised from time
to time based on terminal performance. The new guidelines fix ceiling tariffs right at the beginning of
the bid process and these are provided with the bid documents. The guidelines are applicable to all
major ports PPP projects awarded after February 2008, while existing terminals will continue to
follow the previous regimes as may be applicable.
In the new regime, standard norms are prescribed for determining the investment and operational
efficiency of the project. Target revenue is then calculated as the sum of operating cost, depreciation
and an allowable return on capital employed. Target revenue is then categorised into revenue from
various services based on estimated demand for each service. These ceiling tariffs are indexed to WPI
and escalated year on year, thereby removing the effects of varying demand on tariffs (as used to
happen in the previous regime during tariff revisions).
Though the new regime is successful in removing uncertainties from a bidding perspective, the
Indian experts consulted consider certain gaps still exist in the following aspects and have provided
the following comments and suggestions:
1. Estimation of Capital Cost: The tariff-setting methodology ignores cost of any reinvestment
that is undertaken by the operator. This might prevent the operator from earning the desired
return on capital employed in the period when such investment is incurred.
2. Estimation of Cost of Capital/Return on Capital Employed: TAMP currently uses a fixed
16% ROCE for setting ceiling Tariffs. It however does not incorporate any capital structure
assumptions and hence removes all financing incentives for the promoters. As is the case
with power sector, it would be desirable to use normative estimates for financing and then
determine the allowable return on capital employed.
3. Taxes and Depreciation: The methodology also ignores tax which is a real cost to the
operator. The target revenue requirement or the allowable return needs to be adequately
grossed up to capture the effect of taxes. The method of depreciation to be used by the
regulator in arriving at the tariffs is also left ambiguous. The choice of written down value
method against a straight line method could cause a huge difference in point tariff
estimations.
4. Demand Variations and operating efficiencies: While the Tariff guidelines reckon on 70%
of capacity as throughput, they do not explicitly specify the validity of Tariffs to this
throughput. For instance, the operator could be exposed to inadequate returns during times of
extreme demand variations (for example, during the recent economic downturn where traffic
across some ports have fallen significantly). It might be beneficial to specify the throughput
(or a range of throughput) at which the ceiling tariffs are valid and provide subsidies or
offsets to compensate for any unexpected volatility in traffic. Further, the operator is not
rewarded for any operational efficiencies or improvement in service quality parameters like
speed of evacuation etc. Tariff validity at a given performance standard could be specified
with Tariffs revised to reflect any operational efficiencies.
5. Concurrence with the Concession Agreement Provisions: There exists some disconnect in
the provisions of the MCA and TAMP guidelines. For instance, Change in Law provisions

67
exclude tariff changes. It should be noted that in case of an adverse change in law such as an
increase in taxes, it is not possible for the operator to pass on the additional costs by charging
higher tariffs from the user which is the case with normal business environment. It may be
desirable to specify certain basic assumptions/conditions related to taxes under which the
Tariffs are valid and revise the Tariffs or compensate the user for adverse changes to these
basic assumptions. Other issues that would affect the pricing decisions of the operator could
include clauses including minimum guaranteed cargo, input controls (mandated investment
to a specific capacity much before it is used) etc. While these are tariff-related problems,
these may not be directly addressable by the tariff regulator since they are designed to be
independent of the contracting entities (Port Authority and the Terminal Operator).
6. Disparity and Multitude of Tariff Regimes: Today there are nearly three Tariff regimes
which are currently effective (February 1998, March 2005 and the new guidelines of
February 2008). Terminals in close proximity can be governed by different provisions and
tariff philosophies that affect their ability to compete with each other. It is quite possible that
one terminal has a declining ceiling-tariff profile as it is operating on depreciated assets
while the other has an escalating ceiling-tariff profile under the new regime. Such conflicting
tariff behaviors could leave both the operators with pricing uncertainties. Further, the latter
may be forced to give heavy discounts to match the lower tariff, adversely affecting his
expected return as revenue share is computed based on ceiling tariffs and not actual tariffs.
This problem is further complicated by the existence of “minor ports”, which have come up
in the vicinity of major ports with huge capacity. However, as entities outside TAMP
purview, such ports completely escape tariff regulation.
In summary, the PPP and tariff methodology has shown considerable movement over recent
years. Consideration needs to be given to its further evolution which could include the following:
1. The definition of the problem should combine tariff and service quality, and ensure that the
customers at port terminals pay as per the service quality received. Currently, the
methodology is heavily supply-focused whereas the landed and opportunity costs for the
consumer and alternatives available to them will provide a better view on what charges can
be levied at any particular terminal.
2. Tariff regulation should follow a cluster-based approach rather than a port-based approach.
This would give a better view on the competition that exists in each cluster. The tariff
methodology needs to be uniform with a particular cluster allowing the terminals to compete
on an even ground purely based on attractiveness to the customer and the ability to price for
it.
Funding of infrastructure
India had its own development finance institutions till the nineties, viz., IDBI, IFCI
(government-owned) and ICICI (private sector), which raised finance from line of credit from the
central bank (Reserve Bank of India) and long-term bonds. However, conversion of IDBI and ICICI
into commercial banks left a void in the area of infrastructure finance. Banks have not been able to
participate to the required extent in infrastructure finance, because of asset-liability mismatch.
Though India has a well-developed government securities market for tenures up to ten years,
there is a dearth of long-term corporate instruments with matching tenures to finance infrastructure.
Some new institutions, like IDFC, IIFCL, IL & FS, Power Finance Corporation, L & T Infrastructure

68
Finance, Rural Electrification Corporation have been operating in infrastructure advisory and finance,
but the requirement is much more. There is no specialised institution for port financing.
Recently, the Government and RBI introduced a new category of non-banking finance companies
(NBFCs), i.e. Infrastructure Finance companies (IFCs), which can raise long-term bonds with tax
exemptions. IFCs are allowed to raise external commercial borrowings (ECBs) up to 50% of their net
worth through an automatic route and raise funds through tax free infrastructure bonds.
India’s rank out of 139 countries in infrastructure is 86 (WEF 2010-11 index). The 12th Plan
(2012-17) Government target for investment in infrastructure has been placed at Rs. 1 trillion, to
support the anticipated 9% p.a. growth. The Finance Minister had told the Parliamentary Committee
that there could be a 30% shortfall in funds needed for developing infrastructure. He also said that the
capacity of banks to fund infrastructure projects was limited, and new sources such as insurance and
pension funds need to be tapped for deployment in infrastructure projects. Banks are likely to face a
sizable Asset Liability mismatch in funding such projects (with gestation of ten years or more) as the
maturity of bank deposits mostly ranges from three to five years.
Infrastructure Debt Funds are one option being explored, which the regulatory bodies are working
on, i.e. SEBI on framework for registering these funds and RBI on capital adequacy norms, while
insurance and pension fund regulators would have to allow a flow of funds from such domestic entities
to these debt funds.
Foreign funds can presently register as venture funds and provide equity to the infrastructure
sector, but there is no such mechanism for intermediating debt funds. The funds, when permitted, are
expected to be two-layered – domestic and offshore. The offshore entity may raise funds from
overseas investors, including pension and insurance funds, and then direct them to the entity in India
for down-stream investment, within an overall External Commercial Borrowing (ECB) cap. However,
experts argue that some kind of credit enhancement mechanism would be needed for these funds to
enable them to pierce the sovereign rating.
Funding sources in India for PPPs
With the ambitious aim of funding the most commercially viable infrastructure projects to extend
access of roads, safe drinking water, electricity, sanitation, and other basic amenities to the people in
mass in India, a few organisations came in to existence or started their amenities in these fields. The
details mentioned below are some of the sources available in India.
IIFCL
IIFCL was established by the government of India as a Special Purpose Vehicle in January 2006
and it started its operations from April 2006. To bring the objectives of the Public Private Partnership
(PPP) in to effect, IIFCL allows long term debt through lead banks as total project cost to a project
company, which can be a public sector company or a private sector company selected under PPP
initiative. It has also announced a scheme for take-out financing to support infrastructure projects
financed by banks.
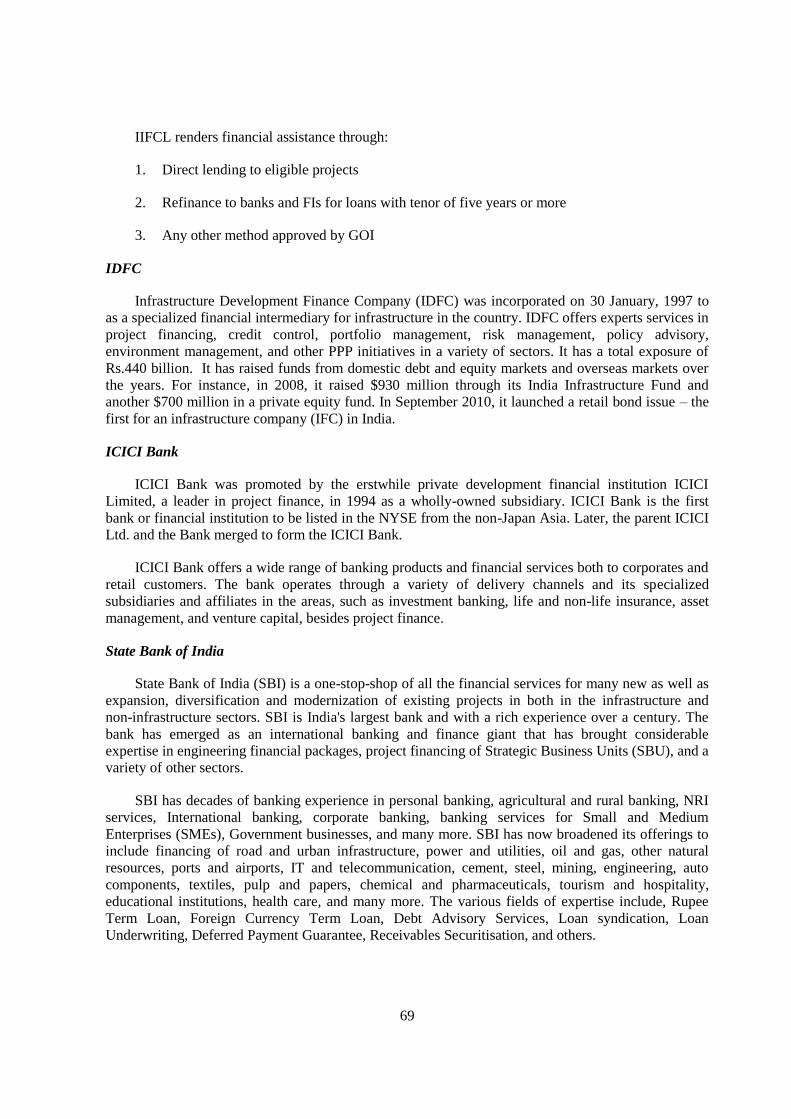
69
IIFCL renders financial assistance through:
1. Direct lending to eligible projects
2. Refinance to banks and FIs for loans with tenor of five years or more
3. Any other method approved by GOI
IDFC
Infrastructure Development Finance Company (IDFC) was incorporated on 30 January, 1997 to
as a specialized financial intermediary for infrastructure in the country. IDFC offers experts services in
project financing, credit control, portfolio management, risk management, policy advisory,
environment management, and other PPP initiatives in a variety of sectors. It has a total exposure of
Rs.440 billion. It has raised funds from domestic debt and equity markets and overseas markets over
the years. For instance, in 2008, it raised $930 million through its India Infrastructure Fund and
another $700 million in a private equity fund. In September 2010, it launched a retail bond issue – the
first for an infrastructure company (IFC) in India.
ICICI Bank
ICICI Bank was promoted by the erstwhile private development financial institution ICICI
Limited, a leader in project finance, in 1994 as a wholly-owned subsidiary. ICICI Bank is the first
bank or financial institution to be listed in the NYSE from the non-Japan Asia. Later, the parent ICICI
Ltd. and the Bank merged to form the ICICI Bank.
ICICI Bank offers a wide range of banking products and financial services both to corporates and
retail customers. The bank operates through a variety of delivery channels and its specialized
subsidiaries and affiliates in the areas, such as investment banking, life and non-life insurance, asset
management, and venture capital, besides project finance.
State Bank of India
State Bank of India (SBI) is a one-stop-shop of all the financial services for many new as well as
expansion, diversification and modernization of existing projects in both in the infrastructure and
non-infrastructure sectors. SBI is India's largest bank and with a rich experience over a century. The
bank has emerged as an international banking and finance giant that has brought considerable
expertise in engineering financial packages, project financing of Strategic Business Units (SBU), and a
variety of other sectors.
SBI has decades of banking experience in personal banking, agricultural and rural banking, NRI
services, International banking, corporate banking, banking services for Small and Medium
Enterprises (SMEs), Government businesses, and many more. SBI has now broadened its offerings to
include financing of road and urban infrastructure, power and utilities, oil and gas, other natural
resources, ports and airports, IT and telecommunication, cement, steel, mining, engineering, auto
components, textiles, pulp and papers, chemical and pharmaceuticals, tourism and hospitality,
educational institutions, health care, and many more. The various fields of expertise include, Rupee
Term Loan, Foreign Currency Term Loan, Debt Advisory Services, Loan syndication, Loan
Underwriting, Deferred Payment Guarantee, Receivables Securitisation, and others.

70
Infrastructure Leasing and Financial Services Limited (IL&FS)
Infrastructure Leasing & Financial Services Limited (IL&FS), one of the leading infrastructure
development and finance companies in India, was established with a view to catalysing the
development of infrastructure in the country. IL&FS was promoted by financial institutions and banks
like the Central Bank of India (CBI), Housing Development Finance Corporation Limited (HDFC) and
Unit Trust of India (UTI). The prime focus of the organisation has been on the commercialisation and
development of infrastructure projects and creation of value added financial services.
IL&FS is actively involved in providing a wide array of services necessary for successful project
completion: visioning, documentation, finance, development, management, technology and execution,
every aspect of the project management, from concept to execution. Some of the core competencies of
the organisation include Project Development, Project Implementation, Cluster Development,
Environment & Social, Education, Technology Projects, Logistics and Fleet Management, Facility
Management. In the port sector, IL&FS has been participating as a financier and promoter, for
instance, the Dighi port on the Western Coast.
L & T Infrastructure Finance Company
This is a finance company related to one of the biggest engineering companies in India, L & T. A
new entrant, it has already achieved a balance sheet size of Rs.120 billion. It plans to raise long term
bonds of ten year tenure up to Rs. 5 billion.
Potential international investors
Indian infrastructure including port projects has also been eliciting interest from international
financial sources. Given below are two such instances – multilateral institutions and private equity.
The International Finance Corporation (IFC) recently announced that it will double its
investments in Indian infrastructure to $1.1 billion. The IFC is the World Bank subsidiary that serves
to support private-sector investment. The argument is to help to sustain India’s rapid economic
growth, which depends on better infrastructure. In emerging economies – and in particular in the so-
called BRIC countries (Brazil, Russia, India and China) – the IFC is also boosting its advisory
services, in an attempt to help governments to create an appropriate investment environment. The IFC
board had approved a facility of up to $15 million to provide advice to Indian governments on
infrastructure.
The IFC does not compete with private-sector companies, but rather mobilises funds in their
support. In this respect, the IFC approach is typical of recent donor policy. The IFC does normally
shoulder only five to ten per cent of the financing burden of any single project. However, once the IFC
structures a project, reaches an agreement with the government concerned and prepares a feasibility
study, private-sector participants tend to come on board. The IFC promotes partnership. In India it has
reached an agreement with the governments of two important states (Andhra Pradesh and Maharastra)
to develop frameworks for public-private partnerships (PPP) and joint ventures in infrastructure.
The 3i Group, a private-equity firm based in the UK, provides an example of private-sector
interest in Indian infrastructure. The Financial Times (April 2008) reported that 3i believes that the
opportunities for investing in infrastructure are probably greater in India than anywhere else in the
world. The group has set up one of the largest Indian infrastructure funds, which has raised around
$1.2 biIlion.

71
Sixteen institutional investors from Europe, Asia, the Middle East and the US, including pension
funds, endowments and sovereign-wealth funds have pooled money in this fund. 3i itself contributed
$500 million. The 3i fund has teamed up in a partnership with the state-run India Infrastructure
Finance Corporation (IIFC), which has been selected to invest the country’s increased foreign
exchange reserves in infrastructure projects. Using leverage, it is expected that the 3i fund will be able
to undertake investments worth $5 billion.
Source: Financial Times – April 2008.
India’s overall investment needs and timings
In relation to India’s overall growth and timings, on a number of measures (such as GDP growth,
regulatory reform, liberalisation as well as traffic growth), India is following a growth pattern similar
to that followed by China, and seems to be on a similar trajectory, around 15-20 years behind China.
China began investing heavily in its road and rail systems around 2000 (i.e. about ten years ago).
China invested more in roads initially. Since around 2005, when it embarked seriously on an
ambitious plan for the rail network to be achieved by 2020, it has been focussing increasingly on
railways. In 2009-2010, China provided huge rail funding as part of its stimulus package and has since
accelerated future rail investment to unprecedented levels, bringing forward planned investments in
both freight and passenger rail.
In China’s case, rail freight services have benefitted significantly from the development of the
vast high speed rail system being built for passengers – which is using a purpose built network that
will free up capacity for rail freight operations.
By 2010, China had expanded its main ports considerably and completed the first stage of the
Yangshan deep water port south of Shanghai to circumvent growth limitations on the Port of
Shanghai.
Although the timings and examples are only indicative, if India continues to follow China’s lead,
India’s investments in Mumbai and JNTP and other ports in the vicinity of the Mumbai gateway area
ports – as well as in their rail and road connections inland (e.g. to the Mumbai region and to the
hinterlands beyond) – are only just beginning.

72
Table 7.1. Some present project cases in funding of ports
FUNDING CASES FOR INDIAN PORTS All figures in Rs billion
Port/Port Projects in PPP Project Cost Means of Funding
South West Ports Ltd. Equity from Equity
Equity-Preference Shares Bank Loan D:E
Essar Bulk Terminal 7.38 Promoters 2.22 5.16 2.33:1
Essar Bulk Terminal (Salaya) Limited 8.64 Promoters 2.59 6.05 2.33:1
JSW Jaigarh port 6.77 Promoters 1.77 5.00 2.82:1
Dighi port
10.39 Balaji Group – 69% 3.12 7.27 2.33:1
Maharashtra Maritime Board – 11%
IL&FS – 20% (Strategic Investor & Co-developer)
Indira Container Terminal Pvt. Ltd. 10.16 Promoters 2.03 8.13 4 ;1
Vadinar Port and Terminal Ltd. 9.29 Promoters 2.79 6.50 2.33:1
Source: Compiled by Overseas Infrastructure Alliance (OIA) from project companies, various newspaper reports and credit rating reports.

73
CHAPTER 8
OPPORTUNITIES FOR INDIA’S MAJOR AND “NON-MAJOR” PORTS
Overview
Based on recent information available and reports, the Indian government is aiming to triple the
port capacity at the major ports in the next ten years. While India’s economy is strong – being the third
largest in all of Asia – the country has reached a critical point where it must expand its infrastructure
to keep up with its economic output.
Major ports
Current projections estimate that by the year 2020, Indian major ports will process more than
2.5 billion tons of cargo per year. The increase in containerised trade coupled with the Government’s
active initiatives to develop the Indian ports sector, is expected to further boost the growth. The
commissioning of power projects based on imported coal and the setting up of steel projects and
offshore exploration and production projects are likely to drive the growth of the Indian ports sector.
Minor (non-major) ports
About 45 non-major ports are fully active and operational. These are in Gujarat (21), Maharashtra
(eight), Tamil Nadu (nine), Karnataka (three), Andhra Pradesh (two), Orissa (one), and Goa (one). The
rest are selectively operational and cater to local cargo requirements, passenger ferrying, and fishing
operations.
A few of the non-major ports have been developed as relatively large ports (Mundra and Pipavav)
through private sector participation and attract a fair amount of cargo. These are comparatively newer
ports with modern facilities and smaller, better-trained workforces, and thus score high on efficiency
parameters.
There is an increased emphasis on development of minor ports by state government authorities
through private participation. Source: Indian ports association.
Trends in cargo handling
The 12 major ports together had a capacity of 215 million tonnes at 1997-98 levels. During 2001,
the total cargo handled at the 12 major ports was 287.56 million tonnes. Over the decade since, there
has been significant growth in cargo needing handling which in 2009 totalled 740 million tonnes.
The Indian ports sector is poised for significant growth driven by new manufacturing and power
projects and higher cargo traffic at ports.
In future, traffic at major ports is expected to grow at a compound annual growth rate (CAGR) of
7.6 per cent from 2010 to 2015.

74
The traffic for total ports in India (i.e. 12 major ports and 66 operational minor ports) was worth
740.3 million tons (MT) in 2009 and this is expected to rise to 1 373.1 MT in 2015. (Source: Indian
ports association.)
Draft limitations
However, several major ports lack sufficient draft for large crude tankers. Large vessels are
berthed at Colombo, Singapore, or Dubai, and cargo is shipped to India later in smaller vessels,
thereby escalating the freight cost. Additionally, all leading ports such as Mumbai, Jawaharlal Nehru
Port Trust (JNPT), Visakhapatnam, and Mormugao handled more cargo than their designed capacities,
further contributing to congestion and resulting in a longer turnaround time.
Inland connections
Weak hinterland connectivity is a challenge for most Indian ports, reducing accessibility.
Port performance
Although the ports in India have shown considerable improvement over the years, benchmarking
them against the ports in Hong Kong, Los Angeles, and Rotterdam reveals that there needs to be
marked improvement in many parameters to get Indian ports at par with international standards.
The performance of Indian ports does not compare favourably with that of efficient international
ports. On three important parameters – capacity, productivity and efficiency, Indian ports lack in
comparison to most of the major international ports. Against international benchmarks, labour and
equipment productivity levels are still very low due inter alia to the outdated equipment, poor training,
low equipment handling levels by labour, uneconomic labour practices, idle time at berth, and time
loss at shift change.
Capacity
Though the bulk of Indian trade is carried by sea routes, the existing port infrastructure is
insufficient to handle trade flows effectively. The current capacity at the major ports is overstretched.
The situation of limited capacity and high demand has inevitably resulted in port congestion. This
results in overstretched berths leading to pre-berthing delays and longer ship turnaround time. In
recent years, major investments in port construction have centred on container as well as bulk
facilities. Modern equipment has been added for container and bulk handling. The equipment-mix for
handling general cargo has to be planned and provided in a manner that suits the needs of each port.
In order to handle the increase in the sea-borne traffic on account of increase in foreign and
coastal trade, major expansion is required in the port infrastructure sector in the country and this will
need mobilisation of substantial resources. Hence, the opening up of the major and minor port sector
for privatisation has been under way.
Infrastructure investment
The Indian Government prioritized the expansion and modernization of ports as part of its five-
year plan (2007-12) initiatives in 2007. It has been instrumental in redefining the role of ports from
mere trade gateways to integral parts of the global and logistics chain. The Committee of
Infrastructure constituted a Committee of Secretaries to recommend time-bound identification and

75
complete connectivity projects to successfully address issues regarding port connectivity. Several
projects are under way for the deepening of drafts at major ports as a part of the national maritime
development programme.
Despite investments from the private sector that are encouraging the modernization and
development of ports, infrastructure continues to be a major issue.
Liberalisation and private sector participation
In keeping with the Government of India’s general policy aimed at liberalisation and
globalisation of economy, the Port sector has been opened increasingly to private sector participation.
There is no legal bar to private sector participation in port operational facilities as per the provisions of
the existing Major Port Trusts Act, 1963.
The government has been promoting public-private participation in the ports sector on a build-
operate-transfer (BOT) basis, thereby stepping-up capacities and traffic handling at ports, besides
enhancing their efficiency – while anticipating a transfer to government ownership in the longer term.
It is expected that privatisation will improve the efficiency, productivity and quality of services
and bring competitiveness in port services – and help bring in the latest technology and improved
management techniques.
The Government will reportedly sell port stakes and open new harbours in an effort to push
annual capacity of the major ports to 3.2 billion tons. There are also plans on the anvil to increase
building of other modes of transportation, like highways, railways, and airports. However, the
emphasis clearly is expected to be upon improvement and efficient utilisation of sea transport.
Further, there are also plans by the Government to further privatise previously state-controlled
port logistics, which would undoubtedly open up more global and domestic investment opportunities
in India for the future. A recent forecast issued by the Indian Shipping Ministry aims to augment the
country's overall port capacity from the current one billion tons to 3.5 billion tons over the next ten
years.
Potential private sector investments
Major public-private-partnership projects that could be in the pipeline include a fourth container
terminal at the Port of Nhava Sheva (Jawaharlal Nehru Port Trust or JNPT), the country's largest
container gateway, and a four-million-TEU deep-water facility at Chennai, and similar mega terminals
in Vallarpadam and Ennore – which would benefit logistics businesses. (Source: Indian ports
association.)
Case Studies of a major and a minor port
Case Studies of Tuticorin (one of India’s Major Ports) and Mundra Port (one of India’s non-
major ports) have been prepared by the Overseas Infrastructure Alliance (OIA) Working Group, to
provide greater insights on the current position of a large and a smaller ports – as well as on the
considerable opportunities (and challenges) they are both facing. These are set out in the Attachments,
following the conclusions below.

76
Conclusions
In the longer term, India’s Major Ports are likely to experience large increases in demand for port
cargo handling. Many of them will also experience difficulties in handling, clearing and dispatching
cargos due in part to congestion, both on the ports and also along trade and transport corridors,
including through the cities where they are located. They may face the risks of increasing pressures for
alternate uses of their real estate, environmental risks related to proximity and impacts on urban
neighbourhoods. Major Ports are also likely to be affected by the prospects of future changes in
regulatory arrangements, including tariff setting and the future effects of efficiency disadvantages.
One of their greatest challenges is likely to be the prospects of reducing roles of government in the
financing of port investments and port operations.
Taking into account the challenges that the Major Ports are likely to face, it can be expected that
the growth in capacities and cargo over the longer-term, i.e. between 2020 and 2050, could take place
increasingly at what are currently regarded as the “Minor Ports”.
The ports to the north of Mumbai Gateway, mainly in Gujarat, are likely to tap a larger share of
cargo bound for the hinterland of North India. Nearby also, the minor ports Dighi, Revas and
Dharmatar are better placed for expansion. These ports with shorter linkages to the Dedicated Freight
Corridor may benefit more in terms of incremental cargo. The ports in South India are likely to get a
larger share of the trans-shipment cargo, being closer to the international maritime routes. For the
major ports, including the Mumbai Port and JNPT, the capacity expansion and productivity
improvement with its limited potential is likely to be realised through PPP projects.

77
ANNEX A
STUDY ON A MAJOR PORT – TUTICORIN
Tuticorin
Among the Indian major ports, Tuticorin has a long maritime history and also is one of the
flourishing ports in recent times. It is well connected to various trade and production centres within
Tamil Nadu and the neighbouring states via road, rail, water and air. In and around Tuticorin city, the
major salt producers in the state are located and contribute 30 per cent of the total salt production in
Tamil Nadu. The main occupation of the Tuticorin district is agriculture and allied activities. A
majority (70 per cent) of people depends upon agricultural activities for their livelihood. But the recent
boom in the new industries like Sterlite (metals), South Indian Petrochemical Industrial Corporation
(SPIC) Limited, Tuticorin Alkali Chemicals (TAC) and Fertilisers Limited, Heavy Water Plant
(HWP), port and related service and Tuticorin Thermal Power Station (TTPS) have put the district
prominently on the industrial map of the country. Hundreds of ancillary units have also sprung up.
Textile and matchbox are other important industries located in this district.
Cargo handled in Tuticorin Port
Tuticorin port trust handled about 23.8 MT during the year 2009-2010. Cargo for captive
industries constitutes about 50% of the overall traffic at Tuticorin. Some of the major captive
industries located in Tuticorin are Tuticorin Thermal power station, Southern petrochemicals
industries, Sterlite, Tuticorin Alkali chemicals, Kilburn chemicals and Dharangdhara chemical works.
They mainly consume thermal coal, copper concentrate, rock phosphate and sulphur.
Among the commodity-wise cargo movements in Tuticorin port, coal is the major item of import;
the main importers are TTPS and cement factories. At all-India level, ten per cent of coal cargo was
handled in Tuticorin port during 2007-08 and the port stood fourth among the major ports. The trade at
Tuticorin port can be best addressed by viewing the past imports and exports of the port.
Tuticorin is primarily an import oriented port, which constitutes about 75% of the traffic as
shown in the table below. Exports are mainly driven by the container market.
Table 8.A1.1. Vessel traffic in terms of tonnage at Tuticorin port for the year 2009 and 2010
Vessel traffic (in 000 tonnes)
Sr. No. Category Traffic
2008-2009 Traffic
2009-2010
1 Containers 6599 5482 2 POL 514 503 3 Iron Ore 41 - 4 Fertiliser 2291 1924 5 Coal 5813 5713 6 Other cargo 8729 8489
Source: Tuticorin Port Trust.

78
Figure 8.A1.1. Volumes of cargo handled in hundred thousand tonnes
Source: Tuticorin Port Trust.
Traffic handling and modes of transport in Tuticorin Port
Efficient transport linkage plays a crucial role in attracting more cargo in the port. Effective cargo
transportation to and from the port is a pre-requisite for port development and therefore, it is necessary
to identify and develop proper transport linkages with the port. Rail and road transport are the main
modes linking the Tuticorin port to various parts of Tamil Nadu and other Southern states of India.
Rail, road, pipeline, coastal shipping and conveyor are the important transportation systems utilised for
handling the cargo in the vicinity of the port.
During 2005-06, 4.9% of the total cargo moved through rail, 53% by road network, 6.2% via
pipelines and 35.9% by conveyors. The volume of cargo moved through the road has increased
tremendously by about 86% between 1997-98 and 2003-04, followed by rail and conveyor mode,
while the volume of the cargo by the pipeline has come down during the same period.
Port infrastructure
Tuticorin port is an artificial harbour with parallel breakwaters projecting into the sea. The
harbour is served by approach channel of 2.4 km length and 183 m width. The draught of approach
channel is 12.5 m. The harbour basin draught is 10.7 m with turning circle of 488 m. There are nine
berths for vessels up to 65 000 T Bulkers and dealing in break bulk and containers, out of which two
are termed shallow water berths. A dedicated jetty for oil with pipelines installed can serve tanker
ships up to 65 000 T DWT. Two coal jetties are also available. The cargo handling equipments include
electric wharf cranes from 6T to 20T on break bulk jetties, 100 T hopper and conveyors for both coal
jetties, and ship to shore crane for container terminal. The stowage facilities are being proposed for
enhancement, since Tuticorin port is built on breakwaters, there is not much back up area.
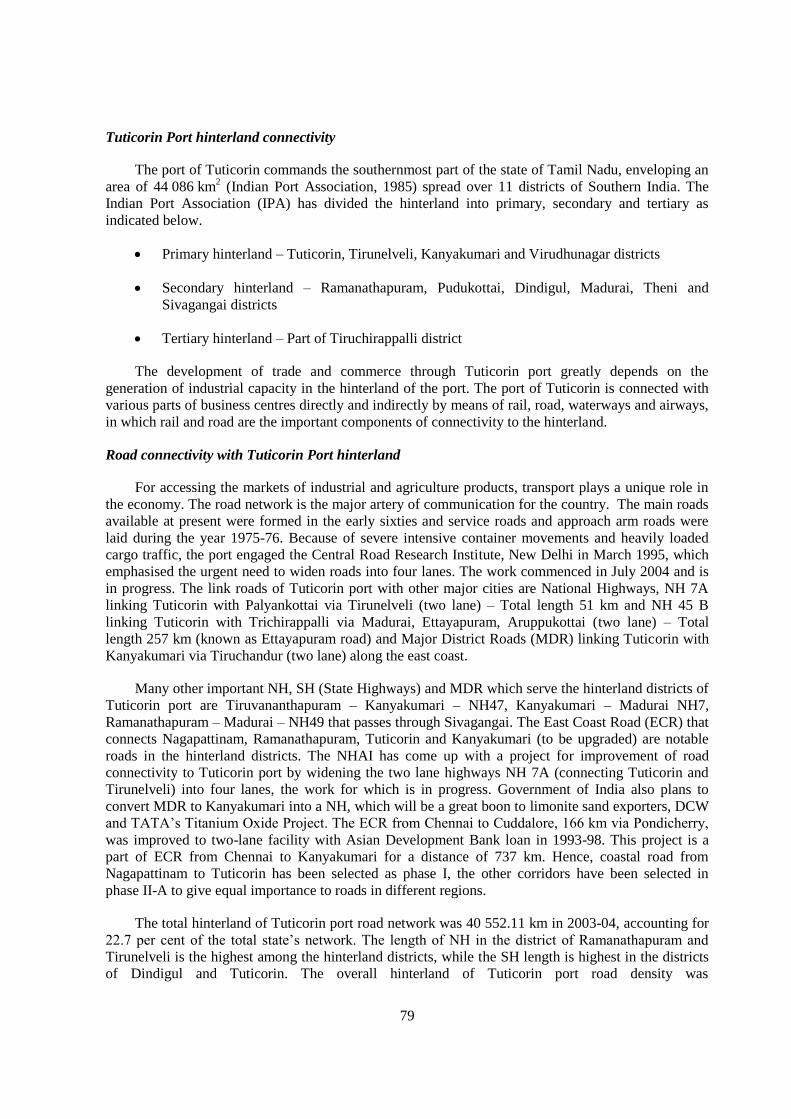
79
Tuticorin Port hinterland connectivity
The port of Tuticorin commands the southernmost part of the state of Tamil Nadu, enveloping an
area of 44 086 km2 (Indian Port Association, 1985) spread over 11 districts of Southern India. The
Indian Port Association (IPA) has divided the hinterland into primary, secondary and tertiary as
indicated below.
Primary hinterland – Tuticorin, Tirunelveli, Kanyakumari and Virudhunagar districts
Secondary hinterland – Ramanathapuram, Pudukottai, Dindigul, Madurai, Theni and
Sivagangai districts
Tertiary hinterland – Part of Tiruchirappalli district
The development of trade and commerce through Tuticorin port greatly depends on the
generation of industrial capacity in the hinterland of the port. The port of Tuticorin is connected with
various parts of business centres directly and indirectly by means of rail, road, waterways and airways,
in which rail and road are the important components of connectivity to the hinterland.
Road connectivity with Tuticorin Port hinterland
For accessing the markets of industrial and agriculture products, transport plays a unique role in
the economy. The road network is the major artery of communication for the country. The main roads
available at present were formed in the early sixties and service roads and approach arm roads were
laid during the year 1975-76. Because of severe intensive container movements and heavily loaded
cargo traffic, the port engaged the Central Road Research Institute, New Delhi in March 1995, which
emphasised the urgent need to widen roads into four lanes. The work commenced in July 2004 and is
in progress. The link roads of Tuticorin port with other major cities are National Highways, NH 7A
linking Tuticorin with Palyankottai via Tirunelveli (two lane) – Total length 51 km and NH 45 B
linking Tuticorin with Trichirappalli via Madurai, Ettayapuram, Aruppukottai (two lane) – Total
length 257 km (known as Ettayapuram road) and Major District Roads (MDR) linking Tuticorin with
Kanyakumari via Tiruchandur (two lane) along the east coast.
Many other important NH, SH (State Highways) and MDR which serve the hinterland districts of
Tuticorin port are Tiruvananthapuram – Kanyakumari – NH47, Kanyakumari – Madurai NH7,
Ramanathapuram – Madurai – NH49 that passes through Sivagangai. The East Coast Road (ECR) that
connects Nagapattinam, Ramanathapuram, Tuticorin and Kanyakumari (to be upgraded) are notable
roads in the hinterland districts. The NHAI has come up with a project for improvement of road
connectivity to Tuticorin port by widening the two lane highways NH 7A (connecting Tuticorin and
Tirunelveli) into four lanes, the work for which is in progress. Government of India also plans to
convert MDR to Kanyakumari into a NH, which will be a great boon to limonite sand exporters, DCW
and TATA’s Titanium Oxide Project. The ECR from Chennai to Cuddalore, 166 km via Pondicherry,
was improved to two-lane facility with Asian Development Bank loan in 1993-98. This project is a
part of ECR from Chennai to Kanyakumari for a distance of 737 km. Hence, coastal road from
Nagapattinam to Tuticorin has been selected as phase I, the other corridors have been selected in
phase II-A to give equal importance to roads in different regions.
The total hinterland of Tuticorin port road network was 40 552.11 km in 2003-04, accounting for
22.7 per cent of the total state’s network. The length of NH in the district of Ramanathapuram and
Tirunelveli is the highest among the hinterland districts, while the SH length is highest in the districts
of Dindigul and Tuticorin. The overall hinterland of Tuticorin port road density was

80
(943.18 per thousand km2) less than the state level density in 2002-2003. When compared to road
infrastructure available in the hinterland districts, apart from Kanyakumari (2 983.54 per thousand
km2), the road length per thousand km
2 in hinterland districts is less than average of the state
(1 372.81 per thousand km2).
Though the overall length of the road network in this region is inadequate, the NH is a prime
category of road carrying cargo from and to the port. It has a three per cent share of the total network
of the hinterland. At the state level, 31.7 per cent of the total NH and 13.44 per cent of SH runs are in
this region. The Tuticorin port cargo mainly passes through two NHs, namely NH7A and NH45B.
Traffic of these highways has increased continually.
The state of Tamil Nadu is poised to benefit immensely from the Golden Quadrilateral project
that connects the four metropolitan cities. In Tamil Nadu, 314 km of NH are being covered under this
programme. NHAI has now taken up the work of upgrading the road sections in NH4, NH5, NH7,
NH46 and NH47, which form part of the “Golden Quadrilateral” and North-South Corridor projects
(Government of India, 2005). The object of these projects is mainly converting the NH into four lanes,
which will render huge benefits to the hinterland of the Tuticorin port.
Rail connectivity with Tuticorin Port hinterland
Railways are important links in the supply chain for global trade. Port – Rail connectivity is a
very important aspect, to ensure a better performance by both the ports and railways. The coverage by
railways in Tamil Nadu was 4 166.80 km in 2003-04 and 51 per cent of it is broad gauge and the rest
is metre gauge. About 30 per cent of the total rail route length in the State is in the Tuticorin port
hinterland districts. The share of metre gauge in the hinterland is higher at 63 per cent, which is greater
than the state’s average. The density of rail route in hinterland districts is lower with 27.84 km per
thousand km2, compared to 32.04 km in Tamil Nadu as a whole during 2003-2004.
The average density in the primary hinterland districts is higher than the secondary hinterland
districts. The Southern Railway took conversion of 324.42 km metre gauge into broad gauge line
connectivity to Karur, Dindigul, Tuticorin and Tirunelveli in 1985. In the year 2003, the Southern
Railways has undertaken 13 projects, including laying new lines and gauge conversions of existing
lines, covering about 2 000 km. The project includes:
new line from Madurai to Tuticorin via Parambupatti, Aruppukkottai, Vilattikulam with an
alternative route via Virudhunagar, Aruppukkottai and Vilattikulam;
gauge conversion between Madurai and Coimbtore; and
new BG line between Madurai and Kottayam. If these projects were implemented, this
would greatly benefit the Tuticorin port hinterland in achieving faster economic growth.
Several measures have been taken by the Indian government to improve the port
connectivity, however, completion of Villupurum – Kumbakonam – Tanjavur and
Tirunelveli – Quilon broad gauge conversion projects, double laning of Madurai – Dindigul
and improving connectivity to Coimbatore will be of interest to Tuticorin port. When
compared to the distance between Tuticorin port and hinterland district road and rail, the
former one is the best choice because of flexibility, less time consumption, easy approach,
and transport frequency.

81
Cargo forecasts
Thermal coal
Tamil Nadu has about 10 098 MW of installed power generation capacity, which covers about
46% of its demands. There are plans to install three thermal power stations with each 1000 MW
capacity in next five to eight years, two out of which would be near Tuticorin. The projection of the
import of thermal coal is determined by the establishment of power plants in the future.
The needs for thermal coal in Tamil Nadu are high, considering the following issues:
Change in energy elasticity from 0.96% in 2006 – 0.75% in 2011
GDP growth rate of 8% until 2014 and 7% until 2020
Every 1000 MW power plant needs about 4.5-5 MT of coal annually
Stable share of 30% of thermal generation of the total power generation
Considering the above, around 15 million tonnes are expected in Tuticorin in next 20 years, as
Tuticorin is considered to develop as a power hub.
Industrial coal
The future demand for industrial coal is mainly driven by three industries
Paper industry
Cement industry
Sugar Industry
Cement production rate in Tamil Nadu has been growing at a rate of 11% and has surpassed
cement consumption rate by 4% due to which excess cement is transported to neighbouring states. The
paper production has grown steadily with GDP growth. Coal is required for these industries as a fuel
in captive power plants.
Chennai being closest to coal import sources in Indonesia, has been attracting more vessels in the
past, however, due to proposed improvements in handling facilities at Tuticorin, and possible shifting
of handling of dusty cargos from Chennai to Ennore, gives good potential to Tuticorin to attract
volumes in future. The forecast of Industrial coal is shown at 3 mt in 2015 and 6 mt in 2030 as
compared to 2 mt in 2010.
Fertilisers
India has been a net importer of fertilisers, and this market is totally regulated by Department of
fertilisers, Ministry of chemicals and fertilisers. Further, the fertiliser market is driven by the
agricultural sector, which is a stable factor, and Tuticorin market has already taken over its shares of
volumes from the competing ports of Cochin and Chennai during the last few years, therefore drastic
increase is not forecasted, however, the imports would grow to around 1.5 mt by 2025.

82
Copper concentrate
The availability of land to extend the business of copper industry (Sterlite Company) is limited by
environmental and Governmental land planning issues. The needed column of copper concentrate up
to date is around 2 mt. There is no other need of imported raw materials to fulfil the increase of copper
capacity, therefore there would not be any drastic rise and volume of import is forecasted to remain
same by 2025.
Timber
Tuticorin has become one of the major hubs of Timber import in South India and it has provision
for enough storage areas for storing timber logs over long periods. The south Indian market would be
dominated by the small scale wood industry with stable demand between 450 000 to 500 000 tonnes.
POL
The POL demands of Tuticorin hinterlands are being served by two refineries, one in Chennai
and other in Cochin. There is also a new refinery being set up at Cuddalore. With this refinery, the
demand in Tamil Nadu and Kerala is saturated. Except if there is any export market, there would be
only steady growth in import of POL at this port, which is 1.5 mt in 2025 as compared to 1 mt in
2010-2011.
Other liquid cargos
Other liquid cargos like liquid ammonia, phosphoric acid and vinyl chloride are imported and
constitute about 60% of share. Palm oil also constitutes about 30% share, with not much growth
expected, main driver in future is palm oil.
Other break bulk and dry bulk cargo
The general cargo growth rate has seen in the past a growth at Tuticorin of about 4.3% over last
five years, which is less than the non-containerised cargo over all ports. Therefore, growth of 9% is
expected in coming years decreasing to about four to five per cent in the next 20 years.
Container
The container demand forecast is based on past development and dependency between:
GDP
General cargo volume
Containerisation rate
The general cargo volume growth rate in India has shown a good relation with the GDP growth
rate. In general the growth rates of GDP and general cargo volume are equal, but still in India the
general cargo volume is higher that GDP growth.
The containerisation rate is about 48% and the expected growth rate for the future is to be
expected between 1.5% and 2% slightly decreasing over the years. The expected containerisation rate
in the year 2027 is expected to be nearly 70% overall India. The conclusion is that in India there is

83
still a high potential for container traffic. The share of Tuticorin port trust on the total Indian market in
terms of volume is 7%, and it is assumed that this share would remain the same over next 20 years.
(Source: Report on Tuticorin Port Trust.)
Tuticorin Port: Potential as an international container hub
Tuticorin can emerge as a trans-shipment hub for domestic container and attract additional
international containers for trans-shipment.
The Tuticorin port has the potential to become an international container trans-shipment hub
given its unique geographical location by 2020, says a feasibility study by PricewaterhouseCoopers
Pvt Ltd. (PwC) in 2005 which was done on behalf of the Tuticorin Hub Port Development Council.
The council is a dedicated forum of representatives from chambers of commerce, trade associations
and corporates of Tuticorin to promote the Tuticorin port as a container trans-shipment hub. The
project cost for a trans-shipment hub will be around Rs. 27 billion. Forty per cent of the port
infrastructure, including dredging costs and breakwaters, has been allocated to bulk cargo such as coal
and liquid bulk. After the allocation, the project cost works out to about Rs. 17 billion, says the study.
Container traffic at the Tuticorin port is over three hundred thousand TEUs (twenty foot
equivalent units), and has been growing at about 17 per cent over the last five years and would soon
exceed the capacity of the terminal. Clearly, there is a need to bolster the port's handling capacity.
Based on the analysis, the traffic projected for Tuticorin is 1.37 million TEUs by 2010,
2.31 million by 2015 and 3.72 million by 2020. The analysis assumes that Tuticorin will have the
infrastructure to handle Post-Panamax vessels with an alongside depth of 17.5 metres.
Further, based on separate reports submitted for the Sethusamudram Ship Canal project, it is
estimated that a further 16-17 per cent upside to the above traffic number would result on
implementation of the canal project, says the study. The study was sponsored by the Tuticorin-
headquartered Tamilnadu Mercantile Bank Ltd. According to the study, international trans-shipment
from neighbouring countries in South Asia and ports such as Chittagong, Karachi, Yangon and
Colombo form up to 20 per cent of the port throughput for Tuticorin. The ports competing with
Tuticorin for this market are international trans-shipment hubs such as Jebel Ali (Dubai), Salalah
(Oman), Singapore, Port Klang (Malaysia), Tanjung Pelepas (Indonesia) and Colombo (Sri Lanka).
Tuticorin can emerge as a trans-shipment hub for domestic container traffic and attract additional
international containers for trans-shipment. The deviation from the international sea route is an
important parameter that needs to be considered, says the study. For instance, the deviation of ports
such as Karachi from the East-West Trade Route is 90 hours and more than 100 hours for Chittagong.
Experts said the additional deviation involved in routing traffic through Tuticorin rather than Colombo
(11.5 hours) is not significant, assuming that Tuticorin can continue to provide more efficient service
and match Colombo's network.

84
ANNEX B
STUDY ON A MINOR PORT – MUNDRA PORT
Mundra Port
Mundra Port is India's largest privately developed Port equipped with state of the art technology
and excellent infrastructure. Picture showing geographic location of Mundra port is available.
Some of the salient features are:
One of the deepest ports on the coastline of India blessed with a natural draught of 17 m and
capable of berthing Capesize vessels up to 150 000 TDWT.
Proximity to Northern & Western hinterland of the country which generates over 42% of the
total international trade of India. Mundra port is over 180 km. closer to Delhi than Mumbai
Port and JNPT.
The Port has dedicated infrastructure to cater to various cargos like grain, liquid, POL and
coal amongst others.
Back-up infrastructure facilities developed over 300 acres area for dry, liquid and container
cargo.
State of the art mechanised bulk handling system.
Ample closed and open storage space for dry cargo.

85
In-house wheat cleaning as well as rice sorting and grading facility.
Large tank farm area for storage of wide variety of liquid cargo.
Connected to NH-8 of the National Highway network.
Linked to the national railway grid through a self-developed 57 km long railway link capable
of handling 24 railway rakes per day.
Can accommodate four Single Point Moorings inside the Port’s limits.
Area of 5 000 acres available for further developing the Port-related infrastructure facilities.
With a total quay length of 895 m, the Port has four berths ranging from 180 to 225 m. in length
and 31 m in width, besides an 85 m barge berth for handling a wide variety of cargo. These berths can
easily handle nine million tonnes of cargo per annum on the existing infrastructural facilities.
Cargo handling at Mundra Port
Dry cargo handling and storage
Mundra Port has state-of-the-art facilities for the handling and warehousing of dry cargo. The
port has four Gottwald and four Liebherr mobile harbour cranes with a handling capacity of 750 tons
per hour (TPH) per crane.
The Port has set up a state of the art 3.6 km long import and export conveyor system capable of
handling 1 500 TPH (tonnes per hour) of import and 1 000 TPH of export cargo. It has 21 enclosed go
downs measuring 137 000 (one hundred thirty seven thousand) m2, for wheat, rice, sugar, de-oiled
cakes (DOC), fertiliser, fertiliser raw materials (FRM), etc. The port also has 800,000 (eight hundred
thousand) m2 of well demarcated open storage space for steel sheets, plate, coils, scrap, clinker, salt,
coal, coke, bentonite, etc.
Liquid cargo handling and storage
Mundra Port is one of the most facilitated ports for the offloading and warehousing of liquid
cargo with the following facilities:
Pipelines with diameters from 8" to 24", connecting liquid berths to tank farms
Bitumen handling facility inside port
64 loading bays with sophisticated volume dispatch systems
Fire fighting, nitrogen, hot water circulation, effluents treatment plant (ETP) and oil-water
separator systems
Tank farms with 73 tanks and a storage volume of 342 000 (three hundred and forty two
thousand) kilolitres for storage of liquids like edible oils, petroleum products and chemicals.

86
The volume of cargo handled is available in terms of traffic volumes for Mundra Port, are shown
in the following figure.
Figure 8.B1.1. Total traffic volume handled in hundred thousand tonnes for last five years
Mundra Port hinterland connectivity
Rail connectivity
Mundra Port is well connected to the Indian railway network. The port has seven railway sidings
and two dedicated diesel locomotives. It is also capable of handling double stack container trains.
Gandhidham-Bhuj
Mundra Port is well connected with national railway network of Broad Gauge (BG) link.
Available railway line has an existing Broad Gauge (BG) link with Ahmedabad passing through
Gandhidham and Viramgam. A 64 km private railway line has been developed which connects the
port with the national network at Adipur. The Railway line between Mundra Port and Adipur is
situated at a distance of eight kilometres from Gandhidham. Adipur is located on the Gandhidham-
Bhuj section of the Western Railway.
Viramgam-Mahesana
The Viramgam-Mahesana Gauge conversion project has also been entrusted to a private party on
BOT basis. This link would reduce the rail distance to Northern Hinterland by 51 km as well as
considerably help in relieving the traffic congestion being experienced by Western Railway in
Ahmedabad region.
Palanpur-Bhildi-Gandhidham
The promoter group of the Port (Adani Group) along with the Indian Railways, Government of
Gujarat and Kandla Port have agreed to create a SPV to undertake the sanctioned work of Palanpur-

87
Bhildi-Gandhidham conversion. The Railways has already commenced the construction activity. This
route would reduce the existing distance between Delhi and Mundra Port by 110 km creating a
substantial advantage in terms of distance for the Port vis-à-vis other competing ports like JNPT,
besides better handling facilities.
Delhi-Kota-Baroda-Mumbai
The Delhi-Kota-Baroda-Mumbai sector is among the busiest rail corridors in the country and this
high traffic density has made it extremely congested. With the objective of providing alternate rail
linkages to the Northern Hinterland, the Central Government decided on improvement of the Delhi-
Jaipur-Viramgam corridor by converting it into a Broad Gauge (BG) section.
Bhildi-Luni
The Bhildi-Luni Broad Gauge conversion is expected to provide the third corridor for the
Northern Hinterland traffic and is likely to accelerate the movement of traffic on an important link
between Mundra Port, Punjab and Rajasthan. The completion of this route would further reduce the
distance for Delhi by 33 km.
Road connectivity
Mundra Port is about 65 km from Bhuj and 400 km from Ahmedabad. It is easily accessible by
the national highway network. Mundra is well connected to the national and state highways. It is
linked to the National Highway Network through an extension of NH 8A from Mundra-Anjar-
Bhimasar and a state Highway No. 6 from Mundra to Gandhidham. National Highway (NH) 8
connects Delhi to Mumbai. NH 8A, an offshoot of NH 8, branches out at Ahmedabad towards the
Kandla port. A four-lane approach road of 14-km stretch connecting the Mundra Port to the Mundra
Village has already been constructed under the current phase of Mundra Port development.
Air connectivity
The nearest commercial airports to Mundra Port are at Bhuj (65 km) and Kandla (60 km).
Mundra Port itself has a private operational airstrip that is suitable for landing mid-size jets. The
aerodrome can be extended for commercial operations as land is available with the promoter group
(Adani group) adjoining the airstrip.
As the developers have their own aircraft, it is in the process of building an airstrip within
Mundra SEZ. The proposal is to convert this airstrip into a Boeing 747 class airport in future. Source:
Port of Mundra.
Mundra Port: Potential as a top calling port in India
Mundra port has the potential to become the one of the busiest ports, among all major and minor
ports in India. Mundra has already begun to account for 14% of cargo moved by all the minor ports
put together. This may not prove the potential now, but it is an indicator of things to come.

88
Within the next two years, Mundra will handle 35 million tonnes of imported coal annually to
feed the requirements of the two mega power plants of Adani Power (4 662 mw) and Tata Power
(4 000 mw), both located at Mundra itself. This commodity alone will propel it to the rank of one of
the top ports in India.
In order to cater to this demand, Mundra is already building a dedicated coal terminal capable of
handling 1 500 tonnes an hour. This will be in addition to the coal Mundra imports for other power
plants in Maharashtra, Gujarat and Rajasthan.
For oil and other liquid (petrochemical and edible oil) products, the New HPCL Mittal Energy
(HMEL) plant at Mundra already has a tank farm which can store 3.5 lakh (three hundred fifty
thousand) kilolitres (kl), and is building another 7.2 lakh kl for its crude oil. Mundra already has
10.25 lakh kl of tank farm capacity of both HPCL and Indian Oil, making it the largest private sector
tank farm location in India. HPCL has a pipeline connecting Panipat to Mundra, while HMEL will
connect its storage tanks to Bhatinda in Haryana and the NCR, Delhi.
The Adani group’s own liquid storage requirements (for bunkering and for edible oil required by
Adani Wilmar) are being increased from the present 81 tanks aggregating 0.345 million kl to
0.69 million kl.
While no other merchant port in India can presently berth very large crude carriers (VLCC),
which require a minimum depth of 29 metres, Mundra’s single point mooring (SPM) offers a depth of
32 metres. The port can accommodate four more SPMs, and one is already being built exclusively for
HMEL.
For 2008-09, Mundra Port accounted for 78% of all container traffic handled by all the minor
ports in the country. This share is likely to increase in the coming years for several reasons. Due to the
geographical location, Mundra remains the closest port for industrial and agricultural centres in North
and West India. The paucity of passenger traffic along Kutch and Rajasthan makes its railway routes
relatively free for cargo railway traffic. When the Dedicated Freight Corridor between Mumbai and
Delhi is ready (expected by 2017-18), Mundra is likely to be a major beneficiary.
Mundra is also India’s largest port for handling of car exports, serving Maruti Suzuki cars at the
present, with the possibly of at least three other vehicle manufacturers using these facilities in the near
future (Tata Motors, Ashok Leyland and Nissan are in discussions). During the first quarter of
2008-09, Mundra Port handled 16 181 cars. In order to cater to this surging demand, Mundra is
building a ro-ro (roll-on-roll-off) berth dedicated exclusively to vehicles.
Moreover, the existing four berths are expected to increase container traffic this year from
0.7 million TEUs to well over a million. Within the next three years, the port expects to cater to
2.5 million TEUs. Capacity, however, is expected to be expanded to 6.56 million TEUs.
Mundra also offers lots of land and skilled workers. Without space for storing, loading and
evacuation of cargo, a port cannot function effectively. Mundra and other Adani group companies
together control over 30 000 acres of land. It has permitted Mundra to offer space to Maruti-Suzuki for
its pre-delivery-inspection bays. It also allows companies like Thermax (a major engineering
company) to construct huge equipment like the 600 tonne boiler it recently fabricated and use Mundra
for export, and is in the process of constructing another weighing 800 tonnes. The port has space for
coal, fertilisers and food grain, in addition to temperature controlled storage.

89
Besides the locational advantage, the advantage of efficiency at the port makes Mundra a port
with great potential on the Western Coast of India. Its cranes achieve around 35 moves an hour, which
is the international standard. Container vessels turn round within 14-16 hours compared with longer
periods at most ports in India. Liquid tankers turn around within 18-20 hours, almost six to ten times
faster than any other merchant port in the country. Mundra port is projected to handle 100 m tonnes a
year by 2013, and 150 m tonnes a year by 2020.
Source: preliminary figures provided by Overseas Infrastructure Alliance (oia).
Recommended