T5113A/T5215A/T5230A/T5280A
T5113H/T5231A/T5281A
Vector Network Analyzer
User’s Guide
TRANSCOM INSTRUMENTS CO., LTD.
2012-4

Transcom Vector Network Analyzer――User’s Guide
Transcom Instruments Co., Ltd. Tel: +86-21-64326888 Fax: +86-21-64326777 I
Copyright Statement
The information in this document is subject to change without notice.
The copyright of this document is belongs to Transcom Instruments Co., Ltd..
Any unit or individual cannot copy this manual, retrieved or transmitted without the
written permission of the copyright owner.
Transcom and and is the registered trademark of Transcom Instruments
Co. Ltd..
All rights reserved!
Shanghai Transcom reserves the right to interpret the document, document version
upgrades without further notice.
Transcom Instruments Co., Ltd.
Address:4F,Building 28, Guiqing Road No. 69 ,Xuhui District,200233,SHANGHAI P.R.C.
Zip Code: 200233
Technical Support: +86-21-64326888
Hot Line: +86-400-677-8077
E-mail: [email protected]
Website: Http://www.transcom.net.cn

Transcom Vector Network Analyzer――User’s Guide
Transcom Instruments Co., Ltd. Tel: +86-21-64326888 Fax: +86-21-64326777 II
Notices Carefully read through the following safety instructions before putting the
Analyzer into operation.
The Analyzer must be used only by skilled and specialized staff or thoroughly
trained personnel with the required skills and knowledge of safety precautions.
The VNA is for INDOOR USE only.
Determine the grid voltage to fit the equipment requirements of the input voltage
before putting the Analyzer into operation.
Never use damaged or aging power cord, and do not overhaul the power cord.
Never place the power cord near heat sources.
The instrument must waterproof strictly and be avoided the fierce collision when
moved. Do not hold the front panel, it may damage the keyboard and input connector.
Immediately stop using when it comes to abnormal phenomVNA, such as
equipment smoke and smell. Turn off the power switch, unplug the power cord and
contact a professional service personnel.
Unplug the power plug when it is not in use for a long time.
Do not disassemble equipment. Contact Technical Service personnel to
maintVNAnce when equipment failure.
Any unit or individual without permission, is banned to change the structure of
the equipment and safety design.

Transcom Vector Network Analyzer――User’s Guide
Transcom Instruments Co., Ltd. Tel: +86-21-64326888 Fax: +86-21-64326777 III
Safety
The following general safety precautions must be observed during all phases of
operation, service, and repair of this instrument. Failure to comply with these
precautions or with specific WARNINGS elsewhere in this manual may impair the
protection provided by the equipment. Such noncompliance would also violate safety
standards of design, manufacture, and intended use of the instrument. Transcom
Instruments assumes no liability for the customer's failure to comply with these
precautions.
Ground the Instrument
To avoid electric shock, the instrument chassis and cabinet must be grounded with the
supplied power cable's grounding prong.
Do not operate in an Explosive Atmosphere
Do not operate the instrument in the presence of inflammable gasses or fumes.
Operation of any electrical instrument in such an environment clearly constitutes a
safety hazard.
Keep away from Live Circuits
Operators must not remove instrument covers. Component replacement and internal
adjustments must be made by qualified maintVNAnce personnel. Do not replace
components with the power cable connected. Under certain conditions, dangerous
voltage levels may remain even after the power cable has been disconnected. To avoid
injuries, always disconnect the power and discharge circuits before touching them.
DO NOT Service or Adjust the Instrument Alone
Do not attempt internal service or adjustment unless another person, capable of
rendering first aid and resuscitation, is present.
DO NOT Substitute Parts or Modify the Instrument
To avoid the danger of introducing additional hazards, do not install substitute parts or
perform unauthorized modifications to the instrument. Return the instrument to an
Transcom Instruments Sales and Service Office for service and repair to ensure that
safety features are maintained in operational condition.

Transcom Vector Network Analyzer――User’s Guide
Transcom Instruments Co., Ltd. Tel: +86-21-64326888 Fax: +86-21-64326777 IV
Dangerous Procedure Warnings
Warnings, such as the example below, precede potentially dangerous procedures
throughout this manual. Instructions contained in the warnings must be followed.
Dangerous voltage levels, capable of causing death, are present in this instrument.
Use extreme caution when handling, testing, and adjusting this instrument.
Cleaning Notes
Keep the instrument cleaning.
Turn off the instrument and plug off Power Cable before cleaning.
Clean the shell of instrument with a soft, dry cloth.
Do NOT spray liquid against the instrument, it may damage the device.
Instrument Software
Update Pre-install software
Do NOT update Pre-install software, only when Transcom recommended. Read the
chapter of Software Upgrade before install soft.
Do NOT Modify or Reconfigure the Operating System
The Microsoft Windows operating system (Windows XP Embedded) has been
modified and optimized by Transcom to improve the performance of the VNA.
Do NOT install a standard version of the Windows operating system on the VNA.
Do NOT change advanced performance settings or group policies.
Do NOT add or delete any hard disk drive partitions on the VNA.
Do NOT change the settings of Standards and Formats in Regional Options and
Languages from default setting (English).
Install Antivirus Protection
The VNA does NOT have antivirus protection when shipped. Use of an antivirus

Transcom Vector Network Analyzer――User’s Guide
Transcom Instruments Co., Ltd. Tel: +86-21-64326888 Fax: +86-21-64326777 V
program is strongly recommended if you connect the VNA to the LAN (Internet).
In addition, the use of a firewall could help to protect the VNA from viruses.
However, some firewalls could limit DCOM connectivity of the VNA.
Installing user application software
It is not recommended to install user application software, because some software
may affect the speed of measurement, and even the normal operation of the
instrument.
Help
Website
If you want to find out the new products of Transcom and product information, you
can interview the website of Transcom.
http://www.transcom.net.cn
If you have any problems with the process and recommendations, welcome to send
E-mail to our technical support. We will solve them as soon as possible.
Telephone
If you would like further information about the product, you can call the technical
support hotline of Transcom during working hours.
Time: Monday-Friday, 9:00-17:30
Hot-Line: +86-400-677-8077

Transcom Vector Network Analyzer――Operating Manual
Transcom Instruments Co., Ltd. Tel: +86-21-64326888 Fax: +86-21-64326777 ‐ 6-
T5113A/T5215A/T5230A/T5280A
T5113H/T5231A/T5281A
Vector Network Analyzer
Operating Manual

Transcom Vector Network Analyzer――Operating Manual
Transcom Instruments Co., Ltd. Tel: +86-21-64326888 Fax: +86-21-64326777 ‐ I-
TABLE OF CONTENTS
1. GENERAL OVERVIEW ························································································ 1
1.1. SYMBOL DEFINITIONS ∙∙∙∙∙∙∙∙∙∙∙∙∙∙∙∙∙∙∙∙∙∙∙∙∙∙∙∙∙∙∙∙∙∙∙∙∙∙∙∙∙∙∙∙∙∙∙∙∙∙∙∙∙∙∙∙∙∙∙∙∙∙∙∙∙∙∙∙∙∙∙∙∙∙∙∙∙∙∙∙∙∙∙∙∙∙∙∙∙∙∙∙∙∙∙∙∙∙∙∙∙∙∙∙∙∙∙∙∙∙∙∙∙∙∙∙ 1
1.2. INTRODUCTION OF INSTRUMENTS∙∙∙∙∙∙∙∙∙∙∙∙∙∙∙∙∙∙∙∙∙∙∙∙∙∙∙∙∙∙∙∙∙∙∙∙∙∙∙∙∙∙∙∙∙∙∙∙∙∙∙∙∙∙∙∙∙∙∙∙∙∙∙∙∙∙∙∙∙∙∙∙∙∙∙∙∙∙∙∙∙∙∙∙∙∙∙∙∙∙∙∙∙∙∙∙∙∙∙ 1
1.2.1. Front Panel ∙∙∙∙∙∙∙∙∙∙∙∙∙∙∙∙∙∙∙∙∙∙∙∙∙∙∙∙∙∙∙∙∙∙∙∙∙∙∙∙∙∙∙∙∙∙∙∙∙∙∙∙∙∙∙∙∙∙∙∙∙∙∙∙∙∙∙∙∙∙∙∙∙∙∙∙∙∙∙∙∙∙∙∙∙∙∙∙∙∙∙∙∙∙∙∙∙∙∙∙∙∙∙∙∙∙∙∙∙∙∙∙∙∙∙∙∙∙∙∙∙∙∙∙∙ 1 1.2.2. Rear Panel ∙∙∙∙∙∙∙∙∙∙∙∙∙∙∙∙∙∙∙∙∙∙∙∙∙∙∙∙∙∙∙∙∙∙∙∙∙∙∙∙∙∙∙∙∙∙∙∙∙∙∙∙∙∙∙∙∙∙∙∙∙∙∙∙∙∙∙∙∙∙∙∙∙∙∙∙∙∙∙∙∙∙∙∙∙∙∙∙∙∙∙∙∙∙∙∙∙∙∙∙∙∙∙∙∙∙∙∙∙∙∙∙∙∙∙∙∙∙∙∙∙∙∙∙ 12
1.3. SCREEN AREA ∙∙∙∙∙∙∙∙∙∙∙∙∙∙∙∙∙∙∙∙∙∙∙∙∙∙∙∙∙∙∙∙∙∙∙∙∙∙∙∙∙∙∙∙∙∙∙∙∙∙∙∙∙∙∙∙∙∙∙∙∙∙∙∙∙∙∙∙∙∙∙∙∙∙∙∙∙∙∙∙∙∙∙∙∙∙∙∙∙∙∙∙∙∙∙∙∙∙∙∙∙∙∙∙∙∙∙∙∙∙∙∙∙∙∙∙∙∙∙∙∙∙∙∙∙∙ 15
1.3.1. Channel Window ∙∙∙∙∙∙∙∙∙∙∙∙∙∙∙∙∙∙∙∙∙∙∙∙∙∙∙∙∙∙∙∙∙∙∙∙∙∙∙∙∙∙∙∙∙∙∙∙∙∙∙∙∙∙∙∙∙∙∙∙∙∙∙∙∙∙∙∙∙∙∙∙∙∙∙∙∙∙∙∙∙∙∙∙∙∙∙∙∙∙∙∙∙∙∙∙∙∙∙∙∙∙∙∙∙∙∙∙∙∙∙∙∙∙ 16
1.3.2. Data Entry Bar ∙∙∙∙∙∙∙∙∙∙∙∙∙∙∙∙∙∙∙∙∙∙∙∙∙∙∙∙∙∙∙∙∙∙∙∙∙∙∙∙∙∙∙∙∙∙∙∙∙∙∙∙∙∙∙∙∙∙∙∙∙∙∙∙∙∙∙∙∙∙∙∙∙∙∙∙∙∙∙∙∙∙∙∙∙∙∙∙∙∙∙∙∙∙∙∙∙∙∙∙∙∙∙∙∙∙∙∙∙∙∙∙∙∙∙∙∙∙ 17 1.3.3. Instrument Status Bar ∙∙∙∙∙∙∙∙∙∙∙∙∙∙∙∙∙∙∙∙∙∙∙∙∙∙∙∙∙∙∙∙∙∙∙∙∙∙∙∙∙∙∙∙∙∙∙∙∙∙∙∙∙∙∙∙∙∙∙∙∙∙∙∙∙∙∙∙∙∙∙∙∙∙∙∙∙∙∙∙∙∙∙∙∙∙∙∙∙∙∙∙∙∙∙∙∙∙∙∙∙∙∙∙∙∙∙ 18 1.3.4. Softkey Menu Bar ∙∙∙∙∙∙∙∙∙∙∙∙∙∙∙∙∙∙∙∙∙∙∙∙∙∙∙∙∙∙∙∙∙∙∙∙∙∙∙∙∙∙∙∙∙∙∙∙∙∙∙∙∙∙∙∙∙∙∙∙∙∙∙∙∙∙∙∙∙∙∙∙∙∙∙∙∙∙∙∙∙∙∙∙∙∙∙∙∙∙∙∙∙∙∙∙∙∙∙∙∙∙∙∙∙∙∙∙∙∙∙∙ 18
1.4. THREE METHODS OF OPERATION ∙∙∙∙∙∙∙∙∙∙∙∙∙∙∙∙∙∙∙∙∙∙∙∙∙∙∙∙∙∙∙∙∙∙∙∙∙∙∙∙∙∙∙∙∙∙∙∙∙∙∙∙∙∙∙∙∙∙∙∙∙∙∙∙∙∙∙∙∙∙∙∙∙∙∙∙∙∙∙∙∙∙∙∙∙∙∙∙∙∙∙∙∙∙∙∙∙∙ 20
1.5. BASIC MEASUREMENT PROCEDURES ∙∙∙∙∙∙∙∙∙∙∙∙∙∙∙∙∙∙∙∙∙∙∙∙∙∙∙∙∙∙∙∙∙∙∙∙∙∙∙∙∙∙∙∙∙∙∙∙∙∙∙∙∙∙∙∙∙∙∙∙∙∙∙∙∙∙∙∙∙∙∙∙∙∙∙∙∙∙∙∙∙∙∙∙∙∙∙∙∙∙∙∙ 20
2. Setting Measurement Conditions ········································································· 21
2.1. INITIALIZING PARAMETERS ∙∙∙∙∙∙∙∙∙∙∙∙∙∙∙∙∙∙∙∙∙∙∙∙∙∙∙∙∙∙∙∙∙∙∙∙∙∙∙∙∙∙∙∙∙∙∙∙∙∙∙∙∙∙∙∙∙∙∙∙∙∙∙∙∙∙∙∙∙∙∙∙∙∙∙∙∙∙∙∙∙∙∙∙∙∙∙∙∙∙∙∙∙∙∙∙∙∙∙∙∙∙∙∙∙∙ 21
2.2. SETTING THE SYSTEM Z0 ∙∙∙∙∙∙∙∙∙∙∙∙∙∙∙∙∙∙∙∙∙∙∙∙∙∙∙∙∙∙∙∙∙∙∙∙∙∙∙∙∙∙∙∙∙∙∙∙∙∙∙∙∙∙∙∙∙∙∙∙∙∙∙∙∙∙∙∙∙∙∙∙∙∙∙∙∙∙∙∙∙∙∙∙∙∙∙∙∙∙∙∙∙∙∙∙∙∙∙∙∙∙∙∙∙∙∙∙∙ 21 2.3. SETTING CHANNELS AND TRACES ∙∙∙∙∙∙∙∙∙∙∙∙∙∙∙∙∙∙∙∙∙∙∙∙∙∙∙∙∙∙∙∙∙∙∙∙∙∙∙∙∙∙∙∙∙∙∙∙∙∙∙∙∙∙∙∙∙∙∙∙∙∙∙∙∙∙∙∙∙∙∙∙∙∙∙∙∙∙∙∙∙∙∙∙∙∙∙∙∙∙∙∙∙∙∙∙ 21
2.3.1. Setting Channel Display (Layout of Channels) ∙∙∙∙∙∙∙∙∙∙∙∙∙∙∙∙∙∙∙∙∙∙∙∙∙∙∙∙∙∙∙∙∙∙∙∙∙∙∙∙∙∙∙∙∙∙∙∙∙∙∙∙∙∙∙∙∙∙∙∙∙∙∙∙∙∙∙∙ 21 2.3.2. Setting Trace Display ∙∙∙∙∙∙∙∙∙∙∙∙∙∙∙∙∙∙∙∙∙∙∙∙∙∙∙∙∙∙∙∙∙∙∙∙∙∙∙∙∙∙∙∙∙∙∙∙∙∙∙∙∙∙∙∙∙∙∙∙∙∙∙∙∙∙∙∙∙∙∙∙∙∙∙∙∙∙∙∙∙∙∙∙∙∙∙∙∙∙∙∙∙∙∙∙∙∙∙∙∙∙∙∙∙∙∙ 23 2.3.3. Active channel ∙∙∙∙∙∙∙∙∙∙∙∙∙∙∙∙∙∙∙∙∙∙∙∙∙∙∙∙∙∙∙∙∙∙∙∙∙∙∙∙∙∙∙∙∙∙∙∙∙∙∙∙∙∙∙∙∙∙∙∙∙∙∙∙∙∙∙∙∙∙∙∙∙∙∙∙∙∙∙∙∙∙∙∙∙∙∙∙∙∙∙∙∙∙∙∙∙∙∙∙∙∙∙∙∙∙∙∙∙∙∙∙∙∙∙∙∙∙ 24 2.3.4. Active Trace ∙∙∙∙∙∙∙∙∙∙∙∙∙∙∙∙∙∙∙∙∙∙∙∙∙∙∙∙∙∙∙∙∙∙∙∙∙∙∙∙∙∙∙∙∙∙∙∙∙∙∙∙∙∙∙∙∙∙∙∙∙∙∙∙∙∙∙∙∙∙∙∙∙∙∙∙∙∙∙∙∙∙∙∙∙∙∙∙∙∙∙∙∙∙∙∙∙∙∙∙∙∙∙∙∙∙∙∙∙∙∙∙∙∙∙∙∙∙∙∙∙ 25
2.4. SETTING STIMULUS CONDITIONS ∙∙∙∙∙∙∙∙∙∙∙∙∙∙∙∙∙∙∙∙∙∙∙∙∙∙∙∙∙∙∙∙∙∙∙∙∙∙∙∙∙∙∙∙∙∙∙∙∙∙∙∙∙∙∙∙∙∙∙∙∙∙∙∙∙∙∙∙∙∙∙∙∙∙∙∙∙∙∙∙∙∙∙∙∙∙∙∙∙∙∙∙∙∙∙∙∙ 25
2.4.1. Setting the Sweep Type ∙∙∙∙∙∙∙∙∙∙∙∙∙∙∙∙∙∙∙∙∙∙∙∙∙∙∙∙∙∙∙∙∙∙∙∙∙∙∙∙∙∙∙∙∙∙∙∙∙∙∙∙∙∙∙∙∙∙∙∙∙∙∙∙∙∙∙∙∙∙∙∙∙∙∙∙∙∙∙∙∙∙∙∙∙∙∙∙∙∙∙∙∙∙∙∙∙∙∙∙∙∙∙∙ 25 2.4.2. Setting the Sweep Range ∙∙∙∙∙∙∙∙∙∙∙∙∙∙∙∙∙∙∙∙∙∙∙∙∙∙∙∙∙∙∙∙∙∙∙∙∙∙∙∙∙∙∙∙∙∙∙∙∙∙∙∙∙∙∙∙∙∙∙∙∙∙∙∙∙∙∙∙∙∙∙∙∙∙∙∙∙∙∙∙∙∙∙∙∙∙∙∙∙∙∙∙∙∙∙∙∙∙∙∙∙∙ 26 2.4.3. VNAble/Disable Stimulus Signal Output ∙∙∙∙∙∙∙∙∙∙∙∙∙∙∙∙∙∙∙∙∙∙∙∙∙∙∙∙∙∙∙∙∙∙∙∙∙∙∙∙∙∙∙∙∙∙∙∙∙∙∙∙∙∙∙∙∙∙∙∙∙∙∙∙∙∙∙∙∙∙∙∙∙∙∙∙∙ 27 2.4.4. Setting fixed frequency at power sweep ∙∙∙∙∙∙∙∙∙∙∙∙∙∙∙∙∙∙∙∙∙∙∙∙∙∙∙∙∙∙∙∙∙∙∙∙∙∙∙∙∙∙∙∙∙∙∙∙∙∙∙∙∙∙∙∙∙∙∙∙∙∙∙∙∙∙∙∙∙∙∙∙∙∙∙∙∙∙∙ 27 2.4.5. Setting power level ∙∙∙∙∙∙∙∙∙∙∙∙∙∙∙∙∙∙∙∙∙∙∙∙∙∙∙∙∙∙∙∙∙∙∙∙∙∙∙∙∙∙∙∙∙∙∙∙∙∙∙∙∙∙∙∙∙∙∙∙∙∙∙∙∙∙∙∙∙∙∙∙∙∙∙∙∙∙∙∙∙∙∙∙∙∙∙∙∙∙∙∙∙∙∙∙∙∙∙∙∙∙∙∙∙∙∙∙∙∙∙ 27 2.4.6. Setting the number of points ∙∙∙∙∙∙∙∙∙∙∙∙∙∙∙∙∙∙∙∙∙∙∙∙∙∙∙∙∙∙∙∙∙∙∙∙∙∙∙∙∙∙∙∙∙∙∙∙∙∙∙∙∙∙∙∙∙∙∙∙∙∙∙∙∙∙∙∙∙∙∙∙∙∙∙∙∙∙∙∙∙∙∙∙∙∙∙∙∙∙∙∙∙∙∙∙ 28 2.4.7. Setting the Sweep Time ∙∙∙∙∙∙∙∙∙∙∙∙∙∙∙∙∙∙∙∙∙∙∙∙∙∙∙∙∙∙∙∙∙∙∙∙∙∙∙∙∙∙∙∙∙∙∙∙∙∙∙∙∙∙∙∙∙∙∙∙∙∙∙∙∙∙∙∙∙∙∙∙∙∙∙∙∙∙∙∙∙∙∙∙∙∙∙∙∙∙∙∙∙∙∙∙∙∙∙∙∙∙∙∙ 29
2.5. SELECTING MEASUREMENT PARAMETERS ∙∙∙∙∙∙∙∙∙∙∙∙∙∙∙∙∙∙∙∙∙∙∙∙∙∙∙∙∙∙∙∙∙∙∙∙∙∙∙∙∙∙∙∙∙∙∙∙∙∙∙∙∙∙∙∙∙∙∙∙∙∙∙∙∙∙∙∙∙∙∙∙∙∙∙∙∙∙∙∙∙∙∙∙ 29
2.5.1. S‐ Parameters ∙∙∙∙∙∙∙∙∙∙∙∙∙∙∙∙∙∙∙∙∙∙∙∙∙∙∙∙∙∙∙∙∙∙∙∙∙∙∙∙∙∙∙∙∙∙∙∙∙∙∙∙∙∙∙∙∙∙∙∙∙∙∙∙∙∙∙∙∙∙∙∙∙∙∙∙∙∙∙∙∙∙∙∙∙∙∙∙∙∙∙∙∙∙∙∙∙∙∙∙∙∙∙∙∙∙∙∙∙∙∙∙∙∙∙∙∙∙∙ 29
2.5.2. Absolute Measurement ∙∙∙∙∙∙∙∙∙∙∙∙∙∙∙∙∙∙∙∙∙∙∙∙∙∙∙∙∙∙∙∙∙∙∙∙∙∙∙∙∙∙∙∙∙∙∙∙∙∙∙∙∙∙∙∙∙∙∙∙∙∙∙∙∙∙∙∙∙∙∙∙∙∙∙∙∙∙∙∙∙∙∙∙∙∙∙∙∙∙∙∙∙∙∙∙∙∙∙∙∙∙∙∙ 29
2.6. SELECTING A DATA FORMAT ∙∙∙∙∙∙∙∙∙∙∙∙∙∙∙∙∙∙∙∙∙∙∙∙∙∙∙∙∙∙∙∙∙∙∙∙∙∙∙∙∙∙∙∙∙∙∙∙∙∙∙∙∙∙∙∙∙∙∙∙∙∙∙∙∙∙∙∙∙∙∙∙∙∙∙∙∙∙∙∙∙∙∙∙∙∙∙∙∙∙∙∙∙∙∙∙∙∙∙∙∙∙∙∙∙ 31
2.6.1. Rectangular display formats ∙∙∙∙∙∙∙∙∙∙∙∙∙∙∙∙∙∙∙∙∙∙∙∙∙∙∙∙∙∙∙∙∙∙∙∙∙∙∙∙∙∙∙∙∙∙∙∙∙∙∙∙∙∙∙∙∙∙∙∙∙∙∙∙∙∙∙∙∙∙∙∙∙∙∙∙∙∙∙∙∙∙∙∙∙∙∙∙∙∙∙∙∙∙∙∙∙ 31 2.6.2. Polar format ∙∙∙∙∙∙∙∙∙∙∙∙∙∙∙∙∙∙∙∙∙∙∙∙∙∙∙∙∙∙∙∙∙∙∙∙∙∙∙∙∙∙∙∙∙∙∙∙∙∙∙∙∙∙∙∙∙∙∙∙∙∙∙∙∙∙∙∙∙∙∙∙∙∙∙∙∙∙∙∙∙∙∙∙∙∙∙∙∙∙∙∙∙∙∙∙∙∙∙∙∙∙∙∙∙∙∙∙∙∙∙∙∙∙∙∙∙∙∙∙∙∙ 33 2.6.3. Smith chart format ∙∙∙∙∙∙∙∙∙∙∙∙∙∙∙∙∙∙∙∙∙∙∙∙∙∙∙∙∙∙∙∙∙∙∙∙∙∙∙∙∙∙∙∙∙∙∙∙∙∙∙∙∙∙∙∙∙∙∙∙∙∙∙∙∙∙∙∙∙∙∙∙∙∙∙∙∙∙∙∙∙∙∙∙∙∙∙∙∙∙∙∙∙∙∙∙∙∙∙∙∙∙∙∙∙∙∙∙∙∙∙∙ 34
2.7. SETTING THE SCALES ∙∙∙∙∙∙∙∙∙∙∙∙∙∙∙∙∙∙∙∙∙∙∙∙∙∙∙∙∙∙∙∙∙∙∙∙∙∙∙∙∙∙∙∙∙∙∙∙∙∙∙∙∙∙∙∙∙∙∙∙∙∙∙∙∙∙∙∙∙∙∙∙∙∙∙∙∙∙∙∙∙∙∙∙∙∙∙∙∙∙∙∙∙∙∙∙∙∙∙∙∙∙∙∙∙∙∙∙∙∙∙∙∙∙∙ 34
2.7.1. Auto scale ∙∙∙∙∙∙∙∙∙∙∙∙∙∙∙∙∙∙∙∙∙∙∙∙∙∙∙∙∙∙∙∙∙∙∙∙∙∙∙∙∙∙∙∙∙∙∙∙∙∙∙∙∙∙∙∙∙∙∙∙∙∙∙∙∙∙∙∙∙∙∙∙∙∙∙∙∙∙∙∙∙∙∙∙∙∙∙∙∙∙∙∙∙∙∙∙∙∙∙∙∙∙∙∙∙∙∙∙∙∙∙∙∙∙∙∙∙∙∙∙∙∙∙∙∙ 34 2.7.2. Manual scale adjustment on a rectangular display format ∙∙∙∙∙∙∙∙∙∙∙∙∙∙∙∙∙∙∙∙∙∙∙∙∙∙∙∙∙∙∙∙∙∙∙∙∙∙∙∙∙∙∙∙∙∙∙∙∙∙∙∙ 35 2.7.3. Manual scale adjustment on the Smith chart/polar format ∙∙∙∙∙∙∙∙∙∙∙∙∙∙∙∙∙∙∙∙∙∙∙∙∙∙∙∙∙∙∙∙∙∙∙∙∙∙∙∙∙∙∙∙∙∙∙∙∙∙∙ 36 2.7.4. Other data settings ∙∙∙∙∙∙∙∙∙∙∙∙∙∙∙∙∙∙∙∙∙∙∙∙∙∙∙∙∙∙∙∙∙∙∙∙∙∙∙∙∙∙∙∙∙∙∙∙∙∙∙∙∙∙∙∙∙∙∙∙∙∙∙∙∙∙∙∙∙∙∙∙∙∙∙∙∙∙∙∙∙∙∙∙∙∙∙∙∙∙∙∙∙∙∙∙∙∙∙∙∙∙∙∙∙∙∙∙∙∙∙∙ 37

Transcom Vector Network Analyzer――Operating Manual
Transcom Instruments Co., Ltd. Tel: +86-21-64326888 Fax: +86-21-64326777 ‐ II-
2.8. SETTING WINDOW DISPLAYS ∙∙∙∙∙∙∙∙∙∙∙∙∙∙∙∙∙∙∙∙∙∙∙∙∙∙∙∙∙∙∙∙∙∙∙∙∙∙∙∙∙∙∙∙∙∙∙∙∙∙∙∙∙∙∙∙∙∙∙∙∙∙∙∙∙∙∙∙∙∙∙∙∙∙∙∙∙∙∙∙∙∙∙∙∙∙∙∙∙∙∙∙∙∙∙∙∙∙∙∙∙∙∙∙ 38
2.8.1. Maximizing a channel window ∙∙∙∙∙∙∙∙∙∙∙∙∙∙∙∙∙∙∙∙∙∙∙∙∙∙∙∙∙∙∙∙∙∙∙∙∙∙∙∙∙∙∙∙∙∙∙∙∙∙∙∙∙∙∙∙∙∙∙∙∙∙∙∙∙∙∙∙∙∙∙∙∙∙∙∙∙∙∙∙∙∙∙∙∙∙∙∙∙∙∙∙ 38
2.8.2. Maximizing a trace display ∙∙∙∙∙∙∙∙∙∙∙∙∙∙∙∙∙∙∙∙∙∙∙∙∙∙∙∙∙∙∙∙∙∙∙∙∙∙∙∙∙∙∙∙∙∙∙∙∙∙∙∙∙∙∙∙∙∙∙∙∙∙∙∙∙∙∙∙∙∙∙∙∙∙∙∙∙∙∙∙∙∙∙∙∙∙∙∙∙∙∙∙∙∙∙∙∙∙ 38 2.8.3. Comparing Traces/Performing Data Math ∙∙∙∙∙∙∙∙∙∙∙∙∙∙∙∙∙∙∙∙∙∙∙∙∙∙∙∙∙∙∙∙∙∙∙∙∙∙∙∙∙∙∙∙∙∙∙∙∙∙∙∙∙∙∙∙∙∙∙∙∙∙∙∙∙∙∙∙∙∙∙∙∙∙∙ 39 2.8.4. Labeling a window (Title) ∙∙∙∙∙∙∙∙∙∙∙∙∙∙∙∙∙∙∙∙∙∙∙∙∙∙∙∙∙∙∙∙∙∙∙∙∙∙∙∙∙∙∙∙∙∙∙∙∙∙∙∙∙∙∙∙∙∙∙∙∙∙∙∙∙∙∙∙∙∙∙∙∙∙∙∙∙∙∙∙∙∙∙∙∙∙∙∙∙∙∙∙∙∙∙∙∙∙∙∙ 40 2.8.5. Turn off the information update function of screen ∙∙∙∙∙∙∙∙∙∙∙∙∙∙∙∙∙∙∙∙∙∙∙∙∙∙∙∙∙∙∙∙∙∙∙∙∙∙∙∙∙∙∙∙∙∙∙∙∙∙∙∙∙∙∙∙∙∙∙∙∙∙ 40
3. Calibration ·············································································································· 42
3.1. CALIBRATION TYPES AND CHARACTERISTICS ∙∙∙∙∙∙∙∙∙∙∙∙∙∙∙∙∙∙∙∙∙∙∙∙∙∙∙∙∙∙∙∙∙∙∙∙∙∙∙∙∙∙∙∙∙∙∙∙∙∙∙∙∙∙∙∙∙∙∙∙∙∙∙∙∙∙∙∙∙∙∙∙∙∙∙∙∙∙∙ 42
3.2. CHECKING CALIBRATION STATUS ∙∙∙∙∙∙∙∙∙∙∙∙∙∙∙∙∙∙∙∙∙∙∙∙∙∙∙∙∙∙∙∙∙∙∙∙∙∙∙∙∙∙∙∙∙∙∙∙∙∙∙∙∙∙∙∙∙∙∙∙∙∙∙∙∙∙∙∙∙∙∙∙∙∙∙∙∙∙∙∙∙∙∙∙∙∙∙∙∙∙∙∙∙∙∙∙∙ 43
3.2.1. Execution Status of Error Correction for Each Channel ∙∙∙∙∙∙∙∙∙∙∙∙∙∙∙∙∙∙∙∙∙∙∙∙∙∙∙∙∙∙∙∙∙∙∙∙∙∙∙∙∙∙∙∙∙∙∙∙∙∙∙∙∙∙ 43 3.2.2. Execution Status of Error Correction for Each Trace ∙∙∙∙∙∙∙∙∙∙∙∙∙∙∙∙∙∙∙∙∙∙∙∙∙∙∙∙∙∙∙∙∙∙∙∙∙∙∙∙∙∙∙∙∙∙∙∙∙∙∙∙∙∙∙∙∙∙∙ 44
3.3. CALIBRATION PROCESS ∙∙∙∙∙∙∙∙∙∙∙∙∙∙∙∙∙∙∙∙∙∙∙∙∙∙∙∙∙∙∙∙∙∙∙∙∙∙∙∙∙∙∙∙∙∙∙∙∙∙∙∙∙∙∙∙∙∙∙∙∙∙∙∙∙∙∙∙∙∙∙∙∙∙∙∙∙∙∙∙∙∙∙∙∙∙∙∙∙∙∙∙∙∙∙∙∙∙∙∙∙∙∙∙∙∙∙∙∙∙∙∙∙ 45
3.3.1. Selecting Calibration Kit ∙∙∙∙∙∙∙∙∙∙∙∙∙∙∙∙∙∙∙∙∙∙∙∙∙∙∙∙∙∙∙∙∙∙∙∙∙∙∙∙∙∙∙∙∙∙∙∙∙∙∙∙∙∙∙∙∙∙∙∙∙∙∙∙∙∙∙∙∙∙∙∙∙∙∙∙∙∙∙∙∙∙∙∙∙∙∙∙∙∙∙∙∙∙∙∙∙∙∙∙∙∙ 45 3.3.2. OPEN/SHORT Response Calibration (reflection test) ∙∙∙∙∙∙∙∙∙∙∙∙∙∙∙∙∙∙∙∙∙∙∙∙∙∙∙∙∙∙∙∙∙∙∙∙∙∙∙∙∙∙∙∙∙∙∙∙∙∙∙∙∙∙∙∙∙ 46 3.3.3. THRU Response Calibration (transmission test) ∙∙∙∙∙∙∙∙∙∙∙∙∙∙∙∙∙∙∙∙∙∙∙∙∙∙∙∙∙∙∙∙∙∙∙∙∙∙∙∙∙∙∙∙∙∙∙∙∙∙∙∙∙∙∙∙∙∙∙∙∙∙∙∙∙∙ 48 3.3.4. 1-Port Calibration (reflection test) ∙∙∙∙∙∙∙∙∙∙∙∙∙∙∙∙∙∙∙∙∙∙∙∙∙∙∙∙∙∙∙∙∙∙∙∙∙∙∙∙∙∙∙∙∙∙∙∙∙∙∙∙∙∙∙∙∙∙∙∙∙∙∙∙∙∙∙∙∙∙∙∙∙∙∙∙∙∙∙∙∙∙∙∙∙∙∙ 49 3.3.5. One Path 2-Port Calibration ∙∙∙∙∙∙∙∙∙∙∙∙∙∙∙∙∙∙∙∙∙∙∙∙∙∙∙∙∙∙∙∙∙∙∙∙∙∙∙∙∙∙∙∙∙∙∙∙∙∙∙∙∙∙∙∙∙∙∙∙∙∙∙∙∙∙∙∙∙∙∙∙∙∙∙∙∙∙∙∙∙∙∙∙∙∙∙∙∙∙∙∙∙∙∙∙∙ 51 3.3.6. Full 2-Port Calibration ∙∙∙∙∙∙∙∙∙∙∙∙∙∙∙∙∙∙∙∙∙∙∙∙∙∙∙∙∙∙∙∙∙∙∙∙∙∙∙∙∙∙∙∙∙∙∙∙∙∙∙∙∙∙∙∙∙∙∙∙∙∙∙∙∙∙∙∙∙∙∙∙∙∙∙∙∙∙∙∙∙∙∙∙∙∙∙∙∙∙∙∙∙∙∙∙∙∙∙∙∙∙∙∙∙ 52
4. Making Measurements ·························································································· 55
4.1. SELECTING A TRIGGER MODE ∙∙∙∙∙∙∙∙∙∙∙∙∙∙∙∙∙∙∙∙∙∙∙∙∙∙∙∙∙∙∙∙∙∙∙∙∙∙∙∙∙∙∙∙∙∙∙∙∙∙∙∙∙∙∙∙∙∙∙∙∙∙∙∙∙∙∙∙∙∙∙∙∙∙∙∙∙∙∙∙∙∙∙∙∙∙∙∙∙∙∙∙∙∙∙∙∙∙∙∙∙∙∙ 55
4.2. GENERATING THE TRIGGER ∙∙∙∙∙∙∙∙∙∙∙∙∙∙∙∙∙∙∙∙∙∙∙∙∙∙∙∙∙∙∙∙∙∙∙∙∙∙∙∙∙∙∙∙∙∙∙∙∙∙∙∙∙∙∙∙∙∙∙∙∙∙∙∙∙∙∙∙∙∙∙∙∙∙∙∙∙∙∙∙∙∙∙∙∙∙∙∙∙∙∙∙∙∙∙∙∙∙∙∙∙∙∙∙∙∙ 56
5. Data Analysis ·········································································································· 57
5.1. ANALYZING DATA ON THE TRACE USING THE MARKER ∙∙∙∙∙∙∙∙∙∙∙∙∙∙∙∙∙∙∙∙∙∙∙∙∙∙∙∙∙∙∙∙∙∙∙∙∙∙∙∙∙∙∙∙∙∙∙∙∙∙∙∙∙∙∙∙∙∙∙∙∙∙∙∙ 57
5.1.1. About Marker Functions∙∙∙∙∙∙∙∙∙∙∙∙∙∙∙∙∙∙∙∙∙∙∙∙∙∙∙∙∙∙∙∙∙∙∙∙∙∙∙∙∙∙∙∙∙∙∙∙∙∙∙∙∙∙∙∙∙∙∙∙∙∙∙∙∙∙∙∙∙∙∙∙∙∙∙∙∙∙∙∙∙∙∙∙∙∙∙∙∙∙∙∙∙∙∙∙∙∙∙∙∙∙∙ 57 5.1.2. Reading Marker Values on Trace ∙∙∙∙∙∙∙∙∙∙∙∙∙∙∙∙∙∙∙∙∙∙∙∙∙∙∙∙∙∙∙∙∙∙∙∙∙∙∙∙∙∙∙∙∙∙∙∙∙∙∙∙∙∙∙∙∙∙∙∙∙∙∙∙∙∙∙∙∙∙∙∙∙∙∙∙∙∙∙∙∙∙∙∙∙∙∙∙∙ 57 5.1.3. Marker Operation ∙∙∙∙∙∙∙∙∙∙∙∙∙∙∙∙∙∙∙∙∙∙∙∙∙∙∙∙∙∙∙∙∙∙∙∙∙∙∙∙∙∙∙∙∙∙∙∙∙∙∙∙∙∙∙∙∙∙∙∙∙∙∙∙∙∙∙∙∙∙∙∙∙∙∙∙∙∙∙∙∙∙∙∙∙∙∙∙∙∙∙∙∙∙∙∙∙∙∙∙∙∙∙∙∙∙∙∙∙∙∙∙∙ 58 5.1.4. Marker Seartch ∙∙∙∙∙∙∙∙∙∙∙∙∙∙∙∙∙∙∙∙∙∙∙∙∙∙∙∙∙∙∙∙∙∙∙∙∙∙∙∙∙∙∙∙∙∙∙∙∙∙∙∙∙∙∙∙∙∙∙∙∙∙∙∙∙∙∙∙∙∙∙∙∙∙∙∙∙∙∙∙∙∙∙∙∙∙∙∙∙∙∙∙∙∙∙∙∙∙∙∙∙∙∙∙∙∙∙∙∙∙∙∙∙∙∙∙∙ 61 5.1.5. Marker Function ∙∙∙∙∙∙∙∙∙∙∙∙∙∙∙∙∙∙∙∙∙∙∙∙∙∙∙∙∙∙∙∙∙∙∙∙∙∙∙∙∙∙∙∙∙∙∙∙∙∙∙∙∙∙∙∙∙∙∙∙∙∙∙∙∙∙∙∙∙∙∙∙∙∙∙∙∙∙∙∙∙∙∙∙∙∙∙∙∙∙∙∙∙∙∙∙∙∙∙∙∙∙∙∙∙∙∙∙∙∙∙∙∙∙∙ 73
5.2. LIMIT TEST ∙∙∙∙∙∙∙∙∙∙∙∙∙∙∙∙∙∙∙∙∙∙∙∙∙∙∙∙∙∙∙∙∙∙∙∙∙∙∙∙∙∙∙∙∙∙∙∙∙∙∙∙∙∙∙∙∙∙∙∙∙∙∙∙∙∙∙∙∙∙∙∙∙∙∙∙∙∙∙∙∙∙∙∙∙∙∙∙∙∙∙∙∙∙∙∙∙∙∙∙∙∙∙∙∙∙∙∙∙∙∙∙∙∙∙∙∙∙∙∙∙∙∙∙∙∙∙∙∙∙∙ 76
5.2.1. Defining Limit Line ∙∙∙∙∙∙∙∙∙∙∙∙∙∙∙∙∙∙∙∙∙∙∙∙∙∙∙∙∙∙∙∙∙∙∙∙∙∙∙∙∙∙∙∙∙∙∙∙∙∙∙∙∙∙∙∙∙∙∙∙∙∙∙∙∙∙∙∙∙∙∙∙∙∙∙∙∙∙∙∙∙∙∙∙∙∙∙∙∙∙∙∙∙∙∙∙∙∙∙∙∙∙∙∙∙∙∙∙∙ 79 5.2.2. Limit line offset ∙∙∙∙∙∙∙∙∙∙∙∙∙∙∙∙∙∙∙∙∙∙∙∙∙∙∙∙∙∙∙∙∙∙∙∙∙∙∙∙∙∙∙∙∙∙∙∙∙∙∙∙∙∙∙∙∙∙∙∙∙∙∙∙∙∙∙∙∙∙∙∙∙∙∙∙∙∙∙∙∙∙∙∙∙∙∙∙∙∙∙∙∙∙∙∙∙∙∙∙∙∙∙∙∙∙∙∙∙∙∙∙∙∙∙∙ 80 5.2.3. Turning the limit test ON/OFF ∙∙∙∙∙∙∙∙∙∙∙∙∙∙∙∙∙∙∙∙∙∙∙∙∙∙∙∙∙∙∙∙∙∙∙∙∙∙∙∙∙∙∙∙∙∙∙∙∙∙∙∙∙∙∙∙∙∙∙∙∙∙∙∙∙∙∙∙∙∙∙∙∙∙∙∙∙∙∙∙∙∙∙∙∙∙∙∙∙∙∙∙∙ 81
5.3. RIPPLE TEST ∙∙∙∙∙∙∙∙∙∙∙∙∙∙∙∙∙∙∙∙∙∙∙∙∙∙∙∙∙∙∙∙∙∙∙∙∙∙∙∙∙∙∙∙∙∙∙∙∙∙∙∙∙∙∙∙∙∙∙∙∙∙∙∙∙∙∙∙∙∙∙∙∙∙∙∙∙∙∙∙∙∙∙∙∙∙∙∙∙∙∙∙∙∙∙∙∙∙∙∙∙∙∙∙∙∙∙∙∙∙∙∙∙∙∙∙∙∙∙∙∙∙∙∙∙∙∙∙∙ 82
5.3.1. Configuring Ripple Limit ∙∙∙∙∙∙∙∙∙∙∙∙∙∙∙∙∙∙∙∙∙∙∙∙∙∙∙∙∙∙∙∙∙∙∙∙∙∙∙∙∙∙∙∙∙∙∙∙∙∙∙∙∙∙∙∙∙∙∙∙∙∙∙∙∙∙∙∙∙∙∙∙∙∙∙∙∙∙∙∙∙∙∙∙∙∙∙∙∙∙∙∙∙∙∙∙∙∙∙∙∙ 83 5.3.2. Turning ON/OFF Ripple Test and Result Display ∙∙∙∙∙∙∙∙∙∙∙∙∙∙∙∙∙∙∙∙∙∙∙∙∙∙∙∙∙∙∙∙∙∙∙∙∙∙∙∙∙∙∙∙∙∙∙∙∙∙∙∙∙∙∙∙∙∙∙∙∙∙∙∙ 84
5.4. FIXTURE SIMULATOR ∙∙∙∙∙∙∙∙∙∙∙∙∙∙∙∙∙∙∙∙∙∙∙∙∙∙∙∙∙∙∙∙∙∙∙∙∙∙∙∙∙∙∙∙∙∙∙∙∙∙∙∙∙∙∙∙∙∙∙∙∙∙∙∙∙∙∙∙∙∙∙∙∙∙∙∙∙∙∙∙∙∙∙∙∙∙∙∙∙∙∙∙∙∙∙∙∙∙∙∙∙∙∙∙∙∙∙∙∙∙∙∙∙∙∙∙ 85
5.5. TIME DOMAIN ∙∙∙∙∙∙∙∙∙∙∙∙∙∙∙∙∙∙∙∙∙∙∙∙∙∙∙∙∙∙∙∙∙∙∙∙∙∙∙∙∙∙∙∙∙∙∙∙∙∙∙∙∙∙∙∙∙∙∙∙∙∙∙∙∙∙∙∙∙∙∙∙∙∙∙∙∙∙∙∙∙∙∙∙∙∙∙∙∙∙∙∙∙∙∙∙∙∙∙∙∙∙∙∙∙∙∙∙∙∙∙∙∙∙∙∙∙∙∙∙∙∙∙∙∙∙ 89
5.6. GATING ∙∙∙∙∙∙∙∙∙∙∙∙∙∙∙∙∙∙∙∙∙∙∙∙∙∙∙∙∙∙∙∙∙∙∙∙∙∙∙∙∙∙∙∙∙∙∙∙∙∙∙∙∙∙∙∙∙∙∙∙∙∙∙∙∙∙∙∙∙∙∙∙∙∙∙∙∙∙∙∙∙∙∙∙∙∙∙∙∙∙∙∙∙∙∙∙∙∙∙∙∙∙∙∙∙∙∙∙∙∙∙∙∙∙∙∙∙∙∙∙∙∙∙∙∙∙∙∙∙∙∙∙∙∙∙∙ 89
5.7. PERFORMING PARAMETER CONVERSION OF MEASUREMENT RESULTS ∙∙∙∙∙∙∙∙∙∙∙∙∙∙∙∙∙∙∙∙∙∙∙∙∙∙∙∙∙∙∙∙∙∙∙∙∙∙∙∙∙ 92
6. Data Output ············································································································ 95

Transcom Vector Network Analyzer――Operating Manual
Transcom Instruments Co., Ltd. Tel: +86-21-64326888 Fax: +86-21-64326777 ‐ III-
6.1. SAVING DATA ∙∙∙∙∙∙∙∙∙∙∙∙∙∙∙∙∙∙∙∙∙∙∙∙∙∙∙∙∙∙∙∙∙∙∙∙∙∙∙∙∙∙∙∙∙∙∙∙∙∙∙∙∙∙∙∙∙∙∙∙∙∙∙∙∙∙∙∙∙∙∙∙∙∙∙∙∙∙∙∙∙∙∙∙∙∙∙∙∙∙∙∙∙∙∙∙∙∙∙∙∙∙∙∙∙∙∙∙∙∙∙∙∙∙∙∙∙∙∙∙∙∙∙∙∙∙ 95
6.1.1. Overview Save Type ∙∙∙∙∙∙∙∙∙∙∙∙∙∙∙∙∙∙∙∙∙∙∙∙∙∙∙∙∙∙∙∙∙∙∙∙∙∙∙∙∙∙∙∙∙∙∙∙∙∙∙∙∙∙∙∙∙∙∙∙∙∙∙∙∙∙∙∙∙∙∙∙∙∙∙∙∙∙∙∙∙∙∙∙∙∙∙∙∙∙∙∙∙∙∙∙∙∙∙∙∙∙∙∙∙∙∙∙ 95 6.1.2. Saving Instrument State ∙∙∙∙∙∙∙∙∙∙∙∙∙∙∙∙∙∙∙∙∙∙∙∙∙∙∙∙∙∙∙∙∙∙∙∙∙∙∙∙∙∙∙∙∙∙∙∙∙∙∙∙∙∙∙∙∙∙∙∙∙∙∙∙∙∙∙∙∙∙∙∙∙∙∙∙∙∙∙∙∙∙∙∙∙∙∙∙∙∙∙∙∙∙∙∙∙∙∙∙∙∙∙ 96 6.1.3. Save Channel ∙∙∙∙∙∙∙∙∙∙∙∙∙∙∙∙∙∙∙∙∙∙∙∙∙∙∙∙∙∙∙∙∙∙∙∙∙∙∙∙∙∙∙∙∙∙∙∙∙∙∙∙∙∙∙∙∙∙∙∙∙∙∙∙∙∙∙∙∙∙∙∙∙∙∙∙∙∙∙∙∙∙∙∙∙∙∙∙∙∙∙∙∙∙∙∙∙∙∙∙∙∙∙∙∙∙∙∙∙∙∙∙∙∙∙∙∙∙∙∙ 96 6.1.4. Save Trace Data ∙∙∙∙∙∙∙∙∙∙∙∙∙∙∙∙∙∙∙∙∙∙∙∙∙∙∙∙∙∙∙∙∙∙∙∙∙∙∙∙∙∙∙∙∙∙∙∙∙∙∙∙∙∙∙∙∙∙∙∙∙∙∙∙∙∙∙∙∙∙∙∙∙∙∙∙∙∙∙∙∙∙∙∙∙∙∙∙∙∙∙∙∙∙∙∙∙∙∙∙∙∙∙∙∙∙∙∙∙∙∙∙∙∙∙∙ 97
6.2. SAVE DATA IN TOUTCHSTONE ∙∙∙∙∙∙∙∙∙∙∙∙∙∙∙∙∙∙∙∙∙∙∙∙∙∙∙∙∙∙∙∙∙∙∙∙∙∙∙∙∙∙∙∙∙∙∙∙∙∙∙∙∙∙∙∙∙∙∙∙∙∙∙∙∙∙∙∙∙∙∙∙∙∙∙∙∙∙∙∙∙∙∙∙∙∙∙∙∙∙∙∙∙∙∙∙∙∙∙∙∙ 98
6.3. RECALL ∙∙∙∙∙∙∙∙∙∙∙∙∙∙∙∙∙∙∙∙∙∙∙∙∙∙∙∙∙∙∙∙∙∙∙∙∙∙∙∙∙∙∙∙∙∙∙∙∙∙∙∙∙∙∙∙∙∙∙∙∙∙∙∙∙∙∙∙∙∙∙∙∙∙∙∙∙∙∙∙∙∙∙∙∙∙∙∙∙∙∙∙∙∙∙∙∙∙∙∙∙∙∙∙∙∙∙∙∙∙∙∙∙∙∙∙∙∙∙∙∙∙∙∙∙∙∙∙∙∙∙∙∙∙∙∙ 99
6.3.1. Recall State ∙∙∙∙∙∙∙∙∙∙∙∙∙∙∙∙∙∙∙∙∙∙∙∙∙∙∙∙∙∙∙∙∙∙∙∙∙∙∙∙∙∙∙∙∙∙∙∙∙∙∙∙∙∙∙∙∙∙∙∙∙∙∙∙∙∙∙∙∙∙∙∙∙∙∙∙∙∙∙∙∙∙∙∙∙∙∙∙∙∙∙∙∙∙∙∙∙∙∙∙∙∙∙∙∙∙∙∙∙∙∙∙∙∙∙∙∙∙∙∙∙∙∙ 99 6.3.2. Recall Channel ∙∙∙∙∙∙∙∙∙∙∙∙∙∙∙∙∙∙∙∙∙∙∙∙∙∙∙∙∙∙∙∙∙∙∙∙∙∙∙∙∙∙∙∙∙∙∙∙∙∙∙∙∙∙∙∙∙∙∙∙∙∙∙∙∙∙∙∙∙∙∙∙∙∙∙∙∙∙∙∙∙∙∙∙∙∙∙∙∙∙∙∙∙∙∙∙∙∙∙∙∙∙∙∙∙∙∙∙∙∙∙∙∙∙∙ 100 6.3.3. Delete State ∙∙∙∙∙∙∙∙∙∙∙∙∙∙∙∙∙∙∙∙∙∙∙∙∙∙∙∙∙∙∙∙∙∙∙∙∙∙∙∙∙∙∙∙∙∙∙∙∙∙∙∙∙∙∙∙∙∙∙∙∙∙∙∙∙∙∙∙∙∙∙∙∙∙∙∙∙∙∙∙∙∙∙∙∙∙∙∙∙∙∙∙∙∙∙∙∙∙∙∙∙∙∙∙∙∙∙∙∙∙∙∙∙∙∙∙∙∙∙∙ 101 6.3.4. Delete All State ∙∙∙∙∙∙∙∙∙∙∙∙∙∙∙∙∙∙∙∙∙∙∙∙∙∙∙∙∙∙∙∙∙∙∙∙∙∙∙∙∙∙∙∙∙∙∙∙∙∙∙∙∙∙∙∙∙∙∙∙∙∙∙∙∙∙∙∙∙∙∙∙∙∙∙∙∙∙∙∙∙∙∙∙∙∙∙∙∙∙∙∙∙∙∙∙∙∙∙∙∙∙∙∙∙∙∙∙∙∙∙∙∙∙ 102
7. Optimizing Measurements ·················································································· 103
7.1. EXPANDING DYNAMIC RANGE ∙∙∙∙∙∙∙∙∙∙∙∙∙∙∙∙∙∙∙∙∙∙∙∙∙∙∙∙∙∙∙∙∙∙∙∙∙∙∙∙∙∙∙∙∙∙∙∙∙∙∙∙∙∙∙∙∙∙∙∙∙∙∙∙∙∙∙∙∙∙∙∙∙∙∙∙∙∙∙∙∙∙∙∙∙∙∙∙∙∙∙∙∙∙∙∙∙∙∙ 103
7.1.1. Narrowing the IF bandwidth ∙∙∙∙∙∙∙∙∙∙∙∙∙∙∙∙∙∙∙∙∙∙∙∙∙∙∙∙∙∙∙∙∙∙∙∙∙∙∙∙∙∙∙∙∙∙∙∙∙∙∙∙∙∙∙∙∙∙∙∙∙∙∙∙∙∙∙∙∙∙∙∙∙∙∙∙∙∙∙∙∙∙∙∙∙∙∙∙∙∙∙∙∙∙ 103 7.1.2. Turning on Sweep Averaging ∙∙∙∙∙∙∙∙∙∙∙∙∙∙∙∙∙∙∙∙∙∙∙∙∙∙∙∙∙∙∙∙∙∙∙∙∙∙∙∙∙∙∙∙∙∙∙∙∙∙∙∙∙∙∙∙∙∙∙∙∙∙∙∙∙∙∙∙∙∙∙∙∙∙∙∙∙∙∙∙∙∙∙∙∙∙∙∙∙∙∙∙∙ 103
7.2. REDUCING TRACE NOISE ∙∙∙∙∙∙∙∙∙∙∙∙∙∙∙∙∙∙∙∙∙∙∙∙∙∙∙∙∙∙∙∙∙∙∙∙∙∙∙∙∙∙∙∙∙∙∙∙∙∙∙∙∙∙∙∙∙∙∙∙∙∙∙∙∙∙∙∙∙∙∙∙∙∙∙∙∙∙∙∙∙∙∙∙∙∙∙∙∙∙∙∙∙∙∙∙∙∙∙∙∙∙∙∙∙∙∙∙ 104
7.3. IMPROVING PHASE MEASUREMENT ACCURACY ∙∙∙∙∙∙∙∙∙∙∙∙∙∙∙∙∙∙∙∙∙∙∙∙∙∙∙∙∙∙∙∙∙∙∙∙∙∙∙∙∙∙∙∙∙∙∙∙∙∙∙∙∙∙∙∙∙∙∙∙∙∙∙∙∙∙∙∙∙∙∙∙∙ 105
7.3.1. Electrical Delay ∙∙∙∙∙∙∙∙∙∙∙∙∙∙∙∙∙∙∙∙∙∙∙∙∙∙∙∙∙∙∙∙∙∙∙∙∙∙∙∙∙∙∙∙∙∙∙∙∙∙∙∙∙∙∙∙∙∙∙∙∙∙∙∙∙∙∙∙∙∙∙∙∙∙∙∙∙∙∙∙∙∙∙∙∙∙∙∙∙∙∙∙∙∙∙∙∙∙∙∙∙∙∙∙∙∙∙∙∙∙∙∙∙∙ 105 7.3.2. Phase Offset ∙∙∙∙∙∙∙∙∙∙∙∙∙∙∙∙∙∙∙∙∙∙∙∙∙∙∙∙∙∙∙∙∙∙∙∙∙∙∙∙∙∙∙∙∙∙∙∙∙∙∙∙∙∙∙∙∙∙∙∙∙∙∙∙∙∙∙∙∙∙∙∙∙∙∙∙∙∙∙∙∙∙∙∙∙∙∙∙∙∙∙∙∙∙∙∙∙∙∙∙∙∙∙∙∙∙∙∙∙∙∙∙∙∙∙∙∙∙∙ 105
7.4. IMPROVE THE MEASUREMENT SPEED ∙∙∙∙∙∙∙∙∙∙∙∙∙∙∙∙∙∙∙∙∙∙∙∙∙∙∙∙∙∙∙∙∙∙∙∙∙∙∙∙∙∙∙∙∙∙∙∙∙∙∙∙∙∙∙∙∙∙∙∙∙∙∙∙∙∙∙∙∙∙∙∙∙∙∙∙∙∙∙∙∙∙∙∙∙∙∙∙∙∙ 106
7.4.1. Turn Off Update ∙∙∙∙∙∙∙∙∙∙∙∙∙∙∙∙∙∙∙∙∙∙∙∙∙∙∙∙∙∙∙∙∙∙∙∙∙∙∙∙∙∙∙∙∙∙∙∙∙∙∙∙∙∙∙∙∙∙∙∙∙∙∙∙∙∙∙∙∙∙∙∙∙∙∙∙∙∙∙∙∙∙∙∙∙∙∙∙∙∙∙∙∙∙∙∙∙∙∙∙∙∙∙∙∙∙∙∙∙∙∙∙∙ 106 7.4.2. Turn Off Correction ∙∙∙∙∙∙∙∙∙∙∙∙∙∙∙∙∙∙∙∙∙∙∙∙∙∙∙∙∙∙∙∙∙∙∙∙∙∙∙∙∙∙∙∙∙∙∙∙∙∙∙∙∙∙∙∙∙∙∙∙∙∙∙∙∙∙∙∙∙∙∙∙∙∙∙∙∙∙∙∙∙∙∙∙∙∙∙∙∙∙∙∙∙∙∙∙∙∙∙∙∙∙∙∙∙∙∙ 106 7.4.3. Performing a Segment-by-Segment Sweep ∙∙∙∙∙∙∙∙∙∙∙∙∙∙∙∙∙∙∙∙∙∙∙∙∙∙∙∙∙∙∙∙∙∙∙∙∙∙∙∙∙∙∙∙∙∙∙∙∙∙∙∙∙∙∙∙∙∙∙∙∙∙∙∙∙∙∙∙∙∙∙∙ 107
8. System Function ··································································································· 111
8.1. PRINT ∙∙∙∙∙∙∙∙∙∙∙∙∙∙∙∙∙∙∙∙∙∙∙∙∙∙∙∙∙∙∙∙∙∙∙∙∙∙∙∙∙∙∙∙∙∙∙∙∙∙∙∙∙∙∙∙∙∙∙∙∙∙∙∙∙∙∙∙∙∙∙∙∙∙∙∙∙∙∙∙∙∙∙∙∙∙∙∙∙∙∙∙∙∙∙∙∙∙∙∙∙∙∙∙∙∙∙∙∙∙∙∙∙∙∙∙∙∙∙∙∙∙∙∙∙∙∙∙∙∙∙∙∙∙∙∙∙ 111
8.1.1. Print Function ∙∙∙∙∙∙∙∙∙∙∙∙∙∙∙∙∙∙∙∙∙∙∙∙∙∙∙∙∙∙∙∙∙∙∙∙∙∙∙∙∙∙∙∙∙∙∙∙∙∙∙∙∙∙∙∙∙∙∙∙∙∙∙∙∙∙∙∙∙∙∙∙∙∙∙∙∙∙∙∙∙∙∙∙∙∙∙∙∙∙∙∙∙∙∙∙∙∙∙∙∙∙∙∙∙∙∙∙∙∙∙∙∙∙∙∙∙ 111 8.1.2. Save Image To File ∙∙∙∙∙∙∙∙∙∙∙∙∙∙∙∙∙∙∙∙∙∙∙∙∙∙∙∙∙∙∙∙∙∙∙∙∙∙∙∙∙∙∙∙∙∙∙∙∙∙∙∙∙∙∙∙∙∙∙∙∙∙∙∙∙∙∙∙∙∙∙∙∙∙∙∙∙∙∙∙∙∙∙∙∙∙∙∙∙∙∙∙∙∙∙∙∙∙∙∙∙∙∙∙∙∙∙∙∙ 111
8.2. MISC SETUP ∙∙∙∙∙∙∙∙∙∙∙∙∙∙∙∙∙∙∙∙∙∙∙∙∙∙∙∙∙∙∙∙∙∙∙∙∙∙∙∙∙∙∙∙∙∙∙∙∙∙∙∙∙∙∙∙∙∙∙∙∙∙∙∙∙∙∙∙∙∙∙∙∙∙∙∙∙∙∙∙∙∙∙∙∙∙∙∙∙∙∙∙∙∙∙∙∙∙∙∙∙∙∙∙∙∙∙∙∙∙∙∙∙∙∙∙∙∙∙∙∙∙∙∙∙∙∙ 112
8.2.1. Ref Source setup ∙∙∙∙∙∙∙∙∙∙∙∙∙∙∙∙∙∙∙∙∙∙∙∙∙∙∙∙∙∙∙∙∙∙∙∙∙∙∙∙∙∙∙∙∙∙∙∙∙∙∙∙∙∙∙∙∙∙∙∙∙∙∙∙∙∙∙∙∙∙∙∙∙∙∙∙∙∙∙∙∙∙∙∙∙∙∙∙∙∙∙∙∙∙∙∙∙∙∙∙∙∙∙∙∙∙∙∙∙∙∙∙ 112 8.2.2. System Correction ∙∙∙∙∙∙∙∙∙∙∙∙∙∙∙∙∙∙∙∙∙∙∙∙∙∙∙∙∙∙∙∙∙∙∙∙∙∙∙∙∙∙∙∙∙∙∙∙∙∙∙∙∙∙∙∙∙∙∙∙∙∙∙∙∙∙∙∙∙∙∙∙∙∙∙∙∙∙∙∙∙∙∙∙∙∙∙∙∙∙∙∙∙∙∙∙∙∙∙∙∙∙∙∙∙∙∙∙∙∙ 112 8.2.3. Beeper Setup ∙∙∙∙∙∙∙∙∙∙∙∙∙∙∙∙∙∙∙∙∙∙∙∙∙∙∙∙∙∙∙∙∙∙∙∙∙∙∙∙∙∙∙∙∙∙∙∙∙∙∙∙∙∙∙∙∙∙∙∙∙∙∙∙∙∙∙∙∙∙∙∙∙∙∙∙∙∙∙∙∙∙∙∙∙∙∙∙∙∙∙∙∙∙∙∙∙∙∙∙∙∙∙∙∙∙∙∙∙∙∙∙∙∙∙∙∙∙ 113 8.2.4. Locking the Front Keys and the Touchscreen ∙∙∙∙∙∙∙∙∙∙∙∙∙∙∙∙∙∙∙∙∙∙∙∙∙∙∙∙∙∙∙∙∙∙∙∙∙∙∙∙∙∙∙∙∙∙∙∙∙∙∙∙∙∙∙∙∙∙∙∙∙∙∙∙∙∙∙∙ 114 8.2.5. Setup the color of trace∙∙∙∙∙∙∙∙∙∙∙∙∙∙∙∙∙∙∙∙∙∙∙∙∙∙∙∙∙∙∙∙∙∙∙∙∙∙∙∙∙∙∙∙∙∙∙∙∙∙∙∙∙∙∙∙∙∙∙∙∙∙∙∙∙∙∙∙∙∙∙∙∙∙∙∙∙∙∙∙∙∙∙∙∙∙∙∙∙∙∙∙∙∙∙∙∙∙∙∙∙∙∙ 114 8.2.6. Time Setup ∙∙∙∙∙∙∙∙∙∙∙∙∙∙∙∙∙∙∙∙∙∙∙∙∙∙∙∙∙∙∙∙∙∙∙∙∙∙∙∙∙∙∙∙∙∙∙∙∙∙∙∙∙∙∙∙∙∙∙∙∙∙∙∙∙∙∙∙∙∙∙∙∙∙∙∙∙∙∙∙∙∙∙∙∙∙∙∙∙∙∙∙∙∙∙∙∙∙∙∙∙∙∙∙∙∙∙∙∙∙∙∙∙∙∙∙∙∙∙∙∙ 114 8.2.7. Touchscreen Calibration ∙∙∙∙∙∙∙∙∙∙∙∙∙∙∙∙∙∙∙∙∙∙∙∙∙∙∙∙∙∙∙∙∙∙∙∙∙∙∙∙∙∙∙∙∙∙∙∙∙∙∙∙∙∙∙∙∙∙∙∙∙∙∙∙∙∙∙∙∙∙∙∙∙∙∙∙∙∙∙∙∙∙∙∙∙∙∙∙∙∙∙∙∙∙∙∙∙∙∙∙∙ 115
8.3. LAN SETUP ∙∙∙∙∙∙∙∙∙∙∙∙∙∙∙∙∙∙∙∙∙∙∙∙∙∙∙∙∙∙∙∙∙∙∙∙∙∙∙∙∙∙∙∙∙∙∙∙∙∙∙∙∙∙∙∙∙∙∙∙∙∙∙∙∙∙∙∙∙∙∙∙∙∙∙∙∙∙∙∙∙∙∙∙∙∙∙∙∙∙∙∙∙∙∙∙∙∙∙∙∙∙∙∙∙∙∙∙∙∙∙∙∙∙∙∙∙∙∙∙∙∙∙∙∙∙∙∙ 115
8.4. PRESET ∙∙∙∙∙∙∙∙∙∙∙∙∙∙∙∙∙∙∙∙∙∙∙∙∙∙∙∙∙∙∙∙∙∙∙∙∙∙∙∙∙∙∙∙∙∙∙∙∙∙∙∙∙∙∙∙∙∙∙∙∙∙∙∙∙∙∙∙∙∙∙∙∙∙∙∙∙∙∙∙∙∙∙∙∙∙∙∙∙∙∙∙∙∙∙∙∙∙∙∙∙∙∙∙∙∙∙∙∙∙∙∙∙∙∙∙∙∙∙∙∙∙∙∙∙∙∙∙∙∙∙∙∙∙∙ 118
8.5. FILE MANAGE ∙∙∙∙∙∙∙∙∙∙∙∙∙∙∙∙∙∙∙∙∙∙∙∙∙∙∙∙∙∙∙∙∙∙∙∙∙∙∙∙∙∙∙∙∙∙∙∙∙∙∙∙∙∙∙∙∙∙∙∙∙∙∙∙∙∙∙∙∙∙∙∙∙∙∙∙∙∙∙∙∙∙∙∙∙∙∙∙∙∙∙∙∙∙∙∙∙∙∙∙∙∙∙∙∙∙∙∙∙∙∙∙∙∙∙∙∙∙∙∙∙∙∙∙ 118
8.6. UPDATE THE INSTRUMENT SOFTWARE ∙∙∙∙∙∙∙∙∙∙∙∙∙∙∙∙∙∙∙∙∙∙∙∙∙∙∙∙∙∙∙∙∙∙∙∙∙∙∙∙∙∙∙∙∙∙∙∙∙∙∙∙∙∙∙∙∙∙∙∙∙∙∙∙∙∙∙∙∙∙∙∙∙∙∙∙∙∙∙∙∙∙∙∙∙∙∙∙ 119
8.7. ABOUT ∙∙∙∙∙∙∙∙∙∙∙∙∙∙∙∙∙∙∙∙∙∙∙∙∙∙∙∙∙∙∙∙∙∙∙∙∙∙∙∙∙∙∙∙∙∙∙∙∙∙∙∙∙∙∙∙∙∙∙∙∙∙∙∙∙∙∙∙∙∙∙∙∙∙∙∙∙∙∙∙∙∙∙∙∙∙∙∙∙∙∙∙∙∙∙∙∙∙∙∙∙∙∙∙∙∙∙∙∙∙∙∙∙∙∙∙∙∙∙∙∙∙∙∙∙∙∙∙∙∙∙∙∙∙∙∙ 120
9. Troubleshooting ···································································································· 121

Transcom Vector Network Analyzer――Operating Manual
Transcom Instruments Co., Ltd. Tel: +86-21-64326888 Fax: +86-21-64326777 ‐ IV-
10. Default Parameters ···························································································· 122
11. Scope of Parameter Settings ·············································································· 127

Transcom Vector Network Analyzer――Operating Manual
Transcom Instruments Co., Ltd. Tel: +86-21-64326888 Fax: +86-21-64326777 ‐ 1-
1. GENERAL OVERVIEW
1.1. Symbol Definitions
hardkey Indicates a hardkey (key on the front panel or external
keyboard) .
“Sweep Type”softkey Indicates a menu/button/box on the screen labeled
“Sample” which can be selected/executed by
clicking.
VNA Denotes T5113A/T5215A/T5230A/T5231A/T5280A
1.2. Introduction of Instruments
1.2.1. Front Panel

Transcom Vector Network Analyzer――Operating Manual
Transcom Instruments Co., Ltd. Tel: +86-21-64326888 Fax: +86-21-64326777 ‐ 2-
Figure 1-1 Front Panel (T5113A/T5215A/T5230A/T5280A)
10.4”LCD Touch Screen Panel Key
Front USB Port Front Power Switch Probe Power

Transcom Vector Network Analyzer――Operating Manual
Transcom Instruments Co., Ltd. Tel: +86-21-64326888 Fax: +86-21-64326777 ‐ 3-
Figure 1-2 Front Panel(T5231A)
10.4”LCD Touch Screen
Panel Key
Test ports
Handle

Transcom Vector Network Analyzer――Operating Manual
Transcom Instruments Co., Ltd. Tel: +86-21-64326888 Fax: +86-21-64326777 ‐ 4-
1.2.1.1. Panel Keyboard The front panel buttons are show as below:
Figure 1-3 General view of front panel(T5113A/T5215A/T5230A/T5280A)

Transcom Vector Network Analyzer――Operating Manual
Transcom Instruments Co., Ltd. Tel: +86-21-64326888 Fax: +86-21-64326777 ‐ 5-
Figure 1-4 General view of front panel(T5231A)
Description of main keys:
1. ACTIVE CH/TRACE Block
A group of keys for selecting active channels and traces.
Key Name Description
Channel Prev Selects the previous channel as the active channel. (Each time
the key is pressed causes the active channel to step down from
the channel with the currently designated number to one with a
smaller channel number).
Channel Next Selects the next channel as the active channel. (Each time the

Transcom Vector Network Analyzer――Operating Manual
Transcom Instruments Co., Ltd. Tel: +86-21-64326888 Fax: +86-21-64326777 ‐ 6-
key is pressed causes the active channel to step up from the
channel with the currently designated number to one with a
larger channel number). A channel must be active before you
can define such parameters as the sweep range. To change the
settings for a channel, use this key to first make the channel
active.
Trace Prev Selects the previous trace as the active trace. (Each time the key
is pressed causes the active trace to step down from the trace
with the currently designated number to one with a smaller
trace number.)
Trace Next Selects the next trace as the active trace. (Each time the key is
pressed causes the active trace to step up from the trace with the
currently designated number to one with a larger channel
number.) A trace must be active before you can define
measurement parameters and other settings. To change the
settings for a trace, use this key to first make the trace active.
2. MKR/ANALYSIS Block
Key Name Description
Marker Displays the Marker Menu on the right side of the screen.
Manipulating the Marker Menu VNAbles you to add markers
and move them by entering stimulus values. You can place up
to 16 markers on each trace.
Marker Search Displays the Marker Search Menu on the right side of the
screen. Manipulating the Marker Search Menu VNAbles you to
move a marker to a specific point (maximum, minimum, peak,
and a point with a target value) on a trace. You can also find the
bandwidth parameters and display them.
Marker Fctn Displays the Marker Function Menu on the right side of the
Transcom Vector Network Analyzer――Operating Manual
Transcom Instruments Co., Ltd. Tel: +86-21-64326888 Fax: +86-21-64326777 ‐ 7-
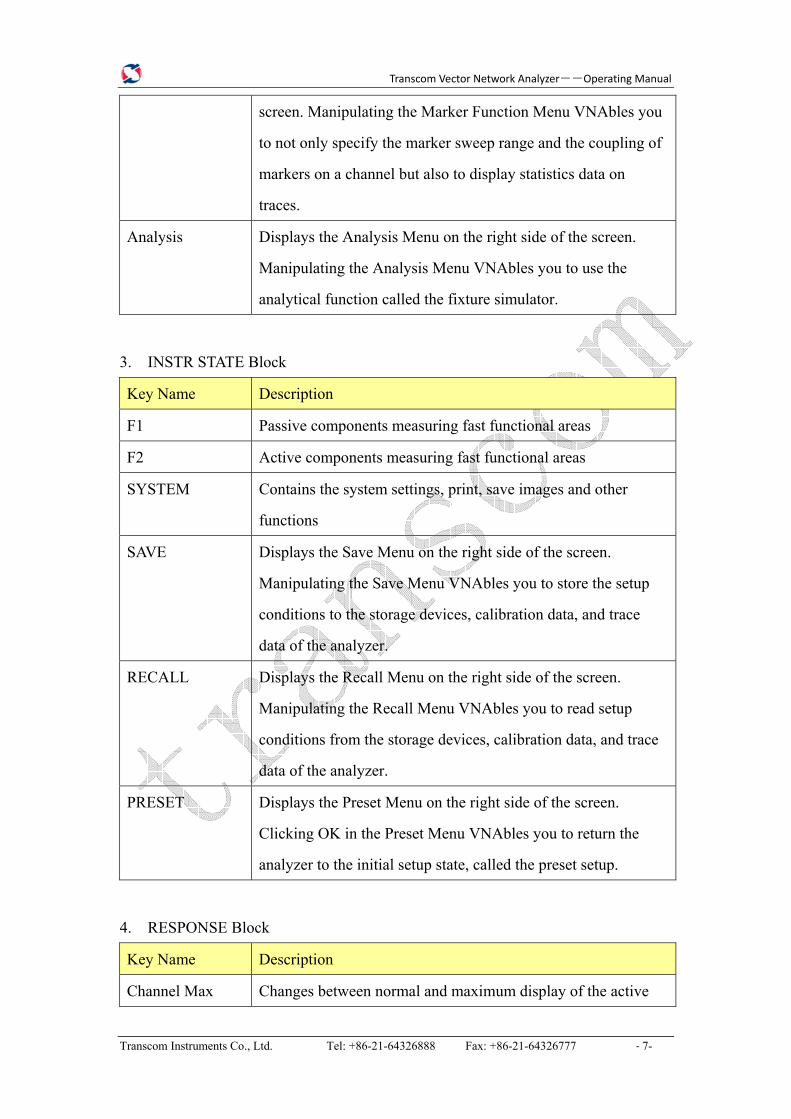
screen. Manipulating the Marker Function Menu VNAbles you
to not only specify the marker sweep range and the coupling of
markers on a channel but also to display statistics data on
traces.
Analysis Displays the Analysis Menu on the right side of the screen.
Manipulating the Analysis Menu VNAbles you to use the
analytical function called the fixture simulator.
3. INSTR STATE Block
Key Name Description
F1 Passive components measuring fast functional areas
F2 Active components measuring fast functional areas
SYSTEM Contains the system settings, print, save images and other
functions
SAVE Displays the Save Menu on the right side of the screen.
Manipulating the Save Menu VNAbles you to store the setup
conditions to the storage devices, calibration data, and trace
data of the analyzer.
RECALL Displays the Recall Menu on the right side of the screen.
Manipulating the Recall Menu VNAbles you to read setup
conditions from the storage devices, calibration data, and trace
data of the analyzer.
PRESET Displays the Preset Menu on the right side of the screen.
Clicking OK in the Preset Menu VNAbles you to return the
analyzer to the initial setup state, called the preset setup.
4. RESPONSE Block
Key Name Description
Channel Max Changes between normal and maximum display of the active

Transcom Vector Network Analyzer――Operating Manual
Transcom Instruments Co., Ltd. Tel: +86-21-64326888 Fax: +86-21-64326777 ‐ 8-
channel window. In normal display, all of the defined channel
windows (both active and non-active) are displayed in split
views on the screen. In maximum display, only the active
channel window is displayed over the entire area, with
non-active windows not displayed. To maximize the active
channel, double-click the channel window frame.
Measurements are also carried out on the non-active channels
that are not displayed.
Trace Max Changes between normal and maximum display of the active
trace window. In normal display, all of the defined channel
windows (both active and non-active) are displayed in split
views on the screen. In maximum display, only the active trace
window is displayed over the entire area, with non-active
windows not displayed. To maximize the active trace,
double-click the trace window frame. Measurements are also
carried out on the non-active channels that are not displayed.
Meas Displays the Measurement Menu on the right side of the screen.
Manipulating the Measurement Menu VNAbles you to specify
the measurement parameters (types of S-parameters) for each
trace.
Format Displays the Format Menu on the right side of the screen.
Manipulating the Format Menu VNAbles you to specify the
data format (data transformation and graph formats) for each
trace.
Scale Displays the Scale Menu on the right side of the screen.
Manipulating the Scale Menu VNAbles you to specify the scale
for displaying a trace (magnitude per division, value of the
reference line, etc.) for each trace. You can also specify the
electrical delay and phase offset for each trace.

Transcom Vector Network Analyzer――Operating Manual
Transcom Instruments Co., Ltd. Tel: +86-21-64326888 Fax: +86-21-64326777 ‐ 9-
Display Displays the Display Menu on the right side of the screen.
Manipulating the Display Menu VNAbles you to specify the
number of channels and the channel window array, the number
and arrangement of traces, the setup for data math, etc.
Avg Displays the Average Menu on the right side of the screen.
Manipulating the Average Menu VNAbles you to define the
averaging, smoothing, and IF bandwidth.
Cal Displays the Calibration Menu on the right side of the screen.
Manipulating the Calibration Menu VNAbles you to turn the
calibration and error correction on/off and change definitions
for calibration kits.
5. STIMULUS Block
Key Name Description
Start Displays the data entry bar for specifying the start value of the
sweep range in the upper part of the screen. (It also displays the
Stimulus Menu for specifying the sweep range on the right side
of the screen.)
Stop Displays the data entry bar for specifying the stop value of the
sweep range in the upper part of the screen. (It also displays the
Stimulus Menu in the same way as Start Key.)
Center Displays the data entry bar for specifying the center value of
the sweep range in the upper part of the screen. (It also displays
the Stimulus Menu in the same way as Start Key.)
Span Displays the data entry bar for specifying the span value of the
sweep range in the upper part of the screen. (It also displays the
Stimulus Menu in the same way as Start Key.)
Sweep Setup Displays the Sweep Setup Menu on the right side of the screen.
Manipulating the Sweep Setup Menu VNAbles you to specify

Transcom Vector Network Analyzer――Operating Manual
Transcom Instruments Co., Ltd. Tel: +86-21-64326888 Fax: +86-21-64326777 ‐ 10-
the signal source power level, sweep time, number of points,
sweep type, etc.
Trigger Displays the Trigger Menu on the right side of the screen.
Manipulating the Trigger Menu VNAbles you to specify the
trigger mode and trigger source. You can specify the trigger
mode for each channel.
6. NAVIGATION Block
Key Name Description
Knob
(turned clockwise
or
counterclockwise)
Moves the softkey selection (highlighted display) up or down.
Increases or decreases the numeric value in the data entry area
in small steps.
Moves the softkey selection (highlighted display) up or down.
Increases or decreases the numeric value in the data entry area
in large steps.
Displays the softkey menu one layer below.
Moves the cursor (|) in the data entry area laterally back and
forth. Use it together with the ENTRY Block keys to change
data one character at a time.
Displays the softkey menu one layer above.
Moves the cursor (|) in the data entry area laterally back and
forth. Use it together with the ENTRY Block keys to change
data one character at a time.
Knob or
Enter key
(pressed)
Executes the function of the selected softkey.
Finishes the entry in the data entry area and moves the focus to
the softkey menu.
7. ENTRY Block
Transcom Vector Network Analyzer――Operating Manual
Transcom Instruments Co., Ltd. Tel: +86-21-64326888 Fax: +86-21-64326777 ‐ 11-
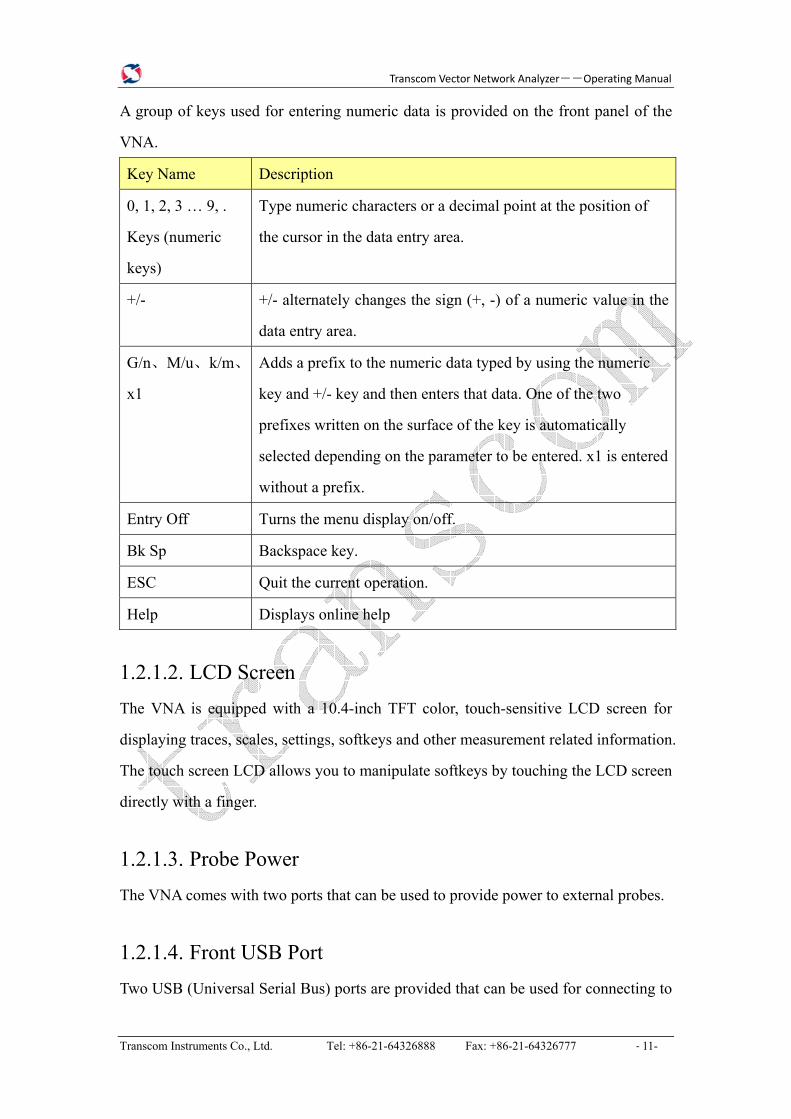
A group of keys used for entering numeric data is provided on the front panel of the
VNA.
Key Name Description
0, 1, 2, 3 … 9, .
Keys (numeric
keys)
Type numeric characters or a decimal point at the position of
the cursor in the data entry area.
+/- +/- alternately changes the sign (+, -) of a numeric value in the
data entry area.
G/n、M/u、k/m、
x1
Adds a prefix to the numeric data typed by using the numeric
key and +/- key and then enters that data. One of the two
prefixes written on the surface of the key is automatically
selected depending on the parameter to be entered. x1 is entered
without a prefix.
Entry Off Turns the menu display on/off.
Bk Sp Backspace key.
ESC Quit the current operation.
Help Displays online help
1.2.1.2. LCD Screen The VNA is equipped with a 10.4-inch TFT color, touch-sensitive LCD screen for
displaying traces, scales, settings, softkeys and other measurement related information.
The touch screen LCD allows you to manipulate softkeys by touching the LCD screen
directly with a finger.
1.2.1.3. Probe Power The VNA comes with two ports that can be used to provide power to external probes.
1.2.1.4. Front USB Port Two USB (Universal Serial Bus) ports are provided that can be used for connecting to

Transcom Vector Network Analyzer――Operating Manual
Transcom Instruments Co., Ltd. Tel: +86-21-64326888 Fax: +86-21-64326777 ‐ 12-
USB, Multiport test set or a printer. Connecting a compatible printer to this port.
1.2.1.5. Test Port The port to which the DUT is connected. While signals are being output from a test
port, the yellow LED above the test port is lit.
1.2.1.6. Power Switch Used to turn on or off the VNA.
1.2.2. Rear Panel Names and Functions of Parts:

Transcom Vector Network Analyzer――Operating Manual
Transcom Instruments Co., Ltd. Tel: +86-21-64326888 Fax: +86-21-64326777 ‐ 13-
Figure 1-5 General view of rear panel(T5113A/T5215A/T5230A/T5280A)
1. GPIB Port
The connection of an external controller through General Purpose Interface Bus
(GPIB) connector allows you to configure an automatic measurement system.
This GPIB connector is used only for controlling the VNA from an external controller.
Use USB/GPIB interface to control other devices from the VNA. You cannot control
other devices from the VNA through this GPIB connector.
2. VIDEO Port
A terminal to which an external color monitor (display device) can be connected. By
connecting a color monitor to this terminal, the same information shown on the LCD
screen of the main body can be displayed on an external color monitor.
Connector type: 15-pin VGA connector, female
3. USB Port
Reference OUT/IN
GPIB Port VIDEO Port USB Port Ethernet Port
Line Switch
Trigger Ground Terminal
Power Cable Receptacle

Transcom Vector Network Analyzer――Operating Manual
Transcom Instruments Co., Ltd. Tel: +86-21-64326888 Fax: +86-21-64326777 ‐ 14-
Three USB (Universal Serial Bus) ports are provided that can be used for connecting
to USB, Multiport test set or a printer.
4. Ethernet Port
A terminal for connecting the VNA to a LAN (Local Area Network). Connecting this
instrument to a LAN VNAbles you to access the hard disk drive of this instrument
from an external PC or to control this instrument by using SICL-LAN.
5. Line Switch
Always keep this switch on (|).
6. Power Cable Receptacle (to LINE)
The receptacle (outlet) to which the power cable is connected. To connect the device
to a power source (outlet), use the supplied three-prong power cable with a ground
conductor. The plug attached to the power cable (on the power outlet side or device
side of the cable) serves as the disconnecting device (device that cuts off power
supply) of the VNA When the power supply must be cut off to avoid such danger as
electric shock, pull out the power cable plug (on the power outlet side or device side
of the cable).
7. Reference OUT/IN
A connector for outputting the internal frequency reference signal from the VNA By
connecting this output connector to the external reference signal input connector of
another device, the device can be phase-locked to the internal reference signal of the
T5230A/T5280A and used under this condition.
8. Trigger
This BNC female connector allows external bias to be applied at the test ports.
9. Ground Terminal
Connected to the chassis of the T5230A/T5280A, a ground terminal is provided with
the VNA You can connect a banana-type plug to this terminal for grounding.

Transcom Vector Network Analyzer――Operating Manual
Transcom Instruments Co., Ltd. Tel: +86-21-64326888 Fax: +86-21-64326777 ‐ 15-
1.3. Screen Area Names and Functions of Parts:
Figure 1-6 Screen Area
Softkey Menu Bar
Channe 1 Window
Channe 2 Window
Channel Data Instrument State
Menu Bar Data Entry Bar

Transcom Vector Network Analyzer――Operating Manual
Transcom Instruments Co., Ltd. Tel: +86-21-64326888 Fax: +86-21-64326777 ‐ 16-
1.3.1. Channel Window
Figrue 1-7 Channel Window
Windows for displaying traces. Because a channel corresponds to a window, it is
called a channel window. When the outer frame of a channel window is displayed in
light gray, the channel is the active channel (the channel for which setup is being
performed). In the following figure, Channel 1 (the upper window) is the active
channel. To make a channel active, use or key.
Clicking inside a channel window will also make the channel active.
Channel 1 Window and Channel 2 Window describes different measurement
parameters available in the channel measurement window. The measurement
parameters described in the Channel 1 and 2 Window correspond to the same channel
measurement window and are displayed in separate windows for ease of read.

Transcom Vector Network Analyzer――Operating Manual
Transcom Instruments Co., Ltd. Tel: +86-21-64326888 Fax: +86-21-64326777 ‐ 17-
1.3.2. Data Entry Bar Used to enter numeric data into the VNA Press a hardkey or softkey to enter data, and
the data entry bar will appear at the top of the screen. To assign a title to a channel
window, an entry bar that allows you to enter letters and symbols by using the front
panel keys or mouse is displayed instead.
Figure 1-8 Data entry bar
1. Parameter Name
Displays the name of the parameter for which data will be entered.
2. Data Entry Area
When the data entry bar is displayed for the first time, the current settings are
displayed on it. You can change numeric values by typing from the keyboard or in the
ENTRY block on the front panel.
You can hide the frequency information in order to ensure its confidentiality or for
other reasons. For detailed information, see Hiding Softkey's Frequency Information.
3. Step Button (Small)
Increases or decreases the numeric value in the data entry area in small steps. Use the
mouse to manipulate this button.
4. Step Button (Large)
Increases or decreases the numeric value in the data entry area in large steps. Use the
mouse to manipulate this button.
5. Enter Button
After typing numeric values in the data entry area by using the keyboard or the
Parameter Step Buttons (Small )
Step Buttons (Big ) Data Entry Box
Enter Button
Close Button

Transcom Vector Network Analyzer――Operating Manual
Transcom Instruments Co., Ltd. Tel: +86-21-64326888 Fax: +86-21-64326777 ‐ 18-
numeric keys in the ENTRY Block on the front panel, press this button to finish the
entry. Use the mouse to manipulate this button.
6. Close Button
Closes the data entry area (turns off the display). Use mouse to manipulate this button.
1.3.3. Instrument Status Bar Displays the measurement status of the VNA
READY Instrument normal
NOT READY Instrument unnormal
1.3.4. Softkey Menu Bar A group of keys on the screen called by the softkeys and menu bars. You can
manipulate these keys by using the NAVIGATION Block keys on the front panel, the
mouse, or the keyboard. You can perform manipulations by directly touching the
screen with your finger instead of using a mouse.

Transcom Vector Network Analyzer――Operating Manual
Transcom Instruments Co., Ltd. Tel: +86-21-64326888 Fax: +86-21-64326777 ‐ 19-
Figure 1-9 Softkey Menu Bar
Pressing and Enter key on the front panel or pressing Enter key on the keyboard
causes the highlighted (selected) softkey to be executed. You can change which
softkey in the menu is highlighted by turning or pressing on the front
panel. Pressing the key or on the front panel brings up the upper level
softkey menu, and pressing the or key on the front panel brings up the
lower level softkey menu.
Softkey Menu Title
Softkeys
Selection Mark

Transcom Vector Network Analyzer――Operating Manual
Transcom Instruments Co., Ltd. Tel: +86-21-64326888 Fax: +86-21-64326777 ‐ 20-
1.4. Three Methods of Operation You can operate the T5230A/T5280A using one of three operating methods: using
keys on the front panel, using a mouse and keyboard, and using the touch screen.
1.5. Basic Measurement Procedures To better understanding how to use the T5230A/T5280A, this section describes the
basic measurement procedure using the VNA
Figure 1-10 Basic Measurement Flow
Start
1. Determining measurement conditions S-parameter -> Data format -> Frequency range -> Number of measurement points -> Power level -> IF bandwidth
2. Calibration Specify calibration kit -> Select calibration type -> Measure calibration data -> Save calibartion data
3. Connecting the Device Under Test (DUT) Connect DUT -> Adjust the scale
4. Analyzing measurement results Analysis using markers
5. Outputting measurement results Store measurement file to a disk
Stop

Transcom Vector Network Analyzer――Operating Manual
Transcom Instruments Co., Ltd. Tel: +86-21-64326888 Fax: +86-21-64326777 ‐ 21-
2. Setting Measurement Conditions
2.1. Initializing Parameters
1. Press on the front panel or Execute the :SYST:PRES command
2. Press OK
2.2. Setting the System Z0 The procedure for setting the system characteristic impedance (Z0) is as follows:
1. Press Cal key, or on the front panel.
2. Click System Z0, then input the system Z0.
3. Press .
2.3. Setting Channels and Traces
2.3.1. Setting Channel Display (Layout of Channels) The procedure for setting the window layout is as follows:
1. Press Display key or on the front panel.
2. Press Allocate Channels key.
3. Press the desired softkey to select the window layout shown below.

Transcom Vector Network Analyzer――Operating Manual
Transcom Instruments Co., Ltd. Tel: +86-21-64326888 Fax: +86-21-64326777 ‐ 22-
Figure 2-1 Channel Windows Layout(T5215A/T5230A/T5231A/T5280A)
Figure 2-2 Channel Windows Layout(T5113A)

Transcom Vector Network Analyzer――Operating Manual
Transcom Instruments Co., Ltd. Tel: +86-21-64326888 Fax: +86-21-64326777 ‐ 23-
2.3.2. Setting Trace Display (I) Setting the number of traces The procedure for setting the number of traces is as
follows:
1. Press or to select the channel for which you want
to set the number of traces.
2. Press .
3. Click Number of Traces key.
4. Press the desired softkey to set the number of traces.
(II) Setting trace layout (graph layout)
The procedure for setting the graph layout is as follows:
1. Press or to select the channel for which you want
to set the graph layout.
2. Press
3. Click Allocate Traces.
4. Press the desired softkey to select the graph layout shown below.

Transcom Vector Network Analyzer――Operating Manual
Transcom Instruments Co., Ltd. Tel: +86-21-64326888 Fax: +86-21-64326777 ‐ 24-
Figure 2-3 Trace Graph Layout
2.3.3. Active channel The active channel is the one whose settings can currently be changed. The window
frame of the active channel is displayed brighter than the window frames of the other
channels. To change the settings specific to a certain channel, you must first activate
the channel.
To change the active channel, use the following hardkeys:
Hardkey Function
Change the active channel to the next channel with the
larger channel number.
Change the active channel to the previous channel with
the smaller channel number.
Transcom Vector Network Analyzer――Operating Manual
Transcom Instruments Co., Ltd. Tel: +86-21-64326888 Fax: +86-21-64326777 ‐ 25-
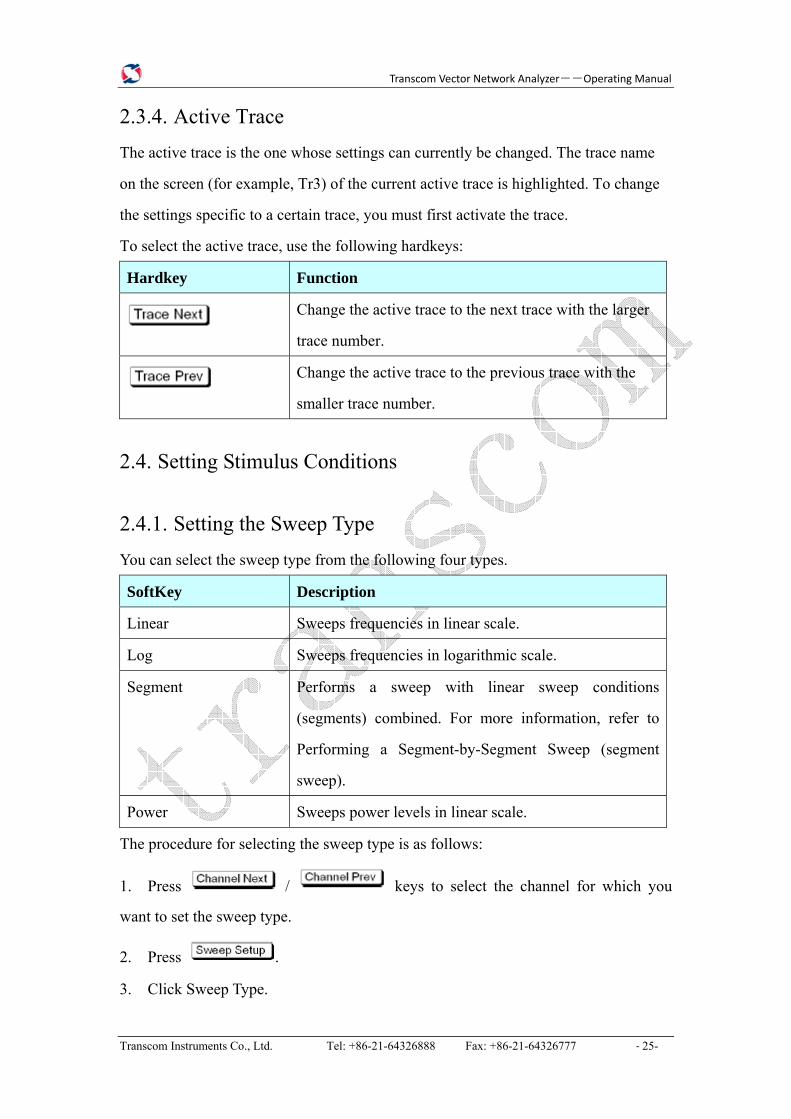
2.3.4. Active Trace The active trace is the one whose settings can currently be changed. The trace name
on the screen (for example, Tr3) of the current active trace is highlighted. To change
the settings specific to a certain trace, you must first activate the trace.
To select the active trace, use the following hardkeys:
Hardkey Function
Change the active trace to the next trace with the larger
trace number.
Change the active trace to the previous trace with the
smaller trace number.
2.4. Setting Stimulus Conditions
2.4.1. Setting the Sweep Type You can select the sweep type from the following four types.
SoftKey Description
Linear Sweeps frequencies in linear scale.
Log Sweeps frequencies in logarithmic scale.
Segment Performs a sweep with linear sweep conditions
(segments) combined. For more information, refer to
Performing a Segment-by-Segment Sweep (segment
sweep).
Power Sweeps power levels in linear scale.
The procedure for selecting the sweep type is as follows:
1. Press / keys to select the channel for which you
want to set the sweep type.
2. Press .
3. Click Sweep Type.

Transcom Vector Network Analyzer――Operating Manual
Transcom Instruments Co., Ltd. Tel: +86-21-64326888 Fax: +86-21-64326777 ‐ 26-
4. Press the desired softkey to select the sweep type.
2.4.2. Setting the Sweep Range (I) Setting the Sweep Range with the Lowest and Highest Values
1. Press / keys to select the channel whose sweep
range will be set.
2. Press , then input the lowest value.
3. Press , then input the highest value.
(II) Setting the Sweep Range with the Center Value and a Span
1. Press / keys to select the channel whose sweep
range will be set.
2. Press , then input the center value.
3. Press , then input the span value.
(III) Setting the Sweep Range Using the Marker
1. In the channel window whose range must be set, place the active marker The
marker on a trace that can be repositioned either by front panel controls or by
programming commands on the active trace to a position that corresponds to the new
range (to the lowest, highest, or center value).
2. Press key.
3. Click the softkey that corresponds to each value.
SoftKey Function
Marker → Start Sets the lowest value to the stimulus value of the
active marker on the currently active trace.
Marker → Stop Sets the highest value to the stimulus value of the
active marker on the currently active trace.
Marker → Center Sets the center value to the stimulus value of the active
marker on the currently active trace.

Transcom Vector Network Analyzer――Operating Manual
Transcom Instruments Co., Ltd. Tel: +86-21-64326888 Fax: +86-21-64326777 ‐ 27-
ATTENTION: If the reference marker is on and the stimulus value of the active
marker is expressed by a value relative to the reference marker, the absolute stimulus
value will be used to set the new sweep rang.
2.4.3. VNAble/Disable Stimulus Signal Output You can turn on/off the stimulus signal output, but this will prevent you from
performing measurement. Therefore, you will not normally use this feature. This is
mainly used to turn the output back to on after it has been turned off by the power trip
feature.
Follow these steps to turn the stimulus signal output on/off:
1. Press key.
2. Click Power > RF Out (Each press toggles between on/off).
2.4.4. Setting fixed frequency at power sweep The procedure for setting the fixed frequency (CW frequency) at the power sweep is
as follows:
1. Press / keys to select the desired channel.
2. Press key.
3. Click Power > CW Freq, then enter the fixed frequency.
2.4.5. Setting power level The procedure for setting power level is as follows:
1. Press / keys to select the desired channel.
2. Press key.
3. Click Power key.
4. Click Power key in the next menu, then enter the power level.

Transcom Vector Network Analyzer――Operating Manual
Transcom Instruments Co., Ltd. Tel: +86-21-64326888 Fax: +86-21-64326777 ‐ 28-
You can use the power slope feature to correct the attenuation of a power level so that
it is simply proportional to the frequency ( attenuation due to cables and so on ),
which improves the accuracy of the level actually applied to the DUT.
(I) Turning power slope feature on/off
1. Press / keys to select the desired channel.
2. Press key.
3. Click Power > Slope [OFF] (Slope [ON]). Each press toggles between on/off.
(II) Setting correction coefficient
1. Press / keys to select the desired channel.
2. Press key.
3. Click Power > Slope Data [xxx dB/GHz] ("xxx" represents the current set value.).
4. Enter the correction coefficient using the ENTRY block keys on the front panel.
2.4.6. Setting the number of points The number of points is the number of data items collected in one sweep. It can be set
to any number from 2 to 10001 for each channel independently.
1. To obtain a higher trace resolution against the stimulus value, choose a larger
value for number of points.
2. To obtain higher throughput, keep the number of points to a smaller value within
an allowable trace resolution.
3. To obtain higher measurement accuracy after calibration, perform calibration
using the same number of points as in actual measurements.
The procedure for setting the number of points is as follows:
1. Press / keys to select the desired channel.
2. Press key.
3. Click Points, then input the desired number of points.

Transcom Vector Network Analyzer――Operating Manual
Transcom Instruments Co., Ltd. Tel: +86-21-64326888 Fax: +86-21-64326777 ‐ 29-
2.4.7. Setting the Sweep Time The sweep time is always kept to the shortest time possible with the current
measurement conditions. There is no need to set.
2.5. Selecting Measurement Parameters
2.5.1. S- Parameters
S-parameters (scattering parameters) are used to evaluate how signals are reflected by
and transferred through the DUT. An S-parameter is defined by the ratio of two
complex numbers and contains information on the magnitude and phase of the signal.
S-parameters are typically expressed as follows:
S out-in
out: port number of the DUT from which the signal is output
in: port number of the DUT to which the signal is input
For example, S-parameter S21 is the ratio of the output signal of port 2 on the DUT
with the input signal of port 1 on the DUT, both expressed in complex numbers.
Operating Procedure:
1. Press (or ) and (or ) to
select the trace for which measurement parameters will be set up.
2. Press .
3. Click a softkey that corresponds to the desired measurement parameter, such as
S11, S21, S12, S22.
Note:There are only S11,S21 parameters for T5113A.
2.5.2. Absolute Measurement
The absolute measurement is the measurement of absolute power of a signal at a
receiver input. Unlike relative measurements of S-parameters, which represent a
relation between the signals at inputs of two receivers, absolute measurements
Transcom Vector Network Analyzer――Operating Manual
Transcom Instruments Co., Ltd. Tel: +86-21-64326888 Fax: +86-21-64326777 ‐ 30-
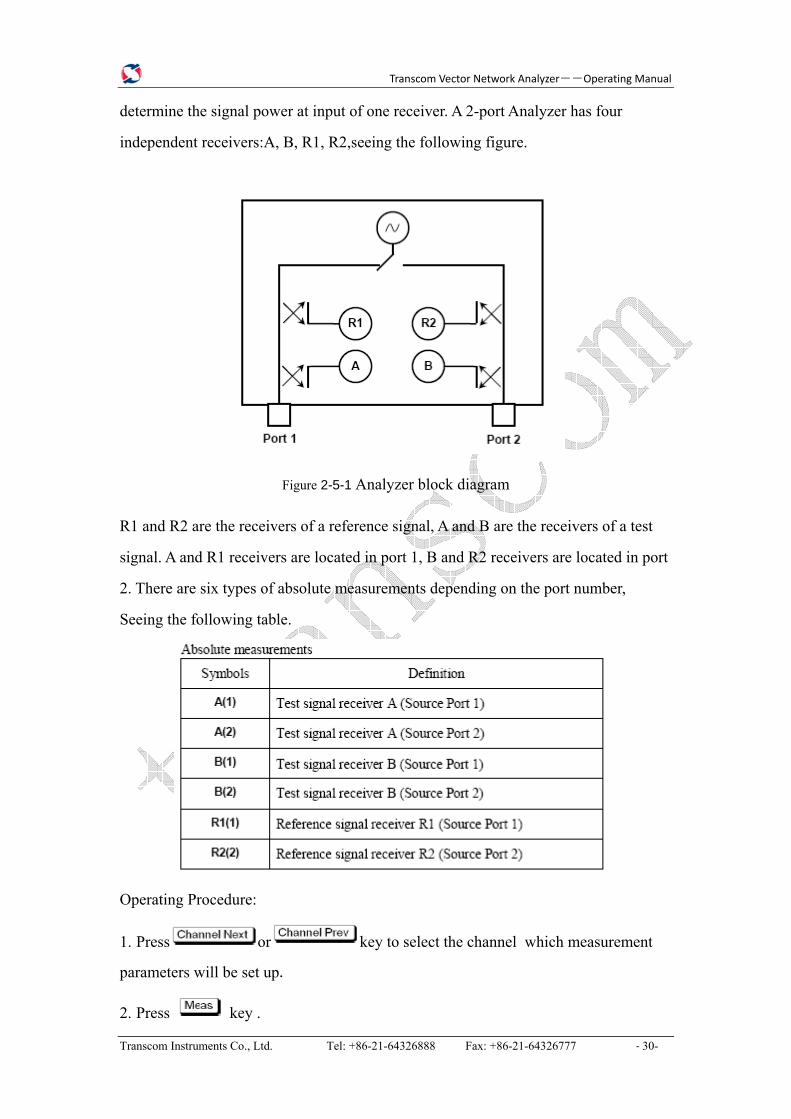
determine the signal power at input of one receiver. A 2-port Analyzer has four
independent receivers:A, B, R1, R2,seeing the following figure.
Figure 2-5-1 Analyzer block diagram
R1 and R2 are the receivers of a reference signal, A and B are the receivers of a test
signal. A and R1 receivers are located in port 1, B and R2 receivers are located in port
2. There are six types of absolute measurements depending on the port number,
Seeing the following table.
Operating Procedure:
1. Press or key to select the channel which measurement
parameters will be set up.
2. Press key .

Transcom Vector Network Analyzer――Operating Manual
Transcom Instruments Co., Ltd. Tel: +86-21-64326888 Fax: +86-21-64326777 ‐ 31-
3. Click the”Absolute” softkey to select Absolute Measurements,seeing the following
figure.
Figure 2-4-2 Analyzer block diagram
4. Click the selected softkey and to display a sign “” in front of the softkey.
2.6. Selecting a Data Format The T5230A/T5280A allows you to display measured S-parameters by using the
following data formats. The data format can be preset to factory settings using the
Preset option.
1. Rectangular display formats
2. Polar format
3. Smith chart format
2.6.1. Rectangular display formats Rectangular display formats draw traces by assigning stimulus values (linear scale) to
the X-axis and response values to the Y-axis. Eight different formats are available

Transcom Vector Network Analyzer――Operating Manual
Transcom Instruments Co., Ltd. Tel: +86-21-64326888 Fax: +86-21-64326777 ‐ 32-
depending on the selection of data for the Y-axis. Eight formats include Log Mag,
SWR, Phase, Expand Phase, Group Dalay, Lin Mag, Real, Imag.
Type Y-axis Data Type Y-axis Unit Application Examples
Log mag Magnitude dB Return loss measurement
Insertion loss
measurement (or gain
measurement)
SWR
(ρ: reflection
coefficient)
(Abstract
number)
Measurement of standing
wave ratio
Phase Phase (displayed in
range from -180° to
+180°)
Degrees ( ° ) Measurement of
deviation from linear
phase
Expanded
phase
Phase (can be displayed
above +180° and below
-180°)
Degrees ( ° ) Measurement of
deviation from linear
phase
Group delay Signal transfer delays
within the DUT
Seconds (s) Group delay
measurement
Lin mag Magnitude (Abstract
number)
Reflection coefficient
measurement
Real Real part of measured
complex parameter
(Abstract
number)
Imag Imaginary part of
measured complex
parameter
(Abstract
number)
Res
pons
e (S
timul
us)

Transcom Vector Network Analyzer――Operating Manual
Transcom Instruments Co., Ltd. Tel: +86-21-64326888 Fax: +86-21-64326777 ‐ 33-
Stimilus
Figure 2-5 Rectangular display formats
2.6.2. Polar format In the polar format, traces are drawn by expressing the magnitude as a displacement
from the origin (linear) and phase in an angle counterclockwise from the positive
X-axis. This data format does not have a stimulus axis, so frequencies must be read by
using the marker. The polar format allows users to select one of the following three:
1. Linear magnitude and phase ( ° )
2. Log magnitude and phase ( ° )
3. Real and imaginary parts
Figure 2-6 Polar Format

Transcom Vector Network Analyzer――Operating Manual
Transcom Instruments Co., Ltd. Tel: +86-21-64326888 Fax: +86-21-64326777 ‐ 34-
2.6.3. Smith chart format The Smith chart format is used to display impedances based on reflection
measurement data of the DUT. In this format, traces are plotted at the same spots as in
the polar format. The Smith chart format allows users to select one of the following
five data groups for displaying the marker response values.
1. Linear magnitude and phase ( ° )
2. Log magnitude and phase ( ° )
3. Real and imaginary parts
4. Resistance (ohm), Reactance (ohm), and inductance (H) or capacitance (F)
5. Conductance (S), susceptance (S), and capacitance (F) or inductance (H)
Figure 2-7 Smith chart format
2.7. Setting the Scales
2.7.1. Auto scale The auto scale function is used to tailor each scale (scale/division and the reference
line value) automatically in such a way that traces will appear at the proper size on the
screen for easy observation.
(I) Single Trace Auto Scale

Transcom Vector Network Analyzer――Operating Manual
Transcom Instruments Co., Ltd. Tel: +86-21-64326888 Fax: +86-21-64326777 ‐ 35-
1. Follow the procedure below to perform the auto scale function on a specific trace.
2. Press / and / keys to
select the trace for which the auto scale function will be performed.
3. Press .
4. Click Auto Scale.
(II) Auto Scale on All Traces
1. Press
2. Click Auto Scale All
2.7.2. Manual scale adjustment on a rectangular display format For a rectangular display format, four parameters are used to manually adjust the
scales.
Adjustable feature Description
Divisions Defines the number of divisions on the Y-axis. An even
number from 4 to 30 must be used. Once set, it is commonly
applied to all traces displayed in any rectangular format
within that channel.
Scale/Division
(Scale/Div)
Defines the number of increments per division on the Y-axis.
The value applies only to the active trace.
Reference position Defines the position of the reference line. The position must
be specified using the number assigned to each division on
the Y-axis starting at 0 (the least significant) running up to
the number of divisions being used (the most significant).
The position applies only to the active trace.
Reference line value
(Reference Value)
Defines the value corresponding to the reference line. It must
be set using the unit on the Y-axis. The reference line value
applies only to the active trace.
Manually setting scales on a rectangular display format:

Transcom Vector Network Analyzer――Operating Manual
Transcom Instruments Co., Ltd. Tel: +86-21-64326888 Fax: +86-21-64326777 ‐ 36-
1. Press / keys and /
keys to select the trace for which scale features will be adjusted.
2. Press key.
3. Select the softkey that corresponds to the particular feature that needs to be
adjusted.
Figure 2-8 Manual scale adjustment on a rectangular display format
Softkey Function
Divisions Defines the number of divisions on the Y-axis.
Scale/Div Defines the number of increments per division
on the Y-axis.
Reference Position Defines the position of the reference line.
Reference Value Defines the value corresponding to the
reference line.
2.7.3. Manual scale adjustment on the Smith chart/polar format Manual scale adjustment on the Smith chart format or the polar format is done by
using the displacement (Scale/Div of the outermost circle).
1. Press / keys and /

Transcom Vector Network Analyzer――Operating Manual
Transcom Instruments Co., Ltd. Tel: +86-21-64326888 Fax: +86-21-64326777 ‐ 37-
keys to select the trace for which the scale will be adjusted.
2. Press key.
3. Click Scale/Div, then input the displacement of the outermost circle.
Figure 2-9 Polar Format
Figure 2-10 Smith chart format
2.7.4. Other data settings (I) Electric Delay
1. Press / keys and /

Transcom Vector Network Analyzer――Operating Manual
Transcom Instruments Co., Ltd. Tel: +86-21-64326888 Fax: +86-21-64326777 ‐ 38-
keys to select the trace for which the scale will be adjusted.
2. Press key.
3. Click Electric Delay, then input the displacement of the outermost circle.
(II) Phase Offset
1. Press / keys and /
keys to select the trace for which the scale will be adjusted.
2. Press key.
3. Click Phase Offset, then input the displacement of the outermost circle.
2.8. Setting Window Displays
2.8.1. Maximizing a channel window When using multiple channels, it is possible to maximize a specific channel window
on the screen. When multiple traces are displayed in a channel window, it is also
possible to maximize a specific trace displayed within that channel window.
1. Press (or ) to select the channel whose window will
be maximized.
2. Press to maximize the channel window.
3. Press one more time to reduce the window to its previous size.
2.8.2. Maximizing a trace display
1. Press (or ) to select the channel to which the trace
belongs.
2. Press (or ) to select the trace whose display will be
maximized.
3. Press Trace the trace display.

Transcom Vector Network Analyzer――Operating Manual
Transcom Instruments Co., Ltd. Tel: +86-21-64326888 Fax: +86-21-64326777 ‐ 39-
4. Press one more time to reduce the display to its previous size.
2.8.3. Comparing Traces/Performing Data Math Each of the traces for which measured data is displayed is provided with an additional
trace, called a memory trace, that temporarily stores measured data. You can use the
memory trace to compare traces on the screen or to perform complex data math
between the memory trace and measured data.
Performing Data Math Operations:
1. Press / keys and /
keys to select the trace for which the scale will be adjusted.
2. Press key.
3. Click Data -> Mem to store the measured data in memory.
4. Click Data Math. Select the data math operation to perform.
Value Description
Data / Mem Divides the measured data by the data in the memory trace. This
function can be used to evaluate the ratio of two traces (e.g.,
evaluating gain or attenuation).
Data * Memory Multiplies the measured data by a memory trace.
Data – Memory Subtracts a memory trace from the measured data. This function
can be used, for example, to subtract a vector error that has been
measured and stored (e.g., directivity) from data subsequently
measured on a device.
Data + Memory Adds the measured data and the data in the memory trace.
OFF Turn off data math function.
5. Click Display.
6. Select the type of data to display on the screen.
Softkey Function

Transcom Vector Network Analyzer――Operating Manual
Transcom Instruments Co., Ltd. Tel: +86-21-64326888 Fax: +86-21-64326777 ‐ 40-
Data Display only data trace on the screen
Mem Displays only memory trace stored by Data->Mem operation on
the screen.
Data&Mem Displays data trace and memory trace on the screen. You can
now easily compare the data trace and memory trace on the
screen.
OFF Trace is not diaplayed
2.8.4. Labeling a window (Title) It is possible to assign a unique name to a channel and display it on the screen. This
feature is useful in saving and/or printing measurement result for future reference.
Labeling a window:
1. Press / keys and /
keys to select the trace for which the scale will be adjusted.
2. Press key.
3. Click Edit Title Label,then the title label input dialog box appears.
4. Press .
5. Click Title Label to turn on the title display. The title will appear within a frame
at the top of the channel window.
2.8.5. Turn off the information update function of screen
1. Press
2. Click Update.

Transcom Vector Network Analyzer――Operating Manual
Transcom Instruments Co., Ltd. Tel: +86-21-64326888 Fax: +86-21-64326777 ‐ 41-
Figure 2-11 Turn off the information update function of screen

Transcom Vector Network Analyzer――Operating Manual
Transcom Instruments Co., Ltd. Tel: +86-21-64326888 Fax: +86-21-64326777 ‐ 42-
3. Calibration
3.1. Calibration Types and Characteristics
Calibration
Method
Standard (s)
Used Corrected Error Factor
Measurement
Parameters
No
calibration None None All parameters
Response
Calibration
OPEN or
SHORT
LOAD
Following 2 error terms:
Reflection Tracking (Er)
Directivity (Ed)
S11(Reflection
characteristics
at 1 port)
THRU
LOAD
Following 2 error terms:
Transmission Tracking (Et)
Isolation (Ex)
S21 (1
direction
transmission
characteristics
at 2 ports)
1-Port
Calibration
OPEN
SHORT
LOAD
Following 3 error terms:
Directivity (Ed)
Source Match (Es)
Reflection Tracking (Er)
S11
(Reflection
characteristics
at 1 port)
Enhanced
Response
Calibration
OPEN
SHORT
LOAD
THRU
Following 5 error terms:
Directivity (Ed1)
Isolation (Ex21)
Source Match (Es1)
Transmission Tracking (Et21)
S11, S21 (1
direction
transmission/R
eflection
characteristics
at 2 ports)

Transcom Vector Network Analyzer――Operating Manual
Transcom Instruments Co., Ltd. Tel: +86-21-64326888 Fax: +86-21-64326777 ‐ 43-
Calibration
Method
Standard (s)
Used Corrected Error Factor
Measurement
Parameters
Reflection Tracking (Er1)
Full 2-Port
Calibration
OPEN
SHORT
LOAD
THRU
Following 12 error terms:
Directivity (Ed1,Ed2)
Isolation (Ex21,Ex12)
Source Match (Es1,Es2)
Load Match (El12,El21)
Transmission Tracking
(Et21,Et12)
Reflection Tracking (Er1,Er2)
S11,S21,S12,S
22 (All
S-parameters
at 2 ports)
3.2. Checking Calibration Status
3.2.1. Execution Status of Error Correction for Each Channel You can check the execution status of error correction for each channel with the error
correction status.
The error correction status is indicated in the channel status bar in the lower part of
the window by the symbols in the below table.
Symbol Execution status of error correction
Cor(displayed in gray) Error correction: On (VNAbled for all traces)
Cor(displayed in red) Error correction: On (VNAbled for some traces)
---(displayed in red) Error correction: On (no calibration data)
Off(displayed in red) Error correction: Off

Transcom Vector Network Analyzer――Operating Manual
Transcom Instruments Co., Ltd. Tel: +86-21-64326888 Fax: +86-21-64326777 ‐ 44-
Figure 3-1 Calibration Status
3.2.2. Execution Status of Error Correction for Each Trace You can check the status of the error correction actually executed for each trace with
the trace status area.
For a trace for which error correction is executed, the applied calibration type is
indicated in the trace status area by the symbols in the table below.
Symbol Calibration Type
RO Open response calibration
RS Short response calibration
RT Thru response calibration
F1 Enhanced response calibration
OP 1-port calibration
F2 Full 2-port calibration/2-port TRL calibration
Calibration Status
Channel Calibration Status

Transcom Vector Network Analyzer――Operating Manual
Transcom Instruments Co., Ltd. Tel: +86-21-64326888 Fax: +86-21-64326777 ‐ 45-
Figure 3-2 Execution Status of Error Correction for Each Trace
3.3. Calibration process
3.3.1. Selecting Calibration Kit Before executing calibration, you need to select a calibration kit.
If you use a calibration kit other than a predefined one, you need to define it. If the
connector type of the standard of the calibration kit you use has polarity (the
distinction between male and female), you need to change the standard class
definition of the calibration kit depending on the standard you actually use. For more
information, see Modifying Calibration Kit Definition.
Calibration Model Pieces Basic Indicators
85032B/E DC to 6GHz, N, 50Ω
85033D/E 30kHz to 9GHz, 3.5mm, 50Ω
85036B/E 30kHz to 3GHz, N, 75Ω

Transcom Vector Network Analyzer――Operating Manual
Transcom Instruments Co., Ltd. Tel: +86-21-64326888 Fax: +86-21-64326777 ‐ 46-
CAL-F/MN-C DC to 6GHz, N, 50Ω
Operating Procedure:
1. Press / keys to select the channel for which you
want to select the calibration kit.
2. Press Key.
3. Click Cal Kit, then select the calibration kit.
3.3.2. OPEN/SHORT Response Calibration (reflection test) In OPEN or SHORT response calibration, calibration data are measured by
connecting an OPEN or SHORT standard, respectively, to the desired test port. For
frequency response, these calibrations effectively eliminate the reflection tracking
error from the test setup reflection test using that port.
Figure 3-3 1-port error model ( OPEN / SHORT response)
It is also possible to carry out isolation calibration with a LOAD standard during
OPEN/SHORT response calibration. An isolation calibration will eliminate the
directivity error from the test setup in a reflection test using that port:
Figure 3-4 1-port error model ( OPEN / SHORT response + isolation)
Operating Procedure:

Transcom Vector Network Analyzer――Operating Manual
Transcom Instruments Co., Ltd. Tel: +86-21-64326888 Fax: +86-21-64326777 ‐ 47-
1. Press / keys to select the channel for which
you want to select the calibration kit.
2. Press .
3. Click Cal Kit to select Calibration Kit.
4. Click Calibrate.
5. Click Response (Open) / Response(Short).
6. Connect a calibration standard (OPEN or SHORT) to the selected test port
(connector to which the DUT is to be connected).
7. Click Open or Short to start the calibration measurement.
8. If an isolation calibration must be performed using a LOAD standard, follow the
Operating procedure :
9. Connect a LOAD standard to the selected test port (connector to which the DUT
is to be connected).
10. Click Load (Optional) to start the measurement on the LOAD standard.
11. Click Done to terminate the response calibration (and the LOAD isolation
calibration) process. Upon pressing this key, calibration coefficients will be calculated
and saved. The error correction function will also be automatically VNAbled.
Figure 3-5 Connecting standards in OPEN/SHORT Response calibration

Transcom Vector Network Analyzer――Operating Manual
Transcom Instruments Co., Ltd. Tel: +86-21-64326888 Fax: +86-21-64326777 ‐ 48-
3.3.3. THRU Response Calibration (transmission test) In THRU response calibration, calibration data are measured by connecting a THRU
standard to the desired test port. This calibration effectively eliminates the frequency
response transmission tracking error from the test setup in a transmission test using
that port.
Figure 3-6 2-Port error model (THRU response)
It is also possible to carry out an isolation calibration using a LOAD standard in the
process of THRU response calibration. An isolation calibration will eliminate
isolation error (crosstalk error) from the test setup in a transmission test using that
port.
Figure 3-7 2-Port Error model (THRU response + isolation)
Operating Procedure:
1. Press / keys to select the channel for which
you want to select the calibration kit.
2. Press .
3. Click Cal Kit to select Calibration Kit.
4. Click Calibrate.
5. Click Response (Thru).
6. Click Select Ports.
7. Select the test ports (and corresponding S parameters) upon which a THRU
response calibration is to be performed.

Transcom Vector Network Analyzer――Operating Manual
Transcom Instruments Co., Ltd. Tel: +86-21-64326888 Fax: +86-21-64326777 ‐ 49-
8. Make a between the selected test ports (between the connectors to which the DUT
will be connected).
9. Click Thru to start the calibration measurement.
10. If an isolation calibration must be performed using a LOAD standard, follow the
procedure below.
a. Connect a LOAD standard to each of the two selected test ports (connectors to
which the DUT is to be connected).
b. Click Isolation (Optional) to start the calibration measurement.
11. Click Done to terminate the response calibration (and the LOAD isolation
calibration) process. Upon pressing this key, calibration coefficients will be calculated
and saved. The error correction function will also be automatically VNAbled.
3.3.4. 1-Port Calibration (reflection test) In 1-port calibration, calibration data are measured by connecting an OPEN standard,
a SHORT standard, and a LOAD standard to the desired test port. This calibration
effectively eliminates the frequency response reflection tracking error, directivity
error, and source match error from the test setup in a reflection test using that port.

Transcom Vector Network Analyzer――Operating Manual
Transcom Instruments Co., Ltd. Tel: +86-21-64326888 Fax: +86-21-64326777 ‐ 50-
Figure 3-8 1-Port error model (1-port calibration)
Operating Procedure:
1. Press / keys to select the channel for which
you want to select the calibration kit.
2. Press .
3. Click Cal Kit to select Calibration Kit.
4. Click Calibrate.
5. Click 1-Port Cal.
6. Click Select Port to select a test port (and corresponding S parameter) on which
1-port calibration will be performed.
7. Connect an OPEN calibration standard to the selected test port (connector to
which the DUT is to be connected).
8. Click Open to start the calibration measurement.
If you select the calibration kit which has different calibration definitions for each
gender, (m) and (f) in the name (label) of the standard displayed in the softkey
indicate male (m) and female (f) for the analyzer's connector, respectively.
9. Connect a SHORT calibration standard to the selected test port (connector to
which the DUT is to be connected).
10. Click Short to start the calibration measurement.
11. Connect a LOAD calibration standard to the selected test port (connector to
which the DUT is to be connected).
12. Click Load to start the calibration measurement.

Transcom Vector Network Analyzer――Operating Manual
Transcom Instruments Co., Ltd. Tel: +86-21-64326888 Fax: +86-21-64326777 ‐ 51-
13. Click Done to terminate the 1-port calibration process. Upon pressing this key,
calibration coefficients will be calculated and saved. The error correction function
will also be automatically VNAbled.
Figure 3-9 Connecting the standard for 1-port calibration
3.3.5. One Path 2-Port Calibration Operating Procedure:
1. Press / keys to select the channel for which
you want to select the calibration kit.
2. Press .
3. Click Cal Kit to select Calibration Kit.
4. Click Calibrate.
5. Click One Path 2-Port Cal.
6. Click Select Port to select a test port (and corresponding S parameter) on which
1-port calibration will be performed.
7. Connect an OPEN calibration standard to the selected test port (connector to
which the DUT is to be connected).
8. Click Open to start the calibration measurement.
If you select the calibration kit which has different calibration definitions for each
gender, (m) and (f) in the name (label) of the standard displayed in the softkey
indicate male (m) and female (f) for the analyzer's connector, respectively.
9. Connect a SHORT calibration standard to the selected test port (connector to
which the DUT is to be connected).
10. Click Short to start the calibration measurement.

Transcom Vector Network Analyzer――Operating Manual
Transcom Instruments Co., Ltd. Tel: +86-21-64326888 Fax: +86-21-64326777 ‐ 52-
11. Connect a LOAD calibration standard to the selected test port (connector to
which the DUT is to be connected).
12. Make a between the selected test ports (between the connectors to which the DUT
will be connected).
13. Click Thru to start the calibration measurement.
14. Click Done to terminate the One Path 2-Port Calibration calibration process.
Upon pressing this key, calibration coefficients will be calculated and saved. The
error correction function will also be automatically VNAbled.
Figure 3-10 One Path 2-Port Calibration
3.3.6. Full 2-Port Calibration In full 2-port calibration, calibration data are measured by connecting an OPEN
standard, a SHORT standard, or a LOAD standard to two desired test ports (or a
THRU standard between two ports).This calibration effectively eliminates the
directivity error, crosstalk, source match error, frequency response reflection tracking
error, and frequency response transmission tracking error from the test setup in a
transmission or reflection test using those ports. This calibration makes it possible to
perform measurements with the highest possible accuracy. A total of twelve error
terms, six each in the forward direction and the reverse direction, are used in a
calibration.

Transcom Vector Network Analyzer――Operating Manual
Transcom Instruments Co., Ltd. Tel: +86-21-64326888 Fax: +86-21-64326777 ‐ 53-
Figure 3-11 F-2 Calibration (12 error terms)
Operating Procedure:
1. Press / keys to select the channel for which
you want to select the calibration kit.
2. Press .
3. Click Cal Kit to select Calibration Kit.
4. Click Calibrate.
5. Click One Full 2-Port Cal.
6. Connect the calibration standard to test port x (the connector to which the DUT is
to be connected).
7. Click Port 1 Open/Short/Load to start the calibration measurement (x denotes the
test port to which the standard is connected).
8. Repeat the above procedure for port y.
9. Make a THRU connection between ports x and y (between the connectors to
which the DUT is to be connected).
10. Click Thru to start the calibration measurement (x and y denote the test ports
between which the THRU connection is being made).
11. Click Done to terminate the One Path 2-Port Calibration calibration process.

Transcom Vector Network Analyzer――Operating Manual
Transcom Instruments Co., Ltd. Tel: +86-21-64326888 Fax: +86-21-64326777 ‐ 54-
Upon pressing this key, calibration coefficients will be calculated and saved. The error
correction function will also be automatically VNAbled.
Figure 3-12 Full 2-Port Calibration
Note:There is no Full 2-Port Calibration for T5113A.

Transcom Vector Network Analyzer――Operating Manual
Transcom Instruments Co., Ltd. Tel: +86-21-64326888 Fax: +86-21-64326777 ‐ 55-
4. Making Measurements The trigger source generates a cue signal that initiates a measurement process. Four
types of trigger sources are available.
Trigger Sources Function
Internal
(Internal)
Uses a consecutive signal generated by the firmware as a
trigger source. Triggers are sent immediately following the
completion of each measurement.
External
(External)
Uses the external trigger input terminal (BNC) or Handler I/O
(Pin No. 18) as a trigger source.
Manual
(Manual) A trigger is generated by pressing Trigger > Trigger.
Bus (Bus) A trigger is generated through GPIB/LAN/USB.
Operating Procedure:
1. Press .
2. Click Trigger Source.
3. Click the softkey that corresponds to the desired trigger source.
4.1. Selecting a Trigger Mode Follow the procedure below to select a trigger mode.
1. Press / keys to select the channel for which the
trigger mode will be set.
2. Press .
3. Press the softkey that corresponds to the desired trigger mode. Repeat the
procedure until each channel is set for its trigger mode.
Softkey Function

Transcom Vector Network Analyzer――Operating Manual
Transcom Instruments Co., Ltd. Tel: +86-21-64326888 Fax: +86-21-64326777 ‐ 56-
Hold Sets active channel trigger mode to hold sweep mode
Single Sets active channel trigger mode to single sweep mode
Continuous Sets active channel trigger mode to continuous sweep mode
Hold All Channels Sets all channel trigger modes to hold sweep mode
Continuous All
Channels
Sets trigger modes of all displayed channels (Display >
Allocate Channels) to continuous sweep mode
4.2. Generating the Trigger Next, it is necessary to generate a trigger by using the trigger source selected in
Selecting a Trigger Source.
1. Pressing .
2. Click Restart during a sweep forces the analyzer to abort the sweep.

Transcom Vector Network Analyzer――Operating Manual
Transcom Instruments Co., Ltd. Tel: +86-21-64326888 Fax: +86-21-64326777 ‐ 57-
5. Data Analysis
5.1. Analyzing Data on the Trace Using the Marker
5.1.1. About Marker Functions The marker can be used in the following ways:
1. Reading a measured value as numerical data (as an absolute value or a relative
value from the reference point)
2. Moving the marker to a specific point on the trace (marker search)
3. Analyzing trace data to determine a specific parameter
4. Using the value of the marker to change the stimulus (sweep range) and scale
(value of the reference line)
The T5230A/T5280A is capable of displaying up to 16 markers including the
reference marker on each trace. Each marker has a stimulus value (the value on the
X-axis in rectangular display format) and a response value (the value on the Y-axis in
rectangular display format). The Smith chart and polar formats each have two marker
response values (log amplitude and phase).
5.1.2. Reading Marker Values on Trace You can read the value of a marker displayed on the trace.
In rectangular display format, the marker response value is always in the same data
format as that of the Y-axis. On the contrary, one format for the marker response
values (two values: main and auxiliary) can be selected from among several types.
The selection is performed in the data format.
Softkey for selecting
data format
Marker response value
Main Auxiliary
Smith - Lin / Phase Linear amplitude Phase

Transcom Vector Network Analyzer――Operating Manual
Transcom Instruments Co., Ltd. Tel: +86-21-64326888 Fax: +86-21-64326777 ‐ 58-
Smith - Log / Phase Log amplitude Phase
Smith - Real / Imag Real component Imaginary component
Smith - R + jX Resistance Reactance
Smith - G + jB Conductance Susceptance
Polar - Lin / Phase Log amplitude Phase
Polar - Log / Phase Real component Imaginary component
Polar - Real / Imag Real component Imaginary component
5.1.3. Marker Operation
5.1.3.1. Add Marker Add marker on the trace.
1. Press / keys to activate the channel on which a
marker is used.
2. Press / to activate the trace on which a marker is
used.
3. Press .
4. Click Add Marker.
5. Enter the frequency value, and click enter.
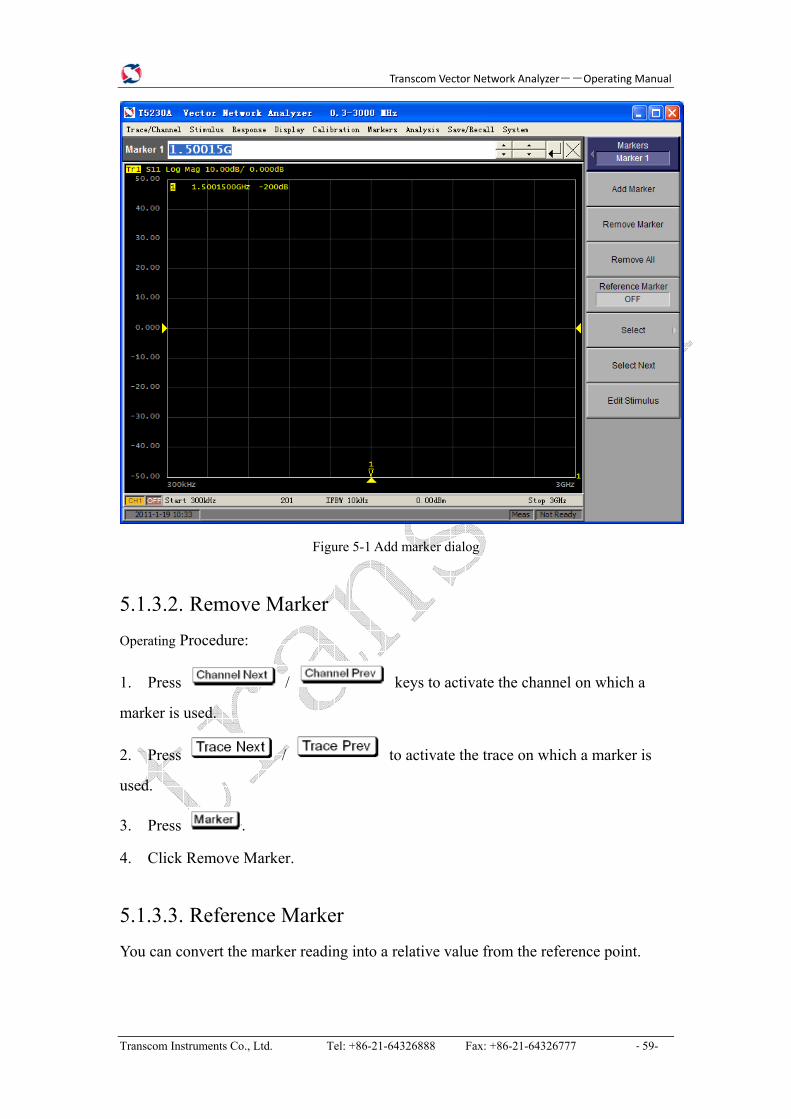
Transcom Vector Network Analyzer――Operating Manual
Transcom Instruments Co., Ltd. Tel: +86-21-64326888 Fax: +86-21-64326777 ‐ 59-
Figure 5-1 Add marker dialog
5.1.3.2. Remove Marker Operating Procedure:
1. Press / keys to activate the channel on which a
marker is used.
2. Press / to activate the trace on which a marker is
used.
3. Press .
4. Click Remove Marker.
5.1.3.3. Reference Marker You can convert the marker reading into a relative value from the reference point.

Transcom Vector Network Analyzer――Operating Manual
Transcom Instruments Co., Ltd. Tel: +86-21-64326888 Fax: +86-21-64326777 ‐ 60-
Figure 5-2 Reference Marker
Operating Procedure:
1. Press .
2. Click Reference Marker [ON/OFF].
5.1.3.4. Select and Edit Marker Operating Procedure:
1. Press / keys to activate the channel on which a
marker is used.
2. Press / to activate the trace on which a marker is
used.
3. Press .
4. Click Select, then click the marker is needed to edit. (Marker1, …, Marker15,
Reference Marker)
5. Enter the stimulus value, and press .

Transcom Vector Network Analyzer――Operating Manual
Transcom Instruments Co., Ltd. Tel: +86-21-64326888 Fax: +86-21-64326777 ‐ 61-
Figure 5-3 Select and Edit Marker
5.1.4. Marker Seartch You can search for a position that matches your specified criteria by using the Marker
Search feature. Marker Search allows you to search for a position that matches any of
the following criteria.
1. Maximum value
2. Minimum value
3. Target (a point that has a target measurement value)
(1) Target nearest to marker position
(2) Target on left-hand side nearest to marker position
(3) Target on right-hand side nearest to marker position
4. Peak
(1) Maximum peak (for a positive peak), minimum peak (for a negative peak)
(2) Peak on left-hand side nearest to marker position
(3) Peak on right-hand side nearest to marker position
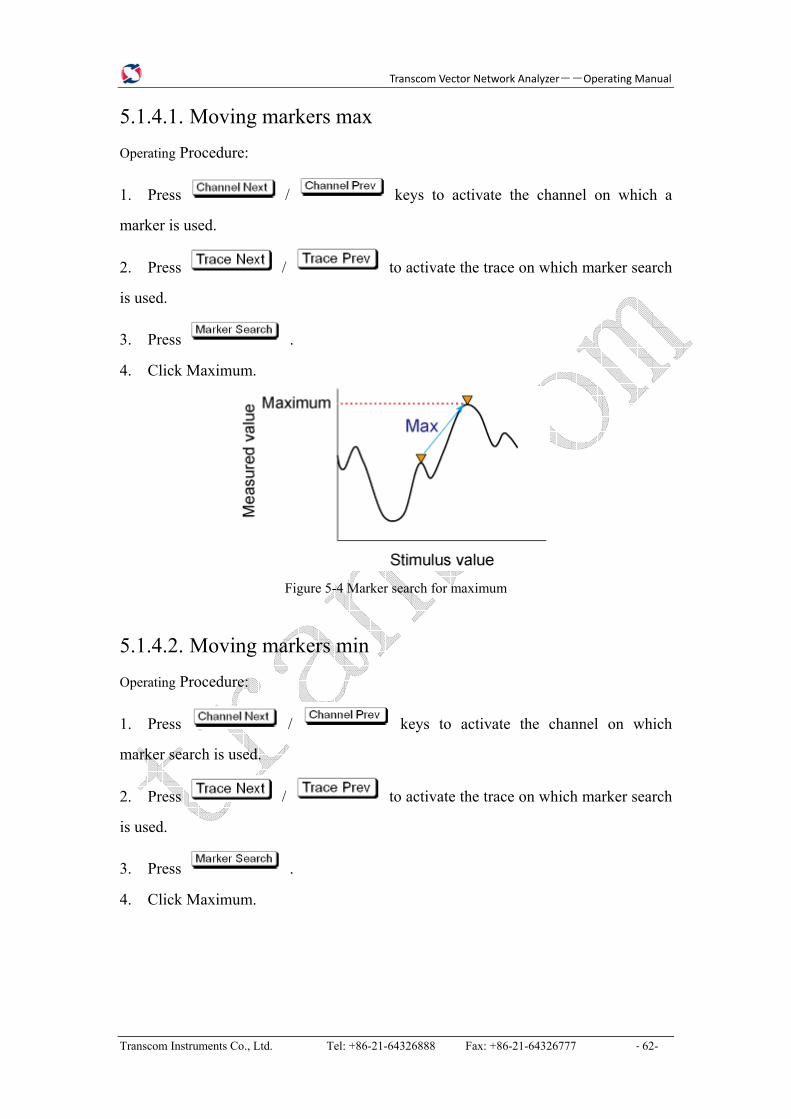
Transcom Vector Network Analyzer――Operating Manual
Transcom Instruments Co., Ltd. Tel: +86-21-64326888 Fax: +86-21-64326777 ‐ 62-
5.1.4.1. Moving markers max Operating Procedure:
1. Press / keys to activate the channel on which a
marker is used.
2. Press / to activate the trace on which marker search
is used.
3. Press .
4. Click Maximum.
Figure 5-4 Marker search for maximum
5.1.4.2. Moving markers min Operating Procedure:
1. Press / keys to activate the channel on which
marker search is used.
2. Press / to activate the trace on which marker search
is used.
3. Press .
4. Click Maximum.
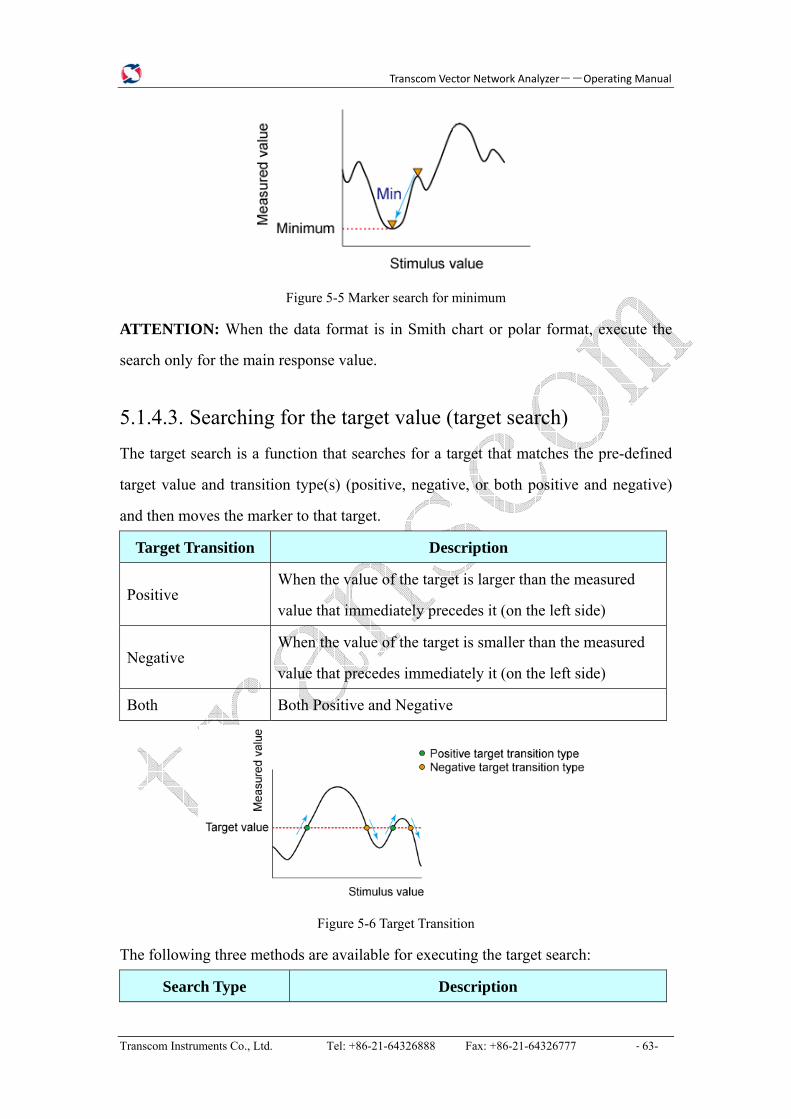
Transcom Vector Network Analyzer――Operating Manual
Transcom Instruments Co., Ltd. Tel: +86-21-64326888 Fax: +86-21-64326777 ‐ 63-
Figure 5-5 Marker search for minimum
ATTENTION: When the data format is in Smith chart or polar format, execute the
search only for the main response value.
5.1.4.3. Searching for the target value (target search) The target search is a function that searches for a target that matches the pre-defined
target value and transition type(s) (positive, negative, or both positive and negative)
and then moves the marker to that target.
Target Transition Description
Positive When the value of the target is larger than the measured
value that immediately precedes it (on the left side)
Negative When the value of the target is smaller than the measured
value that precedes immediately it (on the left side)
Both Both Positive and Negative
Figure 5-6 Target Transition
The following three methods are available for executing the target search:
Search Type Description

Transcom Vector Network Analyzer――Operating Manual
Transcom Instruments Co., Ltd. Tel: +86-21-64326888 Fax: +86-21-64326777 ‐ 64-
Target search
The marker moves to the peak with maximum response
value if the peak polarity is Positive or Both or to the
peak with minimum response value if the peak polarity
is Negative.
Search left
Executes the search from the current marker position to
the smaller stimulus values and moves the marker to
first target encountered.
Search right
Executes the search from the current marker position to
the larger stimulus values and moves the marker to first
target encountered.
Figure 5-7 Type of target search
Operating Procedure:
1. Press / keys to activate the channel on which
marker search is used.
2. Press / to activate the trace on which marker search
is used.
3. Press .
4. Click Target Search > Target Transtion.
5. Click Target Value, enter the target value and press .
6. Click Target Value / Search Target Left / Search Target Right to do the search.

Transcom Vector Network Analyzer――Operating Manual
Transcom Instruments Co., Ltd. Tel: +86-21-64326888 Fax: +86-21-64326777 ‐ 65-
Figure 5-8 Target Value
5.1.4.4. Searching for the peak The peak search function VNAbles you to move the marker to the peak on the trace.
Definition of the peak
A peak is a measurement point whose value is greater or smaller than the adjoining
measurement points on its right and left sides. Peaks are classified into the following
two types depending on the difference in magnitude from the measurement points on
either side of it.
Peak Polarity Description
Positive peak
A peak whose measured value is greater than those of
the measurement points on either side of it (peak
polarity: positive)
Negative peak
A peak whose measured value is smaller than those
of the measuring points on either side of it (peak
polarity: negative)

Transcom Vector Network Analyzer――Operating Manual
Transcom Instruments Co., Ltd. Tel: +86-21-64326888 Fax: +86-21-64326777 ‐ 66-
Both Both positive peak and negative peak
Figure 5-9 Peak Polarrity
Executing a Peak Search
The following three methods are available for executing the peak search:
Search Type Description
Peak
search(Search
Peak)
Moves the marker to the maximum peak when peak polarity is
Positive or Both. Moves the marker to the minimum peak when
peak polarity is Negative.
Left
search(Search
Left)
Executes the search from current marker position to the smaller
stimulus values and moves the marker to first peak encountered.
Right
search(Search
Right)
Execute the search from current marker position to the larger
stimulus values and moves the marker to first peak encountered.
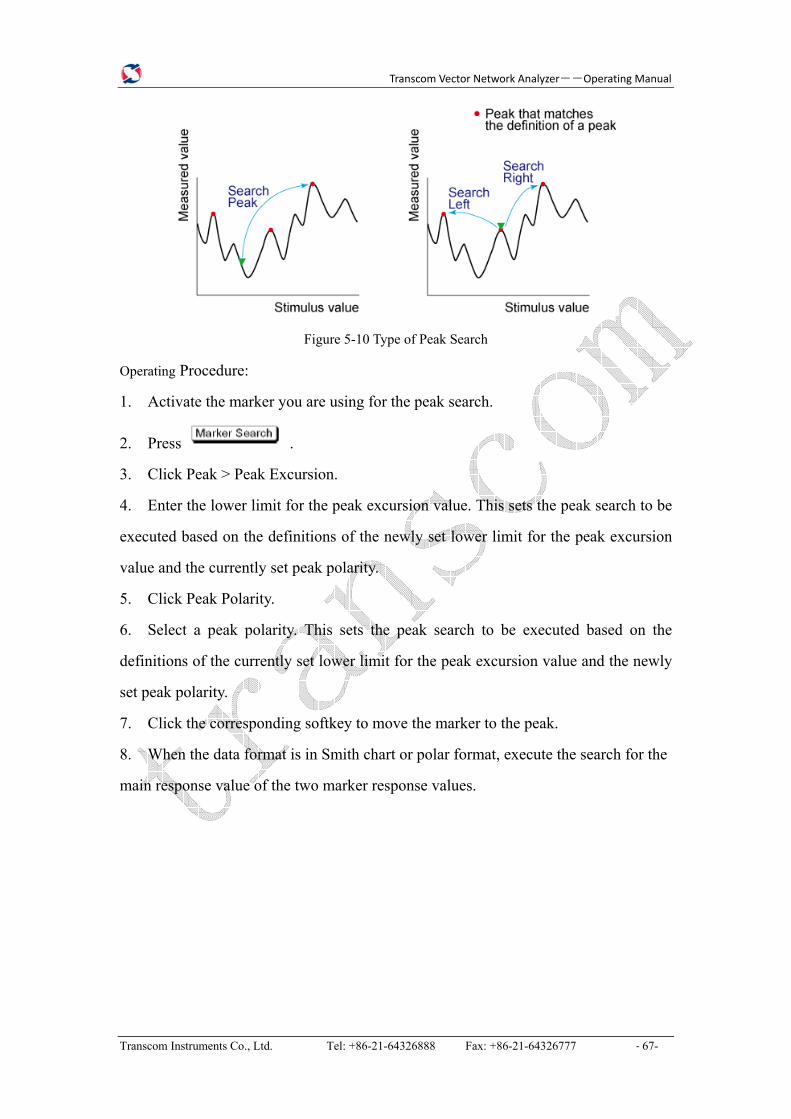
Transcom Vector Network Analyzer――Operating Manual
Transcom Instruments Co., Ltd. Tel: +86-21-64326888 Fax: +86-21-64326777 ‐ 67-
Figure 5-10 Type of Peak Search
Operating Procedure:
1. Activate the marker you are using for the peak search.
2. Press .
3. Click Peak > Peak Excursion.
4. Enter the lower limit for the peak excursion value. This sets the peak search to be
executed based on the definitions of the newly set lower limit for the peak excursion
value and the currently set peak polarity.
5. Click Peak Polarity.
6. Select a peak polarity. This sets the peak search to be executed based on the
definitions of the currently set lower limit for the peak excursion value and the newly
set peak polarity.
7. Click the corresponding softkey to move the marker to the peak.
8. When the data format is in Smith chart or polar format, execute the search for the
main response value of the two marker response values.

Transcom Vector Network Analyzer――Operating Manual
Transcom Instruments Co., Ltd. Tel: +86-21-64326888 Fax: +86-21-64326777 ‐ 68-
Figure 5-11 Peak Excursion
5.1.4.5. Automatically Executing a Search (Search Tracking) Search tracking is a function that sets a search to be repeated every time a sweep is done even if
the execution key for the search (maximum, minimum, peak, and target) is not pressed. This
function facilitates observation of measurement results such as the maximum value of traces (e.g.,
the insertion loss of a band pass filter).
Performing Search Tracking
1. Press / and / keys to
activate the trace on which you want to set up search tracking.
2. Press .
3. Click Tracking and turn the search tracking function ON/OFF.
5.1.4.6. Bandwidth Search The bandwidth search/ notch search is a function for determining the bandwidth of the
trace, center frequency, cut-off points (on the higher frequency and the lower

Transcom Vector Network Analyzer――Operating Manual
Transcom Instruments Co., Ltd. Tel: +86-21-64326888 Fax: +86-21-64326777 ‐ 69-
frequency sides), Q, and insertion loss, based on the position of the active marker. The
definitions of the parameters determined through the bandwidth search are shown in
below.
Figure 5-12 Value defined as the bandwidth
Figure 5-13 Value defined as the notch
Bandwidth Parameter Definition
Insertion loss (loss) The measured value of the position of the active
marker at the time the bandwidth search is executed.
Lower frequency cut-off
point (low)
Lowest frequency of two measurement points, both
separated by the defined bandwidth value from the
active marker position.

Transcom Vector Network Analyzer――Operating Manual
Transcom Instruments Co., Ltd. Tel: +86-21-64326888 Fax: +86-21-64326777 ‐ 70-
Higher frequency cut-off
point (high)
Highest frequency of two measurement points, both
separated by the defined bandwidth value from the
active marker position.
Center frequency (cent)
Frequency at the midpoint between the lower
frequency cut-off and higher frequency cut-off points.
(high+low)/2
Bandwidth (BW)
The difference in frequency between the higher
frequency cut-off and lower frequency cut-off points.
(high-low)
Q Value obtained by dividing the center frequency by the
bandwidth.(cent/BW)
Executing a Bandwidth Search:
1. Press / and / keys to
activate the trace on which the bandwidth search is executed. The response value of
this active marker itself is the insertion loss in the bandwidth search (loss).
2. Press .
3. Click Bandwidth Search.
4. Click Bandwidth Value and enter the defined bandwidth value in the entry area
that appears.
5. Click Bandwidth to turn on the bandwidth search. In the upper left of the trace
display, six bandwidth parameters are displayed.

Transcom Vector Network Analyzer――Operating Manual
Transcom Instruments Co., Ltd. Tel: +86-21-64326888 Fax: +86-21-64326777 ‐ 71-
Figure 5-14 Bandwidth search (Data entry dialog)
Figure 5-15 Bandwidth search results

Transcom Vector Network Analyzer――Operating Manual
Transcom Instruments Co., Ltd. Tel: +86-21-64326888 Fax: +86-21-64326777 ‐ 72-
5.1.4.7. Setting Search Range The Marker Search feature allows you to set part of the sweep range as the search
target (Partial Search feature) as well as the entire search range. For the Partial Search
feature, you can select whether to couple traces in the channel. The Marker Statistics
value is calculated by using the search range.
Procedure to Set Search Range
1. Press / keys and Trace Next /
keys to activate the trace for which you want to set the search range.
2. Press .
3. Click Search Range to turn ON the Partial Search feature.
4. Click Search Start, then enter the start value (lower limit) of the search range.
5. Click Search Stop, then enter the stop value (upper limit) of the search range.
6. Click Search Range to turn ON the Partial Search feature.
7. Click Couple to toggle ON/OFF trace coupling within the search range.
5.1.4.8. Setting up Markers for Each Trace/Setting up Markers
for Coupled Operation between Traces Makers can be set up and moved either in coupled operation for all traces in a channel
or independently for each trace.
1. Press / keys to activate the channel on which the
marker couple will be set.
2. Press .
3. Click Couple to turn the marker coupling on or off.

Transcom Vector Network Analyzer――Operating Manual
Transcom Instruments Co., Ltd. Tel: +86-21-64326888 Fax: +86-21-64326777 ‐ 73-
5.1.5. Marker Function
5.1.5.1. Marker Transfer Settings (I) Setting the Sweep Range Using the Marker
1. In the channel window whose range must be set, place the active marker on the
active trace to a position that corresponds to the new range (to the lowest, highest, or
center value).
2. Press .
3. Click the softkey that corresponds to each value.
Figure 5-16 Marker->Start
If the reference marker is on and the stimulus value of the active marker is expressed
by a value relative to the reference marker, the absolute stimulus value will be used to
set the new sweep rang.
(II) Setting the Reference Using the Marker
1. In the trace whose reference must be set, place the active marker on the active
trace to a position that corresponds to the new reference.
2. Press .
3. Click Marker->Reference.
(III) Setting the Delay Using the Marker

Transcom Vector Network Analyzer――Operating Manual
Transcom Instruments Co., Ltd. Tel: +86-21-64326888 Fax: +86-21-64326777 ‐ 74-
1. In the trace whose reference must be set, place the active marker on the active
trace to a position that corresponds to the new reference.
2. Press .
3. Click Marker->Delay (Scale>Electrical Delay).
5.1.5.2. Marker Couple Makers can be set up and moved either in coupled operation for all traces in a channel
or independently for each trace.
1. Press / keys to activate the channel on which the
marker couple will be set.
2. Press .
3. Click Couple to turn the marker coupling on or off.
Figure 5-17 Marker Couple
5.1.5.3. Listing all Marker Values in all Displayed Channels You can list all of the marker values in all of the displayed channels on the screen.
Turning On the Marker Table Display
1. Press .
2. Click Marker Table to turn on the marker table display.
5.1.5.4. Marker Statistics Data You can easily determine the statistics data for a trace (mean, standard deviation, and

Transcom Vector Network Analyzer――Operating Manual
Transcom Instruments Co., Ltd. Tel: +86-21-64326888 Fax: +86-21-64326777 ‐ 75-
peak-to-peak). The definitions for the statistics data elements are shown below.
Figure 5-18 Marker Statistics
Statistics data element Definition
Mean (mean)
(n: number of points; xi: measured value at the
i-th measurement point)
Standard deviation
(s. dev)
(n: number of points; xi: measured value at the
i-th measurement point; mean: Mean)
Peak-to-peak (p - p)
Max-Min
(Max: greatest measured value; Min: smallest
measured value
Displaying Statistical Data:
1. Press / keys and /
keys to activate the trace for which statistical data is required.
2. Press key.
3. Click Statistics to turn on the display of statistics data.
4. Click Statistics Start and Statistics Stop to set the range of Statistics.

Transcom Vector Network Analyzer――Operating Manual
Transcom Instruments Co., Ltd. Tel: +86-21-64326888 Fax: +86-21-64326777 ‐ 76-
5.1.5.5. Specifying Display Position of Marker Values This section describes how to specify the marker value display position for each
active trace.
Operational procedure:
1. Press / keys to activate the channel for which you
want to set marker coupling.
2. Press key.
3. Click Annotation Options.
4. Click Data X Pos to set the horizontal display position.
5. Click Data Y Pos to set the vertical display position.
5.1.5.6. Aligning Marker Value Display This section describes how to align maker value displays.
Value Description
On
(Align ON)
Displays marker values to align to the display position of
trace 1.
Off
(Align OFF)
Displays marker values in the display position defined for
each trace.
5.2. Limit Test The limit test feature allows you to set the limit line for each trace and then perform
the pass/fail judgment for the measurement result.
The limit test is a function to perform pass/fail judgment based on the limit line you
set with the limit table.
In the limit test, if the upper limit or lower limit indicated by the limit line is not
exceeded, the judgment result is pass; if it is exceeded, the judgment result is fail for
all measurement points on the trace. Measurement points in a stimulus range with no
limit line are judged as pass.

Transcom Vector Network Analyzer――Operating Manual
Transcom Instruments Co., Ltd. Tel: +86-21-64326888 Fax: +86-21-64326777 ‐ 77-
ATTENTION: The targets of the pass/fail judgment are measurement points only.
Parts interpolated between measurement points are not judged.
You define the limit line by specifying the stimulus value (Begin Stimulus) and
response value (Begin Response) of the begin point, the stimulus value (End Stimulus)
and response value (End Response) of the end point, and the type (lower limit/upper
limit). For more information, refer to Defining the limit line.
When the limit test is on, measurement points that fail are displayed in red on the
screen and the trace's pass/fail judgment result based on the results of individual
measurement points (fail if one or more measurement points on the trace fail) is also
displayed. You can check the pass/fail judgment result for the channel (fail if one or
more traces fail in any of the limit test, the ripple test or the bandwidth test within the
channel) on the screen as well. For more information, refer to Displaying judgment
result of limit test.
In addition to viewing the screen, you can check the judgment result of the limit test
by the following methods.
Figure 5-19 Limit Table
segment parameter values shown below:
Segment Parameter Description
Type Select the type of segment from the following:

Transcom Vector Network Analyzer――Operating Manual
Transcom Instruments Co., Ltd. Tel: +86-21-64326888 Fax: +86-21-64326777 ‐ 78-
OFF Segment not used for the limit test
MIN Segment at which the minimum is specified
MAX Segment at which the maximum is specified
Begin Stimulus Specify starting point for stimulus value on the limit
line
End Stimulus Specify ending point for stimulus value on the limit
line
Begin Response Specify starting point for response value on the limit
line
End Response Specify ending point for response value on the limit
line
ATTENTION:
You can define a limit line that is able to freely overlap the stimulus range of
another limit line.
Defining one limit line having the same type as a second limit line whose stimulus
range overlaps with the first one result in two or more limit values at the same
measurement point. In this case, the limit value to be used in the limit test is defined
as follows:
When two or more limit values whose type is set to maximum (MAX) exist, the
smallest one is used as the maximum.
When two or more limit values whose type is set to minimum (MIN) exist, the largest
one is used as the minimum.
Even if the span of the sweep range on the T5230A/T5280A is set to 0, enter the
two parameters of Begin Stimulus and End Stimulus.
When two or more response values are returned as a result of using the Smith or
polar chart format, the first response value of the marker provides the object of the
limit test.

Transcom Vector Network Analyzer――Operating Manual
Transcom Instruments Co., Ltd. Tel: +86-21-64326888 Fax: +86-21-64326777 ‐ 79-
Measurement points that fail are displayed in red on the screen. The judgment result
of the trace is indicated by Pass or Fail displayed in the upper right part of the graph.
Figure 5-20 LimitTest
5.2.1. Defining Limit Line To use the limit test, you must first define the limit line. You can define a limit table
for each trace, and you can define up to 100 limit lines (segments) in a limit table.
The following steps describe how to define a segment.
1. Press t/ keys and /
keys to select the trace on which the limit test function will be used.
2. Press key to display the Analysis menu.
3. Click Limit Test to display the softkeys associated with the limit test.
4. Click Edit Limit Line to display the limit table.
5. Click Add to add a segment to the limit table and then specify the segment
parameter values shown below.

Transcom Vector Network Analyzer――Operating Manual
Transcom Instruments Co., Ltd. Tel: +86-21-64326888 Fax: +86-21-64326777 ‐ 80-
Figure 5-21 Edit Limit Table
Softkey Function
Delete Delete a segment
Add Add a segment
Edit Edit the segment
Clear Limit Table Clear the limit table
Save Limit Table Open the Save As dialog box. In this step, lim
(extension: *.lim) is selected as the file type.
Restore Limit Table Recall the limit table you have saved.
5.2.2. Limit line offset By adding a certain offset to the limit value, you can adjust the limit line so that it
conforms to the device output.
1. Press / keys and /
keys to select the trace on which the limit test function will be used.

Transcom Vector Network Analyzer――Operating Manual
Transcom Instruments Co., Ltd. Tel: +86-21-64326888 Fax: +86-21-64326777 ‐ 81-
2. Press key to display the Analysis menu.
3. Click Limit Test to display the softkeys for the limit test.
4. Click Limit Line Offsets to display the limit line offset function menu. The
following functions correspond to each softkey.
Figure 5-22 Stimulus Offset
Softkey Function
Stimulus Offset Adds a certain offset to the stimulus value of the entire
segment in the limit table. (Stimulus offset)
Response Offset Adds a certain offset to the response value of the entire
segment in the limit table. (Amplitude offset)
Marker->
Response Ofs.
Adds the amplitude offset by the same amount as the
retrieved value of the active marker. You can confirm the
current value set for the amplitude offset by pressing
Amplitude Offset. (Marker amplitude offset)
5.2.3. Turning the limit test ON/OFF You can set the limit test ON/OFF for each trace individually.
1. Press / keys and /
keys to select the trace on which the limit test function will be used.
2. Press key to display the Analysis menu.
3. Click Limit Test to display the Limit Test menu.

Transcom Vector Network Analyzer――Operating Manual
Transcom Instruments Co., Ltd. Tel: +86-21-64326888 Fax: +86-21-64326777 ‐ 82-
4. Click Fail Sign.
5. Click Limit Line.
6. Click Limit Test.
5.3. Ripple Test Independently of the limit test, you can evaluate the measurement results on a
pass/fail basis by setting a limit for the ripple. This function is called the ripple test.
The ripple test is a function for evaluating the results on a pass/fail basis based on the
ripple limit, which is set using the ripple limit table. You can specify up to 12
frequency bands, which permits a test for each frequency band.
The ripple test judges the measurement as "Pass" when the ripple value specified with
the ripple limit is not exceeded by any of the measurement points on the trace;
otherwise, it judges the measurement as "Fail". For the measurement points in a
stimulus range without a specified ripple limit, the test judges the measurement as
"Pass".

Transcom Vector Network Analyzer――Operating Manual
Transcom Instruments Co., Ltd. Tel: +86-21-64326888 Fax: +86-21-64326777 ‐ 83-
Figure 5-23 Result of Ripple Test
5.3.1. Configuring Ripple Limit You must configure the ripple limit before you can use the ripple test function. You
can specify a ripple limit table for each trace, where up to 12 ripple limit bands
(frequency bands) can be configured.
Operating procedure:
1. Press / keys and /
keys to select the trace on which you want to apply the ripple test function.
2. Press to display the Analysis menu.
3. Click Ripple Limit to display the softkeys for to the ripple test.
4. Click Edit Ripple Limit to display the ripple limit table shown below.
Figure 5-24 Ripple Test Edit Window
Softkey Function
Delete Delete a segment

Transcom Vector Network Analyzer――Operating Manual
Transcom Instruments Co., Ltd. Tel: +86-21-64326888 Fax: +86-21-64326777 ‐ 84-
Add Add a segment
Edit Edit the segment
Clear Ripple Limit Table Clear the ripple limit table
Save Ripple Limit Table Open the Save As dialog box. In this step, lim
(extension: *.rlm) is selected as the file type.
Restore Ripple Limit Table Recall the ripple limit table you have saved.
5.3.2. Turning ON/OFF Ripple Test and Result Display You can set the limit test ON/OFF for each trace individually.
1. Press / keys and /
keys to select the trace on which you want to apply the ripple test function.
2. Press to display the Analysis menu.
3. Click Ripple Limit to display the softkeys for the ripple test.
Figure 5-25 Ripple Limit (Softkeys)
Softkey Function

Transcom Vector Network Analyzer――Operating Manual
Transcom Instruments Co., Ltd. Tel: +86-21-64326888 Fax: +86-21-64326777 ‐ 85-
Ripple Test Sets the ripple test ON/OFF.
Ripple Limit Sets the ripple limit line display ON/OFF.
Ripple Value Sets how the ripple values are displayed. Available settings are
off, absolute value (difference between maximum and
minimum values within the band) display, and margin
(difference between absolute value of ripple and ripple limit)
display.
Ripple Value
Band
Selects the band for which you want to display the ripple
value.
Edit Ripple
Limit
Opens the ripple limit table for editing the ripple limit. To use
the ripple test function, you must first define the ripple limit.
4. Click Ripple Limit to turn on/off the ripple limit function.
5. Click Ripple Value set how the ripple values are displayed.
6. Click Fail Sign to show the result of ripple limit.
5.4. Fixture Simulator The Fixture Simulator is a function that uses software in the T5230A/T5280A to
simulate various measurement conditions based on the measurement results. The
functions available in Fixture Simulator are as follows:
1. Port reference impedance conversion
2. Network de-embedding
3. Embedding
(I) Port reference impedance conversion
1. Press / keys to select the channel on which you
want to use fixture simulator function.
2. Press .
3. Click Fixture Simulator to enter the next menu. Click Fixture Simulator to turn
ON/OFF the function.

Transcom Vector Network Analyzer――Operating Manual
Transcom Instruments Co., Ltd. Tel: +86-21-64326888 Fax: +86-21-64326777 ‐ 86-
4. Click Port Z Conversion, enter the next menu. Click Port Z Conversion to turn
ON/OFF the function. Click Port1 Z0 to enter the Z0 data, click Port2 Z0 to enter the
Z0 data.
Figure 5-26 Port Z Conversion
(II) Network de-embedding
Network de-embedding is a function for performing measurements, test port by test
port, by removing the characteristics of an arbitrary network defined by a Touchstone
data file.

Transcom Vector Network Analyzer――Operating Manual
Transcom Instruments Co., Ltd. Tel: +86-21-64326888 Fax: +86-21-64326777 ‐ 87-
Figure 5-27 Network De-Embedding
1. Press / keys to select the channel on which you
want to use fixture simulator function.
2. Press .
3. Click De-Embedding to enter the next menu.
4. Click Port1 S-parameters File to open Sparameters of simulation data file, click Port2
S-parameters File to open Sparameters of simulation data file.

Transcom Vector Network Analyzer――Operating Manual
Transcom Instruments Co., Ltd. Tel: +86-21-64326888 Fax: +86-21-64326777 ‐ 88-
Figure 5-28 De-Embedding (Sparameters of simulation data file)
5. Click Port1 to turn ON/OFF, click Port2 to turn ON/OFF.
(III) Embedding
Figure 5-29 Embedding

Transcom Vector Network Analyzer――Operating Manual
Transcom Instruments Co., Ltd. Tel: +86-21-64326888 Fax: +86-21-64326777 ‐ 89-
5.5. Time Domain The T5230A/T5280A provides the time domain function, which is used to
mathematically transform waveforms in the frequency domain that can be measured
with a general network analyzer to waveforms in the time domain.
The waveform in the frequency domain shows ripples due to mismatches, but it is
difficult to estimate their locations. On the other hand, from the waveform in the time
domain, you can determine the locations and magnitudes of mismatches.
Operating Procedure:
1. Press / keys and /
keys to select the trace on which you want to apply the time domain function.
2. Press to display the Analysis menu.
3. Click Time Domain to display the softkeys for the time domain.
4. Click Time Domain to turn ON/OFF this function.
5. Click Start and Stop to set the time range, or Click center and span to set the time
range.
6. Click Type to select the type, including Bandpass, Lowpass Step, Lowpass
Impulse.
7. Click Window to select the shape of window, including Maximum, Normal,
Minimum, Impluse Width, KiserBeta.
5.6. Gating Deletes unnecessary data in the time domain from original data in the time domain.
For more information, refer to Deleting Unnecessary Data in Time Domain (gating).
Measurement Flow:
Item Description
1. Measurement in
frequency domain
Executes measurement in frequency domain
2. Transformation to VNAbles transformation function and transforms

Transcom Vector Network Analyzer――Operating Manual
Transcom Instruments Co., Ltd. Tel: +86-21-64326888 Fax: +86-21-64326777 ‐ 90-
time domain measurement data to data in time domain
3. Setting the gate Makes the following settings of the gate to select the
necessary domain:Gate type, Gate shape, Gate range
4. Transformation back
to frequency domain
Disables transformation function and displays
response in frequency domain corresponding to the
data selected with the gate
The following figure shows the change in the waveform at each step of the flow.
Figure 5-30 Change in the waveform at each step of the flow
(I). Setting Gate Type
The T5230A/T5280A lets you choose from the following two gate types:
Gate type Description
Band pass Deletes response outside the gate range
Notch Deletes response inside the gate range
Operating Procedure:
1. Press / keys and /
keys to select the trace on which you want to apply the gating function.
2. Press to display the Analysis menu.

Transcom Vector Network Analyzer――Operating Manual
Transcom Instruments Co., Ltd. Tel: +86-21-64326888 Fax: +86-21-64326777 ‐ 91-
3. Click gating to display the softkeys for the gating.
4. Click Type to select the type, including Bandpass and Notch.
(II). Setting Gate Shape
The gate is a filter whose shape looks like a band pass filter. There are several
parameters that indicate the gate shape. The following figure shows the definition of
the gate shape parameters.
Figure 5-31 Gating (the definition of the gate shape parameters)
The following table compares the characteristics according to the gate shape.
Gate shape Sidelobe level Minimum gate span
Minimum -48 dB 2.8/frequency span
Normal -68 dB 5.6/frequency span
Wide -57 dB 8.8/frequency span
Maximum -70 dB 25.4/frequency span
Operating Procedure:
1. Press / keys and /
keys to select the trace on which you want to apply the gating function.
2. Press to display the Analysis menu.
3. Click gating to display the softkeys for the gating.
4. Click Shape to select the shape of window.
(III). Setting Gate Range

Transcom Vector Network Analyzer――Operating Manual
Transcom Instruments Co., Ltd. Tel: +86-21-64326888 Fax: +86-21-64326777 ‐ 92-
Specify the gate range in time. The ends of the range are defined as the - 6 dB
attenuation points shown in the figure above. You can set the gate range by specifying
the start and stop times or the center and span. The T5230A/T5280A has the following
limitations on the gate range you can set.
Lower limit: -Tspan, Upper limit: Tspan
Tspan is the measurement range expressed in time obtained in Measurement range.
Operating Procedure:
1. Press / keys and /
keys to select the trace on which you want to apply the gating function.
2. Press to display the Analysis menu.
3. Click gating to display the softkeys for the gating.
4. Click Start and Stop to set the time range, or click center and span to set the time
range.
(IV). VNAbling Gating Function
Operating Procedure:
1. Press / keys and /
keys to select the trace on which you want to apply the gating function.
2. Press to display the Analysis menu.
3. Click gating to display the softkeys for the gating.
4. Click Gating to turn ON/OFF the gating function.
5.7. Performing Parameter Conversion of Measurement Results (I) You can use the parameter conversion function to convert the measurement
results of the S-parameter (Sab) to the following parameters.
1. Equivalent impedance (Zr) and equivalent admittance (Yr) in reflection
measurement

Transcom Vector Network Analyzer――Operating Manual
Transcom Instruments Co., Ltd. Tel: +86-21-64326888 Fax: +86-21-64326777 ‐ 93-
2. Equivalent impedance (Zt) and equivalent admittance (Yt) in transmission
measurement
3. Inverse S-parameter (1/Sab)
where:
Z0a: Characteristic impedance of port a
Z0b: Characteristic impedance of port b
4. Z/Y Transmission Shunt
5. Conjugation
Conjugation converts the measurement value to complex conjugate number.
When the fixture simulator function is ON and the port impedance function is ON, the
value set in the port impedance conversion is used. In other cases, the system Z0
(preset value: 50 ohm) is used.
(II) ON/OFF
Operating Procedure:
1. Press / keys and /

Transcom Vector Network Analyzer――Operating Manual
Transcom Instruments Co., Ltd. Tel: +86-21-64326888 Fax: +86-21-64326777 ‐ 94-
keys to select the trace on which you want to use the marker.
2. Press to display the Analysis menu.
3. Click Conversion.
4. Click Conversion to turn ON the conversion function.
(III) Selecting Conversion Target Parameter
Operating Procedure:
1. Press / keys and /
keys to select the trace on which you want to use the marker.
2. Press to display the Analysis menu.
3. Click Conversion > Function.
4. Click the softkey corresponding to the parameter to which you want to convert
the result.

Transcom Vector Network Analyzer――Operating Manual
Transcom Instruments Co., Ltd. Tel: +86-21-64326888 Fax: +86-21-64326777 ‐ 95-
6. Data Output
6.1. Saving Data
6.1.1. Overview Save Type You can save the instrument state of the T5230A/T5280A into a file on mass storage
and then recall it later to reproduce that state. You can select the stored data from the
following four types.
Type Stored data and usage
State only
(State Only)
Saves the setting of the T5230A/T5280A and reproduces the
state when it was saved by recalling it later into the VNA
State and
calibration data
(State & Cal)
Saves the setting of the T5230A/T5280A and calibration data
(calibration coefficient array) to reproduce the state when it was
saved by recalling it later into the VNA At this time, you can
perform error correction of measured values by using the
recalled calibration data.
State and trace
(State & Trace)
Saves the setting of the T5230A/T5280A and traces
(error-corrected data array and error-corrected memory array)
to reproduce the state when it was saved by recalling it later
into the VNA At this time, the traces are also recalled and
displayed on the screen.
State, calibration
data, and traces
(All)
Saves the setting of the T5230A/T5280A, calibration data, and
traces to reproduce the state when it was saved by recalling it
later into the VNA At this time, the calibration data and traces
are also recalled.

Transcom Vector Network Analyzer――Operating Manual
Transcom Instruments Co., Ltd. Tel: +86-21-64326888 Fax: +86-21-64326777 ‐ 96-
6.1.2. Saving Instrument State Operating steps:
1. Press key.
2. Click Save Type.
3. Press key or key, Save
4. Click Save State.
5. Press , and Choose(State1~State10), Press key, or Click State
File, Choose to save state file, Click save button.
Figure 6-1 Save State (State Select)
6.1.3. Save Channel The T5230A/T5280A allows you to save/recall the instrument state for each channel
independently. This function allows you to save the instrument state of the active
channel independently into one of four registers (A to D, volatile memory) and to
recall the instrument state from the register to restore it as the state of the currently

Transcom Vector Network Analyzer――Operating Manual
Transcom Instruments Co., Ltd. Tel: +86-21-64326888 Fax: +86-21-64326777 ‐ 97-
active channel. As in the case of saving the entire state of the instrument into a file,
you can select items to be saved from four kinds.
Since you can recall the instrument state for each channel that was saved with this
function from a different channel that the one used to save it, this function is very
useful for copying an instrument state between channels.
ATTENTION: Unlike when saving the entire instrument state, the instrument state
for each channel is saved into volatile memory instead of a file, so if you turn off the
power, this state is lost.
Operating steps:
1. Press or Key, to activate a channel whose state you
want to save.
2. Press Key.
3. Click Save Channel.
4. Click one of State A to State D to save the instrument state of the active channel to
the specified register. For registers having saved data, the “” symbol is displayed to
the right of their softkey label. If you specify one of these, its content is overwritten.
6.1.4. Save Trace Data The T5230A/T5280A allows the user to save data for the active trace on the active
channel to a CSV file (file extension *.csv) and to load the data into PC application
software for further processing.
Prpcedure:
1. Press or Key and
Press or Key to select the trace to be saved.
2. Press Key.
3. Click Save Trace Data to open the Save As dialog box, Select the destination
folder and input a file name,Click Save to save the file.

Transcom Vector Network Analyzer――Operating Manual
Transcom Instruments Co., Ltd. Tel: +86-21-64326888 Fax: +86-21-64326777 ‐ 98-
Figure 6-2 Save Trace Data
6.2. Save Data in ToutchStone You can save data in "log magnitude - angle", "linear magnitude - angle", or "real
number - imaginary number."。File types are *.s1p 和*.s2p。The file type indicates the
number of ports of the data structure that is output to the Touchstone file.
Operating Procedure:
1. Press or Key and Press or
Key, to select the trace to be saved.
2. Press Key.
3. Click Save Data To Touchstone File.
4. Click Type, Choose file types, Click 1-Port(s1p), Choose s1p, Click2-Port(s2p),
Choose s2p, Selected function button before “”.
5. Press Key or Key, Save Data To Touchstone File.
6. If choose file type is s1p, Need to choose port, Otherwise, don't need this step

Transcom Vector Network Analyzer――Operating Manual
Transcom Instruments Co., Ltd. Tel: +86-21-64326888 Fax: +86-21-64326777 ‐ 99-
operation. Click Select Port, Each click once, On a 1, 2 switching.
7. Click Format, In Touchstone Format, choose file type. File type Shown below:
Softkey Function
Real-Imaginary Select "real - imaginary number" data format
Magnitude-Angle Select "linear magnitude - angle" data format
dB-Angle Select "log magnitude - angle" data format
8. Press Key or Key, Return Save Data To Touchstone File.
9. Click Save File, Open “save as” dialog box, Input to save the filVNAme, Click
save.
Figure 6-3 Save Data in ToutchStone
6.3. Recall
6.3.1. Recall State Operating Procedure:
1. Press Key,Into Recall.
2. Click Recall State,Into Recall State.

Transcom Vector Network Analyzer――Operating Manual
Transcom Instruments Co., Ltd. Tel: +86-21-64326888 Fax: +86-21-64326777 ‐ 100-
3. Press Key,Choose State1~State10(Only the instrument has saved state
can choose),Press Key,or Click State File,Choose the instrument saved State
File
4. Click Open。Shown below:
Figure 6-4 Recall State
6.3.2. Recall Channel Operating Procedure:
1. Press Key,Into Recall。
2. Click Recall Channel,Into Recall C。
3. Press Key,Click one of State A to State D to save the instrument state
of the active channel to the specified register,Press Key,Shown below:

Transcom Vector Network Analyzer――Operating Manual
Transcom Instruments Co., Ltd. Tel: +86-21-64326888 Fax: +86-21-64326777 ‐ 101-
Figure 6-5 Recall Channel
6.3.3. Delete State Operating Procedure:
1. Press Key.
2. Click Delete State,Open Delete State File,Choose to Delete State File,Click
Open,Shown below:

Transcom Vector Network Analyzer――Operating Manual
Transcom Instruments Co., Ltd. Tel: +86-21-64326888 Fax: +86-21-64326777 ‐ 102-
Figure 6-6 Delete State
6.3.4. Delete All State
Operating Procedure:
1. Press Key。
2. Click Delete All Statel,Shown below:
Figure 6-7 Delete All State

Transcom Vector Network Analyzer――Operating Manual
Transcom Instruments Co., Ltd. Tel: +86-21-64326888 Fax: +86-21-64326777 ‐ 103-
7. Optimizing Measurements
7.1. Expanding Dynamic Range
The dynamic range is the finite difference between the maximum input power level
and the minimum measurement power level (noise floor) of the analyzer. In
evaluating a characteristic accompanied by a large change in the amplitude (the pass
band and stop band of a filter, for example), it is important to increase the dynamic
range.
Lowering the noise floor of the receiver VNAbles you to expand the dynamic range.
The following methods can be used to lower the receiver noise floor.
1. Narrowing the IF bandwidth
2. Turning on Sweep Averaging
7.1.1. Narrowing the IF bandwidth Narrowing the receiver IF bandwidth VNAbles you to reduce the effect of random
noise on measurements. Narrowing the IF bandwidth to 1/10 the original bandwidth
causes the receiver noise floor to decrease by 10 dB.
To specify the IF bandwidth, follow the steps described below.
1. Press or Key, to select a channel on which to specify
the IF bandwidth.
2. Press Key.
3. Click IF Bandwidth.
4. Change the IF bandwidth in the data entry area.
7.1.2. Turning on Sweep Averaging Using sweep averaging also VNAbles you to reduce the effects of random noise on
measurements.

Transcom Vector Network Analyzer――Operating Manual
Transcom Instruments Co., Ltd. Tel: +86-21-64326888 Fax: +86-21-64326777 ‐ 104-
Sweep averaging averages data from each point (vector quantity) based on the
exponential average of a continuous sweep weighted by the averaging factor specified
by the user. Sweep averaging is expressed in following equation.
Where:
1. An = Result of the calculation of sweep averaging for the nth sweep operation at
the point in question (a vector quantity)
2. Sn = Measurement value obtained at the nth sweep operation at the point in
question (a vector quantity)
3. F = Sweep averaging factor (an integer between 1 and 999)
Define the sweep averaging by following the steps below.
1. Press or Key,select the channel on which you want to
define the sweep averaging.
2. Press key。
3. Click Ave Factor
4. change the averaging factor in the data entry area.。
5. Click Averaging,Turn ON the Averaging,Be Open Averaging;Turn OFF the
Averaging,Be turn OFF the Averaging.
7.2. Reducing Trace Noise
Smoothing can be used to reduce noise that has relatively small peaks. By turning on
smoothing, the value of each point on a trace is represented by the moving average
over the values of several nearby points. The smoothing aperture (percentage of
sweep span) defines the range of points to be included in the calculation of the
moving average.
Set up the smoothing operation by following the steps below:
1. Press or Key and

Transcom Vector Network Analyzer――Operating Manual
Transcom Instruments Co., Ltd. Tel: +86-21-64326888 Fax: +86-21-64326777 ‐ 105-
Press or Key,To activate the trace on which smoothing will
be defined.
2. Press Key。
3. Click Smo Aperture,
4. Change the Smoothing aperture (%) in the data entry area
5. Click Smothing,Turn ON the Smoothing,Be Open Smoothing;Turn OFF the
Smoothing,Be turn OFF the Smoothing.
7.3. Improving Phase Measurement Accuracy
7.3.1. Electrical Delay Electrical Delay is a function that adds or removes a pseudo-lossless transmission line
with a variable length corresponding to the receiver input. Using this function
VNAbles you to improve the resolution in phase measurement and thereby measure
deviation from the linear phase. You can specify the electrical delay trace by trace.
Depending on the media type, the calculation method of the electrical delay, which is
required to correct the phase delay, differs.
Operating Procedure:
1. Press Key and Press or Key,
To activate the phase trace for which you want to specify the Electrical Delay.
2. Press Key。
3. Click Electrical Delay。
4. Change the electrical delay (Entry) in the data entry area.
7.3.2. Phase Offset Phase offset is a function used to add or subtract a predetermined value relative to the
frequency to and from the trace. Using this function VNAbles you to simulate the
phase offset occurring as a result of, say, adding a cable. The phase offset can be

Transcom Vector Network Analyzer――Operating Manual
Transcom Instruments Co., Ltd. Tel: +86-21-64326888 Fax: +86-21-64326777 ‐ 106-
specified from -360° to +360°.
Operating Procedure:
1. Press or Key and
Press or Key,To activate the phase trace for which you want
to specify the Phase Offset.
2. Press Key.
3. Click Phase Offset, Change the Phase Offset(Entry) in the data entry area.
7.4. Improve the measurement speed
7.4.1. Turn Off Update Operating Procedure:
1. Press Key.
2. Click Update, State witch to OFF.
7.4.2. Turn Off Correction (I) Turn off measure calibration data.
1. Press Key.
2. Click Correction, State witch to OFF.
(II) Turn Off System calibration data
1. Press Key.
2. Click Misc Setup.
3. Click System Correction, Turn ON the System Correction, Be the System
Correction; Turn OFF the System Correction, Be turn OFF the System Correction.

Transcom Vector Network Analyzer――Operating Manual
Transcom Instruments Co., Ltd. Tel: +86-21-64326888 Fax: +86-21-64326777 ‐ 107-
7.4.3. Performing a Segment-by-Segment Sweep
7.4.3.1. Concept of Segment Sweep To perform a segment sweep, you must define two or more frequency ranges, called
segments, and then specify the number of points, IF bandwidth, power level, sweep
mode, sweep delay time, and sweep time for each segment. All segments are swept
sequentially as if swept in one sweep operation.
By skipping the frequency range, which does not need to be measured, you can
sweep and measure only the portions you need.
You can define the optimum measurement conditions for each of the segments
you designate. For example, you can specify as many points as possible in a segment
requiring high trace resolution and as few points as possible in a segment not
requiring high resolution. This shortens the measurement time, VNAbling you to
optimize the overall measurement throughput by not having to perform the entire
operation under the same measurement conditions of a particular frequency range.
To evaluate a band pass filter having the transmission characteristics shown in the
following figure. for example, you can select the frequency ranges you need from A
through G and determine the measurement conditions shown in the table below This
VNAbles you to measure them simultaneously in one sweep operation.
Figure 7-1 Segment Sweep
Start
Frequency
Stop Frequency Number
of points
IF
Bandwidth
Power Delay

Transcom Vector Network Analyzer――Operating Manual
Transcom Instruments Co., Ltd. Tel: +86-21-64326888 Fax: +86-21-64326777 ‐ 108-
A 440 MHz 915MHz 50 50kHz 0dBm 0s
B 915 MHz 980MHz 130 70kHz 0dBm 0s
C 980 MHz 1.035GHz 60 50kHz 0dBm 0s
D 1.035GHz 1.07GHz 60 50kHz 0dBm 0s
E 1.07GHz 2GHz 100 70kHz 0dBm 0s
F 2GHz 2.6GHz 40 70kHz 0dBm 0s
G 2.6GHz 3GHz 40 70kHz 0dBm 0s
7.4.3.2. Conditions for Setting Segment Sweep The following conditions apply when setting up a segment sweep.
1. The frequency range of a segment must not overlap with that of another segment.
(The start frequency of a segment must be higher than the stop frequency of the
immediately preceding segment).
2. The start frequency of segment 1 must be greater than lowest frequency and the
stop frequency of the last segment less than highest frequency, as per the frequency
range depending on the option.
3. When the start frequency and stop frequency of a segment are not the same, you
can define from 2 to 2001 points in a segment.
4. When the start frequency and stop frequency of a segment are the same, you can
define from 1 to 2001 points in a segment.
5. You can set the total number of points in the segment table from 2 to 2001.
6. You can set the number of segments in the segment table to between 1 and 12.
7. You can turn ON or OFF segments.
Data Item Description
Start Sets the start value of the sweep range
Stop Sets the stop value of the sweep range
Points Sets the number of points
IFBW Sets the IF bandwidth
POWER Sets the power level

Transcom Vector Network Analyzer――Operating Manual
Transcom Instruments Co., Ltd. Tel: +86-21-64326888 Fax: +86-21-64326777 ‐ 109-
Delay Sets the sweep delay time
Operating Procedure:
1. Press or Key, Choose to a new Segment Table data.
2. Press Key.
3. Click Segment Table, Into Segment Table.
Softkey Function
Add Add a line in Segment table data
Delete Delete the last line in Segment table data
Edit Edit in Segment table data
List IFBW ON/OFF IFBW
List Power ON/OFF Power
List Delay ON/OFF Delay
Figure 7-2 Segment Sweep
7.4.3.3. Turning ON/OFF Segments Operating Procedure:

Transcom Vector Network Analyzer――Operating Manual
Transcom Instruments Co., Ltd. Tel: +86-21-64326888 Fax: +86-21-64326777 ‐ 110-
1. Press or Key, Choose to The Segment Working
trace.
2. Press Key.
3. Creating a segment table.
4. Click Sweep Type.
5. Click Segment.

Transcom Vector Network Analyzer――Operating Manual
Transcom Instruments Co., Ltd. Tel: +86-21-64326888 Fax: +86-21-64326777 ‐ 111-
8. System Function
8.1. Print
8.1.1. Print Function Operating Procedure:
1. Press Key.
2. Click Print.
3. As necessary, press Invert Image to toggle between [OFF] for printing in colors
close to the actually displayed screen and [ON] for printing in inverse colors.
4. Click Print, Shown below, Click “OK” begin to print.
8.1.2. Save Image To File Operating Procedure:
1. Press Key.
2. Click Print.
3. As necessary, press Invert Image to toggle between [OFF] for printing in colors
close to the actually displayed screen and [ON] for printing in inverse colors.
4. Click Save Image to File, shown below, enter the file name , and click Open to
save.

Transcom Vector Network Analyzer――Operating Manual
Transcom Instruments Co., Ltd. Tel: +86-21-64326888 Fax: +86-21-64326777 ‐ 112-
Figure 8-1 Save Image to File
8.2. Misc Setup
8.2.1. Ref Source setup Operating Procedure:
1. Press Key.
2. Click Misc Setup.
3. Click Ref Source, Choose Interal or Choose External.
8.2.2. System Correction
The T5230A/T5280A executes Port Characteristics Correction in the data processing
flow shown in Data Processing Flowchart, by using the system calibration data set at
the factory. This system error correction process is not required if the user performs
proper calibration by using the Cal key and the softkeys that subsequently appear,
which automatically turns on error correction.
By turning off system error correction, you can reduce the data processing time

Transcom Vector Network Analyzer――Operating Manual
Transcom Instruments Co., Ltd. Tel: +86-21-64326888 Fax: +86-21-64326777 ‐ 113-
needed during measurement and thus improve measurement throughput.
Operating Procedure:
1. Press .
2. Click Misc Setup.
3. Click System Correction to turn ON/OFF the system correction.
8.2.3. Beeper Setup The T5230A/T5280A has a speaker that sounds a beep tone. The beeper allows you to
make two types of settings.
Type Function
Operation
complete beeper
Sounds a beep tone to inform the user that operations have
completed.
When calibration data measurements are done
When data storage has completed
Warning beeper Sounds a beep tone to prompt the user to use caution.
When an instrument error occurs (An error message
appears at the same time.)
When a limit test fails
(I) Setting the Operation Complete Beeper
Operating Procedure:
1. Press .
2. Click Misc Setup > Beeper > Beep Complete to switch the operation complete
beeper on/off.
3. Clicking Test Beep Complete allows you to hear and check the beep tone of the
operation complete beeper.
(II) Setting the Warning Beeper
Operating Procedure:
1. Press .

Transcom Vector Network Analyzer――Operating Manual
Transcom Instruments Co., Ltd. Tel: +86-21-64326888 Fax: +86-21-64326777 ‐ 114-
2. Click Misc Setup > Beeper > Beep Warning to switch the warning beeper on/off.
3. Clicking Test Beep Warning allows you to hear and check the beep tone of the
warning beeper.
8.2.4. Locking the Front Keys and the Touchscreen You can lock (disable) the front keys and touchscreen. This feature prevents erroneous
operation caused by inadvertently touching any of these devices.
Operating Procedure:
1. Press .
2. Click Misc Setup.
3. Click Keyboard Lock to lock the front keys.
4. Click Touch Screen Lock to lock the touch screen.
5. If both keyboard and touch screen are locked, you should to press to
unlock them.
8.2.5. Setup the color of trace Operating Procedure:
1. Press .
2. Click Misc Setup.
3. Click Color Setup.
4. Click trace to select one.
5. Click Red/Green/Blue to setup the color.
8.2.6. Time Setup Operating Procedure:
1. Press .
2. Click Misc Setup.
3. Click Time Setup to set the time.

Transcom Vector Network Analyzer――Operating Manual
Transcom Instruments Co., Ltd. Tel: +86-21-64326888 Fax: +86-21-64326777 ‐ 115-
4. Click OK to save and exit.
Figure 8-2 Time Setup
8.2.7. Touchscreen Calibration Operating Procedure:
1. Press .
2. Click Misc Setup.
3. Click Touchscreen Cal.
8.3. LAN Setup Operating Procedure:
1. Press .
2. Click Network Setup, the window is shown below.

Transcom Vector Network Analyzer――Operating Manual
Transcom Instruments Co., Ltd. Tel: +86-21-64326888 Fax: +86-21-64326777 ‐ 116-
3. Double click the “Local Area Connection”, the window is shown below.

Transcom Vector Network Analyzer――Operating Manual
Transcom Instruments Co., Ltd. Tel: +86-21-64326888 Fax: +86-21-64326777 ‐ 117-
4. Double click Internet Protocol(TCP/IP), the window is shown below.

Transcom Vector Network Analyzer――Operating Manual
Transcom Instruments Co., Ltd. Tel: +86-21-64326888 Fax: +86-21-64326777 ‐ 118-
5. Edit IP Address、Subnet Mask,then press OK.
8.4. Preset Operating Procedure:
1. Press .
2. Click OK.
8.5. File Manage With thisfunction, you can copy files from the instrument to the U-disk. And you can
copy files from U-disk into the instrument, too.
Operating Procedure:
1. Press .
2. Click File Manage.
3. Insert the U-disk device.

Transcom Vector Network Analyzer――Operating Manual
Transcom Instruments Co., Ltd. Tel: +86-21-64326888 Fax: +86-21-64326777 ‐ 119-
4. Select the files you want to copy.
5. Click the <<< or >>> button.
Figure 8-3 File Manage
8.6. Update the Instrument Software Operating Procedure:
1. Prepare an U-disk device, and make it formatted.
2. Create a folder named TranscomUpdate under the root.
3. Copy the upgrade package to TanscomUpdate.
4. Insert the U-disk to the instrument, then wait for a few minutes until the device is
installed.
5. Press .
6. Click Update, enter the password(The default password is 123456).

Transcom Vector Network Analyzer――Operating Manual
Transcom Instruments Co., Ltd. Tel: +86-21-64326888 Fax: +86-21-64326777 ‐ 120-
7. Waiting for a few minutes until the instrument is showing the work interface.
8.7. About The window shows description of the version of software, and the copyright
information.
Operating Procedure:
1. Press .
2. Click About.
Figure 8-4 About window

Transcom Vector Network Analyzer――Operating Manual
Transcom Instruments Co., Ltd. Tel: +86-21-64326888 Fax: +86-21-64326777 ‐ 121-
9. Troubleshooting
No. Symptom Solution
1
Turning on (|) the
standby switch does
not start up the system.
1. Confirm that the power cable is properly
plugged in.
2. Confirm that the line switch on the rear panel
is turned on.
2 The system starts up,
but cannot see trace. Press , then click Auto Scale.
3
Front panel keyboard,
touch screen and
mouse are inoperable.
Press on the front panel, then try
again.
4 Front panel keyboard
is inoperable.
Click System>Misc Setup>Key Lock on touch
screen, check if the Keyboard Lock is selected.
5 Front panel and
mouseis inoperable.
Press System on the front panel keyboard, then
press Misc Setup>Key Lock. Check if the Touch
Screen Lock is selected.
6
Result of measurement
is with a large error
every time.
1. Check the cable connection.
2. Check the status of Calibration.
3. Check the method of Calibration right or not.
4. Check the system correction ON or OFF.
7 Files cannot be copied
to U-disk.
Make sure the U-disk is normal.
Check the write-protected of U-disk.

Transcom Vector Network Analyzer――Operating Manual
Transcom Instruments Co., Ltd. Tel: +86-21-64326888 Fax: +86-21-64326777 ‐ 122-
10. Default Parameters
No. Parameter Description Default Parameter set object
1 Data Saving Type State and Cal Analyzer
2 Touchstone Data Format Real-Imaginary Analyzer
3 Allocation of Channels Analyzer
4 Active Channel Number 1 Analyzer
5 Marker Value Identification
Capacity (Stimulus) 7 digits Analyzer
6 Marker Value Identification
Capacity (Response) 4 digits Analyzer
7 Marker Table OFF Analyzer
8 Reference Frequency
Source Internal Analyzer
9 Trigger Signal Source Internal Analyzer
10 Reference Channel Error
Correction ON Analyzer
11 System Correction ON Analyzer
12 Allocation of Traces Channel
13 Vertical Divisions 10 Channel
14 Channel Title Bar OFF Channel
15 Channel Title Empty Channel
16 «FAIL» Label Display
(Limit Test) OFF Channel
17 Traces per Channel 1 Channel
18 Active Trace Number 1 Channel
19 Marker Coupling ON Channel
20 Sweep Type Linear Frequency Channel

Transcom Vector Network Analyzer――Operating Manual
Transcom Instruments Co., Ltd. Tel: +86-21-64326888 Fax: +86-21-64326777 ‐ 123-
No. Parameter Description Default Parameter set object
21 Number of Sweep Points 201 Channel
22 Stimulus Start Frequency 300 kHz Channel
23 Stimulus Stop Frequency
3.0GHz/8.0 GHz
(T5230A/
T5280A)
Channel
24 Stimulus CW Frequency 300 kHz Channel
25 Stimulus Start Power Level
–55 dBm /–60 dBm
(T5230A/
T5280A)
Channel
26 Stimulus Stop Power Level 10dBm Channel
27 Stimulus Power Level 0dBm Channel
28 Stimulus Power Slope 0dBm Channel
29 Stimulus IF Bandwidth 10 kHz Channel
30 Sweep Measurement Delay 0sec Channel
31 Sweep Range Setting Start / Stop Channel
32 Number of Segments 1 Channel
33 Points per Segment 2 Channel
34 Segment Start Frequency 300 kHz Channel
35 Segment Stop Frequency 300 kHz Channel
36 Segment Sweep Power
Level 0 dBm Channel
37 Segment Sweep IF
Bandwidth 10 kHz Channel
38 Segment Sweep
Measurement Delay 0 sec. Channel
39 Segment Sweep Power
Level (Table Display) OFF Channel
40 Segment Sweep IF OFF Channel

Transcom Vector Network Analyzer――Operating Manual
Transcom Instruments Co., Ltd. Tel: +86-21-64326888 Fax: +86-21-64326777 ‐ 124-
No. Parameter Description Default Parameter set object
Bandwidth (Table Display)
41
Segment Sweep
Measurement Delay
(TableDisplay)
OFF Channel
42 Segment Sweep Range
Setting Start / Stop Channel
43 Averaging OFF Channel
44 Averaging Factor 10 Channel
45 Trigger Mode Continuous Channel
46 Table of Calibration
Coefficients Empty Channel
47 Error Correction OFF Channel
48 Port Z Conversion OFF Channel
49 Port 1 Simulated Impedance 50 Ω Channel
50 Port 2 Simulated Impedance 50 Ω Channel
51 Port 1 De-embedding OFF Channel
52 Port 2 De-embedding OFF Channel
53 Port 1 De-embedding
S-parameter File Empty Channel
54 Port 2 De-embedding
S-parameter File Empty Channel
55 Port 1 Embedding OFF Channel
56 Port 2 Embedding OFF Channel
57 Port 1 Embedding User File Empty Channel
58 Port 2 Embedding User File Empty Channel
59 Measurement Parameter S11 Trace
60 Trace Scale 10 dB / Div. Trace
61 Reference Level Value 0 dB Trace

Transcom Vector Network Analyzer――Operating Manual
Transcom Instruments Co., Ltd. Tel: +86-21-64326888 Fax: +86-21-64326777 ‐ 125-
No. Parameter Description Default Parameter set object
62 Reference Level Position 5 Div. Trace
63 Data Math OFF Trace
64 Phase Offset 0° Trace
65 Electrical Delay 0 sec. Trace
66 S-parameter Conversion OFF Trace
67 S-parameter Conversion
Function Z: Reflection Trace
68 Trace Display Format Logarithmic
Magnitude (dB) Trace
69 Time Domain
Transformation OFF Trace
70 Time Domain
Transformation Start –10 nsec. Trace
71 Time Domain
Transformation Stop 10 nsec. Trace
72 Time Domain Kaiser-Beta 6 Trace
73 Time Domain
Transformation Type Bandpass Trace
74 Time Domain Gate ON Trace
75 Time Domain Gate Start –10 ns Trace
76 Time Domain Gate Stop 10 ns Trace
77 Time Domain Gate Type Bandpass Trace
78 Time Domain Gate Shape Normal Trace
79 Smoothing OFF Trace
80 Smoothing Aperture 1% Trace
81 Trace Display Mode Data Trace
82 Limit Test OFF Trace
83 Limit Line Display OFF Trace

Transcom Vector Network Analyzer――Operating Manual
Transcom Instruments Co., Ltd. Tel: +86-21-64326888 Fax: +86-21-64326777 ‐ 126-
No. Parameter Description Default Parameter set object
84 Defined Limit Lines Empty Trace
85 Number of Markers 0 Trace
86 Marker Position 300 kHz Trace
87 Marker Search Maximum Trace
88 Marker Tracking OFF Trace
89 Marker Search Target 0 dB Trace
90 Marker Search Target
Transition Both Trace
91 Marker Search Peak
Polarity Positive Trace
92 Marker Search Peak
Excursion 3 dB Trace
93 Bandwidth Parameter
Search OFF Trace
94 Marker Search Bandwidth
Value –3 dB Trace
95 Marker Search Range OFF Trace
96 Marker Search Start 0 Trace
97 Marker Search Stop 0 Trace

Transcom Vector Network Analyzer――Operating Manual
Transcom Instruments Co., Ltd. Tel: +86-21-64326888 Fax: +86-21-64326777 ‐ 127-
11. Scope of Parameter Settings
No. ParameterScope
Softkeys Instrument Channel Trace
Stimulus
1 Scan Range √ Start, Stop, Center, Span
2 Power, CW
Frequency √ Sweep Setup>Power
3 Sweep Time/
Sweep Delay √
Sweep Setup>Sweep
Time/Sweep Delay
4 Points √ Sweep Setup>Points
5
Segment √
Sweep Setup>Sweep Type,
Edit Segment Table/Segment
Display
6 Sweep Type √ Sweep Setup>Sweep Mode
Trigger
7 Trigger
Source √
Trigger>Trigger
Source/Restart/Trigger
8
Trigger Type √
Trigger>Hold/Hold All
Channels/Single/Continuous/C
ontinuous Disp Channels
Response
9 Measurement √ Meas
10 Format √ Format
11 Scale/Electric
Delay/Phase
Offset
√ Scale
12 Data √ Display>Display/Data ->

Transcom Vector Network Analyzer――Operating Manual
Transcom Instruments Co., Ltd. Tel: +86-21-64326888 Fax: +86-21-64326777 ‐ 128-
No. ParameterScope
Softkeys Instrument Channel Trace
Memory/Data
Math
Mem/Data Math
13 Title Label √
Display>Edit Title Labe/Title
Label(ON/OFF)
14 Update(ON/O
FF) √ Display>Update (ON/OFF)
15 Average √
Avg>Averaging Restart/Avg
Factor/Averaging (ON/OFF)
16 Smoothing √
Avg>Smo
Aperture/Smoothing(ON/OFF)
17 IF Bandwidth √ Avg>IF Bandwidth
18 Calibration √ Cal
19 Marker √
Marker/Marker Search/Maker
Fctn
Analysis
20 Fixture
Simulator √ Analysis>Fixture Simulator
21 Time Domain √ Analysis>Gating/Transform
22 Conversion √ Analysis>Conversion
23 Limit Test √ Analysis>Limit Test
24 Save/Recall √ Save/Recall
System
25 Print/Print
Screen/Beepe
r/GRIB
Setup/LAN
Setup/Time/K
√ System

Transcom Vector Network Analyzer――Operating Manual
Transcom Instruments Co., Ltd. Tel: +86-21-64326888 Fax: +86-21-64326777 ‐ 129-
No. ParameterScope
Softkeys Instrument Channel Trace
ey Lock/
26 Preset √ Preset
Recommended