1
DIFFERENTIATION OF CARBOHYDRATE ISOMERS BY TUNABLE INFRARED MULTIPLE PHOTON DISSOCIATION AND FOURIER TRANSFORM ION CYCLOTRON
RESONANCE MASS SPECTROMETRY
By
SARAH ELIZABETH STEFAN
A DISSERTATION PRESENTED TO THE GRADUATE SCHOOL OF THE UNIVERSITY OF FLORIDA IN PARTIAL FULFILLMENT
OF THE REQUIREMENTS FOR THE DEGREE OF DOCTOR OF PHILOSOPHY
UNIVERSITY OF FLORIDA
2009

2
© 2009 Sarah Elizabeth Stefan

3
To my Mom and Dad

4
ACKNOWLEDGMENTS
Many people have supported and helped me throughout my graduate career. First, I would
like to thank my parents. Their support and unconditional love have made my studies possible. I
want to thank them for their understanding and encouragement when tough times occurred; I
appreciate all their help and love more than they will ever know. I also thank my family for their
support and for always making life interesting.
I am grateful for my friends, old and new, who gave a helping hand and an ear for listening
when I needed them. All the laughs and conversations over these past four years have lifted my
spirits and helped me to keep going. I want to acknowledge my lab mates, past and present, for
their help, knowledge and conversations have been instrumental in my work.
I would also like to thank all my professors at Wheaton College, specifically Drs. Elita
Pastra-Landis and Laura Muller, whose support and investment in me opened my eyes and mind
to the potential of graduate school. Their enthusiasm and support have made all the difference.
I have the deepest gratitude to all the people with whom I collaborated; they have made my
project possible. First, I wish to thank my advisor, Dr. John Eyler, for his guidance, patience and
support during my graduate career. I want to thank Dr. Brad Bendiak for all the samples, advice
and support that he has provided throughout this project. His guidance and suggestions were
well needed and helped tremendously. I would also like to thank Dr. David Powell for use of his
instrument for the negative disaccharide work. Next, I want to thank my other committee
members, Drs. Nicolo Omenetto, Nicolas Polfer and Carrie Haskell-Luevano, whose questions
and conversations have helped me along the way. Finally, I would like to thank Drs. Jos
Oomens and Jeffrey Steill for their help and effort with the work performed at the Free Electron
Laser for Infrared eXperiments (FELIX) facility. Without all of these people, this dissertation
would not be possible.

5
Finally I need to thank the one person who has had to listen to me late at night and early in
the morning, whose patience and loving shoulder made it easier to continue when I wanted to
give up, Mr. Brad House. His immense computer knowledge and lack of chemistry knowledge
helped me survive the past four years.

6
TABLE OF CONTENTS page
ACKNOWLEDGMENTS ...............................................................................................................4
LIST OF TABLES...........................................................................................................................9
LIST OF FIGURES .......................................................................................................................10
ABSTRACT...................................................................................................................................13
CHAPTER
1 INTRODUCTION ..................................................................................................................15
Carbohydrates .........................................................................................................................15 Monosaccharides .............................................................................................................15 Disaccharides...................................................................................................................18 Oligo- and Polysaccharides .............................................................................................19
Differentiation of Mono- and Disaccharides ..........................................................................21 Separation of Oligosaccharides .......................................................................................22 Analysis Methods ............................................................................................................24 Mass Spectrometry: Ionization Techniques ....................................................................26 Fragmentation Methods...................................................................................................27 Charged Ions....................................................................................................................29
Objective of This Research.....................................................................................................31 Overview.................................................................................................................................32
2 FOURIER TRANSFORM ION CYCLOTRON RESONANCE MASS SPECTROMETRY.................................................................................................................39
History ....................................................................................................................................39 Apparatus................................................................................................................................40
Magnet.............................................................................................................................40 Vacuum System...............................................................................................................40 Analyzer Cell...................................................................................................................41 Data System.....................................................................................................................41
Theory.....................................................................................................................................42 Cyclotron Motion ............................................................................................................42 Trapping Motion..............................................................................................................43 Magnetron Motion...........................................................................................................44
Basic FTICR-MS Operation and Data Acquisition ................................................................46 Mass Resolution......................................................................................................................49 Tandem Mass Spectrometry ...................................................................................................51 Dissociation Techniques.........................................................................................................51 Conclusions.............................................................................................................................53

7
3 INFRARED MULTIPLE PHOTON DISSOCIATION .........................................................58
Introduction.............................................................................................................................58 Mechanism of Infrared Multiple Photon Dissociation ...........................................................59 Lasers Used for IRMPD .........................................................................................................60
4 DIFFERENTIATION OF MONOSACCHARIDES IN THE POSITIVE ION MODE BY IRMPD WITH A TUNABLE CO2 LASER.....................................................................66
Introduction.............................................................................................................................66 Procedure ................................................................................................................................67 Reproducibility .......................................................................................................................68 Results and Discussion ...........................................................................................................69
Methyl-glucopyranosides ................................................................................................69 Unknown Study of Methyl-glucopyranosides.................................................................71 Methyl-galactopyranosides..............................................................................................71 Unknown Study of both Methyl-gluco- and galactopyranosides ....................................72
Conclusions.............................................................................................................................73
5 DIFFERENTIATION OF DISACCHARIDES IN THE POSITIVE ION MODE WITH A TUNABLE CO2 LASER ....................................................................................................83
Introduction.............................................................................................................................83 Procedure ................................................................................................................................84
Fragmentation Study .......................................................................................................84 Anomeric Configuration Study .......................................................................................85
Results and Discussion ...........................................................................................................85 Differentiation of Disaccharides......................................................................................85 Determination of the Anomeric Configurations..............................................................86 Differentiation of Unknowns...........................................................................................87
Conclusions.............................................................................................................................88
6 IRMPD STUDIES OF NEGATIVELY CHARGED DISACCHARIDES WITH A TUNABLE CO2 LASER ........................................................................................................93
Introduction.............................................................................................................................93 Procedure ................................................................................................................................94
Deprotonated Disaccharides ............................................................................................94 Chlorinated Disaccharides...............................................................................................95 Reproducibility: Deprotonated Disaccharides.................................................................96 Reproducibility: Chlorinated Disaccharides....................................................................96
Results and Discussion ...........................................................................................................97 Deprotonated Disaccharides ............................................................................................97 Chlorinated Disaccharides...............................................................................................98 Identification of Fragment Ions .....................................................................................102
Conclusions...........................................................................................................................102

8
7 DIFFERENTIATION OF DISACCHARIDES IN THE NEGATIVE ION MODE WITH FREE ELECTRON LASER INFRARED MULTIPLE PHOTON DISSOCIATION ..................................................................................................................115
Introduction...........................................................................................................................115 Procedure ..............................................................................................................................115 Results and Discussion .........................................................................................................116
Disaccharides.................................................................................................................116 Monosaccharide Anion Produced from Disaccharides .................................................118
Conclusions...........................................................................................................................119
8 CONCLUSIONS AND FUTURE WORK...........................................................................127
LIST OF REFERENCES.............................................................................................................131
BIOGRAPHICAL SKETCH .......................................................................................................139

9
LIST OF TABLES
Table page 5-1 Table of ratios used to determine the laser power used for fragmentation........................91
6-1 Major fragment ions observed for the chlorinated disaccharides when the precursor ion (m/z 377) was almost depleted by infrared mulitple photon dissociation (IRMPD) at 9.588 μm ......................................................................................................................108
6-2 Comparison of the fragments produced by collision induced dissociation (CID) and IRMPD for the chlorinated disaccharides........................................................................108

10
LIST OF FIGURES
Figure page 1-1 Fischer projection for D- and L-glucose. ...........................................................................34
1-2 Example of the numbering system for the carbons of monosaccharides...........................34
1-3 Fischer projections for the D-hexoses of the aldose family...............................................34
1-4 Anomers of D-glucose. ......................................................................................................35
1-5 Inter-conversion of the ring structures for the 6-membered ring, pyranose, and the 5-membered ring, furanose, of D-glucose .........................................................................35
1-6 Examples of disaccharides composed of two glucose (Glc) monosaccharides. ................36
1-7 Structures of two common oligosaccharide derivatives. ...................................................36
1-8 Typical steps for analysis of glycans. ................................................................................37
1-9 Fragmentation nomenclature for oligosaccharides. ...........................................................38
1-10 Possible fragmentation pathways for fragmentation by infrared multiple photon dissociation (IRMPD). .......................................................................................................38
2-1 Ion cyclotron motion..........................................................................................................54
2-2 Schematic diagram of the components of a Bruker 4.7 T FTICR (Fourier transform ion cyclotron) mass spectrometer. .....................................................................................54
2-3 Figures of merit for FTICR-MS as a function of magnetic field strength .........................55
2-4 Two of the typical analyzer cells used for in FTICR mass spectrometers.........................55
2-5 General schematic of a typical experimental sequence. ....................................................56
2-6 Various domains and spectra obtained from an FTICR-MS experiment. .........................56
2-7 Effect of number of data points acquired and Fourier transform on mass resolution........57
3-1 Energy potential well. ........................................................................................................64
3-2 Depiction of the IRMPD mechanism in polyatomic molecules. .......................................64
3-3 Schematic of an undulator used for free elctrom lasers (FELs).........................................65
3-4 Layout schematic of Free Electrom Laser for Infrared eXperiments (FELIX) .................65

11
4-1 Structures of the O-methylated monosaccharides discussed in this chapter......................74
4-2 Experimental set up of the 4.7 T FTICR mass spectrometer.............................................74
4-3 Wavelength-dependent fragmentation patterns for the lithiated O-methyl-glucopyranosides for wavelength from 9.2 to 10.8 μm.....................................75
4-4 Infrared mulitple photon dissociation depletion spectra of the precursor ions (m/z 201) for both α- and β-O-methyl-glucopyranoside – lithium cation complexes. ......76
4-5 Comparison of the fragmentation of β-methyl-glucopyranoside at wavelengths 9.588 and 10.611 μm. ..................................................................................................................77
4-6 Relative percent abundance of fragment ions for both lithiated α- and β-O-methyl-glucopyranosides over the wavelength range from 9.201 to 9.675 μm. ........78
4-7 Spectra of unknowns in single blind study of methyl-glucopyranosides at wavelength 9.588 μm. ...........................................................................................................................79
4-8 Fragmentation patterns over the wavelengths from 9.2 to 10.6 μm. .................................80
4-9 Ratio of m/z 169 to m/z 151 for α- and β-O-methyl-galactopyranoside. ...........................81
4-10 Decision flowchart used to identify the different monosaccharide anomers. ....................81
4-11 Spectra of unknowns identified as galactopyranosides in single blind study obtained at wavelength 9.588 μm.. ...................................................................................................82
5-1 Wavelength-dependent fragmentation for the various linked lithiated disaccharides .......89
5-2 Flow-chart depicting how linkage of the disaccharides was determined. .........................90
5-3 Flow-chart showing ratios of peak heights and values used to determine anomeric configurations. ...................................................................................................................91
5-4 Bar graphs comparing ratios from knowns and unknown lithiated glucose-containing disaccharides at the wavelengths 9.342, 9.472 and 9.588 μm. ..........................................92
6-1 Schematic drawing of the laser/mass spectrometer set-up used for the analysis of deprotonated disaccharides. .............................................................................................104
6-2 Relative percent abundance of the precursor ion (m/z 341) of isomaltose at selected wavelengths......................................................................................................................104
6-3 Wavelength-dependent fragmentation patterns for the various deprotonated disaccharides. ...................................................................................................................105
6-4 Ratio of m/z 161/179 for 1-3 and 1-6 linked disaccharides, showing that this ratio is not optimal for distinguishing the different anomers.......................................................106

12
6-5 Comparison of the fragmentation patterns of deprotonated isomaltose on two separate days. ...................................................................................................................107
6-6 Fragmentation spectra for the nearly depleted precursor ion (m/z 377) for the chlorinated disaccharides at 9.588 μm.............................................................................109
6-7 Infrared multiple photon dissociation spectra for chlorinated isomaltose obtained at three wavelengths on two different days.. .......................................................................110
6-8 Average fragmentation spectra for the disaccharides at 9.342, 9.473 and 9.588 μm. .....111
6-9 Decision flow chart used to identify disaccharide samples with unknown identities in a single-blind study. .........................................................................................................112
6-10 Comparison of various ratios used to determine the anomeric configurations of the chlorinated disaccharides. ................................................................................................113
6-11 Identification of some of the fragment ions for the various linked disaccharides. ..........114
7-1 Schematic of the FTICR set-up at FELIX. ......................................................................121
7-2 Infrared multiple photon dissociation fragmentation patterns over the wavelength range of 5.5 to 11 μm for the deprotonated 18O-labeled disaccharides. ..........................122
7-3 Fragmentation pattern of chlorinated unlabeled sophorose. ............................................123
7-4 Comparison of the IRMPD spectra for O18-labeled sophorose and O16-chlorinated sophorose. ........................................................................................................................123
7-5 Comparison of the IRMPD spectra of the monosaccharide anions (m/z 179) produced by deprotonation of glucose and by fragmentation of a disaccharide by sustained off-resonance irradiation collision-induced dissociation (SORI-CID) and CO2 laser irradiation. .......................................................................................................124
7-6 Schematic of the possible mechanism leading to the opening of the monosaccharide anion ring. ........................................................................................................................124
7-7 Infrared multiple photon dissociation spectra of various deprotonated monosaccharides. .............................................................................................................125
7-8 Comparison of the IRMPD spectra for anomers of O-methyl-glucopyranoside to the spectrum of deprotonated glucose. ..................................................................................125
7-9 Comparison of the fragmentation patterns of the deprotonated monosaccharides over the wavelength range of 5.5 to 11 μm..............................................................................126

13
Abstract of Dissertation Presented to the Graduate School of the University of Florida in Partial Fulfillment of the Requirements for the Degree of Doctor of Philosophy
DIFFERENTIATION OF CARBOHYDRATE ISOMERS BY TUNABLE INFRARED
MULTIPLE PHOTON DISSOCIATION AND FOURIER TRANSFORM ION CYCLOTRON RESONANCE MASS SPECTROMETRY
By
Sarah Elizabeth Stefan
May 2009 Chair: John R. Eyler Major: Chemistry
Carbohydrates and their derivatives play a crucial role in many biological processes
including fertilization, cell growth, inflammation and post-translational protein modification.
The function of carbohydrates in these systems is closely related to their structure, including
monosaccharide sequence, glycosidic linkage and stereochemistry. Unfortunately, the number of
anomeric configurations and possible linkages between monosaccharide units makes analysis of
carbohydrate structures complex. In order to shed light on these larger oligosaccharides, the
fragmentation patterns and infrared multiple photon dissociation (IRMPD) spectra of various
mono- and disaccharides were obtained and compared. For this work, various tunable infrared
sources including a line-tunable continuous-wave carbon dioxide laser and a free electron laser
(FEL) were used in conjunction with Fourier transform ion cyclotron resonance mass
spectrometry (FTICR-MS).
The first three projects used a line-tunable carbon dioxide laser to fragment various mono-
and disaccharides in both the positive and negative ion modes. In the first project, anomers of
lithium-cation attached O-methyl-gluco- and galactopyranosides were fragmented. The identity
and anomeric configuration of each monosaccharide was accurately determined by comparing

14
fragmentation patterns and ratios of certain fragments. A second project explored the
fragmentation pattern of lithiated glucose-containing disaccharides having various linkages (1-2,
1-3, 1-4 and 1-6) and anomeric configurations (alpha and beta). Both the linkage and anomeric
configuration of the various disaccharides were successfully identified based on their
fragmentation patterns at several wavelengths. Next, irradiation of deprotonated and chlorinated
glucose-containing disaccharides produced fragmentation patterns in which cleavage of the
glycosidic bond resulted in major abundances of m/z 161 and 179 fragment ions. Along with
differentiating the anomeric configuration for the chlorinated disaccharides, comparison of the
abundances for major fragment ions also resulted in the positive identification of the linkages for
both sets of disaccharides.
Lastly, several deprotonated (negatively charged) mono- and disaccharides were
fragmented with a FEL. The IRMPD spectra of the monosaccharide anions (m/z 179) from both
the deprotonated monosaccharides and those isolated by fragmentation of various disaccharides
were taken. A C-O stretching band characteristic of aldehydes was present in all spectra at
~1720 wavenumbers and gave spectroscopic evidence of the monosaccharide ring opening and
therefore loss of anomericity.

15
CHAPTER 1 INTRODUCTION
Carbohydrates and their derivatives are biologically important. They participate in cell-
cell interactions and also act as target structures for microorganisms, toxins and antibodies. 1-3
Carbohydrates also interact with proteins and play a critical role in fertilization, cell growth,
inflammation and post-translational protein modifications.1,3-5 The simplest unit within these
larger carbohydrates is that of the monosaccharide. When two monosaccharides are joined
together, the result is a disaccharide. The disaccharide is the smallest saccharide unit which
contains the glycosidic bond. Depending on the anomeric configurations of the monosaccharides
that react, a disaccharide can either be α- or β-linked. The role of carbohydrates depends not
only on the subunits of sugars which compose them, but also how these units are linked
together.6 Therefore, characterization of the both the anomeric configuration and the linkage of
the different types of mono- and disaccharides is important.
Carbohydrates
Carbohydrates can be categorized based on their degree of polymerization. The smallest
group is that of monosaccharides and their derivatives, all of which are not polymerized. The
next category includes oligosaccharides, that have 2 to 10 degrees of polymerization. The last
category is that of polysaccharides, that have greater than 10 degrees of polymerization. This
chapter will discuss all the possible types of carbohydrates as well as give an overview of the
methods used for carbohydrate analysis.
Monosaccharides
Monosaccharides are the smallest units that compose larger oligosaccharides. There are
several types of monosaccharides and they all have the general formula of (CH2O)n. Typically
the more biologically common isomer of monosaccharides in nature is the D-isomer, but

16
L-isomers are also found. The monosaccharide isomer can be determined by drawing the
Fischer projection. In the Fischer projection when the hydroxyl group on the highest numbered
stereocenter is on the right, it is the D-isomer and when the hydroxyl group is on the left it is the
L-isomer, Figure 1-1.7 Since D-isomers of sugars are found much more frequently in nature, this
dissertation will deal only with D-isomers.
The carbons in monosaccharides are numbered sequentially starting with the end of the
chain nearest to the carbonyl group, as seen in Figure 1-2. Carbon number 1, also known as the
anomeric carbon, is where two monosaccharides can be joined together, through a glycosidic
linkage or bond, to form larger oligosaccharides.
The smallest possible monosaccharide has a backbone composed of only 3 carbon atoms,
but 4, 5 and 6 carbons are other possible backbones. The names of these monosaccharides are
trioses, tetroses, pentoses, hexoses, and heptoses, respectively. Monosaccharides that contain a
keto group are called ketose whereas monosaccharides containing an aldehyde are called aldoses.
Typically the names of the family and number of carbons are combined into one systematic
name. For example, a monosaccharide containing both a 4 carbon backbone and an aldehyde
group would be named an aldotetrose (aldo for the aldehyde group and tetrose for the 4 carbon
backbone). For the aldose family, each of the eight D-aldohexoses differs in stereochemistry at
carbon 2, 3 or 4 and has its own unique, common name, such as D-glucose, D-galactose, etc., as
shown in Figure 1-3. When two monosaccharides only differ at one carbon position, they are
epimers. Since they only differ in the position of the hydroxyl group on carbon number 4,
D-glucose and D-galactose are an example of epimers from the aldose family.
Monosaccharides can be found in either the open chain or ring form, but typically the ring
form is more common. In solution, monosaccharides with a 5 or 6 carbon backbone can undergo

17
nucleophilic attack of the carbonyl carbon by one of the hydroxyl groups along the chain,
resulting in a ring. Six-membered rings are called pyranoses and 5-membered rings are called
furanoses.8,9 At least four carbons and one oxygen are needed to form a furanose. Therefore,
aldotetroses and higher aldoses and 2-pentuloses and higher ketoses can be found in the furanose
ring. While monosaccharide rings can be either 5- or 6-membered, pyranosides are the most
common form.
When cyclic monosaccharides only differ by the position of the hydroxyl group on the
anomeric carbon, they are anomers. If the hydroxyl group is axial relative to the plane of the
ring then it is said to be in the α-position and if it is equatorial then it is in the β-position,
Figure 1-4. The cyclic monosaccharides can interconvert between α- and β-anomers through a
process known as mutarotation, Figure 1-5. During mutarotation, the ring opens into the chain
form. Once in the chain form, a nucleophilic attack results in the formation of the β-anomer.
Therefore, in solution there is an equilibrium mixture of all possible isomers including the
furanose, pyranose, α-, β- and open chain forms of the monosaccharides. This equilibrium
mixture is different for each monosaccharide, but for D-glucose it is approximately one-third
α-anomer, two-thirds β-anomer and less than 1% of both the open and five-membered ring
forms.7 On the other hand, D-mannose has approximately 69% α-anomer and 31% β-anomer in
solution, thus showing that the equilibrium doesn’t always contain more of the β-anomer than the
α-anomer.
The two cyclic forms of D-glucose are known as hemi-acetals, which are formed by the
reaction of the hydroxyl group on carbon number 5 and the aldehyde group. Typically any
monosaccharide that contains a hemiacetal group is a reducing sugar and can react further. A
reducing sugar is one that reacts with Tollens’ (Ag(NH3)2OH) or Benedict’s reagents (solution of

18
copper (II) sulfate, sodium carbonate, sodium citrate dihydrate and 2,5-difluorotoluene) to reduce
either Ag+2 or Cu+2. If a sugar contains an acetal group then it cannot react with the Tollens’ or
Benedict’s reagents and it is called a non-reducing sugar.
While hexoses are the most abundant sugars, there are a number of monosaccharide sugar
derivatives that are naturally abundant and important. Some of these derivatives are
N-acetylneuraminic acid (sialic acid), α-D-acetylgalactosamine and α-D-acetylglucosamine.
These derivatives are found primarily in animals as the major components of glycoproteins and
glycolipids.
Disaccharides
Disaccharides, the next largest saccharide are formed when a hydroxyl group of one
monosaccharide reacts with the anomeric carbon of the other, Figure 1-6. The resulting bond is
known as an O-glycosidic linkage. When two cyclic hexoses come together, a glycosidic linkage
can occur at one of the five hydroxyl positions. This leads to numerous possible isomers with
various linkages. Disaccharides are composed of a non-reducing monosaccharide that is fixed in
the ring conformation and a reducing-monosaccharide that can interconvert between the α- and
the β-configuration. Therefore, in solution, there will be a mixture of the α- and β-configurations
of the reducing sugar of the disaccharide.
While most sugars have a common, non-systematic name, there is a systematic
nomenclature scheme for disaccharides. In it, the name of the first monosaccharide unit, its
anomeric configuration and then the linkage followed by the second monosaccharide unit is
given. For example, two glucose (Glc) units that are α- connected at the 1 and 6 carbon will be
named glucose α1-6 glucose (Glcα1-6Glc), for which the common name is isomaltose. For
larger oligosaccharides the nomenclature process is the same, but for each monosaccharide
attachment the linkage and anomeric configuration followed by the monosaccharide is given.

19
For example a trisaccharide that has a glucose β-linked to carbon number 2 of a mannose (Man)
monosaccharide which is α-linked to carbon number 4 of another glucose unit would be named
Glcβ1-2Manα1-4Glc. When the anomeric carbons of both monosaccharide units are linked, the
anomeric configuration of each saccharide is given. For example, sucrose is a disaccharide when
the anomeric carbon of both the glucose and fructose (Fru) monosaccharide units are linked. For
this, the systematic name would be Glcα1-2βFru. Since both anomeric carbons are linked in
sucrose, it is a non-reducing sugar, unlike kojibiose (Glcα1-2Glc) and sophorose (Glcβ1-2Glc)
that are examples of reducing sugars.
Oligo- and Polysaccharides
Oligosaccharides are the next largest saccharide chains that consist of 3 to 10
monosaccharide units linked together. Sugars that contain more than ten monosaccharide units
are called polysaccharides. Oligo- and polysaccharides can be either homo- or
heter-oligosaccharides. Homo-oligosaccharides contain the same monosaccharide unit that
repeats, whereas heter-oligosaccharides contain different monosaccharide units linked together.
One homo-polysaccharide is starch, which can be found in foods such as potatoes. Starches
characteristically have α1-4 linkage between two glucose units.10 Other polysaccharides that do
not have this linkage, also known as non-starch polysaccharides, can be found in foods such as
bran, bananas and hazelnuts. Other common polysaccharides are cellulose and glycogen.
Cellulose is a polysaccharide that contains several hundreds to thousands of β1-4 linked glucose
units. It is the main component of the primary cell walls of plants and can be found in some
algae. Glycogen is a glucose-polysaccharide that has a lot of branching and most commonly
functions as short-term energy storage in animals.
Common oligosaccharide derivatives are those of N-acetyl hexosamines, primarily
N-acetylglucosamine (GlcNAc) and N-acetylgalactosamine (GalNAc), Figure 1-7.11 The

20
GlcNAc reducing end is linked to serine or threonine residues whereas the GalNAc reducing end
is linked to asparagines. N-acetylglucosamine is a component of chitin and GalNAc is the
terminal carbohydrate that forms the antigen of blood group A. N-acetylgalactosamine is also
the first monosaccharide unit that connects to serine and threonine in glycosylation and is
necessary for intercellular communication.
Polysaccharides and oligosaccharides are also known as glycans. Glycosylation is a
post-translational modification where oligo- and polysaccharides are linked to proteins and
lipids, forming glycoconjugates. Glycosylation is one of the most common post-translational
modifications for proteins and it is approximated that more than 50% of all proteins are
glycosylated.12 Linkages between a glycan and a protein form glycoproteins and those with
lipids form glycolipids.
The type of glycoprotein is determined by the linkage between the carbohydrates and the
protein. Glycoproteins can be O- or N-linked. While N-linked are linked by a chitobiose (dimer
of β1-4-linked glucosamine units) unit to an amide nitrogen of an asparagine residue, O-linked
are linked to the oxygen of a side chain of an amino acid.13,14 Typically the linkage is through a
serine or threonine residue. N-glycosidic bonds are found in all nucleotides (the resulting sugar
and nucleotide structures are called nucleosides, such as ribonucleic acid (RNA) and
deoxyribonucleic acid (DNA)). Unlike other oligosaccharides that are linked by oxygen bridges,
RNA and DNA are polyesters that are linked by phosphate bridges. DNA is the largest known
polymer with more than 1012 units found in human genes and the number of units found
decreases as one goes down the evolutionary chain.8 Another example of a polysaccharide with
N-linkages is chitin. Chitin is a naturally occurring polysaccharide, composed of β1-4-linked
N-acetyl-D-glucosamines, which is found in places like fungi and exoskeletons of arthropods

21
such as crustaceans. The three classes of glycoproteins are: N-glycosyl protein, O-glycosyl
protein and N,O-glycosyl protein. Since multiple types of linkages (O- or N-linked) and
anomeric configurations are possible, it is no surprise that many different isomers are possible.
When attached to proteins (glycoproteins), oligosaccharides have been found to aid in a
plethora of functions in the human body including cellular recognition, signaling, receptor
binding and immune responses.15-17 They also serve to influence folding, biological lifetime and
recognition of binding partners for proteins.17 Carbohydrates are also involved in the glycosyl
phosphatidyl-inositol (GPI) anchor, by which proteins are attached to the plasma membrane and
the oligosaccharides are linked to lipids which are attached to cell membranes.18 In this process,
a glycolipid can be connected to the C-terminus of a protein during post-translation modification.
Since the biological role of oligosaccharides depends on the linkage, branching,
configuration and saccharide units, being able to distinguish and differentiate the smaller
mono- and disaccharides that compose larger oligosaccharides is very important. Due to the
various linkages (carbons 1-6 of each monosaccharide unit), anomeric configurations (α- or β-)
and monosaccharide units (any of the eight D-hexoses) there is a plethora of possible isomers,
which makes analysis of carbohydrates a very difficult task.
Differentiation of Mono- and Disaccharides
Glycans must be isolated and prepared for analysis. The preparation method can include
releasing the glycans, separating them and then finally analyzing them. Once separated common
methods for analysis have included nuclear magnetic resonance (NMR) and/or mass
spectrometry (MS). Figure 1-8 shows a schematic of the different methods used for separating
and analyzing saccharides.

22
Separation of Oligosaccharides
Typically oligosaccharides can be released by several methods, either chemical or
enzymatic. Enzymatic methods use a specific enzyme to pick out a particular substrate from
mixtures.14 Enzymes, for example glycosidase and galactosidase, are used to remove specific
sugar residues sequentially from the non-reducing end. A chemical method for releasing glycans
is an alkali-borohydride treatment which then can be followed by hydrolysis, with the resulting
species then separated by high performance liquid chromatography (HPLC) and/or
gas chromatography (GC).19,20
Once released, the oligosaccharides can then be separated. Methods for determining and
separating mixtures of carbohydrates include thin layer chromatography (TLC), column
chromatography methods (including gas chromatography, liquid chromatography, gas-liquid
chromatography and high performance liquid chromatography) and capillary
electrophoresis (CE).13,14,21
Thin layer chromatography is a relatively cheap and inexpensive method for separating
analytes. Microcrystalline cellulose and silica gel are two typical solid supports. Cellulose
separation occurs by a liquid-liquid partition where the sugar of interest is distributed between
the mobile phase and the cellulose-bound complex in water. The separation occurs based on the
solubility of sugar in the eluent and how easily it can enter the solid support. Cellulose TLC has
the same chromatographic characteristics as paper TLC, but allows for shorter elution time and
increased sensitivity. Silica gel separation is similar to cellulose, but requires an additional
adsorption component, typically an inorganic salt (phosphate, bisulfate). Numerous solvents are
used to separate the various monosaccharides.
High performance liquid chromatography, gas-chromatography (GC) and
gas-liquid chromatography (GLC) can also be used to separate components of mixtures. All of
23
these methods require somewhat expensive equipment. High performance liquid
chromatography is typically preferred for monosaccharide mixtures, oligosaccharide analysis and
purification. Whereas GLC is limited to monosaccharide mixtures only, HPLC requires different
columns and various solvents are used to elute the mixture through the column. Typical columns
include sulfonated polymeric or amino-bonded silica columns. Typical solvents include
acetonitrile/water mobile phase. Gas liquid chromatography is a sensitive technique and allows
the analysis of sub-nanomolar amounts of carbohydrates.14
Capillary electrophoresis is a newer technique that yields results in relatively short times
and with high efficiency. To achieve electrophoretic separation, the two ends of the capillary are
submerged into two separate electrolyte reservoirs that contain a high voltage electrode. The
separation is due to the variation of molecular size and electric charge ratios of the sugars within
the mixture. This method does not require derivatization of the oligosaccharides and cannot be
used to identify and separate oligosaccharides that have the same degree of polymerization,
i.e. isomers.
Derivatization of oligosaccharides allows for them to be more volatile and therefore more
compatible with analysis methods such as mass spectrometry. One common derivative method
is hydrolysis followed by chromatographic separation.22,23 Besides hydrolysis, other common
methods used to derivative oligosaccharides are permethylation 24 and peracetylation.25
Permethylation has been shown to easily determine branching and interglycosidic linkages. It
also helps stabilize sialic acid residues in acidic oligosaccharides and in conjunction with
matrix-assisted laser desorption ionization (MALDI) has been shown to give more predictable
ionization than non-permethylated oligosaccharides.26 Two common methods for
permethylation are the use of dimethyl sulfoxide anion (DMSO-) to remove protons from the

24
analyte and replace them with methyl groups27 and the addition of methyl iodide to DMSO-
which contains powdered sodium hydroxide. This second method effectively replaces protons
with a methyl group at both oxygen and nitrogen sites in oligosaccharides.24
Analysis Methods
Once released and separated, the oligosaccharides can then be analyzed individually. One
past method for differentiation of isolated and separated carbohydrates is NMR spectroscopy.28-30
Over the past 25 years advances in NMR have allowed it to become suitable for structural
analysis of carbohydrates.31 Such advances include improvements in instrumentation, pulse
sequences, ability to interpret spectra, isotopic labeling of compounds and improvement in
molecular modeling. With the advances of technology, the ability and accessibility of these
techniques have become faster, better and more accessible. The improved coupling of molecular
modeling with NMR has provided the ability to determine primary structure and
three-dimensional structures of different biological molecules.31
While NMR has been used to study carbohydrate structures, including glycosidic linkages
of saccharide units, and has developed considerably in recent years, it still has several drawbacks
and areas in need of improvement. First, the sample size required for NMR analysis is relatively
large. Another major drawback is that data analysis can be complicated and time consuming.
Typical 1H NMR spectra can be used to give partial spatial arrangement, but due to the
incomplete separation of the proton resonance signals they cannot provide a lot of structural
information. Other types of NMR have been used in the past to analyze carbohydrates and
include 13C, 15N, 17O, 19F and 31P. The resolution and sensitivity of each method varies and
therefore different information can be ascertained by using each method. For example,
13C-NMR can give the information of the anomeric configuration of the carbohydrate residues.
It can also provide sequence information of the composite monosaccharides, their sequence and

25
the overall conformation of the carbohydrates. Another NMR method that improves the results,
but increases the complexity, of data analysis uses 2D- homonuclear correlation types of spectra
(2D-COSY) to assign resonances and give further structural information. Although these spectra
give more information, they do not provide monosaccharide sequence information because there
is an absence of coupling over the glycosidic linkage. For this, nuclear overhauser enhancement
spectroscopy (NOESY) or rotating-frame overhauser enhancement spectroscopy (ROESY) may
be used. While there is some success with these methods, the linkage is not always identified.31
Since carbohydrates are inherently flexible, in solution carbohydrates may undergo
alternations. Estimation of the solution structure required knowledge of the configuration of the
composing monosaccharides. Flexible motions of the whole molecule on a short time scale
involve fast vibrations at bonds and angles and on a longer time scale involve changes in the
dihedral angles. Therefore changing the relaxation time can help deduce the internal flexibilities
of carbohydrates in solution. As one can see, the data required for this type of analysis are
extensive and analysis can be extremely time-consuming.
Mass spectrometry is another very popular analytical technique that is used for gas-phase
analysis of carbohydrates. Several types of mass spectrometers have been used for analysis,
including Fourier transform ion cyclotron resonance mass spectrometry (FTICR-MS), which will
be discussed further in chapter 2. Mass spectrometry has been shown to have 3 to 4 orders of
magnitude higher sensitivity than NMR.32 Mass spectrometry is highly sensitivity and can be
used in multi-step approaches to determine structural information. In order for analysis with
mass spectrometry to be done, one of several ionization methods can be used to introduce the
analyte of interest into the mass spectrometer.

26
Mass Spectrometry: Ionization Techniques
Both hard and soft ionization methods exist. Hard ionization methods are ones that result
in fragmentation and degradation of the sample during the ionization process, whereas soft
methods produce little or no fragmentation during the ionization process. One previous hard
ionization method widely applied is electron ionization (EI). In EI a beam of electrons is used to
excite and ionize a volatile analyte. A main drawback of EI is fragmentation of the sample
before detection.33 Soft ionization methods are currently preferred since they result in the
ionization with molecules of the sample remaining intact. Electrospray ionization (ESI) is the
most popular of the soft ionization methods. Several soft ionization techniques have been used
in the past for carbohydrate analysis and include fast atom bombardment (FAB),34-36 MALDI37
and ESI.38,39
In FAB, the analyte is mixed with a liquid matrix and is bombarded under vacuum with a
high energy beam of atoms. Fast atom bombardment results in the release of [M+H]+ or [M-H]-
ions which can then be analyzed.40 Analysis with FAB had several constraints including poor
ionization of neutral and basic oligosaccharides and restriction of analysis to relatively smaller
molecules. While basic oligosaccharides were ionized poorly with FAB, acidic oligosaccharides
produced stronger signals in the negative ion mode.35 When FAB was coupled with FTICR-MS,
extensive fragmentation, including cross-ring cleavages was seen.41,42
While FAB uses a liquid matrix, MALDI uses a crystalline matrix where the analyte of
interest is co-crystallized with the solid matrix molecules. A laser is focused onto the matrix
and its photon energy is absorbed by the matrix and the analyte of interest is released as charged
ions.43 While analysis with traditional MALDI is possible, analysis of smaller saccharide units is
a challenge because most peaks of the typical matrix are present in the range m/z <500, where
peaks due to smaller saccharides such as mono-,di- and trisaccharides are also found. Recently,

27
use of an acid fullerene matrix instead of the traditional matrix has allowed for disaccharides to
be successfully studied with MALDI.44 This approach needs to be developed more fully and
applied to other types of carbohydrates.
Electrospray ionization is the least energetic of these three gentle ionization techniques. A
primary benefit of ESI ionization is the absence of matrix peaks and therefore ease of analysis
for smaller mono-, di- and trisaccharides.33,45,46 In ESI, a solution of the analyte and solvent is
passed through a capillary with a high voltage (2 to 5 kV) applied to it.47 This process allows for
charged droplets to be formed. Once formed these charged droplets can then be transferred
(through differential pumping and ion optics) into a mass spectrometer and analyzed by mass
spectrometry. Electrospray ionization is versatile when it comes to carbohydrates since it can be
used to ionize both basic and acidic oligosaccharides. Since multiply charged ions are formed,
and mass spectrometers typically separate based on mass-to-charge ratio, ESI has virtually no
limit to the size of the ion that can be analyzed. This dissertation will concentrate on ESI since it
was used exclusively in the research to be reported.
Fragmentation Methods
Since isomers have the same mass and therefore cannot be differentiated by mass
spectrometry alone, differences in ion fragmentation can be used to distinguish isomers. To
obtain structural information, several fragmentation methods have been used. These methods
include electron capture dissociation (ECD), collision induced dissociation (CID) and infrared
multiple photon dissociation (IRMPD).
Electron capture dissociation uses low energy electrons to induce fragmentation of the
saccharide.6 It results in multiply, positively charged ions that can then be analyzed with a mass
spectrometer. Past research has included using ECD to do top-down analysis where a whole
protein is sequenced simultaneously. Also, O-glycosylation sites on proteins have been explored

28
using ECD.48 While ECD can be used for proteins and peptides, it has limited application to
oligosaccharides.
Another dissociation technique that is more applicable to oligosaccharides is CID. In
on-resonance or traditional CID, a neutral background gas is pulsed into the cell, analyte ions are
accelerated to higher kinetic energies, and collide with the introduced gas. These collisions
result in fragmentation of the analyte of interest.49 Another commonly used CID method in
FTICR-MS is sustained off-resonance irradiation collision induced dissociation (SORI-CID).50
In SORI-CID, ions are excited by an off-resonance frequency, causing their kinetic energies to
increase and decrease repeatedly with time, resulting in less-energetic collisions with background
molecules over a longer time period than with conventional CID. These collisions can
nonetheless result in fragmentation of an isolated ion of interest. Collision induced dissociation
of oligosaccharides results in fragments that can be used to determine stereochemistries, linkage
position and branching information.34,51,52 A disadvantage to SORI-CID with respect to
identification of oligosaccharide is that since SORI-CID is low energy, cross-ring fragmentations
are less likely than the fragmentation of the glycosidic linkage. Also, the ability to control the
energies of collisions is limited with CID. Due to the collisions and variance of energy, CID can
give different fragmentation than other dissociation methods.
One fragmentation method that gives similar and complementary fragments to CID, but
allows for finer control of the energy imparted to the system is IRMPD.53 IRMPD relies on
absorption of photons by one vibrational normal mode of trapped ions and the subsequent
redistribution of photon energy into other vibrational modes of the ions. This redistribution
occurs via intramolecular vibrational relaxation.54,55 If sufficient photons are absorbed without
excessive collisional or radiative relaxation, then the internal energy of the ion increases to a

29
level above the dissociation threshold, resulting in fragmentation. One advantage of IRMPD
over CID is that the power is only limited by the laser being used. Therefore, use of a tunable
laser gives finer control over the power imparted into the system. The theory and history of
IRMPD will be discussed in more detail in chapter 3.
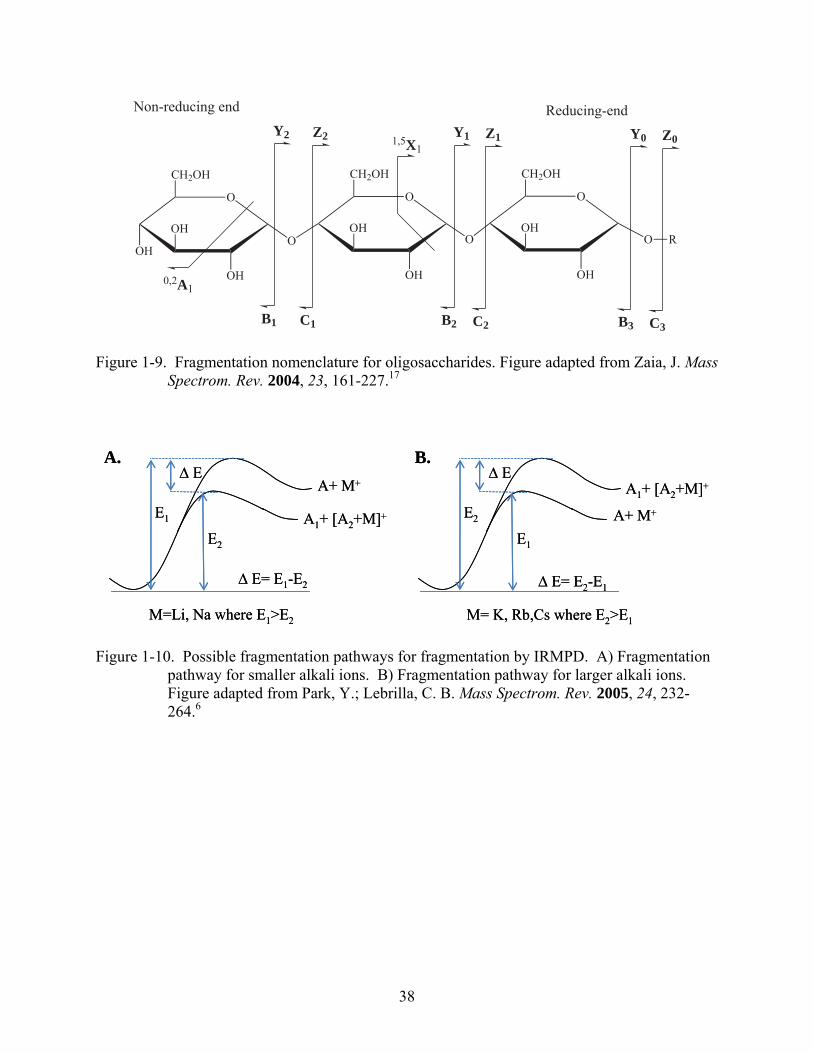
A systematic nomenclature method has been developed for naming fragments of
carbohydrate ions. In this method, the fragments which contain a non-reducing end sugar are
labeled with uppercase letters sequentially starting with A, Figure 1-9.17 Those fragments that
contain the reducing sugar are labeled sequentially with letters from the end of the alphabet
(X, Y, Z). Ions formed by cleavage across a ring are A and X ions. The subscripts for these
fragments are given by assigning each ring bond a number and then counting clockwise.
Charged Ions
Since mass spectrometry only detects charged particles, metal ions have become a
common way to ionize neutrals and then detect the complexes formed with mass spectrometry.
Adduction of an alkali metal ion has been used with FAB, MALDI and ESI in both the positive
and negative ion mode.56-61
For fragmentation of a metal-attached ions two pathways predominate. The first type of
fragmentation is loss of the metal ion and the second type is fragmentation of the molecule into
smaller charged parts which often retain the metal ion. The fragmentation pathway that occurs
depends on the strength of the bonds of the adduction of the metal to the molecule, Figure 1-10.
If the binding energy of the metal ion is less than the dissociation threshold, then loss of the
metal will occur. This type of fragmentation is seen when large alkali metals are adducted to
molecules. This is because the binding energy of the larger alkali metals ions is lower than that
of smaller alkali metal ions.58 The opposite has been seen with the smaller alkali metal ions.
Since their binding energies are larger and thus metal ion dissociation is less likely, the result is

30
greater fragmentation of the molecules with the smaller alkali metal ions remaining attached to
the fragments. Cancilla et al. found that the relative binding energy for alkali metal ions is
Li+>Na+>K+>Rb+>Cs+.58 The stronger the binding energy, the more fragmentation that will be
seen with IRMPD since it is more likely the molecule will fragment before losing the metal.6
Xie et al. have compared the ability of CID and IRMPD to fragment alkali-adducted molecules
and showed that for smaller ions such as Li+ and Na+ both dissociation method yielded similar
fragments.62
Specifically, adduction of lithium to saccharides has been studied by Hofmeister et al.60 In
this research they determined that the lithium cation interacts with disaccharides through several
oxygen sites, including the glycosidic bond. This triple interaction leads to stronger binding and
therefore greater fragmentation is seen with IRMPD. The research performed in this dissertation
primarily used adduction of lithium ions and analysis in the positive ion mode.
In the negative ion mode, Cole & Zhu have shown that chlorinated species can be studied
conveniently.61 Formation of the chlorine adduct has proven successful for species that are
polar, neutral molecules or slightly acidic molecules that do not generate negative ions through
deprotonation. Therefore, chlorination has been shown to be one easy method for exploring ions
in the negative mode when addition of a strong base does not promote deprotonation.
While the addition of an appropriate salt can help facilitate the ESI process through
producing charged adducts, excessively high salt concentrations can cause background
interferences; therefore caution needs to be taken when using salts for the creation of ions.
These interferences can lead to signal suppression and the subsequent inability to detect the ions
of interest. The ease of the adduction of metals to create ions with oligosaccharides makes their

31
use with IRMPD a promising method to differentiate the sugars in both positive and negative ion
modes.
Objective of This Research
Since carbohydrates are biologically important, being able to differentiate both their
linkages and anomeric configurations can give valuable information. For this research,
FTICR-MS was used in conjunction with IRMPD to distinguish various mono- and disaccharide
ions in both the positive and negative ion mode. Fourier transform ion cyclotron resonance mass
spectrometry not only gives superior mass resolution and mass accuracy when compared to other
types of mass spectrometry, but it also allows for tandem mass spectrometric experiments to be
done in the same region of space (within the analyzer cell), thereby eliminating extra
instrumentation that is often needed with other mass spectrometers.63,64
Since IRMPD uses lasers to introduce photons, various lasers have been used in the past
including fixed frequency and wavelength-tunable CO2 lasers65-69 and free electron lasers
(FELs).55,70-72 Fixed frequency CO2 lasers produce photons at one wavelength (10.6 μm), thus
the information that can be obtained with them is limited. Free electron lasers, on the other hand,
have a large output wavelength range (5 to 250 μm) but these lasers are very expensive and
access to beam time is limited. Therefore, a less expensive alternative with at least a (limited)
range of wavelengths (9.2 to 10.6 μm) is the tunable CO2 laser that will be emphasized in this
research.
The objective of this research was to produce a method for discriminating between various
linked and anomeric configurations of mono- and disaccharides. While previous research done
by Polfer et al. with irradiation produced by a FEL had shown that the linkages and anomeric
configurations could be distinguished by wavelength-dependent ion fragmentation patterns, a

32
method to do so in more conventional (i.e. non-FEL equipped) laboratories had not been
demonstrated.73,74
In this research the anomeric configuration of mono- and disaccharides was determined by
examining the fragmentation patterns produced by IRMPD with a tunable CO2 laser in both the
positive and negative ion modes using FTICR-MS. While past methods have studied the
lithiated disaccharides in the positive ion mode with FEL irradiation, the negative mode of
mono- and disaccharides has not been explored. Therefore the fragmentation of
glucose-containing disaccharides, some of their specific fragment ions and some selected
monosaccharides was also examined in the negative ion mode at the Free Electron Laser for
Infrared eXperiments (FELIX) facility.
Overview
The next chapter will give a description of FTICR-MS. This description will include a
history as well as theoretical and practical aspects of FTICR-MS. Chapter 3 will discuss the
mechanism and theory of IRMPD. The types of lasers used for IRMPD will also be described in
this chapter. Chapter 4 is a detailed description of the procedure and apparatus used to
differentiate lithiated monosaccharides with a tunable CO2 laser at the University of Florida in
Dr. John Eyler’s laboratory. The results of this study will also be discussed. Chapter 5 will
discuss a method to determine both the linkage and anomeric configuration of lithiated glucose-
containing disaccharides in the positive ion mode with a CO2 laser. Chapter 6 will next describe
IRMPD fragmentation of deprotonated and chlorinated disaccharides in the negative ion mode
by wavelength-tunable CO2 laser. A description of the procedure and apparatus used for the
fragmentation of deprotonated disaccharides done at the University of Florida in Dr. David
Powell’s laboratory will also be given. Chapter 7 will give a detailed account of negative mono-
and disaccharides ions and some of their fragment ions explored at the FELIX facility. Finally, a

33
conclusion including a summary of the strengths and weaknesses of this work along with
proposed future work will be presented.

34
CHO
OHH
HHO
OHH
OHH
CH2OH
D-glucose
CHO
HHO
OHH
HHO
HHO
CH2OH
L-glucose
Figure 1-1. Fischer projection for D- and L-glucose.
O
H
HO
H
HO
H
OH
OHHH
OH
Alpha-D-glucose
1
23
45
6
Figure 1-2. Example of the numbering system for the carbons of monosaccharides. The carbons are numbered sequentially beginning with the anomeric (chiral) carbon.
CHO
OHH
OHH
OHH
OHH
CH2OH
CHO
HHO
OHH
OHH
OHH
CH2OH
CHO
OHH
HHO
OHH
OHH
CH2OH
CHO
HHO
HHO
OHH
OHH
CH2OH
CHO
OHH
OHH
HHO
OHH
CH2OH
CHO
HHO
OHH
HHO
OHH
CH2OH
CHO
OHH
HHO
HHO
OHH
CH2OH
CHO
HHO
HHO
HHO
OHH
CH2OH
D-Allose D-Altrose D-Glucose D-Mannose D-Gulose D-Idose D-Galactose D-Talose
Figure 1-3. Fischer projections for the D-hexoses of the aldose family. Isomers that vary in only one position are called epimers.

35
O
H
HO
H
HO
H
OH
OHHH
OH
O
H
HO
H
HO
H
H
OHHOH
OHA B
Figure 1-4. Anomers of D-glucose. A) Structure of the α-anomer of glucose, where the hydroxyl group on the anomeric carbon is in the axial position. B) Structure of the β-anomer of glucose, where the hydroxyl group on the anomeric carbon is in the equatorial position.
O
H
HO
H
HO
H
OH
OHHH
OH
O
CH
H
HO
H
HO
H
OHH
OHH
O
O
H
HO
H
HO
H
H
OHHOH
OH
OH
H
H
H OH
HO H
O
H
HOHO
H
OH
H
H OH
HO H
O
H
HOHO
O
H
H OH
HOHCH
O
H
HOHO
H
Figure 1-5. Inter-conversion of the ring structures for the 6-membered ring, pyranose, and the 5-membered ring, furanose, of D-glucose. Once the cyclic ring of the α-glucose opens, a nucleophilic attack results in the closing of the ring in the β-position.

36
O
H
HO
H
HO
H
OOHH
H
OH
O
H
H
HO
H
OHH
OH
O
H
HO
H
HO
H
H
OHH
OH
O
H
O
H
HO
H
OHH
OH
1
4
H,OH
H,OH
1 4
A
B
Non-reducing end
Reducing end
Non-reducing end Reducing end
Figure 1-6. Examples of disaccharides composed of two glucose (Glc) monosaccharides. A) Structure of maltose (Glcα1-4Glc) with an α-link between carbon 1 of the non-reducing sugar and carbon 4 of the reducing sugar. B) Structure of cellobiose (Glcβ1-4Glc) with a β-link between carbon 1 of the non-reducing sugar and carbon 4 of the reducing sugar.
NH
OH
OH
OH
OH
OO
N-acetyl glucosamine
NH
OH
OH
OH
OH
OO
n-acetyl galactosamine
A
B
Figure 1-7. Structures of two common oligosaccharide derivatives. A) Structure of N-acetylglucosamine. B) Structure of N-acetyl galactosamine. These derivatives are found linked to proteins and are biologically important.

37
Glycoconjugate
Chemical or enzymatic method
Released glycans
Separated glycans
Purification methods:-Gel filtration-Chromatography-Capillary electrophoresis
Derivatization:Methylation with CH3I and a strong base
Derivatization:Hydrolysis with a strong acid
DerivatizationHydrolysis with enzymes
Direct analysis:NMR and MS
Methylated saccharides Monosaccharides Smaller glycans
-Sequence-Glycosidic bond
conformation
-Enzymes-Methylation
-Sequence-Position-Glycosidic bond
conformation
-Type-Amount
-Glycosidic bond conformation
-CE-TLC-HPLC
Figure 1-8. Typical steps for analysis of glycans. Figure adapted from Valle, J. J. Ph.D., University of Florida, Gainesville, 2005.74
38
O
OHO
OH
OH
CH2OH
O
O
OH
OH
CH2OH
O
O
OH
OH
CH2OH
R
Y2
B1
Z2
C1
Non-reducing end Reducing-end
Y1
B2
Z1
C2
Y0
B3
Z0
C3
0,2A1
1,5X1
Figure 1-9. Fragmentation nomenclature for oligosaccharides. Figure adapted from Zaia, J. Mass Spectrom. Rev. 2004, 23, 161-227.17
E2
∆ E
E1
A+ M+
A1+ [A2+M]+
∆ E= E1-E2
M=Li, Na where E1>E2
A.
E1
∆ E
E2 A+ M+
A1+ [A2+M]+
∆ E= E2-E1
B.
M= K, Rb,Cs where E2>E1
E2
∆ E
E1
A+ M+
A1+ [A2+M]+
∆ E= E1-E2
M=Li, Na where E1>E2
A.
E1
∆ E
E2 A+ M+
A1+ [A2+M]+
∆ E= E2-E1
B.
M= K, Rb,Cs where E2>E1
Figure 1-10. Possible fragmentation pathways for fragmentation by IRMPD. A) Fragmentation pathway for smaller alkali ions. B) Fragmentation pathway for larger alkali ions. Figure adapted from Park, Y.; Lebrilla, C. B. Mass Spectrom. Rev. 2005, 24, 232-264.6

39
CHAPTER 2 FOURIER TRANSFORM ION CYCLOTRON RESONANCE MASS SPECTROMETRY
Fourier transform ion cyclotron resonance mass spectrometry (FTICR-MS) is a powerful
analytical technique with a plethora of research applications. This chapter will discuss the
history of the technique, the apparatus used for it and examples of research done with
FTICR-MS.
History
Today’s current research with FTICR-MS first became possible with the invention of E.O.
Lawrence’s cyclotron in the 1930’s.75 Lawrence’s cyclotron accelerator was used to bombard
target compounds with ions of various masses. In 1932, Lawrence et al. demonstrated that an
ion moving perpendicular to an uniform magnetic field is restricted to circular, cyclotron motion
with an angular frequency given by the following equation:76
m
qBc . (2-1)
In Equation 2-1, ωc is the cyclotron frequency, q is the ion’s charge, B (in Tesla) is the magnetic
field strength and m is the mass of the ion. This motion is independent of the particle’s orbital
radius. The direction of this motion depends on the charge of the ion, with positive ions rotating
in one direction and negative ions in the opposite direction, Figure 2-1.
This theory was incorporated into Sommer, Thomas and Hipple’s Omegatron in the
1950’s,77 which was later developed into other instruments that were used to study ion-molecule
reactions.78 Then in the 1970’s, Comisarow and Marshall introduced Fourier transform methods
into ion cyclotron resonance (ICR) mass spectrometry to build the first Fourier transform mass
spectrometer (FTMS).79,80 The number of Fourier transform mass spectrometers and

40
applications using them has been increasing since the initial demonstration of the technique in
the 1970’s.
Apparatus
While several types of FTICR-MS instruments are available, all have the same general
components.78 These include the magnet, vacuum system, analyzer cell and a data system. A
schematic diagram of the components of a 4.7 T FTICR-MS system (minus the data system) is
shown in Figure 2-2.
Magnet
The first component is the magnet, most commonly either an electromagnet or a
superconducting magnet. Magnetic field strengths of electromagnets are below 3.0 T, normally
around 1.5 T. Superconducting magnets are generally available in field strengths of 3.0 to 9.4 T,
but higher field strengths such as 20 T have been used in FTMS instruments.78 As magnetic field
strength increases, both the mass resolving power and highest non-coalesced mass increase
(Figure 2-3). Therefore, as magnetic strength increases the ability to study higher masses with
more resolving power is possible. Also, with stronger magnetic fields, longer ion trapping times
are possible. Since the capabilities of the mass spectrometer increase with magnetic field
strength, typical mass spectrometers are designed using the strongest magnet available or
affordable.
Vacuum System
To avoid collisions of the analyte with other molecules in the cell, low pressures are
needed for optimal ion excitation and detection. For best results, background pressures in the
10-9 to 10-10 Torr range are typically used. In order to achieve these low pressures, a pumping
system is needed. Generally such a system will use mechanical pumps for rough pumping and
turbo-molecular pumps to achieve the low pressures needed for FTICR-MS. To allow the

41
coupling of ambient ionization techniques, there is normally a region where higher pressures are
pumped down by differential or rough pumps near the source. Normally a gate valve separates
the source region from the high vacuum region. Optics are used to guide ions from a high
pressure region (10-5-10-6 Torr) to a lower pressure region, as seen in Figure 2-2. Fourier
transform ion cyclotron resonance mass spectrometers often use valves to permit pulses of gas
(or air) to be leaked into the cell, allowing fragmentation methods like collision induced
dissociation (CID) to be performed.
Analyzer Cell
An analyzer cell is the next part of the instrumentation. Ions are stored, mass analyzed and
detected in the cell. The analyzer cell is where ions can also be isolated and fragmented in
tandem mass spectrometry (MSn). Since the cell is the heart of the mass spectrometer, having
the most efficient design is desired. While a number of designs have been proposed over the
years,64 two typically used cells are of cubic and cylindrical geometry (Figure 2-4). These cells
are both composed of six electrode plates, which perform one of three functions when voltages
are applied to them. The first type of plate, the trapping plate, holds ions in the cell in the
direction parallel to the magnetic field. The second type of plate, the excitation plate, excites the
trapped ions to larger radii. The last type of plate, the detection plate, detects the excited ions.
In cubic cells, the trapping plates sometime have small openings that allow externally produced
ions to enter the cell, where they can then be excited and detected. Cylindrical cells are typically
preferred since they are larger, conform more closely to the geometry of superconducting
magnets (with cylindrical bores) and therefore can hold more ions
Data System
The next component is the data system. The data system takes the signal induced by
excited ions on the detection plates and transforms it into useable information. The
42
instrumentation in this component includes a frequency synthesizer that generates the
frequencies used for exciting the ions, a delay pulse generator, broadband radio frequency
amplifier, fast transient digitizer and computer system.78 A computer coordinates all of the
electrical devices needed for the experimental process. User-friendly interfaces allow for ease in
use of the system by operators. With these interfaces, tandem mass spectrometry experiments
can be performed simply by changing and/or adding events in the experimental sequence. It
goes without saying that as technology improves the capability and ease of FTICR-MS
instruments will also improve.
Theory
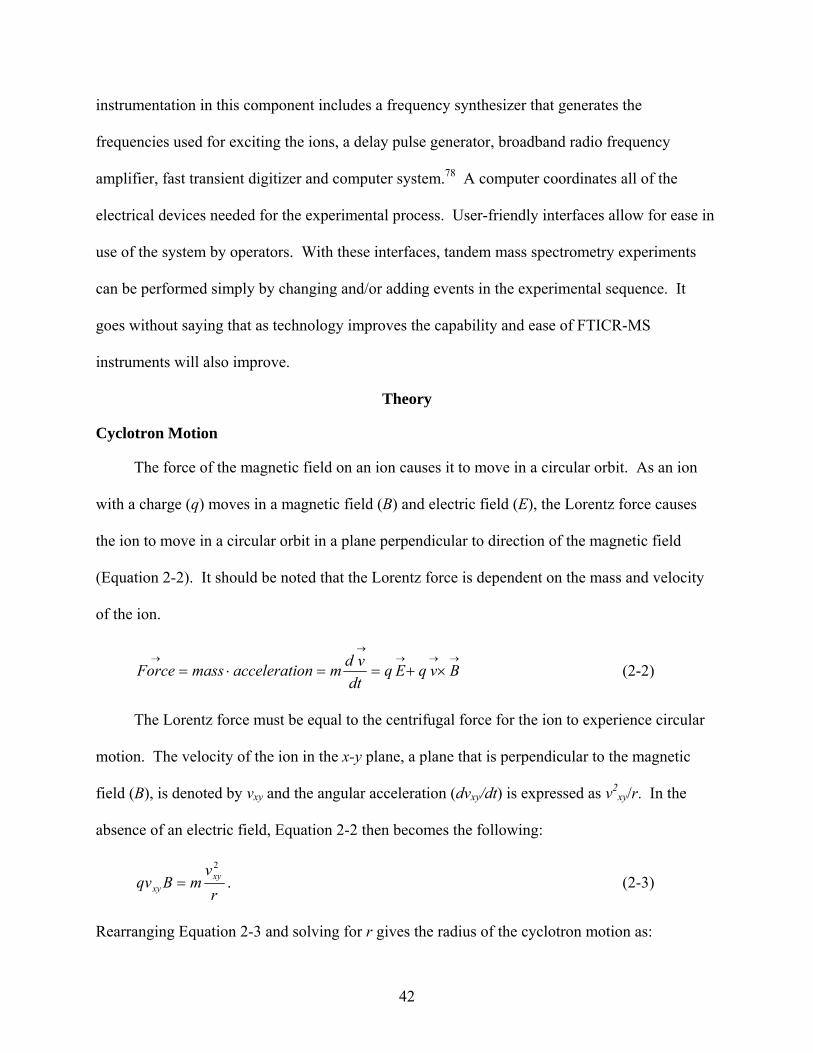
Cyclotron Motion
The force of the magnetic field on an ion causes it to move in a circular orbit. As an ion
with a charge (q) moves in a magnetic field (B) and electric field (E), the Lorentz force causes
the ion to move in a circular orbit in a plane perpendicular to direction of the magnetic field
(Equation 2-2). It should be noted that the Lorentz force is dependent on the mass and velocity
of the ion.
BvqEqdt
vdmonacceleratimassForce (2-2)
The Lorentz force must be equal to the centrifugal force for the ion to experience circular
motion. The velocity of the ion in the x-y plane, a plane that is perpendicular to the magnetic
field (B), is denoted by vxy and the angular acceleration (dvxy/dt) is expressed as v2xy/r. In the
absence of an electric field, Equation 2-2 then becomes the following:
r
vmBqv xy
xy
2
. (2-3)
Rearranging Equation 2-3 and solving for r gives the radius of the cyclotron motion as:

43
qB
mvr xy
c . (2-4)
Substituting in the angular velocity (in rad/s) as ω= vxy/r, Equation 2-4 becomes:
mω2r = qBωr. (2-5)
Rearranging Equation 2-5 gives the cyclotron frequency, Equation 2-1:
m
qBc . (2-1)
Since ω=2π/t=2πf, the linear cyclotron frequency can therefore be given by:
m
qBf c
c
22 . (2-6)
For example, at 4.7 T a singly charged ion of m/q 349 will have a cyclotron frequency of
209.8 kHz:
kHz 8.20910673.13492
7.410602.1127
19
kguu
TC
.
Equation 2-6 shows that the cyclotron frequency is dictated only by the magnetic field
strength, the charge of the ion and the mass of the ion. This means that the cyclotron frequency
is independent of the ion’s velocity and therefore independent of the ion’s kinetic energy. Since
the frequency is independent of the velocity and kinetic energy, all ions with the same m/q ratio
will have the same cyclotron frequency. Using Equation 2-1 and Equations 2-3 to 2-6, the
typical frequencies calculated are from the kilohertz (kHz) to the megahertz (MHz) range. These
frequencies are detectable by most commercially available instrument electronics.64,78
Trapping Motion
The presence of a uniform magnetic field in the z-direction allows for unrestricted motion
along the z-axis and confines the motion of ion in the x-y plane. To prevent ions from escaping
along the z-axis, a trapping voltage, Vtrap, can be applied to the end-cap electrodes of the cell.

44
This trapping voltage leads to a three-dimensional quadrupolar potential, in the cell, in the
form:64,81,82
22
22
2rz
aVtrap(r,z)
. (2-8)
In Equation 2-8, Vtrap is the trapping voltage, r is the radial position of the ion in the x-y plane
and equals 22 yx , a is a measure of the trap size and γ and α are trap shape dependent
constants. Equation 2-8 can used to solve in terms of the z-motion of the ion, giving:
),,(2
2
zyxqdt
zdmFaxial (2-9)
Solving Equation 2-9, gives:
)2cos()0()( tvztz z . (2-10)
An ion at a particular z-position will oscillate with a given frequency that be found by
Equation 2-11:
23 10 x 2.21088
ma
zVv trap
z
. (2-11)
In Equation 2-10, vz is in Hz, Vtrap is in volts, a is in meters, m is in atomic mass units and z is in
multiples of elementary charge.
Magnetron Motion
Combination of the electric and magnetic fields creates a three-dimensional trapping
potential that allows ions to be stored and analyzed for extensive intervals of time (seconds).
Although the cyclotron and trapping motions are not coupled, their motions combine to induce a
third type of motion: magnetron motion. The trapping potential of Equation 2-8 also produces a
radial force with the equation:

45
ra
qVqEF trap
rradial 2)(
. (2-12)
This radial force acts upon the ions in an outward direction that opposes the inward Lorentz force
of the magnetic field. An equation related to the motion of an ion that is subjected to a static
magnetic field and three-dimensional axial quadrupolar potential is given when Equation 2-1 and
2-11 are combined to give Equation 2-13:
ra
qVrqBrmF trap
22
. (2-13)
Solving this quadratic equation for zero gives:
02
2 ma
qV
m
qB trap . (2-14)
The absence of the radius, r, in Equation 2-14, indicates that ω is independent of the radius.
Therefore, each ion motion frequency is independent of the ion position within the ion trap.
Solving Equation 2-14 for ω yields two natural rotational frequencies. The first frequency, ω+, is
given in Equation 2-15. This is the perturbed cyclotron frequency that is observed in the
presence of a direct current (d.c.) trapping potential. The second frequency, ω-, is shown in
Equation 2-16. This is the magnetron frequency which is a circular motion that is superimposed
onto the cyclotron motion.
222
22
zcc (2-15)
222
22
zcc (2-16)
The cyclotron frequency is far greater than both the magnetron and trapping frequencies.
Therefore, only the cyclotron frequency is used for ion detection.64,78

46
Basic FTICR-MS Operation and Data Acquisition
Due to the design of an FTICR mass spectrometer, the various experimental events occur
in the same region of space, namely the analyzer cell. A typical event sequence can be seen in
Figure 2-5. The basic events of a typical experiment are: ionization, delays, excitation, detection
and quenching ions from the cell.
The first step of the experimental sequence is quenching. Quenching empties the analyzer
cell of any ions that may have been present from previous experiments. These ions are typically
ejected along the z-axis of the cell by changing or removing voltages on the trapping plate.
Usually a quench pulse of about 1 millisecond gives ample time to empty the cell of all
unwanted ions.
The next step in the experimental sequence is ionization in which gas-phase ions are
produced. Ions can either be formed internally in or externally to the cell. Externally made ions
have to be transferred into the cell for analysis through the use of ion optics. Once inside the
cell, the ions are constrained to motion in the x-y plane by the magnetic field and are trapped
along the z-axis by a voltage (typically 0.5 to 5 V) that is applied to the trapping electrodes.
Both positive and negative ions can be trapped and analyzed within the ICR cell by simply
changing the polarity of the voltages applied to the trapping electrodes. Also, ions of a large m/z
range can be trapped in the cell, all of which oscillate at their own particular frequencies as
determined by Equation 2-6.
After ionization, a series of delays usually follow in the experimental sequence. Such
delays allow time for ion injection, ejection of unwanted ions and reaction of trapped ions with
neutral species or irradiation by laser sources. Thus, during these delays the ions can be
subjected to tandem mass spectrometry techniques such as introducing collision gases (for CID),

47
laser pulses (for IRMPD) or electrons (for electron capture dissociation) into the analyzer
cell.64,83,84
Excitation of the ions into larger, detectable radii is the next event in the experimental
sequence. In order to detect a wide m/z range of ions, a swept frequency approach can be used in
excitation. For this, a wide range of frequencies is applied sequentially to the excitation
electrodes. These frequencies create a short, high intensity, broadband radio frequency signal
also know as a chirp. When the frequency applied matches the cyclotron resonance frequency of
an ion, the ion absorbs energy and this results in the acceleration of the ion into a larger orbit.
Ions of the same mass to charge, once excited, move together in ion packets. The excitation
event is brief since if the ions are excited too much, their radii will become too large, causing
them to impact the analyzer cell walls and thus resulting in their loss.
Use of stored waveform inverse Fourier transform (SWIFT)85 or chirp excitation allows for
the undesired ions to be ejected from the cell while permitting the desired ions to remain in the
cell for detection. While a SWIFT uses a calculated and then synthesized waveform and a chirp
uses a high voltage swept r.f. signal, they both excite unwanted ions into an orbital radius that is
larger than the cell radius, causing ion-wall collision of these undesired ions.64,78 This effectively
eliminates the unwanted ions.
Since a chirp is a high voltage, short duration event, all the ions are both excited and
detected almost simultaneously. For example, a frequency synthesizer can sweep over
frequencies from 100 kHz to 10 MHz in roughly 1 millisecond. This sweep excites all the ions
with cyclotron frequencies in that range. The resulting time domain spectrum (Figure 2-6 A) is
very complex. To produce the mass spectrum, the time domain signal is mathematically
analyzed using a Fourier transform algorithm. This generates a frequency domain spectrum

48
(Figure 2-6 B), with all the individual ion frequencies being present. A calibration formula
derived from the cyclotron frequency equation allows the frequency domain to be easily
transformed into a mass spectrum (Figure 2-6 C). Since this approach excites and detects all
frequencies simultaneously, the acquisition time needed is far less than that of classical ICR in
which only one frequency at a time could be detected and analyzed. The time it takes to perform
an FT on the data is only hindered by the technology available; as the speed of computers
increases, so does the ability to do FT.
Once excited, the ion packets create an alternating current (image current) in the detection
plates, where the amplitude is related to the number of charges in the cell. This image current
gives FTICR-MS the unique ability to detect ions without destroying them. While FTICR-MS
uses the image current, all other mass spectrometers, excluding orbitraps, detect ions in a
destructive manner. Since the ions are not destroyed during detection in FTICR-MS, they
remain in the cell and can be re-measured and reacted further without having to produce more
ions. Also, since multiple frequencies are applied during the excitation step, FTICR-MS can be
used to detect ions of many different masses simultaneously. This also allows FTICR-MS to
have increased sensitivity and resolution.
The entire sequence can then be repeated as many times as wanted or needed. The scans
that are collected can be signal averaged. Signal averaging leads to spectra with better signal to
noise (S/N) ratios and improves the quality of the collected spectra. Other events can be added
into the sequence to allow for tandem methods such as CID or IRMPD to be performed on the
ions within the cell. The actual experimental sequence and length can vary depending on the
experiment.

49
Mass Resolution
One major advantage of FTICR-MS instruments is their superior mass resolution when
compared to other mass spectrometers. Mass resolution (m2-m1 ≥ Δm50% where m1 and m2 are the
closest masses that can be resolved) is defined as the point where one valley begins to appear
between peaks of equal shape and height and is separated by Δm50%.64 Both high mass resolving
power and high mass resolution can significantly improve the quality of the experimental data
obtained. As mass resolving power increases, the maximum number of components in a mixture
that can be resolved also increases. Therefore, it may be possible to distinguish and differentiate
different chemical components in a mixture without prior separation. Another advantage is that
high resolution can decrease peak width, thereby giving a more accurate mass determination.
Fourier transform ion cyclotron resonance mass spectrometry is capable of giving the highest
mass resolving power and highest mass accuracy (for all ions up to m/z 5000) of all mass
spectrometry methods.
High mass resolution requires that a long time domain signal, also known as the transient
response signal, be acquired. The mass resolution increases in direct proportion to the length of
the transient recorded. The number of data points collected during the experiment is set by the
user before the transient is collected. Figure 2-7 shows that as the number of data points
increases, the peak widths decrease and the resolution of the mass spectrum increases. However,
the number of data points that can be processed from a transient is limited. Thus far,
approximately 106 data points can be processed using commercially available data analysis
programs. The higher the number of data points, the more computer memory is needed.
Therefore as technology advances, larger numbers of data points can be taken. The number of
data points required for a desired transient length can be calculated by Equation 2-16,

50
S
NTacq . (2-16)
In Equation 2-16, Tacq is the transient duration, S is the sampling rate and N is the number of data
points collected. The transient collection rate is based on the sampling frequency used.
According to the Nyquist theorem, the sampling frequency must be at least twice the highest
frequency (determined by the lowest m/z) being recorded. Based on the number of points
collected, the maximum resolution that can be achieved is determined by:
2acqcTf
R . (2-17)
In Equation 2-17, R is the resolving power, fc is the cyclotron frequency and Tacq is the duration
of the transient. As seen in Figures 2-6 and 2-7, the transient signal decays over time. This
occurs as the collisions between ions and neutrals destroy the coherent ion packet within the
analyzer cell. Therefore, to reduce the possibility of collisions within the cell, all FTICR-MS
experiments are carried out in ultra-high vacuum.
Another aspect that can affect the resolution is space charging. Space charging is due to
repulsions between ions having similar charge. It is a consequence of Coulomb’s law and can be
described by the following equation:
)(2
'
r
qqkF . (2-18)
In Equation 2-18, F is the force between the two ions, k is a proportionality constant, q and q' are
the ion charges and r is the distance between the two ions. Space charging can affect mass
measurement accuracy and sensitivity.78,86-88 The greater the force, the more space charging,
thereby resulting in a decrease in resolution. Reducing the number of ions held within the cell or
introducing an internal calibrant can reduce the effect of space charging.89-91

51
Tandem Mass Spectrometry
One distinct advantage of FTICR-MS is the ability to perform multiple (tandem) mass
spectrometry (MS) experiments. For tandem MS, the precursor ion is excited and then
dissociated. The resulting product ions are then detected and analyzed. Tandem MS allows
more information than just the precursor mass spectrum of an ion to be obtained. For example,
isomers with the same mass can be identified by ratios of the relative percent abundances of
product ions.92-94 Since more steps are involved, tandem MS experiments are inherently more
complex than regular mass spectrometric experiments. Current software allows tandem
experiments to be performed by simply adding additional steps into the experimental sequence.
Unlike tandem MS performed on magnetic sectors or quadruple mass spectrometers, where
additional mass analyzers are needed for each additional step, FTICR-MS only needs additional
steps added to the experimental sequence. The experimental sequence can also be altered to
include isolation steps for the product ions. Once isolated, both the precursor and/or the product
ions, can be dissociated by either collision induced dissociation (CID), irradiation with a laser or
by electron impact (EI).64,78,95,96
Dissociation Techniques
Several dissociation techniques are employed in tandem mass spectrometry. These
methods include CID, surface induced dissociation (SID),97 electron capture dissociation
(ECD)98,99, ultraviolet photodissociation (UVPD)100, blackbody infrared dissociation (BIRD)101
and infrared multiple-photon dissociation (IRMPD).95,102
One of the most popular dissociation techniques for biological molecules is dissociation by
collision. This method involves the trapping and reaction of ions in the analyzer cell prior to
dissociation. Application of an excitation pulse ejects all the ions of higher and lower masses
than the previously selected and isolated precursor ion from the analyzer cell. Ejection of the

52
unwanted ions can also be configured to involve exciting the precursor ion into a larger radius
orbit and thus increasing the kinetic energy of the ion.78,103 The relationship between the kinetic
energy and the radius is shown in Equation 2-19.
m
rBqE
2
222
(2-19)
In Equation 2-19, E is the kinetic energy of the ion, q is the charge of the ion, B is the magnetic
field strength, r is the radius of the ion’s orbit and m is the mass of the ion. This mass selected
and kinetically energized ion undergoes collisions with a background gas or a neutral gas
(typically Ar) that is pulsed into the cell by a pulsed valve.49,104 As long as the pulsed gas does
not increase the pressure in the cell too much, the ions are retained and detected.
One disadvantage of traditional CID is that the product ions are formed away from the
center of the analyzer cell. The farther the ions are from the center of the cell, the more likely it
is that there will be a decrease in detection efficient and resolution. An alternative to traditional
CID is sustained off-resonance irradiation (SORI)-CID which does not have this disadvantage
and is less energetic than traditional CID.50,105,106
Another tandem mass spectrometric method which was used for the research reported in
this dissertation is IRMPD. Traditional IRMPD dissociation uses a fixed wavelength CO2 laser
(10.6 μm) to introduce photons and slowly heat the ions by increasing their vibrational energies,
thus resulting in dissociation of the ions within the analyzer cell. In IRMPD, the photons are
absorbed and their energy is redistributed internally until the dissociation threshold is met or
exceeded, resulting in the fragmentation of the precursor ion. Recently, tunable lasers, including
free electron lasers, have been used to fragment oligosaccharides and other biological
samples.70-73,107

53
Infrared multiple photon dissociation results in similar and/or complementary fragments to
those produced by CID. The benefit of IRMPD over CID is that a gas pulse is not required for
fragmentation. With no gas pulsing, there is no need for extra experimental time to reduce the
pressure in the cell before detection. The ability to manipulate ions and the convenience with
which photons can be delivered into the cell makes coupling IRMPD with FTICR-MS an
advantageous method.
Conclusions
Fourier transform ion cyclotron resonance mass spectrometry has become a very valuable
tool for bioanalytical studies including proteomics and glycobiology. The increased ability and
popularity of FTICR-MS is mainly due to the increased efficiency of and developments in
hardware and software technology. It offers higher mass resolution and mass accuracy that any
other type of mass spectrometry, thereby allowing superior mass assignment. Along with these
benefits, the ability to do tandem mass spectrometry in time rather than space makes FTICR-MS
superior over many other mass spectrometric methods. With improvements in data acquisition
and analysis technology, the power and ease of use of FTICR-MS also increases, making it an
even more valuable mass spectrometric tool for future research.
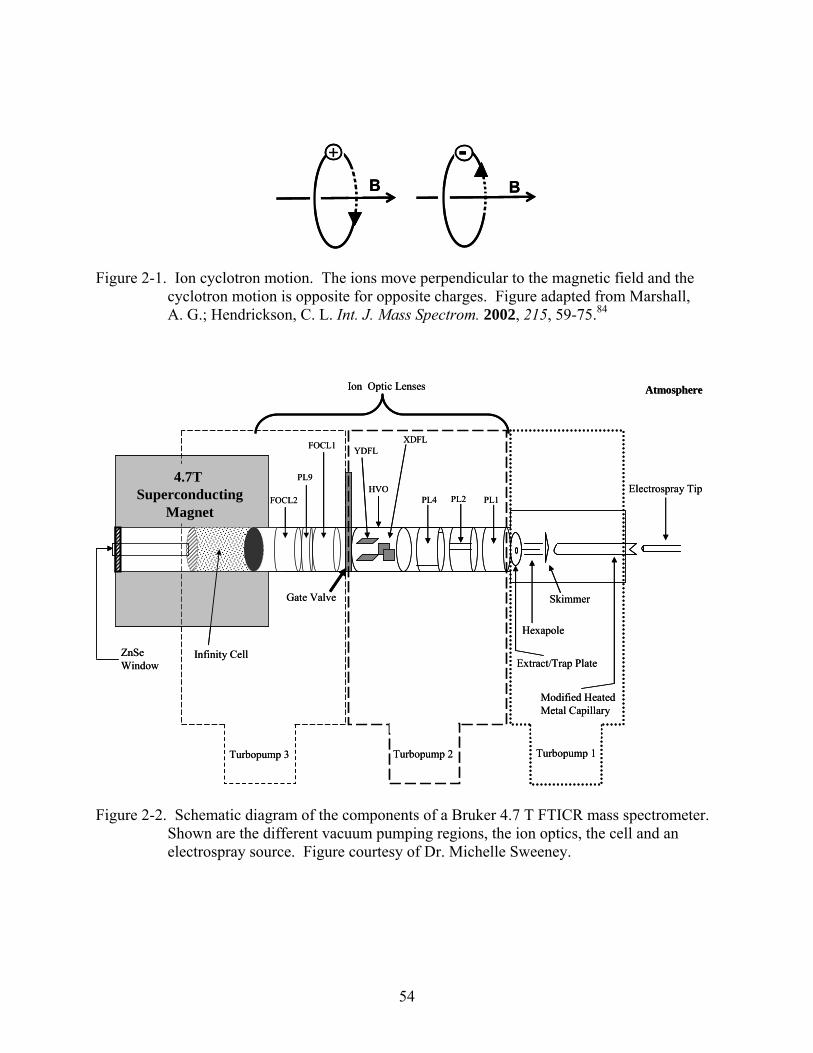
54
BB
+ -BB
++ --
Figure 2-1. Ion cyclotron motion. The ions move perpendicular to the magnetic field and the cyclotron motion is opposite for opposite charges. Figure adapted from Marshall, A. G.; Hendrickson, C. L. Int. J. Mass Spectrom. 2002, 215, 59-75.84
ZnSeWindow
Infinity Cell
FOCL2
PL9
FOCL1
Gate Valve
HVO
YDFLXDFL
PL4 PL2 PL1
Extract/Trap Plate
Hexapole
Skimmer
Modified HeatedMetal Capillary
Electrospray Tip
Ion Optic Lenses
Turbopump 1Turbopump 2
Atmosphere
Turbopump 3
4.7T Superconducting
Magnet
ZnSeWindow
Infinity Cell
FOCL2
PL9
FOCL1
Gate Valve
HVO
YDFLXDFL
PL4 PL2 PL1
Extract/Trap Plate
Hexapole
Skimmer
Modified HeatedMetal Capillary
Electrospray Tip
Ion Optic Lenses
Turbopump 1Turbopump 2
Atmosphere
Turbopump 3
4.7T Superconducting
Magnet
Figure 2-2. Schematic diagram of the components of a Bruker 4.7 T FTICR mass spectrometer. Shown are the different vacuum pumping regions, the ion optics, the cell and an electrospray source. Figure courtesy of Dr. Michelle Sweeney.
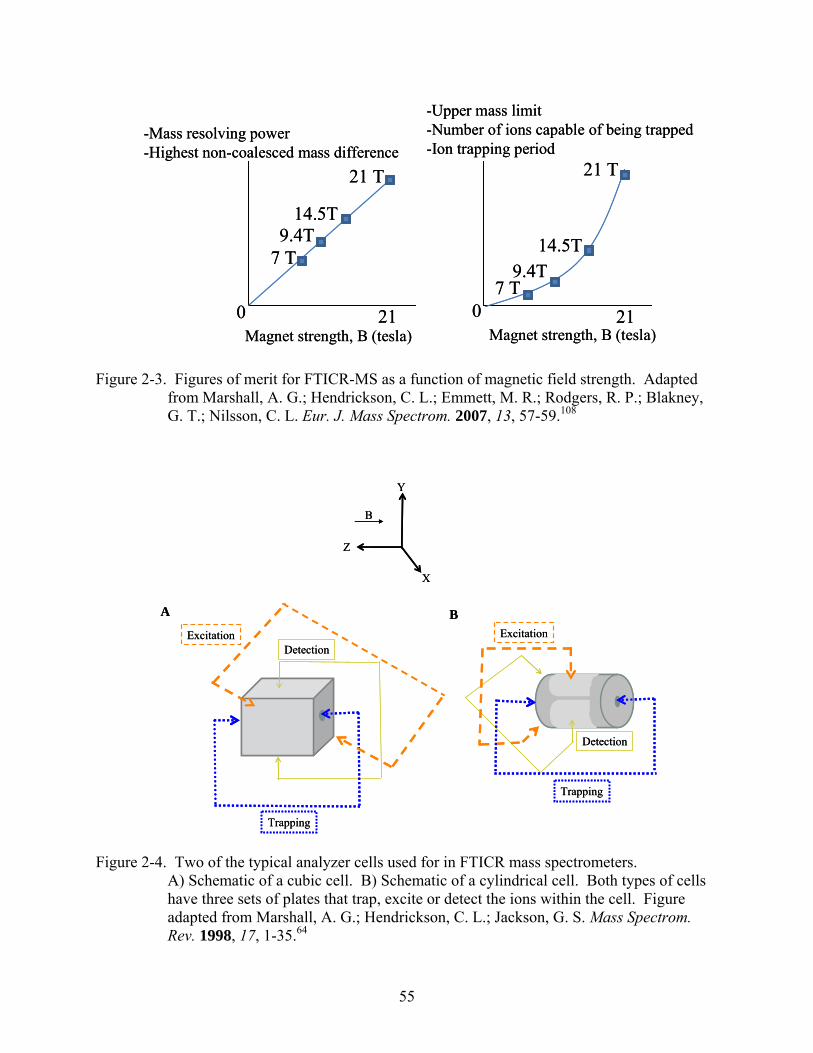
55
7 T9.4T
14.5T
21 T
0 21
-Mass resolving power-Highest non-coalesced mass difference
2107 T
9.4T14.5T
21 T
Magnet strength, B (tesla) Magnet strength, B (tesla)
-Upper mass limit-Number of ions capable of being trapped-Ion trapping period
7 T9.4T
14.5T
21 T
0 21
-Mass resolving power-Highest non-coalesced mass difference
2107 T
9.4T14.5T
21 T
Magnet strength, B (tesla) Magnet strength, B (tesla)
-Upper mass limit-Number of ions capable of being trapped-Ion trapping period
Figure 2-3. Figures of merit for FTICR-MS as a function of magnetic field strength. Adapted from Marshall, A. G.; Hendrickson, C. L.; Emmett, M. R.; Rodgers, R. P.; Blakney, G. T.; Nilsson, C. L. Eur. J. Mass Spectrom. 2007, 13, 57-59.108
Detection
Trapping
Excitation
B
Y
X
Z
Trapping
Detection
Excitation
A B
Detection
Trapping
Excitation
B
Y
X
Z
Trapping
Detection
Excitation
A B
Figure 2-4. Two of the typical analyzer cells used for in FTICR mass spectrometers. A) Schematic of a cubic cell. B) Schematic of a cylindrical cell. Both types of cells have three sets of plates that trap, excite or detect the ions within the cell. Figure adapted from Marshall, A. G.; Hendrickson, C. L.; Jackson, G. S. Mass Spectrom. Rev. 1998, 17, 1-35.64

56
Quench Ionization Excitation Detection
Time delays:InjectionEjectionReaction Repeat
Time
Quench Ionization Excitation Detection
Time delays:InjectionEjectionReaction Repeat
Time
Figure 2-5. General schematic of a typical experimental sequence. This sequence can be repeated as many times as needed.
Frequency (kHz)350300250200150100
Ab
un
dan
ce
400
350
300
250
200
150
100
50
Time150100500
Ab
un
dan
ce
0.0090.0080.0060.0050.0040.0030.001
0-0.001-0.003-0.004-0.005-0.006-0.008-0.009-0.01
A
m/z1,000900800700600500400300200
Ab
un
dan
ce
400
350
300
250
200
150
100
50
B
C
Frequency (kHz)350300250200150100
Ab
un
dan
ce
400
350
300
250
200
150
100
50
Time150100500
Ab
un
dan
ce
0.0090.0080.0060.0050.0040.0030.001
0-0.001-0.003-0.004-0.005-0.006-0.008-0.009-0.01
A
Time150100500
Ab
un
dan
ce
0.0090.0080.0060.0050.0040.0030.001
0-0.001-0.003-0.004-0.005-0.006-0.008-0.009-0.01
Time150100500
Ab
un
dan
ce
0.0090.0080.0060.0050.0040.0030.001
0-0.001-0.003-0.004-0.005-0.006-0.008-0.009-0.01
A
m/z1,000900800700600500400300200
Ab
un
dan
ce
400
350
300
250
200
150
100
50
B
C
Figure 2-6. Various domains and spectra obtained from an FTICR-MS experiment. A) The time domain transient response signal. B ) The frequency domain. C) The m/z domain.

57
m/z350349348
Ab
un
dan
ce
650
600
550
500
450
400
350
300
250
200
150
100
50
Frequency (kHz)350349348
Abundan
ce
450
400
350
300
250
200
150
100
50
128 K
Frequency (kHz)350349348
Abundan
ce
250
200
150
100
50
256 K
m/z
m/zTime9080706050403020100
0.005
0.004
0.003
0.001
0
-0.001
-0.003
-0.004
-0.005
-0.006
Time454035302520151050
0.005
0.004
0.003
0.001
0
-0.001
-0.003
-0.004
-0.005
Time150100500
0.0090.0080.0060.0050.0040.0030.001
0-0.001-0.003-0.004-0.005-0.006-0.008-0.009-0.01
m/z
512 K
Figure 2-7. Effect of number of data points acquired and Fourier transform on mass resolution. As the number of points increases, the peak width decreases and the resolution increases.
58
CHAPTER 3 INFRARED MULTIPLE PHOTON DISSOCIATION
Introduction
Several methods have been used to fragment ions in mass spectrometers. One of them is
the absorption of light, which can result in different reactions and fragmentation of ions. Two
types of light that have been used in the past for ion irradiation involve wavelengths in the
ultraviolet/visible (UV/vis) and in the infrared (IR) region of the electromagnetic spectrum.
Absorption of UV/vis light by the ions usually involves promotion to excited electronic states of
the ions, which either by direct dissociation or internal conversion to high vibrational levels of
the ground state gives rise to internal energies above the dissociation threshold of the molecule,
thereby resulting in fragmentation. Another source of light is infrared (IR) radiation, which can
result in fragmentation by inducing step-wise vibrational excitation of the molecule. Infrared
photons are less energetic (typically 0.001 to 1.7 eV/photon) than UV/vis photons (typically 2 to
approximately 8 eV/photon). Therefore, the number of IR photons needed for dissociation of a
molecule is greater than that needed with UV/vis radiation.
The invention of high-power IR lasers enabled IR light to be utilized for ion and neutral
dissociation. In the 1970’s, IR lasers were used to explore the dissociation of trapped
ions.53,109-111 These experiments and the others that shortly followed demonstrated the
phenomenon of infrared multiple photon dissociation (IRMPD) and have been reviewed in detail
by Eyler and Polfer.95,96 Such experiments include dissociation of large biomolecules that were
ionized by electrospray (ESI)45,112 and matrix assisted desorption ionization (MALDI).43,113
This chapter will discuss the mechanism by which IRMPD occurs and the various lasers
that can be used as IRMPD radiation sources.

59
Mechanism of Infrared Multiple Photon Dissociation
A polyatomic molecule or ion that is irradiated with infrared radiation can absorb the light
energy as photons. The energy of the photon is converted to vibrational energy within the
molecule or ion. Since energy is quantized, the energy absorption leads to a transition between
energy levels if the energy of the photon matches the difference between the energy level of the
molecule or ion. Figure 3-1 depicts a typical potential-energy well of a diatomic molecule.
Initially the mechanism of IRMPD was thought to proceed via a ladder-climbing mechanism in
which rotational levels compensated for the unequal spacing of the vibrational levels as one
ascends the energy well. In this mechanism, the addition of each photon sequentially between
energy levels in the potential-energy well caused the total vibrational energy of the ion to
increase as pictured in Figure 3-1. This is not the case and therefore, this step-ladder mechanism
cannot be the mechanism for IRMPD.
The actual mechanism of IRMPD involves the slow, sequential absorption of multiple
infrared photons. Once absorbed, the energy of each photon is internally redistributed until the
dissociation threshold is either met or exceeded, resulting in fragmentation of the molecule of
interest. A schematic view of this process can be seen in Figure 3-2. The first photon is
absorbed by the fundamental of the vibrational mode in question (vi =0 → vi =1). Redistribution
of the photon energy that is absorbed by a normal mode occurs by rapid intramolecular
vibrational relaxation (IVR), which distributes the photon’s energy to an assembly of other
vibrational modes within the molecule.54,114-116 If the IVR is rapid enough (ps to ns time scale),
the absorbing vibrational mode can be de-excited with enough time to allow the absorption of a
sequential photon. This process can be repeated many times until enough internal energy has
been gained by the molecule or ion so that the dissociation threshold is either met or exceeded
and the molecule or ion fragments. As the number of photons absorbed increases, so does the

60
internal energy of the molecule. After a few photons have been absorbed, the internal energy of
the ion is such that it enters a quasi-continuum. In the quasi-continuum, the vibrational levels are
closer together and are indirectly coupled to the absorbing mode, allowing for the absorption
efficiency of the molecule to increase. Once this point is reached, if there is both favorable
absorption strength and laser power then multiple absorptions (10 to 100+ photons) can occur,
leading to higher internal temperatures, thus allowing dissociation to occur more rapidly. This
mechanism has been used to explain the absorption of up to hundreds of photons for polycyclic
aromatic hydrocarbons (PAHs)117,118 and fullerenes.119,120
Lasers Used for IRMPD
R.C. Dunbar first performed an experiment demonstrating the photodissociation of gaseous
ions in an ICR cell in the early 1970’s.121 While these experiments were performed using a slide
projector as the light source and a coarse cutoff filter as the wavelength selector, many
technological advances since then have been incorporated into more complicated experiments
and, in particular, allow IRMPD to be performed quite routinely. One specific advancement is
the development of sophisticated lasers.
The first experiments with IRMPD used high-power continuous wave (cw)-tunable CO2
lasers, but there are several other types of lasers that can be used for irradiation. All lasers
consist of a gain medium that is contained within a highly reflective optical cavity.122
Amplification of the light occurs when photons are passed through the gain medium and
stimulated emission of radiation takes place. It is this amplification from which the laser gets its
power. At one end of the cavity there is a small opening or partially reflective mirror through
which a low percentage of the light can pass creating the output beam of the laser. While the
general idea of a laser is simple, there are several types of lasers each having its own
methodology for creating light. Such laser systems include optical parametric

61
oscillators/amplifiers (OPO/OPA), tunable CO2 lasers and free electron lasers (FELs). The
research reported in this dissertation used both a cw-tunable CO2 laser and a FEL.
The first type of laser used in this research was a continuous wave CO2 laser. Carbon
dioxide lasers use a gas gain medium which contains carbon dioxide, helium, nitrogen and
sometimes a small amount of hydrogen, water vapor and/or xenon.123 Typically, CO2 lasers are
electrically pumped by a gas discharge. Nitrogen molecules are excited by this discharge into a
higher vibrational level. Once excited, the nitrogen molecules transfer their energy to the CO2
molecules that collide with them. The helium in the mixture serves as a depopulator, lowering
the laser power and removing the heat. Non-tunable CO2 lasers typically emit at a wavelength of
10.6 μm and tunable-CO2 lasers have outputs in the region of 9.2 to 10.8 μm, which corresponds
to the stretching frequency of C-O bonds. The laser power available for CO2 lasers can be from
a few watts to several hundred watts. The benefit of CO2 lasers, especially tunable lasers, is that
they are affordable bench-top lasers. The major drawback to tunable-CO2 lasers is that only a
limited wavelength range can be explored.
Free electron lasers are laser systems that not only are large and complex, but also are
expensive.124-126 For this reason, FELs are generally located in national laboratories. The
amplification and wavelength range of FELs is achieved through the use of an undulator. In the
undulator, the placement of magnets with alternating polarities, as seen in Figure 3-3, allows free
electrons to be accelerated, resulting in the release of photons. The spacing of the magnets
within the undulator and the energies of the electrons dictates the wavelength of the photons
being released. The released photons results in coherent light that can then be used in various
ways. The irradiation is composed of 5 to 20 macropulses (composed of hundreds of high-power
micropulses spaced 1 ns apart).127 The macropulses are delivered to the user station at a rate of 5

62
to 10 Hz. While the power of each micropulse is in the MWatt range, each macropulse has an
average energy of ~30 to 50 mJ. The major benefit of FELs is that they allow access to
wavelengths (~5 to 250 μm), that correspond to most of the “chemically interesting” infrared
wavelength range, much wider than a CO2 laser can achieve. The major drawback of FELs is
that they are very costly and access to beam time is limited since they are generally housed in
national facilities with many users applying for beam time.
Several FELs have been coupled with Fourier transform ion cyclotron resonance (FTICR)
mass spectrometers. Examples include the Free Electron Laser for Infrared
eXperiments (FELIX)127 at the FOM-Institute for Plasma Physics Rijnhuizen in The Netherlands,
the Centre Laser Infrarouge Orsay (CLIO)71 facility in Orsay, France and the FEL at the Science
University of Tokyo (SUT).70 The research done in this dissertation with IR photons from a FEL
was performed at FELIX. Figure 3-4 shows a schematic of the laser instrumentation of the
FELIX facility. Two lasers, FEL-1 and FEL-2 give FELIX its wide wavelength range
capability.127 Accelerator 1 allows FEL-1 to access wavelengths from 25 to 250 μm. When the
two accelerators are used in conjunction with each other, FEL-2 can access wavelengths from 5
to 30 μm. The free electrons are accelerated to either 15 to 25 or 25 to 45 MeV by one or two
radio-frequency linear accelerators. An undulator is used, where the positioning of samarium-
cobalt permanent magnets tunes the wavelength of the laser beam. The resonator of the laser is
defined by two gold-plated copper mirrors. The FELIX is a pulsed laser composed of micro and
macro-pulses. The micropulses are spaced 1 ns apart and have a duration of 3 to 6 ps.
Macropulses are possible for a duration up to 20 μs at a rate of 5 Hz or 10 Hz.
All lasers have their benefits and drawbacks. For this dissertation the relatively
inexpensive and technically simple wavelength-tunable CO2 laser was used for a majority of the

63
work. Although access to FELIX beam time is limited, some shifts were available, so some of
the research reported here was also done in The Netherlands. Use of both a FEL and CO2 laser
gave a plethora of information that neither laser alone would have provided.

64
v=0
v=1
v=2
v=3
v=4
v=5
j=1j=0 v=0
v=1
v=2
v=3
v=4
v=5
j=1j=0
Figure 3-1. Energy potential well. As one moves up the well, the spacing of the vibrational levels decreases.
v=0 v=0
v=1
v=2
v=3
v=4
v=5
v=0
v=1
v=2
v=3
v=4
v=5
IVRIVR
Dissociation threshold
IVR
v=2
v=3
v=4
v=5
v=1
v=0 v=0
v=1
v=2
v=3
v=4
v=5
v=0
v=1
v=2
v=3
v=4
v=5
IVRIVR
Dissociation threshold
IVR
v=2
v=3
v=4
v=5
v=1
Figure 3-2. Depiction of the IRMPD mechanism in polyatomic molecules. One photon of IR radiation is absorbed, its energy is then distributed into an array of vibrational modes through IVR. This process is repeated until the dissociation threshold is met or exceeded, resulting in the fragmentation of the molecule.

65
N
N
N
N
N
N
N
S
S
S
S
S
S
S
Electron beam
Released photons
N
N
N
N
N
N
N
S
S
S
S
S
S
S
Electron beam
Released photons
Figure 3-3. Schematic of an undulator used for FELs. Here a beam of free electrons enters the undulator and magnets of alternating polarities forces the electrons to travel in an oscillating path, resulting in the release of photons. The photons combine coherently to give the final beam of light.
Electron Injector Accelerator 1 Accelerator 2
Undulator 1
Undulator 2
FEL 1
FEL 2
Electron Injector Accelerator 1 Accelerator 2
Undulator 1
Undulator 2
FEL 1
FEL 2
Figure 3-4. Layout schematic of FELIX. Two accelerators and FELs are used to give FELIX its continuous wavelength range. Figure adapted from Oepts, D.; van der Meer, A. F. G.; van Amersfoort, P. W. Infrared Phys. Technol. 1995, 36, 297-308.127

66
CHAPTER 4 DIFFERENTIATION OF MONOSACCHARIDES IN THE POSITIVE ION MODE BY
IRMPD WITH A TUNABLE CO2 LASER
Introduction
As described in chapter 1, monosaccharides are the smallest of all the sugar units and play
an important role in biological systems. Past mass spectrometric methods have used soft
ionization techniques such as fast atom bombardment (FAB), electrospray ionization (ESI) and
matrix assisted laser desorption ionization (MALDI) to analyze monosaccharides in the positive
ion mode.128-132 Gaucher and Leary showed that metal ions complexed with various
monosaccharides can be used to differentiate the anomeric configuration of monosaccharides.128
They used electrospray ionization (ESI) and collision induced dissociation (CID) to identify and
differentiate hexoses (glucose and mannose) that were derivatized with
zinc (diethylenetriamine). Other adducts that have been used for the differentiation of anomers
and include copper (II)131, ammonium133, lead134 and sodium135. All these past research methods
have utilized fragments produced by CID to distinguish the identity of the monosaccharides and
derivatives being studied.
Infrared multiple photon dissociation (IRMPD) is another fragmentation method that gives
different, but complementary fragments to those produced by CID. Jose Valle used irradiation
by a free electron laser (FEL) to fragment rubidium- and potassium-attached monosaccharides.
Monitoring the dissociation of the various ions over a range of wavelengths showed differences
in the IRMPD spectra which were used to differentiate positively charged saccharide isomers
and anomers.74
As described in chapter 3, line-tunable CO2 lasers, when compared to FELs, have a limited
wavelength range. Although the wavelength is limited, the cost of a line tunable CO2 laser is far
less than that of a FEL. Therefore, use of a tunable CO2 laser in this work makes the method

67
developed here more affordable and accessible to other laboratories. This chapter will discuss
IRMPD research done at the University of Florida on lithiated O-methyl-gluco- and
galactopyranoside monosaccharides anomers in the positive ion mode using a CO2 laser.
Procedure
Each of the monosaccharides was prepared at a concentration of 0.1 mM in 80:20
general-use grade methanol to MilliQ ultra-pure H2O solution containing 0.1 mM LiCl. The
monosaccharides used in these studies were obtained from Dr. Brad Bendiak at the Department
of Cellular and Structural Biology, University of Colorado Health Sciences Center. Their
structures are seen in Figure 4-1 and include α-O-methyl-glucopyranoside,
β-O-methyl-glucopyranoside, α-O-methyl-galactopyranoside and β-O-methyl-galactopyranoside.
A schematic of the instrumental set-up is shown in Figure 4-2. The lithiated
monosaccharides were ionized with a commercial ESI source (Analytica of Branford, Branford,
CT, USA). The capillary of this source has been user modified136,137 with a conical capillary138
inlet to increase ion introduction into the mass spectrometer. For these experiments, the capillary
was set to temperatures between 120 and 125°C. The flow rate for all experiments was 15 μL/hr.
All experiments were performed on a Bruker 47e Fourier transform ion cyclotron
resonance (FTICR) mass spectrometer (Bruker Daltonics; Billerica, MA, USA) with a 4.7 T
superconducting magnet (Magnex Scientific Ltd.; Abington, UK) and an InfinityTM cell
(Figure 4-2).139 Precursor ions were isolated using a stored waveform inverse Fourier transform
(SWIFT)85 and irradiated for 1 second with a Lasy-20G tunable CO2 laser (Access Laser Co.;
Marysville, WA, USA). This laser has a power range of 0-20 W with a wavelength range of 9.2
to 10.8 μm. Typical laser powers for the experiments described in this chapter were
approximately 0.7 W, but were occasionally as high as 3 W to overcome the effects of slight
laser misalignment.

68
To facilitate fragmentation and increase signal intensity, ions were accumulated in the
hexapole for a period of 1.0-1.5 seconds. This accumulation period was kept constant
throughout all experiments when comparing monosaccharide anomeric pairs. Irradiation with
the CO2 laser was facilitated by a mechanical mirror. When the mechanical mirror was in one
position, the laser beam was blocked and directed into a power meter. When the mirror was in
the other position, the beam was passed into the back of the FTICR cell through a ZnSe window.
No internal mirrors were used, therefore there was only one pass of the laser beam through the
ion cloud within the cell. The wavelengths used were determined based on the stability and
power stated in the laser manual, where wavelengths with excellent stability and high power
were chosen. Each day, two sets of twenty-five scans of 512 K data points were collected and
averaged at each wavelength. All experiments were repeated at least once, several days apart.
Significance of results reported here is based on the 95% confidence interval of the mean.140
Reproducibility
Since variations in the alignment of the laser and the abundance of ions within the cell
change the amount of fragmentation observed, a method for calibrating the overall power of the
laser beam actually irradiating the was needed. To ensure reproducibility, the total number of
ions and irradiation power were kept constant throughout the day. The laser power used daily
was found by determining the power needed to keep a ratio of 1.26 ± 0.04 for the m/z 127 to
m/z 201 fragment ions of lithiated β-O-methyl-glucopyranoside at an irradiation wavelength of
9.588 μm. Once the power needed for this ratio was found, it was used throughout the day. The
power was monitored for each experiment with a power meter and adjustments were made to the
CO2 control electronics as needed to keep the power constant.
Due to slight variations in laser alignment as well as the cell heating during the course of
the day, even with a daily calibration, some variance in the fragmentation was seen. Also, the

69
inherent fluctuation of ion production by the ESI process could have added to the observed
variances. The method of calibration described in the last paragraph was settled upon after
several other methods were tried. Preliminary attempts kept the percent dissociation of the
precursor ion (m/z 201) constant for β-O-methyl-glucopyranoside at 9.588 μm and then used that
laser power for the day. While both methods of calibration resulted in similar ratios for the
abundances of key fragment ions (mainly m/z 109 and m/z 127), using the ratio of m/z 127 to
m/z 201 daily gave a smaller relative error, better reproducibility and finer control over the
energy imparted to the system. The fragment ion at m/z 127 was used for the calibration because
its appearance and disappearance changed significantly when compared to that of the precursor
ion (m/z 201) as a function of laser power.
Results and Discussion
Methyl-glucopyranosides
Anomers of O-methyl-glucopyranoside were first studied. Since monosaccharides can
open up into the chain form and then close again, permitting interconversion between the
different anomers, use of O-methylated monosaccharides insured that the anomer under study
was locked in its closed conformation and therefore could not interconvert. The fragmentation
patterns were obtained by using a CO2 laser to irradiate both the α- and β- anomers of
O-methyl-glucopyranoside. At each wavelength the percent abundance of each fragment was
determined by the following formula:
100AbundancePrecursor AbundanceFragment
AbundanceFragment abundancepercent Relative
. (4-1)
This percent abundance was plotted for each fragment over the range of 9.2 to 10.8 μm as a
function of both mass and wavelength. The major fragments for both anomers were m/z 67, 81,
91, 97, 109, 127, 141, 151 and 169, as seen in Figure 4-3. The fragmentation patterns of the

70
α- and β-anomers proved to be different as seen in Figure 4-3. Specifically, the relative percent
abundance of key fragments such as m/z 91, 109 and 127 appeared to be significantly different
for the anomers. The abundance of m/z 109 was always higher for α-O-methyl-glucopyranoside
than for β-O-methyl-glucopyranoside. Also, the relative percent abundance for m/z 127 was
always significantly higher for the β-anomer than the α-anomer. These fragments are key
identifying fragments and allow for easy discrimination between the two anomers.
The IRMPD spectra of these ions showed that using disappearance of the precursor ion to
distinguish between the α- and β-anomer is impossible. As seen in Figure 4-4, there are several
wavelengths at which the percent abundances of the remaining precursor ion signal overlap for
these anomers. These wavelengths include 9.230, 9.250, 9.305, 9.473, 9.448, 9.520, 9.675 and
9.7 to 10.8 μm. The power needed to fragment β-O-methyl-glucopyranoside to obtain a ratio of
1.26 ± 0.04 for m/z 127 to m/z 201 at 9.588 μm, was far less than the power that was needed for
fragmentation of either anomer at wavelengths 9.7-10.8 μm. Figure 4-5 demonstrates the
fragmentation efficiency at the two wavelengths 9.588 and 10.611 μm. While fragmentation at
the higher wavelength is possible, it requires longer irradiation times and/or higher laser power.
Typical laser power needed to fragment at the lower wavelengths was approximately 0.70 W, but
to obtain any fragmentation at the higher wavelengths (on the same day with the same alignment
and number of ions in the cell) required more than 3 W.
Since the IRMPD depletion spectra of the precursor ion was found to be of little help in
distinguishing the anomers, comparing the percent abundances of m/z 109 and m/z 127 fragments
for O-methyl-glucopyranosides allowed for the different anomers to be distinguished, Figure 4-6.
The ratio of m/z 109 to m/z 127 was always higher for the α-anomer than for the β-anomer.
While the values changed slightly at the different wavelengths, the α-anomer always produced a

71
value that was greater than one and the β-anomer gave values that were less than one. The
greater abundance of the smaller fragments and the larger depletion of the parent ion indicate
that the α-anomer of O-methyl-glucopyranoside requires less energy for fragmentation than
β-O-methyl-glucopyranoside.
Unknown Study of Methyl-glucopyranosides
To demonstrate the ability to differentiate isomers of glucopyranosides by the developed
method, a single-blind test was performed for two samples each of α- and
β-O-methyl-glucopyranoside. Representative spectra taken at 9.588 μm are shown in
Figure 4-7 A and B. These unknowns were identified based on their fragmentation patterns.
Figure 4-7 A has a greater m/z 109 to m/z 127 and a relatively small amount of m/z 169 in
comparison to the unknown seen in Figure 4-7 B. Both methyl-glucopyranosides were positively
identified based solely on their spectra.
Methyl-galactopyranosides
This fragmentation procedure was then applied to another hexoses anomer pair, α- and
β-O-methyl-galactopyranoside. To compare the results of the O-methyl-glucopyranosides with
the O-methyl-galactopyranosides, a daily calibration with the β-O-methyl-glucopyranoside was
performed at 9.588 μm. This ensured that the same amount of power was used for each anomer.
For these studies, experiments were performed twice about a week and a half apart. Figure 4-8
shows the resulting fragmentation pattern of the O-methyl-galactopyranosides as a function of
wavelength and mass.
One key difference in the fragmentation patterns of α- and β-O-methyl-galactopyranoside
was the significantly greater abundance of the m/z 121 fragment ion for the β-anomer as
compared to that seen for the α-anomer. Also, the ratio of m/z 169 to m/z 151 proved to be
useful in the identification of the α- and β-anomers, as shown in Figure 4-9 for wavelengths 9.2

72
to 9.7 μm. The abundance ratio of m/z 169 to m/z 151 was always less than 5 for
β-O-methyl-galactopyranoside and was always greater than 5 for the α-anomer.
When comparing Figure 4-3 to Figure 4-8, several differences in the fragmentation
patterns of the methyl-gluco- and galactopyranosides are apparent. For example, m/z 109, 127,
151 and 169 are key fragment ions whose relative percent abundances vary for the gluco- and
galactopyranosides. Comparing Figure 4-3 to Figure 4-8, one can see that the abundances of
m/z 169 are greater for both methyl-galactopyranosides than for the methyl-glucopyranoside
anomers, while the abundances of m/z 109 and m/z 127 are lower for the
methyl-galactopyranosides than for the methyl-glucopyranosides. Using these differences in
fragmentation patterns the gluco- and galactopyranosides can be distinguished from each other.
Unknown Study of both Methyl-gluco- and galactopyranosides
To test the method described above for differentiating both α- and β- anomers of both the
gluco-and galactopyranosides, a single-blind study was performed. For this study, two samples
each of α-, β-O-methyl-glucopyranoside and α-, β-O-methyl-galactopyranoside were randomized
and their identity concealed. The unknowns were then analyzed individually at wavelengths of
9.230, 9.473 and 9.588 μm.
The identities of the unknown samples were then determined using the flowchart shown in
Figure 4-10. Similar spectra to those shown in Figure 4-7 A and B were obtained for α- and
β-O-methyl-glucopyranoside. Spectra obtained for the galactopyranosides are shown in
Figure 4-11 A and B. As displayed in Figure 4-11 A, there was a relatively small abundance of
m/z 109 and m/z 127 and a high abundance of m/z 169, identifying this unknown as one of the
galactopyranoside anomers. Comparing the spectrum in Figure 4-11 A to the spectrum in
Figure 4-11 B, there is a higher ratio of m/z 127 to m/z 109 and very little m/z 151. The lack of
m/z 121 and the ratio of 8.9 for m/z 169 to m/z 151 positively identify this unknown as

73
α-methyl-galactopyranoside. This identification was confirmed with the fragmentation seen
when the unknown was irradiated with a higher laser power. For the next unknown, whose
spectrum is seen in Figure 4-11 B, the ratio of m/z 169 to m/z 151 of 3 and the appearance of
m/z 121 made it clear that the identity of this unknown was β-O-methyl-galactopyranoside. All
of the eight unknown samples were correctly identified in a similar way.
In order to simulate a real-life laboratory environment, no calibration of laser power was
done before the unknown studies reported in the last paragraph. Although various laser powers
were used for the unknown studies, the precursor ion was never depleted. In general, higher
powers were needed for O-methyl-galactopyranosides since they fragmented less than the
O-methyl-glucopyranosides. For example, the methyl-glucopyranosides that produced the
spectra seen in Figure 4-7 A and B were both irradiated with 2.61 W and the
methyl-galactopyranosides that produced the spectra seen in Figure 4-11 A and B were irradiated
with 3.98 and 4.33 W, respectively.
Conclusions
Use of a tunable CO2 laser produced unique fragmentation patterns for anomers of
O-methyl-glucopyranoside and O-methyl-galactopyranoside over the wavelength range of 9.2 to
9.7 μm. Various fragment ions and their ratios were used to differentiate between the two sets of
monosaccharides (O-methyl-galactopyranoside and O-methyl-glucopyranoside) anomers. Since
only two monosaccharides were studied, future work should include other hexoses.

74
O
H
HO
H
HO
H
H
OHHOCH3
OH
O
OH
H
H
HO
H
OCH3
OHHH
OH
O
OH
H
H
HO
H
H
OHHOCH3
OH
O
H
HO
H
HO
H
OCH3
OHHH
OH
Alpha-methyl-glucopyranoside Beta-methyl-glucopyranoside
Alpha-methyl-galactopyranoside Beta-methyl-galactopyranoside
Figure 4-1. Structures of the O-methylated monosaccharides discussed in this chapter.
CO2 LaserM1
M2Salt
window
Power meter
Wavemeter
Mirror gate
M3
Laser table
M4
M5 Iris ZnSewindow
Source
4.7 T Bruker Mass Spectrometer
Infinity cell
CO2 LaserM1
M2Salt
window
Power meter
Wavemeter
Mirror gate
M3
Laser table
M4
M5 Iris ZnSewindow
Source
4.7 T Bruker Mass Spectrometer
Infinity cell
Figure 4-2. Experimental set up of the 4.7 T FTICR mass spectrometer. When the mechanical mirror M3 is down the laser beam passes through the ZnSe window into the cell. If the mechanical mirror up the laser beam is blocked from entering the cell and reflected into the power meter.

75
Figure 4-3. Wavelength-dependent fragmentation patterns for the lithiated O-methyl-glucopyranosides for wavelength from 9.2 to 10.8 μm. A) Lithiated α-O-methyl-glucopyranoside. B) Lithiated β-O-methyl-glucopyranoside.

76
Figure 4-4. Infrared multiple photon dissociation depletion spectra of the precursor ions (m/z 201) for both α- and β-O-methyl-glucopyranoside – lithium cation complexes.
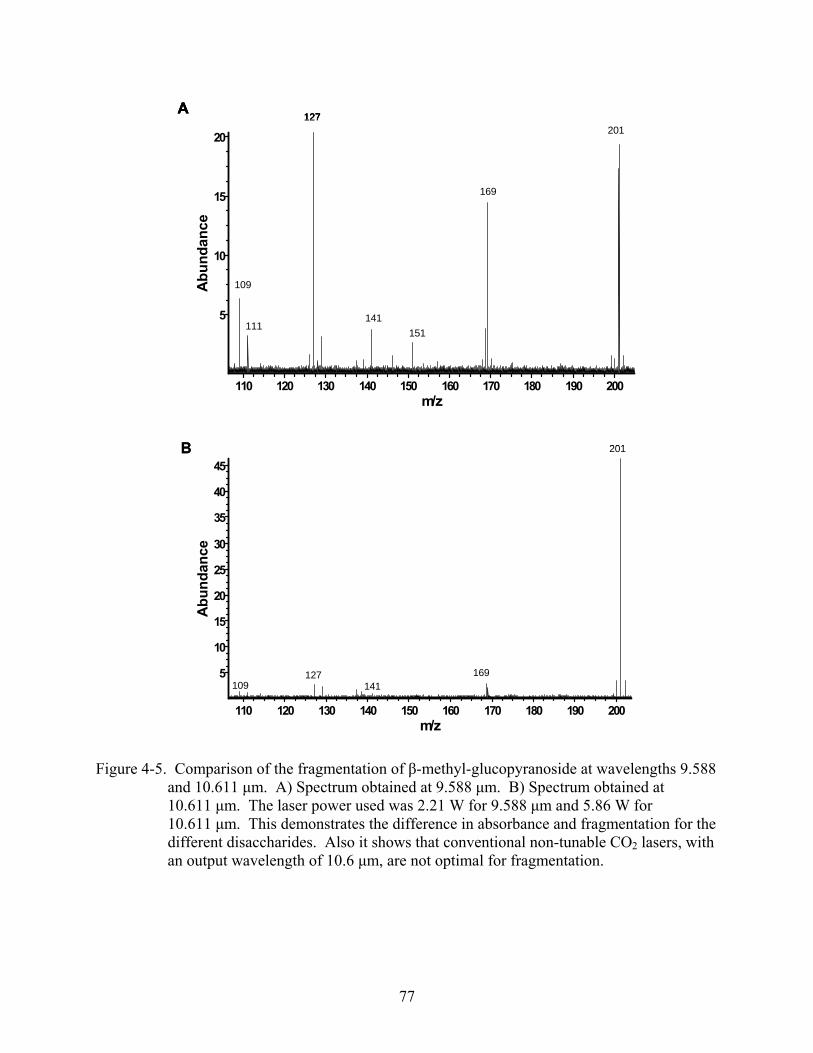
77
m/z200190180170160150140130120110
Ab
un
dan
ce
20
15
10
5
201
169
151
141
127
109
A
111
m/z200190180170160150140130120110
Ab
un
dan
ce
20
15
10
5
201
169
151
141
127
109
A
m/z200190180170160150140130120110
Ab
un
dan
ce
20
15
10
5
201
169
151
141
127
109
m/z200190180170160150140130120110
Ab
un
dan
ce
20
15
10
5
201
169
151
141
127
109
A
111
m/z200190180170160150140130120110
Ab
un
dan
ce
45
40
35
30
25
20
15
10
5
201
169141
127109
B
m/z200190180170160150140130120110
Ab
un
dan
ce
45
40
35
30
25
20
15
10
5
201
169141
127109
B
Figure 4-5. Comparison of the fragmentation of β-methyl-glucopyranoside at wavelengths 9.588 and 10.611 μm. A) Spectrum obtained at 9.588 μm. B) Spectrum obtained at 10.611 μm. The laser power used was 2.21 W for 9.588 μm and 5.86 W for 10.611 μm. This demonstrates the difference in absorbance and fragmentation for the different disaccharides. Also it shows that conventional non-tunable CO2 lasers, with an output wavelength of 10.6 μm, are not optimal for fragmentation.

78
Figure 4-6. Relative percent abundance of fragment ions for both lithiated α- and β-O-methyl-glucopyranosides over the wavelength range from 9.201 to 9.675 μm. A) Relative percent abundance of product ion m/z 109. B) Relative percent abundance of product ion m/z 127. C) The ratio of m/z 109 to m/z 127.

79
m/z200150100
Ab
un
dan
ce
150140130120110100908070605040302010
67
91
97
109
127141 151
169
201
A
79
81
m/z200150100
Ab
un
dan
ce
150140130120110100908070605040302010
67
91
97
109
127141 151
169
201
A
m/z200150100
Ab
un
dan
ce
150140130120110100908070605040302010
67
91
97
109
127141 151
169
201
A
79
81
m/z200150100
Ab
un
dan
ce
150140130120110100908070605040302010 67
91
97
109
127
141151
169
201B
7981
m/z200150100
Ab
un
dan
ce
150140130120110100908070605040302010 67
91
97
109
127
141151
169
201B
m/z200150100
Ab
un
dan
ce
150140130120110100908070605040302010 67
91
97
109
127
141151
169
201
m/z200150100
Ab
un
dan
ce
150140130120110100908070605040302010
m/z200150100
Ab
un
dan
ce
150140130120110100908070605040302010 67
91
97
109
127
141151
169
201
67
91
97
109
127
141151
169
201B
7981
Figure 4-7. Spectra of unknowns in single blind study of methyl-glucopyranosides at wavelength 9.588 μm. A) Spectrum of α-O-methyl-glucopyranoside. B) Spectrum of β-O-methyl-glucopyranoside.

80
Figure 4-8. Fragmentation patterns over the wavelengths from 9.2 to 10.6 μm. A) Lithiated α-O-methyl-galactopyranoside. B) Lithiated β-O-methyl-galactopyranoside.

81
Figure 4-9. Ratio of m/z 169 to m/z 151 for α- and β-O-methyl-galactopyranoside.
m/z 169 > m/z 91,109,127,151
yes no
α-O-methyl-galactopyranosideβ-O-methyl-galactopyranoside
α-O-methyl-glucopyranosideβ-O-methyl-glucopyranoside
> 5 < 5 > 1 < 1
m/z 169/151 m/z 109/127
α-O-methyl-galactopyranoside β-O-methyl-galactopyranoside α-O-methyl-glucopyranoside β-O-methyl-glucopyranoside
m/z 169 > m/z 91,109,127,151
yes no
α-O-methyl-galactopyranosideβ-O-methyl-galactopyranoside
α-O-methyl-glucopyranosideβ-O-methyl-glucopyranoside
> 5 < 5 > 1 < 1> 1 < 1
m/z 169/151 m/z 109/127
α-O-methyl-galactopyranoside β-O-methyl-galactopyranoside α-O-methyl-glucopyranoside β-O-methyl-glucopyranoside
Figure 4-10. Decision flowchart used to identify the different monosaccharide anomers.

82
m/z200150100
Ab
un
dan
ce
50
45
40
35
30
25
20
15
10
5
67 91 109
111
127
141 151
169
201
97
A
79
m/z200150100
Ab
un
dan
ce
50
45
40
35
30
25
20
15
10
5
67 91 109
111
127
141 151
169
201
97
A
79
m/z200150100
Ab
un
dan
ce
150
100
5067
91109
111
127
141
151
169
201
97121
B
8179
m/z200150100
Ab
un
dan
ce
150
100
5067
91109
111
127
141
151
169
201
97121
B
8179
Figure 4-11. Spectra of unknowns identified as galactopyranosides in single blind study
obtained at wavelength 9.588 μm. A) Spectrum of α-O-methyl-galactopyranoside. B) Spectrum of β-O-methyl-galactopyranoside.

83
CHAPTER 5 DIFFERENTIATION OF DISACCHARIDES IN THE POSITIVE ION MODE WITH A
TUNABLE CO2 LASER
Introduction
The structure of carbohydrates dictates their biological function. This includes the
monosaccharide sequence, the anomeric configuration and the linkage between the
monosaccharides within the oligosaccharides, which are the carbohydrate building blocks. Since
various linkages and anomeric configuration are possible, being able to differentiate the smaller
oligosaccharides that compose the larger carbohydrates is a complicated task. As described in
chapter 1, disaccharides are the smallest saccharide units that contain the glycosidic bond. The
anomeric configuration of this bond can play an important role in the function of the saccharide.
In the past, collision induced dissociation (CID)60,141 and infrared multiple photon
dissociation (IRMPD)62,73,142 have been used for fragmentation of saccharides, in particular
disaccharides. Past experiments by Polfer et al. examined fragmentation patterns of lithiated
disaccharides with the Free Electron Laser for Infrared eXperiments (FELIX) at the
FOM-Institute for Plasma Physics Rijnhuizen in the Netherlands.73 They found that isomeric
ions with various linkages had different fragmentation patterns. They also found that the
intensity ratio of specific fragments (m/z 169/187) was higher for β-anomers than for α-anomers
and may be used to differentiate the anomeric configuration of the disaccharides. Although the
fragmentation and some ratios were explored, there was no attempt to quantitatively ascertain the
anomeric configuration.
This chapter describes attempts to develop a method for the differentiation of lithiated
disaccharides. Wavelength-selective fragmentation of glucose-containing disaccharide anomers
was performed by IRMPD with a tunable CO2 laser, and differentiation of the disaccharides was

84
based on their fragmentation patterns and ratios of the relative abundances of specific fragment
ions.
Procedure
All work described in this chapter was performed with the instrumental set-up described in
chapter 4. Each of the disaccharides was prepared as a 0.10 mM solution which also contained
0.10 mM LiCl. To aid in ionization, the solvent was composed of an 80:20 ratio of general-use
grade methanol to MilliQ ultra-pure H2O. The disaccharides used in these studies were obtained
from Dr. Brad Bendiak at the Department of Cellular and Structural Biology, University of
Colorado Health Sciences Center, and were composed of two glucose units having varying
linkages and anomeric configurations: kojibiose (α1-2), sophorose (β1-2), nigerose (α1-3),
laminaribiose (β1-3), maltose (α1-4), cellobiose (β1-4), isomaltose (α1-6) and
gentiobiose (β1-6).
Fragmentation Study
For each lithiated disaccharide, the precursor ion (C12O22H11Li+, m/z 349) was produced by
electrospray ionization (ESI) and isolated via a stored waveform inverse Fourier
transform (SWIFT). The isolated precursor ion was irradiated for 1 second using a laser power
determined by a daily calibration involving the precursor ion of sophorose (β1-2). This ion was
fragmented to obtain an m/z 349:229 intensity ratio of 1.04 ± 0.16. The laser power required to
achieve this ratio was then used for the remainder of the experiments over the wavelength range
from 9.2 to 9.7 μm.
For each disaccharide, three data sets composed of 15 scans of 512 K points were collected
and averaged at each wavelength. To test reproducibility, the entire fragmentation pattern of
sophorose was obtained once on two separate days. Once fragmented, all the relative percent
abundances of the fragments were calculated and correlated with the disaccharide linkage.
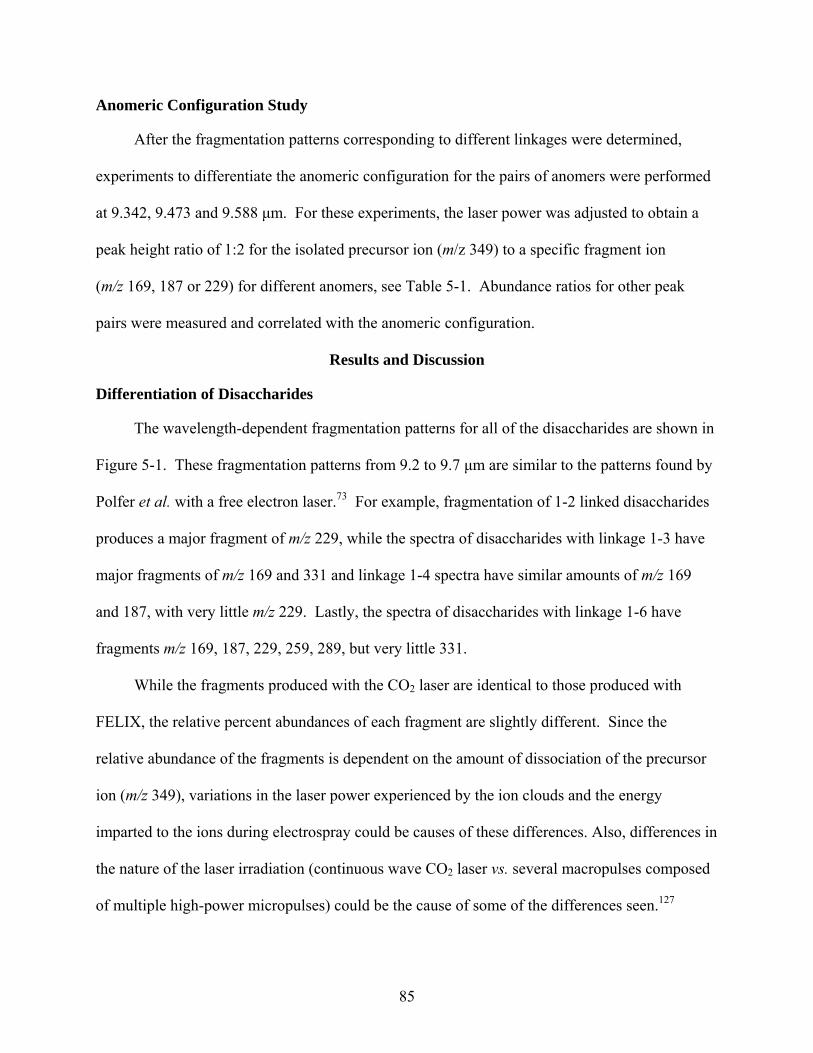
85
Anomeric Configuration Study
After the fragmentation patterns corresponding to different linkages were determined,
experiments to differentiate the anomeric configuration for the pairs of anomers were performed
at 9.342, 9.473 and 9.588 μm. For these experiments, the laser power was adjusted to obtain a
peak height ratio of 1:2 for the isolated precursor ion (m/z 349) to a specific fragment ion
(m/z 169, 187 or 229) for different anomers, see Table 5-1. Abundance ratios for other peak
pairs were measured and correlated with the anomeric configuration.
Results and Discussion
Differentiation of Disaccharides
The wavelength-dependent fragmentation patterns for all of the disaccharides are shown in
Figure 5-1. These fragmentation patterns from 9.2 to 9.7 μm are similar to the patterns found by
Polfer et al. with a free electron laser.73 For example, fragmentation of 1-2 linked disaccharides
produces a major fragment of m/z 229, while the spectra of disaccharides with linkage 1-3 have
major fragments of m/z 169 and 331 and linkage 1-4 spectra have similar amounts of m/z 169
and 187, with very little m/z 229. Lastly, the spectra of disaccharides with linkage 1-6 have
fragments m/z 169, 187, 229, 259, 289, but very little 331.
While the fragments produced with the CO2 laser are identical to those produced with
FELIX, the relative percent abundances of each fragment are slightly different. Since the
relative abundance of the fragments is dependent on the amount of dissociation of the precursor
ion (m/z 349), variations in the laser power experienced by the ion clouds and the energy
imparted to the ions during electrospray could be causes of these differences. Also, differences in
the nature of the laser irradiation (continuous wave CO2 laser vs. several macropulses composed
of multiple high-power micropulses) could be the cause of some of the differences seen.127

86
As seen in Figure 5-1, fragmentation of the precursor ion over a range of wavelengths from
9.2 to 9.7 μm gave fragmentation patterns unique for each of the disaccharides. The wavelength
of fixed-frequency CO2 lasers (10.6 μm) was also explored, but very little (if any) fragmentation
was seen for the eight disaccharides. Either longer irradiation times and/or much higher laser
power were needed to see the little fragmentation that was observed. This result is consistent
with those found by Polfer et al. in which the fragmentation of the lithiated disaccharides
dramatically declined around 10.6 μm.73 Furthermore, this research shows that the typical
wavelength of non-tunable CO2 lasers is not optimal for differentiation of the various
disaccharides.
The flowchart in Figure 5-2 shows that the presence and absence of a certain fragment
makes determination of the different linkages possible. For example, if the dissociation
spectrum contains the fragments m/z 331 and m/z 289, but not the m/z 259 fragment, the linkage
can be identified as 1-4. Similar patterns can be specified for each of the different disaccharides
that were studied. While the linkage can be determined by the presence or absence of certain
fragments alone, more information is needed to identify the anomeric configuration.
Determination of the Anomeric Configurations
To determine the anomeric configurations, additional experiments were performed at three
wavelengths (9.342, 9.473 and 9.588 μm) in which the m/z 349 precursor ion was dissociated
with sufficient laser power to decrease its abundance to one half that of a fragment ion specified
in Table 5-1. Using this laser power, the ratios of the relative percent abundances of other
fragment ions were measured and used to identify the anomeric configuration, as shown in
Figure 5-3. For example, if the fragmentation pattern indicated that the linkage was 1-4, the
precursor ion was then irradiated to give a ratio of 1:2 for m/z 349 to m/z 187. The ratio of two
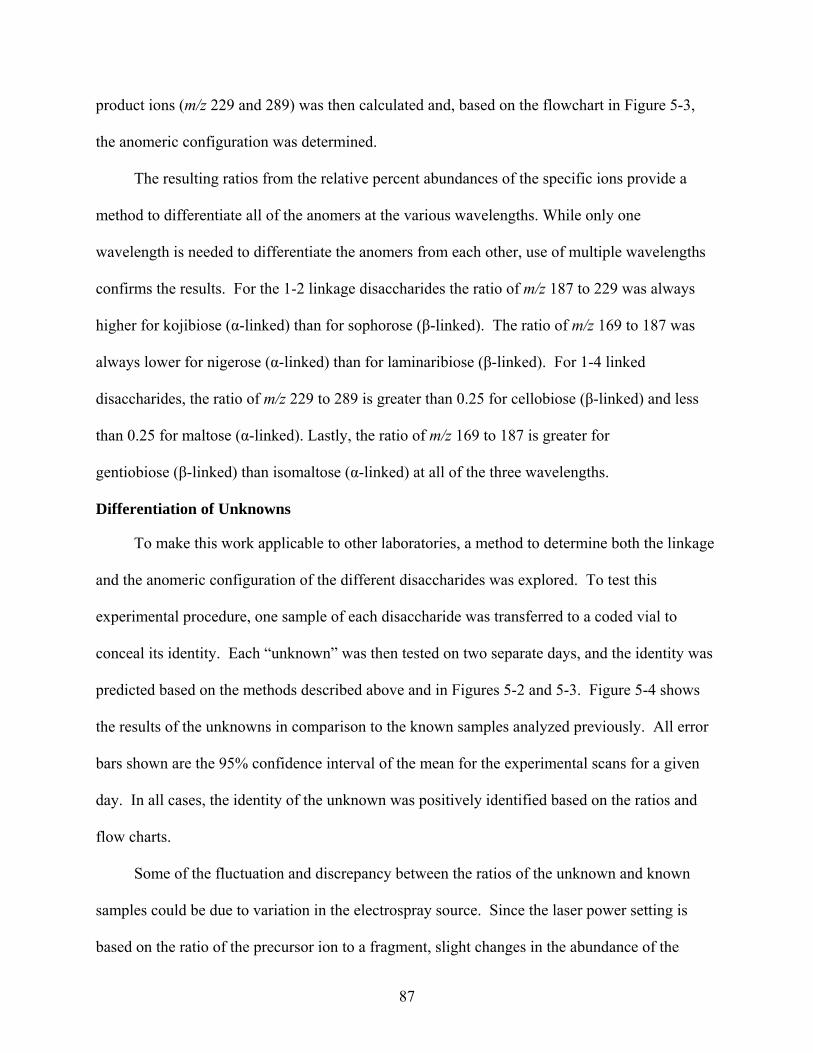
87
product ions (m/z 229 and 289) was then calculated and, based on the flowchart in Figure 5-3,
the anomeric configuration was determined.
The resulting ratios from the relative percent abundances of the specific ions provide a
method to differentiate all of the anomers at the various wavelengths. While only one
wavelength is needed to differentiate the anomers from each other, use of multiple wavelengths
confirms the results. For the 1-2 linkage disaccharides the ratio of m/z 187 to 229 was always
higher for kojibiose (α-linked) than for sophorose (β-linked). The ratio of m/z 169 to 187 was
always lower for nigerose (α-linked) than for laminaribiose (β-linked). For 1-4 linked
disaccharides, the ratio of m/z 229 to 289 is greater than 0.25 for cellobiose (β-linked) and less
than 0.25 for maltose (α-linked). Lastly, the ratio of m/z 169 to 187 is greater for
gentiobiose (β-linked) than isomaltose (α-linked) at all of the three wavelengths.
Differentiation of Unknowns
To make this work applicable to other laboratories, a method to determine both the linkage
and the anomeric configuration of the different disaccharides was explored. To test this
experimental procedure, one sample of each disaccharide was transferred to a coded vial to
conceal its identity. Each “unknown” was then tested on two separate days, and the identity was
predicted based on the methods described above and in Figures 5-2 and 5-3. Figure 5-4 shows
the results of the unknowns in comparison to the known samples analyzed previously. All error
bars shown are the 95% confidence interval of the mean for the experimental scans for a given
day. In all cases, the identity of the unknown was positively identified based on the ratios and
flow charts.
Some of the fluctuation and discrepancy between the ratios of the unknown and known
samples could be due to variation in the electrospray source. Since the laser power setting is
based on the ratio of the precursor ion to a fragment, slight changes in the abundance of the

88
precursor ion can cause the ratios of fragments to be affected. Even with the variation, the
results are such that the disaccharides were distinguished unambiguously.
Conclusions
This research demonstrated the use of a tunable CO2 laser to identify both the linkage and
the anomeric configuration of various lithium-attached disaccharides. When compared to FELs,
tunable CO2 lasers have a limited wavelength range, but this research showed that results
comparable to those from the broad output wavelength range of the FEL can be achieved in the
CO2 wavelength range of 9.2 to 9.7 μm. These results provide a method for differentiation of
isomers that is accessible and economically feasible for other laboratories.

89
Figure 5-1. Wavelength-dependent fragmentation for the various linked lithiated disaccharides. A) Kojibiose (α1-2). B) Sophorose (β1-2). C) Nigerose (α1-3). D) Laminaribiose (β1-3). E) Maltose (α1-4). F) Cellobiose (β1-4). G) Isomaltose (α1-6). H) Gentiobiose (β1-6).

90
Nigerose (α1-3)Laminaribiose (β1-3) Maltose (α1-4)Cellobiose (β1-4)Isomaltose (α1-6)Gentiobiose (β1-6)
Kojibiose (α1-2)Sophorose (β1-2)
Isomaltose (α1-6)Gentiobiose (β1-6)
m/z 289 observed?yes no
Maltose (α1-4)Cellobiose (β1-4)Isomaltose (α1-6)Gentiobiose (β1-6)
Nigerose (α1-3)Laminaribiose (β1-3)
m/z 259 observed?
Maltose (α1-4)Cellobiose (β1-4)
m/z 331 observed?yes no
yes no
Nigerose (α1-3)Laminaribiose (β1-3) Maltose (α1-4)Cellobiose (β1-4)Isomaltose (α1-6)Gentiobiose (β1-6)
Kojibiose (α1-2)Sophorose (β1-2)
Isomaltose (α1-6)Gentiobiose (β1-6)
m/z 289 observed?yes noyes noyes no
Maltose (α1-4)Cellobiose (β1-4)Isomaltose (α1-6)Gentiobiose (β1-6)
Nigerose (α1-3)Laminaribiose (β1-3)
m/z 259 observed?
Maltose (α1-4)Cellobiose (β1-4)
m/z 331 observed?yes noyes noyes no
yes noyes noyes no
Figure 5-2. Flow-chart depicting how linkage of the disaccharides was determined.
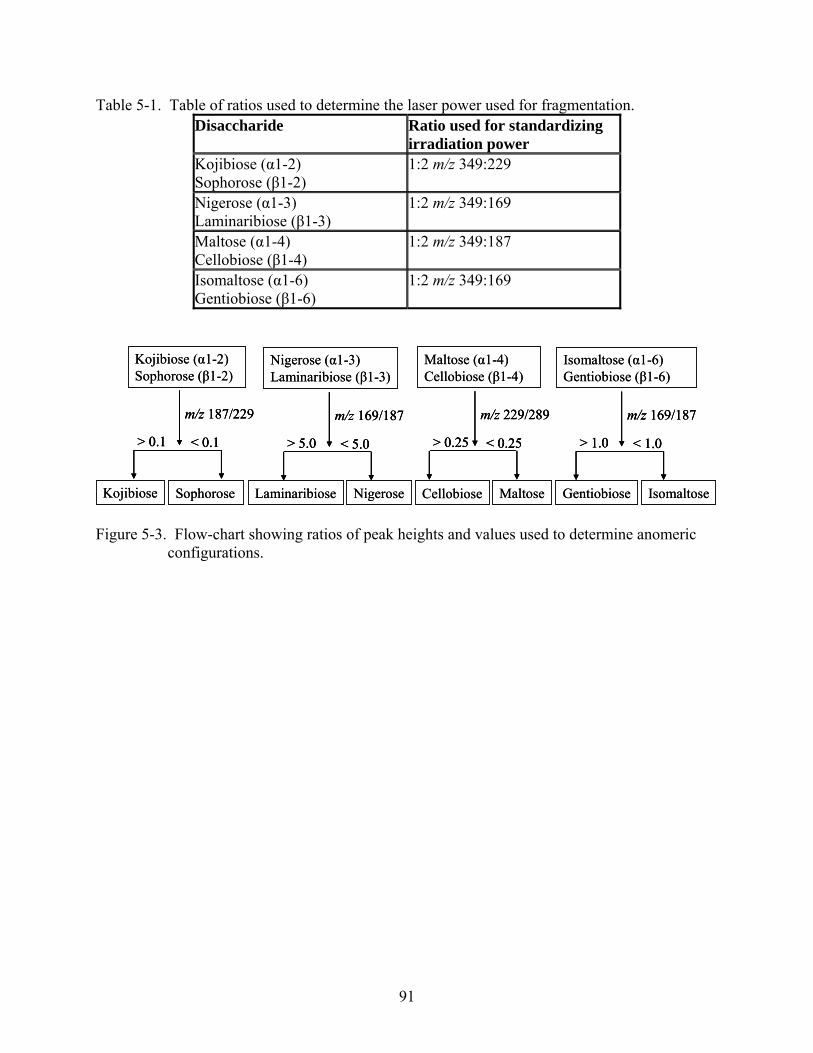
91
Table 5-1. Table of ratios used to determine the laser power used for fragmentation. Disaccharide Ratio used for standardizing
irradiation power Kojibiose (α1-2) Sophorose (β1-2)
1:2 m/z 349:229
Nigerose (α1-3) Laminaribiose (β1-3)
1:2 m/z 349:169
Maltose (α1-4) Cellobiose (β1-4)
1:2 m/z 349:187
Isomaltose (α1-6) Gentiobiose (β1-6)
1:2 m/z 349:169
Nigerose (α1-3)Laminaribiose (β1-3)
Kojibiose (α1-2)Sophorose (β1-2)
Isomaltose (α1-6)Gentiobiose (β1-6)
Maltose (α1-4)Cellobiose (β1-4)
m/z 187/229
> 0.1 < 0.1
Kojibiose Sophorose
m/z 169/187
> 5.0 < 5.0
m/z 229/289
> 0.25 < 0.25
m/z 169/187
> 1.0 < 1.0
Laminaribiose Nigerose Cellobiose Maltose Gentiobiose Isomaltose
Nigerose (α1-3)Laminaribiose (β1-3)
Kojibiose (α1-2)Sophorose (β1-2)
Isomaltose (α1-6)Gentiobiose (β1-6)
Maltose (α1-4)Cellobiose (β1-4)
m/z 187/229
> 0.1 < 0.1
m/z 187/229
> 0.1 < 0.1
Kojibiose Sophorose
m/z 169/187
> 5.0 < 5.0
m/z 169/187
> 5.0 < 5.0
m/z 229/289
> 0.25 < 0.25
m/z 229/289
> 0.25 < 0.25
m/z 169/187
> 1.0 < 1.0
m/z 169/187
> 1.0 < 1.0
Laminaribiose Nigerose Cellobiose Maltose Gentiobiose Isomaltose
Figure 5-3. Flow-chart showing ratios of peak heights and values used to determine anomeric configurations.

92
Kojibiose and Sophorose m/z 187/229
0
0.05
0.1
0.15
0.2
0.25
0.3
0.35
0.4
Kojibiose9.342
Kojibiose9.473
Kojibiose9.588
Sophorose9.342
Sophorose9.473
Sophorose9.588
Sample
Rat
io
Knowns
Unknown trial 1
Unknown trial 2Rat
io
A Kojibiose and Sophorose m/z 187/229
0
0.05
0.1
0.15
0.2
0.25
0.3
0.35
0.4
Kojibiose9.342
Kojibiose9.473
Kojibiose9.588
Sophorose9.342
Sophorose9.473
Sophorose9.588
Sample
Rat
io
Knowns
Unknown trial 1
Unknown trial 2Rat
io
A
Nigerose and Laminaribiose m/z 169/187
0
2
4
6
8
10
12
Nigerose9.342
Nigerose9.473
Nigerose9.588
Laminaribiose9.342
Laminaribiose9.473
Laminaribiose9.588
Sample
Rat
io
Known
Unknown trial 1
Unknown trial 2
Rat
io
B Nigerose and Laminaribiose m/z 169/187
0
2
4
6
8
10
12
Nigerose9.342
Nigerose9.473
Nigerose9.588
Laminaribiose9.342
Laminaribiose9.473
Laminaribiose9.588
Sample
Rat
io
Known
Unknown trial 1
Unknown trial 2
Rat
io
B
Maltose and Cellobiose m/z 229/289
00.10.20.30.40.50.60.70.80.9
Maltose9.342
Maltose9.473
Maltose9.588
Cellobiose9.342
Cellobiose9.473
Cellobiose9.588
Sample
Rat
io
Known
Unknown trial 1
Unknown trial 2Rat
io
CMaltose and Cellobiose m/z 229/289
00.10.20.30.40.50.60.70.80.9
Maltose9.342
Maltose9.473
Maltose9.588
Cellobiose9.342
Cellobiose9.473
Cellobiose9.588
Sample
Rat
io
Known
Unknown trial 1
Unknown trial 2Rat
io
C
Isomaltose and Gentiobiose m/z169/187
0
0.5
1
1.5
2
2.5
3
3.5
Isomaltose9.342
Isomaltose9.473
Isomaltose9.588
Gentiobiose9.342
Gentiobiose9.473
Gentiobiose9.588
Sample
Rat
io
Known
Unknown trial 1
Unknown trial 2Rat
io
D Isomaltose and Gentiobiose m/z169/187
0
0.5
1
1.5
2
2.5
3
3.5
Isomaltose9.342
Isomaltose9.473
Isomaltose9.588
Gentiobiose9.342
Gentiobiose9.473
Gentiobiose9.588
Sample
Rat
io
Known
Unknown trial 1
Unknown trial 2Rat
io
D
Figure 5-4. Bar graphs comparing ratios from knowns and unknown lithiated glucose-containing disaccharides at the wavelengths 9.342, 9.472 and 9.588 μm. A) Ratio of m/z 187/229 for kojibiose and sophorose. B) Ratio of m/z 169/187 for nigerose and laminaribiose. C) Ratio of m/z 229/289 for maltose and cellobiose. D) Ratio of m/z 169/187 for isomaltose and gentiobiose.

93
CHAPTER 6 IRMPD STUDIES OF NEGATIVELY CHARGED DISACCHARIDES WITH A TUNABLE
CO2 LASER
Introduction
The fragmentation of alkali-attached disaccharides73 and polysaccharides formed by
electrospray ionization (ESI) has been previously studied.57 The results showed that
disaccharides and polysaccharides with different linkages give different fragments and that the
wavelength-dependent fragmentation patterns can be used to identify the linkages in these
positively charged species. Both collision induced dissociation (CID),59,60,141,143,144 and infrared
multiple photon dissociation (IRMPD) using a free electron laser (FEL)62,70,73,74,142 have been
used to fragment saccharides. While adduction of a metal in both positive and negative ion
modes makes ionization of carbohydrates easier, when developing a general approach for
saccharide isomeric determination it would be simplest to analyze the saccharide without any
metal ions attached.
Past studies done in the negative ion mode by Jiang and Cole showed that the addition of
chloride yields a higher abundance of the precursor ion than that seen for the deprotonated
disaccharide, thus making it easier to isolate and fragment the precursor.145 Early studies of
chlorinated disaccharides such as sucrose were performed with fast atom bombardment (FAB)
and CID by Prome et al.,146 who found that the saccharides give characteristic fragment ions that
can be used for identification in the negative mode. Along with other fragments, they observed
that the fragmentation of the chloride-attached species resulted in loss of HCl to yield a high
abundance of deprotonated sucrose. More recent studies in the negative mode on the
fragmentation of 1-3, 1-4 and 1-6 linked glucose-containing disaccharides were conducted by
Zhu and Cole,147 who showed that it is possible to identify the linkage of the chlorinated
disaccharides by CID. They also found that the spectra of the deprotonated species are very

94
similar to the spectra obtained for the chlorinated species, further supporting the theory of HCl
loss prior to dissociation.147 Even more recent studies by Jiang and Cole have shown that CID
fragmentation of chlorinated disaccharides not only gives structural linkage information, but also
has the potential for anomeric discrimination,145 using the relative abundances of chlorinated
products vs. the non-chlorinated products. Of the 1-4 linked disaccharides explored by Jiang and
Cole, the ratio of chlorinated to non-chlorinated products was always higher for the α-anomer
than the β-anomer. They observed the opposite trend for 1-6 linked disaccharides.
This chapter reports studies of the fragmentation patterns of several deprotonated
glucose-containing disaccharides with various linkages and anomeric configurations obtained by
irradiation with a CO2 laser in the negative ion mode. The fragmentation patterns of chlorinated
disaccharides at selective wavelengths are also described.
Procedure
Deprotonated Disaccharides
All the fragmentation results for the deprotonated disaccharides discussed here were
obtained at the University of Florida in Dr. David Powell’s laboratory. A Bruker Bio-Apex II
Fourier transform ion cyclotron resonance (FTICR) mass spectrometer with a 4.7 T magnet
(Bruker Daltonics, Billerica, MA) and an InfinityTM cell were used to analyze several glucose-
containing disaccharides including: kojibiose (α1-2), nigerose (α1-3), laminaribiose (β1-3),
maltose (α1-4), cellobiose (β1-4), isomaltose (α1-6) and gentiobiose (β1-6). All disaccharide
samples were provided by Dr. Brad Bendiak of the Department of Cellular and Structural
Biology, University of Colorado Health Sciences Center. The disaccharides were ionized with a
pneumatically-assisted Apollo external electrospray source (Bruker Daltonics, Billerica, MA).
For irradiation, the beam from a Lasy-20G tunable CO2 laser (Access Laser Co.; Marysville,
WA) was passed into the ICR cell through a KBr window located on the end of the FTICR mass

95
spectrometer opposite the end from which externally generated ions were admitted. To control
the irradiation time, a mechanical mirror was used to direct the laser beam. When not directed
into the cell, the laser beam was directed into a power meter head, allowing the laser power to be
monitored throughout the day. Figure 6-1 shows a general schematic of the FTICR-MS and laser
instrumentation used for these experiments.
Solutions of each disaccharide were prepared at a concentration of 0.1 mM. For
deprotonation of the disaccharides, several bases were tried, including sodium
hydroxide (NaOH), tri-ethylamine (N(CH2CH3)3) and ammonium hydroxide (NH4OH). Of the
bases used, NaOH gave the most stable signal with largest abundance of the deprotonated
disaccharide. Therefore, NaOH was used for all of the deprotonated disaccharide experiments.
Several solutions with concentration ratios from 0.1 to 1.0 mM NaOH to 0.1 mM disaccharide
were tried, and a concentration of 1 mM NaOH was found to give the best signal. For improved
ionization, all solutions were composed of 80:20 methanol:water made with general-use grade
methanol and MilliQ water. For all experiments, flow rates between 3 and 7 μL/min were used.
The flow rate was adjusted for each disaccharide to obtain the most stable and abundant signal.
All of the isolated disaccharide precursor ions (m/z 341) were irradiated with the CO2 laser
for one second. The wavelengths used were chosen based on specifications given in the laser
manual, so that only wavelengths with good or excellent power and stability were used. For each
wavelength, three experimental sets of 10 scans of 128 K points each were collected. Once the
precursor ions were fragmented, the relative percent abundance of each fragment was
determined.
Chlorinated Disaccharides
Experiments which studied the fragmentation of chlorinated disaccharides were performed
at the University of Florida in Dr. Eyler’s laboratory with the same instrumental set-up as

96
described in chapter 4. All samples were 0.1 mM solutions made with 1:1 LiCl:saccharide in
80:20 methanol:water. To obtain higher signal intensities, ions were accumulated for
1.5 seconds before being transferred to the analyzer cell followed by isolation, irradiation and
detection. All disaccharides were irradiated for 1 second with a Lasy-20 CO2 laser. The laser
power used was adjusted to create a peak height ratio of 1:1 for the isolated precursor ion
(m/z 377) to a specific fragment ion (m/z 161 or 179). For disaccharides kojibiose (α 1 -2),
sophorose (β 1-2), isomaltose (α 1-6) and gentiobiose (β 1-6), a ratio of 1:1 for m/z 377 to
m/z 179 was used. For nigerose (α 1-3), laminaribiose (β 1-3), maltose (α 1-4) and
cellobiose (β1-4), a ratio of 1:1 for the peak heights of m/z 377 to 161 was used. For each
linkage, the choice of fragment was based on greatest abundance and highest sensitivity relative
to the disappearance of the precursor ion peak.
Reproducibility: Deprotonated Disaccharides
To aid in reproducibility, a daily calibration was performed using isomaltose, which was
the first successfully detected deprotonated disaccharide. In this calibration, the laser power
needed to produce an m/z 179:341 abundance ratio of 1.19 ± 0.17 was determined daily. The
laser power was kept constant for all experiments performed on the same day.
Reproducibility: Chlorinated Disaccharides
To increase the reproducibility of these experiments, the laser power was adjusted to give a
1:1 ratio of the precursor ion to a specific fragment ion. The laser power was determined by
monitoring the fragment ion (either m/z 179 or 161) for each wavelength in the experiment.
Most of the variation seen in these experiments can be attributed to electrospray source
ionization and/or laser power fluctuations. Specific wavelengths were chosen to give a general
coverage of the full range between 9.2 to 9.7 μm. For time considerations and for simplicity of
the experiments, spectra at three wavelengths (9.342, 9.473 and 9.588 μm) were obtained.

97
Results and Discussion
Deprotonated Disaccharides
Figure 6-2 shows the percent abundance of the precursor ion of isomaltose following
IRMPD for the various wavelengths studied (i.e. a depletion spectrum). While the calibration
wavelength of 9.588 μm has a 95% confidence interval of the mean from experiments performed
on two separate days of approximately ± 2%, the maximum variation (at wavelength 9.657 μm)
was ± 26%. Figure 6-2 shows that the day-to-day variation of this method is larger than desired.
Some of the fluctuations causing daily variations could result from instability in the electrospray
source or slight variation of the laser power. Based on the variance of relative percent
abundance for the fragments, this proved to be a qualitative rather than quantitative method for
determining the linkage position of the disaccharides.
The relative percent abundances for the fragments are plotted as a function of wavelength
and mass in Figure 6-3, which shows that the major fragments produced for all of the
disaccharides, except for kojibiose, were m/z 179 and m/z 161. For kojibiose, the major
fragments seen were m/z 263 and 323, as well as minor contributions from fragments m/z 331,
281, 113 and 101. For both isomaltose and gentiobiose, the appearance of m/z 281 was unique
for and thus characteristic of the 1-6 linkage. Thus, 1-2 and 1-6 linked disaccharides can be
distinguished based on the presence of the m/z 281 fragment ion. Disaccharides with linkages of
1-3 and 1-4 gave only fragments at m/z 161 and 179. To distinguish the two linkages, the
abundance of m/z 161 and 179 for each linkage was explored further. For the 1-3 linked, the
ratio of m/z 161:179 was approximately 1:2, whereas the ratio was approximately 6:1 for the 1-4
linked disaccharides. Thus, within the wavelength range 9.2 to 9.7 μm, the linkage of
disaccharides can be identified from the fragmentation pattern.

98
Although the linkage position of the disaccharides could easily be determined based on the
appearance of certain key fragments, determining the anomeric configuration was problematic.
Since fragmentation of 1-3 and 1-4 linked disaccharides produces only m/z 161 and 179 ions, the
ratio of these two was calculated for each enantiomeric pair. The results for the 1-3 and 1-6
linked disaccharides are shown in Figure 6-4. Unfortunately, the ratios for each anomeric pair
were very similar and the identities of the anomers cannot be distinguished by this means.
Therefore more research in this area is needed, including greater fragmentation of the precursor
ion to determine if lower mass ions can be used to distinguish the anomers. Due to time
constraints and chlorine contamination, the spectrum of deprotonated sophorose was not
obtained in this study.
While the relative percent abundances of the fragment ions appear to vary from day to day,
the identities of the fragment ions from each disaccharide remained the same. Figure 6-5 shows
an example of the percent dissociation of the precursor ion from isomaltose and relative percent
abundances of the fragment ions at two different wavelengths (9.201 and 9.657 μm) on two
separate days. These differences, for example the relative percent abundance of the precursor
ion (m/z 341), could be due to the inherent fluctuation of the electrospray source and the laser
power. Since the degree of depletion of the precursor ion dictates the abundances of the
fragments produced, an increase in laser power results in greater abundances of the smaller m/z
ions due to multiple fragmentation.
Chlorinated Disaccharides
During the experiments on deprotonated disaccharides, the presence of chlorine hindered
detection of the deprotonated species. If chlorine was present in the cell and/or solutions, the
sugar would preferentially bind to Cl- rather than lose H+. To take advantage of this, several

99
experiments with the chlorinated disaccharides were performed in Dr. Eyler’s laboratory at the
University of Florida.
First, the fragmentation induced by the irradiation of the chlorinated disaccharides was
studied. Table 6-1 shows the fragments for each chlorinated disaccharide obtained at 9.588 μm
by varying the laser power to decrease the signal abundance of the precursor ion to a relative
percent abundance of 2.6 ± 1.6%, Figure 6-6.
Almost depleting the precursor ion allowed for more of the lower mass ions (for example
m/z 101) to be observed. By monitoring the fragment ions produced, it is possible to identify the
linkage. The presence of m/z 263 and 323 without m/z 281 indicates a 1-2 linkage. The absence
of m/z 263, 281 and 323 indicates a 1-3 linkage, whereas the presence of these three ions
indicates a 1-6 linkage. Lastly, the presence of only m/z 143, 161, 179 and 341 indicates a 1-4
linkage.
This study showed that the fragments produced by IRMPD are in fact different from those
seen in the CID studies of Zhu and Cole.147 The fragments produced for each fragmentation
method are compared in Table 6-2. First, for 1-3 linked disaccharides, the IRMPD spectra
contained lower mass fragment ions m/z 101, 119, 131 and 143 that were not present in the CID
spectra. For the 1-4 linked disaccharides, the higher mass ions of m/z 263 and 281 present in the
CID spectra were not present in the IRMPD spectra. For the 1-6 linked disaccharides, the
IRMPD produced the lower mass ions m/z 119, 131 and 143 that were not found in the CID
spectra and the higher mass ions with m/z 221 and 251 present in the CID spectra were not
present in the IRMPD spectra. These results indicate that, in general, the higher laser powers
used for IRMPD allow production of some lower mass ions that are not seen with CID, perhaps
by photodissociation of higher mass fragments.

100
The ratios of the relative percent abundances of specific fragment ions were obtained to
differentiate the anomeric configuration of disaccharides with the same linkage. For these
experiments, three wavelengths (9.342, 9.473 and 9.588 μm) were chosen for fragmentation.
Selecting only three wavelengths allowed for a (limited) range of wavelengths to be explored
while decreasing the experiment time. For these wavelengths, the laser power was adjusted to
obtain a peak height ratio of approximately 1:1 for m/z 161 to 377 (for nigerose, laminaribiose,
maltose and cellobiose) and m/z 179 to 377 (for kojibiose, sophorose, isomaltose and
gentiobiose). As has been discussed in earlier chapters, using such a ratio to “standardize” the
laser power allowed for improved day to day reproducibility compared to solely monitoring the
depletion of the precursor ion. Figure 6-7 shows the day to day reproducibility at the three
wavelengths for the isomaltose precursor and fragment ions. In comparison to the average
uncertainty of the precursor ion abundance found for the deprotonated isomaltose (± 15%) the
variation for chlorinated isomaltose precursor ion abundances over the three was only ± 2%,
indicating much better day-to-day reproducibility.
Similar to the results found with IRMPD of deprotonated disaccharides, m/z 161 and 179
were the major fragments produced by irradiation of the chlorinated disaccharides. The spectra
obtained for each disaccharide at each of the three wavelengths are shown in Figure 6-8. Except
for the 1-3 linked disaccharides, both the linkage and anomeric configuration can be determined
for all the disaccharides. For the 1-3 linked disaccharides, only the linkage could be determined.
The appearance of m/z 263 as the primary peak for both kojibiose and sophorose at 9.342 μm
makes this a useful wavelength for distinguishing the linkage and anomeric configuration of the
1-2 linked disaccharides. For nigerose and laminaribiose, the fragment ions produced were
mainly m/z 161 and 179, with the abundance of m/z 161 approximately 1.3 times that of m/z 179.

101
In contrast, the spectra of maltose and cellobiose have major fragments at m/z 161 and 179, but
the abundance of m/z 161 is approximately 6 (for maltose) and 8 (for cellobiose) times greater
than the abundance of m/z 179. While m/z 161 and 179 are the major peaks in the spectra for
gentiobiose and isomaltose, the presence of the fragment at m/z 281 in the spectra facilitates
identification of 1-6 linked.
The fragmentation patterns and specific ratios were used in a single-blind study where one
sample of each disaccharide was analyzed at wavelengths of 9.342, 9.473 and 9.588 μm. The
decision flow-chart used to identify the unknowns in the blind study is shown in Figure 6-9.
Analysis of the spectra shows that specific ratios of fragments can be used to differentiate
the anomeric pairs of the disaccharides, as shown in Figure 6-10. The ratio of m/z 263 to
m/z 179 fragment ion abundances of the 1-2 linked disaccharides shows differences at 9.342 and
9.473 μm, with this ratio greater for kojibiose than for sophorose at 9.342 μm and smaller for
kojibiose at wavelength 9.473 μm. To differentiate the 1-4 linked anomers, the data show that
the ratio of m/z 161/179 can be used. While all three wavelengths gave similar results, with the
ratio of cellobiose always being greater than that for maltose, 9.342 μm gave the greatest
difference with the smallest error bars (ratio of 6.5 ± 0.04 for maltose versus 8.1 ± 0.3 for
cellobiose). Lastly, the ratio of m/z 161 to 143 is always higher for gentiobiose than for
isomaltose. The average value for gentiobiose is 9.6 ± 1.1 vs. 3.1 ± 0.4 for isomaltose.
Unfortunately, more work is needed to differentiate the anomers of the 1-3 linked disaccharides.
Since the major fragments produced for the 1-3 linked disaccharides were m/z 161 and 179 and
the error bars for the ratios overlap at the three wavelengths, further fragmentation with more
power may be needed to distinguish the α- and β-anomers.

102
Identification of Fragment Ions
Because, the disaccharides used in these studies are all composed of two glucose units, it is
impossible to distinguish from which of the two glucose monosaccharides, reducing or
non-reducing, a fragment was produced without 18O labeling of the sugar at the reducing-end.
Figure 6-11 shows the possible fragment identities for fragments m/z 119,161, 179, 221, 251 and
289 based on 18O-labeling studies done by Hofmeister et al. in the positive ion mode60 and
Fang et al. in the negative ion mode.93 For the chlorinated disaccharides, the resulting fragments
are produced by the loss of HCl. Fang et al. found that fragments m/z 73, 89, 97, 119, 179, 251,
263 and 281 are produced from the non-reducing end. Since the reducing-end monosaccharide
can interconvert in solution, there is a mixture of both the α- and β-anomers for the reducing-end
monosaccharide. Therefore, being able to use the non-reducing fragments to identify the
anomers allows one to be certain of the anomeric configuration being identified.
Conclusions
These studies of the deprotonated and chlorinated disaccharides revealed that the
fragments produced by IRMPD over the wavelength range of 9.2 to 9.7 μm can be used to
identify the linkage positions of the glucose monosaccharides which comprise the disaccharides.
Identification of the anomeric configuration of the disaccharides is a more difficult task, but it
can be achieved for most of the anomeric pairs by calculating ratios of certain fragment ions for
the various linkages.
The similarity of results for the deprotonated and chlorinated disaccharides supports the
conclusions of Cole and co-workers that loss of HCl occurs before fragmentation.145,147 This
study also showed that IRMPD can be used in the negative ion mode to determine both the
anomeric configuration and linkage of chlorinated glucose-containing disaccharides.

103
Future research should include multiple fragmentations (hopefully produced using higher
laser powers) to see if depletion of the higher mass fragments results in a greater abundance of
the lower masses for the 1-3 linked disaccharides. It may be possible that ratios of these lower
masses can be used in the differentiation of the anomeric configuration. Therefore, future studies
should use an abundance ratio of the precursor ion to a fragment ion at all wavelengths to see
how the abundances of the fragment ions change. Also, since all the disaccharides studied here
were composed of two glucose units, the fragmentation of disaccharides composed of other
monosaccharide units such as mannose or allose should be tried.
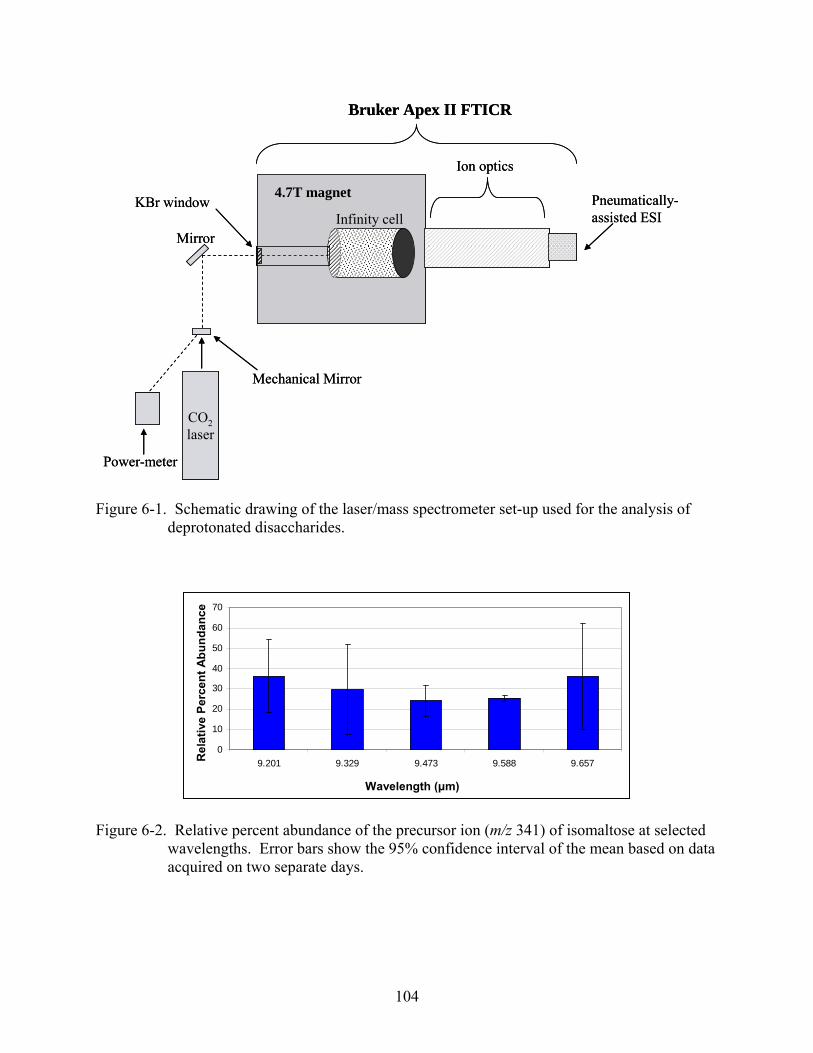
104
Power-meter
CO2
laser
Ion optics
Pneumatically-assisted ESIInfinity cell
KBr window
Mirror
Mechanical Mirror
Bruker Apex II FTICR
4.7T magnet
Power-meter
CO2
laser
Ion optics
Pneumatically-assisted ESIInfinity cell
KBr window
Mirror
Mechanical Mirror
Bruker Apex II FTICR
4.7T magnet
Figure 6-1. Schematic drawing of the laser/mass spectrometer set-up used for the analysis of deprotonated disaccharides.
0
10
20
30
40
50
60
70
9.201 9.329 9.473 9.588 9.657
RP
W
Wavelength (μm)
Re
lati
ve P
erce
nt
Ab
un
da
nc
e
0
10
20
30
40
50
60
70
9.201 9.329 9.473 9.588 9.657
RP
W
Wavelength (μm)
Re
lati
ve P
erce
nt
Ab
un
da
nc
e
Figure 6-2. Relative percent abundance of the precursor ion (m/z 341) of isomaltose at selected wavelengths. Error bars show the 95% confidence interval of the mean based on data acquired on two separate days.

105
Figure 6-3. Wavelength-dependent fragmentation patterns for the various deprotonated disaccharides. A) Kojibiose. B) Nigerose. C) Laminaribiose. D) Maltose. E) Cellobiose. F) Isomaltose. G) Gentiobiose.
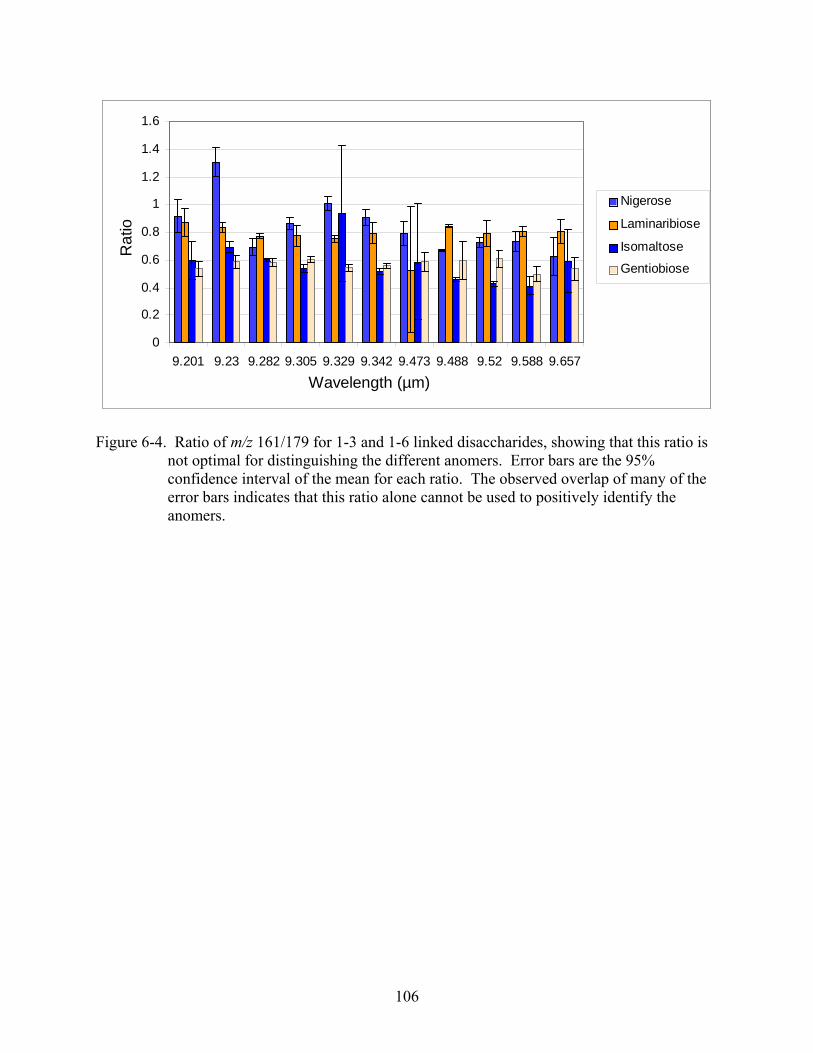
106
0
0.2
0.4
0.6
0.8
1
1.2
1.4
1.6
9.201 9.23 9.282 9.305 9.329 9.342 9.473 9.488 9.52 9.588 9.657
Wavelength
Rat
io
Nigerose
Laminaribiose
Isomaltose
Gentiobiose
Wavelength (µm)
Ra
tio
0
0.2
0.4
0.6
0.8
1
1.2
1.4
1.6
9.201 9.23 9.282 9.305 9.329 9.342 9.473 9.488 9.52 9.588 9.657
Wavelength
Rat
io
Nigerose
Laminaribiose
Isomaltose
Gentiobiose
Wavelength (µm)
Ra
tio
Figure 6-4. Ratio of m/z 161/179 for 1-3 and 1-6 linked disaccharides, showing that this ratio is not optimal for distinguishing the different anomers. Error bars are the 95% confidence interval of the mean for each ratio. The observed overlap of many of the error bars indicates that this ratio alone cannot be used to positively identify the anomers.

107
9.201
-10
0
10
20
30
40
50
60
70
101 113 115 119 125 143 161 179 221 251 281 309 311 323 341
m/z
Day 1
Day 2
9.657
-10
0
10
20
30
40
50
101 113 115 119 125 143 161 179 221 251 281 309 311 323 341
m/z
Day 1
Day 2
A
m/z
m/z
Rel
ati
ve P
erc
ent
Ab
un
dan
ceR
elat
ive
Per
cen
t A
bu
nd
ance
9.657 μm
9.201 μm
B
9.201
-10
0
10
20
30
40
50
60
70
101 113 115 119 125 143 161 179 221 251 281 309 311 323 341
m/z
Day 1
Day 2
9.201
-10
0
10
20
30
40
50
60
70
101 113 115 119 125 143 161 179 221 251 281 309 311 323 341
m/z
Day 1
Day 2
9.657
-10
0
10
20
30
40
50
101 113 115 119 125 143 161 179 221 251 281 309 311 323 341
m/z
Day 1
Day 2
9.657
-10
0
10
20
30
40
50
101 113 115 119 125 143 161 179 221 251 281 309 311 323 341
m/z
Day 1
Day 2
A
m/z
m/z
Rel
ati
ve P
erc
ent
Ab
un
dan
ceR
elat
ive
Per
cen
t A
bu
nd
ance
9.657 μm
9.201 μm
B
Figure 6-5. Comparison of the fragmentation patterns of deprotonated isomaltose on two separate days. A) The IRMPD spectrum of isomaltose at wavelength 9.201 μm. B) The IRMPD spectrum of isomaltose at wavelength 9.657 μm. Notice that the percent abundances of the precursor and fragment ions are different, but in general the same fragments are produced day to day.

108
Table 6-1. Major fragment ions observed for the chlorinated disaccharides when the precursor ion (m/z 377) was almost depleted by IRMPD at 9.588 μm. The solid boxes indicate the presence of a fragment ion of that m/z, whereas the stripped boxes indicate the absence of the fragment.
323
Gentiobiose (β1-6)
Isomaltose (α1-6)
Cellobiose (β1-4)
Maltose (α1-4)
Laminaribiose (β1-3)
Nigerose (α1-3)
Sophorose (β1-2)
Kojibiose(α1-2)
341281263179161143131119113101Disaccharide m/z 323
Gentiobiose (β1-6)
Isomaltose (α1-6)
Cellobiose (β1-4)
Maltose (α1-4)
Laminaribiose (β1-3)
Nigerose (α1-3)
Sophorose (β1-2)
Kojibiose(α1-2)
341281263179161143131119113101Disaccharide m/z
Table 6-2. Comparison of the fragments produced by CID and IRMPD for the chlorinated disaccharides. Fragments produced by both IRMPD and CID are coded in orange, by CID only in yellow, by IRMPD only in blue, and those not produced by either CID or IRMPD are coded in white.
1-6 linked
1-4 linked
1-3 linked
341323281263251221179161143131119113101m/z
Linkage
1-6 linked
1-4 linked
1-3 linked
341323281263251221179161143131119113101m/z
Linkage

109
m/z350300250200150100
Ab
un
dan
ce
200
150
100
50
377341323
263
179
161
143131
119
113
A
m/z350300250200150100
Ab
un
dan
ce
200
150
100
50
377341323
263
179
161
143131
119
113
m/z350300250200150100
Ab
un
dan
ce
200
150
100
50
377341323
263
179
161
143131
119
113
A
m/z350300250200150100
Ab
un
dan
ce
300
250
200
150
100
50377341323
263
179
161
143131119
113
101
B
m/z350300250200150100
Ab
un
dan
ce
300
250
200
150
100
50377341323
263
179
161
143131119
113
101
m/z350300250200150100
Ab
un
dan
ce
300
250
200
150
100
50377341323
263
179
161
143131119
113
101
B
m/z350300250200150100
Ab
un
dan
ce
160150140130120110100908070605040302010
377341
179
161
143
131119
113
101 251** **
C
m/z350300250200150100
Ab
un
dan
ce
160150140130120110100908070605040302010
377341
179
161
143
131119
113
101 251** **
m/z350300250200150100
Ab
un
dan
ce
160150140130120110100908070605040302010
377341
179
161
143
131119
113
101 251** **
C
m/z350300250200150100
Ab
un
dan
ce
400
350
300
250
200
150
100
50 341
179
161
143
131119
113
101 251*** 377
D
m/z350300250200150100
Ab
un
dan
ce
400
350
300
250
200
150
100
50 341
179
161
143
131119
113
101 251*** 377
m/z350300250200150100
Ab
un
dan
ce
400
350
300
250
200
150
100
50 341
179
161
143
131119
113
101 251*** 377
D
m/z350300250200150100
Ab
un
dan
ce
350
300
250
200
150
100
50377
341
179
161
143
E
m/z350300250200150100
Ab
un
dan
ce
350
300
250
200
150
100
50377
341
179
161
143
m/z350300250200150100
Ab
un
dan
ce
350
300
250
200
150
100
50377
341
179
161
143377
341
179
161
143
E
m/z350300250200150100
Ab
un
dan
ce
80075070065060055050045040035030025020015010050 377
179
161
143
F
m/z350300250200150100
Ab
un
dan
ce
80075070065060055050045040035030025020015010050 377
179
161
143
m/z350300250200150100
Ab
un
dan
ce
80075070065060055050045040035030025020015010050 377
179
161
143
F
m/z350300250200150100
Ab
un
dan
ce
400
350
300
250
200
150
100
50 281
377341323263
179
161
143
131119
113
101
*
G
m/z350300250200150100
Ab
un
dan
ce
400
350
300
250
200
150
100
50 281
377341323263
179
161
143
131119
113
101
*
G
281
377341323263
179
161
143
131119
113
101
*
G
m/z350300250200150100
Ab
un
dan
ce
80
70
60
50
40
30
20
10
377
341
281
323*263
179
161
143
131119
113
101
*
H
m/z350300250200150100
Ab
un
dan
ce
80
70
60
50
40
30
20
10
377
341
281
323*263
179
161
143
131119
113
101
*
m/z350300250200150100
Ab
un
dan
ce
80
70
60
50
40
30
20
10
377
341
281
323*263
179
161
143
131119
113
101
*
377
341
281
323*263
179
161
143
131119
113
101
*
H
Figure 6-6. Fragmentation spectra for the nearly depleted precursor ion (m/z 377) for the chlorinated disaccharides at 9.588 μm. A) Kojibiose. B) Sophorose. C) Maltose. D) Cellobiose. E) Nigerose. F) Laminaribiose. G) Isomaltose. H) Gentiobiose.

110
9.342
0
5
10
15
20
25
30
35
71 73 81 83 89 101 113 119 125 131 143 161 179 251 263 281 323 341 377 379
W av
RP Day 1
Day 2
9.342 μm
m/z
Rel
ativ
e P
erce
nt
Ab
un
dan
ce
9.473
0
5
10
15
20
25
30
35
71 73 81 83 89 101 113 119 125 131 143 161 179 251 263 281 323 341 377 379
m /z
RP
A Day 1
Day 2
9.473 μm
m/z
Rel
ativ
e P
erce
nt
Ab
un
dan
ce
9.588
0
5
10
15
20
25
30
35
71 73 81 83 89 101 113 119 125 131 143 161 179 251 263 281 323 341 377 379
m
RP Day 1
Day 2
9.588 μm
m/z
Rel
ativ
e P
erce
nt
Ab
un
dan
ce9.342
0
5
10
15
20
25
30
35
71 73 81 83 89 101 113 119 125 131 143 161 179 251 263 281 323 341 377 379
W av
RP Day 1
Day 2
9.342 μm
m/z
Rel
ativ
e P
erce
nt
Ab
un
dan
ce9.342
0
5
10
15
20
25
30
35
71 73 81 83 89 101 113 119 125 131 143 161 179 251 263 281 323 341 377 379
W av
RP Day 1
Day 2
9.342 μm
m/z
Rel
ativ
e P
erce
nt
Ab
un
dan
ce9.342 μm
m/z
Rel
ativ
e P
erce
nt
Ab
un
dan
ce
9.473
0
5
10
15
20
25
30
35
71 73 81 83 89 101 113 119 125 131 143 161 179 251 263 281 323 341 377 379
m /z
RP
A Day 1
Day 2
9.473 μm
m/z
Rel
ativ
e P
erce
nt
Ab
un
dan
ce
9.473
0
5
10
15
20
25
30
35
71 73 81 83 89 101 113 119 125 131 143 161 179 251 263 281 323 341 377 379
m /z
RP
A Day 1
Day 2
9.473 μm
m/z
Rel
ativ
e P
erce
nt
Ab
un
dan
ce
9.473 μm
m/z
Rel
ativ
e P
erce
nt
Ab
un
dan
ce
9.588
0
5
10
15
20
25
30
35
71 73 81 83 89 101 113 119 125 131 143 161 179 251 263 281 323 341 377 379
m
RP Day 1
Day 2
9.588 μm
m/z
Rel
ativ
e P
erce
nt
Ab
un
dan
ce
9.588 μm
m/z
Rel
ativ
e P
erce
nt
Ab
un
dan
ce
Figure 6-7. Infrared multiple photon dissociation spectra for chlorinated isomaltose obtained at three wavelengths on two different days. Similar reproducibilities were observed for the other chlorinated disaccharides.

111
0
10
20
30
40
50
71 73 81 83 87 89 101 113 119 125 131 143 161 179 251 263 281 323 341 377 379
Sophorose
9.342
9.473
9.588
0
10
20
30
40
71 73 81 83 87 89 101 113 119 125 131 143 161 179 251 263 281 323 341 377 379
Laminaribiose
9.342
9.473
9.588
0
20
40
60
71 73 81 83 87 89 101 113 119 125 131 143 161 179 251 263 281 323 341 377 379
Kojibiose
9.342
9.473
9.588
0
10
20
30
40
71 73 81 83 87 89 101 113 119 125 131 143 161 179 251 263 281 323 341 377 379
Nigerose
9.342
9.473
9.588
0
10
20
30
40
50
71 73 81 83 87 89 101 113 119 125 131 143 161 179 251 263 281 323 341 377 379
Maltose
9.342
9.473
9.588
0
10
20
30
40
50
71 73 81 83 87 89 101 113 119 125 131 143 161 179 251 263 281 323 341 377 379
Cellobiose
9.342
9.473
9.588
0
10
20
30
71 73 81 83 87 89 101 113 119 125 131 143 161 179 251 263 281 323 341 377 379
Isomaltose
9.342
9.473
9.588
0
10
20
30
40
71 73 81 83 87 89 101 113 119 125 131 143 161 179 251 263 281 323 341 377 379
Gentiobiose
9.342
9.473
9.588
m/z m/z
Re
lati
ve P
erc
ent
Ab
un
da
nce
Kojibiose Sophorose
Nigerose Laminaribiose
Maltose Cellobiose
Isomaltose Gentiobiose
0
10
20
30
40
50
71 73 81 83 87 89 101 113 119 125 131 143 161 179 251 263 281 323 341 377 379
Sophorose
9.342
9.473
9.588
0
10
20
30
40
71 73 81 83 87 89 101 113 119 125 131 143 161 179 251 263 281 323 341 377 379
Laminaribiose
9.342
9.473
9.588
0
20
40
60
71 73 81 83 87 89 101 113 119 125 131 143 161 179 251 263 281 323 341 377 379
Kojibiose
9.342
9.473
9.588
0
10
20
30
40
71 73 81 83 87 89 101 113 119 125 131 143 161 179 251 263 281 323 341 377 379
Nigerose
9.342
9.473
9.588
0
10
20
30
40
50
71 73 81 83 87 89 101 113 119 125 131 143 161 179 251 263 281 323 341 377 379
Maltose
9.342
9.473
9.588
0
10
20
30
40
50
71 73 81 83 87 89 101 113 119 125 131 143 161 179 251 263 281 323 341 377 379
Cellobiose
9.342
9.473
9.588
0
10
20
30
71 73 81 83 87 89 101 113 119 125 131 143 161 179 251 263 281 323 341 377 379
Isomaltose
9.342
9.473
9.588
0
10
20
30
40
71 73 81 83 87 89 101 113 119 125 131 143 161 179 251 263 281 323 341 377 379
Gentiobiose
9.342
9.473
9.588
m/z m/z
Re
lati
ve P
erc
ent
Ab
un
da
nce
Kojibiose Sophorose
Nigerose Laminaribiose
Maltose Cellobiose
Isomaltose Gentiobiose
Figure 6-8. Average fragmentation spectra for the disaccharides at 9.342, 9.473 and 9.588 μm. The major fragments observed for kojibiose and sophorose are m/z 179, 263 and 323, whereas the major fragments for nigerose, laminaribiose, maltose and cellobiose are m/z 161 and 179. The major fragments observed for isomaltose and gentiobiose are m/z 161, 179 and 281.

112
1-3 linked1-4 linked1-6 linked
1-2 linked
1-3 linkedNigeroseLaminaribiose
m/z 323?yes no
1-6 linked 1-3 linked1-4 linked
m/z 161 >>179?
1-4 linked
m/z 281?yes no
yes no
> 2 < 2
> 4.35 < 4.35
> 6.75 < 6.75
m/z 263/179 at 9.473 μm
α1-2Kojibiose
β1-2Sophorose
β1-6Gentiobiose
α1-6Isomaltose
m/z 161/143 at 9.342, 9.473 and 9.588 μm
m/z 161/179 at 9.473 and 9.588 μm
α1-4Maltose
β1-4Cellobiose
1-3 linked1-4 linked1-6 linked
1-2 linked
1-3 linkedNigeroseLaminaribiose
m/z 323?yes noyes noyes no
1-6 linked 1-3 linked1-4 linked
m/z 161 >>179?
1-4 linked
m/z 281?yes noyes noyes no
yes noyes no
> 2 < 2
> 4.35 < 4.35
> 6.75 < 6.75
m/z 263/179 at 9.473 μm
α1-2Kojibiose
β1-2Sophorose
β1-6Gentiobiose
α1-6Isomaltose
m/z 161/143 at 9.342, 9.473 and 9.588 μm
m/z 161/179 at 9.473 and 9.588 μm
α1-4Maltose
β1-4Cellobiose
Figure 6-9. Decision flow chart used to identify disaccharide samples with unknown identities in a single-blind study. Once the linkage is determined, the anomeric configuration of all the disaccharides (except 1-3 linked) can then be determined from ratios of specific fragment ions.

113
m/z 263/179
0
0.5
1
1.5
2
2.5
3
3.5
9.342 9.473 9.588
Wavelength
Rat
io
Kojibiose Day 1
Kojibiose Day 2
Kojibiose Unknown
Sophorose Day 1
Sophorose Day 2
Sophorose Unknown
m/z 161/179
0123456789
9.342 9.473 9.588
Wavlength
Rat
io
Maltose Day 1
Maltose Day 2
Maltose Unknown
Cellobiose Day 1
Cellobiose Day 2
Cellobiose Unknown
m/z 161/143
0
2
4
6
8
10
12
14
16
9.342 9.473 9.588
Wavelength
Rat
io
Isomaltose Day 1
Isomaltose Day 2
Isomaltose Unknown
Gentiobiose Day 1
Gentiobiose Day 2
Gentiobiose Unknown
Wavelength (μm)
Rat
io
m/z 263/179A
Wavelength (μm)
Rat
io
m/z 161/143C
Wavelength (μm)
Rat
io
m/z 161/179B
m/z 263/179
0
0.5
1
1.5
2
2.5
3
3.5
9.342 9.473 9.588
Wavelength
Rat
io
Kojibiose Day 1
Kojibiose Day 2
Kojibiose Unknown
Sophorose Day 1
Sophorose Day 2
Sophorose Unknown
m/z 161/179
0123456789
9.342 9.473 9.588
Wavlength
Rat
io
Maltose Day 1
Maltose Day 2
Maltose Unknown
Cellobiose Day 1
Cellobiose Day 2
Cellobiose Unknown
m/z 161/143
0
2
4
6
8
10
12
14
16
9.342 9.473 9.588
Wavelength
Rat
io
Isomaltose Day 1
Isomaltose Day 2
Isomaltose Unknown
Gentiobiose Day 1
Gentiobiose Day 2
Gentiobiose Unknown
Wavelength (μm)
Rat
io
m/z 263/179A
Wavelength (μm)
Rat
io
Wavelength (μm)
Rat
io
m/z 161/143C
Wavelength (μm)
Rat
io
Wavelength (μm)
Rat
io
m/z 161/179B
Figure 6-10. Comparison of various ratios used to determine the anomeric configurations of the chlorinated disaccharides. The unknowns that were identified in the single-blind study by the decision flow chart (Figure 6-9) are also shown. A) The ratio of m/z 263/179 for 1-2 linked kojibiose and sophorose. B) The ratio of m/z 161/179 for 1-4 linked maltose and cellobiose. C) The ratio of m/z 161/143 for 1-6 linked isomaltose and gentiobiose.

114
O
OH
OH
OH
O
OH
OH
O
HO
OH
H, OH
O
OH
OH
OH
O
HO
O
OH
OH
OH
O
HO
O
OH
OH
OH
O
OH
OH
HO
H, OH
H,OH
A
B
C
-HCl
-HCl
-HCl
179
161
221
119
251
161
179
281
O
OH
OH
OH
O
OH
OH
O
HO
OH
H, OH
O
OH
OH
OH
O
HO
O
OH
OH
OH
O
HO
O
OH
OH
OH
O
OH
OH
HO
H, OH
H,OH
A
B
C
-HCl
-HCl
-HCl
179
161
221
119
251
161
179
281
Figure 6-11. Identification of some of the fragment ions for the various linked disaccharides. A) Fragments produced by 1-2 linked disaccharides. B) Fragments produced by 1-4 linked disaccharides. C) Fragments produced by 1-6 linked disaccharides. Based on results from Hofmeister, G. E.; Zhou, Z.; Leary, J. A. J. Am. Chem. Soc. 1991, 113, 5964-5970 and Fang, T. T.; Zirrolli, J.; Bendiak, B. Carbohydr. Res. 2007, 342, 217-235.60,93

115
CHAPTER 7 DIFFERENTIATION OF DISACCHARIDES IN THE NEGATIVE ION MODE WITH FREE
ELECTRON LASER INFRARED MULTIPLE PHOTON DISSOCIATION
Introduction
While tunable CO2 lasers have a limited wavelength range of 9.2 to 10.8 μm, the output
wavelengths produced by free electron lasers (FELs) span a much wider range. Past infrared
multiple photon dissociation (IRMPD) studies with a FEL on both mono- and disaccharides
involved positive ions formed by the adduction of metal ions.73,74 Polfer et al. found that
fragmentation of various glucose-containing lithium-attached disaccharides yielded unique
fragmentation patterns that were a function of both mass and wavelength. The work of Jose
Valle showed that the IRMPD spectra of various rubidium-attached O-methylated pyranosides
were unique for the various monosaccharides.74
The Free Electron Laser for Infrared eXperiments (FELIX) of the FOM-Institute for
Plasma Physics Rijnhuizen, The Netherlands is a user facility that began operation in the
1990’s.74,127,148 The components of FELIX, discussed in chapter 3, are housed in the basement of
the facility, and the laser beam is directed through evacuated beam tubes into different user
stations by pneumatically controlled mirrors. For the studies reported in this chapter, a
laboratory-constructed Fourier transform ion cyclotron resonance (FTICR) mass spectrometer,
Figure 7-1, was used.148 The FELIX laser beam passes into the back of the FTICR mass
spectrometer through a ZnSe window, where a mirror system creates multiple passes resulting in
higher laser fluence over the wavelengths of approximately 5.5 to 11.0 μm used for most
studies.
Procedure
All the experiments reported in this chapter were performed at the FELIX facility with the
help of Drs. Jos Oomens and Jeffrey Steill. First the fragmentation and IRMPD spectra of the
116
deprotonated precursor ions of several mono- and disaccharides were obtained. Next, the
IRMPD spectra and fragmentation patterns of the m/z 179 monosaccharide anion isolated from
the fragmentation of deprotonated disaccharides in the negative ion mode were obtained. Also,
the fragmentation and IRMPD spectra of various deprotonated monosaccharides were studied.
All ions were irradiated with FELIX for 2.5 to 3.5 seconds with a macropulse repetition rate of
5 Hz (for the disaccharide studies) or 10 Hz (for the monosaccharide studies). For the dual laser
experiments, a fixed-frequency CO2 laser was used to fragment a disaccharide to yield the
monosaccharide anion (m/z 179). The disaccharides were irradiated with the CO2 laser with a
power of 0.8 W for 0.35 seconds to produce m/z 179 as the predominant fragment ion.
All deprotonated disaccharide samples of O18-labeled kojibiose, sophorose, nigerose and
laminaribiose were prepared in 80:20 methanol (MeOH):H2O solutions at 1.0 mM disaccharide
and 1.0 mM NaOH concentrations. The solution of chlorinated sophorose was prepared in
8:2 MeOH:H2O with 1 mM concentrations of both sophorose and LiCl. All monosaccharide
samples were prepared with 1 mM saccharide and 1 mM NaOH in 80:20 MeOH:H2O, with the
exception of glucose, which was made at 2 mM glucose to 1.5 mM NaOH (deprotonated studies)
or 1.5 mM LiCl (chlorinated studies). Several concentrations of NaOH were tried, but the
concentrations that gave the best results were either 1.0 or 1.5 mM. Also, triethylamine was tried
as an alternative base, but deprotonation with NaOH provided the best signal for both the
disaccharides and the monosaccharides.
Results and Discussion
Disaccharides
The deprotonated disaccharides and their fragmentation patterns were studied first.
Fang et al. showed that fragmentation of a cross-ring cleavage product (m/z 221), itself produced
by CID from the deprotonated parent ion, was useful in the differentiation of disaccharides.93

117
The research here explored the possibility of using another fragment ion (m/z 179) to
differentiate the disaccharides. First studies of the fragmentation of the precursor ion of the
18O-labeled deprotonated disaccharides (m/z 343) were performed to confirm that the anion
monosaccharide fragment (m/z 179) is produced solely from the non-reducing end. This step
was necessary to determine if the monosaccharide anion could be used to differentiate the
disaccharides and anomeric configurations. For these experiments, two sets of 18O-labeled
glucose-containing disaccharide anomers, kojibiose/sophorose (1-2 linked) and
nigerose/laminaribiose (1-3 linked), were used. The spectrum of chlorinated disaccharide of
sophorose was also obtained to explore the effect of chlorine ion adduction on the fragmentation
of disaccharides.
The fragmentation patterns of deprotonated 18O-labeled kojibiose, sophorose, nigerose and
laminaribiose are shown in Figure 7-2. The fragments produced for the two anomer pairs vary
based on the linkage. For example, fragments m/z 101, 119, 143, 223, 265 and 325 are present
for the 1-2 linked (kojibiose and sophorose) but are not present for the 1-3 linked disaccharides
(nigerose and laminaribiose). Higher mass fragments are present in IRMPD spectra of the
1-2 linked disaccharides, but only the lower masses of m/z 59 and 97 are produced by the
IRMPD fragmentation of 1-3 linked disaccharides. The fragmentation patterns show that the
relative percent abundances of specific fragments are different for each anomer. For example,
the relative percent abundances of m/z 223 and 265 were higher for kojibiose than for sophorose.
The fragmentation patterns for both nigerose and laminaribiose contain m/z 59, 62, 69, 71, 89,
97, 113, 115, 161, 163 and 179, but fragmentation of nigerose produces a higher abundance of
m/z 97 while fragmentation of laminaribiose produced a higher abundance of m/z 59 and 62 over
the wavelength range of approximately 9.0 to 11.0 μm.

118
The IRMPD fragmentation spectrum of chlorinated unlabeled sophorose was also obtained
over the wavelength range of 5.5 to 11.0 μm. The fragmentation of the chlorinated disaccharide,
Figure 7-3, shows a pattern very similar to that of the deprotonated disaccharide, Figure 7-2 B, in
which m/z 323, 263 (265 for 18O-labeled sophorose) and 179 are the major fragments produced.
One difference is that the ion m/z 223 (221 for 16O-sophorose) fragment is produced by
irradiation of the deprotonated sophorose, but not the chlorinated sophorose. Comparing the
IRMPD spectra of the deprotonated and chlorinated sophorose parent ions, Figure 7-4, shows
that adduction of chlorine produces a similar spectrum, but that the overall spectral peaks are
sharpened.
Monosaccharide Anion Produced from Disaccharides
The absence of m/z 181 in the fragmentation patterns for both sets of disaccharide anomer
pairs confirmed that the fragment ion m/z 179 comes solely from the non-reducing end. Next,
the IRMPD spectra of the monosaccharide anion (m/z 179) produced from fragmentation of the
various disaccharides were obtained. For this, m/z 179 was produced by sustained off-resonance
irradiation collision induced dissociation (SORI-CID) and then by laser irradiation with a
non-tunable CO2 laser. The results of this study were compared to those obtained from the
irradiation of deprotonated glucose. As seen in Figure 7-5, the presence of a peak around
~1720 cm-1 for all of the IRMPD spectra is consistent with a characteristic C=O stretch of an
aldehyde. Since the IRMPD spectra of the m/z 179 fragment ion produced by CID and laser
irradiation both contain the aldehyde stretch, these results indicate that the monosaccharide anion
opens upon fragmentation. A possible schematic for this process is shown in Figure 7-6.
To confirm the ring opening, several deprotonated monosaccharides including allose,
galactose, glucose and mannose were irradiated with FELIX and their spectra were obtained. As
seen in Figure 7-7, all monosaccharides produced very broad spectra over the range of 1000 to

119
1800 cm-1. More importantly, the IRMPD spectra for all the deprotonated monosaccharides
contained a peak around 1720 cm-1, thereby indicating the ring opening and loss of anomericity.
To give further spectroscopic evidence for the ring opening, the IRMPD spectra of O-methylated
anomers of glucose were obtained. Methylation of the C-1 oxygen locks the conformation of the
anomer and thereby eliminates mutarotation. When comparing these spectra, Figure 7-8, to the
spectrum of deprotonated glucose (also seen in Figures 7-5 or 7-7), the O-methylated compounds
lacked the aldehyde peak at 1720 cm-1, thereby confirming the suspicion of the opening of the
ring.
Since the IRMPD spectra alone could not differentiate the monosaccharides, more
information was needed. Irradiation of the monosaccharides over the wavelengths 5.5 to
approximately 11 μm produced fragment ions with m/z 59, 71, 89, 101, 113, 119,143 and 161.
While all of the monosaccharides produced the same fragment ions, the relative percent
abundances of the fragments varied depending on the monosaccharide. For example, the percent
abundances of m/z 89, 101, 131 and 161 were the largest fragments of glucose, while fragments
with m/z 59, 71 and 101 were the most abundant for allose, galactose and mannose. Since the
monosaccharides used for this study were not methylated, they existed as a mixture of anomeric
configurations, and therefore anomeric configurations were not studied. Also, due to limited
time, the spectra of these monosaccharides were obtained only once.
Conclusions
The studies performed with FELIX on mono- and disaccharides confirmed that at least
some of the monosaccharide anions open upon deprotonation resulting in loss of the anomeric
configuration. These findings also indicate that the fragment ion m/z 179 may not be the best to
use when differentiating disaccharides. These results also demonstrated that the fragmentation

120
patterns for the various mono- and disaccharides in the negative ion mode are unique and depend
on both the linkage and anomeric configuration of the saccharide.

121
Figure 7-1. Schematic of the FTICR set-up at FELIX. Drawing courtesy of Dr. Jos Oomens.

122
O
OH
OH
OHO
HO
O
OH
OH
OH
18OH,H
-H+
325
265
223
179
143
119113
10189
179
223
m/z
179
m/z
Wavelength(µm)
Re
lati
ve P
erc
en
t A
bu
nd
an
ce
A B
325
265
223179
143119113
10189
O
OH
OH
OHO
HO
O
OH
OH
OH
18OH,H
-H+
223
O
OH
OH
OHO
HO
O
OH
OH
OH
18OH,H
-H+
325
265
223
179
143
119113
10189
179
223
m/z
179
m/z
Wavelength(µm)
Re
lati
ve P
erc
en
t A
bu
nd
an
ce
A B
325
265
223179
143119113
10189
O
OH
OH
OHO
HO
O
OH
OH
OH
18OH,H
-H+
223
O
OH
OH
OHO
HO
O
OH
OH
HO
18OH,H
-H+
Wavelength(µm)
161179
113 115
97
89
7159
161
179
113 115
97
89
7159
m/z m/z
Rel
ati
ve P
erc
en
t A
bu
nd
anc
e
163 163
179
163
179
163
C D
O
OH
OH
OHO
HO
O
OH
OH
HO
18OH, H
-H+
O
OH
OH
OHO
HO
O
OH
OH
HO
18OH,H
-H+
Wavelength(µm)
161179
113 115
97
89
7159
161
179
113 115
97
89
7159
m/z m/z
Rel
ati
ve P
erc
en
t A
bu
nd
anc
e
163 163
179
163
179
163
C D
O
OH
OH
OHO
HO
O
OH
OH
HO
18OH, H
-H+
Figure 7-2. Infrared multiple photon dissociation fragmentation patterns over the wavelength range of 5.5 to 11 μm for the deprotonated 18O-labeled disaccharides. A) Kojibiose. B) Sophorose. C) Nigerose. D) Laminaribiose.

123
341323
263179
161
143131
119
10189
m/z
Wavelength(µm)
Rel
ativ
e P
erce
nt
Ab
un
da
nce
O
OH
OH
OHO
OH
OH
O
HO
OH
H, OH
-HCl
341323
263179
161
143131
119
10189
341323
263179
161
143131
119
10189
m/z
Wavelength(µm)
Rel
ativ
e P
erce
nt
Ab
un
da
nce
O
OH
OH
OHO
OH
OH
O
HO
OH
H, OH
-HCl
Figure 7-3. Fragmentation pattern of chlorinated unlabeled sophorose.
0
0.1
0.2
0.3
0.4
0.5
0.6
700 800 900 1000 1100 1200 1300 1400 1500 1600 1700 1800
cm
Dis
so
cia
tio
n y
e
O-18 Deprotonated Sophorose
Chlorinated Sophorose
cm-1
Dis
so
cia
tio
n Y
ield
0
0.1
0.2
0.3
0.4
0.5
0.6
700 800 900 1000 1100 1200 1300 1400 1500 1600 1700 1800
cm
Dis
so
cia
tio
n y
e
O-18 Deprotonated Sophorose
Chlorinated Sophorose
0
0.1
0.2
0.3
0.4
0.5
0.6
700 800 900 1000 1100 1200 1300 1400 1500 1600 1700 1800
cm
Dis
so
cia
tio
n y
e
O-18 Deprotonated Sophorose
Chlorinated Sophorose
cm-1
Dis
so
cia
tio
n Y
ield
Figure 7-4. Comparison of the IRMPD spectra for O18-labeled sophorose and O16-chlorinated sophorose.

124
Spectra of m/z 179
0
0.1
0.2
0.3
0.4
0.5
0.6
1000 1100 1200 1300 1400 1500 1600 1700 1800
Wavenumber
Dis
so
cia
tio
n y
ieDeprotonated glucosefrom kojibiose produced by SORI-CIDfrom kojibiose produced by CO2 laserfrom sophorose produced by CO2 laser
cm-1
Dis
soci
atio
n y
ield
Spectra of m/z 179
0
0.1
0.2
0.3
0.4
0.5
0.6
1000 1100 1200 1300 1400 1500 1600 1700 1800
Wavenumber
Dis
so
cia
tio
n y
ieDeprotonated glucosefrom kojibiose produced by SORI-CIDfrom kojibiose produced by CO2 laserfrom sophorose produced by CO2 laser
cm-1
Dis
soci
atio
n y
ield
Figure 7-5. Comparison of the IRMPD spectra of the monosaccharide anions (m/z 179) produced by deprotonation of glucose and by fragmentation of a disaccharide by SORI-CID and CO2 laser irradiation.
O
H
HO
H
HO
H
O-
OHHH
OH
O-
H
HO
H
HO
H
O
OHH
OH
Figure 7-6. Schematic of the possible mechanism leading to the opening of the monosaccharide anion ring.

125
0
0.1
0.2
0.3
0.4
0.5
0.6
0.7
1000 1050 1100 1150 1200 1250 1300 1350 1400 1450 1500 1550 1600 1650 1700 1750 1800
cm
dis
s
Allose
Galactose
Glucose
Mannose
Dis
soci
atio
n yi
eld
cm-1
0
0.1
0.2
0.3
0.4
0.5
0.6
0.7
1000 1050 1100 1150 1200 1250 1300 1350 1400 1450 1500 1550 1600 1650 1700 1750 1800
cm
dis
s
Allose
Galactose
Glucose
Mannose
0
0.1
0.2
0.3
0.4
0.5
0.6
0.7
1000 1050 1100 1150 1200 1250 1300 1350 1400 1450 1500 1550 1600 1650 1700 1750 1800
cm
dis
s
Allose
Galactose
Glucose
Mannose
Dis
soci
atio
n yi
eld
cm-1
Dis
soci
atio
n yi
eld
cm-1
Figure 7-7. Infrared multiple photon dissociation spectra of various deprotonated monosaccharides. All the spectra are very broad with a peak around ~ 1720 cm-1, indicating the opening of the ring.
0
0.1
0.2
0.3
0.4
0.5
0.6
0.7
0.8
Dis
soci
atio
Alpha-O-methyl-glucopyranoside
Beta-O-methyl-glucopyranoside
0
0.1
0.2
0.3
0.4
0.5
0.6
820 920 1020 1120 1220 1320 1420 1520 1620 1720 1820
Disso
wav
e
Deprotonated glucose
α-O-methyl-glucopyranoside
β-O-methyl-glucopyranoside
Deprotonated glucose
cm-1
Dis
soci
atio
n yi
eld
Dis
soci
atio
n y
ield
0
0.1
0.2
0.3
0.4
0.5
0.6
0.7
0.8
Dis
soci
atio
Alpha-O-methyl-glucopyranoside
Beta-O-methyl-glucopyranoside
0
0.1
0.2
0.3
0.4
0.5
0.6
820 920 1020 1120 1220 1320 1420 1520 1620 1720 1820
Disso
wav
e
Deprotonated glucose
α-O-methyl-glucopyranoside
β-O-methyl-glucopyranoside
Deprotonated glucose
cm-1
Dis
soci
atio
n yi
eld
Dis
soci
atio
n y
ield
Figure 7-8. Comparison of the IRMPD spectra for anomers of O-methyl-glucopyranoside to the spectrum of deprotonated glucose.

126
D
Wavelength(µm)
m/z
Re
lati
ve
Per
cen
t A
bu
nd
an
ce
59
71
89
101
143 161
Wavelength(µm)
C
Re
lati
ve
Per
cen
t A
bu
nd
an
ce
89
101
113 119131 161
m/z
A
Wavelength(µm)
m/z
Re
lati
ve
Per
cen
t A
bu
nd
an
ce
5971
89
101
119
143161
m/z
B
Wavelength(µm)
Re
lati
ve
Per
cen
t A
bu
nd
an
ce
5971
89
101113 143
131113
59 71143
131
113
119
119 131161
O
H
HO
OH
H
H
OHH
OH
OH,H
-H+
O
OH
H
H
HO
H
OHH
OH
OH,H
-H+
O
H
HO
H
HO
H
OHH
OH
OH,H
-H+
O
H
HO
H
HO
OH
HH
OH
OH,H
-H+
Figure 7-9. Comparison of the fragmentation patterns of the deprotonated monosaccharides over the wavelength range of 5.5 to 11 μm. A) Allose. B) Galactose. C) Glucose. D) Mannose.

127
CHAPTER 8 CONCLUSIONS AND FUTURE WORK
Infrared multiple photon dissociation (IRMPD) was used in conjunction with Fourier
transform ion cyclotron resonance mass spectrometry (FTICR-MS) to obtain fragmentation
patterns of mono- and disaccharide isomers in both the positive and negative ion mode. The
fragmentation patterns and IRMPD spectra produced with tunable irradiation from both a
continuous wave, line-tunable CO2 and free electron laser (FEL) were used to differentiate
various lithiated, deprotonated and chlorinated mono- and disaccharides.
The major benefit demonstrated by this research was that an affordable and accessible
line-tunable CO2 laser can be used for the differentiation of isomers. The fragmentation patterns
produced over the wavelength range from 9.2 to 9.7 μm for lithiated mono- and disaccharides
were used to identify and differentiate both their linkages and anomeric configurations. Along
with showing that the output wavelength of fixed frequency CO2 lasers (10.6 μm) is not at all
optimal for differentiation of isomers, this research also demonstrated the benefits of using
multiple wavelengths from a tunable CO2 laser.
The first project of this dissertation showed that CO2 laser irradiation of
O-methyl-gluco- and galactopyranosides produced unique fragmentation patterns over the
wavelength range of 9.2 to 9.7 μm. The relative percent abundance of fragment m/z 169 could
be used to distinguish the glucopyranosides from the galactopyranosides. Furthermore, ratios of
the relative percent abundance of specific fragments (m/z 109/127 for the glucopyranosides and
m/z 169/151 for the galactopyranosides) were used to differentiate the anomeric configuration of
monosaccharide isomers. In both cases, the ratios of the specified fragment ions for the
α-anomers were larger than for the β-anomers. A single-blind study confirmed that the isomers
could be identified based on fragment abundances in conjunction with ratios of the relative

128
percent abundances of specific key ions. In this project, a method for differentiation that could be
useful to other researchers was developed.
In a second project, irradiation of lithiated disaccharide isomers with a line-tunable CO2
laser over the wavelength range of 9.2 to 9.7 μm produced fragmentation similar to that obtained
with a more expensive and complex FEL. The fragmentation patterns seen from 9.2 to 9.7 μm
could be used to differentiate the linkage, while ratios of specific ions were used to determine the
anomeric configurations. Fragmenting the precursor ion (m/z 349) with a laser to produce a
1:2 peak height of precursor ion to fragment ion (m/z 229 for 1-2 linked, m/z 169 for 1-3 and
1-6 linked and m/z 187 for 1-4 linked disaccharides) at wavelengths 9.342, 9.473 and 9.588 μm
allowed the eight isomers to be differentiated. Comparing ratios of the relative abundances of
other key fragments (m/z 187/229 for 1-2 linked, m/z 169/187 for 1-3 and 1-6 linked and
m/z 229/289 for 1-4 linked disaccharides) gave a method to differentiate the anomeric
configuration. Specifically, the ratios calculated for fragments from the β-anomers were larger
than the ratios obtained for the α-anomers for all except the 1-2 linked disaccharides.
The study of deprotonated and chlorinated disaccharides fragmented with a line-tunable
CO2 laser demonstrated that differentiation of the disaccharides in the negative mode is more
difficult than that involving lithiated disaccharides in the positive ion mode. The fragments
obtained from the dissociation of the deprotonated disaccharides were primarily m/z 161 and
m/z 179 and were similar to those obtained for the chlorinated species. While the linkage for
each deprotonated disaccharide could be determined based on the relative percent abundances of
the fragment ions, the anomeric configurations of the deprotonated ions were not determined in
this study. Fragmentation patterns were used to determine the linkage of the eight chlorinated
disaccharides studied. Also, comparison of specific ratios of the relative percent abundances of

129
specific fragment ions (m/z 263/179 for 1-2 linked, m/z 161/179 for 1-4 linked and m/z 161/143
for 1-6 linked) for the chlorinated disaccharides gave a method of discriminating the various
anomers.
Lastly, study of deprotonated disaccharides with a FEL gave spectroscopic evidence for
opening of the monosaccharide anion. An 18O-labeling study of the fragmentation of 1-2 and
1-3 linked deprotonated disaccharides confirmed that the monosaccharide anion (m/z 179)
produced over wavelengths 5.5 to 11.0 μm contained solely the non-reducing monosaccharide.
Multiple fragmentation methods, including sustained off-resonance irradiation collision-induced
dissociation (SORI-CID) and laser irradiation by a fixed-frequency CO2 laser were used to
fragment various disaccharides and isolate the m/z 179 anion. The IRMPD spectra for the
isolated m/z 179 fragment ion revealed a band corresponding to C=O aldehyde stretch around
1720 cm-1. This gave strong evidence for opening of the non-reducing monosaccharide ring and
subsequent loss of anomericity of the monosaccharide anion produced from the fragmentation of
the glucose-containing disaccharides. Furthermore, the IRMPD spectra of several other
deprotonated monosaccharides also contained this peak. Opening of the monosaccharide ring
and thereby loss of the anomeric configuration confirms the need for more information, such as
fragmentation patterns, to differentiate the monosaccharide anomers that compose larger
oligosaccharides when using the deprotonated forms of these compounds for analysis.
Only glucose-containing disaccharides were used in the research discussed in this
dissertation, therefore future studies should examine the fragmentation patterns of other hexose-
containing disaccharides. It may be possible, since the monosaccharides studied in this
dissertation gave unique fragmentation patterns, that disaccharides composed of different
monosaccharide units could also give unique fragmentation patterns that could be used for

130
isomeric differentiation. The patterns of these smaller saccharides could then be used to
differentiate the linkage and monosaccharide units within larger oligo- and polysaccharides.
Since the largest saccharide units studied here were the disaccharides, larger saccharide units
such as trisaccharides composed of various monosaccharide units should be studied. A major
limitation of this research was that only pure samples of each disaccharide were used. Since in
nature mixtures of anomers are often present simultaneously in solution, a method that can
determine the percentage of each anomer within a mixture of saccharides should be developed.
Lastly, an instrumental set-up that utilizes an optical parametric oscillator (OPO) in
conjunction with a FTICR mass spectrometer may be useful for studying various hexoses. The
use of an OPO allows access to the 2.28-4.67 μm wavelength range, which corresponds to the
O-H stretch region. The various O-H stretches could be helpful in differentiating anomers of
mono- and disaccharide

131
LIST OF REFERENCES
(1) Clowers, B. H.; Dwivedi, P.; Steiner, W. E.; Hill, H. H.; Bendiak, B. J. Am. Soc. Mass
Spectrom. 2005, 16, 660-669.
(2) Dwek, R. A. Chem. Rev. 1996, 96, 683-720.
(3) Lis, H.; Sharon, N. Chem. Rev. 1998, 98, 637-674.
(4) Dyer, J. W., I.S.; Palejwala, A.; Ellis, A.; Shirazi-Beechey, S.P. Am. J. Physiol Gastrointest. Liver Physiol. 2002, 282, G214-G248.
(5) Varki, A. Glycobiology 1993, 3, 97-130.
(6) Park, Y.; Lebrilla, C. B. Mass Spectrom. Rev. 2005, 24, 232-264.
(7) Solomons, G.; Fryhle, C. Organic Chemistry, 7 ed.; John Wiley & Soncs, Inc.: New York, NY, 2002.
(8) El Khadem, H. S. Carbohydrate Chemistry: Monosaccharides and Their Oligomers; Academic Press, Inc.: San Deigo, 1988.
(9) Lindhorst, T. K. Essentials of Carbohydrate Chemistry and Biochemistry, 2nd ed.; Wiley-VCH: Weinheim, 2003.
(10) Englyst, K. N.; Liu, S.; Englyst, H. N. Eur. J. Clin. Nut. 2007, 61, S19-S39.
(11) Voet, D.; Voet, J. G. Biochemistry, 2 ed.; John Wiley & Sons: New York, 1995.
(12) Apweiler, R.; Hermjakob, H.; Sharon, N. Biochim. Biophys. Acta. 1999, 1473, 4-8.
(13) Rassi, Z. E., Ed. Carbohydrate analysis: high performance liquid chromatography and capillary electrophoresis; Elsevier Science B. V.: Amsterdam, 1995.
(14) Chaplin, M. F.; Kennedy, J. F., Eds. Carbohydrate Analysis: A practical approach; Oxford University Press Inc.: New York, 1994.
(15) Hakomori, S. Curr. Opin. Hematol. Rev. 2003, 10, 16-24.
(16) Ramasamy, R.; Reese, R. T. J. Immunol. 1985, 134, 1952-1955.
(17) Zaia, J. Mass Spectrom Rev 2004, 23, 161-227.
(18) Amon, S.; Zamfir, A. D.; Rizzi, A. Electrophoresis 2008, 29, 2485-2507.
(19) Coppin, A.; Maes, E.; Flahaut, C.; Coddeville, B.; Strecker, G. Eur. J. Biochem. 1999, 266, 370-382.

132
(20) Martensson, S.; Levery, S. B.; Fang, T. T.; Bendiak, B. Eur. J. Biochem. 1998, 258, 603-622.
(21) Rassi, Z. E., Ed. Carbohydrate analysis by modern chromatography and electrophoresis; Elsevier Science B.V.: Amsterdam, 2002.
(22) Bergstrom, N.; Nair, G. B.; Weintraub, A.; Jansson, P.-E. Carbohydr Res. 2002, 337, 813-817.
(23) Zhang, Y.-H. P.; Lynd, L. R. Anal. Biochem. 2003, 322, 225-232.
(24) Ciucanu, I.; Kerek, F. Carbohydr. Res. 1984, 131, 209-217.
(25) Bourne, E. J.; Stacey, M.; Tatlow, J. C.; Tedder, J. M. J. Chem. Soc. 1949, 2976-2979.
(26) Kang, P.; Mechref, Y.; Klouckova, I.; Novotny, M. V. Rapid Commun. Mass Spectrom. 2005, 19, 3421-3428.
(27) Hakomori, S. I. J. Biochem. 1964, 55, 205.
(28) Armstrong, G. S.; Bendiak, B. J. Magn. Reson. 2006, 181, 79-88.
(29) Duus, J. O.; Gotfredsen, C. H.; Bock, K. Chem. Rev. 2000, 100, 4589-4614.
(30) Bendiak, B. Carbohydr Res. 1999, 315, 206-221.
(31) Vliegenthart, J. F. G.; Woods, R. J., Eds. NMR Spectroscopy and Computer Modeling of Carbohydrates: Recent Advances; Oxford University Press: Washington, DC, 2006.
(32) Fang, T. T.; Bendiak, B. J. Am. Chem. Soc. 2007, 129, 9721-9736.
(33) Yamashita, M.; Fenn, J. B. J. Phys Chem. 1984, 88, 4451-4459.
(34) Carr, S. A.; Reinhold, V. N.; Green, B. N.; Hass, J. R. Biomed Mass Spectrom 1985, 12, 288-295.
(35) Egge, H.; Peter-Katalinic, J. Mass Spectrom Rev. 1987, 6, 331-393.
(36) Dell, A. Adv. Carbohydr. Chem. Biochem. 1987, 45, 19-72.
(37) Stahl, B.; Steup, M.; Karas, M.; Hillenkamp, F. Anal. Chem. 1991, 63, 1463-1466.
(38) Duffin, K.; Welply, J. K.; Huang, E.; Henion, J. D. Anal. Chem. 1992, 64, 1440-1448.
(39) Fura, A.; Leary, J. A. Anal. Chem. 1993, 65, 2805-2811.
(40) Barber, M.; Bordoli, R. S.; Sedgwick, R. D.; Tyler, A. N. J. Chem. Soc. Chem. Comm. 1981, 325-327.

133
(41) Carroll, J. A.; Lebrilla, C. B. Org. Mass Spectrom. 1992, 27, 639-643.
(42) Carroll, J. A.; Ngoka, L.; Beggs, C. G.; Lebrilla, C. B. Anal. Chem. 1993, 65, 1582-1587.
(43) Karas, M.; Bachmann, D.; Hillenkamp, F. Anal. Chem. 1985, 57, 2935-2939.
(44) Zhang, H.; Brokman, S. M.; Fang, N.; Pohl, N.; Nicola, L.; Yeung, E. S. Rapid Commun. Mass Spectrom. 2008, 22, 1579-1586.
(45) Fenn, J. B.; Mann, M.; Meng, C. K.; Wong, S. F.; Whitehouse, C. M. Science 1989, 246, 64-71.
(46) Cech, N. B.;Enke, C.G. Mass Spectrom. Rev. 2001, 20, 362-387.
(47) Fenn, J. B.; Mann, M.; Meng, C. K.; Wong, S. F.; Whitehouse, C. M. Mass Spectrom. Rev. 1990, 9, 37-70.
(48) Mirgorodskaya, E.; Roepstorff, P.; Zubarev, R. A. Anal. Chem. 1999, 71, 4431-4436.
(49) Cody, R. B.; Burnier, R. C.; Freiser, B. S. Anal. Chem. 1982, 54, 96-101.
(50) Gauthier, J. W.; Trautman, T. R.; Jacobson, D. B. Anal. Chim. Acta. 1991, 246, 211-225.
(51) Mueller, D. R.; Domon, B. M.; Blum, W.; Raschdorf, F.; Richter, W. J. Biomed. Mass Spectrom 1988, 15, 441-446.
(52) Laine, R. A.; Yoon, E.; Mahier, T. J.; Abbas, S. A.; de Lappe, B.; Jain, R.; Matta, K. Biol. Mass Spectrom. 1991, 20, 505-514.
(53) Woodin, R. L.; Bomse, D. S.; Beauchamp, J. L. J. Am. Chem. Soc. 1978, 100, 3248-3250.
(54) Black, J. G.; Yablonovitch, E.; Bloembergen, N.; Mukamel, S. Physical Review Letters 1977, 38, 1131-1134.
(55) Oomens, J.; Tielens, A. G. G. M.; Sartakov, B. G.; von Helden, G.; Meijer, G. Astrophys J. 2003, 591, 968-985.
(56) Adamson, J. T.; Hakansson, K. Anal. Chem. 2007, 79, 2901-2910.
(57) Asam, M. R.; Glish, G. L. J. Am. Soc. Mass Spectrom. 1997, 8, 987-995.
(58) Cancilla, M. T.; Penn, S. G.; Carroll, J. A.; Lebrilla, C. B. J. Am. Chem. Soc. 1996, 118, 6736-6745.
(59) Firdoussi, A. E.; Lafitte, M.; Tortajada, J.; Kone, O.; Salpin, J.Y. J. Mass Spectrom. 2007, 42, 999-1011.
(60) Hofmeister, G. E.; Zhou, Z.; Leary, J. A. J. Am. Chem. Soc. 1991, 113, 5964-5970.

134
(61) Cole, R. B.; Zhu., J. H. Rapid Commun. Mass Spectrom. 1999, 13, 607-611.
(62) Xie, Y.; Lebrilla, C. B. Anal. Chem. 2003, 75, 1590-1598.
(63) March, R. E. J. Mass Spectrom. 1997, 32, 351-369.
(64) Marshall, A. G.; Hendrickson, C. L.; Jackson, G. S. Mass Spectrom. Rev. 1998, 17, 1-35.
(65) Jasinski, J. M.; Rosenfeld, R. N.; Meyer, F. K.; Brauman, J. I. J. Am. Chem. Soc. 1982, 104, 652-658.
(66) Gaumann, T.; Riveros, J. M.; Zhu, Z. Q. Helv. Chim. Acta 1990, 73, 1215-1218.
(67) Shin, S. K.; Beauchamp, J. L. J. Am. Chem. Soc. 1990, 112, 2057-2066.
(68) Shin, S. K.; Beauchamp, J. L. J. Molec. Struct. 1991, 249, 1-9.
(69) Peiris, D. M.; Riveros, J. M.; Eyler, J. R. Int. J. Mass Spectrom. Ion Process 1996, 159, 169-183.
(70) Fukui, K.; Takada, Y.; Sumiyoshi, T.; Imai, T.; Takahashi, K. J. Phys Chem. B. 2006, 110, 16111-16116.
(71) Prazeres, R.; Glotin, F.; Insa, C.; Jarosynski, D. A.; Ortega, J. M. Eur. Phys J. D. 1998, 3, 87-93.
(72) Prazeres, R.; Glotin, F.; Ortega, J. M., Tsukuba, Japan 2003; 83-87.
(73) Polfer, N. C.; Valle, J. J.; Moore, D. T.; Oomens, J.; Eyler, J. R.; Bendiak, B. Anal. Chem. 2006, 78, 670-679.
(74) Valle, J. J. Ph.D., University of Florida, Gainesville, 2005.
(75) Lawrence, E. O.; Edlefsen, N. E. Science 1930, 72, 376.
(76) Lawrence, E. O.; Livingston, M. S. Phys. Rev. 1932, 40, 19.
(77) Sommer, H.; Thomas, H. A.; Hipple, J. A. Phys. Rev. 1949, 76, 1877.
(78) Amster, I. J. J. Mass Spectrom. 1996, 31, 1325-1337.
(79) Comisarow, M. B.; Marshall, A. G. Chem. Phys. Lett. 1974, 25, 282.
(80) Marshall, A. G.; Comisarow, M. B.; Parisod, G. J. Chem. Phys. 1979, 71, 4434.
(81) Jackson, G. S.; Hendrickson, C. L.; Reinhold, B. B.; Marshall, A. G. Int. J. Mass Spectrom. Ion Process. 1997, 165/166, 327-338.
(82) Dehmelt, H. Rev. Mod. Phys. 1990, 1990, 525-530.

135
(83) Marshall, A. G. Int. J. Mass Spectrom. 2000, 200, 331-356.
(84) Marshall, A. G.; Hendrickson, C. L. Int. J. Mass Spectrom. 2002, 215, 59-75.
(85) Guan, S; Marshall, A. Int. J. Mass Spectrom. Ion Processes 1996, 157/158, 5-37.
(86) Busch, K. Spectrosc. 2004, 19, 35-38.
(87) Ledford, E. B.; Rempel, D.; Gross, M. L. Anal. Chem. 2005, 1984, 2744-2748.
(88) Zhang, L.; Rempel, D.; Pramanik, B. N.; Gross, M. L. Mass Spectrom. Rev. 2005, 24, 286-309.
(89) Burton, R. D.; Matuszak, K. P.; Watson, C. H.; Eyler, J. R. J. Am. Soc. Mass Spectrom. 1999, 10, 1291-1297.
(90) Hannis, J. C.; Muddlman, D. C. J. Am. Soc. Mass Spectrom 2000, 11, 876-883.
(91) Taylor, P. K.; Amster, I. J. Int. J. Mass Spectrom. 2003, 222, 351-361.
(92) Garozzo, D.; Impallomeni, G.; Spina, E.; Green, B. N.; Hutton, T. Carbohydr. Res. 1991, 221, 253-257.
(93) Fang, T. T.; Zirrolli, J.; Bendiak, B. Carbohydr. Res. 2007, 342, 217-235.
(94) Stefan, S. E.; Eyler, J. R. Anal. Chem. 2009, 81, 1224-1227.
(95) Eyler, J. R. Mass Spectrom. Rev. 2009, 28, 448-467.
(96) Polfer, N. C.; Oomens, J. Mass Spectrom. Rev. 2009, 28, 468-494.
(97) Ijames, C. F.; Wilkins, C. L. Anal. Chem. 1990, 62, 1295-1299.
(98) Zubarev, R. A. Curr. Opin. Chem. Biotechnol. 2004, 15, 12-16.
(99) Zubarev, R. A.; Haselmann, K. F.; Budnik, B.; Kjeldsen, F.; Jensen, F. Eur. J. Mass Spectrom. 2002, 8, 337-349.
(100) Gorshkov, M. V.; Guan, S. H.; Marshall, A. G. Int. J. Mass Spectrom. Ion Process. 1993, 128, 47-60.
(101) Dunbar, R. C.; McMahon, T. B. Science 1998, 279, 194-197.
(102) Peiris, D. M.; Cheeseman, M. A.; Ramanathan, R.; Eyler, J. R. J. Phys Chem. 1993, 97, 7839-7843.
(103) Senko, M. W.; Speir, J. P. Anal. Chem. 1994, 66, 2801-2808.
(104) Carlin, T. J.; Freiser, B. S. Anal. Chem. 1983, 55, 571-574.

136
(105) Laskin, J.; Futrell, J. H. Mass Spectrom. Rev. 2003, 22, 158-181.
(106) Laskin, J.; Futrell, J. H. Mass Spectrom. Rev. 2005, 24, 135-167.
(107) Oomens, J.; Sartakov, B.G.; Meijer, G.; von Helden, G. Int. J. Mass Spectrom. 2006, 254, 1-19.
(108) Marshall, A. G.; Hendrickson, C. L.; Emmett, M. R.; Rodgers, R. P.; Blakney, G. T.; Nilsson, C. L. Eur. J. Mass Spectrom. 2007, 13, 57-59.
(109) Bomse, D. S.; Beauchamp, J. L., Eds. Multiphoton dissociation of molecules with low power CW infrared lasers.; Springer-Verlag: Berlin-Heidelberg, 1978.
(110) Woodin, R. L.; Bomse, D. S.; Beauchamp, J. L. Chem. Biochem. Appl. Lasers 1979, 4, 355-388.
(111) Woodin, R. L.; Bomse, D. S.; Beauchamp, J. L. Chem. Phys. Lett. 1979, 63, 630-636.
(112) Dole, M.; Mack, L. L.; Hines, R. I.; Mobley, R. C.; Ferguson, L. D.; Alice, M. B. J. Chem. Phys. 1968, 49, 2240-2249.
(113) Tanaka, K.; Ido, Y.; Akita, S.; Yoshida, T. Iyo Masu Kenkyuki Koenshu 1987, 12, 219-222.
(114) Lehmann, K. K.; Scoles, G.; Pate, B. H. Annu. Rev. Phys. Chem. 1994, 45, 241-274.
(115) Grant, E. R.; Schulz, P. A.; Sudbo, A. S.; Shen, Y. R.; Lee, Y. T. Phys. Rev. Lett. 1978, 40, 115-118.
(116) Bagratashvili, V. N.; Letokhov, V. S.; Makarov, A. A.; Ryabov, E. A. Mulitple Photon Infrared Laser Photophysics and Photochemistry; Hardwood Academic Publishers: Amsterdam, 1985.
(117) Oomens, J.; Meijer, G.; von Helden, G. J. Phys. Chem. A 2001, 105, 8302-8309.
(118) Oomens, J.; van Roji, A. J. A.; Meijer, G.; Von Helden, G. Astrophys. J. 2000, 542, 404-410.
(119) von Helden, G.; Holleman, I.; Knippels, G. M. H.; van der Meer, A. F. G.; Meijer, G. Phys. Rev. Lett. 1997, 79.
(120) von Helden, G.; Holleman, I.; Meijer, G.; Sartakov, B. G. Opt. Express 1999, 4, 46-52.
(121) Dunbar, R. C. J. Am. Chem. Soc. 1971, 93, 4354-4358.
(122) Atkins, P.; de Paula, J. Physical Chemistry, 7th ed.; W. H. Freeman and Company: New York, 2002.
(123) Patel, C. K. N. Phys. Rev. 1964, 136, A1187.

137
(124) Colson, W. B.; Sessler, A. M. Annu. Rev. Nucl. Part. Sci. 1985, 35, 25-54.
(125) Colson, W. B.; Johnson, E. D.; Kelly, M. J.; Schwettman, H. A. Phys. Today 2002, 55, 35-41.
(126) O'Shea, P. G.; Freuden, H. P. Science 2001, 292, 1853-1858.
(127) Oepts, D.; van der Meer, A. F. G.; van Amersfoort, P. W. Infrared Phys. Technol. 1995, 36, 297-308.
(128) Gaucher, S. P.; Leary, J. A. Anal. Chem. 1998, 70, 3009-3014.
(129) Gaucher, S. P.; Leary, J. A. J. Am. Soc. Mass Spectrom. 1999, 10, 269.
(130) Smith, G.; Leary, J. A. J. Am. Chem. Soc. 1998, 120, 13046-13056.
(131) Desaire, H.; Leary, J. A. Anal. Chem. 1999, 71, 1997-2002.
(132) Smith, G.; Leary, J. A. J. Am. Soc. Mass Spectrom. 1996, 7, 953-957.
(133) Madhusudanan, K. P. J. Mass Spectrom. 2006, 41, 1096-1104.
(134) Salpin, J.-Y.; Tortajada, J. J. Phys. Chem. A 2003, 107, 2943-2953.
(135) March, R. E.; Stadey, C. J. Rapid Commun Mass Spectrom. 2005, 19, 805-812.
(136) Ikonomou, M. G.; Kebarle, P. J. J. Am. Soc. Mass Spectrom. 1994, 5, 791-799.
(137) Wigger, M.; Nawrocki, J. P.; Watson, C. H.; Eyler, J. R.; Benner, S. A. Rapid Commun. Mass Spectrom. 1997, 11, 1749-1752.
(138) Wu, S.; Zhang, K.; Kaiser, N. K.; Bruce, J. E.; Prior, D. C.; Anderson, G. A. J. Am. Soc. Mass Spectrom. 2006, 17, 772-779.
(139) Caravatti, P.; Allemann, M. Org. Mass Spectrom. 1991, 26, 514-518.
(140) Urdan, T. C. Statistics in Plain English, 2 ed.; Lawrence Erlbaum Associates, Inc. : Mahwah, 2005.
(141) Zhou, Z.; Ogden, S.; Leary, J. A. J. Org. Chem. 1990, 55, 5444-5446.
(142) Zhang, J.; Schubothe, K.; Li, B.; Russell, S.; Lebrilla, C. B. Anal. Chem. 2005, 77, 208-214.
(143) Daikoku, S.; Ako, T.; Kurimoto, A.; Kanie, O. J. Mass Spectrom. 2007, 42, 417-423.
(144) Konig, S.; Leary, J. A. J. Am. Soc. Mass Spectrom. 1998, 9, 1125-1134.
(145) Jiang, Y.; Cole, R. B. J. Am. Soc. Mass Spectrom. 2005, 16, 60-70.
138
(146) Prome, D.; Prome, J.-C.; Puze, G.; Aurelle, H. Carbohydr. Res. 1985, 140, 121-129.
(147) Zhu, J.; Cole, R. B. J. Am. Soc. Mass Spectrom. 2001, 12, 1193-1204.
(148) Valle, J. J.; Eyler, J. R.; Oomens, J.; Moore, D. T.; van der Meer, A. F. G.; Von Helden, G.; Meijer, G.; Hendrickson, C. L.; Marshall, A. G.; Blakney, G. T. Rev. Sci. Instrum. 2005, 76, 023103.

139
BIOGRAPHICAL SKETCH
Sarah Elizabeth Stefan was born in 1983 to Robert and Elizabeth Stefan. She grew up in
Plymouth, Massachusetts, with her parents and four siblings. Sarah attended Plymouth public
schools for elementary through high school. She graduated in the top five of her high school
class in May 2001. She then attended Wheaton College, a small liberal arts college in Norton,
Massachusetts. Under the direction of Dr. Laura Muller, she worked on her undergraduate
honor’s thesis entitled Analysis of Fingerprint Residue via Infrared Microscopy. In May 2005,
she graduated summa cume laude and with chemistry departmental honors, receiving a Bachelor
of Arts degree in chemistry with a minor in American politics. After graduation, Sarah moved to
Gainesville, Florida, to begin her graduate studies in analytical chemistry at the University of
Florida. She then joined the group of Dr. John Eyler and began her work using infrared multiple
photon dissociation and Fourier transform ion cyclotron resonance mass spectrometry in the
differentiation of carbohydrates. She received her Doctor of Philosophy from the University of
Florida in the spring of 2009.
Recommended