
Time Spent – Major Media
May 2011

Time Spent• The statistics contained on the following pages provide a snap shot of the time
Canadians spend on a weekly basis with major media
• To provide an apples to apples comparison, we have used the RTS consumer data from BBM Analytics as the source for cross-media statistics
• RTS is a “return to sample” survey which is sent to those people who participate in the measurement of Radio in Canada; while it is based on a very robust sample of more than 50K people, it is a self reported survey that relies on the ability of people to recall their behaviour, a very difficult task; ultimately in surveys people report what they "think" they do, and this does not always correspond to what they actually do
• Therefore, on each slide we have included the time spent data produced by Portable People Meters (PPM) which are the devices that produce the currency data on which television advertising is bought and sold in Canada; electronically measured, this system eliminates the misreporting inherent in recall surveys
• Likewise, through measurement by comScore the online industry also provides measured rather than reported data for online usage, and where this data has been made available to TVB we have also included it on the following pages
• Based on the measured data from PPM and comScore, Television remains the medium to which Canadians allocate most of their time spent with media

Adults

Average Per Capita Weekly Time SpentHours - Adults 18+
Source: BBM Analytics RTS Spring 2011; BBM PPM 2010/11 52-week Avg; comScore 3-month Avg Q2-2011
Television PPM
Television RTS
Radio Newspaper Magazine Internet comScore
Internet RTS
29.4
23.7
18.3
2.50.8
10.1
17.2

Average Per Capita Weekly Time SpentHours - Adults 18-34
Source: BBM Analytics RTS Spring 2011; BBM PPM 2010/11 52-week Avg; comScore 3-month Avg Q2-2011
Television PPM
Television RTS
Radio Newspaper Magazine Internet comScore
Internet RTS
22.4
19.2
14.0
0.9 0.4
10.5
25.1

Average Per Capita Weekly Time SpentHours - Adults 18-49
Source: BBM Analytics RTS Spring 2011; BBM PPM 2010/11 52-week Avg; comScore 3-month Avg Q2-2011
Television PPM
Television RTS
Radio Newspaper Magazine Internet comScore
Internet RTS
23.7
20.4
16.5
1.20.5
10.8
21.5

Average Per Capita Weekly Time SpentHours - Adults 25-49
Source: BBM Analytics RTS Spring 2011; BBM PPM 2010/11 52-week Avg
Television PPM
Television RTS
Radio Newspaper Magazine Internet
23.8
21.4
17.5
1.30.5
19.4

Average Per Capita Weekly Time SpentHours - Adults 25-54
Source: BBM Analytics RTS Spring 2011; BBM PPM 2010/11 52-week Avg; comScore 3-month Avg Q2-2011
Television PPM
Television RTS
Radio Newspaper Magazine Internet comScore
Internet RTS
25.0
22.0
18.0
1.50.6
10.8
18.7

Average Per Capita Weekly Time SpentHours - Adults 35-49
Source: BBM Analytics RTS Spring 2011; BBM PPM 2010/11 52-week Avg
Television PPM
Television RTS
Radio Newspaper Magazine Internet
25.0
21.6
19.0
1.50.5
17.8

Average Per Capita Weekly Time SpentHours - Adults 35-54
Source: BBM Analytics RTS Spring 2011; BBM PPM 2010/11 52-week Avg
Television PPM
Television RTS
Radio Newspaper Magazine Internet
26.4
22.5
19.3
1.70.6
17.2

Average Per Capita Weekly Time SpentHours - Adults 50+
Source: BBM Analytics RTS Spring 2011; BBM PPM 2010/11 52-week Avg
Television PPM
Television RTS
Radio Newspaper Magazine Internet
36.9
28.0
20.8
4.2
1.1
11.6

Average Per Capita Weekly Time SpentHours - Adults 55+
Source: BBM Analytics RTS Spring 2011; BBM PPM 2010/11 52-week Avg; comScore 3-month Avg Q2-2011
Television PPM
Television RTS
Radio Newspaper Magazine Internet comScore
Internet RTS
38.8
28.9
21.0
4.8
1.3
8.410.4

Average Per Capita Weekly Time SpentHours - Adults 60+
Source: BBM Analytics RTS Spring 2011; BBM PPM 2010/11 52-week Avg
Television PPM
Television RTS
Radio Newspaper Magazine Internet
40.5
29.4
21.0
5.3
1.3
9.3

Males

Average Per Capita Weekly Time SpentHours - Males 18+
Source: BBM Analytics RTS Spring 2011; BBM PPM 2010/11 52-week Avg
Television PPM
Television RTS
Radio Newspaper Magazine Internet
28.0
22.8
18.8
2.50.6
18.7

Average Per Capita Weekly Time SpentHours - Males 18-34
Source: BBM Analytics RTS Spring 2011; BBM PPM 2010/11 52-week Avg
Television PPM
Television RTS
Radio Newspaper Magazine Internet
21.4
18.0
14.8
0.9 0.3
26.5
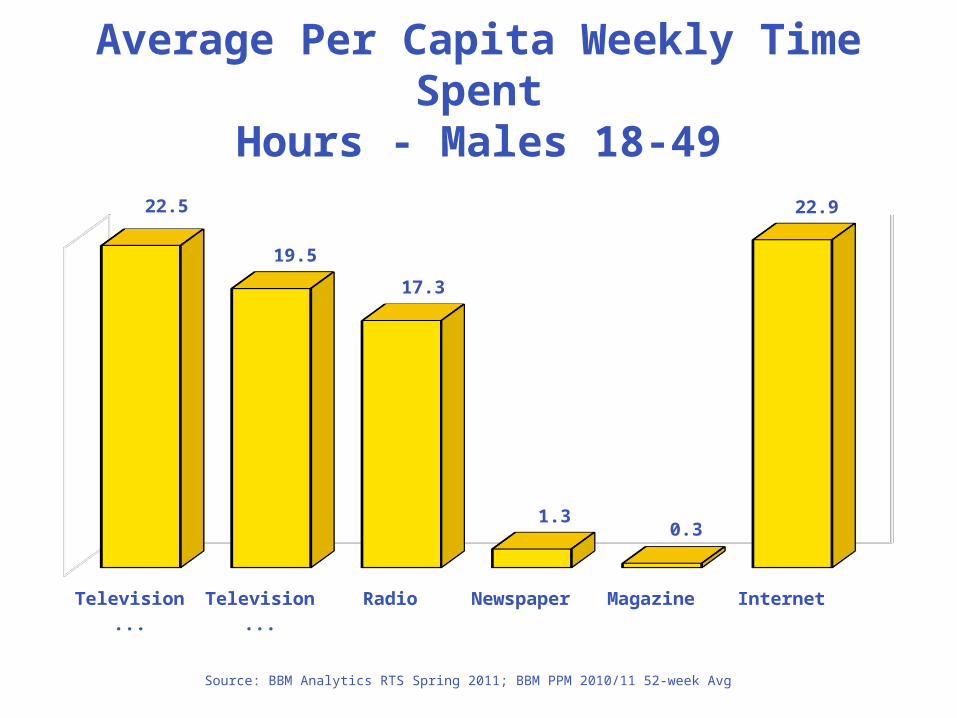
Average Per Capita Weekly Time SpentHours - Males 18-49
Source: BBM Analytics RTS Spring 2011; BBM PPM 2010/11 52-week Avg
Television PPM
Television RTS
Radio Newspaper Magazine Internet
22.5
19.5
17.3
1.30.3
22.9

Average Per Capita Weekly Time SpentHours - Males 25-49
Source: BBM Analytics RTS Spring 2011; BBM PPM 2010/11 52-week Avg
Television PPM
Television RTS
Radio Newspaper Magazine Internet
22.4
20.7
18.5
1.50.4
21.0

Average Per Capita Weekly Time SpentHours - Males 25-54
Source: BBM Analytics RTS Spring 2011; BBM PPM 2010/11 52-week Avg
Television PPM
Television RTS
Radio Newspaper Magazine Internet
23.7
21.4
19.0
1.60.4
20.1
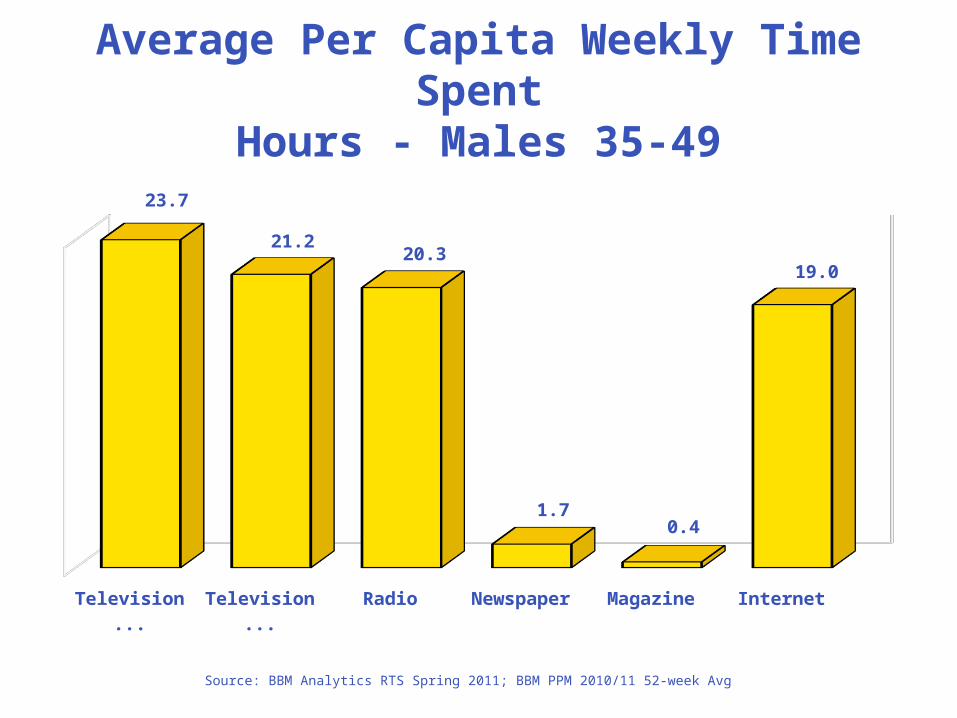
Average Per Capita Weekly Time SpentHours - Males 35-49
Source: BBM Analytics RTS Spring 2011; BBM PPM 2010/11 52-week Avg
Television PPM
Television RTS
Radio Newspaper Magazine Internet
23.7
21.220.3
1.70.4
19.0

Average Per Capita Weekly Time SpentHours - Males 35-54
Source: BBM Analytics RTS Spring 2011; BBM PPM 2010/11 52-week Avg
Television PPM
Television RTS
Radio Newspaper Magazine Internet
25.2
22.120.3
1.90.5
18.2
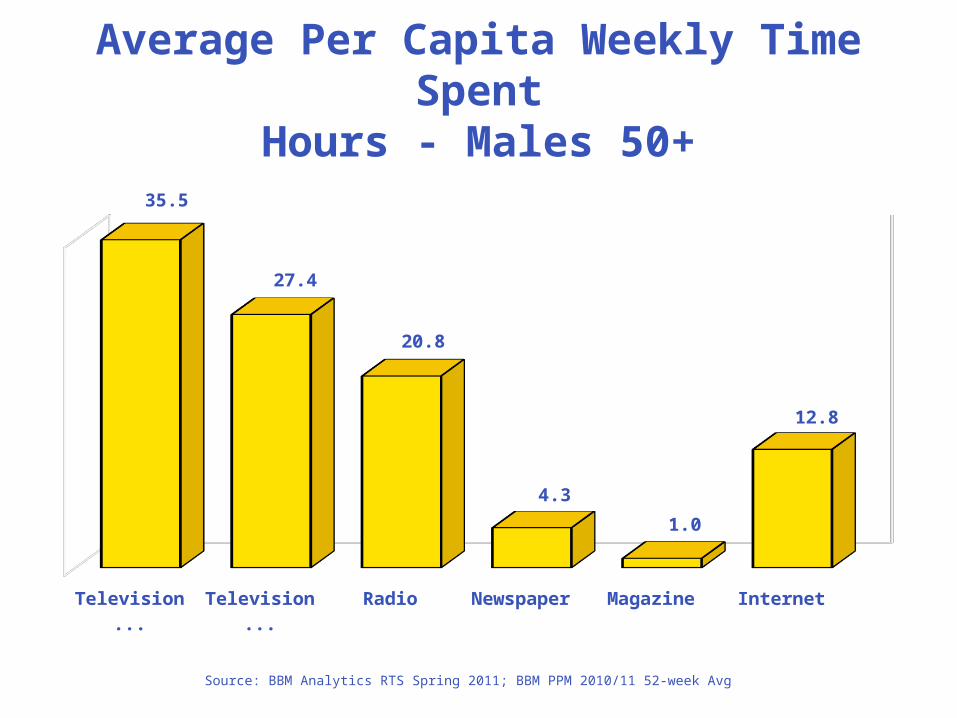
Average Per Capita Weekly Time SpentHours - Males 50+
Source: BBM Analytics RTS Spring 2011; BBM PPM 2010/11 52-week Avg
Television PPM
Television RTS
Radio Newspaper Magazine Internet
35.5
27.4
20.8
4.3
1.0
12.8

Average Per Capita Weekly Time SpentHours - Males 55+
Source: BBM Analytics RTS Spring 2011; BBM PPM 2010/11 52-week Avg
Television PPM
Television RTS
Radio Newspaper Magazine Internet
37.4
28.3
21.0
4.9
1.1
11.8

Average Per Capita Weekly Time SpentHours - Males 60+
Source: BBM Analytics RTS Spring 2011; BBM PPM 2010/11 52-week Avg
Television PPM
Television RTS
Radio Newspaper Magazine Internet
39.0
28.8
20.5
5.3
1.2
10.8

Females

Average Per Capita Weekly Time SpentHours - Females 18+
Source: BBM Analytics RTS Spring 2011; BBM PPM 2010/11 52-week Avg
Television PPM
Television RTS
Radio Newspaper Magazine Internet
30.8
24.5
17.8
2.50.9
15.8

Average Per Capita Weekly Time SpentHours - Females 18-34
Source: BBM Analytics RTS Spring 2011; BBM PPM 2010/11 52-week Avg
Television PPM
Television RTS
Radio Newspaper Magazine Internet
23.4
20.5
13.5
0.8 0.5
23.6
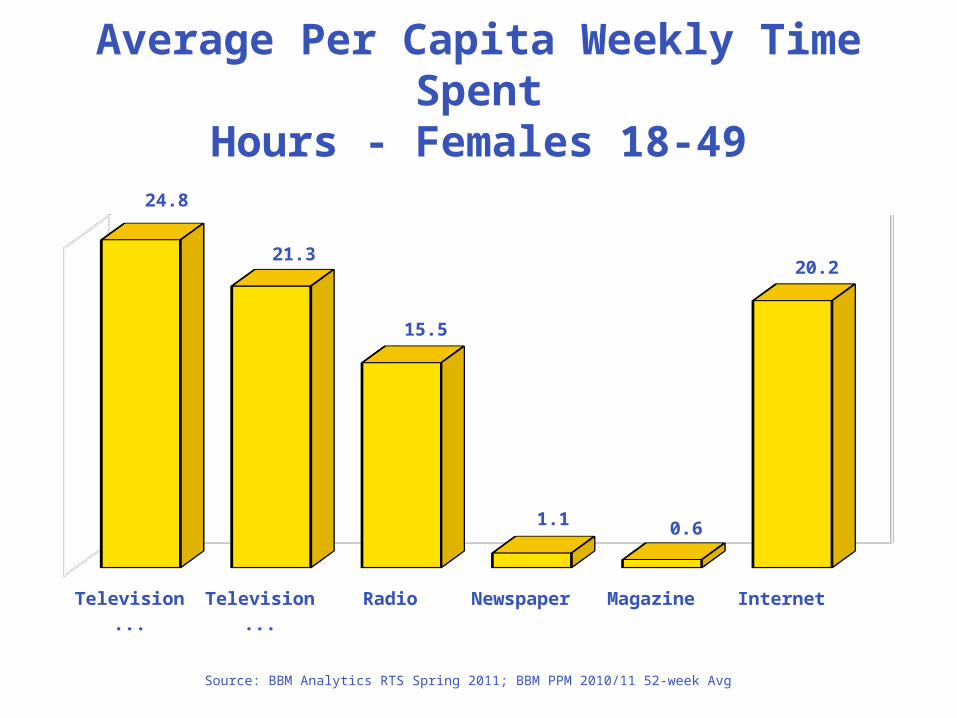
Average Per Capita Weekly Time SpentHours - Females 18-49
Source: BBM Analytics RTS Spring 2011; BBM PPM 2010/11 52-week Avg
Television PPM
Television RTS
Radio Newspaper Magazine Internet
24.8
21.3
15.5
1.1 0.6
20.2

Average Per Capita Weekly Time SpentHours - Females 25-49
Source: BBM Analytics RTS Spring 2011; BBM PPM 2010/11 52-week Avg
Television PPM
Television RTS
Radio Newspaper Magazine Internet
25.1
22.0
16.8
1.1 0.6
17.7
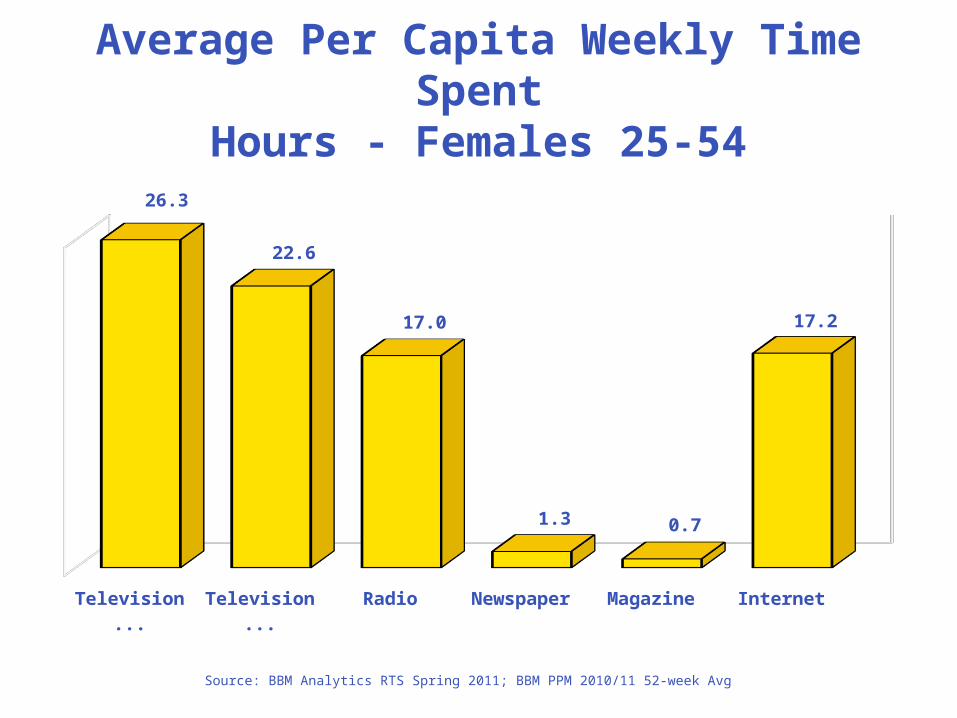
Average Per Capita Weekly Time SpentHours - Females 25-54
Source: BBM Analytics RTS Spring 2011; BBM PPM 2010/11 52-week Avg
Television PPM
Television RTS
Radio Newspaper Magazine Internet
26.3
22.6
17.0
1.3 0.7
17.2

Average Per Capita Weekly Time SpentHours - Females 35-49
Source: BBM Analytics RTS Spring 2011; BBM PPM 2010/11 52-week Avg
Television PPM
Television RTS
Radio Newspaper Magazine Internet
26.2
22.1
17.8
1.3 0.7
16.7

Average Per Capita Weekly Time SpentHours - Females 35-54
Source: BBM Analytics RTS Spring 2011; BBM PPM 2010/11 52-week Avg
Television PPM
Television RTS
Radio Newspaper Magazine Internet
27.7
22.9
18.0
1.60.7
16.2

Average Per Capita Weekly Time SpentHours - Females 50+
Source: BBM Analytics RTS Spring 2011; BBM PPM 2010/11 52-week Avg
Television PPM
Television RTS
Radio Newspaper Magazine Internet
38.2
28.6
20.8
4.21.3
10.4

Average Per Capita Weekly Time SpentHours - Females 55+
Source: BBM Analytics RTS Spring 2011; BBM PPM 2010/11 52-week Avg
Television PPM
Television RTS
Radio Newspaper Magazine Internet
40.0
29.5
21.3
4.7
1.4
9.2

Average Per Capita Weekly Time SpentHours - Females 60+
Source: BBM Analytics RTS Spring 2011; BBM PPM 2010/11 52-week Avg
Television PPM
Television RTS
Radio Newspaper Magazine Internet
41.8
29.9
21.3
5.2
1.4
8.1

English

Average Per Capita Weekly Time SpentHours - English 18+
Source: BBM Analytics RTS Spring 2011; BBM PPM 2010/11 52-week Avg
Television PPM
Television RTS
Radio Newspaper Magazine Internet
28.5
23.9
18.3
2.50.8
18.0

Average Per Capita Weekly Time SpentHours - English 18-34
Source: BBM Analytics RTS Spring 2011; BBM PPM 2010/11 52-week Avg
Television PPM
Television RTS
Radio Newspaper Magazine Internet
22.4
19.3
13.8
0.8 0.4
26.0

Average Per Capita Weekly Time SpentHours - English 18-49
Source: BBM Analytics RTS Spring 2011; BBM PPM 2010/11 52-week Avg
Television PPM
Television RTS
Radio Newspaper Magazine Internet
23.3
20.6
16.3
1.20.5
22.4

Average Per Capita Weekly Time SpentHours - English 25-49
Source: BBM Analytics RTS Spring 2011; BBM PPM 2010/11 52-week Avg
Television PPM
Television RTS
Radio Newspaper Magazine Internet
23.321.6
17.5
1.3 0.5
20.2

Average Per Capita Weekly Time SpentHours - English 25-54
Source: BBM Analytics RTS Spring 2011; BBM PPM 2010/11 52-week Avg
Television PPM
Television RTS
Radio Newspaper Magazine Internet
24.4
22.2
17.8
1.50.6
19.5

Average Per Capita Weekly Time SpentHours - English 35-49
Source: BBM Analytics RTS Spring 2011; BBM PPM 2010/11 52-week Avg
Television PPM
Television RTS
Radio Newspaper Magazine Internet
24.2
21.9
19.0
1.50.6
18.6

Average Per Capita Weekly Time SpentHours - English 35-54
Source: BBM Analytics RTS Spring 2011; BBM PPM 2010/11 52-week Avg
Television PPM
Television RTS
Radio Newspaper Magazine Internet
25.6
22.7
19.0
1.70.6
18.0

Average Per Capita Weekly Time SpentHours - English 50+
Source: BBM Analytics RTS Spring 2011; BBM PPM 2010/11 52-week Avg
Television PPM
Television RTS
Radio Newspaper Magazine Internet
35.3
28.2
20.8
4.3
1.1
12.2

Average Per Capita Weekly Time SpentHours - English 55+
Source: BBM Analytics RTS Spring 2011; BBM PPM 2010/11 52-week Avg
Television PPM
Television RTS
Radio Newspaper Magazine Internet
37.0
29.1
21.3
4.9
1.2
11.0

Average Per Capita Weekly Time SpentHours - English 60+
Source: BBM Analytics RTS Spring 2011; BBM PPM 2010/11 52-week Avg
Television PPM
Television RTS
Radio Newspaper Magazine Internet
38.5
29.7
21.3
5.3
1.3
9.8

French

Average Per Capita Weekly Time SpentHours - French 18+
Source: BBM Analytics RTS Spring 2011; BBM PPM 2010/11 52-week Avg
Television PPM
Television RTS
Radio Newspaper Magazine Internet
37.3
23.8
19.3
2.60.8
14.0

Average Per Capita Weekly Time SpentHours - French 18-34
Source: BBM Analytics RTS Spring 2011; BBM PPM 2010/11 52-week Avg
Television PPM
Television RTS
Radio Newspaper Magazine Internet
27.6
19.3
15.8
1.0 0.4
20.5

Average Per Capita Weekly Time SpentHours - French 18-49
Source: BBM Analytics RTS Spring 2011; BBM PPM 2010/11 52-week Avg
Television PPM
Television RTS
Radio Newspaper Magazine Internet
28.8
20.3
18.0
1.2 0.4
17.6

Average Per Capita Weekly Time SpentHours - French 25-49
Source: BBM Analytics RTS Spring 2011; BBM PPM 2010/11 52-week Avg
Television PPM
Television RTS
Radio Newspaper Magazine Internet
28.9
21.520.0
1.3 0.5
15.7

Average Per Capita Weekly Time SpentHours - French 25-54
Source: BBM Analytics RTS Spring 2011; BBM PPM 2010/11 52-week Avg
Television PPM
Television RTS
Radio Newspaper Magazine Internet
30.8
22.220.0
1.5 0.5
15.2
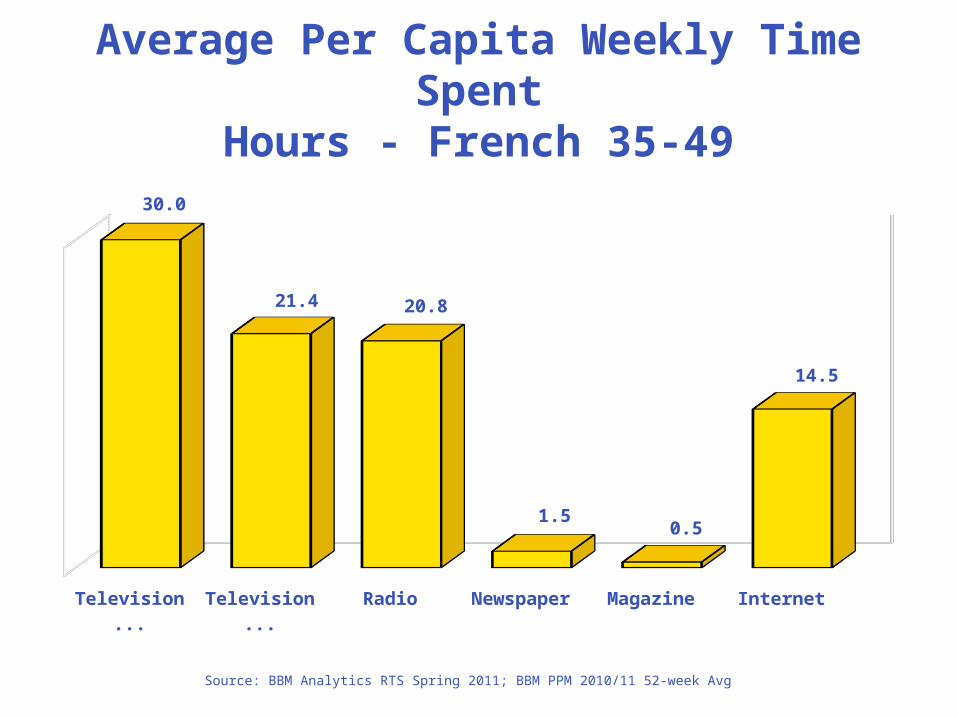
Average Per Capita Weekly Time SpentHours - French 35-49
Source: BBM Analytics RTS Spring 2011; BBM PPM 2010/11 52-week Avg
Television PPM
Television RTS
Radio Newspaper Magazine Internet
30.0
21.4 20.8
1.50.5
14.5

Average Per Capita Weekly Time SpentHours - French 35-54
Source: BBM Analytics RTS Spring 2011; BBM PPM 2010/11 52-week Avg
Television PPM
Television RTS
Radio Newspaper Magazine Internet
32.2
22.520.8
1.80.5
14.1

Average Per Capita Weekly Time SpentHours - French 50+
Source: BBM Analytics RTS Spring 2011; BBM PPM 2010/11 52-week Avg
Television PPM
Television RTS
Radio Newspaper Magazine Internet
45.4
28.1
20.8
4.31.3
9.5

Average Per Capita Weekly Time SpentHours - French 55+
Source: BBM Analytics RTS Spring 2011; BBM PPM 2010/11 52-week Avg
Television PPM
Television RTS
Radio Newspaper Magazine Internet
47.7
28.9
20.8
4.81.4
8.6
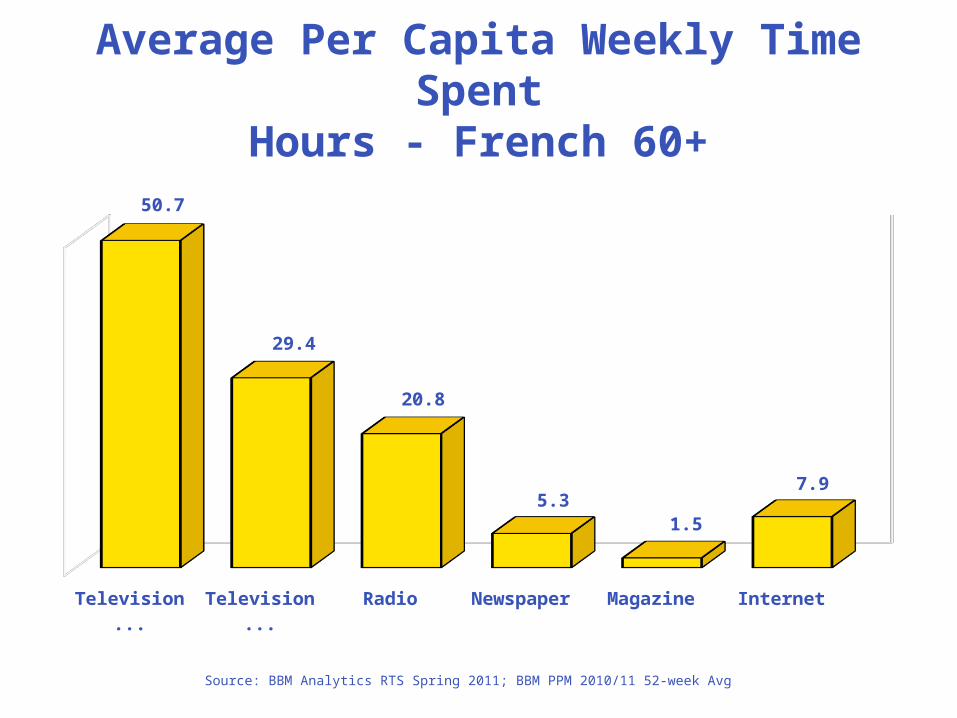
Average Per Capita Weekly Time SpentHours - French 60+
Source: BBM Analytics RTS Spring 2011; BBM PPM 2010/11 52-week Avg
Television PPM
Television RTS
Radio Newspaper Magazine Internet
50.7
29.4
20.8
5.31.5
7.9

Regions

Average Per Capita Weekly Time SpentHours - B.C. Adults 18+
Source: BBM Analytics RTS Spring 2011; BBM PPM 2010/11 52-week Avg; * based on Van/Vic EM
Television PPM *
Television RTS
Radio Newspaper Magazine Internet
27.3
22.7
16.3
2.30.7
18.5

Average Per Capita Weekly Time SpentHours - Prairies Adults 18+
Source: BBM Analytics RTS Spring 2011; BBM PPM 2010/11 52-week Avg; * based on Atlantic/Prairie average
Television PPM *
Television RTS
Radio Newspaper Magazine Internet
30.0
24.4
18.0
2.40.7
17.9

Average Per Capita Weekly Time SpentHours - Ontario Adults 18+
Source: BBM Analytics RTS Spring 2011; BBM PPM 2010/11 52-week Avg
Television PPM
Television RTS
Radio Newspaper Magazine Internet
27.9
23.5
18.3
2.50.7
18.6

Average Per Capita Weekly Time SpentHours - Quebec Adults 18+
Source: BBM Analytics RTS Spring 2011; BBM PPM 2010/11 52-week Avg
Television PPM
Television RTS
Radio Newspaper Magazine Internet
33.0
23.8
19.3
2.70.8
14.0

Average Per Capita Weekly Time SpentHours - Quebec French Adults 18+
Source: BBM Analytics RTS Spring 2011; BBM PPM 2010/11 52-week Avg
Television PPM
Television RTS
Radio Newspaper Magazine Internet
34.2
23.9
19.5
2.60.8
13.8

Average Per Capita Weekly Time SpentHours - Atlantic Adults 18+
Source: BBM Analytics RTS Spring 2011; BBM PPM 2010/11 52-week Avg; * based on Atlantic/Prairie average
Television PPM *
Television RTS
Radio Newspaper Magazine Internet
30.0
24.6
19.5
2.60.9
16.2
Recommended


