Thin Film Module ReliabilityThin Film Module Reliability –– enabling solar electricity generationenabling solar electricity generation
Markus Beck, Pedro Gonzalez, Richard Gruber, Jim Tyler
enabling solar electricity generationenabling solar electricity generation
Our MissionOur Mission To create enduring value by enabling a world powered by clean affordable solar electricity powered by clean, affordable solar electricity.
© 2009 First Solar, Inc. 2
600
800
200
400
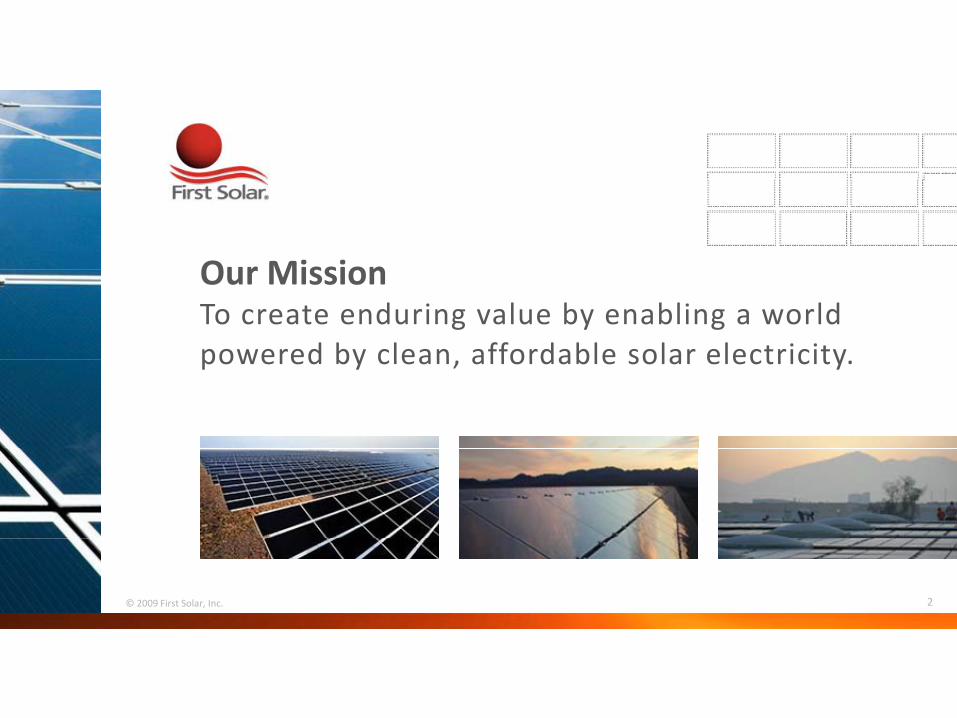
Sustainable Environmental Profile Carbon Footprint is a Fraction of Conventional Sources Carbon Footprint is a Fraction of Conventional Sources
1000
800
Carbonn
footprint
(gCO
2 ‐‐eq
/kWh)
400
900 850
400 First Solar
45 25 24 15 11 00
Coal Oil Gas CC Biomass PV multi‐Si Nuclear PV CdTe Wind CHP (13.2%)* (US) (10.9%)**
Sources: *de Wild Scholten M presented at CrystalClear Final Event in Munich on May 26 2009 **de Wild Scholten M Solar as anSources: *de Wild‐Scholten, M., presented at CrystalClear Final Event in Munich on May 26, 2009. **de Wild‐Scholten, M., ‘Solar as an environmental product: Thin‐film modules – production processes and their environmental assessment,’ presented at the Thin Film Industry Forum, Berlin, April, 2009. Both PV technologies use insolation of 1700 kWh/m2. All other data from ExternE project, 2003; Kim and Dale, 2005; Fthenakis and Kim, 2006: Fthenakis and Alsema, 2006; Fthenakis and Kim, in press.
© 2009 First Solar, Inc. 3
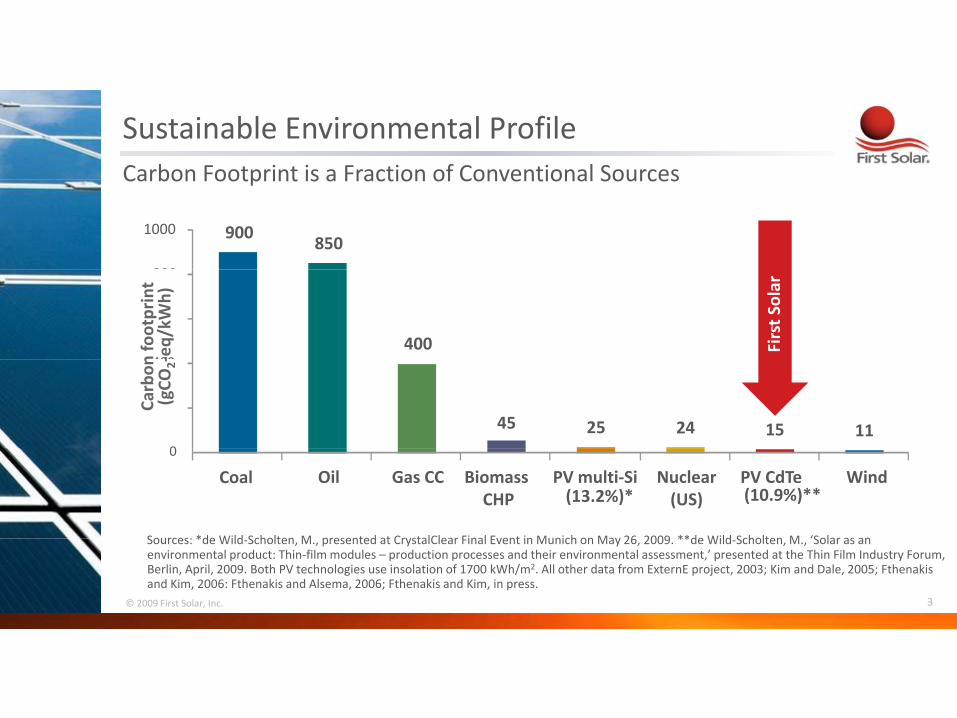
First Solar’s Energy Payback Time (EPBT) < 1 year
EPBT:EPBT:
The amount of time a system must operate to recover thhe energy thhat was required toi d fabricate the system
– EPBT = Einput/(Eoutput/yr)
Objective: Minimize EPBT – Supports rappid scalabilitypp y
– <1 year ensures industry growth does not create near term energy deficit
Note: Southern Europe 1700 kWh/m2/year irradiance.
Source: de Wild‐Scholten, M., ‘Solar as an environmental product: Thin‐film modules – production processes and their environmental assessment,’ presented at the Thin Film Industry Forum, Berlin, April, 2009
© 2009 First Solar, Inc. 4

Production Capacity Growth (year‐end capacity) Current and announced capacity grows by 1.3GW (92%) to 2.7GW Current and announced capacity grows by 1.3GW (92%) to 2.7GW
CapacityCapacity
USA
Vietnam France
Plant 5 & 6
Plant 2
Malaysia
Germany
Ohio, USA
Representation of year‐end capacity. 2005 & 2006 based on Q4 06 run rate; 2007 based on Q4 07 run rate; 2008 based on Q4 08 run rate; 2009 based on Q4 09 run rate, 2010‐2012 based on Q3 10 run‐rate.
© Copyright 2010, First Solar, Inc. 5
$
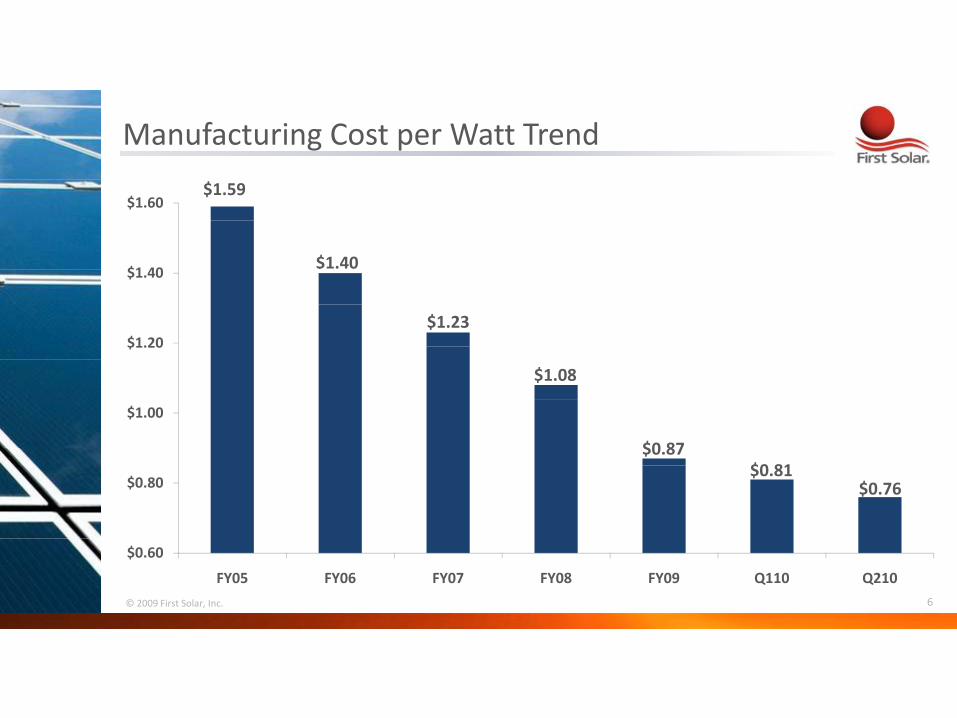
Manufacturing Cost per Watt Trend
$1.59 $1.60
$1.40$1 40 $1.40
$1.23 $1.20
$1.08
$1.00
$0 87 $0.87 $0.81
$0.80 $0.76
$0.60
FY05 FY06 FY07 FY08 FY09 Q110 Q210
© 2009 First Solar, Inc. 6
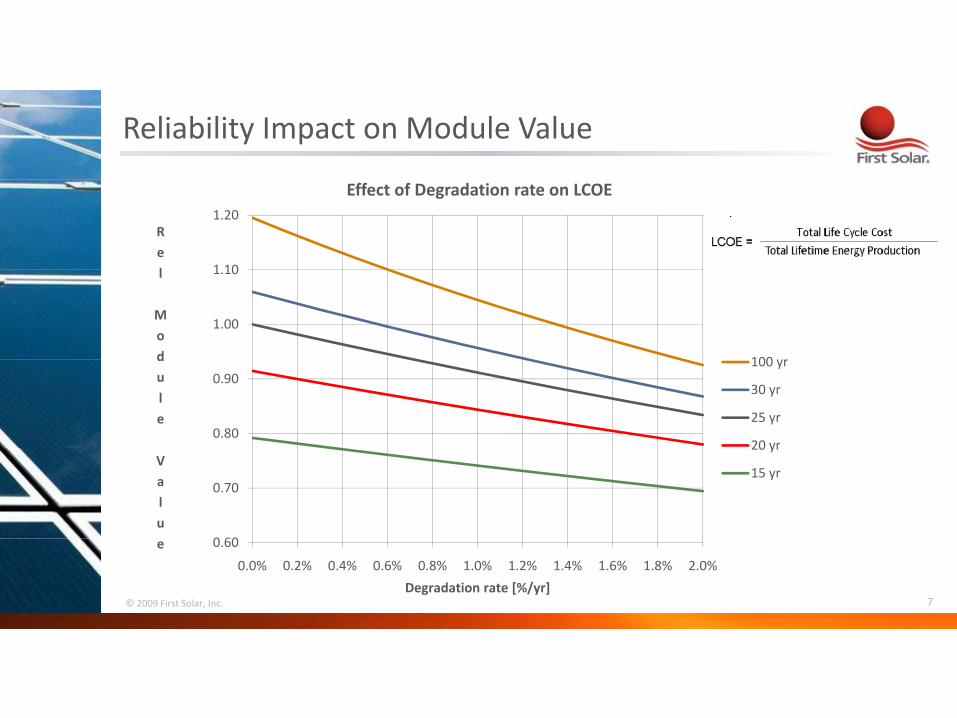
Reliability Impact on Module Value
1 10
1.20 R
e
l
Effect of Degradation rate on LCOE
1.00
1.10l
M
o
d 100
0.80
0.90
d
u
l e
100 yr
30 yr
25 yr
20 yr
0 60
0.70
V
a
l u
20 yr
15 yr
© 2009 First Solar, Inc. 7
0.60
0.0% 0.2% 0.4% 0.6% 0.8% 1.0% 1.2% 1.4% 1.6% 1.8% 2.0%
e
Degradation rate [%/yr]
• •
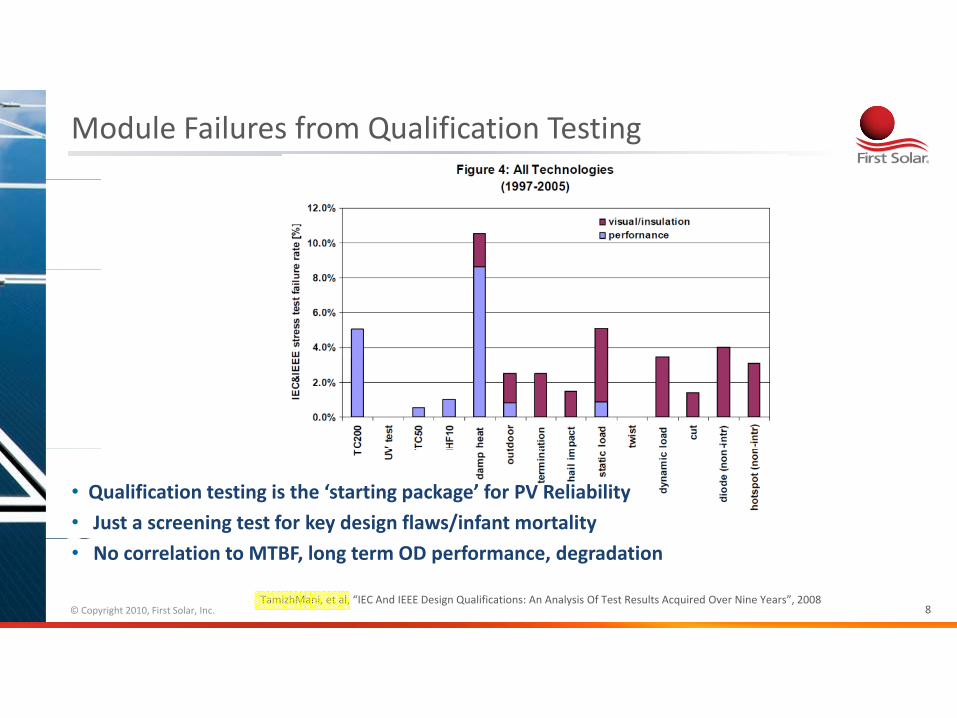
Module Failures from Qualification Testing
• Qualification testing is the ‘starting package’ for PV Reliability
Just a screening test for key design flaws/infant mortality
No correlation to MTBF, long term OD performance, degradation
TamizhMani, et al, “IEC And IEEE Design Qualifications: An Analysis Of Test Results Acquired Over Nine Years”, 2008 © Copyright 2010, First Solar, Inc. 8
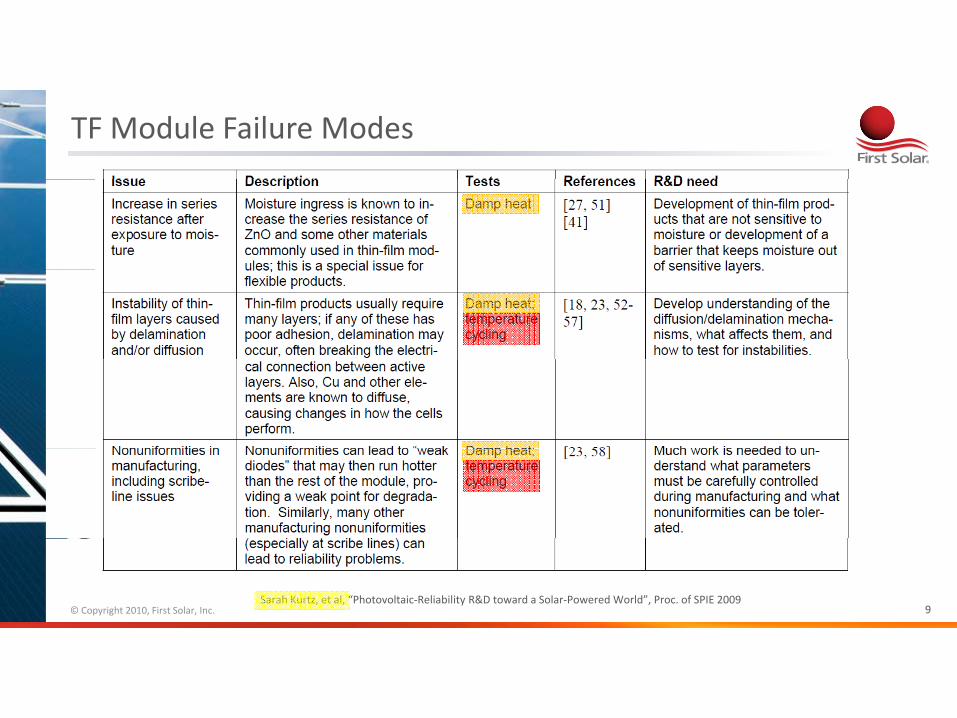
TF Module Failure Modes
Sarah Kurtz, et al, “Photovoltaic‐Reliability R&D toward a Solar‐Powered World”, Proc. of SPIE 2009 © Copyright 2010, First Solar, Inc. 9

TF Module Failure Modes cont.
Nick Bosco, “Reliability Concerns Associated with PV Technologies“, NREL © Copyright 2010, First Solar, Inc. 10
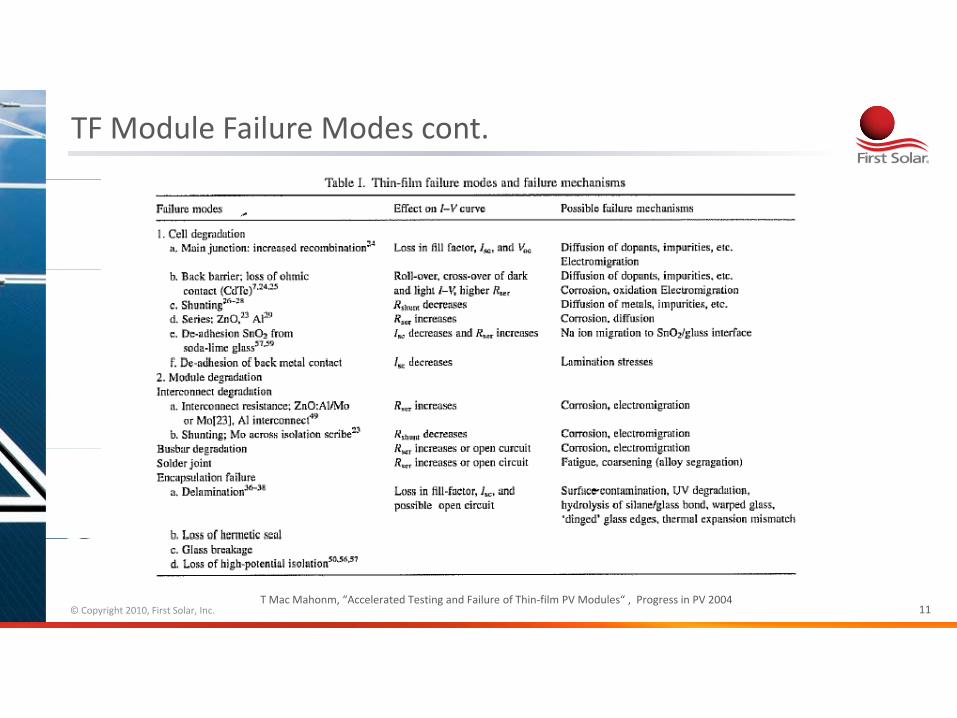
TF Module Failure Modes cont.
T Mac Mahonm, “Accelerated Testing and Failure of Thin‐film PV Modules“ , Progress in PV 2004 © Copyright 2010, First Solar, Inc. 11

Humidity is an important stress factor
(1)
EEaa
k Ao e
RT
Diffusivity of water follows an Arrhenius model
Choose materials that limit water ingress!
(2) D. J. Coyle, H. A. Blaydes, J. E. Pickett et al., “Degradation kinetics of CIGS solar cells,” Proceedings of the 2009 34th IEEE Photovoltaic Specialists Conference (PVSC 2009), pp. 001943‐7, 2009.
(1) M. Kempe, “Control of Moisture Ingress into Photovoltaic Modules” IEEE PVSC, 2005
© Copyright 2010, First Solar, Inc. 12
••
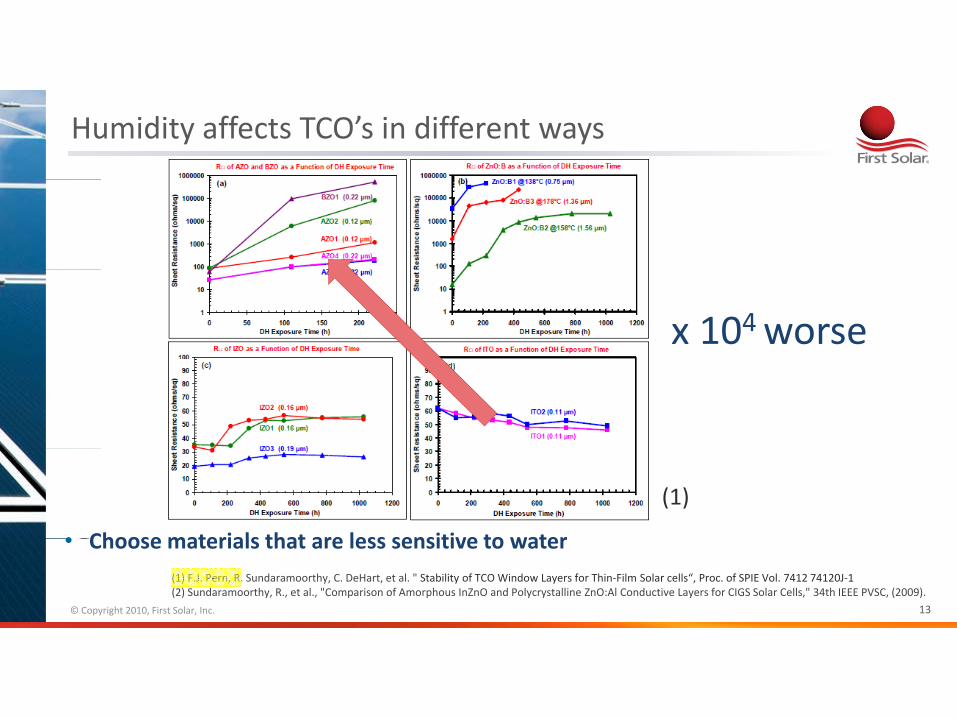
Humidity affects TCO’s in different ways
x 104 worse
(1)
Choose materials that are less sensitive to water Choose materials that are less sensitive to water (1) F.J. Pern, R. Sundaramoorthy, C. DeHart, et al. " Stability of TCO Window Layers for Thin‐Film Solar cells“, Proc. of SPIE Vol. 7412 74120J‐1 (2) Sundaramoorthy, R., et al., "Comparison of Amorphous InZnO and Polycrystalline ZnO:Al Conductive Layers for CIGS Solar Cells," 34th IEEE PVSC, (2009).
© Copyright 2010, First Solar, Inc. 13
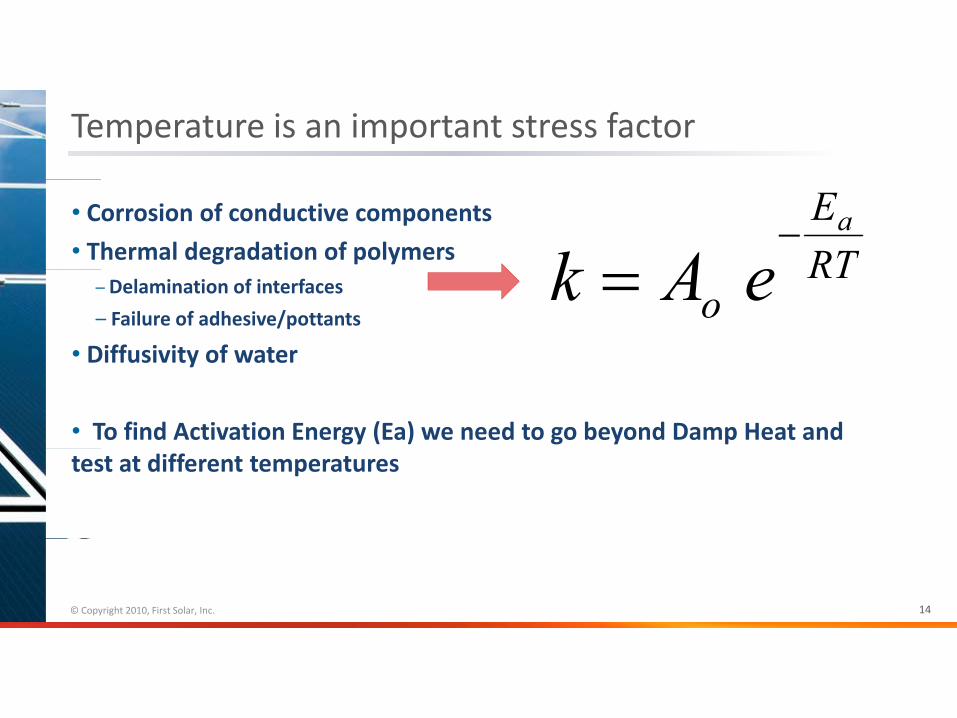
Temperature is an important stress factor
• Corrosion of conductive components Ea• Thermal degradation of polymers RT – Delamination of interfaces k AAo ee RTk – Failure of adhesive/pottants
• Diffusivity of water Diffusivity of water
• To find Activation Energy (Ea) we need to go beyond Damp Heat and test at different temperatures
© Copyright 2010, First Solar, Inc. 14
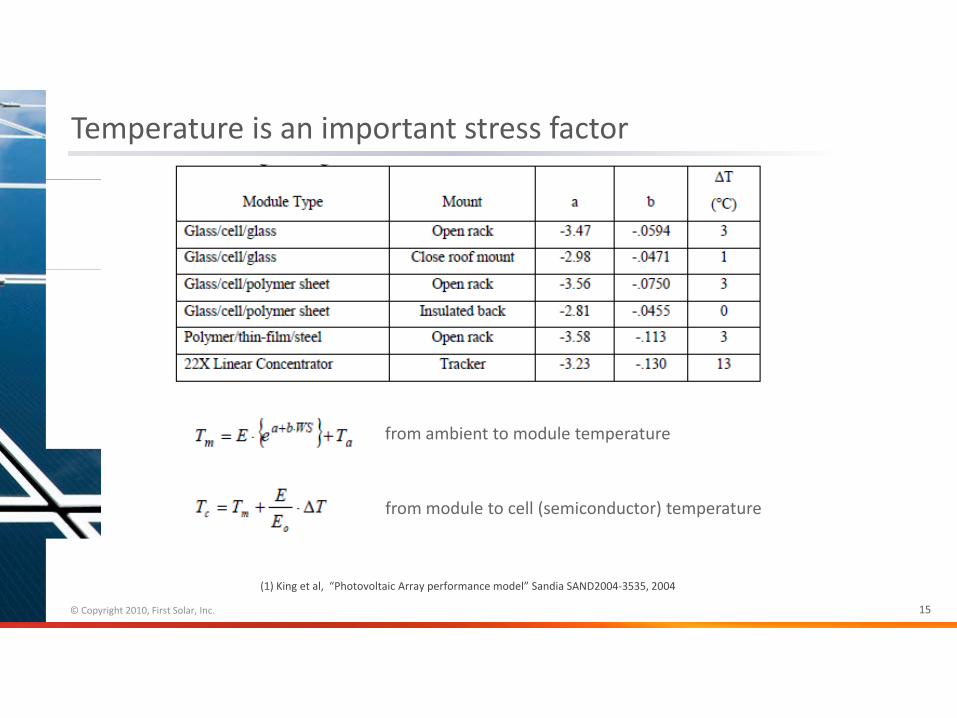
Temperature is an important stress factor
from ambient to module temperature
from module to cell (semiconductor) temperature
(1) King et al, “Photovoltaic Array performance model” Sandia SAND2004‐3535, 2004
© Copyright 2010, First Solar, Inc. 15
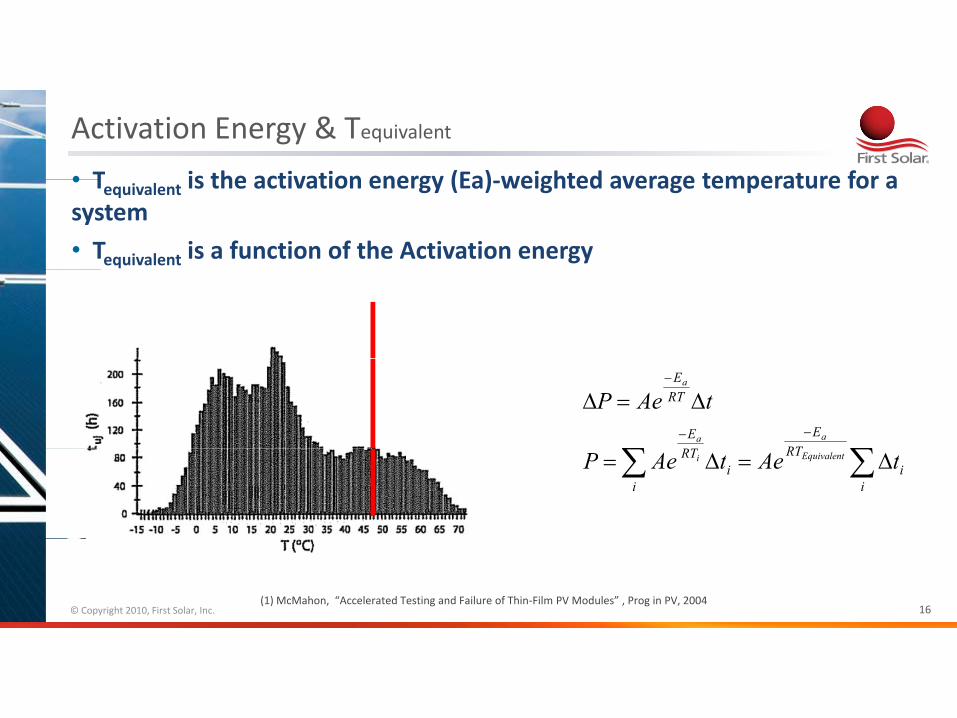
Activation Energy & Tequivalent
• T is the activation energy (Ea) weighted average temperature for a • Tequivalent is the activation energy (Ea)‐weighted average temperature for a system
• Tequivalent is a function of the Activation energy
© Copyright 2010, First Solar, Inc. (1) McMahon, “Accelerated Testing and Failure of Thin‐Film PV Modules” , Prog in PV, 2004
Ea
P Ae RT t E Eaa
RTRTRT RTEquivalentiP Ae ti Ae ti i i
16

Equivalent Temperature for Different Climatic Zones
• We can now answer the question “how long will my module last” for some degradation mechanisms degradation mechanisms
• What comes next? Correlate your lab model with real outdoor data Kent Whitfield, “Evaluation Of High‐temperature Exposure Of Rack‐mounted Photovoltaic Modules”, PVSC IEEE 34th
© Copyright 2010, First Solar, Inc. 17
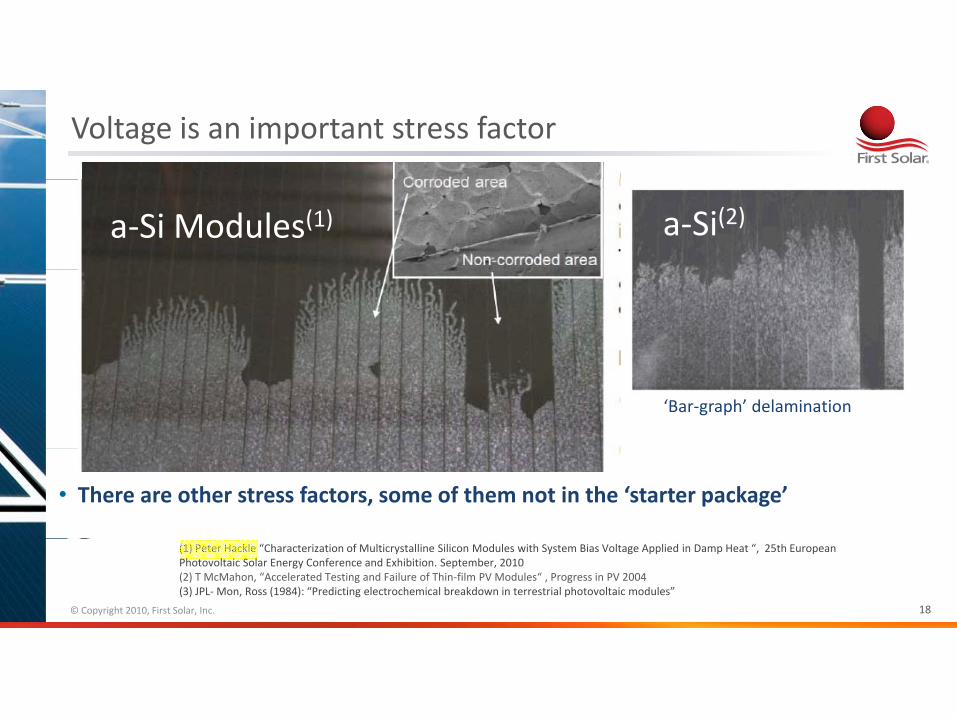
‘Bar‐graph’ delamination
• There are other stress factors, some of them not in the ‘starter package’
Voltage is an important stress factor
a‐Si Modules(1)
(1) Peter Hackle “Characterization of Multicrystalline Silicon Modules with System Bias Voltage Applied in Damp Heat “, 25th European Photovoltaic Solar Energy Conference and Exhibition. September, 2010 (2) T McMahon, “Accelerated Testing and Failure of Thin‐film PV Modules“ , Progress in PV 2004 (3) JPL‐Mon, Ross (1984): “Predicting electrochemical breakdown in terrestrial photovoltaic modules”
© Copyright 2010, First Solar, Inc.
a‐Si(2)
18

PV System Degradation rates
19© Copyright 2010, First Solar, Inc. Dirk Jordan (NREL), “Degradation Rates”, Feb‐2010
Outdoors Performance Monitoring
• energy output E [amount of energy kW AC] • energy output E [amount of energy kW‐AC]
• final PV system yield Yf = E/P0 [takes into account system size]
• pperformance ratio PR = Yf/Y [[size + solar radiation]] f rr
• PTC ratio PTC [size + solar radiation + temperature/wind]
IEC 61724 "Photovoltaic system performance monitoring‐guidelines for measurement, data exchange, and analysis" © Copyright 2010, First Solar, Inc. 20

•
•
Calculation of PV System Degradation rates
The variability on PTC(PVUSA) is lower than PR because it compensates for temperature The variability on PTC(PVUSA) is lower than PR because it compensates for temperature
+3 years of data is recommended to calculate degradation rates
B. Marion, et al, "Performance Parameters for Grid‐Connected PV Systems“, 30th IEEE PVSC, 2005 © Copyright 2010, First Solar, Inc. 21
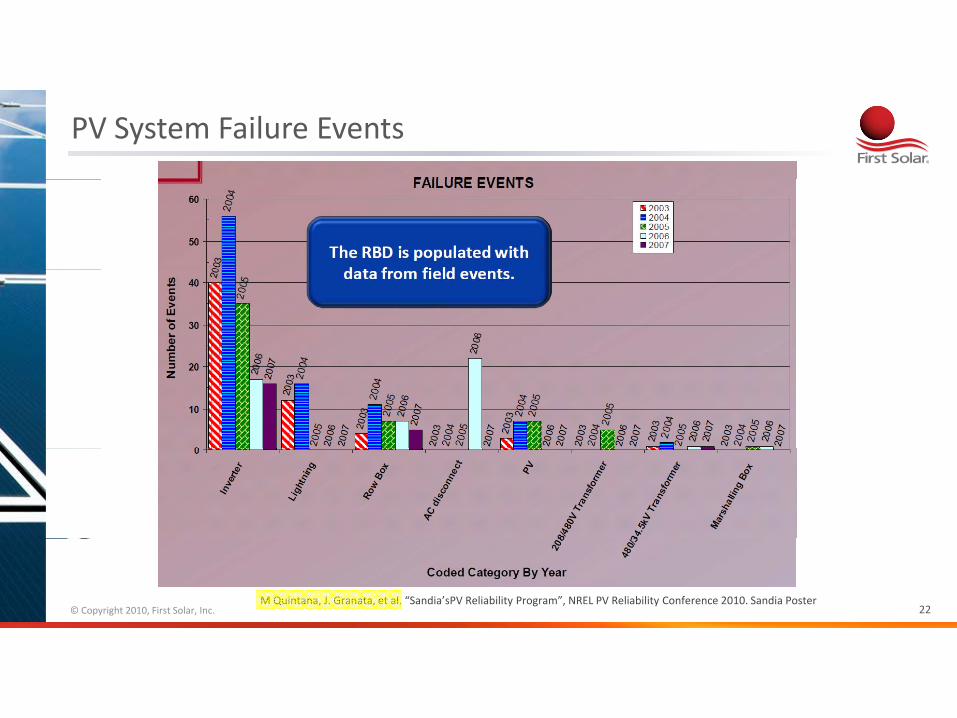
PV System Failure Events
22© Copyright 2010, First Solar, Inc. M Quintana, J. Granata, et al. “Sandia’sPV Reliability Program”, NREL PV Reliability Conference 2010. Sandia Poster
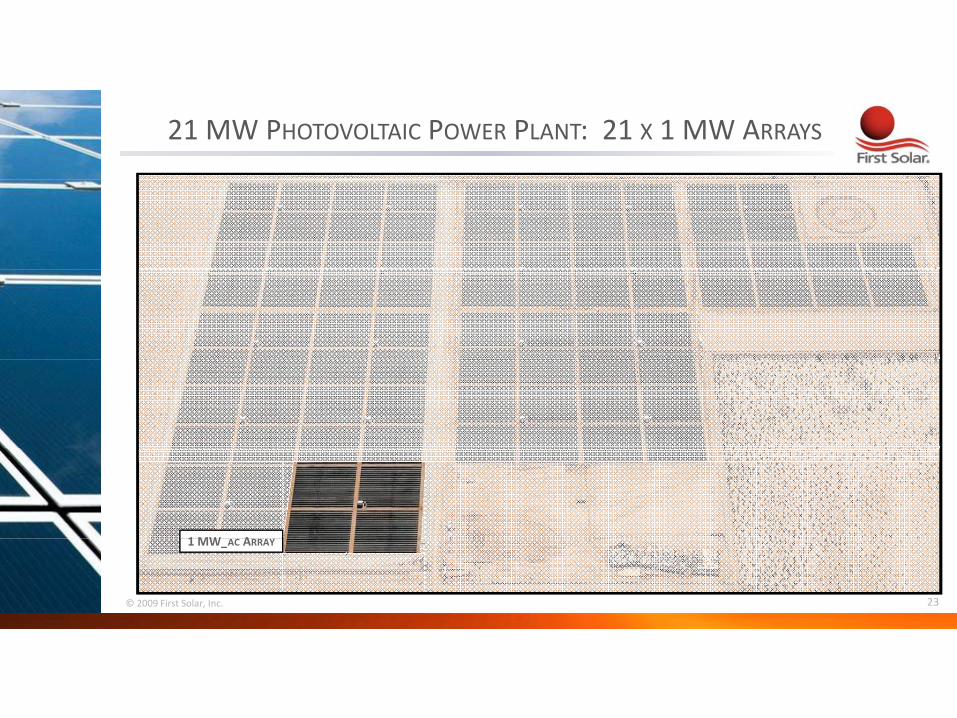
21 MW PHOTOVOLTAIC POWER PLANT: 21 X 1 MW ARRAYS
1 MW A
© 2009 First Solar, Inc. 23
1 MW_AC ARRAY

1 MWAC ARRAY (1.2 MWDC)
300 KWDC 300 KWDC
1 MW PCS
DC F S
1 MW – PCS
POWER CONVERSION STATION
DC FEEDERS
DC COMBINER BOXES (8X)
300 KWDC 300 KWDC
© 2009 First Solar, Inc. 24

1 MW PCS (POWER CONVERSION STATION)
1 MW TRANSFORMER 34.5 KV
HVAC UNITS (2X)
PCS SHELTER
HOUSES 2 EA 500 KW DC:AC POWER INVERTERS
500 KW INVERTER
HOUSES 2 EA. 500 KW DC:AC POWER INVERTERS
© 2009 First Solar, Inc. 25

21 MW PHOTOVOLTAIC POWER PLANT: 21 X 1 MW ARRAYS
ER6 MW_A
C FE
EDE
1 MW A P V COMBINING SWITCHGEAR 1 MW_AC ARRAY P.V. COMBINING SWITCHGEAR
(4 FEEDERS IN – 1 FEEDER OUT
© 2009 First Solar, Inc. 26
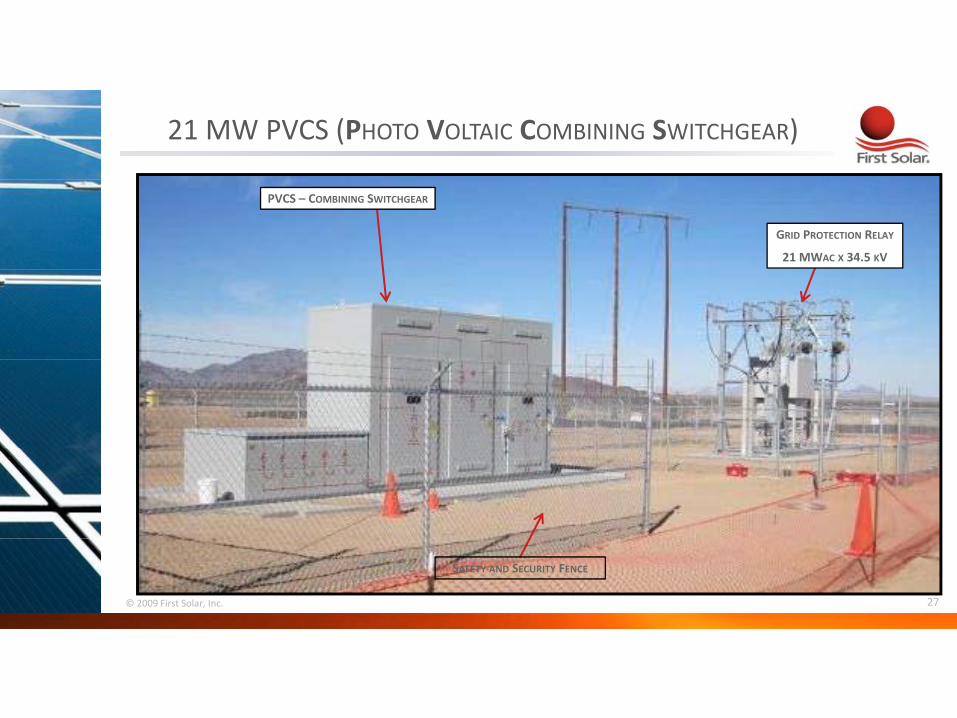
21 MW PVCS (PHOTO VOLTAIC COMBINING SWITCHGEAR)
GRID PROTECTION RELAY
21 MWAC X 34.5 KV
PVCS – COMBINING SWITCHGEAR
SAFETY AND SECURITY FENCE
© 2009 First Solar, Inc. 27

’
METEOROLOGICAL STATION (2 EA.)
RAIN GAUGE (BEHIND)
WIND VELOCITY
AMBIENT TEMP
& REL HUMIDITY
GLOBAL RADIATION SENSOR
PLANE OF ARRAY SENSOR
• Irradiance Temperature & WindSpeed needed to calculate PR’s & PTC’s• Irradiance, Temperature & WindSpeed needed to calculate PR’s & PTC s
• Correlate your lab model with real outdoor data © 2009 First Solar, Inc. 28
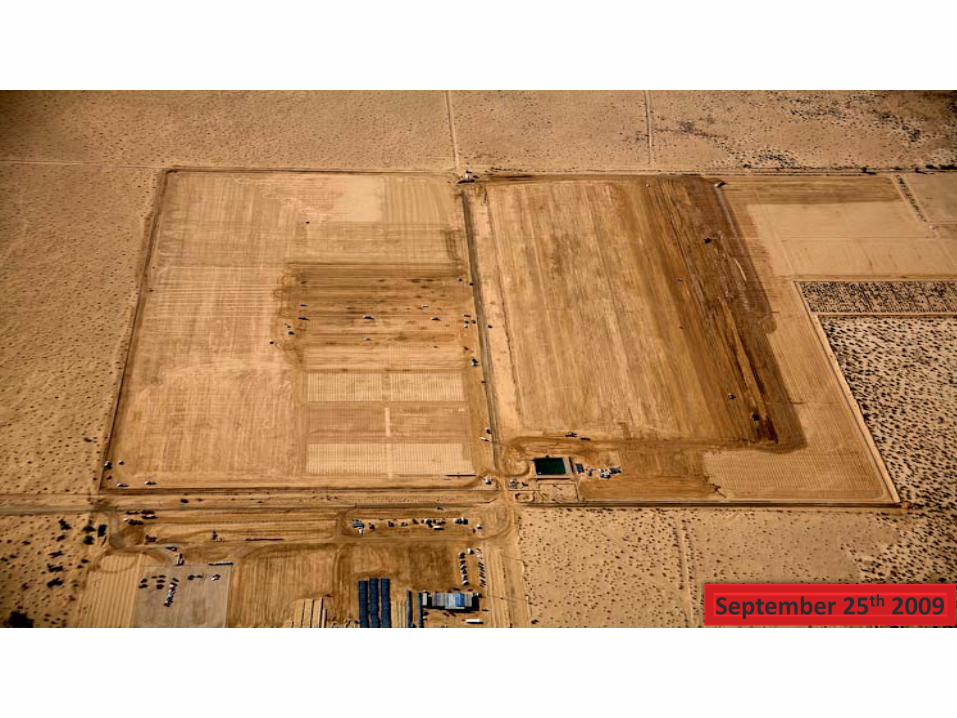
September 25th 2009

October 2nd 2009
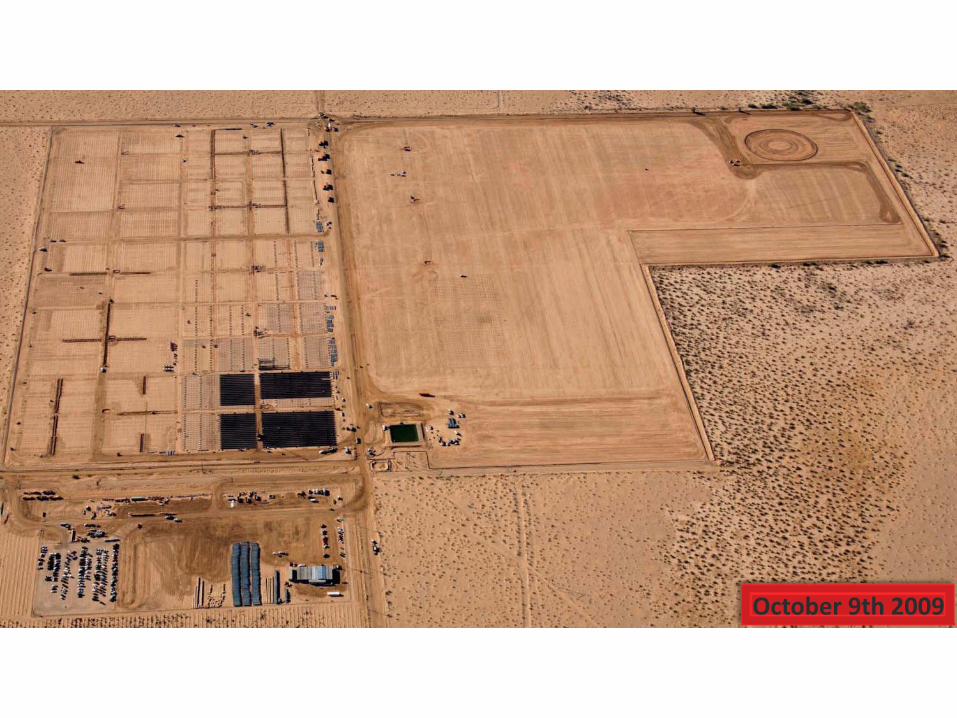
October 9th 2009

October 16th 2009
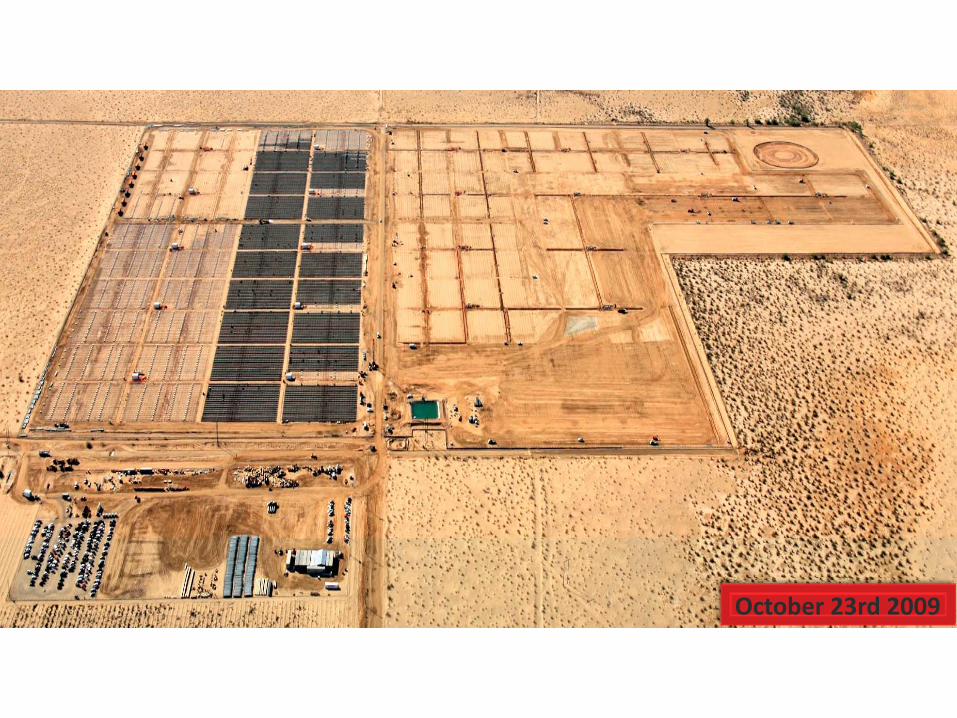
October 23rd 2009

November 3rd 2009

November 13th 2009
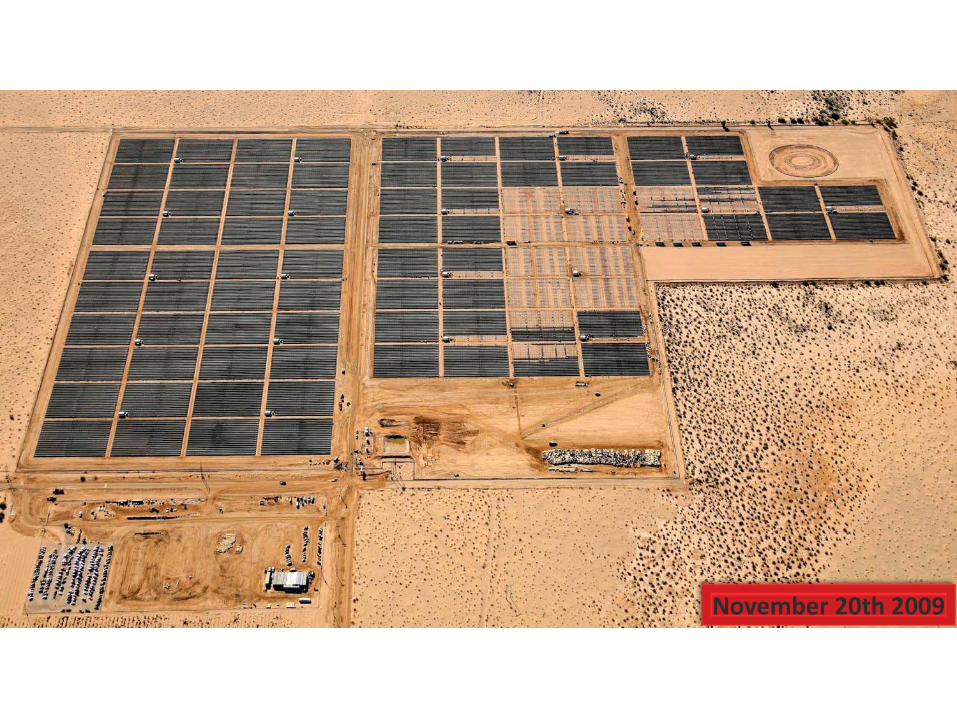
November 20th 2009
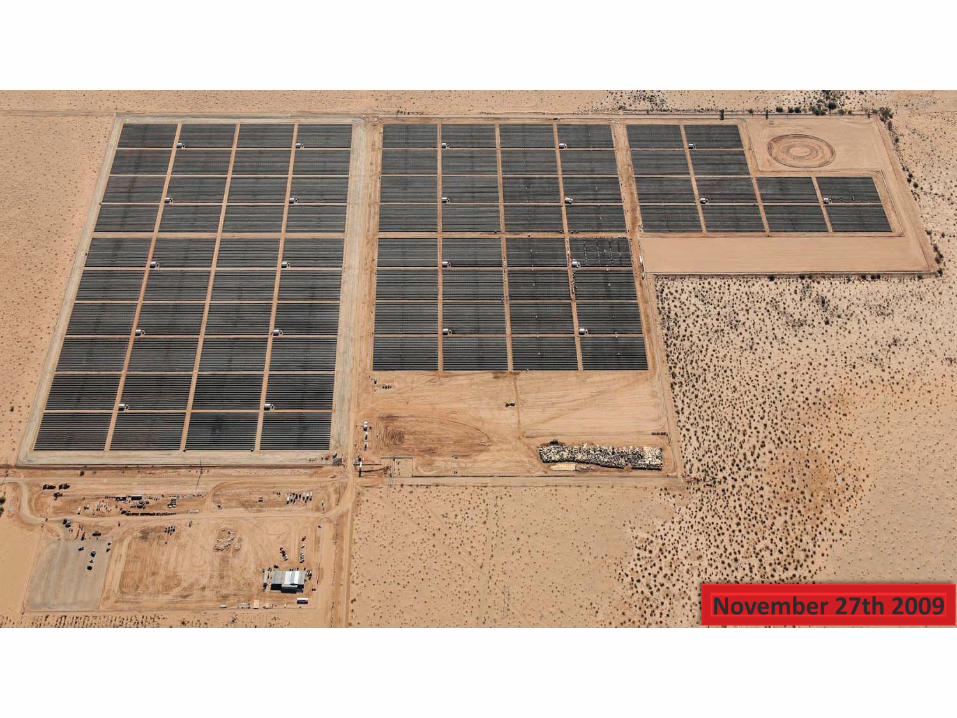
November 27th 2009
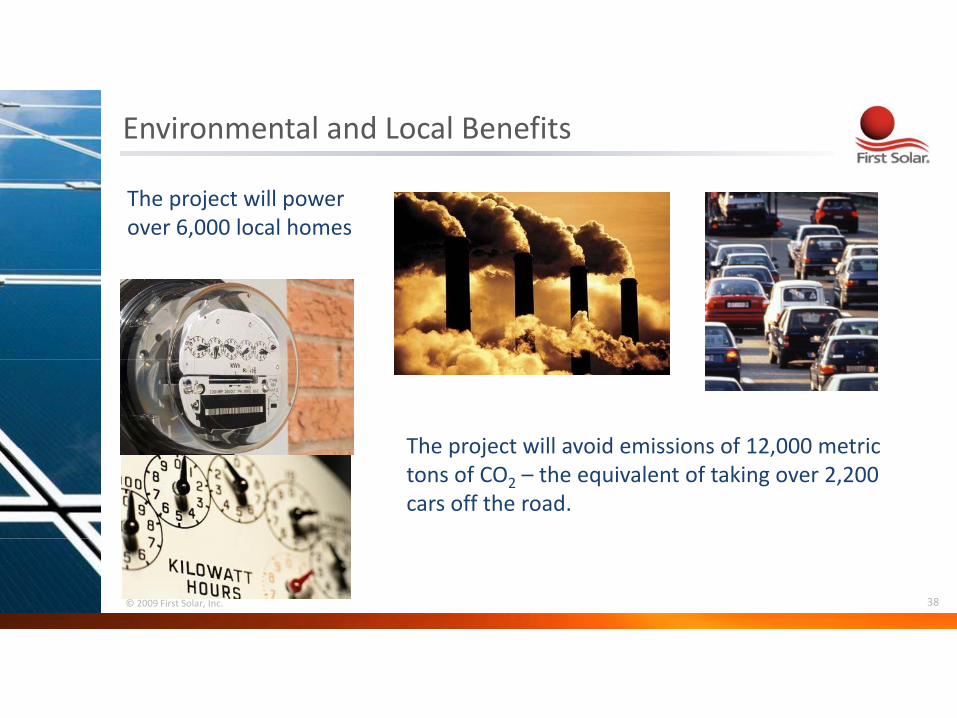
Environmental and Local Benefits
The project will power over 6,000 local homes
The project will avoid emissions of 12 000 metricThe project will avoid emissions of 12,000 metric tons of CO2 – the equivalent of taking over 2,200 cars off the road.
© 2009 First Solar, Inc. 38
© 2009 First Solar, Inc.
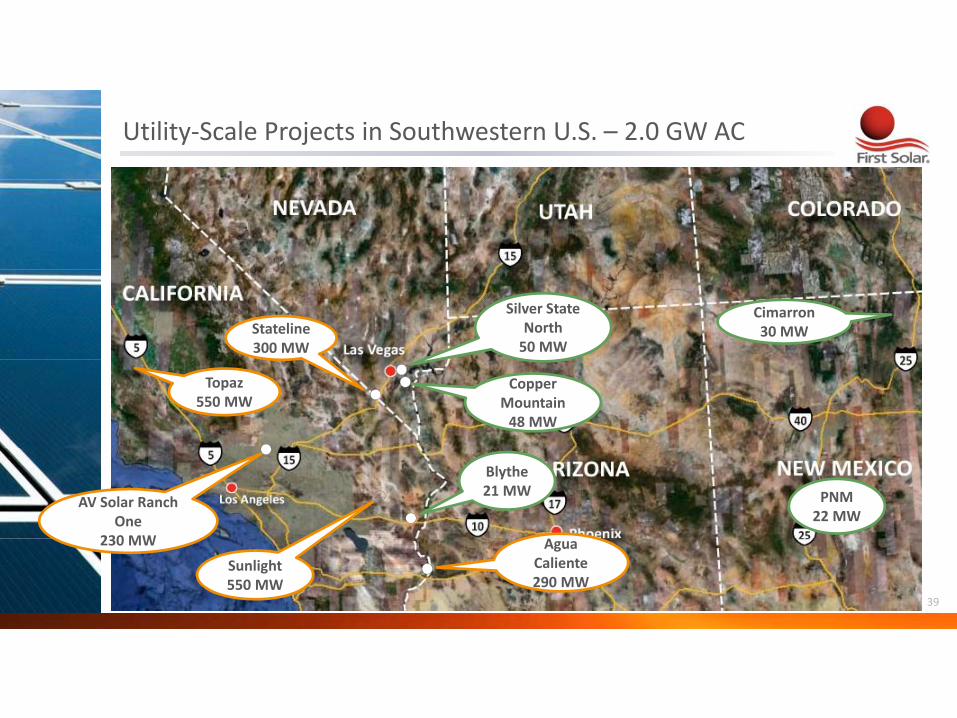
Utility‐Scale Projects in Southwestern U.S. – 2.0 GW AC
Stateline 300 MW
Cimarron 30 MW
Silver State North 50 MW
Copper Mountain 48 MW
Topaz 550 MW
Blythe 21 MW PNM
22 MW AV Solar Ranch
One 230 MW
39
Sunlight 550 MW
Agua Caliente 290 MW
230 MW
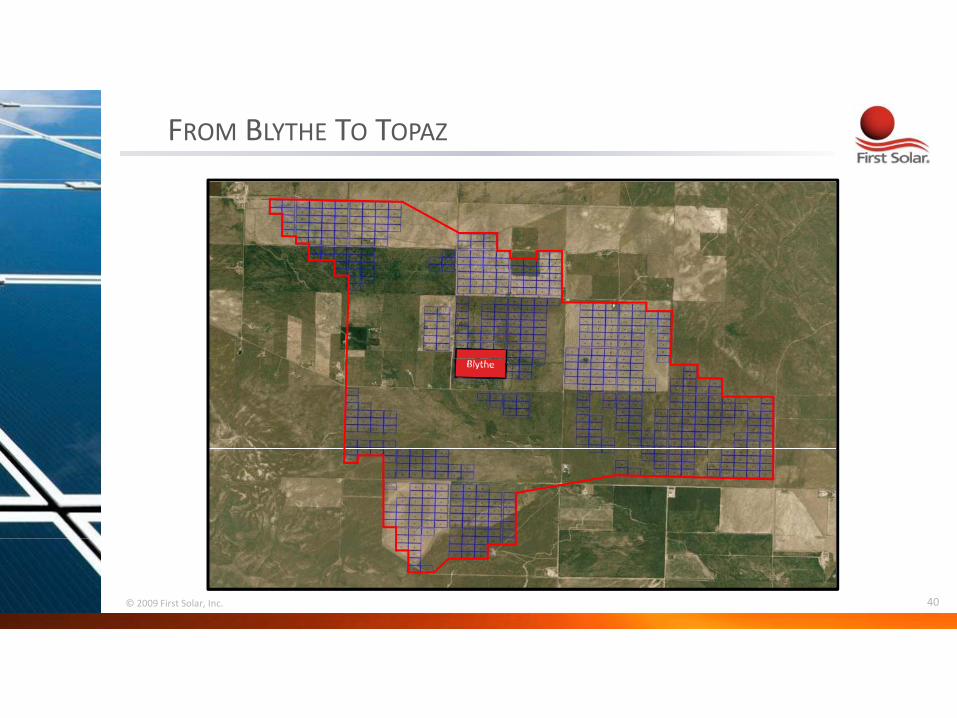
FROM BLYTHE TO TOPAZ
© 2009 First Solar, Inc. 40
–
Summary
•• Module reliability is a driver for cost Module reliability is a driver for cost
• Module reliability does not dominate system reliability
• Module reliability enables affordable PV electricity • Module reliability enables affordable PV electricity
• Key module stress factors i. Humidity
ii. Temperature
• What’s needed – fundamental understanding of degradation mechanismsfundamental understanding of degradation mechanisms
– correlation to real outdoor performance data
• First Solar enabling statistics at utility scale
© 2009 First Solar, Inc. 41

thank you thank you
Our Mission Our Mission To create enduring value by enabling a world powered by clean affordable solar electricity powered by clean, affordable solar electricity.
© 2009 First Solar, Inc. 42
Recommended