2nd Global Summit
Healthcare Fraud:Prevention is better than cure
25-26 October 2012Beaumont Estate, Old Windsor, UK
2nd Global Summit
Healthcare Fraud:Prevention is better than cure
25-26 October 2012Beaumont Estate, Old Windsor, UK

The Use of Advanced Analyticsto Prevent Healthcare Fraud
- Fraus omnia corrumpit –
Ted DoyleVice President, Fraud Analytics
UnitedHealth Group/OptumInsight
Julie MalidaPrincipal, Health Care Fraud Solutions
SAS Institute Inc.
2
The Use of Advanced Analyticsto Prevent Healthcare Fraud
- Fraus omnia corrumpit –
Ted DoyleVice President, Fraud Analytics
UnitedHealth Group/OptumInsight
Julie MalidaPrincipal, Health Care Fraud Solutions
SAS Institute Inc.

Ted DoyleVice President, Fraud Analytics
UnitedHealth Group/OptumInsight
3
Ted DoyleVice President, Fraud Analytics
UnitedHealth Group/OptumInsight

US Healthcare Fraud
National Trends
4
US Healthcare Fraud
National Trends
4

NHCAA Anti-FraudManagement Survey
2011 Stats – NHCAA Management Survey
Average Health Insurance company SIU realized combined fraudrecoveries, savings and prevented losses totaling over$22.9M/year based upon average budget = $1.95M
Average SIU staff = 20 FTEs Average recoveries = nearly $5.3M Average savings = more than $13.8M Average prevented losses = almost $7.7M Average number of open cases or investigations = 396 Average number of cases handled by a US based SIU = 936

US Fraud Hot Spots(Red Font with Star)
Brooklyn &New YorkCity
Chicago
Detroit
BatonRouge
Dallas &Houston
Los Angeles
Tampa &Miami

US Top Ten Fraud Trends
Benefit Type Fraud Scheme
Prescription Drug Services
“Drug Seeking” patients are doctor-shopping to obtain multiple medicallyunnecessary prescriptions, causing benefit payments to increase but alsocausing health risks for Payer member populations, which translates toincreased cost for medical care. Insurers lose between $8.6M and $857Ma year depending on plan size.
Ambulance Transportationto Nowhere
Ambulance and Van services where no other office visit, ER or Inpatientservices provided at same time. In a 2006 OIG report, Medicare was foundto have improperly paid $402M for ambulance services that were notrendered or medically necessary.
Ambulance and Van services where no other office visit, ER or Inpatientservices provided at same time. In a 2006 OIG report, Medicare was foundto have improperly paid $402M for ambulance services that were notrendered or medically necessary.
Infusion Therapy (IVTherapy)
Medicare has identified over $2B in suspect payments for IV Therapyassociated with false AIDS diagnosis between 2002 and 2011. Thisrepresents on average $222M a year.
Medical Identity Theft
With the proliferation of Medical Identity Theft, Payers need to identifygroups of patients who appear to be shared across multiple providers orprovider networks. Medicare identified over 100,000 member IDscompromised (sold) and over $1B in savings for claims denied associatedwith compromised member info between 2002 and 2011, representing onaverage $111M a year.
Independent DiagnosticTesting Facilities
Medicare alone allowed almost $1 billion for IDTF claims for 2.4 millionbeneficiaries in 2010

Benefit Type Fraud Scheme
Payments to excluded,sanctioned or phantomproviders
Medicare allowed close to $41M for medical equipment and supply claimswith invalid, inactive or deceased referring physicians or for services orderedby non-physicians.
Home Health Services Medicare spending for Home Health Services has increased 81% since theyear 2000
Payers need to ID spike billing over a rolling 12-month average but alsomonth-to-month spikes that don’t make sense based upon peer and/orgeographic trends. No prosecutorial case information or Regulatory reportshave been produced for this trend
US Top Ten Fraud Trends
Spike BillingPayers need to ID spike billing over a rolling 12-month average but alsomonth-to-month spikes that don’t make sense based upon peer and/orgeographic trends. No prosecutorial case information or Regulatory reportshave been produced for this trend
Services while Inpatient
Public and Private sector Payers have seen an increase insuspicious/fraudulent billing for outpatient services while the patient is in aFacility setting. SIU/Analytic presentations at the annual trainingconferences for the US National Health Care Anti-Fraud Association, UnitedKingdom Health Insurance Counter Fraud Group and the European UnionHealth Care Fraud and Corruption Network addressed this trends as asignificant concerns for new health care fraud.
Cosmetic Services – Dental,Vision, Medical
Medically unnecessary cosmetic procedures, misrepresented (coded) asmedically necessary procedures. No prosecutorial case information orRegulatory reports have been produced for this trend.

Comparative Billing Report
• CBR: A report developed in an effort to provide education to theprovider community by comparing billing practices across peer group
• Benefits: Education = behavior change = cost avoidance = savings
• CBR 001 Physical Therapy Services with the KX Modifier• CBR 002 Chiropractic Services• CBR 003 Ambulance• CBR 004 Hospice• CBR 005 Podiatry• CBR 006 Sleep Study• CBR 007 Ordering Durable Medical Equipment: Spinal Orthotics• CBR 008 Outpatient Physical Therapy Services with the KX Modifier• CBR 009 Ordering Durable Medical Equipment: Diabetic Supplies• CBR 010 Chiropractic Services• CBR 011 Electrodiagnostic• CBR012 Ordering Durable Medical Equipment: Lower Limb Orthotics• CBR013 Advanced Diagnostic Imaging• CBR014 Pain Management Services• CBR015 Cardiology Services• CBR016 Evaluation and Management Services
• For more info visit: http://www.safeguard-servicesllc.com/cbr/

Investigative PerspectiveWhy Advanced Analytics?
• Shift the focus from I’ll find the fraud to Show me the fraud.
• Free up SIU Investigators to create and investigate cases
• Discover unknown schemes and aberrant billing patterns
• Protect Payer resources at an enterprise level
• Predict trends and anomalies before to late
• Shift the focus from I’ll find the fraud to Show me the fraud.
• Free up SIU Investigators to create and investigate cases
• Discover unknown schemes and aberrant billing patterns
• Protect Payer resources at an enterprise level
• Predict trends and anomalies before to late

Challenge of Improper ClaimDetection
• This space represents the universe of claims
• Manual clinical review is impossible for entire space
• Goal: Stop as many reds (improper) for review as possible whilekeeping the number of blues (proper) identified to a minimum

Advanced Analytics are Required
Using hybrid analytics for fraud detection
EnterpriseData
EnterpriseData
For knownpatterns
For knownpatterns
For unknownpatterns
For unknownpatterns
For complexpatterns
For complexpatterns
For unstructureddata
For unstructureddata
For associativelinking
For associativelinking
EmployerData
MedicalProcedure
RulesRules to surface knownfraud behaviors
Anomaly DetectionAlgorithms to surfaceunusual (out-of-band)behaviors
Predictive ModelsIdentify attributes ofknown fraud behavior
Text MiningLeverage unstructureddata elements inanalytics
Network AnalysisAssociative discoverythru automated linkanalysis
Examples:• Inaccurate eligibility
information• Unlicensed or
Suspended Provider• Daily provider billing
exceeds possible• CPT up-coding• Value of charges for
procedure exceedsthreshold
Examples:• Abnormal service
volume compared tosimilar providers
• Ratio of $ / procedureexceed norm
• # patients fromoutside surroundingarea exceeds norm
Examples:• Like patterns of
claims as confirmedknown fraud
• Provider behaviorsimilar to knownfraud cases
• Like provider/network growth rate(velocity)
Examples:• Claim/call center
notes high-lightingkey fraud risks (e.g.,policy questions)
• Static data elements(e.g., address) usedfor linking suspiciousactivity
• Integration of richcase file information
Examples:• Provider/claimant
associated to knownfraud
• Linked members withlike suspiciousbehaviors
• Suspicious referrals tolinked providers
• Collusive network ofproviders & referrals
Claims EligibilityData
Provider /Member
Referral
Known BadLists
3rd PartyData
Examples:• Inaccurate eligibility
information• Unlicensed or
Suspended Provider• Daily provider billing
exceeds possible• CPT up-coding• Value of charges for
procedure exceedsthreshold
Examples:• Abnormal service
volume compared tosimilar providers
• Ratio of $ / procedureexceed norm
• # patients fromoutside surroundingarea exceeds norm
Examples:• Like patterns of
claims as confirmedknown fraud
• Provider behaviorsimilar to knownfraud cases
• Like provider/network growth rate(velocity)
Examples:• Claim/call center
notes high-lightingkey fraud risks (e.g.,policy questions)
• Static data elements(e.g., address) usedfor linking suspiciousactivity
• Integration of richcase file information
Examples:• Provider/claimant
associated to knownfraud
• Linked members withlike suspiciousbehaviors
• Suspicious referrals tolinked providers
• Collusive network ofproviders & referrals

New PhenomenonEntrepreneurs in Healthcare Fraud
New PhenomenonEntrepreneurs in Healthcare Fraud

• Who/what are these entrepreneurs?
• What are they doing?
• How do we identify them?
– Traditional scheme development
– A new analytic approach
• Wikipedia defines entrepreneur as:– An entrepreneur is an owner or manager of a business enterprise who
makes money through risk and initiative.
– Is a term applied to a person who is willing to help launch a new ventureor enterprise and accept full responsibility for the outcome.
– “The entrepreneur shifts economic resources out of lower and into higherproductivity and greater yield."
Entrepreneurs in Healthcare Fraud
• Who/what are these entrepreneurs?
• What are they doing?
• How do we identify them?
– Traditional scheme development
– A new analytic approach
• Wikipedia defines entrepreneur as:– An entrepreneur is an owner or manager of a business enterprise who
makes money through risk and initiative.
– Is a term applied to a person who is willing to help launch a new ventureor enterprise and accept full responsibility for the outcome.
– “The entrepreneur shifts economic resources out of lower and into higherproductivity and greater yield."

Who/What Are These Entrepreneurs?
• A Healthcare entrepreneur can be:– A business person who shows initiative to maximize income
– Middlemen who have inserted themselves into the healthcare deliverysystem
– In both of the above cases, rules and regulations are usuallydisregarded
Caution: Entrepreneur may or may NOT be a healthcare provider
• Operations at OptumInsight regularly identifies “Entrepreneurs” in bothcategories through ideation, referrals and tips from the healthcarecommunity

OptumInsight Anti-Fraud Analytics
• Our experience:– The Provider will maximize revenue, but try to stay below
the radar by keeping dollar thresholds low enough– Insert themselves into the healthcare delivery stream,
possibly as a “middleman” between legitimate providers• Suppliers/vendors
• OBS facility charge
• HHA arranger
• IOM double billing
• “Concierge” services (delivery of drugs)

What Are They Doing?
• Submitting another bill when one or more providers have alreadybeen paid in full
• Taking advantage of gaps– In the claims processing system– In Policies and Procedures– Between UB forms and CMS forms
• Some take advantage of there being no applicable taxonomy codefor a non-healthcare type of provider

How Do We Identify Them?
• Old school methods: Look for them!– Scheme ideation: Unlicensed entity (ASCs, FSED, OBS, Pharmacy,
HHA)– Duplicate claims– Data analysis– Inappropriate use of modifiers to prevent claim form hitting edits– More than one claim for single date of service (single or multiple
providers)– Patient complaints

Example
Middleman company bills globally when the facility hasbeen paid the Technical component. Reading physiciangets the “interpretation” (modifier 26) split.• According to policy, the payer will reimburse the interpretingphysician or healthcare professional only the professionalcomponent because the facility is reimbursed for the technicalcomponent of the service
• It would be inappropriate to bill the global code whichrepresents both the professional and technical component.
• According to policy, the payer will reimburse the interpretingphysician or healthcare professional only the professionalcomponent because the facility is reimbursed for the technicalcomponent of the service
• It would be inappropriate to bill the global code whichrepresents both the professional and technical component.

Example
Unlicensed Facility EntrepreneursUnlicensed Facility Entrepreneurs
Characteristics:
• Office Based Surgery entity at samephysical address as physician
• Physician paid global fee
• Corporate entity for office bills facilitycharge
• Corporation is owned by the physician
• Classic double dip
Characteristics:
• Office Based Surgery entity at samephysical address as physician
• Physician paid global fee
• Corporate entity for office bills facilitycharge
• Corporation is owned by the physician
• Classic double dip

Example
Characteristics:
– Billing for self-administered or IV infusion drugs
– Arranges for the delivery of drugs directly to patientor hospital outpatient department
– But is not a licensed pharmacy
– Has NO relationship with patients
– Doctors defending their use of the company
– Suspect kickbacks to Pharmacy and Doctors
– High Dollar claims and High Units billed
– Hold HHA license, but no employees
Concierge ServiceConcierge Service
Characteristics:
– Billing for self-administered or IV infusion drugs
– Arranges for the delivery of drugs directly to patientor hospital outpatient department
– But is not a licensed pharmacy
– Has NO relationship with patients
– Doctors defending their use of the company
– Suspect kickbacks to Pharmacy and Doctors
– High Dollar claims and High Units billed
– Hold HHA license, but no employees

Analytics
Instead of schemeanalysis focused on asingle provider type ona state by statebasis….
New dataanalysistechniquesexamine multipleindicators todetermineaberrant billingpatterns
Instead of schemeanalysis focused on asingle provider type ona state by statebasis….
New dataanalysistechniquesexamine multipleindicators todetermineaberrant billingpatterns

Detecting HealthcareEntrepreneurs With Analytics
• Entrepreneurs are in the healthcare system to make moneyrather than to deliver quality care so they will behave differently.
• For a healthcare provider to increase their reimbursement, theymust increase at least one of the following:
– Patients– Units per Patient– Cost per Unit
• Each of these can have various approaches. For example, toincrease patients a healthcare provider can:
– Open a new office location– Aggressively market services– Add patient “enticements” – waive copayments, spa coupons– Engage in patient kick-backs – “rent-a-patient”– Bill from a stolen patient list
23
• Entrepreneurs are in the healthcare system to make moneyrather than to deliver quality care so they will behave differently.
• For a healthcare provider to increase their reimbursement, theymust increase at least one of the following:
– Patients– Units per Patient– Cost per Unit
• Each of these can have various approaches. For example, toincrease patients a healthcare provider can:
– Open a new office location– Aggressively market services– Add patient “enticements” – waive copayments, spa coupons– Engage in patient kick-backs – “rent-a-patient”– Bill from a stolen patient list

Detecting HealthcareEntrepreneurs With Analytics
• Our goal is to find Healthcare Entrepreneurs who are gamingthe payment system by inappropriately inflating patients, unitsor unit cost
• Traditional outlier analysis often uses:– Static benchmarks such as a provider who bills the highest code
in an upcoding group 5X more than their peers.– Acceleration reports such as a provider billing a code 50% more
than last year.
24
• Our goal is to find Healthcare Entrepreneurs who are gamingthe payment system by inappropriately inflating patients, unitsor unit cost
• Traditional outlier analysis often uses:– Static benchmarks such as a provider who bills the highest code
in an upcoding group 5X more than their peers.– Acceleration reports such as a provider billing a code 50% more
than last year.

Adjust For Known Changes(Know Your Environment)
• New Member Groups– Number of patients for healthcare provider increases 50% (more providers + static members = fraud)
• New Procedure Codes / New Use For Established Codes– Healthcare provider’s use of a CPT dramatically increases, maybe a related
CPT was deleted and use shifted to this code?= Need for provider Utilization Profiling & Morphing analysis
• Regional Practice Differences– Medical school and practice partners greatly influence treatment patterns
• Epidemics, Seasonality and Disasters– Fast rise of office visits in the Northeast, maybe a flu outbreak?– Control at a state level
• Consider Provider Morphing

Healthcare EntrepreneursConclusion
• Healthcare Entrepreneurs can range from licensed providers pushingthe envelope for revenue maximization to fictitious entities engaged infraudulent billing schemes
• Traditional scheme analysis is still an important part of an overalldetection strategy– It yields savings– Can help exclude inappropriate provider types
• Analytics can lead to the discovery of new schemes– There are only three “levers” to increase reimbursement
• Patients, Units and Unit Cost– Need both benchmarking and acceleration to accurately describe a
reimbursement pattern– Many common occurrences will result in false patterns
• Remove known causes of variation such as new groups, regional differences, etc…

Healthcare Entrepreneurs Next Steps
• Clinical Prevalence– Procedure codes can have multiple uses– Linking them to diagnosis codes and peer literature on disease prevalence
will help us understand the complete treatment picture– Should help weed out false positives

Use of Prevalence Datain Fraud Detection
Use of Prevalence Datain Fraud Detection

Epidemiology can be a useful toolin Investigation
Examples:
•25.8 million children and adults in the United States—8.3% of thepopulation—have diabetes
•16.3% of the U.S. adult population—have high total cholesterol. Thelevel defined as high total cholesterol is 240 mg/dL and above
•These diseases are common and are evenly distributed amongstPrimary Care Physicians

Background• Period Prevalence Rate is all cases whether old, new or
recurrent, arising over a defined period, either one or twoyears. The denominator is the average population overthe period (or mid-point estimate)
– Specific rates permit rational and easy comparison ofdisease patterns in different places and times for they canbe directly compared with each other
– There may be some regional variation but extremes areworrisome either for fraud/waste/abuse or an epidemic thatmerits public health investigation
• Prevalence values are additive as the population is thecommon denominator
• ICD-10 has greater coding precision for many conditionswhen compared with ICD-9 diagnosis coding
• Period Prevalence Rate is all cases whether old, new orrecurrent, arising over a defined period, either one or twoyears. The denominator is the average population overthe period (or mid-point estimate)
– Specific rates permit rational and easy comparison ofdisease patterns in different places and times for they canbe directly compared with each other
– There may be some regional variation but extremes areworrisome either for fraud/waste/abuse or an epidemic thatmerits public health investigation
• Prevalence values are additive as the population is thecommon denominator
• ICD-10 has greater coding precision for many conditionswhen compared with ICD-9 diagnosis coding

Example—Dx 357.81, ChronicInflammatory DemyelinatingPolyneuritis (CIDP)• CBSA for zip code 33135 (Miami, Florida)
• Population-- 5,531,060
• 1695 Family Practice Physicians in CBSA*
• Prevalence of CIDP: 1 case per 10,000
• Expected CIDP cases in CBSA—553
• Insurer’s Florida Medicare membership 583,000
• Expected CIDP cases in Insurer’s population—583
• A single provider (Family Practice) was treating 9 individuals inhis practice for CIDP using high dose intravenousimmunoglobulin
* http://www.doh.state.fl.us/Workforce/Workforce/Annual_Reports/PhysicianWorkforce_Nov2010.pdf
`.
• CBSA for zip code 33135 (Miami, Florida)
• Population-- 5,531,060
• 1695 Family Practice Physicians in CBSA*
• Prevalence of CIDP: 1 case per 10,000
• Expected CIDP cases in CBSA—553
• Insurer’s Florida Medicare membership 583,000
• Expected CIDP cases in Insurer’s population—583
• A single provider (Family Practice) was treating 9 individuals inhis practice for CIDP using high dose intravenousimmunoglobulin
* http://www.doh.state.fl.us/Workforce/Workforce/Annual_Reports/PhysicianWorkforce_Nov2010.pdf

Example—Dx 357.81, ChronicInflammatory DemyelinatingPolyneuritis (CIDP)--continued• This doctor has 2% (9/553) of ALL CIDP cases in this entire
CBSA & 20% (9/58) of all expected CIDP cases in the insurer’sFlorida M&R market!
• Incidentally 4 other doctors (also Family Practitioners), had anadditional 3% (17/583) of ALL cases in the CBSA and 30%(10/58) of the expected CIDP cases in the insurer’s FloridaM&R market!
• This concentration of patients with CIDP would not be expectedfor a Family Practitioner
– All patients were receiving IVIG administered in high dosage– The practices were clinics rather than specialists
• Review of records revealed diagnosis and treatment were bothfabricated with substantial recovery
• This doctor has 2% (9/553) of ALL CIDP cases in this entireCBSA & 20% (9/58) of all expected CIDP cases in the insurer’sFlorida M&R market!
• Incidentally 4 other doctors (also Family Practitioners), had anadditional 3% (17/583) of ALL cases in the CBSA and 30%(10/58) of the expected CIDP cases in the insurer’s FloridaM&R market!
• This concentration of patients with CIDP would not be expectedfor a Family Practitioner
– All patients were receiving IVIG administered in high dosage– The practices were clinics rather than specialists
• Review of records revealed diagnosis and treatment were bothfabricated with substantial recovery

IVIG can be used forHematologic Diagnoses• Conditions such as Idiopathic Thrombocytopenic Purpura,
Monoclonal Gammopathy and Chronic LymphocyticLeukemia respond to IVIG
• Prevalence of different conditions with a common treatmentcan be added together
• Number of patients with hematologic diagnoses with acommon treatment such as IVIG divided by population canreveal areas where the prevalence is in excess of expected
• Single payer system and use of ICD-10 coding enhancedetection ability
• Review of records may yield misrepresentation of diagnosesand/or treatment
• Conditions such as Idiopathic Thrombocytopenic Purpura,Monoclonal Gammopathy and Chronic LymphocyticLeukemia respond to IVIG
• Prevalence of different conditions with a common treatmentcan be added together
• Number of patients with hematologic diagnoses with acommon treatment such as IVIG divided by population canreveal areas where the prevalence is in excess of expected
• Single payer system and use of ICD-10 coding enhancedetection ability
• Review of records may yield misrepresentation of diagnosesand/or treatment

Case Study - Infusion Therapy
• Scheme: Over-utilization of Infusion Therapy Drug (ITD) codes– Excessive units– Excessive frequency of service
• Costly services
• Small # of patients
$119 million$119 million
$8 million
$142 million

Infusion Therapy
• Scheme targets vulnerable populations– Lower income/high unemployment– HIV diagnoses– Fraudsters buy member IDs
• From other fraudulent providers (list sharing)• From patients themselves – offer kickbacks
– Cash– Prescriptions, drugs, appliances, food
• Providers enlist physician complicity or bill using their providernumber without doctor knowing
– Often older physicians– Pay kickbacks for referrals
• Providers enroll with Plan to get new provider number

IV Therapy: Detection Approaches
Detection
• Predictive Scoring Model (PSM)
• Peer Grouping
• Provider Profiling
• Link Analysis
• Static Code Analysis
• Prospective Rules
Detection
• Predictive Scoring Model (PSM)
• Peer Grouping
• Provider Profiling
• Link Analysis
• Static Code Analysis
• Prospective Rules

Provider Morphing: Definition
• Helps identify providers that may be abusing the payer system
• Compares distribution of billed procedure codes across two timeperiods, weighted by paid dollars
• Large changes/swings may indicate the evolution of fraud schemes
Studying Provider behavior over time
• Patterns of provider behavior suggest fraud schemes
• Once a fraud scheme is identified, it can be stopped (or minimized)
• Fraudsters have financial incentive to adjust billing practices toevade detection and maximize revenue
• For “Fraudster” group, when one “bad” behavior stops, new “bad”behavior likely starts
• Traditional methods of fraud detection offer few clues as to whatthat new bad behavior will look like

Provider Morphing: Sample Results
Provider Procedure Procedure Description CurrentQuarter
PreviousYear
Clinic XYZ 1992 ANESTH, N BLOCK/INJ, PRONE $36,876 $9,548Clinic XYZ 1935 ANESTH, PERC IMG DX SP PROC $26,317 $0Clinic XYZ 1810 ANESTH, LOWER ARM SURGERY $13,650 $0Clinic XYZ 1630 ANESTH, SURGERY OF SHOULDER $20,648 $0Clinic XYZ 1480 ANESTH, LOWER LEG BONE SURG $16,745 $4,445Clinic XYZ 1400 ANESTH, KNEE JOINT SURGERY $20,283 $4,793Clinic XYZ 952 ANESTH, HYSTEROSCOPE/GRAPH $23,806 $0Clinic XYZ 840 ANESTH, SURG LOWER ABDOMEN $21,681 $0Clinic XYZ 810 ANESTH, LOW INTESTINE SCOPE $28,955 $16,190Clinic XYZ 797 ANESTH, SURGERY FOR OBESITY $10,367 $0Clinic XYZ 790 ANESTH, SURG UPPER ABDOMEN $35,330 $0
1 2Series1 $434,317 $83,670
$0$50,000
$100,000$150,000$200,000$250,000$300,000$350,000$400,000$450,000$500,000
Clinic XYZ 790 ANESTH, SURG UPPER ABDOMEN $35,330 $0Clinic XYZ 740 ANESTH, UPPER GI VISUALIZE $34,504 $8,709Clinic XYZ 670 ANESTH, SPINE, CORD SURGERY $8,253 $0Clinic XYZ 630 ANESTH, SPINE, CORD SURGERY $8,362 $0Clinic XYZ 160 ANESTH, NOSE/SINUS SURGERY $23,299 $0
Series1 $434,317 $83,670
Data is grouped by provider to highlight changes inbehavior.Current Quarter and Previous Year show the discrepancyin paid amounts year-over-year for a given quarter.
Above, a suspicious Total Paiddiscrepancy of over 5 times the previousyear’s paid amount.
The table above shows significant change in the type andvolume of procedures performed.

Case Studies
• Physiatrist listed as Medical Director of a spa that recently went out ofbusiness. DO and DC training
• 54% increase in patient volume, 78% increase in codes billed/pt visitin current year with spike in echo guided biopsy and epidural/SIinjections
• Significant increase in submission of claims in current period
• Physical therapy and Chiropractor in practice with provider
Provider Procedure Procedure Description PreviousYear
CurrentQuarter
Provider A 76942 ECHO GUIDE FOR BIOPSY $0 $5,625Provider A 64484 INJ FORAMEN EPIDURAL ADD-ON $0 $5,886Provider A 64483 INJ FORAMEN EPIDURAL L/S $0 $14,398Provider A 64479 INJ FORAMEN EPIDURAL C/T $0 $3,223Provider A 27096 INJECT SACROILIAC JOINT $29 $3,173
Provider and CPT Paid Amount information Total Paid Amount comparison
• Physiatrist listed as Medical Director of a spa that recently went out ofbusiness. DO and DC training
• 54% increase in patient volume, 78% increase in codes billed/pt visitin current year with spike in echo guided biopsy and epidural/SIinjections
• Significant increase in submission of claims in current period
• Physical therapy and Chiropractor in practice with provider

Provider Morphing Summary
• Provider Morphing identifies potential aberrant behavior. Ithas potential application as:
– Retrospective analysis tool to find suspicious behavior thatwould require additional investigation
– Retrospective tool to ensure compliance for providers who haveagreed to modify certain billing behaviors
– Prospective flag that would allow the pending of claims subjectto further analysis of medical records

Ted’s Closing Thoughts
• Multiple Analytical Methods and Advanced Analytics are a Must
• Data, data and more data - use all data available to you
•• Work togetherWork together–– healthcare fraud is truly a global problem!healthcare fraud is truly a global problem!
•• Get creative!!Get creative!!–– “fraudster” will and does in order to maximize revenue“fraudster” will and does in order to maximize revenue
41

Julie MalidaPrincipal, Health Care Fraud Solutions
SAS Institute Inc.
42
Julie MalidaPrincipal, Health Care Fraud Solutions
SAS Institute Inc.

THE NEED FOR MULTIPLEANALYTICAL METHODS

Analytic Approach: Business Rules
• Automates manualprocesses
• Operationalize traditional“red flags” or suspiciousloss indicators
• Effective regardless oftraining or experiencelevel
• Catch suspicious claimsthat would “fall throughthe cracks”
• Automates manualprocesses
• Operationalize traditional“red flags” or suspiciousloss indicators
• Effective regardless oftraining or experiencelevel
• Catch suspicious claimsthat would “fall throughthe cracks”

Analytical Approach – Business Rules
Health Care Scenarios/Model Examples
1 Claims less than xx months of policy inception
2 Increase in coverage less than xx months of claim
3 Clinic/hospital distant from claimant’s home address for routine care
4 Bills are billed on holidays and weekends
5 Physician's diagnosis not consistent with treatment5 Physician's diagnosis not consistent with treatment
6 Value of charges for procedure is excessive
7 Same drug prescribed for multiple family members
8 Doctors treatment always the same despite different injuries/accidents
9 Medication prescribed out of line with physician speciality
10 Doctor bills for emergency anaesthesia but hospital stay was non-emergency

• Use when no target exists
• Examine current behaviorto identify outliers andabnormal transactions thatare somewhat differentfrom ordinary transactions
• Include univariate andmultivariate outlierdetection techniques, suchas peer group comparison,clustering, trend analysis,etc.
Avg. Number of PCS Services Submitted
Analytic Approach:Unsupervised Methods(Anomaly Detection)
• Use when no target exists
• Examine current behaviorto identify outliers andabnormal transactions thatare somewhat differentfrom ordinary transactions
• Include univariate andmultivariate outlierdetection techniques, suchas peer group comparison,clustering, trend analysis,etc.
Provider is notonly an outlier,also showsextreme variationfor averagenumber ofservices submittedper attendingprovider
Avg. Number of PCS Services Submitted

Analytic Approach:Supervised Methods (Predictive Models)
• Use when a known target(prior fraud) is available
• Use historical behavioralinformation of knownfraud to identify suspiciousbehaviors similar toprevious fraud patterns
• Include parametric andnonparametric predictivemodels, such asgeneralized linear model,decision tree, neuralnetworks, etc.
Fraud Scores
PredictedFraud Scores
Incomes # of previousinvestigations
• Use when a known target(prior fraud) is available
• Use historical behavioralinformation of knownfraud to identify suspiciousbehaviors similar toprevious fraud patterns
• Include parametric andnonparametric predictivemodels, such asgeneralized linear model,decision tree, neuralnetworks, etc.

Target IdentificationSocial Network (Link) Analysis
• Network scoring– Rule and analytic-based
• Analytic measures of associationhelp users know where to lookin network
– Net-CHAID for local area ofinterest (node) in the network
– Density, Beta-Index (network)– Risk ranking with
hypergeometric distribution,degree, closeness,betweenness, eigenvector,clustering coefficients (node)
• Modularity (sub-network)

Text Mining (Unstructured data)
Up to 80% of insurerdata is unstructuredtext
Configurable parsing,tagging, and extractingof free text for use infraud analytics
Combine quantitativeand qualitative datawith text analysis toimprove predictions
Text Mining (e.g., call center logs or doctor’s notes)
Up to 80% of insurerdata is unstructuredtext
Configurable parsing,tagging, and extractingof free text for use infraud analytics
Combine quantitativeand qualitative datawith text analysis toimprove predictions

The Solution: A Hybrid Approach
50

Sample ClientHealth Care Fraud FindingsUsing a Hybrid Approach
Sample ClientHealth Care Fraud FindingsUsing a Hybrid Approach

Example 1 – Non-US Benefit Plan:Targeting Doctor Shopping
• Problem statement:– Plan previously relying on tips/law enforcement– Drug diversion by pharmacies, drugs finding their way to the streets.
• Analytics Applied: Rules, Anomaly detection and link analysis
• Data Provided:– One year of claims, provider and patient data (~5GB)– Over 11k providers and 687k patients, $1.1B paid
• Findings:– $192M in suspicious activity detected in top 10%, countrywide.

Example 1 – Non-US Benefit Plan:Targeting Doctor Shopping
ScoreRange
Percentof
Providers
# SASFlagged
Providers
TotalAmount Paid
to SASflagged
Providers
EstimatedFraud /Waste /Abuse
EstimatedRecovery
TotalAmount Paid
to SASflagged
Providers
EstimatedFraud /Waste /Abuse
88-100 1% 110 $71,285,537 $3,187,105 $3,187,105
61-87 5% 403 $159,146,916 $7,115,299 $3,928,194
28-60 10% 512 $192,134,531 $8,590,143 $4,403,037

Pharmacy A
• Example of two members withvery abusive behavior
• Member 1 had 228 paid claims permonth (~7 claims daily) with a totalclaim amount of $79K.
• Member 2 had 110 paid claims permonth (~4 claims daily) with a totalclaim amount of $20K.
• Two prescribers responsible for ~99%of these two members claims.
• $384K out of $963K(36%) ofclaim dollars suspicious
Pharmacy B• Member had 642 paid claims per
month(~20 claims daily), and wasresponsible for $63K of $67K(94%) ofthe total amount paid to this pharmacy.
• One physician prescribed $61K of theclaims.
Validated Examples
Example 1 – Non-US Benefit Plan:Targeting Doctor Shopping
Pharmacy A
• Example of two members withvery abusive behavior
• Member 1 had 228 paid claims permonth (~7 claims daily) with a totalclaim amount of $79K.
• Member 2 had 110 paid claims permonth (~4 claims daily) with a totalclaim amount of $20K.
• Two prescribers responsible for ~99%of these two members claims.
• $384K out of $963K(36%) ofclaim dollars suspicious
Pharmacy C• Member had 129 paid claims per
month(~4 claims daily), and wasresponsible for $40K of $116K(35%) ofthe total amount paid to this pharmacy.
• One physician responsible for $13K ofthe claims.

Example 2 –Commercial U.S. Health Plan
• Problem statement:– Increasing number of patients exhibiting drug-seeking behavior for
Promethazine with Codeine (party cocktail) and Hydrocodone (paintablets).
• Analytics applied: Rules, anomaly detection and link analysis
• Data Provided:– All claims, provider and member information for 1 year and 1 region– ~ 414k claims, 116k members, $18.7M annually for these 2 drugs
• Findings:– ~$1.5M in suspicious activity detected– 1.4% of members taking these drugs flagged (1,587 patients)

Based on SAS score Hydrocodone Promethazine withCodeine
Total tablets Total Cost Total ML Total Cost
Top 10 members 40,685 $1,999 89,834 $1,405
Top 50 members 198,170 $12,001 340,961 $5,326
Top 500 members 1,892,428 $106,726 1,956,103 $31,307
All members score>0[1]
2,915,604 $163,077 2,398,391 $38,553
Example 2 –Commercial U.S. Health Plan
All members score>0[1]
2,915,604 $163,077 2,398,391 $38,553
[1] 858 members had score > 0 for Hydrocodone759 members had score > 0 for Promethazine

Example 2 Findings:Top 10 Hydrocodone Members
Member score MemInactive
Qty 12m # newRx
% NewRx ofthisDrug
with NoDr Visit
# DrVisit s
with NoRx ofthisDrug
#Pharma
#Prescrib
ers
#Rxotherfraudpronedrugs
DiffZipdist
****4375 62 1 4230 20 100 1 2 3 8 8****0276 62 1 2784 16 94 0 3 3 0 35****0040 60 1 3269 23 100 0 2 5 0 1
Memberinactive or 1+
Rx dispensedoutside memdates
All 20 newhydrocod Rxhad no prior docvisit
Of all doctors visits ,only 3 did notinvolve prescribingthis drug
Multiplesources
72purchases ofother fraud-prone drugs
****0276 62 1 2784 16 94 0 3 3 0 35****0040 60 1 3269 23 100 0 2 5 0 1****8680 60 0 3765 71 97 24 5 10 18 2****3940 60 1 5330 28 86 4 1 2 36 0****8351 60 0 7260 48 88 3 3 1 72 0****5070 59 0 3724 45 98 1 6 7 0 7****4700 57 0 3863 57 95 10 6 8 14 0****3469 56 1 2260 28 54 12 5 10 33 1****0319 56 0 4200 14 100 0 1 2 15 14
Travels 35 miles more for hydrocodcompared to non-fraud-prone drugs
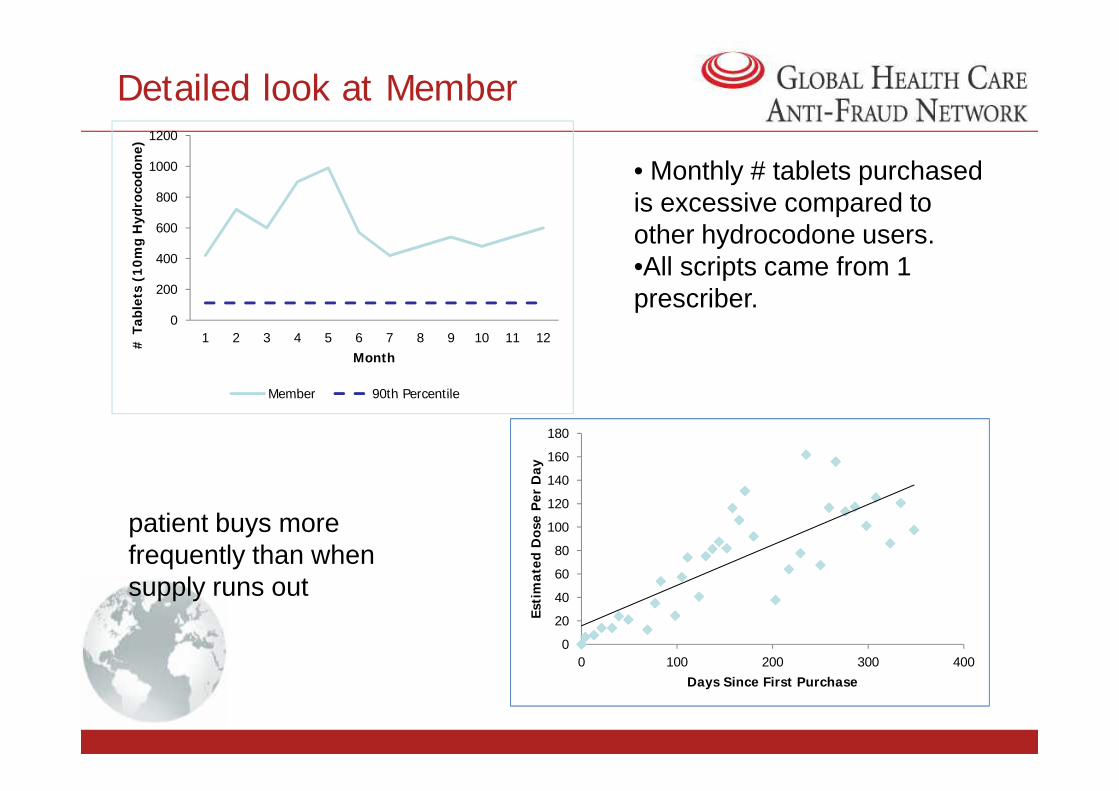
Detailed look at Member
0
200
400
600
800
1000
1200
1 2 3 4 5 6 7 8 9 10 11 12# T
able
ts (
10
mg
Hyd
roco
don
e)
Month
Member 90th Percentile
• Monthly # tablets purchasedis excessive compared toother hydrocodone users.•All scripts came from 1prescriber.
Member 90th Percentile
patient buys morefrequently than whensupply runs out
0
20
40
60
80
100
120
140
160
180
0 100 200 300 400
Esti
mat
ed D
ose
Per
Day
Days Since First Purchase

Example 2 Findings:Top 10 Promethazine Members
Member score FlaggedwithSpec
MemberInactive
Qty 12m(ML)
# Monthswith Rxfor thisDrug
# NewRx
% NewRx ofthisDrug
with NoDr Visit
# DrVisit s
with NoRx ofthisDrug
#Pharma
#Prescrib
ers
#Rxotherfraudpronedrugs
DiffZipdist
****7226 64 0 1 16,800 11 35 100 0 1 2 31 0****5643 61 0 1 14,190 11 15 100 0 2 2 14 0****5543 60 1 1 5,038 7 22 100 0 4 7 15 0
Bought Promethfor 12 months.Not a seasonaluser.
95% of new Rxfor Prometh hadno prior doctorvisit
Traveled 4miles morefor Promethcompared tonon-fraud-prone drugs
Went to 7pharmaciesand 8prescribersfor Prometh
****5643 61 0 1 14,190 11 15 100 0 2 2 14 0****5543 60 1 1 5,038 7 22 100 0 4 7 15 0****0381 58 0 0 10,560 12 42 95 22 7 8 44 4****5606 57 1 1 5,160 6 24 100 1 4 9 3 0****3115 57 0 1 6,203 8 11 100 0 2 7 4 0****4290 56 0 0 13,673 12 31 90 3 6 4 22 1****6742 56 0 1 2,472 6 9 100 0 2 9 9 0****0371 55 1 0 12,440 12 26 92 1 4 3 16 6****3097 54 0 1 3,298 7 10 100 1 2 8 11 0
Had 22 other doctor visits in 2009 that did notinvolve the prescription of Prometh. Could thisbe a cancer patient using Prometh as an anti-nausea drug?

Detailed look at Member
•Escalating usage.•Heavy usage compared to 90%tileof age group (age 47)•Expected seasonal usage notfollowed.
Tota
l Qua
ntity
0
200
400
600
800
1000
1200
1400
1600
1800
2000
Month
1 2 3 4 5 6 7 8 9 10 11 12
Dispensing Quantity
Est D
ose
Per D
ay
0102030405060708090
100110120130
Days Since First Purchase
0 100 200 300 400
Avg Dose pDay
patient buys morefrequently than whensupply runs out
Tota
l Qua
ntity
0
200
400
600
800
1000
1200
1400
1600
1800
2000
Month
1 2 3 4 5 6 7 8 9 10 11 12
Dispensing Quantity
Est D
ose
Per D
ay
0102030405060708090
100110120130
Days Since First Purchase
0 100 200 300 400
Avg Dose pDay

Drug Seeking Behavior Study:Link Analysis
• Suspicious Network of Collusion:
• 2 members, both high scorers, same address• 6 prescribers, 9 for the other, none in common• Member 1 had activity from January-August 2009, and member 2
from June-August 2009.• Activities of the 2nd member could have been stopped earlier if DSB
scoring and link analysis were performed regularly.

Example 3: Commercial U.S.Health Plan - Targeting 5 Specialties
• Problem statement:– Analyze professional claims payment activity in order to identify
patterns of fraud, waste and abuse in: Labs, DME, PainManagement, Mental Health and Podiatry.
• Analytics applied: Rules, anomaly detection and link analysis
• Data Provided:– All claims, provider and member information for 1 year and 1 region– ~ 10k providers and $161M annually
• Findings:– ~$16M in suspicious activity detected– 623 providers flagged

Specialty #Providers
Amount paid # ProvidersFlagged **
AmountFlagged
LAB 5,451 $75,820,727 382 $11,232,812PAIN 2,158 $32,587,234 104 $2,466,119DME 1,322 $42,059,927 86 $1,480,618
Example 3: Commercial U.S.Health Plan - Targeting 5 Specialties
DME 1,322 $42,059,927 86 $1,480,618MENTAL 649 $7,897,088 45 $715,669PODIATRY 493 $3,000,998 15 $93,086
All Five 10,073 $161,365,974 632 $15,988,304
** Includes all providers with at least 1 alert triggered

• Goal: uncover potential fraud networks by linking flaggedproviders based on name, address, phone number, tax id, SocialSecurity Number
Network 10884:• 3 LAB providers 2LAB companies• total potential loss =$81k
2 providers having same phonenumber, tax id, similar names,but different addresses samecompany, different branches?
Example 3: Commercial U.S. Health PlanTargeting 5 Specialties
High scorer (75).Potential loss=$79k.
Network 10884:• 3 LAB providers 2LAB companies• total potential loss =$81k
2 providers having same phonenumber, tax id, similar names,but different addresses samecompany, different branches?
2 providers having sameaddress but other infodifferent. Medium scorercolored green, while lowscorer colored white.

Example 4: U.S. Blue Cross PlanTargeting Limited Benefit Abuse• Problem statement:
– Abuse of benefits with inside limits (such as chiropractic andacupuncture) by continuing the services using other family members’ID.
• Analytics applied: Rules and anomaly detection
• Data Provided:– All claims, provider and member information for 3 years (results on
most recent 12 months)– ~ 8.57M claims, 750k members and $871M (most recent 12 months)
• Findings:– ~$162k in suspicious activity detected– 583 members flagged
• Problem statement:– Abuse of benefits with inside limits (such as chiropractic and
acupuncture) by continuing the services using other family members’ID.
• Analytics applied: Rules and anomaly detection
• Data Provided:– All claims, provider and member information for 3 years (results on
most recent 12 months)– ~ 8.57M claims, 750k members and $871M (most recent 12 months)
• Findings:– ~$162k in suspicious activity detected– 583 members flagged

• When one family member’s benefit is used up, billing moves to anotherfamily member with the same or similar diagnosis and same procedures:
– 483 members in 182 families with 120 Chiropractors• Youngest member seen was 1 year old• 3083 claims worth $111,110
– 13 members in 4 families with 8 acupuncture providers• Youngest member seen was 11• 104 claims worth $33,493
– 87 members in 32 families with 18 dermatologists• Youngest member seen was 8• 178 claims worth $17,525
Example 4: U.S. Blue Cross PlanTargeting Limited Benefit Abuse• When one family member’s benefit is used up, billing moves to another
family member with the same or similar diagnosis and same procedures:
– 483 members in 182 families with 120 Chiropractors• Youngest member seen was 1 year old• 3083 claims worth $111,110
– 13 members in 4 families with 8 acupuncture providers• Youngest member seen was 11• 104 claims worth $33,493
– 87 members in 32 families with 18 dermatologists• Youngest member seen was 8• 178 claims worth $17,525

Example 5: U.S. Public AgencyTargeting In-Home Support Services• Problem statement:
• Desire to detect fraud earlier• Improve the quality of their alerts• Facilitate criminal investigations
• Analytics applied: Rules, anomaly detection, predictive modeling and LinkAnalysis
• Data Provided:– Beneficiary, provider, historical fraud referrals and vital records data for most recent 4
years– ~170k beneficiaries and $1.9B paid in 2011
• Findings:– 1020 alerts and $1.6M at risk
• Problem statement:• Desire to detect fraud earlier• Improve the quality of their alerts• Facilitate criminal investigations
• Analytics applied: Rules, anomaly detection, predictive modeling and LinkAnalysis
• Data Provided:– Beneficiary, provider, historical fraud referrals and vital records data for most recent 4
years– ~170k beneficiaries and $1.9B paid in 2011
• Findings:– 1020 alerts and $1.6M at risk

Results:Anomaly Detection Rules Cases FlaggedDistance and GeographyProvider Address out of State 39
Provider Address out of County 436
Distance Between Provider and Consumer
30 to 39 Miles 1749
40 to 69 Miles 2171
Over 70 Miles 567
Example 5: U.S. Public AgencyTargeting In-Home Support Services
Over 70 Miles 567
Hours per MonthSeverely Impaired cases (defined as eligible for up to 283 hrs. permonth but receiving more)
2292
Non-Severely Impaired (defined as eligible for up to 195 hrs. per monthbut receiving more)
3289
Authorized for up to 300 hrs. per month but provider paid for more 756
Paid for Over 540 Hours 55
Paid for Over 720 Hours 12
Cross ParticipationIHSS Provider is also Consumer of IHSS services 212
DMS Child Care Provider is also IHSS Consumer 289

More Results:Anomaly Detection Rules Cases FlaggedPayment After Death Provider Consumer
30 to 59 Days 41 545
60 to 119 Days 27 254
120 to 179 Days 19 102
180 to 364 Days 20 74
Over 365 Days 44 50
Example 5: U.S. Public AgencyTargeting In-Home Support Services
Over 365 Days 44 50
Suspicious ActivityPerson was only 1 link away from someone convicted or under investigation 259 71
Person was a suspect in another fraud case 558 564
Person was on the list of fleeing felons the state is pursuing n/a 20
Convicted Drug Felon n/a 27
Suspicious Scenario (provider is not a relative and traveling >40 mi. to getpaid for small # of hours)
45

Closing Thoughts
• Multiple Methods are a Must
• Don’t just perpetuate EVERY linkage
• Re-score using other analytics after you build the links
• All models degrade over time:– Need a continual feedback loop– Need periodic testing of model performance
• Hoard the data, and use it all – even the unstructuredtext data!
• Multiple Methods are a Must
• Don’t just perpetuate EVERY linkage
• Re-score using other analytics after you build the links
• All models degrade over time:– Need a continual feedback loop– Need periodic testing of model performance
• Hoard the data, and use it all – even the unstructuredtext data! 70

2nd Global Summit
Healthcare Fraud:Prevention is better than cure
25-26 October 2012Beaumont Estate, Old Windsor, UK
2nd Global Summit
Healthcare Fraud:Prevention is better than cure
25-26 October 2012Beaumont Estate, Old Windsor, UK
Recommended