AEGC 2019: From Data to Discovery – Perth, Australia 1
The Role of Geochemistry in Understanding Mineral Systems
Carl W. Brauhart
CSA Global 2/3 Ord St WEST PERTH 6005 [email protected]
INTRODUCTION
The mineral systems concept (McCuaig et al., 2010) is a
helpful framework into which we can place our exploration
data, interrogate it and erect new hypotheses for testing.
Correctly used, it is more flexible than traditional ore deposit
models which have more fixed assumptions, and it also
encompasses a larger volume of rock, taking into account
energy inputs, metal source regions, flow paths, trap sites and
spent fluid paths.
Whole-rock geochemistry is a cheap and widely available tool
that can be used to advance understanding of a mineral system
in three major ways:
1. Immobile element lithogeochemistry to constrain
stratigraphy,
2. Alteration geochemistry to quantify mass balance
changes along hydrothermal flow paths, and
3. Metal enrichment signatures related to
mineralisation.
Each of these areas of investigation can be applied at any
scale, and there are procedures specific to each of them.
Following the mineral systems approach makes the explorer
more mindful of the importance of scale when interpreting
geochemical and other data. It also encourages that explorer to
try and fit “the pieces of the puzzle” into a coherent whole,
and in so doing increases the likelihood that sensible
exploration targets will be tested in a logical fashion.
IMMOBILE ELEMENT LITHOGEOCHEMISTRY
In any hydrothermal mineral system there is widespread mass
transfer meaning that, at best, mobile elements (including
most major elements) will only serve as a rough guide to
original rock compositions. The more intense the alteration,
the more pronounced this problem becomes. Apart from rare
cases of extreme alteration, “immobile” elements (Fig. 1f) are
neither added to, or removed from, the rock mass. Therefore
immobile element ratios remain constant for each rock type.
Immobile element ratios can be used to identify sedimentary
packages of the same provenance and they are particularly
powerful for discriminating different igneous rocks. Two
different types of immobile element ratio are important:
1. Incompatible / Incompatible Element Ratio (e.g.,
Zr/Th to discriminate different magma series), and
2. Compatible / Incompatible Element Ratio (e.g.,
Ti/Zr to discriminate different degrees of fractional
crystallisation within a magma series)
In cases of extreme alteration, where some of the normally
immobile elements have undergone mass transfer, there is
usually a subset of immobile elements that have remained
fixed and still have constant inter-element ratios.
In the Panorama VHMS mineral system, the Ti/Zr ratio
(higher values are more mafic) is a very helpful check on the
rock units that have been mapped, but the Zr/Th and Th/Yb
ratios resolve discrete magma series in the volcanic pile (Fig.
1) that could not recognised without geochemistry. For a
VHMS mineral system, breaks in volcanic activity are
potential host horizons, so recognising these breaks is very
important for a better understanding of stratigraphy, and
through that, the mineral system. The reason that
incompatible-immobile element pairs can be used to
distinguish different batches of magma is that these elements
stay in the melt rather than crystallising in phenocryst phases.
Therefore, as fractional crystallisation proceeds, the initial
incompatible-immobile element ratios of the melt are
preserved and can be used to fingerprint rocks that belong to
it.
ALTERATION GEOCHEMISTRY
An advanced understanding of alteration in a mineral system
is generally not possible until starting compositions have been
constrained through adequately understanding the host strata.
Mass balance studies (e.g., Gresens, 1967; McLean and
Barrett, 1993) can quantify how much of each mobile element
has been added and lost throughout the mineral system so long
as the starting compositions are adequately constrained. A
quicker and very effective approach used by Halley (2016) is
to model mineralogy throughout a mineral system using a
suite of geochemical plots appropriate to that mineral system
SUMMARY
The mineral system concept is a valuable framework to
use for mineral exploration because it allows the user to
interpret their data with more flexibility than for
traditional ore deposit models. Better context is provided
by a well constructed mineral deposit model because
fundamental processes can be adapted to a broad range of
systems.
Geochemistry adds much needed detail to any mineral
deposit model in three main areas: (1) immobile element
geochemistry to better constrain lithological units and
define a more detailed stratigraphy, (2) alteration
geochemistry to quantify mass balance leading to a better
understanding of hydrothermal fluid flow and potential
trap sites, and (3) metal enrichment signatures and how
they vary across a mineral system so that exploration can
be focussed on those parts of the mineral system that
have the highest likelihood of exploration success.
Geochemistry to Understand Mineral Systems Carl Brauhart
AEGC 2019: From Data to Discovery – Perth, Australia 2
and that highlight key alteration processes. The keys to using
this approach are to plot alteration minerals on those graphs
and have the knowledge to discern alteration-related processes
from lithological ones. Both are potential drivers of
geochemical trends on mineralogical plots.
Both approaches are effective in mapping important aspects of
the Panorama mineral system. Brauhart et al. (2001) made
mass balance calculations for major and selected trace
elements following the methods of McLean and Barrett
(1993). Magnesium is added to chlorite-quartz altered rocks
near the base of the volcanic pile and in discordant corridors
underneath the prospects and deposits (interpreted as
hydrothermal discharge zones; Fig 2a). Copper is strongly
depleted (1-2 ppm Cu in mafic and intermediate rock) in the
same zones as well as in feldspar-bearing rock from high
temperature alteration zones at the bottom of the volcanic pile
(Fig. 2b). A simple Na/Al versus K/Al molar ratio plot (Fig.
2c) is very effective at demarcating major alteration zones and
a zone of Na-enrichment near the base of the volcanic pile
(Fig. 2d).
At Panorama, alteration mapping is interpreted to reflect a
seawater dominated convective hydrothermal alteration
system and that map is consistent with whole-rock
geochemistry data. Alteration temperatures are interpreted to
increase across semiconformable alteration zones that overlie
a large subvolcanic intrusion; the Strelley Granite. Focussed
zones of high-temperature hydrothermal discharge are
interpreted to have followed discordant zones of chlorite-
quartz alteration that are mapped by Mg mass transfer (Fig.
2a) and combined low Na/Al and K/Al molar ratios (Fig. 2d).
A map of Cu mass transfer suggests that the northern part of
the district around Sulphur Springs and Kangaroo Caves may
be more fertile based on the amount of metal leached from the
footwall.
METAL SIGNATURE
Multielement geochemistry is our primary tool for
understanding the combination of elements that are enriched
in a body of mineralisation and give it its “multielement
signature”. That pattern of element enrichment is more subtly
expressed in the fresh rock halo to mineralisation as well as
dispersed by weathering and erosion in weathered rock.
Understanding the zonation of metal signature in fresh rock is
one of the keys to understanding metal distribution throughout
a mineral system and for interpreting its modified expression
in the regolith.
One of the best tools for isolating metal associations related to
mineralisation is by the expert use of Principal Component
Analysis (PCA). It can be used at all scales from a portion of a
mineral deposit to data covering an entire mineral system and
on data types including drill, rock chip, soil and stream
sediment samples. Most of the variation in a multielement
dataset is captured in the first handful of principal components
by PCA. In drill data from a mineral deposit, the main metal
signature will feature on PC1, whereas it is likely to be a much
more subtle feature on a lower order PCs like PC4 or PC5 in
regional stream sediment data. As for mineral systems analysis
in general, it is important to subset data for PCA so that metal
signatures are understood over a range of different scales.
The OSNACA transform (Brauhart et al., 2017) provides a
framework in which any metal enrichment can be mapped in
Magmato-Hydrothermal Space (MH-Space) relative to a
global database of ore samples (Fig. 3). A key finding of the
work by Brauhart et al. (2017) is that ore deposits have a range
of signatures and occupy a discrete volume within MH-Space.
Data for individual deposits overlap to define a volume for
each ore deposit class, and all the deposit classes combined
map the architecture of MH-Space (Fig. 3). Again it is
possible to interrogate data at all scales from within an
individual deposit, through camp and deposit class scale to all
of MH-Space. A fruitful area of future research is likely to be
mapping subtle variations in metal signature within deposits
and across mining camps and the OSNACA-transform is an
ideal tool to do this work. Such work should lead to a better
understanding of how mineral systems work and where
economic concentrations of metal are most likely to be found
in those systems.
CONCLUSION
Multielement geochemistry can prove overwhelming in both
its depth (number of samples) and its breadth (number of
elements). However, there are well proven tools that explorers
can use with these data to:
1. Better discriminate strata across an entire mineral
system. From a more detailed understanding of stratigraphy
comes better structural interpretations.
2. Quantify mass changes associated with
hydrothermal alteration and constrain the likely mineralogy of
that alteration. To understanding the 4-D architecture of an
alteration system is to understand the 4-D architecture of the
hydrothermal fluid flow.
3. Gain a detailed understanding of the multielement
nature of metal enrichment (signature), and more importantly,
spatial variations in that signature across the mineral system.
Both intra- and inter-deposit variations are important.
REFERENCES
Brauhart, C.W., Huston, D.L., Groves, D.I., Mikucki, E.J., and
Gardoll, S.J., 2001, Geochemical mass transfer patterns as
indicators of the architecture of a complete volcanic-hosted
massive sulfide hydrothermal alteration system, Panorama
district, Pilbara, Western Australia: Economic Geology, 96,
1263-1278.
Brauhart, C.W., Grunsky, E.C., and Hagemann S.G., 2017,
Magmato-Hydrothermal Space: A New Metric for
Geochemical Characterisation of Metallic Ore Deposits: Ore
Geology Reviews, 86, 867-895.
Gresens, R.L., 1967, Composition-volume relationships of
metasomatism: Chemical Geology, 2, 47-55.
Halley, S., 2016, Interpreting Multielement Geochemistry
data: Mineralogical Patterns in Hydrothermal Systems
Seminar, University of Western Australia, 22 July 2016.
MacLean, W.H., and Barrett, T.J., 1993, Lithogeochemical
techniques using immobile elements: Journal of Geochemical
Exploration, 48, 109-133.
Campbell McCuaig, C.T., Beresford, S., and Hronsky J., 2010,
Translating the mineral systems approach into an effective
exploration targeting system: Ore Geology Reviews, 38, 128-
138.

AEGC 2019: From Data to Discovery – Perth, Australia 3
Figure 1. Panorama VHMS District (A) rock samples
classified according to composition, (B) rock samples
classified according to magma series, (C) Zr-Ti plot with
same legend as 1a, (D) Th-Zr plot with same legend as
1b, (E) Th-Yb plot with same legend as 1b, (F) Extended
primitive mantle normalised trace element diagram
showing lower suite volcanic samples.
A
B
D
E
C
F

Figure 2. Panorama VHMS District (A) Magnesium
mass transfer values following methods of McLean and
Barrett (1993) gridded for 420 whole-rock samples. (B)
Copper mass transfer values as for (A) highlighting
pronounced copper depletion in footwall to Sulphur
Springs and Kangaroo Caves. (C) Na/Al versus K/Al
molar ratio plot for 420 rock chip samples with key
alteration mineral nodes and common igneous rock
compositions. (D) Rock chip data colour coded according
to Na/Al versus K/Al plot in (C), with alteration map as
background.
A
B
D
C
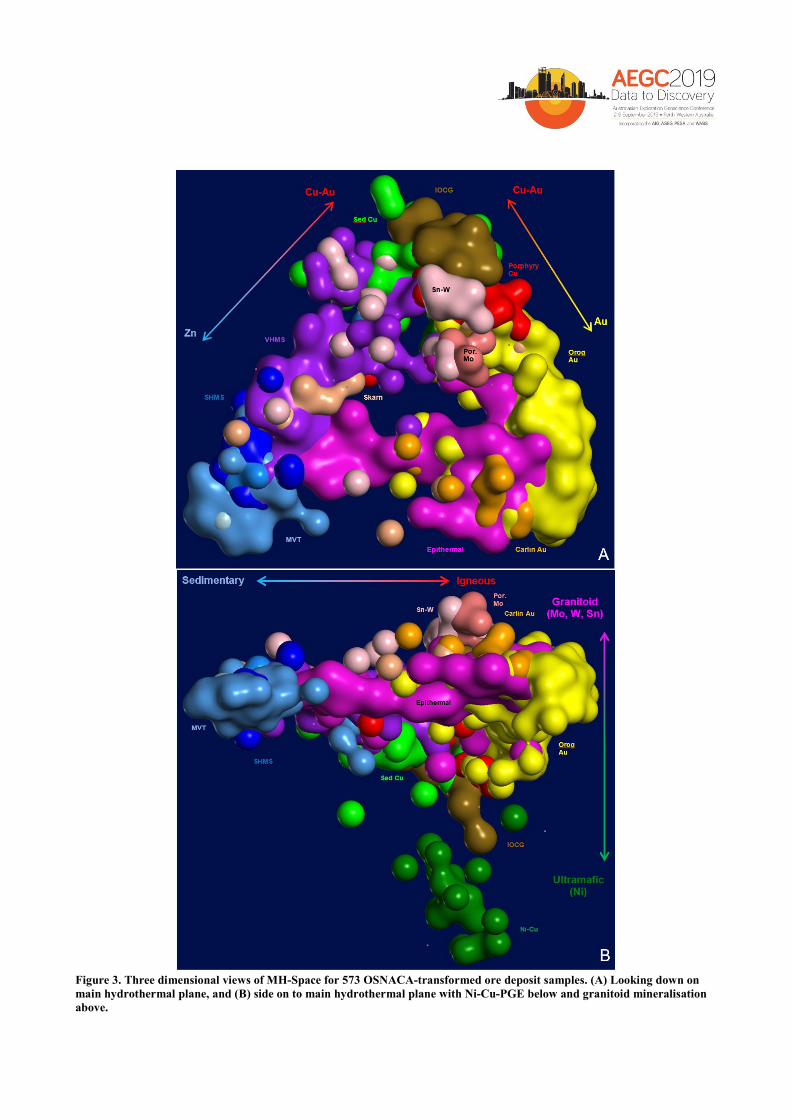
Figure 3. Three dimensional views of MH-Space for 573 OSNACA-transformed ore deposit samples. (A) Looking down on
main hydrothermal plane, and (B) side on to main hydrothermal plane with Ni-Cu-PGE below and granitoid mineralisation
above.
Recommended

![Application of 3D Geochemistry to Mineral Exploration · Application of 3D Geochemistry to Mineral Exploration Jackson, R. G. [1] _____ 1. Consulting Geochemist ABSTRACT The development](https://img.dokumen.tips/doc/110x75/5edc61b0ad6a402d666704f4/application-of-3d-geochemistry-to-mineral-application-of-3d-geochemistry-to-mineral.jpg)


![Application of 3D Geochemistry to Mineral Exploration · Application of 3D Geochemistry to Mineral Exploration Jackson, R. G. [1] 1. Consulting Geochemist ABSTRACT The development](https://img.dokumen.tips/doc/110x75/5e860a795aa1774f9501610a/application-of-3d-geochemistry-to-mineral-exploration-application-of-3d-geochemistry.jpg)