THE RELATIONSHIP BETWEEN SYSTEM CHARACTERISTICS, PATIENT SAFETY PRACTICES, AND PATIENT SAFETY OUTCOMES
IN JCAHO ACCREDITED ACUTE CARE HOSPITALS
by
Phyllis Morris-Griffith A Dissertation
Submitted to the Graduate Faculty
of George Mason University in Partial Fulfillment of
The Requirements for the Degree of
Doctor of Philosophy Nursing
Committee: __________________________________________ Dr. P. J. Maddox, Chair __________________________________________ Dr. Barbara Hatcher, 1st Reader __________________________________________ Dr. Margie Rodan, 2nd Reader __________________________________________ Dr. R. Kevin Mallinson, Assistant Dean, Doctoral Division and Research Development __________________________________________ Dr. Thomas R. Prohaska, Dean,
College of Health and Human Services
Date: _____________________________________ Summer Semester 2016 George Mason University Fairfax, VA

The Relationship Between System Characteristics, Patient Safety Practices, and Patient Safety Outcomes in JCAHO Accredited Acute Care Hospitals
A dissertation submitted in partial fulfillment of the requirements for the degree Of Doctor of Philosophy at George Mason University
By
Phyllis Morris-Griffith Master of Health Care Administration
Mississippi College, 1989 Bachelor of Science in Nursing
University of Southern Mississippi, 1985
Director: P. J. Maddox, Professor Department of Health Administration and Policy
Summer Semester 2016 George Mason University
Fairfax, VA

ii
Copyright 2016 Phyllis Morris-Griffith All Rights Reserved

iii
DEDICATION
This dissertation is dedicated to my grandmother, Ruby Barnes Sellers, who instilled in me the value of education. She taught me to live with purpose and determination, and believed that I could achieve anything. To my Aunt Janice, who inspired me as a young girl to strive for excellence, thank you for your constant encouragement. Finally, to
LaVan⎯my husband, voice of reason, confidant, and best friend⎯thank you for always believing in me. I am so grateful for the constant support and sacrifice you made so that I could achieve my professional and academic goals. Your support was essential to my success.

iv
ACKNOWLEDGEMENTS
I would like to convey my sincerest appreciation to many people who have supported my pursuit of this educational endeavor. My deepest gratitude is extended to my chair, Dr. P. J. Maddox, for her full support, expert guidance, patience, and encouragement throughout my study and research. Thank you for pushing me to see my work through a different lens. I have learned so much from you, and I am so appreciative for the opportunity to have worked with you. Your support and guidance were vital to my success. To my committee members, Dr. Margie Rodan and Dr. Barbara Hatcher, your indispensable advice, information, encouragement, and generosity of your time was so important to my achievement. To my children, Kayci Amanda and Benjamin LaVan, thank you for believing me. Your expectations motivated me to push forward towards completing this milestone. To Dr. Constance Bell, who encouraged me through continuous reminders that I could do this, I am so humbled by your faith in me. To all of the people who supported me through this achievement, I simply offer my heartfelt thanks. I am forever grateful for the love and support.

v
TABLE OF CONTENTS
List of Tables ................................................................................................................ viii List of Figures ...................................................................................................................x
Abstract ........................................................................................................................... xi Chapter 1: Introduction .....................................................................................................1
Background ...................................................................................................................2
Problem Statement ........................................................................................................5
Conceptual Framework ...............................................................................................12
Definition of Terms.....................................................................................................15
Patient Safety Indicators .........................................................................................15
General Physiological Definitions of the Five Selected PSIs .................................16
National Patient Safety Goals .................................................................................18
Teaching Status and Location .................................................................................19
Bed Size ..................................................................................................................20
Registered Nurse Staff Hours per Average Patient Discharge ...............................20
Geographic Region .................................................................................................20
Summary .....................................................................................................................21
Chapter 2: Literature Review ..........................................................................................22
Rationale for Study .....................................................................................................22
Conceptual Framework ...............................................................................................25
Structure ..................................................................................................................25
Process ....................................................................................................................27
Outcomes ................................................................................................................29
Patient Safety Movement ............................................................................................31
Patient Safety ..........................................................................................................34
Adverse Events .......................................................................................................40
Organizational Characteristics and Patient Outcomes ................................................43
Bed Size ..................................................................................................................45
Teaching and Location ............................................................................................47
Nurse Staffing .........................................................................................................50
Outcome Measures......................................................................................................55
Patient Safety Practices ...............................................................................................59
The Joint Commission Accreditation Process ............................................................66
Accreditation and Patient Outcomes .......................................................................68
National Patient Safety Goals .................................................................................72
Assessment Process ................................................................................................75
vi
HCUP-NIS Data..........................................................................................................76
Patient Safety Indicators .............................................................................................78
Summary .....................................................................................................................86
Chapter 3: Methodology .................................................................................................89
Research Design..........................................................................................................89
Conceptual Model .......................................................................................................90
Population and Sample ...............................................................................................94
Population ...............................................................................................................94
Sample.....................................................................................................................95
Datasets .......................................................................................................................97
Hospital-Level Data ....................................................................................................97
Group Size, Missing, and Outlier Data .................................................................102
Data Analysis ........................................................................................................103
Data Analysis Plan ....................................................................................................104
Research Question 1 .............................................................................................104
Research Question 2 .............................................................................................105
Research Question 3 .............................................................................................106
Research Question 4 .............................................................................................107
Human Subject Protection ........................................................................................108
Chapter 4: Results .........................................................................................................110
Descriptive Analysis .................................................................................................110
Findings Reported by Research Questions ...............................................................116
Research Question 1 .................................................................................................116
Research Question 2 .................................................................................................126
Research Question 3 .................................................................................................127
Research Question 4 .................................................................................................132
Chapter 5: Discussion and Recommendation ...............................................................143
Question 1 .................................................................................................................144
Question 2 .................................................................................................................146
Question 3 .................................................................................................................148
Hospital Bed Size ..................................................................................................149
Teaching Status and Location ...............................................................................150
RN Staffing ...........................................................................................................151
Geographic Region ...............................................................................................152
Question 4 .................................................................................................................153
Teaching Status and Location ...............................................................................153
Geographic Region ...............................................................................................156
Recommendations for Further Nursing Research .....................................................158
Implications for Nursing Practice .............................................................................160
Strengths and Limitations .........................................................................................163
Strengths ...............................................................................................................163
Limitations ............................................................................................................164
Conclusion ................................................................................................................166

vii
Appendix A ...................................................................................................................169
Appendix B ...................................................................................................................170
Appendix C ...................................................................................................................171
Appendix D ...................................................................................................................172
Appendix E ...................................................................................................................173
Appendix F....................................................................................................................176
References .....................................................................................................................180
viii
LIST OF TABLES
Table 1. Operational Definitions of Patient Safety Indicators (PSIs) ............................ 17
Table 2. Descriptions of 2011 Hospital National Patient Safety Goals (NPSGs) ......... 19
Table 3. Healthcare Cost and Utilization Project Bed Size Categories ......................... 20
Table 4. Adverse Events and Hospitalization ................................................................ 41
Table 5. Noncompliance Percentages for National Patient Safety Goals ...................... 74
Table 6. Agency for Healthcare Research and Quality’s Provider-level PSIs .............. 81
Table 7. Research Questions, Variables, Data Source, and Data Analysis ................... 92
Table 8. Hospital Discharges Per State for 2011 National Inpatient Sample ................ 98
Table 9. Variable Construction .................................................................................... 101
Table 10. Number and Accreditation Status of U.S. Hospitals in 2011 by State .......... 111
Table 11. Distribution of Hospitals by Region, Size, Teaching Status, and Location ... 112
Table 12. Healthcare Cost and Utilization Project-Participating Hospitals by States and Region ..................................................................................................... 112
Table 13. Mean Rate of Hospital-Reported Patient Safety Indicators ........................... 115
Table 14. Hospital Patient Safety Indicator Frequency by National Patient Safety Goal Compliance ........................................................................................... 117
Table 15. Patient Safety Indicator Rates by National Patient Safety Goal Compliance for Sample Hospitals Studied......................................................................... 118
Table 16. Patient Safety Indicator Frequency by Hospital Geographic Region ............ 119
Table 17. Patient Safety Indicator Frequency by Teaching Status and Location .......... 120
Table 18. Frequency of Patient Safety Indicator by Registered Nurse Staffing Levels 121
Table 19. Patient Safety Indicator Frequency by Hospital Bed Size ............................. 122
Table 20. Relationship Between Hospital National Patient Safety Goal Compliance and Patient Safety Indicator Rate, Mann Whitney Results ............................ 124
Table 21. Logistic Regression Coefficients for Hospitals by Bed Size, Region, and Teaching Status ........................................................................................... 125
Table 22. Hospital Bed Size, Region, Location, and National Patient Safety Goal Compliance, Chi Square Results.................................................................... 127
Table 23. Kruskal-Wallis Test Results for Hospital Characteristics and Patient Safety Indicator Outcomes Relationships ................................................................. 128
Table 24. 2011 National Inpatient Sample Patient Safety Indicator Rates Per Hospital Study Sample Characteristic .......................................................................... 130
Table 25. Logistic Regression Univariate and Multivariate⎯Decubitus Ulcer .............. 135
Table 26. Logistic Regression Univariate and Multivariate⎯Central Venous Line Bloodstream Infection .................................................................................... 137

ix
Table 27. Logistic Regression Univariate and Multivariate⎯Postoperative Sepsis ....... 139

x
LIST OF FIGURES
Figure 1. Donabedian’s conceptual framework.. ............................................................ 30

ABSTRACT
THE RELATIONSHIP BETWEEN SYSTEM CHARACTERISTICS, PATIENT SAFETY PRACTICES, AND PATIENT SAFETY OUTCOMES IN JCAHO ACCREDITED ACUTE CARE HOSPITALS Phyllis Morris-Griffith, Ph.D George Mason University, 2016 Dissertation Chair: Dr. P. J. Maddox This exploratory, descriptive study examined the relationship of patient safety practices
as measured by compliance with The Joint Commission’s national patient safety goals
(NPSGs), hospital characteristics, and patient safety outcomes as defined by the Agency
for Healthcare Research and Quality (AHRQ) patient safety indicators (PSIs) in
accredited, acute care hospitals in the United States. It examined the relationship between
the implementation of patient safety practices such NPSGs and outcomes as defined by
the AHRQ’s PSIs. It further examined the relationship between hospital characteristics
such as teaching status, geographic location, and bed size with NPSGs. It used
Donabedian’s triad model (Donabedian, 1960) to examine the relationship between
NPSGs and quality outcomes, and the influence of hospital characteristics on these
variables. The findings provided objective information to guide hospital leaders regarding
influences on patient safety outcomes and help them make decisions accordingly.

1
CHAPTER 1: INTRODUCTION
Concerns for quality in today’s rapidly changing healthcare delivery system
require healthcare policy makers to acknowledge the need for fundamental change
(Institute of Medicine, 2001). Identifying influences that are associated with providing
safe care in healthcare delivery is crucial. Many researchers contend that most medical
errors or adverse events are preventable (Brennan, Hebert et al., 1991; Thomas et al.,
2000b; Lehman, Puopolo, Shaykevich, & Brennan, 2005). As a result of medical errors,
hospitalized patients face longer hospital stays and assume a greater financial burden
(Nordgren, Johnson, Kirschbaum, & Peterson, 2004; Zhan & Miller, 2003b; Rojas,
Silver, Llewellyn, & Ranees, 2005).
Hospitals struggle with the impact of organizational structure and process at the
system level. As a result of the heightened attention toward improving patient safety over
the past decade, healthcare leaders have turned to safety science literature to help explain
patient safety and provide direction for creating safety management systems (Flin, 2007).
Further, as federal and state compliance demands and production demands mount,
providers are challenged to deliver healthcare with decreased staff, suboptimal working
conditions, limited availability of suitable technology, and a shortage of nurses and
physicians. It is the influence of these factors that lead to serious harm and
2
need to identify structures and processes that will influence the delivery of quality care
(James, 2013).
Various safety practices have been implemented to address patient safety issues in
healthcare. However, their impact on patient outcomes remains relatively unexplored
(Shojana, Duncan, McDonald, & Wachter, 2001). The Joint Commission organization
responded to the Institute of Medicine (IOM) reports on safety concerns in 2003 by
issuing a group of standards and eventually national patient safety goals (NPSGs) to
promote specific improvements. The goals serve as a national standardized performance
measurement system of care delivered (The Joint Commission, 2013).
Despite widespread dissemination, there is significant variation in the application
of the standards across hospitals (Fonarow, Yancy, & Haywood, 2005; Bradley et al.,
2006; Peterson & Walker., 2006). Variability in the application of quality processes is
complex, and researchers have suggested that reasons are associated with systems issues
(Fonarow, Yancy, & Heywood, 2005). Although studies have found a correlation of
specific outcome variables with hospital type, size, and location, no study specifically has
examined patient outcome variables and their association with organizations’
implementation of The Joint Commission’s NPSGs.
Background
As early as 1964, Schimmel published evidence that supported the need for focus
on patient safety in a study that revealed that 20% of 1,000 patients admitted to a
university hospital suffered an adverse outcome, such as hospital-acquired infections and
medication reactions, related to their hospitalization. Little activity ensued following
3
Schimmel’s published report until the IOM, responding to public concern, published its
now-renowned book, To Err is Human: Building a Safer Healthcare System (Kohn et al.,
2000). The crusade to develop a quality improvement plan that would change the
healthcare industry began with the formation of the IOM’s Quality of Healthcare in
America committee. Medical errors were number one on the agenda because errors easily
were understood by the American public and the consequences of error created sizable
financial and social burdens (Kohn et al., 2000).
The first estimates from the IOM report of medical errors received widespread
attention (Kohn et al., 2000) and revealed that an estimated 1 million people are injured
by errors during treatment at a healthcare facility each year. At the time of the report, 3%
to 4% of hospitalizations had some adverse event, with 9% to 14% of those mistakes
resulting in death. These numbers equate to approximately 44,000 to 98,000 annual
deaths of hospitalized patients per year. According to the latest numbers noted in a study
by Classen et al. (2011), adverse events in hospitals may be 10 times greater than
previously thought.
Adverse events attributed to death in 13.6% of the subjects in one study (Brennan,
Leape et al., 1991) and 6.6% in the other study (Thomas et al., 2000b). Medical errors are
ranked as the eighth-leading cause of death in the United States. Further, the costs
associated with medical errors in hospitals across the nation are estimated between $17
billion and $29 billion per year. Aside from these staggering statistics, the costs also
impact intangible issues such as trust in the healthcare system and diminished satisfaction
by both patients and health professionals (Kohn et al., 2000).
4
Fifteen years since the healthcare report from the IOM, Crossing the Quality
Chasm (IOM, 2001), data show that the quality of delivery of healthcare in the United
States remains at an unexpected low point, where efforts to improve patient safety in all
dimensions is perilous (Hughes & Kelly, 2008). The United States is ranked last out of
seven nations⎯including Australia, Canada, Germany, the Netherlands, New Zealand, and
the United Kingdom⎯on dimensions of patient safety and access equity (Zhang, 2007).
More than $1.9 trillion is spent on healthcare in the United States⎯an amount that makes
the United States’ healthcare system the most expensive in the world. However, medical
error costs in the United States totaled an estimated $19.5 billion during 2008, according
to the 2011 National Healthcare Quality Report. Indirect costs related to increased
mortality rates total $1.4 billion (Zhang, 2007). Despite the money spent, medical errors
continue to plague the system.
There have been efforts from healthcare organizations, various associations,
professional societies, health insurers, and regulatory and accrediting bodies to respond to
the recommendations of the 1999 IOM report (Leape & Berwick, 2005). A sharp increase
in new agencies focusing on healthcare improvements as well as a redirection to safety by
established bodies such as the National Quality Forum (NQF), Leap Frog, Agency for
Healthcare Research and Quality (AHRQ), The Joint Commission, National Foundation
for Patient Safety, and Institute for Healthcare Improvement (IHI) have been noted.
Experts agree that focused initiatives by these agencies should be preceded by a cultural
change to fully reap the benefits of their efforts (Agency for Healthcare Research and
Quality, 2012a).
5
The Joint Commission, the leading healthcare accrediting body in the nation,
responded to the IOM report in 2003 with the issuance of patient safety accreditation
standards known as NPSGs. The first set of six NPSGs was implemented in 2003 (The
Joint Commission, 2012). The Joint Commission called for the implementation of these
goals in healthcare organizations to direct healthcare improvement efforts to high-priority
problem areas (Hyman, 2014) and to address patient safety issues being encountered and
reported across the nation.
Problem Statement
As the 2001 IOM report Crossing the Quality Chasm made clear, estimated
injuries were upward of 98,000 per year. Using a weighted average of four studies, James
(2013) found a lower limit of 210,000 deaths per year to be associated with preventable
adverse errors in hospitals. While this number is reflective of current estimates of
preventable errors, it does not compensate for the known absence of evidence in medical
records of errors, near misses, or verbalized patient complaints. Weissman et al. (2008)
estimate a twofold increase in medical errors to account for undocumented evidence of
serious adverse errors caused during hospitalizations. He estimates that preventable errors
may contribute to the death of approximately 440,000 patients each year from care
provided in hospitals. This number represents roughly one-sixth of all deaths that occur in
the United States each year and is more than four times the original estimate of 98,000
from the IOM report (Kohn et al., 2000). Whether the number is 98,000, 210,000, or 440,
000, an epidemic of patient harm in hospitals is undeniable. Additional research must be
undertaken to identify causes and curtail these alarming numbers.
6
However, a significant gap exists in healthcare literature linking patient safety
practices, patient outcomes, and selected hospital characteristics. The gap may be
attributable in part to the lack of standardization of optimal indicators for the quality of
patient care used in measuring outcomes and culture (Clarke, 2014). Before the
implementation of NPSGs, organizations made attempts to use selected Joint
Commission standards to improve the quality of care based on institutional data (Kizer &
Blum, 2005; Leape, Berwick, & Bates, 2002). However, their attempts to gain valuable
outcome information related to patient safety practices failed. Since the implementation
of The Joint Commission’s NPSGs in 2003, there has been an absence of studies to
explore the relationship between NPSGs and the AHRQ’s patient safety indicator (PSI)
outcomes.
Despite widespread dissemination of The Joint Commission’s NPSGs and the
AHRQ’s PSIs, there is significant variation in the implementation and compliance across
hospitals (Fonarow et al., 2005; Bradley et al., 2006; Peterson & Walker, 2006; Masica,
Richter, Convery, & Haydar, 2009). Reasons for the variation in the application of
evidenced-based processes are complex. It has been suggested that differences are
associated with systems issues (Fonarow et al., 2005). Brook, McGlynn, and Cleary
(1996) assert that one factor contributing to the variation in compliance with national
safety goals could be attributable to the lack of objective measures connecting the
processes of care to patient outcomes. Though some studies have found a correlation
between specific outcome variables with hospital type, size, and location, no work has
specifically examined the relationship of hospital characteristics with NPSGs. This study
7
will examine characteristics of acute care hospitals, and the relationship between patient
safety practices and patient safety outcomes.
Need for the Study
Despite marked efforts to improve patient safety, experts suggest that patient
safety has not improved substantially, and that action and progress on patient safety are
disturbingly slow (James, 2013; Rothschild et al., 2006). Efforts to improve safety have
been encumbered, in part, by the difficulty in examining systemic failures that occur in
complex, dynamic environments such as hospitals. The present estimate of more than
200,000 (James, 2013) deaths per year attributed to preventable errors is more than
double the original estimates over a decade ago in the IOM report To Err is Human:
Building a Safer Health System (Kohn et al., 2000). Loss of life and irreversible harm to
patients in hospitals generates an urgency and increased vigilance to address the problem
of harm to patients who seek safe, quality care.
The Joint Commission accreditation process is focused primarily on quality and
safety of clinical care. As a result, hospitals spend a significant portion of their budgets to
participate in The Joint Commission accreditation process and comply with its standards.
Thornlow and Merwin (2009) assert that the relationship between utilization of patient
safety practices, specifically NPSGs, has not been well studied, making it difficult for
hospitals to understand and identify useful actions to solve problems that could improve
patient outcomes.
Approximately 90% of all hospitals that are accredited in the United States are
accredited by The Joint Commission (The Joint Commission, 2013). Further, compliance
8
with accreditation standards has been incentivized by the deemed relationship with the
U.S. Department of Health and Human Service (HHS) Centers for Medicare & Medicaid
Services (CMS), under which hospital licensure is affected by accreditation outcomes.
Devers, Pham, and Liu (2004) conducted a study of administrators in 12 community
hospitals and found that hospitals’ major patient-safety initiatives primarily were
intended to meet The Joint Commission’s standards and requirements, leading to the
conclusion that The Joint Commission’s accreditation process is a principal driver of
hospitals’ patient safety initiatives.
However, the extent to which compliance with NPSGs truly is associated with
safety and improved outcomes is relatively unknown (Miller et.al, 2005). To date, The
Joint Commission has published limited research examining the relationship between the
implementation of NPSGs and other quality-driven organizations’ patient outcomes.
Specifically, no research has been published that examines the influence of the
implementation of The Joint Commission’s NPSGs and use of standardized outcomes
such as the AHRQ’s PSIs. The Joint Commission introduced six original NPSGs in 2003,
and over several years introduced 10 additional goals.
To evaluate its progress and how well hospitals were complying with the new
goals, The Joint Commission released annual compliance data. The data reflect hospital
compliance with the NPSGs to be low and inconsistent. It is noteworthy that as new goals
were added, non-compliance percentages increased. A complete, in-depth discussion of
noncompliance with the NPSGs can be found in Chapter 2. Given the growing emphasis
on patient safety and the increasingly complex nature of healthcare, it is critical to
9
determine whether differences in preventable adverse events among Joint Commission
accredited, acute care hospitals are reflective of differences in organizational systems and
processes implemented in those hospitals.
Purpose
The purpose of this exploratory study is to examine the relationship between
healthcare system characteristics and patient safety practices as measured by
implementation of the NPSGs, and whether these variables are associated with the
AHRQ’s PSIs in Joint Commission accredited, acute care hospitals in the United States.
The study also seeks to identify which hospital structural characteristics⎯such as teaching
status, geographic location, and bed size⎯are related to implementation with NPSGs. For
purposes of this study, four of 21 the AHRQ’s PSIs will be used.
Donabedian’s conceptual model will be used to guide the framework for
examining quality and patient care safety in this study (Donabedian, 1997). His structure-
process-outcome (SPO) paradigm long has served as a unifying framework for examining
health services and assessing patient outcomes (Donabedian, 1980). Little evidence
exists, however, that patient safety practices, as evaluated using accreditation criteria, are
related to the achievement of patient safety outcomes (Thornlow & Merwin, 2009).
Significance and Projected Outcomes
Consequences of medical errors are both tangible and intangible. Tangible
consequences are evidenced in the estimated $19 billion spent per year due to errors. The
tangible consequences of medical errors are reflected by loss of life, patient harm, and
lack of public trust. The perception of quality and safe healthcare is affected by public

10
reporting, and it influences access and healthcare decisions. Results of The Joint
Commission triennial accreditation survey is public and used by CMS to measure
participation in Medicare.
Findings from this study contribute to understanding the predictors of patient
safety outcomes. Such information may be used by healthcare leaders to improve patient
outcomes in hospitals. Understanding the relationship between hospital system
characteristics and implementation of NPSGs and the AHRQ’s PSI outcomes will help
advance the science of healthcare quality and safety measurements, and inform decisions
on the use of healthcare resources.
Questions remain as to whether data currently collected by various safety
agencies are sufficient to measure quality outcomes and help improve patient safety.
Analysis of outcome data and understanding of the relationship between hospital systems
and processes may be useful to healthcare executives in designing patient safety
solutions. Since the use of data to influence operations and incorporating various safety
practices comes from domains outside of healthcare such as the aviation industry, it is to
be hoped that the study of adverse outcomes may influence an organization’s learning
environment (Shojana et al., 2001).
Findings from this study provided empirical data that may support healthcare
organizations in efforts to improve quality and safety in healthcare.
The results of this study may contribute to what is known about successful quality
improvement efforts in hospitals. Knowledge gained from this study may provide
evidence about which systems or processes are related to quality patient outcomes and
11
the characteristics of acute care hospitals that utilize patient safety practices. It should
have a far-reaching impact on the delivery of care and approaches to quality and safety
measures.
Assumptions
Assumptions related to this study are the following: The use of secondary data
sets provided by The Joint Commission accurately reflect implementation of NPSGs. The
patient-level discharge data from the 2010 Nationwide Inpatient Sample (NIS), a subset
of the Healthcare Cost and Utilization Project (HCUP), accurately reflect the patient
conditions for each of the hospitals reported. Further, structural differences in the
characteristics among Joint Commission accredited, acute care hospitals⎯their structures
and processes⎯are representative of all U.S. hospitals, and the relationships observed in
the study findings are generalizable to reflect adverse events in acute care hospitals. The
independent variables are fixed and are measured without error, and a relationship exists
between the independent variable (hospital characteristics) and dependent variables
(patient outcomes and NPSGs) (Pedhazur, 1984).
Limitations
Limitations of this study include those related to study design and the sampling
methodology known to affect the generalizability of study findings. The findings from
this study may be limited to U. S. healthcare organizations with particular characteristics
and locations. Some limitations are related to using secondary administrative data to
study the quality of care delivered by healthcare providers. There also is an inherent
potential for bias in self-reported, administrative data (Rantz & Connolly, 2004), outdated
12
data, coding inaccuracy or bias, missing data elements, under-reporting or incomplete
reporting due to fear of reprisal, lack of clinical detail, or lack of event timing (Iezzoni,
1994; Lawthers et al., 2000; Miller, Elixhauser, Zhan, & Meyer, 2001; Weingart et al.,
2000; Zhan & Miller, 2003a).
Research Questions
This study addresses the following specific research questions:
1. Is there a relationship between national patient safety goal (NPSG)
compliance and the Agency for Healthcare Research and Quality (AHRQ)
patient safety indicator (PSI), risk-adjusted hospital outcome rates for
decubitus ulcer, postoperative sepsis, and central venous catheter bloodstream
infection in acute care hospitals accredited by The Joint Commission?
2. What is the relationship between hospital characteristics and NPSG
compliance in acute care hospitals?
3. What is the relationship between hospital characteristics and the AHRQ’s PSI
outcome rates of diabetes decubitus ulcer, postoperative sepsis, and central
venous catheter bloodstream infection in accredited acute care hospitals?
4. What are the independent predictors of adverse hospital AHRQ’s PSIs for
decubitus ulcer, postoperative sepsis, and central venous catheter bloodstream
infection in accredited acute care?
Conceptual Framework
There are numerous models to consider when exploring patient safety. According
to the AHRQ (2012b), Donabedian’s model is the standard for quality measurement in

13
healthcare. His SPO paradigm long has served as a unifying framework for examining
health services and assessing patient outcomes (Donabedian, 1980). Donabedian (1980)
was the first to introduce the SPO model, which is considered the foundation for modern
healthcare quality research. His framework has influenced healthcare quality and has
become the accepted archetype for outcomes research (Perrin, 2002). Donabedian’s
model was used to guide the framework for examining quality and patient care safety in
this study.
Donabedian developed the SPO framework to assess and evaluate the quality of
care from sciences. His model infers that three elements⎯structure, process, and
outcome⎯are the rudimentary elements indicating the quality of care or lack thereof.
Further, Donabedian’s model draws causal linkages among structure, process, and
outcome. Guidance from this approach can inform and infer conditions that either has
salutary or adverse effects on patient outcomes (Donabedian, 1988).
Many researchers contend that Donabedian’s framework continues to influence
how the role of the nurse is viewed in relation to adverse patient outcomes (White &
McGillis Hall, 2003), and that it remains relevant today for quality improvement studies
linking structure and outcomes (Lee, Chang, Pearson, Kahn, & Rubenstein, 1999).
Donabedian’s work has been labeled the “precursor of modern outcomes research”
(Moorhead, Johnson, Maas, & Swanson, 2008, p. 3). While many different types of
quality measurements exist, nearly all fall into one of the three categories⎯structure,
process, or outcome⎯in the Donabedian model. This model has set the framework for
14
most contemporary quality measurement and improvement activities (The Joint
Commission, 2012).
Donabedian (1980) recognized that defining quality is particularly arduous and
challenging because the quality is not a uniform property. Rather, it is comprised of a
number of varying characteristics. Multiple formulations of definition are both possible
and legitimate, depending on where the issues are located in the system of care, and the
nature and extent of areas of responsibility. Two definitions related to his interpretations
of quality have been offered. First, Donabedian defined quality as a reflection of values
and goals current in the medical-care system and larger society. Second, he defined high-
quality care as the delivery of services that are appropriate, efficient, and effective,
resulting in the best outcomes for patients (Donabedian, 1980). Donabedian’s definition
of quality is congruent with a published definition of quality from the IOM, which noted
that quality is the degree to which health services increase the likelihood of desired health
for individuals and populations, and are consistent with current professional knowledge
(Kohn et al., 2000).
Donabedian provided further insight into this three-part approach model to
assessing quality by defining the components of the framework. Structure is defined as
the characteristics of the care setting, which includes the organizational structure
(Donabedian, 1980). Structure refers to a healthcare facility’s organization and resources,
such as hospital bed size and ownership. Process is defined as the detailed activities that
constitute care delivery, such as preventive measures, treatment of illness, and patient
education (Donabedian, 2003). Process refers to actual techniques used to treat patients

15
such as surgery and requirements outlined in The Joint Commission’s NPSGs. Outcome
is defined as the desirable or undesirable changes in individuals and populations that can
be attributed to healthcare (Donabedian, 2003). Outcome refers to the consequences of a
patient’s interaction with the healthcare system or the desired result, such as
postoperative sepsis rates, central venous catheter infection rates, and reduced rates of
patient death.
Donabedian (1988) attributes the effectiveness of this approach to a causative
linkage. He contends that to be effective, quality measures should be developed with a
flow, maintaining the three prongs of the quality model. Quality is not a straight linear
relationship, but an interchange between the effects of structure and process on outcome.
Donabedian (1980) argues that a good organizational structure influences conditions for
good or improved processes, and good processes subsequently cultivate better patient
outcomes. His approach provides a solid underpinning and context in which to consider
quality-improvement efforts. From the standpoint of patient safety, Donabedian’s model
fosters an examination of how risks and hazards are embedded within the structure of
patient care and potentially lead to adverse outcomes (Donabedian, 1980).
Definition of Terms
Conceptual and operational definitions of terms used in this study, as reflected in
Table 1, are:
Patient Safety Indicators
Operational definition: Twenty-one measures that screen for adverse events
using administrative data found in the discharge record that patients experience as a result
16
of exposure to the healthcare system, such as teaching status, ownership, and size
(Healthcare Cost and Utilization Project, 2011b).
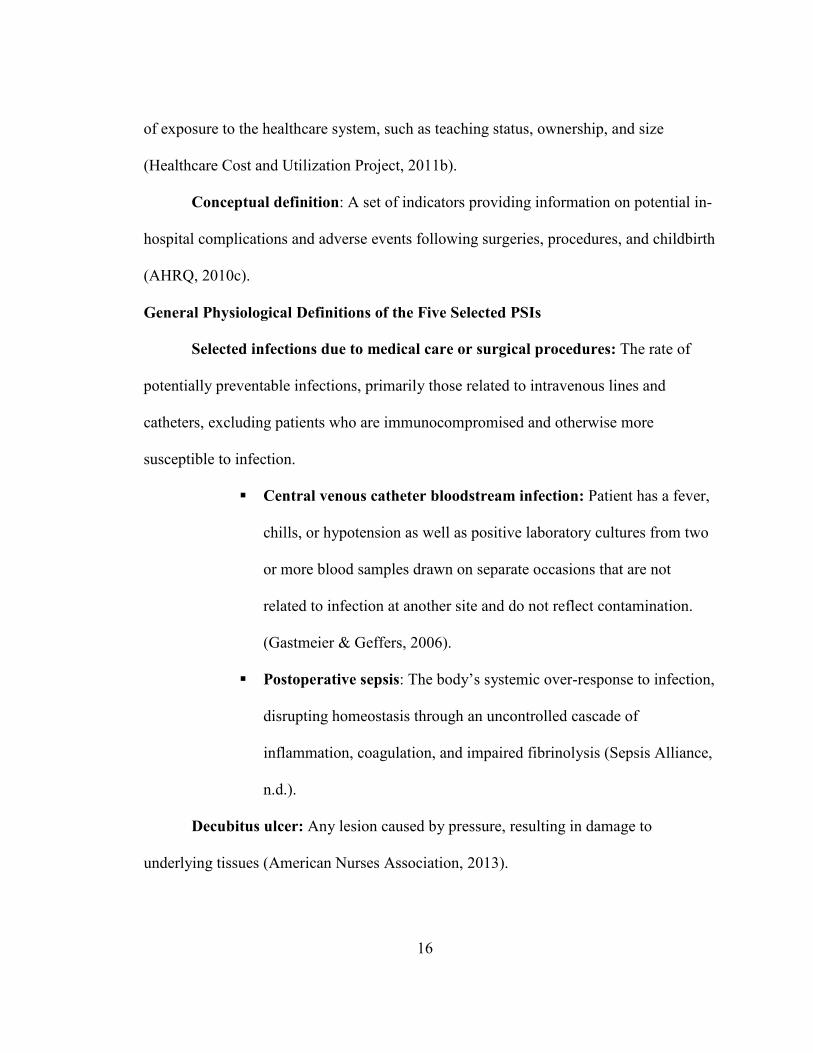
Conceptual definition: A set of indicators providing information on potential in-
hospital complications and adverse events following surgeries, procedures, and childbirth
(AHRQ, 2010c).
General Physiological Definitions of the Five Selected PSIs
Selected infections due to medical care or surgical procedures: The rate of
potentially preventable infections, primarily those related to intravenous lines and
catheters, excluding patients who are immunocompromised and otherwise more
susceptible to infection.
� Central venous catheter bloodstream infection: Patient has a fever,
chills, or hypotension as well as positive laboratory cultures from two
or more blood samples drawn on separate occasions that are not
related to infection at another site and do not reflect contamination.
(Gastmeier & Geffers, 2006).
� Postoperative sepsis: The body’s systemic over-response to infection,
disrupting homeostasis through an uncontrolled cascade of
inflammation, coagulation, and impaired fibrinolysis (Sepsis Alliance,
n.d.).
Decubitus ulcer: Any lesion caused by pressure, resulting in damage to
underlying tissues (American Nurses Association, 2013).
17
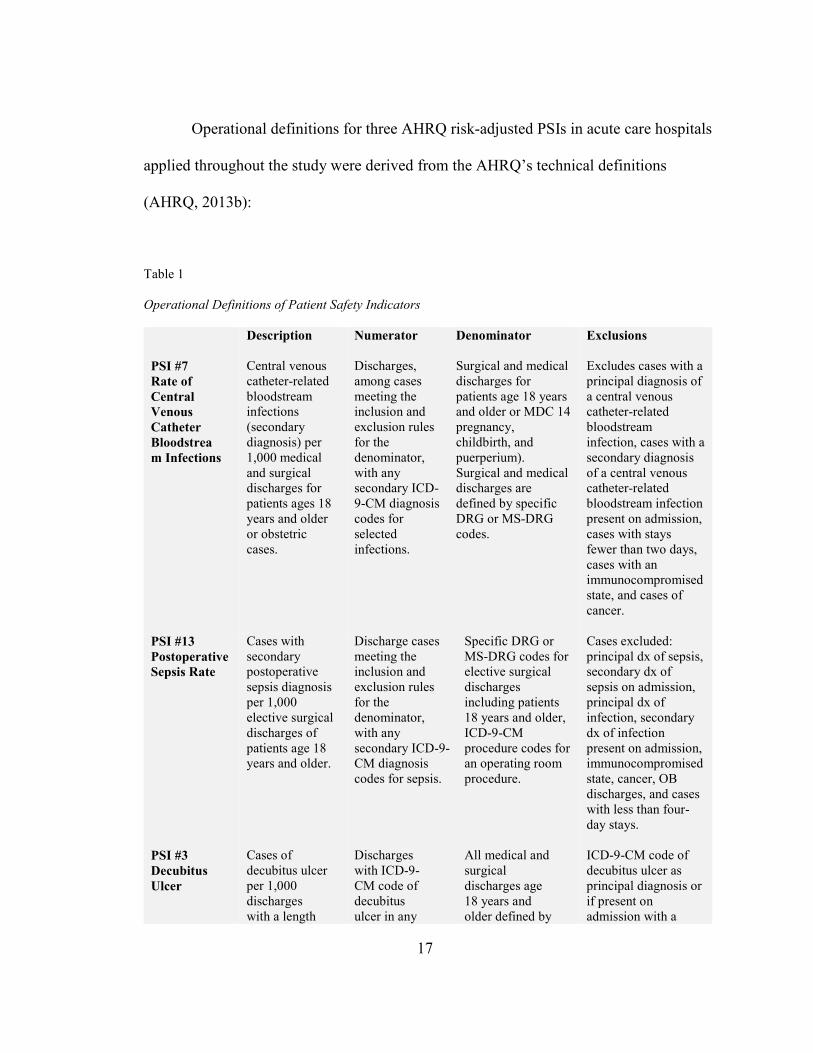
Operational definitions for three AHRQ risk-adjusted PSIs in acute care hospitals
applied throughout the study were derived from the AHRQ’s technical definitions
(AHRQ, 2013b):
Table 1
Operational Definitions of Patient Safety Indicators
Description Numerator Denominator Exclusions
PSI #7
Rate of
Central
Venous
Catheter
Bloodstrea
m Infections
Central venous catheter-related bloodstream infections (secondary diagnosis) per 1,000 medical and surgical discharges for patients ages 18 years and older or obstetric cases.
Discharges, among cases meeting the inclusion and exclusion rules for the denominator, with any secondary ICD-9-CM diagnosis codes for selected infections.
Surgical and medical discharges for patients age 18 years and older or MDC 14 pregnancy, childbirth, and puerperium). Surgical and medical discharges are defined by specific DRG or MS-DRG codes.
Excludes cases with a principal diagnosis of a central venous catheter-related bloodstream infection, cases with a secondary diagnosis of a central venous catheter-related bloodstream infection present on admission, cases with stays fewer than two days, cases with an immunocompromised state, and cases of cancer.
PSI #13
Postoperative
Sepsis Rate
PSI #3
Decubitus
Ulcer
Cases with secondary postoperative sepsis diagnosis per 1,000 elective surgical discharges of patients age 18 years and older. Cases of decubitus ulcer per 1,000 discharges with a length
Discharge cases meeting the inclusion and exclusion rules for the denominator, with any secondary ICD-9-CM diagnosis codes for sepsis. Discharges with ICD-9- CM code of decubitus ulcer in any
Specific DRG or MS-DRG codes for elective surgical discharges including patients 18 years and older, ICD-9-CM procedure codes for an operating room procedure. All medical and surgical discharges age 18 years and older defined by
Cases excluded: principal dx of sepsis, secondary dx of sepsis on admission, principal dx of infection, secondary dx of infection present on admission, immunocompromised state, cancer, OB discharges, and cases with less than four-day stays. ICD-9-CM code of decubitus ulcer as principal diagnosis or if present on admission with a
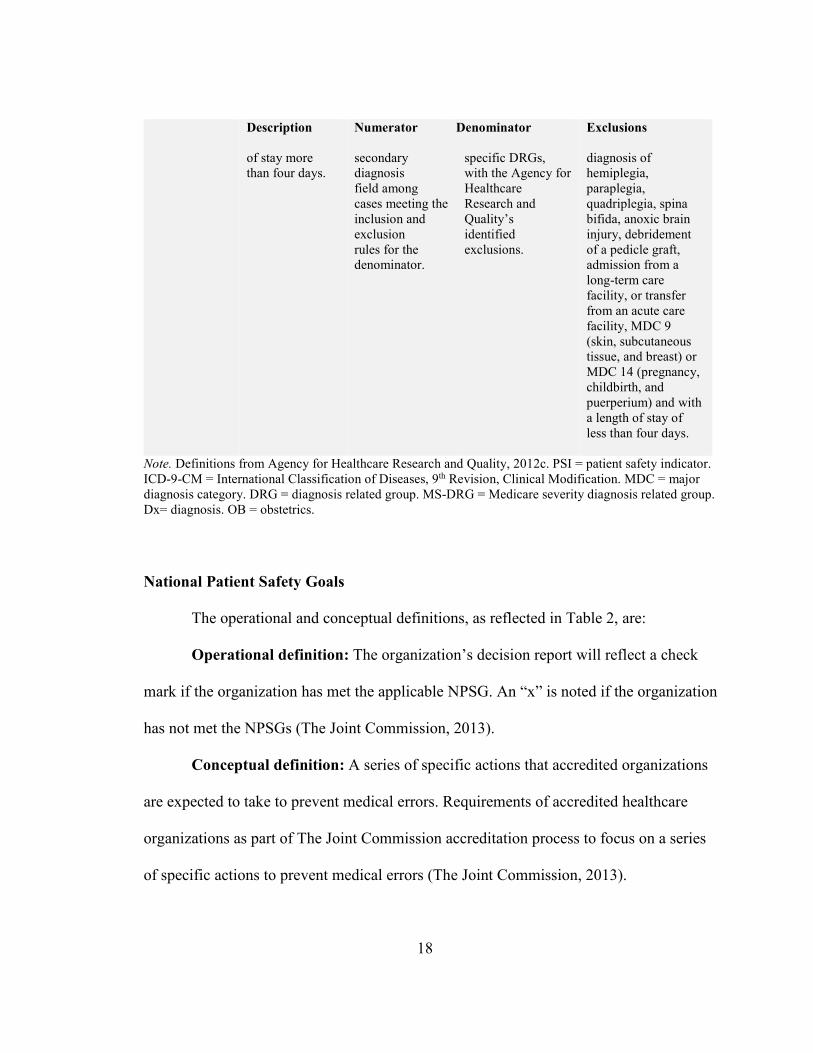
18
Description Numerator Denominator Exclusions
of stay more than four days.
secondary diagnosis field among cases meeting the inclusion and exclusion rules for the denominator.
specific DRGs, with the Agency for Healthcare Research and Quality’s identified exclusions.
diagnosis of hemiplegia, paraplegia, quadriplegia, spina bifida, anoxic brain injury, debridement of a pedicle graft, admission from a long-term care facility, or transfer from an acute care facility, MDC 9 (skin, subcutaneous tissue, and breast) or MDC 14 (pregnancy, childbirth, and puerperium) and with a length of stay of less than four days.
Note. Definitions from Agency for Healthcare Research and Quality, 2012c. PSI = patient safety indicator. ICD-9-CM = International Classification of Diseases, 9th Revision, Clinical Modification. MDC = major diagnosis category. DRG = diagnosis related group. MS-DRG = Medicare severity diagnosis related group. Dx= diagnosis. OB = obstetrics.
National Patient Safety Goals
The operational and conceptual definitions, as reflected in Table 2, are:
Operational definition: The organization’s decision report will reflect a check
mark if the organization has met the applicable NPSG. An “x” is noted if the organization
has not met the NPSGs (The Joint Commission, 2013).
Conceptual definition: A series of specific actions that accredited organizations
are expected to take to prevent medical errors. Requirements of accredited healthcare
organizations as part of The Joint Commission accreditation process to focus on a series
of specific actions to prevent medical errors (The Joint Commission, 2013).

19
Table 2
Descriptions of 2011 Hospital National Patient Safety Goals (NPSGs)
NPSG Description
Identify Patients Correctly
NPSG.0.01.01 NPSG.01.03.01
Use at least two ways to identify patients. Make sure that the correct patient gets the correct blood when blood is administered.
Prevent Infection
NPSG.07.01.01 NPSG.07.03.01 NPSG.07.04.01 NPSG.07.05.01
Use hand-cleaning guidelines from the Centers for Disease Control and Prevention or the World Health Organization. Set goals for improving hand cleaning. Use proven guidelines to prevent infections that are difficult to treat. Use proven guidelines to prevent infection of the blood from central lines. Use proven guidelines to prevent infection from surgery.
Prevent Mistakes in Surgery
UP.01.01.01 UP.01.02.01 UP.01.03.01
Make sure that the correct surgery is done on the correct patient and at the correct place on the patient’s body. Mark the correct place on the patient’s body where the surgery is to be done. Pause before the surgery to make sure that a mistake is not being made.
Note. Definitions from The Joint Commission, 2013.
Teaching Status and Location
Operational definition: Defined as rural, urban teaching or urban nonteaching if
hospital meets one of the following criteria: member of the Council of Teaching
Hospitals of the Association of American Medical Colleges, approved residency by
American Medical Association, or a ratio of full-time equivalent interns and residents to
beds of 0.25 or greater (HCUP, 2013).
Conceptual definition: A hospital’s teaching status and location as defined in the
most recent Medicare Cost Report or as defined by the American Hospital Association
(AHA).
20
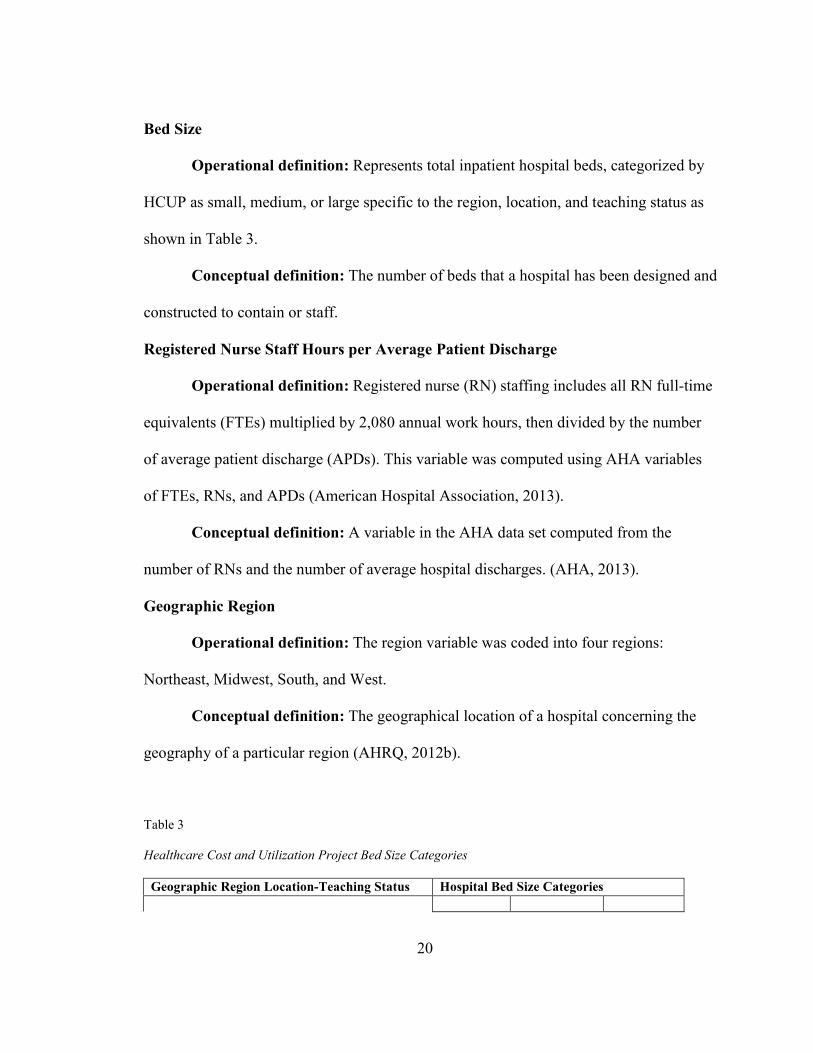
Bed Size
Operational definition: Represents total inpatient hospital beds, categorized by
HCUP as small, medium, or large specific to the region, location, and teaching status as
shown in Table 3.
Conceptual definition: The number of beds that a hospital has been designed and
constructed to contain or staff.
Registered Nurse Staff Hours per Average Patient Discharge
Operational definition: Registered nurse (RN) staffing includes all RN full-time
equivalents (FTEs) multiplied by 2,080 annual work hours, then divided by the number
of average patient discharge (APDs). This variable was computed using AHA variables
of FTEs, RNs, and APDs (American Hospital Association, 2013).
Conceptual definition: A variable in the AHA data set computed from the
number of RNs and the number of average hospital discharges. (AHA, 2013).
Geographic Region
Operational definition: The region variable was coded into four regions:
Northeast, Midwest, South, and West.
Conceptual definition: The geographical location of a hospital concerning the
geography of a particular region (AHRQ, 2012b).
Table 3
Healthcare Cost and Utilization Project Bed Size Categories
Geographic Region Location-Teaching Status Hospital Bed Size Categories
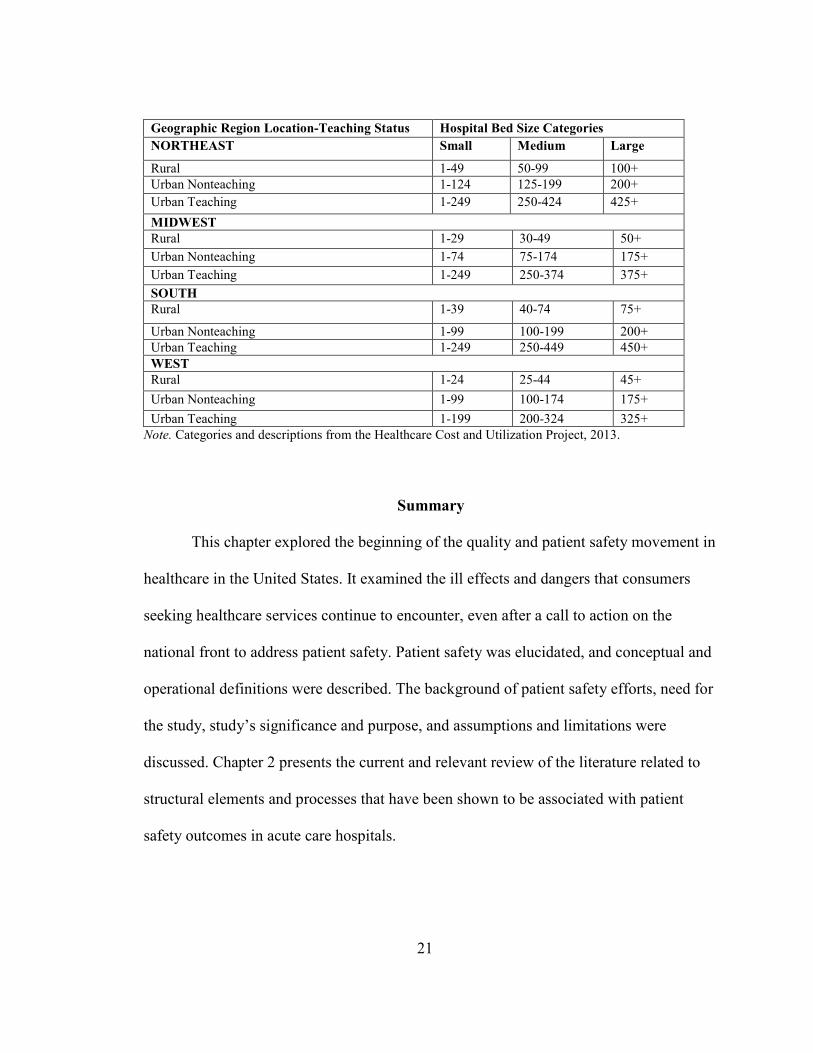
21
Geographic Region Location-Teaching Status Hospital Bed Size Categories
NORTHEAST Small Medium Large
Rural 1-49 50-99 100+
Urban Nonteaching 1-124 125-199 200+
Urban Teaching 1-249 250-424 425+
MIDWEST
Rural 1-29 30-49 50+
Urban Nonteaching 1-74 75-174 175+
Urban Teaching 1-249 250-374 375+
SOUTH
Rural 1-39 40-74 75+
Urban Nonteaching 1-99 100-199 200+
Urban Teaching 1-249 250-449 450+
WEST
Rural 1-24 25-44 45+
Urban Nonteaching 1-99 100-174 175+
Urban Teaching 1-199 200-324 325+
Note. Categories and descriptions from the Healthcare Cost and Utilization Project, 2013.
Summary
This chapter explored the beginning of the quality and patient safety movement in
healthcare in the United States. It examined the ill effects and dangers that consumers
seeking healthcare services continue to encounter, even after a call to action on the
national front to address patient safety. Patient safety was elucidated, and conceptual and
operational definitions were described. The background of patient safety efforts, need for
the study, study’s significance and purpose, and assumptions and limitations were
discussed. Chapter 2 presents the current and relevant review of the literature related to
structural elements and processes that have been shown to be associated with patient
safety outcomes in acute care hospitals.

22
CHAPTER 2: LITERATURE REVIEW
Although studies have shown associations between characteristics of hospital
systems, such as teaching status, ownership status, nurse staffing, and patient safety
outcomes (Ayanian & Weissman, 2002; Devereaux et al., 2002; Kupersmith, 2005;
Stanton, 2004), few have examined specifically how these characteristics influence the
use of patient safety practices. Further, even fewer studies have examined the impact of
patient safety practices on patient outcomes. Analysis and clear understanding of the
association between structural characteristics, patient safety practices, and patient
outcomes within hospital systems is a prerequisite to designing patient safety solutions
(Shojana et al., 2001).
Rationale for Study
The purpose of this exploratory, descriptive, correlational study was to examine
the relationship between healthcare system characteristics and implementation of national
patient safety goals (NPSGs). It also examined whether patient safety practices are
associated with patient safety outcomes in acute care hospitals in the United States. It
sought to identify which characteristics of acute care organizations are linked more
frequently to the implementation of NPSGs and whether there was an association with
the Agency for Healthcare Research and Quality (AHRQ) patient safety indicator (PSI)
outcomes and patient safety practices. Donabedian’s (1980) conceptual model was used
23
to guide the theoretical framework for examining quality and patient care safety. His
structure-process-outcome (SPO) paradigm has long served as a unifying framework for
examining health services and assessing patient outcomes (Donabedian, 1980). Little
evidence exists, however, that patient safety practices, as evaluated by using accreditation
criteria, are related to the achievement of patient safety outcomes (Thornlow & Mervin,
2009).
A comprehensive literature search was conducted using the keywords “patient
safety,” “patient safety indicators,” “adverse events,” “national patient safety goals,”
“patient safety outcomes,” and other related keywords such as “patient safety culture.”
Databases searched were Ovid OLDMEDLINE®, Ovid MEDLINE®, Cumulative to
Nursing and Allied Health Literature, ProQuest, PsychINFO, Cochrane Database of
Systemic Reviews, Health & Psychosocial Instruments, Dissertation Journals @Ovid, the
AHA, Quality Interagency Coordination Task Force, Database of Abstracts of Reviews
of Effects, and The Joint Commission. The following federal agency websites were
reviewed: the U.S. Department of Veterans Affairs, CMS, U.S. Department of Defense
(DOD), and AHRQ. Websites for grassroots lobbying organizations such as Leapfrog and
Emergency Care Research Institute also were reviewed. In addition, general and related
references in Google Scholar search engine were searched using the keywords “patient
safety,” “patient safety outcomes,” “medical error,” and “medical adverse events.”
The search was limited to human subjects studies published from 1998 to 2014.
However, classic studies related to patient safety and quality before 1998 also were
included. Reference lists of articles were reviewed, and additional pertinent articles
24
retrieved. Inclusion criteria identified for the search included primary research,
qualitative, mixed methods, and quantitative studies. Also included in the search was any
article discussing patient safety, medical errors, leadership support, evidenced-based
practice, communication, just culture, nurse-manager support, and patient safety climate.
Articles were excluded based on three criteria: (1) lack of relevance to the field of patient
safety in hospitals, (2) relevance to the field of patient safety, but lack sufficient
information and detail, and (3) outdated information.
In total, 147 articles were found using the specified keyword boundaries.
Duplications were identified and removed. Abstracts were scanned for relevance to the
study. The result showed that there had been little research performed in the area of
patient safety particularly exploring the relationship with patient safety practices and
outcomes.
This chapter will synthesize the literature, specifically Donabedian’s theoretical
framework, and review relevant literature related to organizational characteristics and
accreditation processes that influence patient outcomes in acute care hospitals. It is
divided into three sections. First, the development and use of the theoretical framework,
including constructs within the framework, will be explored. Second, the overall
literature on patient safety practices, specifically The Joint Commission’s NPSGs, will be
reviewed. Finally, third, relevant literature related to structural elements and processes
associated with patient safety outcomes in acute care hospitals, specifically the AHRQ’s
PSIs, will be reviewed.
25
Conceptual Framework
Donabedian (1980) attributes the effectiveness of his approach to measuring
quality to a causative linkage. He contends that to be effective, quality measures should
be developed with a flow, maintaining the three prongs of the quality model. Donabedian
defined the quality prongs as follows (Donabedian, 1969; Donabedian, 1988). Structure
consists of the organization of “instrumentalities” of care (Donabedian, 1969, p. 1833) or
the attributes of the setting where care occurs. Process of care is the appraisal of care and
the elements of care. Outcomes of care are the effects of care delivery on the patient.
Quality is not a straight linear relationship, but an interchange between the effects
of structure and process on outcome. Donabedian (1980) argues that a good
organizational structure influences conditions for good or improved processes, and good
processes subsequently cultivate better patient outcomes. His approach provides a solid
underpinning to consider quality-improvement efforts. Donabedian’s model fosters an
examination of how risks and hazards are embedded within the structure of patient care
and potentially lead to adverse outcomes (Donabedian, 1988). The three prongs to
Donabedian’s framework are discussed in detail.
Structure
Structures incorporate the conditions and elements under which care is provided
Donabedian’s (1988). It is the attributes of the setting where care is provided, and it is
defined as the instrumentalities of the organization. It includes organizational
characteristics such as ownership, bed size, and teaching status (Donabedian, 1969).
Structure may also include “administrative and related processes that support and direct

26
the provision of care ... concerned with such things as ... the administrative structure and
operations of programs and institutions providing care” (Donabedian, 1966, p. 695).
Structure within a hospital influences the occurrence of quality-related problems.
Structures of care within the conceptual model proposed in this study, shown in Figure 1,
include organizational characteristics and administrative structural variables related to
patient safety. They are based on Donabedian’s definition of structure.
Donabedian’s concept of structure encompasses stable characteristics of the
system of care delivery, including staffing, equipment, and facilities and how those
elements are organized to deliver care. Formalized organizational routines, such as the
process of passing patient information across caregiver work shifts, are included in an
organization’s structure. System improvements are considered a change in structure.
Structure data are, therefore, essential to system-level organizational learning.
Structural variables in this study are (1) hospital bed size, (2) region, and (3)
location and teaching status (teaching or nonteaching). Because of the potential impact or
suggested relations found in patient safety literature, these variables will be considered
confounding variables for this study. The selected variables directly affect patient safety,
according to the model. However, they indirectly affect patient outcomes about the
importance of healthcare structure. This relationship is in line with Donabedian, who
conceived structure as a driving force for later care processes and ultimately for health
outcomes (Donabedian, 1966).
Donabedian’s commentary on structure focused on physical structure, facilities,
and provider qualifications. Most modern accreditation and quality organizations, such as

27
The Joint Commission, historically have viewed the structure largely from Donabedian’s
perspective (AHRQ, 2007). However, as the study of organizational characteristics and
behavior has evolved, the understanding of organizational characteristics and
management capabilities that drive quality improvement in healthcare remains
underdeveloped. Organizational behavior⎯a multidisciplinary field including
contributions from psychology, sociology, and economics studying individual and group
dynamics within an organization⎯has demonstrated that people and organizational
arrangements are key determinants of quality (AHRQ, 2007).
Process
The method in which healthcare providers deliver care⎯a series of actions,
changes, or functions involved in the delivery of care and subjected to professional
judgment that affects an outcome⎯is considered process (Donabedian, 1966; Stone et al.,
2007). Process measures reflect common practices, apply to a variety of healthcare
settings, and have proper inclusion and exclusion criteria. It refers to the actions involved
in care delivery and the ways in which healthcare delivery is provided (Donabedian,
1966; Stone et al., 2007). Insertion of central intravenous catheters, timing of
administration of antibiotic prophylaxis in surgical patients, vaccination rates for
healthcare workers and patients and hand-washing protocols are all considered process
measures (Stone et al., 2007).
Essentially, process is viewed as being under the control of the structure of an
institution. Processes can be analyzed at various levels of an organization and readily
observable. Donabedian (1966) asserts that processes are limited by the structures in
28
which they operate. Few healthcare organizations have effectively addressed the
structures that hinder their progress toward assessing quality. However, healthcare
organizations focus a copious amount of attention on improving care services, patient
outcomes, and the safety and quality of the care provided. Process quality measures
evaluate the method by which healthcare is provided. The measures reflect the
procedures, tests, surgeries, and other actions provided for a patient during treatment
(Donabedian, 1966).
To illustrate, The Joint Commission process measures, commonly called
accreditation standards, require hospitals to conduct periodic risk assessments in
timeframes defined by the hospital for multidrug-resistant organism acquisition and
transmission, measure surgical-site infection rates for the first 30 or 90 days following
surgical procedures based on National Healthcare Safety Network procedural codes, and
perform a time-out immediately prior to an invasive procedure (The Joint Commission,
2009). NPSG compliance is required of Joint Commission accredited hospitals (Joint
Commission, 2003). These measures, if followed, significantly improve patient
outcomes.
A process measure required by CMS calls for facilities to track how often
pneumonia patients receive blood cultures before receiving doses of antibiotic. This
process affects the infection control rates of hospitals by preventing distortion of cultures
and can improve patient outcomes (Centers for Medicare & Medicaid Services, 2010).
Processes will be studied in the conceptual framework in for this by exploring
compliance with the 2011 Joint Commission’s NPSGs. The foundational quality elements
29
of Donabedian’s SPO conceptual framework fit well with this research study.
Organizational characteristics such as accreditation status, hospital size, and teaching
status represent structure implementation of NPSGs, which represent process. AHRQ’s
PSIs represent patient outcomes. Donabedian’s organizational structure attributes will be
applied in this study using a bivariate model to assess the relationship between
organizational characteristics of accreditation status and four outcome variables.
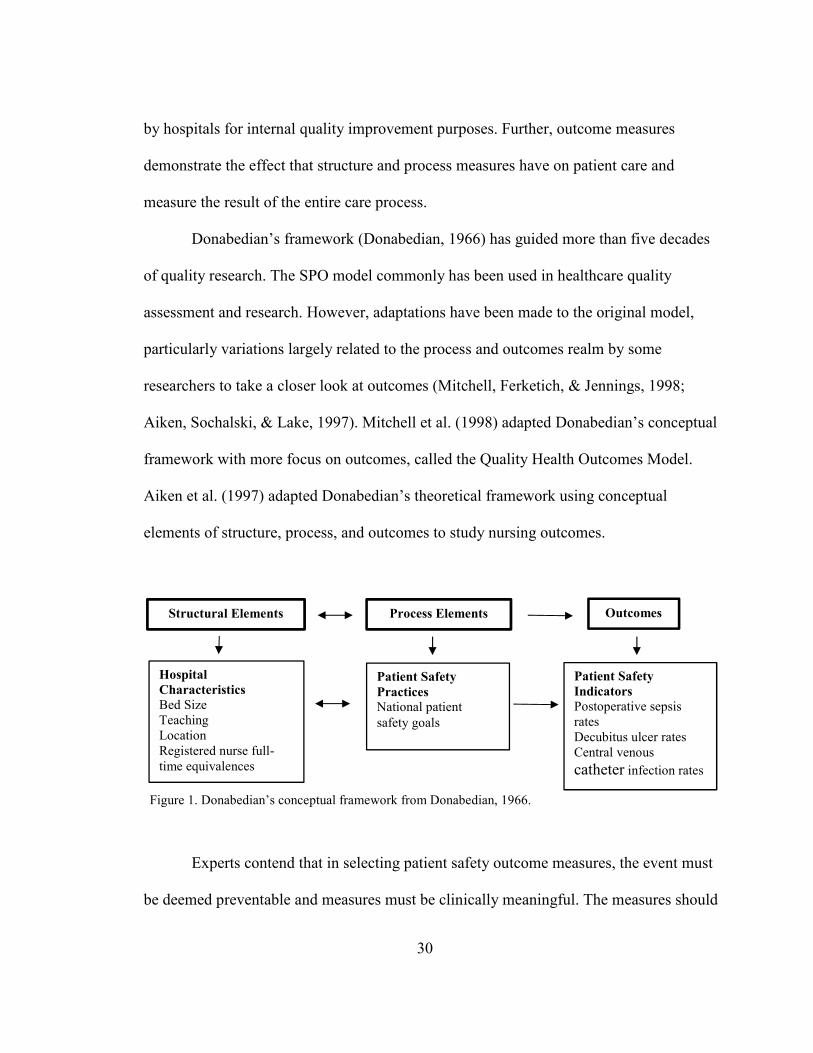
Outcomes
The third component in Donabedian’s (1988) framework is outcomes and refers
to changes in health status that can be attributed to that care. Outcomes demonstrate the
effects of care on the health status of patients and populations (Donabedian, 1988).
Outcomes of the provision of healthcare generally are used as an indicator of quality in
health services research. However, there are several limitations to simply measuring
outcomes (Donabedian, 1966). Outcomes reflect both the ability of healthcare providers
to achieve certain results under any set of given conditions and the degree to which best-
known practices have been applied. Outcomes also are affected by other extraneous
factors that must be considered in making valid conclusions. Yet, outcomes remain the
best validation for the measurement of the quality of healthcare (Donabedian, 1966).
Patient outcomes that were expected to be affected by structure and process
variables in this study are postoperative sepsis rate, decubitus ulcer rates, and central
venous catheter bloodstream infections. These outcome variables were chosen from
among other outcomes of healthcare delivery because of their direct measures of patient
safety practices congruencies with NPSGs. Outcome measures frequently are performed
30
by hospitals for internal quality improvement purposes. Further, outcome measures
demonstrate the effect that structure and process measures have on patient care and
measure the result of the entire care process.
Donabedian’s framework (Donabedian, 1966) has guided more than five decades
of quality research. The SPO model commonly has been used in healthcare quality
assessment and research. However, adaptations have been made to the original model,
particularly variations largely related to the process and outcomes realm by some
researchers to take a closer look at outcomes (Mitchell, Ferketich, & Jennings, 1998;
Aiken, Sochalski, & Lake, 1997). Mitchell et al. (1998) adapted Donabedian’s conceptual
framework with more focus on outcomes, called the Quality Health Outcomes Model.
Aiken et al. (1997) adapted Donabedian’s theoretical framework using conceptual
elements of structure, process, and outcomes to study nursing outcomes.
Figure 1. Donabedian’s conceptual framework from Donabedian, 1966.
Experts contend that in selecting patient safety outcome measures, the event must
be deemed preventable and measures must be clinically meaningful. The measures should
Hospital
Characteristics Bed Size Teaching Location Registered nurse full-
time equivalences
Patient Safety
Practices
National patient
safety goals
Outcomes
Patient Safety
Indicators
Postoperative sepsis rates Decubitus ulcer rates Central venous
catheter infection rates
Structural Elements Process Elements
31
address inadequacies in structure, process, and outcomes of care with the ability to foster
improvements (Zhan et al., 2005).
Patient Safety Movement
Examining how and why medical errors and adverse events occur historically has
been focused on individual medical professionals. The tendency to blame individuals has
perpetuated a culture of punishment and individual accountability among medical
professionals (Hoff & Sutcliffe, 2006). Patient safety must be examined at the
organizational level because of the growing belief that organizational culture shapes the
facets of hospital performance, including safety. Organizational structure plays a critical
role in the delivery of safe, quality healthcare.
More than 25 years ago, the Institute of Medicine (IOM) reports stimulated public
debate surrounding patient safety and gave birth to an array of national and regional
efforts to address the issue. A swelling of new agencies focusing on healthcare
improvements was spawned, and a redirection to safety was seen at established bodies
such as the AHRQ, The Joint Commission, IOM, CMS, The Leapfrog Group, Institute of
Safe Medicine Practices, and the IHI. These organizations began gathering and analyzing
data to develop measures to improve the quality and safety of healthcare (Leape &
Berwick, 2005).
The Joint Commission, the leading healthcare accrediting body in the United
States, responded to the report by issuing new patient safety accreditation standards,
namely NPSGs, in 2003. The Joint Commission approved and implemented the first set
of six NPSGs in 2003 (The Joint Commission, 2010b). In addition to developing NPSGs,

32
The Joint Commission demonstrated its commitment to patient safety with the revision of
all its standards in 2003. More than 50% of the revised hospital accreditation standards
focused on patient safety (The Joint Commission, 2010b). In each of the preceding years,
new safety goals have been added annually to address significant safety issues (The Joint
Commission, 2009). Continuing its focus on patient safety, The Joint Commission adds
or revises NPSGs each year.
The National Quality Forum (NQF) responded to the IOM report in 1999 by
revising its mission to develop and implement national strategies for healthcare quality
measurement and reporting (National Quality Forum, 2010). Broad representation from a
variety of partners⎯including national, state, regional, and local groups representing
consumers, public and private purchasers, employers, healthcare professionals, provider
organizations, health plans, accrediting bodies, labor unions, supporting industries, and
organizations involved in healthcare research⎯support the effectiveness of its efforts. The
NQF developed seven priority areas and goals in 1999. Improving safety of the U.S.
healthcare delivery system, and creating and implementing a national strategy for
healthcare quality reporting and measurement was a majority priority (NQF, 2010). In
2009, the NQF also created a list of never events and a requirement that hospitals that
participate in the federal Medicare and Medicaid programs report their performance
regarding this list. (NQF, 2010).
CMS also has participated in the safety movement. Initially, CMS responded by
developing 27 quality measures for hospitals, 24 clinical process of care measures, and
three clinical outcome measures (CMS, 2010). A new policy was implemented in 2008
33
that effects hospital reimbursement by denial of payment for admissions complicated by
selected adverse events. Private healthcare payers are following suit by adopting similar
policies (Wachter, Foster, & Dudley, 2008). Stakeholders such as CMS, individual
providers, and healthcare insurers believe that nonpayment provides an incentive to
prevent costly adverse events.
The AHRQ, formerly known as the Agency for Health Care Policy and Research,
was developed as the health services research arm of the HHS with a focus on research,
safety, and healthcare quality (AHRQ, 2012b). The research sciences have been heavily
influenced by the AHRQ’s contributions to healthcare quality and safety, including
identification of a set of quality indicators. The AHRQ’s 27 PSIs are a subset of quality
indicators the agency has developed. Included in this set are 20 provider-level indicators
(AHRQ, 2012b).
Even with efforts by numerous quality agencies, it is evident that there is room for
improvement. Fourteen years after the IOM report, the data remains grim. According to
the IHI (2010), 15 million adverse incidents occur in U.S. hospitals each year. One in 10
patients encounters an adverse event and dies because of the incident (Healthgrades,
2010). About 1 million patient safety incidents occurred from 2006 to 2008 among
Medicare patients with an associated cost of $8.9 billion. The financial burden and
number of patients affected by adverse events remain virtually unchanged over the past
14 years.
34
Patient Safety
A fundamental principle of healthcare is patient safety. Patient safety is
conceptualized as a set of practices affected by organizational leaders at various levels
and caregivers focusing on the reduction of medical errors and the avoidance, prevention,
and amelioration of adverse outcomes or injuries stemming from the processes of
healthcare delivery (Cooper, Gaba, Liang, Woods, & Blum, 2000). Patient safety is not a
policy, program, or procedure (Sammer, Lykens, Singh, Mains, & Lackan, 2010). Rather,
it is a value within an organization that guides individuals as they solve problems, adjust
to change, and deal with relationships (Choi, Bakken, Larson, Du, & Stone, 2004). It
refers to the extent to which individuals and groups commit to personal responsibility for
safety, act to preserve safety, actively strive to learn and adapt, and modify behavior
based on lessons learned from mistakes (Sammer et al., 2010).
An organization driven by patient safety recognizes the inevitability of error,
considers the impact of human factors on errors, and proactively seeks to identify and
minimize latent threats (Reason, 1998). Reason’s (1998) conceptual approach to
examining errors is congruent with other findings about medical errors and contends that
errors are not based solely on individual attributes, but also are influenced by systemic
factors such as structural characteristics.
Kohn et al. (2000) declared in the 1999 IOM report that most medical errors do
not result from individual recklessness or actions of a particular group. Rather errors are
caused by faulty systems, processes, and conditions that lead people to make mistakes or
fail to prevent them. Berntsen (2004) contends that individuals such as nurses who are in
35
direct contact with patients have been the focus of error reduction strategies. However,
this is a serious flaw because the individual approach has no consideration of systemic
contributions to errors. Reason (2000) contends that 95% of errors in an organization are
due to systemic problems, and 5% are due to individuals. Reason’s systems approach
recognizes that individuals are fallible and errors are to be expected (Reason, 2000).
Further, a systems approach actively seeks to identify how and why defenses failed
within the system. Focus is placed on the structural elements under which individuals
work, and errors are viewed as consequences rather than causes. However, the conditions
under which humans work can be influenced and re-engineered (Etchells, Lester,
Morgan, & Johnson, 2008). Shared accountability is critical in developing a patient safety
culture that will affect patient outcomes.
Within healthcare institutions, several complex processes lend themselves to
potential errors. However, numerous layers of protection exist to prevent errors. There
are processes that are engineered and relied upon for error prevention such as alarms, the
establishment of policies and procedures, AHRQ quality indicators such as PSIs, and
regulatory requirements through The Joint Commission for error prevention.
There are also structural influences that affect errors, such as hospital bed size,
teaching status, and geographic location. Ideally, all of these layers would be intact. In
reality, there are weaknesses or gaps like slices of Swiss cheese (Reason, 1998).
According to Reason’s error theory (Reason, 1998), an organization’s defenses against
medical errors are modeled as a series of barriers with individual weaknesses in
individual parts of a system that continually vary in size and position. The system as a
36
whole produces failures when individual weaknesses align, permitting a trajectory of
accident opportunity so that a hazard passes through all of the holes and misses all
defenses, leading to a medical error. The philosophical perspective of the systems
approach calls for not readily blaming or penalizing an individual for an error, rather
evaluating the system for failures.
As heightened attention is devoted to quality and patient safety, there is greater
demand for data on quality and safety performance of individual providers and
organizations healthcare (Kohn et al., 2000; Pronovost et al., 2003). Healthcare
organizations have multiple aims for focusing on patient safety: 1) reducing the risk of
injury or harm to patients from the structures or processes of care and 2) constructing
operational systems designed to minimize the likelihood of errors by maximizing the
likelihood of intercepting errors when or before they occur (IOM, 2001).
The provision of healthcare in the United States is vast, high risk, and complex. It
consists of various clinical settings, procedures, conditions, and treatment interventions.
Effectively measuring adverse events poses enormous challenges for healthcare
organizations. Outcome measures at the systemic level, and other safety measures and
initiatives currently in use vary considerably in the extent to which they have been
validated, in the scope and consistency of their use in facilities and regions, and in the
purposes that they were designed to serve (Zhan et al., 2005).
Medical errors have been shown to significantly affect the outcomes of
hospitalized patients. Further, it has been suggested that adverse events can be
categorized in areas of patient safety focus consistent with those safety initiatives of the
37
NPSGs implemented by The Joint Commission and PSIs supported by the AHRQ
(Department of Health and Human Services, 2008). In one study, investigators examined
medical records of 780 randomly selected patients, chosen to represent 1 million
Medicare patients discharged from acute care hospitals. The study showed that 128
serious adverse events occurred that caused harm to patients and contributed to the deaths
of 12 patients (HHS, 2008). Of the deaths, seven were medication related, two were from
bloodstream infections, two were from aspiration, and one was linked to ventilator-
associated pneumonia. All 12 deaths were related to areas of focus of The Joint
Commission’s NPSGs. Five deaths were related to events on the AHRQ’s PSIs, and two
events were on the NQF list. It was estimated that adverse events contributed to the
deaths of 1.5 % or 15,000 per month of the 1 million Medicare patients hospitalized in
October 2008 and 44% of adverse medical events were preventable (HHS, 2008; IHI,
2010).
In March 2011, Classen et al. (2011) examined the medical records of 795
patients treated in one of three tertiary hospitals recognized for their efforts to improve
patient safety. Investigators found 167 adverse events. Nine adverse events, or 1.1%,
attributed to the death of the patient. Nosocomial infection accounted for one event,
postoperative pulmonary embolism/deep vein thrombosis accounted for two, and the
others were unspecified. None of the deaths was explicitly associated with medication
errors, which were the primary causes of death in Medicare patients studied by the Office
of Inspector General (James, 2013). Errors involve a combination of sources⎯human and
systemic (Etchells et al., 2005).
38
Organizations generally have formal reporting processes for internal event
reporting (Kohn, Corrigan, & Donaldson, 1999). Written adverse event reporting was
developed in the late 1940s and early 1950s (Flanagan, 1954) to identify and capture
medical errors. The adverse-event reporting system used by healthcare organizations was
fashioned after Flanagan’s (1954) critical incident techniques. Flanagan’s process
involved collecting and analyzing significant facts related to a critical incident.
Development of the event reporting system was twofold. It provided a means to identify,
capture, verify that an event occurred, and offer a method for evaluating and developing
strategies to decrease the risks of reoccurrence of similar events (Sharpe, 2003.)
According to Flanagan (1954) and an IOM report (2004b), medical errors are
captured by an organization through two reporting means: written processes and
surveillance. Surveillance methods are used to determine whether an adverse event
occurred. Large, federal, healthcare systems have adopted a written process as their
preferred method of capturing data (IOM, 2004b). However, no unified reporting method
has been adopted by all healthcare systems.
Because of the federal government’s response to the 1999 IOM report, the AHRQ
was allocated $50 million to spearhead patient safety efforts. The AHRQ and University
of California of San Francisco-Stanford Evidenced-Based Practice Center developed PSIs
that consisted of 20 hospital-based indicators for medical conditions and surgical
procedures. Inpatient discharge data in conjunction with the HCUP is used to cultivate
research examining patient safety outcomes, and support the identification of preventable
problems and adverse events that are influenced by system-level changes (AHRQ,
39
2012a). Hospitals, health systems, and other organizations that monitor patient safety
performance have increased their use of these indicators (Healthgrades, 2004; Miller et
al., 2001; Romano et al., 2003; Rosen et al., 2005).
Research and regulatory agencies alongside the AHRQ are using administrative
data to formulate research studies in patient safety. Administrative data sets provide
perspectives on patient safety conditions and procedures, which show that adverse event
rates vary substantially among institutions and may be linked to characteristics consistent
with preventable errors (AHRQ, 2013b). However, additional research in the area of
patient safety is warranted to evaluate the reliability and validity of the measures
(Merwin & Thomlow, 2006). Analysis of data from the Hospital Quality Alliance
national reporting system reveal that performance varies among indicators and hospitals
(Jha, Li, Orav, & Epstein, 2005).
Stelfox, Palmisiani, Scurlock, Orav, and Bates (2006) evaluated the effects of the
IOM (1999) reports on patient safety publications and research awards, and found a
significant increase in the number of publications and awards since the reports’ release.
Stelfox et al. (2006) contend efforts must be made to shift from a retrospective aspect of
accountability to a prospective view. Retrospective accountability is linked closely to
practices of praising and blaming. Prospective accountability is a forward-looking,
systems approach to the evaluation of medical errors. It emphasizes responsibility in
taking preventive steps, represents goal-setting and moral deliberation, and offers shared
accountability. Prospective accountability in patient safety suggests a high degree of
transparency and analysis to determine the causes of errors (Sharpe, 2003).
40
While studies have addressed patient safety, overall research in the area largely
has been descriptive, assessing the climate of patient care units and individual patient
outcomes. Few studies incorporate assessments of organizations’ structures and processes
in investigating patient outcomes. A significant gap exists in healthcare literature linking
patient safety outcomes and objective measurements of selected hospital and unit level
characteristics. Progress appears to have been slow in developing an understanding the
relationship between patient safety and outcomes. The reasons might be attributed, in
part, to a lack of identification of optimal indicators of quality patient care and issues in
measuring outcomes and culture (Clarke, 2014). Furthermore, various agencies’ patient
safety efforts are independent of the other. Therefore, there are no consistent
measurements. Hence, there is a clear need for more research to examine the relationship
between organizational characteristics and patient outcomes, and development of unified
measurements across quality agencies.
Adverse Events
The findings of the 2000 IOM report (Kohn et al., 2000) revealed that 1 million
people are injured by errors during treatment at healthcare facilities each year. The report
showed that 3% to 4% of hospitalizations had an adverse event with 9% to 14% of those
mistakes resulting in death. The study reported that of 30,195 patients, 1,133 adverse
events occurred. Of the adverse events identified, 70% of the errors were preventable, 6%
potentially were preventable, and 24% were not preventable. Nearly half of the adverse
events identified were attributable to negligence (Brennan, Hebert et al., 1991; Brennan,
Leape et al., 1991).

41
Researchers in the Harvard Medical Practice Study found that 18% of patients
hospitalized are injured during their courses of stay. Adverse events account for 2.9% to
3.7% of deaths among hospitalized patients as shown in Table 4 (Kohn et al., 2000).Two
additional studies (Brennan, Leape et al., 1991; Thomas et al., 2000a) examining medical
errors found similar statistics. In a review of more than 15,000 medical records, 2.9% of
patients experienced adverse events with 54% of them being preventable and 6% of the
events resulting in death (Thomas et al., 2000b). It was revealed in another study by
Brennan, Hebert et al. (1991) that 13% of adverse events contributed to the death of the
patients while hospitalized (Brennan, Hebert et al., 1991). Further, the likelihood of
experiencing an adverse event increases by 6% for each day of a hospital stay (Wachter,
2004).
Table 4
Adverse Events and Hospitalization
Event Outcome Per Year
Number of Americans who die from medical errors 44,000 to 98,000
Percentage of adverse events for hospitalized patients 2.9% to 3.7%
Number of adverse drug reactions during hospital stays 1.9 million
Rate of adverse drug events among Medicare
beneficiaries in ambulatory settings
50 per 1,000 persons
Cost attributable to medical errors $19.5 billion
Total cost per error $13,000
Annual cost attributable to surgical errors $1.5 billion
Note. Data from Kohn et al., 2000 and Shreve et al., 2010.
According to the IHI (2006), 15 million adverse incidents occur in U.S. hospitals
each year. One in 10 patients who encounter adverse events dies because of the incidents
(Healthgrades, 2010). In 2008, the cost of measurable hospital adverse events in the

42
United States was $17.1 billion, constituting 0.72% of the $2.39 trillion spent on
healthcare delivered (Van Den Bos et al., 2011).
In 2010, there were 35.1 million discharges from hospitals. Lengths of stay
averaged 4.8 days, and 2.2% of patients died while hospitalized. Hospital death rates
declined overall from 2000 to 2010 but saw a 17% rise in the nosocomial infection rate
(Hall, Levant, & DeFrances, 2013). Patients who died in hospitals had longer hospital
stays than all patients.
Combining the findings and generalizing across 34 million hospitalizations, James
(2013) concluded that preventable errors contribute to the deaths of 210,000 hospital
patients annually. Weissman et al. (2008) estimate a two-fold increase in medical errors
to account for undocumented evidence of adverse events, underreporting, and near misses
during hospitalization. Weissman et al. contend that an accurate number of premature
deaths associated with preventable adverse events is more than 400,000 per year
(Weissman et al., 2008).
Data shows that consequences of adverse events most often include longer lengths
of stay, increased costs, and poorer outcomes. In a study conduct by Healthgrades (2014),
a convenience sample of 1.4 million patient records from 131 hospitals across 13 states
was used. The study examined the relationship between direct hospital costs and patient
outcomes for 32 mortality- and complication-based conditions and procedures. Findings
showed a direct correlation between adverse patient outcomes and higher direct costs
because of increased lengths of stays (Healthgrades, 2014). The findings were consistent
with a previous study of 1,047 patients admitted to a large, urban teaching hospital where
43
17.7% of patients suffered at least one serious adverse event that led to longer hospitals
stays and increased costs (Andrews et al., 1997).
HHS’ Office of the Inspector General found that one in seven Medicare patients
are injured during hospital stays and adverse events during the courses of care contribute
to the deaths of 180,000 patients every year (Landrigan et al., 2010). The authors of the
report estimated that adverse events contributed to the deaths of 1.5 % of the 1 million
Medicare patients hospitalized, equating to 15,000 deaths per month or 180,000 per year
(Wachter, 2004).
In 2009, preventable medical errors ranked as the sixth-leading cause of death in
the United States⎯an increase from its eighth-ranking in the 1999 IOM report (1999).
That makes medical errors the third-leading cause of death in America, behind heart
disease and cancer.
Finally, the financial impact of adverse events in 2010 totaled $19.5 billion
(Shreve et al., 2010), and the number of patients affected by adverse events virtually
remain unchanged over the past 14 years (HHS, 2010). Therefore, there is an urgent need
for continued research in this area.
Organizational Characteristics and Patient Outcomes
Numerous researchers consider adverse event data to be closely related to
organizational characteristics, making it a sensitive indicator of the quality of care
(Mitchell & Shortell, 1997; Vartak, Ward, & Vaughn, 2008; White & McGillis Hall,
2003). A retrospective review of a statewide database (Brennan, Hebert et al., 1991)
examined the relationship of hospital organizational structure with adverse events. The
44
findings revealed higher complication rates associated with university teaching hospitals.
However, ownership, location, size, and percentage of minority discharges were not
significant. Further, adverse event rates were lower and occurred more often in rural and
larger hospitals. However, the effects of organizational characteristics on patient
outcomes vary.
Wan (1992) examined 10 hospital characteristics in relation to outcomes in 85
acute care hospitals in Virginia. Limited relationships with adverse patient outcomes
were found. This finding is consistent with Donabedian’s conceptual model of quality
patient care used for this study (Donabedian, 1980). Donabedian contends that
preventable, adverse events often result from process failures that may be related to
structural characteristics such as teaching status (Duggirala, Chen, & Gergen, 2004;
Romano et al., 2003; Kohn et al., 2000), bed size (Iezzoni et al., 1994), nurse staffing
levels (Needleman, Buerhaus, Mattke, Stewart, & Zelevinsky, 2002; Person et al., 2004),
or other organizational characteristics of hospitals. When investigating the relationship
between hospital characteristics and PSI rates, it is important to account for structural
characteristics that can affect processes and outcomes of care.
Hospitals provide structural component that influences the environment, physical
setting, and resources for care delivery. Furthermore, the leadership of the organization
determines how care will be carried out and is influenced by the overall hospital
structure. Researchers have searched for links between hospital organizational structure
and outcomes due to the differences in each hospital structure (Hartz et al., 1989).
However, few studies illustrate work performed in this area. Various studies have found
45
that adverse event outcomes have been found to be indicative of variations in structural
variables within the healthcare systems (Mitchell & Shortell, 1997; White & McGillis
Hall, 2003).
Bed Size
Examining hospital size is an essential factor that provides meaningful data for
the nation’s smallest hospitals where resources, service volumes, and patient
characteristics vary significantly from those of larger hospitals. Some studies have
attributed variation in adherence to evidence-based guidelines and practice patterns the
hospital size and location specifically, small and rural hospital settings (Goldman &
Dudley, 2008).
Understanding how hospital bed size may influence implementation of patient
safety practice and adherence to guides becomes critical to the examination outcomes.
Most studies that have investigated the relationship between organizational
characteristics and patient outcomes have use hospital size as a single unit. As a result,
studies using hospital size as a single predictor of patient outcomes have reported varying
findings, and have failed to establish a consistent association between hospital size and
outcomes such as mortality (Al-Haider & Wan, 1991), preventable conditions, and
adverse events (Silber, Williams, Krakauer, & Schwartz, 1992).
A meta-analysis of 16 studies conducted from 1980 to 2010 became the first
systematic review of the literature evaluating hospital size and its impact on patient
mortality outcomes. Results of this analysis indicate that large hospitals have lower odds
of patient mortality compared to small hospitals (Fareed, 2012). Specifically, the
46
probability of patient mortality in a large hospital compared to a small hospital is
approximately 11% less.
Studies with unadjusted mortality rates have even lower overall odds ratio of
mortality compared to studies with adjusted mortality rates (Fareed, 2012). Fareed built
his study upon a 2008 systemic review of structure-outcome studies of hospitals, and it
indicated that structure-outcome variables provided a mixed set of findings that ranged
from non-significant to positively significant to negatively significant relationships. In a
national study of preventable adverse events, investigators found that large hospitals had
the highest incidence of adverse patient safety events, although they had lower incident
rates for such events as anesthesia complications, postoperative hip fracture, and
abdominopelvic wound dehiscence (Romano et al., 2003).
Another study (Frankenfield, Sugarman, Presley, Helgerson, & Rocco, 2000)
found increased effectiveness of hemodialysis, as measured by a greater potassium and
urea reduction ratio, in hospitals with larger bed size. Mitchell and Shortell (1997) found
the literature to be inconclusive when examining 81 research studies that associated
organizational structure or process with mortality. They asserted that adverse events
might be a more sensitive marker of healthcare quality than other measures. A similar
association between outcomes and nursing was found by Pierce (1997) in a review of
literature from 1974 to 1996 using Donabedian’s framework. Similarly, in a national
study using the 2000 HCUP-NIS data, 10 complex procedures in U.S. hospitals were
studied Elixhauser, Steiner, and Fraser (2003) found unadjusted mortality rates to be

47
significantly higher at low-volume hospitals for five selected procedures. Hospitals with
low-volume also tended to have lower numbers of RNs, pointing to staffing as a factor.
Teaching and Location
There is evidence that suggests that quality of care generally is higher in teaching
hospitals than in nonteaching hospitals. The evidence also shows that acute care hospital
system characteristics, such as teaching status, influence preventable adverse event rates
(Ayanian & Weissman, 2002; Kupersmith, 2005). A study conducted by Rivard et al.
(2008) was among the first to compare teaching and nonteaching hospitals using a
regression model that incorporated hospital structural characteristics similar to this study.
Using the AHRQ’s PSIs and adult, male patient discharges from the Veterans
Health Administration (VA) and non-federal hospitals, they examined the likelihood of
incurring an event considered as a PSI. Their findings revealed higher PSI rates in major
teaching hospitals than in nonteaching hospitals and that PSI events might more likely
occur in teaching hospitals compared with nonteaching hospitals (Rivard et al., 2008).
Further, results revealed that patients receiving care in non-federal teaching hospitals had
higher incidence and higher stratified rates for developing decubitus ulcers and
postoperative wound dehiscence (Rivard et al., 2008). In a study conducted by Thornlow
and Stukenborg (2006), teaching hospitals had significantly higher rates of infection than
rural and urban nonteaching hospitals. Urban nonteaching hospitals had significantly
higher rates of infection than rural hospitals. Urban nonteaching hospitals reported
statistically significant greater rates of infection than privately owned rural hospitals.
Loux, Payne, and Knott (2005) conducted a study of 312 rural hospitals using the NIS
48
database exploring PSIs. The researchers asserted that small, rural hospitals had
significantly lower rates of potential patient safety events than those of large, rural
hospitals for three of the 19 patient safety indictors⎯iatrogenic pneumothorax, infection
due to medical care, and postoperative hemorrhage or hematoma.
Two studies using administrative data found higher infection rates as a result of
medical care in teaching hospitals compared to nonteaching facilities (Romano et al.,
2003; Thornlow & Stukenborg, 2006).
Romano et al. (2003) also reported an association between teaching hospitals and
patient safety outcomes in a national study. In that study, investigators found that PSIs
were highest in urban teaching hospitals. Vartak et al. (2008) used the 2003 NIS database
to assess the impact of teaching status on patient adverse events in a study that included
400 nonteaching, 207 minor teaching, and 39 major teaching hospitals. Findings suggest
significantly higher incidence of postoperative deep vein thrombosis and pulmonary
embolism as well as postoperative sepsis in teaching hospitals, while a lower probability
of developing postoperative respiratory failure was found, demonstrating inconsistencies
in the relationship between teaching status and various patient safety outcomes.
In 1991, Brennan, Hebert et al. (1991) examined the relationship of hospital
organizational structure with adverse events using a retrospective review of a statewide
database. Findings revealed higher complication rates associated with teaching hospitals.
However, ownership, location, size were not significant. Thomas and Brennan (2000)
contend that patients in major teaching hospitals were less likely to suffer preventable
adverse drug events.
49
Results were varied in studies examining adverse event rates among teaching and
nonteaching hospitals. Many investigators reported that nonteaching hospitals
experienced lower incidences of adverse events (Brennan, Hebert et al., 1991; Duggirala
et al., 2004; Sloan, Conover, & Provenzale, 2000). Patients in major teaching hospitals
were more likely to experience adverse events than were those in nonteaching hospitals
(Brennan, Hebert et al., 1991). Consistent with Brennan’s study (Brennan, Hebert et al.,
1991), Duggirala et al. (2004) found that rates of postoperative adverse events were
higher in teaching hospitals than nonteaching hospitals. Higher reported postoperative
complications were noted in surgical patients receiving care in teaching hospitals
compared to nonteaching facilities (Sloan et al., 2000).
A relationship between teaching status and patient safety outcomes has been
established through research. The direction of the association is challenging to establish
due to empirical evidence related the influence of structural characteristics on patient
outcomes being inconclusive. Conversely, the evidence is less clear on whether hospital
teaching status affects patient safety. Several studies of potentially preventable adverse
events reveal inconsistent findings in comparisons among teaching and nonteaching
hospitals (Romano et al., 2003; Thornlow & Stukenborg, 2006; Thornlow & Merwin,
2009). Additional research on the relationship of structural characteristics to adverse
events is warranted.
In a large study of 996 hospitals inpatients, Maynard, Every, Chapko, and Ritchie
(2000) found that postangioplasty mortality rates were more abundant in rural hospitals
among patients with acute myocardial infarction compared to other hospital types. In
50
addition, in-hospital mortality was lower in high-volume angioplasty in both rural and
urban settings-
The finding revealed that patients in urban settings were more likely to receive
beta-blockers and aspirin upon arrival and at discharge (Maynard et al., 2000).
Furthermore, it was significantly more likely that patients in urban hospitals have an
assessment of the left ventricular function and smoking cessation education provided.
Overall, there were significant differences between care in acute care hospitals, and rural
critical-access hospitals.
Conversely, rural critical-access hospitals’ measured performance in four of the
five pneumonia-related indicators was parallel or better than urban hospitals. Rural,
critical-access hospitals were more likely to collect blood culture specimens before
administering the first dose of antibiotics, assess oxygen levels, and administer antibiotics
within the first four hours of arrival to the hospital (Park et al., 1990).
The quality of care provided in rural hospitals generally has been accepted as
being congruent to care provided in urban hospitals. In 2006, the AHRQ examined the
relationship between the effects of low service volumes and patient outcomes. The study
found strong evidence of a volume-outcome effect, with low volumes being associated
with poorer outcomes.
Nurse Staffing
Nurse staffing was related to lower infection rates in a number of studies
examining the relationship between staffing and outcomes. Specifically, higher nurse
staffing was related to lower nosocomial infection rates in multiple studies (American

51
Nurses Association, 2013; Kane, Shamliyan, Mueller, Duval, & Wilt, 2007; Lichting et
al., 1999; Needleman et al., 2002). Lean nurse staffing was associated with increased
urinary tract infections and postoperative infections in an evidence-based review of
literature conducted by Seago (2001). Central venous bloodstream infections also were
associated with higher nurse-to-patient ratio according to a 1996 study (Fridkin, Pear,
Williamson, Gallgiani, & Jarvis, 1996). Higher staffing also has been associated with
lower pressure ulcer development (Blegen, Goode, & Reed, 1998; Lichting, Knauf, &
Milholland, 1999).
Lower staffing levels were associated with higher rates of general infections and
urinary tract infections in a one-hospital study consisting of 497 patients (Flood & Diers,
1988). The IHI 100,000 Lives Campaign related to the central-line infections prevented
more than 120,000 deaths nationally during its first year of implementation in 2006 (IHI,
2006). The study focused on the implementation of evidence-based guidelines, or bundles
of care, in acute care hospitals. The IHI noted decreases in bloodstream infection rates
following the implementation of guidelines or protocols. Another study conducted in
intensive care units in which central-line guidelines were implemented nearly eliminated
catheter-related bloodstream infections (Behrenholtz, Pronovost, & Lipsett, 2004).
The American Nurses Association (2013) conducted a study with an all-payer
sample of more than 9 million patients in 1,000 hospitals and a Medicare sample of more
than 3.8 million patients in more than 1,500 hospitals, measuring outcomes deemed to be
preventable adverse events. A significant relationship between nurse staffing and five
outcomes⎯urinary tract infections, postoperative infections, pneumonia, pressure ulcers,
52
and length of stay⎯was found. Lang, Hodge, Olson, and Kravitz (2004) reviewed 43
studies meeting their inclusion criteria from 1980 to 2003. Their review showed that a
rich skill mix of RNs resulted in lower mortality rates, failure to rescue, and shorter
length of stays.
Another study found that the skill mix of RNs was associated with lower
mortality in a one-hospital study spanning one fiscal year (Blegen et al., 1998). Kane et
al. (2007) conducted an observational in the United States and Canada from 1990 to 2006
using meta-analysis to test the relationship between nurse staffing and patient outcomes.
The researchers found that higher nurse staffing was associated with reduced hospital-
related mortality, failure to rescue, cardiac arrest, hospital-associated pneumonia, and
other adverse events. Tourangeau, Giovannetri, Tu, and Wood (2002) reported similar
findings regarding the skill mix of RNs on mortality.
In a Midwestern hospital with a mix of 2,709 general, orthopedic, and vascular
surgery patients, Halm, Lee, and Chassen (2002) found no relationship between RN skill
mix and mortality. Needleman et al. (2002a, 2002b) examined administrative data,
including 799 hospitals from 11 states with more than 6 million patient discharges. The
researchers did not find an association between higher levels of staffing by RNs and
mortality.
Decubitus ulcer. The prevalence of skin breakdown during hospitalization was
studied. Lichting et al. (1999) measured nursing-sensitive, patient outcome indicators
using an administrative data set for 1992 and 1994 for a study conducted in California
and New York. Their findings revealed a relationship between nursing skill mix and

53
lower pressure ulcer rates. Other findings related to total hours of nursing care and the
relationship to pressure ulcers, postoperative infections, and urinary tract infections were
found in a study conducted by Blegen et al. (1998). This study using 1993 administrative
data from a large university hospital with a large sample of more than 21,000 patients,
found the higher the RN skill mix, the lower the incidence of adverse occurrences was on
inpatient units, specifically decubitus ulcer development.
An association between nurse staffing mix and the development of decubitus
ulcers was found (ANA, 2013; Blegen et al., 1998; Lichting et al., 1999). The ANA study
(2013) used data from nine states, including more than 9 million patients in more than
1,000 hospitals, and a Medicare sample of 3.8 million patients in more than 1,500
hospitals. A statistically significant result was found between pressure ulcers and staffing
levels. Although Blegen et al. (1998) used only one hospital, a large sample of more than
21,000 patients was included with total hours of care being associated with the rate of
decubitus ulcer formation. In a literature review, White and McGillis Hall (2003)
identified evidence of a relationship between nursing levels and mortality in a study using
Donabedian’s quality framework. They further concluded that nosocomial infections,
falls, and pressure ulcers were significantly associated with nursing practice.
Infections. In a one-hospital study, two units and 497 patients were examined in
relation to nosocomial infections (Flood & Diers, 1988). Lower staffing levels were
associated with higher rates of general infections and urinary tract infections. Central
venous bloodstream infections were associated with higher nurse-to-patient ratio (Fridkin
et al., 1996).
54
In several studies, richer staffing mix of RNs and higher nurse staffing were
related to lower nosocomial rates (ANA, 2013; Kane et al., 2007; Kovner & Gergen,
1998; Lichting et al., 1999; McGillis Hall, Irvine Doran, Baker et al., 2001; McGillis
Hall, Irvine Doran, & Pink, 2004; Needleman et al., 2002a, 2002b). Seago (2001)
conducted an evidence-based review of the literature. Seago’s study showed strong
evidence that increased urinary tract infections and postoperative infections were
associated with lean nurse staffing. A study conducted by Vogel, Dombrovsly, Carson,
Graham, and Lowry (2010) found that patients in large hospitals were more likely to
develop sepsis after elective surgical procedures than patients in small hospitals. Urban,
nonteaching hospitals were more likely to be complicated by postoperative sepsis
compared to rural and teaching hospitals for elective surgical procedures. Small hospitals
had higher rates for central venous catheter-related bloodstream infection and
postoperative sepsis.
In contrast, Taunton, Kleinbeck, Stafford, Woods, and Bott (1994) conducted a
study in four Midwestern acute care hospitals, collecting data from 1989 to 1990. The
study included 65 units, using data from hospital documents and reports. The researchers
did not find a relationship between nursing workload and urinary tract infections.
However, the researchers found an association between RN absenteeism and nosocomial
infections.
A literature review shows inconsistent findings about hospital structural
characteristics and outcomes, providing no solid direction of correlation. Further research

55
is necessary to explicate a relationship between acute care hospital system characteristics,
patient safety practices, and outcomes.
Outcome Measures
Outcome measurement in the healthcare industry has been at the forefront for
decades, beginning with Nightingale’s work during the Crimean War (Salive, Mayfield,
& Weissman, 1990). Most of the earliest research focused on medical and nursing care
(Pringle & Doran, 2003). Since then, defining and measuring outcomes of healthcare
delivery increasingly has become a priority for healthcare researchers.
Measurement of patient outcomes not only consists of services provided within
the acute care hospital, but also takes into account patients’ clinical attributes, including
severity of illness (Apolone, 2000). The effect of safety practices on patient outcomes has
not been well studied beyond organizations such as The Joint Commission, which
enforces implementation of patient safety practices. Likewise, a large-scale evaluation of
influences on patient safety changes has not yet occurred nationally.
According to many researchers, outcome measures examine not only patient
outcomes, but also include organizational outcomes (Stone et al., 2007; Van Doren,
Bowman, Landstrom, & Graves, 2004). Outcome measures should be chosen based on
frequency, severity, and preventability of the outcome events. Experts contend that the
measures also should address inadequacies in structure, process, and outcomes that
promote patient safety outcomes (Zhan et al., 2005). Examples of these measures are
intravascular catheter-related bloodstream infection rates and surgical-site infections in
selected operations. Although intravascular catheter-related bloodstream infections occur

56
at relatively low frequency, the severity is high. Furthermore, evidence-based prevention
strategies exist, and they have proven to be effective.
Many safety measures and initiatives currently in use pertain to different aspects
of complex healthcare systems. However, the measures vary considerably in the extent to
which they have been validated, in the scope and consistency of their use across facilities
and regions, and in the purposes that they were designed to serve (Zhan et al., 2005).
Effectively measuring adverse events poses enormous challenges. However, patient
outcomes at the individual level are elements that are present in all healthcare settings
and can be understood as the occurrence of adverse events that harm patients. To
establish good processes that improve healthcare outcomes, monitoring both process and
outcome measures and assessing their correlation is considered a model approach (IOM,
2000, 2004b; Pronovost et al., 2003).
In 2003, 38,220,659 patients were discharged from U.S. hospitals. Of these
patients, 2.2% died while hospitalized. Most of those who died received care in private,
not-for-profit facilities (58%) and nonteaching hospitals (56%) with an average length of
stay of 4.6 days (Merrill & Elixhauser, 2005). In 2005, the National Center for Health
Statistics (2005) published the U.S. national death rates for selected causes and found that
1% of all hospitalized patients in 2003 died of complications from medical care. Using
the 2000 HCUP-NIS and PSIs, Romano et al. (2003) found that 1.12 million potential
safety-related events occurred in 1.07 million hospitalizations at nonfederal, acute care
facilities. The national sample represented more than 36 million hospitalizations, and the
57
report found that 34% of the safety-related events occurred in surgical hospitalizations,
31% in obstetric hospitalizations, and 35% in medical hospitalizations.
PSIs are outcome measures that support best practices or evidence-based
guidelines to prevent central-line associated bloodstream infections. Organizations have
used selected standards of the hospital manual in The Joint Commission accreditation
process in an attempt to create evidenced-based practices (Kizer & Blum, 2005; Leape,
Berwick, & Bates, 2002; Shojania, Duncan, McDonald, & Watcher, 2002).
Yet, no studies have examined outcomes and the relationship of hospital system
structure with the use of patient safety practices identified as NPSGs. Existing studies
reveal an association between structural characteristics, such as teaching status and
ownership status to patient outcomes (Ayanian & Weissman, 2002; Devereaux et al.,
2002; Halm et al., 2002; Stanton, 2004; Kupersmith, 2005). Comprehensive literature
reviews related to patient outcomes and adverse events were found identifying variations
in structural variables within healthcare systems (Mitchell & Shortell, 1997; White &
McGillis Hall, 2003).
Thornlow and Merwin (2009) assert that the relationship between use of patient
safety practices, specifically NPSGs, has not been well studied. Therefore, it is difficult
for hospitals to identify clearly actions and modifications necessary to improve patient
outcomes. However, several researchers have attempted to examine relationships
between The Joint Commission accreditation process and outcomes.
In 2009, two studies were published that examined the association between
accreditation standards and patient outcomes (Masica et al., 2009; Thornlow & Merwin,
58
2009). Thornlow and Merwin (2009) investigated the relationship between patient safety
practices using hospital accreditation standards and patient safety outcomes using the
AHRQ’s PSIs as measured by hospital infections, postoperative respiratory failure,
decubitus ulcers, and failure to rescue. The researchers found that selected hospital
accreditation standards significantly were related to higher decubitus rates and hospital
infection rates. However, no association was found between postoperative respiratory
failure and failure to rescue. It was also revealed that hospital system characteristics did
not consistently explain patient outcomes, reverberating findings in other studies (Baker
et al., 2002; Romano et al., 2003; Thornlow & Stukenborg, 2006).
In 2003, Chen, Rathore, Radford, and Krumholz (2003) studied the association
between hospitals’ quality of care, as measured by performance on three quality
indicators, survival among Medicare patients hospitalized for acute myocardial infarction
and compliance with Joint Commission hospital accreditation standards. Lower quality
and higher 30-day mortality rates were found in hospitals not accredited by The Joint
Commission.
In a 2005, study conducted by Miller et al. (2005) that examined the relationship
between Joint Commission accreditation scores and PSIs from HCUP administrative data
(n = 24 states and n = 2,116 hospitals) and Joint Commission accreditation data from
1997 to 1999. The study findings revealed that when there was little variation in The
Joint Commission scores, wide variation existed in the PSI rates, resulting in the
conclusion that there was no relationship between Joint Commission accreditation
processes and the studied PSIs.

59
Further, Romano et al. (2003) investigated the relationship between hospital
characteristics and PSIs. However, the study did not include patient safety practices such
as The Joint Commission’s NPSGs. The findings are consistent with conclusions of other
research showing that Joint Commission accreditation levels had limited usefulness in
differentiating individual performance among accredited hospitals.
A national study of preventable adverse events suggested mixed results, showing
large hospitals with a higher prevalence of most patient safety events but lower incident
rates for others (Romano et al., 2003). Al-Haider and Wan (1991) examined hospital
mortality and noted that hospital size and specialization were not statistically significant
with hospital mortality when controlling for the effects of other organizational factors.
Patient Safety Practices
Patient safety practices have been proposed to assist with generating meaningful
data, process, and outcome measures. Process measures support patient safety initiatives
by establishing common practices to diverse healthcare settings. They encompass
appropriate inclusion and exclusion criteria. Identifying ways to improve outcomes and
patient safety remain significant issues of healthcare leaders and researchers. Patient
safety practices are considered process measures and have been incorporated into care
delivery since the 1960s. The evidence-based practice center defined patient safety
practice as a type of process in which application reduces the probability of an adverse
event. Consistent with Donabedian’s conceptual framework in patient safety, this
definition declares that systemic changes are more effective and productive in reducing
adverse events and medical error than targeting and punishing individual providers

60
(Shojana et al., 2001). The goal of systemic change is to prevent future problems and
eliminate or reduce systems vulnerabilities.
As a result of regulatory requirements for reporting serious adverse events,
organizations have a procedure to capture serious events known as sentinel events. A
sentinel event is considered to be an unexpected occurrence involving death; severe
physical or psychological injury or the risk thereof, including unanticipated death or
major loss of functioning unrelated to the patient’s condition; patient suicide; wrong-side
surgery; infant abduction or discharge to the wrong family; rape; or hemolytic transfusion
reactions (The Joint Commission, 2012). The Joint Commission (2002) initially proposed
a sentinel event policy to learn about the frequencies and underlying causes of sentinel
events, promote sharing of lessons learned with other healthcare organizations, and
reduce the risk of future sentinel event occurrences.
In contrast to other error reporting systems found in other industries such as the
aviation industry, the sentinel event policy excludes the reporting of near misses.
According to The Joint Commission (2012), this exclusion causes organizations to miss
opportunities to gain valuable teaching information from missed errors. Although
healthcare organizations accredited by The Joint Commission are not required to report a
sentinel event, mandated review of organizational responses to sentinel events is an
active part of the standard accreditation process (The Joint Commission, 2012). The
sentinel event policy requires accredited organizations to conduct an intensive, root cause
analysis of all serious adverse events, and implement policies and procedures designed to
reduce the likelihood of recurrence (Mello, Kelly, & Brennan, 2005). The Joint
61
Commission has required the reporting of sentinel events since 1996. Data does not yet
exist to examine the impact of this reporting initiative on patient outcomes, nor is there
data to research the degree and effectiveness to which hospitals carry out the root cause
analysis process.
Future advancements in healthcare and patient safety are dependent upon the
ability to learn from mistakes. To do that, an environment of trust and shared
accountability must be created in which healthcare professionals feel safe to report errors
and a concerted effort made to standardize the nomenclature used to define error. The
focus of patient-safety-oriented organizations should be upon promoting an environment
conducive to learning from errors and minimizing the effects of the error similar to what
happens in the aviation industry (Nieva & Sorra, 2003).
Despite widespread dissemination, there is significant variation in the application
of patient safety practices across hospitals (Bradley et al., 2006; Fonarow et al., 2005;
Peterson & Walker, 2006). Reasons for variance in application of evidenced-based
processes are complex. It has been suggested that differences are associated with
systems’ issues (Fonarow et al., 2005).
Elimination of variation in processes has helped improve performance and
reliability over the past decades in the commercial aviation industry according to Chassin
and Leob (2011). They contend that a comparable level of success has been attained in
the fields of anesthetics and obstetrics.
Similarly, standardization of any process of care by using protocols and checklists
can help achieve similar reductions in harmful events. These types of standardizations
62
should be recognized as guides to managing clinical situations or processes of care that
apply to most patients. Thornlow and Merwin (2009), assert that the relationship between
utilization of patient safety practices, specifically, NPSGs, has not been well studied, thus
making it difficult for hospitals to identify clearly actions and modifications necessary to
improve patient outcomes.
While studies have shown associations between hospital characteristics such as
bed size, teaching status, and patient outcomes (Ayanian & Weissman, 2002; Devereaux
et al., 2002; Kupersmith, 2005; Thornlow & Merwin, 2009), there is little evidence that
examines how these structural characteristics effect utilization of patient safety practices
in accredited hospitals. Moreover, none have examined the influence of patient safety
practices such as NPSG compliance on patient safety outcomes. Past studies were limited
to measuring Joint Commission accreditation scoring and the relationship with the
AHRQ’s PSIs (Miller et al., 2005; Masica et al., 2009; Thornlow & Merwin, 2009).
Two studies examined the association between The Joint Commission
accreditation scores and quality measures and mortality (Chen et al., 2003) and inpatient
quality and PSIs (Miller et al., 2005). No significant relationship between The Joint
Commission accreditation decisions and performance were found in a 2003 study. Chen
et al. (2003) examined the association between Joint Commission hospital accreditation,
the hospitals’ quality of care (using three quality indicators) and survival among
Medicare patients hospitalized for acute myocardial infarction. Hospitals not surveyed by
The Joint Commission revealed lower quality and higher 30-day mortality rates than
those surveyed. Of those hospitals surveyed, patients admitted to hospitals accredited
63
with commendation had the highest use of beta-blockers on admission and during
hospitalization, while patients admitted to hospitals with conditional accreditation had the
lowest use. Hospitals accredited with commendation, 30-day mortality were higher on
average in comparison to those conditionally accredited. Considerable hospital-level
variation existed in the use of aspirin therapy, use of beta-blocker therapy, and 30-day
mortality rates for the hospitals in the sample groups. The authors concluded that Joint
Commission accreditation levels had limited usefulness in distinguishing performance
among accredited hospitals as a result of wide heterogeneity in performance existed
within each facility.
The Joint Commission Data
The Joint Commission is the leading healthcare accrediting body in the nation.
Hospitals are accredited based on their compliance with a set of national standards,
including the NPSG program. The first set of NPSGs was effective January 1, 2003. The
NPSGs were developed by a panel of widely recognized patient safety experts identified
as the Patient Safety Advisory Group. This group is comprised of nurses, physicians,
pharmacists, and other health professionals who have hands-on experience in addressing
patient safety issues in a variety of healthcare settings to help accredited organizations
address specific areas of concern regarding patient safety.
The Patient Safety Advisory Group works with Joint Commission staff in
identifying emerging patient safety issues, and advises on updates and changes using
performance measures and other data. With input from practitioners, provider
organizations, purchasers, consumer groups and other stakeholders, recommendations are
64
made to The Joint Commission to determine the highest priority patient safety issues and
how best to address them. The Joint Commission also determines whether a goal applies
to a specific accreditation program and, if so, tailors the goal to be program-specific.
NPSGs differ from standards and their corresponding elements of performance by
requiring the surveyor to observe compliance of each goal applicable to hospitals. All
accredited acute care hospitals are required to implement each recommendation surveyed
for compliance during each survey. Each year, new goals or revisions are announced in
July, and implementation is mandatory beginning January 1 of the following year. For
example, the 2010 goals were announced in July 2010; implementation was not required
until January 2011. Therefore, compliance data with 2010 NPSGs was examined in
hospitals accredited in 2011 to ensure that organizations were given time to effectively
address the goals. NIS patient safety indicator data also was compared for 2011.
In 2010, there were 15 NPSGs applicable to hospitals. Compliance with each of
the 15 goals is measured through the triennial visit by Joint Commission surveyors. The
Joint Commission survey process is data-driven, patient-centered, and focused on
evaluating actual care processes. The Joint Commission on-site surveys are designed to
be organization specific, consistent, and support the organization’s efforts to improve
performance.
Survey length is determined by information supplied on the application. Each
accreditation report includes the healthcare organization’s accreditation date and
decision, areas with recommendations for improvement, compliance with NPSGs, and a
display of how the individual healthcare organization compares to other organizations
65
nationally in each performance area (The Joint Commission, 2013). All hospital triennial
and random performance reports for surveyed hospitals are housed on The Joint
Commission’s website. Information on a hospital’s performance survey result can be
retrieved for at least five previous encounters from the website. For this study, data for
the 2011 accreditation performance reports were retrieved from the website.
When an organization’s accreditation decision becomes official, it is publicly
disclosed. The decision is posted to Quality Check® within one business day of being
posted to the extranet. Using Quality Check®, results for all hospitals meeting inclusion
criteria and evaluated for accreditation in 2011 were considered for this study. Results of
hospitals surveyed in 2011 as part of The Joint Commission’s unannounced process were
included in the data collection. Quality Check® is the online guide to Joint Commission
accredited and certified healthcare organizations in the United States (The Joint
Commission Quality Check, 2013). The accreditation decisions are categorized as
accredited, provisional accreditation, conditional accreditation, preliminary denial of
accreditation, or denial of accreditation. For this study, the investigator considered
accredited hospitals.
Compliance with NPSGs is noted on the Quality Check® report with symbols
representing whether the hospital has met the goals, not met the goals, or the goals are not
applicable. Only hospitals that meet the inclusion criteria set by HCUP-NIS and The Joint
Commission were used in this study.
66
The Joint Commission Accreditation Process
The Joint Commission, founded in 1951, evaluates and accredits more than
20,500 U.S. healthcare organizations and programs. An independent, not-for-profit
organization, The Joint Commission is the nation’s oldest and largest standards-setting
and accrediting body in the healthcare industry.
The Joint Commission Accreditation for Hospitals was established by the
American College of Surgeons (ACS). The ACS developed the first national system to
measure hospital performance related to patient safety. The first set of standards for
patient safety was developed by ACS in 1917, and inspections of hospital compliance to
these standards began in 1918. In 1952, The Joint Commission introduced published
accreditation standards for hospitals and began accreditation surveys.
In 1966, Congress passed the Social Security Amendment Act of 1965 that
deemed Joint Commission accredited hospitals as meeting the requirements for
participation in the federal Medicare and Medicaid programs. While hospitals’
participation in the accreditation process is voluntary, the federal government requires
hospitals to meet The Joint Commission standards to receive reimbursement from
Medicare and Medicaid. This requirement essentially mandates that hospitals
participating in the accreditation process meet The Joint Commission standards.
An organization undergoes an on-site survey by a Joint Commission survey team
at least every three years to earn and maintain The Joint Commission’s Gold Seal of
Approval™. The Joint Commission is governed by a 32-member Board of
Commissioners that includes physicians, administrators, nurses, employers, a labor
67
representative, quality experts, a consumer advocate, and educators (The Joint
Commission Quality Check, 2013).
To prevent a monopoly, Section 125 of the Medicare Improvements for Patients
and Providers Act of 2008 removed The Joint Commission’s statutorily guaranteed
accreditation authority for hospitals. The Joint Commission’s hospital accreditation
program is now subject to the Centers for Medicare and Medicaid Services CMS
requirements for organizations seeking accrediting authority. This action allows for
governmental quality oversight of The Joint Commission’s accreditation processes.
The scope of The Joint Commission accreditation services was expanded in 1987
to other healthcare organizations. The organization’s name was changed to the Joint
Commission on Accreditation of Healthcare Organizations (JCAHO). The organization
has undergone numerous name changes over the years, and it has continued its quest to
address safety issues for healthcare organizations.
In 2007, JCAHO underwent a major rebranding and simplified its name to The
Joint Commission. The Joint Commission’s accreditation process supports organizations
in the identification of functions and processes directed at continuously improving patient
safety and increasing outcomes. There is a focus on organizational systems that are
essential to providing safe, high quality of care, treatment, and services. The standards
provide an objective evaluation method in which healthcare organizations measure,
assess, and improve performance with the applicable standards in the hospital manual.
The Joint Commission annually accredits 4,067 acute care, children’s, long-term
acute, psychiatric, rehabilitation, and specialty hospitals. It also accredits 362 critical
68
access hospitals through a separate accreditation program. The Joint Commission
accredits 90% of U.S. hospitals. More than 3,000 Joint Commission accredited hospitals
provide data on 57 inpatient measures (The Joint Commission Quality Check, 2013).
Accreditation and Patient Outcomes
Devers et al. (2004) conducted a study of administrators in 12 community
hospitals that the indicated that hospitals’ major patient safety initiatives were primarily
intended to meet The Joint Commission’s standards and requirements. The findings led
researchers to conclude that The Joint Commission accreditation process is a principal
driver of hospitals’ patient safety initiatives. In 2004, Hibbard and Pawlson contended
that improvement to the quality of care was achieved through compliance with Joint
Commission accreditation standards and that accreditation played a major role in
improving the quality of care delivered in hospitals. He argued that compliance with
accreditation standards was incentivized by the deemed relationship with CMS in which
hospital licensure is affected by the accreditation outcome.
In 2003, two studies examined the association between Joint Commission
accreditation scores, quality measures, and mortality (Chen et al., 2003) and inpatient
quality and PSIs (Miller et al., 2005). No significant association between The Joint
Commission accreditation decisions and performance were found in either study.
Another study conducted by Devers et al. (2004) found that hospitals reported
partial or full compliance with The Joint Commission’s 2003 patient safety standards.
One possible explanation provided for compliance was again related to the relationship
between accreditation and the deemed status relationship with CMS, which influenced
69
hospitals’ ability to received reimbursements for caring for Medicare patients. Medicare
patients generated approximately 40% of revenue for hospitals participating in this study.
Jacott and Jacott (2003) contended that The Joint Commission’s efforts to make
patient safety a centerpiece of accreditation activity and the survey process play a
significant role in driving improvement. However, the researchers concluded that
substandard patterns of care unlikely were identifiable. Further, no evidence existed that
these efforts have resulted in reducing medical errors.
Significant progress has been made in patient safety practices and process
measurements since The Joint Commission took the lead in requiring healthcare
organizations to report errors that harm patients, adopt systemic measures to improve
patient safety, and reduce the potential for adverse events. Creating ways to improve
outcomes, patient safety, and care delivery are priorities of healthcare leaders and
researchers through the nation.
According to Lagasse (2002), improvements in patient care safety are not
attributable to a singular action but, rather to a combination of regulatory requirements
such as those imposed by The Joint Commission, and the use of multiple or bundled
changes as proposed by the IOM. In 1996, The Joint Commission instituted a sentinel
event reporting policy for accredited organizations. The policy requires accredited
organizations to report adverse events that meet established criteria.
In July 2001, The Joint Commission propagated safety standards for organizations
surveyed under its hospital standards manual. Initially, the safety standards were in
response to the 1999 IOM report and affected hospital pharmacy practices by requiring
70
compliance processes to identify, track, and reduce the likelihood of errors. Later, the
first set of the six NPSGs were approved and implemented (The Joint Commission,
2002). The NPSGs included clear, evidence-based recommendations to help healthcare
organizations reduce specific types of errors.
Monitoring process and outcome measures, and assessing their correlation is a
model approach to validating good processes that lead to good, safety, healthcare
outcomes (The Joint Commission, 2009). In 2003, more than 17,000 Joint Commission
accredited healthcare systems providing care relevant to the NPSGs began participation
in the evaluation process for compliance with the requirements or implementation of
acceptable alternatives. In each of the following years, new safety goals have been added
to address significant safety issues (The Joint Commission, 2009).
Dennis S. O’Leary, M.D., president of The Joint Commission, contended that
organizations possess the knowledge and tools to prevent errors, but must focus their
concentration on measures that require healthcare organizations to implement preventive
steps (The Joint Commission, 2002). The standards encouraged open dialogue among
hospital staff about errors and urged a focus on patient safety issues during orientation.
According to Henri R. Manasse Jr., Ph.D., chairperson of the Sentinel Event Advisory
Group, the NPSGs selected by the advisory group are all high-impact, low-cost targets.
These measures should significantly improve patient safety outcomes. (The Joint
Commission, 2002).
Before the mandated implementation of NPSGs by The Joint Commission in
2003, there was limited evidence to support the notion that patient safety practices deliver
71
any benefit in acute care hospitals, especially on patient outcomes. Understating the
effect of safety practices such as The Joint Commission’s NPSGs on patient care is
pivotal to improving patient safety. In 2003, two studies examined the association
between The Joint Commission accreditation scores and quality measures and mortality
(Chen et al., 2003), and inpatient quality and PSIs (Miller et al., 2005). No significant
association between The Joint Commission accreditation decisions and performance were
found in either study. A significant limitation of both studies was that data were captured
before the incorporation of specific quality standards and the NPSGs into The Joint
Commission accreditation process.
Romano et al. (2003) examined the relationship of hospital systems and PSIs, and
found no relationship. However, the study was not inclusive of patient safety practices,
specifically NPSGs. While some studies demonstrate a relationship between hospital
system characteristics⎯such as teaching status and nurse staffing⎯with patient outcomes
(Ayanian & Weissman, 2002; Devereaux et al. 2002; Halm et al., 2002; Stanton, 2004;
Kupersmith, 2005), there are no studies that examine the relationship between hospital
structure and the use of NPSGs.
Research shows that patient care, quality, and safety are influenced by
organizational processes and structure (King & Byers, 2007). The step of connecting
indicators of quality patient care with patient safety practices provides objective
information in understanding how an organization’s structure and process affect patient
outcomes. This step is the next logical move toward improving patient safety. Examining
the relationship between implementation of patient safety practices, organizational

72
characteristics, and outcomes will provide objective information to guide hospital leaders
towards designing patient safety solutions. The examination also helps identify factors
that may influence patient safety practices.
National Patient Safety Goals
In 2003, The Joint Commission, the leading healthcare accrediting body in the
nation, responded to the IOM 2002 report by the issuance of new patient safety
accreditation standards, namely NPSGs. NPSGs were introduced to direct healthcare
improvement efforts to high priority problem areas (Hyman, 2014). The goals included
improving the accuracy of patient identification, improving the effectiveness of
communication among caregivers, improving the safety of high-alert medications, the
safety of using infusion pumps, and the effectiveness of alarms used in the clinical
setting. Organizations also were to develop processes to eliminate wrong-site, wrong-
patient, and wrong-procedure surgery.
NPSGs have become a critical method by which The Joint Commission promotes
and enforces major changes in patient safety. The criteria used for determining the value
of these goals and required revisions are based on the merit of the goals’ impact, cost, and
effectiveness. Improvement in the safety of patients is the core of these goals. Recent
changes have focused on preventing hospital-acquired infections and medication errors in
addition to promoting surgical safety, correct patient identification, communication
among staff, and identifying patients at risk for suicide.
The Joint Commission approved and implemented the first set of six NPSGs in
2003 (The Joint Commission, 2010b). Further demonstrating its commitment to safety,
73
the Joint Commission revised all of its standards in 2003. With this revision, more than
50% of hospital accreditation standards focused on patient safety (The Joint Commission,
2010b).
In 2009, 16 NPSGs were listed in the Joint Commission’s hospital accreditation
manual. While no new goals were added, the 2009 NPSGs contain the most significant
revisions since the release of the 2003 original six requirements. Major changes for 2009
included three new hospital requirements related to preventing deadly healthcare-
associated infections due to multiple drug resistant organisms, central venous catheter-
associated bloodstream infections, and surgical-site infections. These changes enhanced
the existing NPSGs for the reduction of healthcare-associated infections. The 2011
NPSGs for hospitals used in this study remain the same as the 2009 goals.
Beginning January 1, 2003, The Joint Commission on began to evaluate more
than 17,000 healthcare organizations for compliance with the implementation of the
NPSGs. Criteria used for determining the value of these goals and potential revisions are
centered on the merit of their impact, cost, and effectiveness.
Mark R. Chassin, M.D., president of The Joint Commission, contends that by
acting consistently to meet the goals, healthcare organizations can substantially improve
patient safety and immediately benefit patients (The Joint Commission 2009). Dennis S.
O’Leary, M.D., past president of The Joint Commission, stressed that the knowledge
exists to prevent error, but the challenge before the industry was to develop processes and
measures that prompt healthcare organizations to implement patient safety practices such
as the NPSGs (The Joint Commission, 2002). Another leader in healthcare quality, Henri
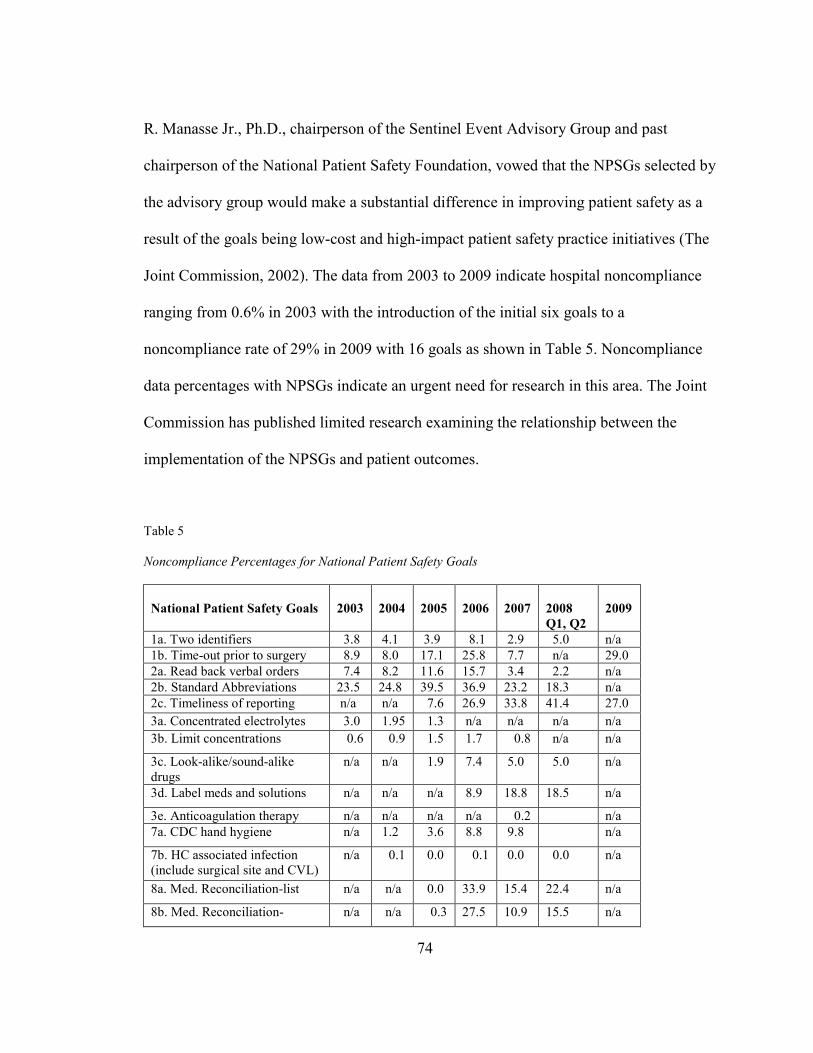
74
R. Manasse Jr., Ph.D., chairperson of the Sentinel Event Advisory Group and past
chairperson of the National Patient Safety Foundation, vowed that the NPSGs selected by
the advisory group would make a substantial difference in improving patient safety as a
result of the goals being low-cost and high-impact patient safety practice initiatives (The
Joint Commission, 2002). The data from 2003 to 2009 indicate hospital noncompliance
ranging from 0.6% in 2003 with the introduction of the initial six goals to a
noncompliance rate of 29% in 2009 with 16 goals as shown in Table 5. Noncompliance
data percentages with NPSGs indicate an urgent need for research in this area. The Joint
Commission has published limited research examining the relationship between the
implementation of the NPSGs and patient outcomes.
Table 5
Noncompliance Percentages for National Patient Safety Goals
National Patient Safety Goals
2003
2004
2005
2006
2007
2008
Q1, Q2
2009
1a. Two identifiers 3.8 4.1 3.9 8.1 2.9 5.0 n/a
1b. Time-out prior to surgery 8.9 8.0 17.1 25.8 7.7 n/a 29.0
2a. Read back verbal orders 7.4 8.2 11.6 15.7 3.4 2.2 n/a
2b. Standard Abbreviations 23.5 24.8 39.5 36.9 23.2 18.3 n/a
2c. Timeliness of reporting n/a n/a 7.6 26.9 33.8 41.4 27.0
3a. Concentrated electrolytes 3.0 1.95 1.3 n/a n/a n/a n/a
3b. Limit concentrations 0.6 0.9 1.5 1.7 0.8 n/a n/a
3c. Look-alike/sound-alike drugs
n/a n/a 1.9 7.4 5.0 5.0 n/a
3d. Label meds and solutions n/a n/a n/a 8.9 18.8 18.5 n/a
3e. Anticoagulation therapy n/a n/a n/a n/a 0.2 n/a
7a. CDC hand hygiene n/a 1.2 3.6 8.8 9.8 n/a
7b. HC associated infection (include surgical site and CVL)
n/a 0.1 0.0 0.1 0.0 0.0 n/a
8a. Med. Reconciliation-list n/a n/a 0.0 33.9 15.4 22.4 n/a
8b. Med. Reconciliation- n/a n/a 0.3 27.5 10.9 15.5 n/a
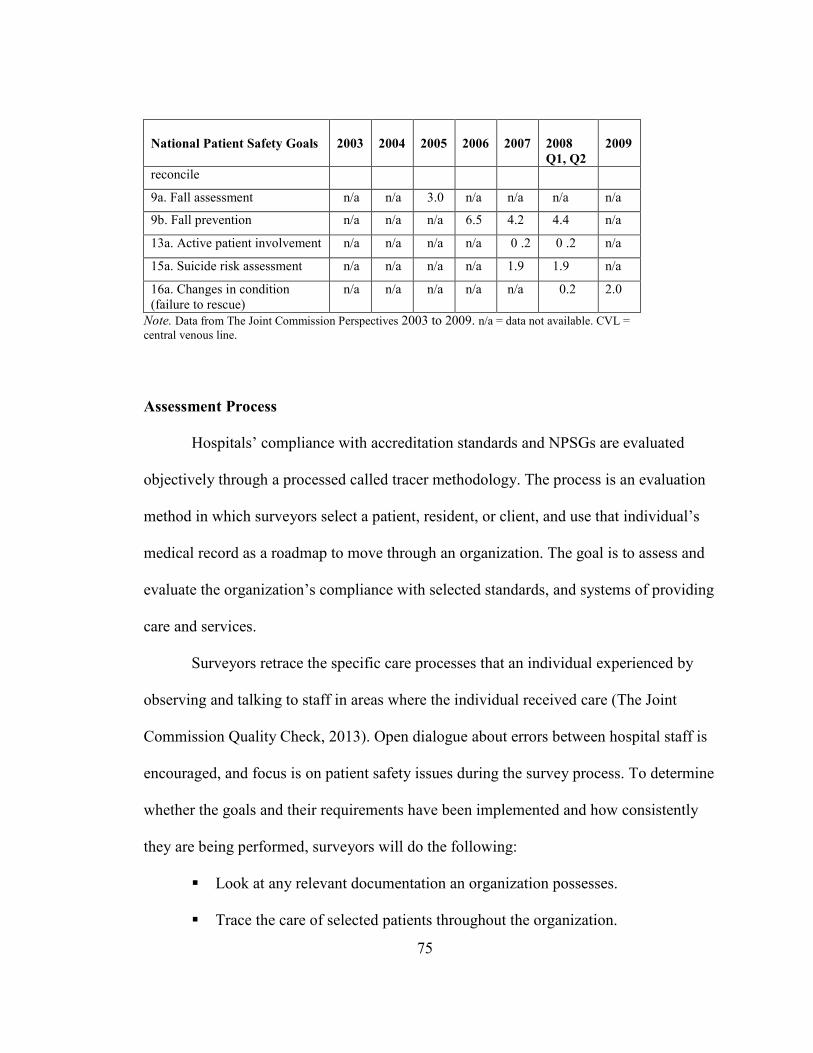
75
National Patient Safety Goals
2003
2004
2005
2006
2007
2008
Q1, Q2
2009
reconcile
9a. Fall assessment n/a n/a 3.0 n/a n/a n/a n/a
9b. Fall prevention n/a n/a n/a 6.5 4.2 4.4 n/a
13a. Active patient involvement n/a n/a n/a n/a 0 .2 0 .2 n/a
15a. Suicide risk assessment n/a n/a n/a n/a 1.9 1.9 n/a
16a. Changes in condition (failure to rescue)
n/a n/a n/a n/a n/a 0.2 2.0
Note. Data from The Joint Commission Perspectives 2003 to 2009. n/a = data not available. CVL =
central venous line.
Assessment Process
Hospitals’ compliance with accreditation standards and NPSGs are evaluated
objectively through a processed called tracer methodology. The process is an evaluation
method in which surveyors select a patient, resident, or client, and use that individual’s
medical record as a roadmap to move through an organization. The goal is to assess and
evaluate the organization’s compliance with selected standards, and systems of providing
care and services.
Surveyors retrace the specific care processes that an individual experienced by
observing and talking to staff in areas where the individual received care (The Joint
Commission Quality Check, 2013). Open dialogue about errors between hospital staff is
encouraged, and focus is on patient safety issues during the survey process. To determine
whether the goals and their requirements have been implemented and how consistently
they are being performed, surveyors will do the following:
� Look at any relevant documentation an organization possesses.
� Trace the care of selected patients throughout the organization.
76
� Interview the organization’s leaders and direct caregivers.
� Directly observe performance with respect to the goals to determine whether
the requirements have been implemented and how consistently they are being
performed.
Edmond and Eickhoff (2008) contend that The Joint Commission standards and
NPSGs at times lack strong supporting evidence and do not provide a mandate for
hospitals to report outcomes associated with NPSGs to ensure that interventions actually
are improving outcomes. The Joint Commission accreditation process attempts to ensure
that scoring and evaluation processes are congruent with the organization’s performance
standards, transparent and easily understood by all involved, and based on the criticality
of the standards (The Joint Commission, 2012).
HCUP-NIS Data
The AHRQ’s PSIs originally were developed in 1994 using data from the HCUP-
NIS as a method for screening inpatient administrative discharge data to identify potential
patient safety problems. Yet, they increasingly are being used for quality measurement
and hospital comparison purposes (Romano et al., 2009.) In 1998, the AHRQ revised and
updated the indicators with input from users and advances in the sciences (AHRQ,
2010a). The PSIs were developed to minimize false positives at the expense of false
negatives and maximize the likelihood that flagged events are preventable (AHRQ, 2007;
Romano et al., 2003). The PSIs have good face validity, and studies suggest that several
PSIs have good construct validity (Duggirala et al., 2004; Romano et al., 2003; Rosen et
al., 2005; Rosen et al., 2006).
77
The NIS is part of the HCUP, an all payer healthcare database developed through
a federal-state-industry partnership and sponsored by the AHRQ. Currently, NIS is the
largest all-payer, inpatient, hospital care database in the United States. It is used by
policymakers and researchers to analyze and track national trends in healthcare
utilization, charges, quality, and outcomes (AHRQ, 2011). The HCUP-NIS contains “the
unit of analysis is the hospital stay rather than the patient” (Levit et al., 2007, p. 56). The
HCUP database currently provides clinical and nonclinical variables from hospital
discharge abstracts from 1988 to 2011 for states participating in HCUP. For 2011, more
than 97% of the U.S. population is included in the database. Databases contain clinical
patient-level discharge information, and resource information is included in a typical
discharge abstract.
The AHRQ’s PSI data is being used in a variety of ways to foster safety (CMS,
2010). For example, evidence-based indicators are being amassed through reports such as
the AHRQ’s National Healthcare Quality Report and National Healthcare Disparities
Report, which integrates patient safety indicator information to perform assessments of
national performance on quality and patient safety in the United States (AHRQ, 2012a).
Furthermore, many states along with HCUP are facilitating electronic PSI data
availability so that hospitals quickly can access their own quarterly PSI rates for a more
just-in-time view of their performance (Savitz, Sorensen, & Bernard, 2004).
Hospitals have the ability to query their individual PSI rates, compare their results,
analyze differences in individual discharge data, and develop strategies to address areas
of need (Savitz et al., 2004).
78
Patient Safety Indicators
To use PSIs effectively, researchers must generate a solid and integrated
overview of various quality dimensions. Donabedian (1966) first presented a
conceptual framework to classify indicators to fulfill this requirement. His quality
assessment theory contains a relatively simple model, particularly applicable in
healthcare, called the SPO or Donabedian’s triad model in which the PSIs fit
(Donabedian, 1980).
In his theory, Donabedian describes three quality elements: structure,
process, and outcome. The first two elements contain indirect measures that
influence the third, direct element. All elements are linked with each other.
Therefore, insight into one of the three is insufficient to measure and evaluate
integral quality. Indicators can provide a structural and specific view of various
quality properties (Donabedian, 1980).
PSIs are a set of quality measures used to help hospitals identify potential
adverse events that may require further study. They provide an opportunity to
assess the incidence of adverse events using administrative inpatient hospital and
discharge data. Specifically, PSIs provide a method for identifying preventable
adverse events that patients experience through contact with the healthcare system
and that are likely amenable to prevention by implementing system level changes
(AHRQ, 2002). With information available from secondary diagnoses reported in
discharge abstracts, PSIs provide information on in-hospital adverse events after
surgeries, procedures, and childbirth using the International Classification of

79
Diseases 9 (ICD) and Revision Clinical Modification (RCM) codes present in
hospital administrative data (AHRQ, 2002).
A model for risk adjustment is incorporated into the PSI algorithms, which
are available through the AHRQ’s comorbidity software (Elixhauser, Steiner,
Harris, & Coffey, 2006) and include patient-level predictors such as age, sex, age-
sex interactions, modified DRGs, and modified comorbidity categories (Rosen et
al., 2005). Risk-adjusted rates were used for this study. The risk-adjusted rate
answers the converse question: “What rate of adverse events would we see in this
provider (or area) if they provided the locally observed quality of care to patients
whose distribution of characteristics matched those in the reference population?”
Risk-adjusted rates are useful in comparisons between providers or areas. They
are evaluated on an identical mix of patients, so calculating them is an attempt to
remove the confounding influence of patient mix from the comparison. A total of
30 comorbidities are generated automatically by the PSI software and used as risk
adjusters in the administrative data set (Zhan & Miller, 2003a). This risk
adjustment at the patient level strengthens the internal validity of the study’s
findings (Tourangeau & Tu, 2003).
The use of point of admission fields uniformly can impact PSI and patient
discharge indicators rates by reducing the times that false positives
occur⎯diagnoses being identified as complications from the current
hospitalization instead of a prior hospitalization or pre-existing comorbidities. The
PSIs are organized into three categories of measures: prevention quality

80
indicators, inpatient quality indicators, and PSIs (AHRQ, 2007). They are deemed
amenable to detection using administrative data, adequately coded in previous
studies, and sensitive to the quality of care (Romano et al., 2003).
Twenty PSIs exists as shown in Table 6 for medical conditions and surgical
procedures that represent a selective list of potential safety-related events believed
amenable to discovery using administrative data and sensitive to the quality of care
(Romano et al., 2003). For the interest of this study, hospital provider level PSIs were
used to examine outcomes of which three are of interest for this study. Evidence suggests
that adverse event rates have been shown to vary substantially across institutions and that
these indicators may link to deficiencies in the provision of care (AHRQ, 2012b).
Since the release of the AHRQ’s PSIs in 2003, several studies have been
conducted by researchers using the indicators to examine associations between selected
variables and adverse patient outcomes. These studies offer a considerable contribution to
established empirical evidence about patient safety outcomes. In 2001, using the AHRQ’s
PSI data from 1997 and more than 2 million patients in the New York inpatient database,
Miller et al. (2001) investigated the association between patient safety events and
variables such as length of stay, inpatient mortality, and hospital charges. Because of
their work, PSI algorithms were created along, and an association was made between
patient safety events, age, and hospitals with higher inpatient surgeries and intensive care
beds.
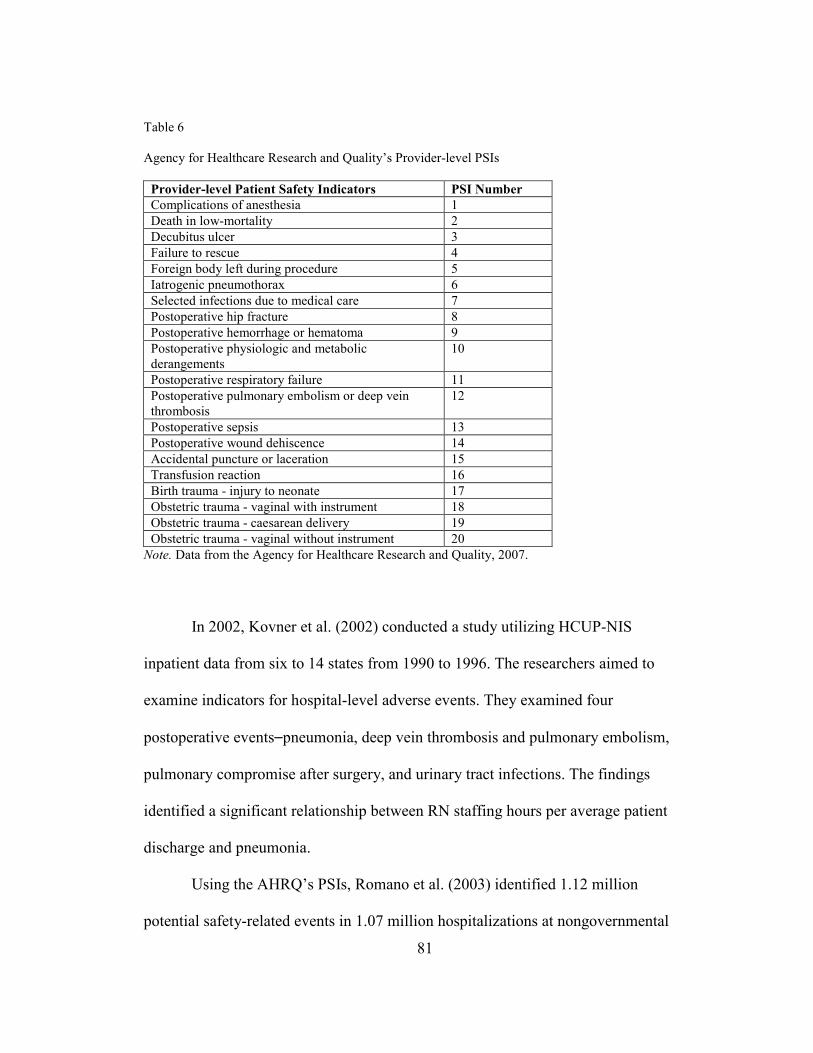
81
Table 6
Agency for Healthcare Research and Quality’s Provider-level PSIs
Provider-level Patient Safety Indicators PSI Number
Complications of anesthesia 1
Death in low-mortality 2
Decubitus ulcer 3
Failure to rescue 4
Foreign body left during procedure 5
Iatrogenic pneumothorax 6
Selected infections due to medical care 7
Postoperative hip fracture 8
Postoperative hemorrhage or hematoma 9
Postoperative physiologic and metabolic derangements
10
Postoperative respiratory failure 11
Postoperative pulmonary embolism or deep vein thrombosis
12
Postoperative sepsis 13
Postoperative wound dehiscence 14
Accidental puncture or laceration 15
Transfusion reaction 16
Birth trauma - injury to neonate 17
Obstetric trauma - vaginal with instrument 18
Obstetric trauma - caesarean delivery 19
Obstetric trauma - vaginal without instrument 20
Note. Data from the Agency for Healthcare Research and Quality, 2007.
In 2002, Kovner et al. (2002) conducted a study utilizing HCUP-NIS
inpatient data from six to 14 states from 1990 to 1996. The researchers aimed to
examine indicators for hospital-level adverse events. They examined four
postoperative events⎯pneumonia, deep vein thrombosis and pulmonary embolism,
pulmonary compromise after surgery, and urinary tract infections. The findings
identified a significant relationship between RN staffing hours per average patient
discharge and pneumonia.
Using the AHRQ’s PSIs, Romano et al. (2003) identified 1.12 million
potential safety-related events in 1.07 million hospitalizations at nongovernmental
82
acute care hospitals in a 2000 HCUP study. Further, the researchers established
face and consensual validity of these indicators, and identified an association with
patient and hospital characteristics. Their findings revealed that PSIs were highest
in urban teaching hospitals, increased with age, and were higher in African
Americans when adjusted.
In a 2005 study by Miller et al. (2005) that examined the relationship
between Joint Commission accreditation scores and PSIs from HCUP
administrative data, and Joint Commission accreditation data from 1997 to 1999.
The study findings revealed that when there was little variation in Joint
Commission scores, wide variation existed in the PSI rates, resulting in the
conclusion that there was no relationship between Joint Commission accreditation
processes and the studied PSIs.
Romano et al. (2003) used HCUP-NIS data to establish face and
consensual validity of PSIs and presented national data on the AHRQ’s PSIs. This
data included events over time and their association with patient and hospital
characteristics. More than 1.12 million potential, safety-related events in 1.07
million hospitalizations at nongovernmental acute care hospitals in 2000 were
identified. When adjusted, the frequency of PSIs was highest in urban teaching
hospitals.
In 2005, Savitz et al. (2004) investigated the relationship between PSIs,
the NQF indicators, and ANA indicators. The researchers found an association
with two indicators: failure to rescue and rate of decubitus ulcers. An additional
83
PSI⎯infections due to medical care⎯also was found to overlap with the NQF
indicators. Three indicators from these findings were used in this study:
development of decubitus ulcer and infections due to medical care that include
postoperative sepsis and central venous catheter bloodstream infection. The three
selected PSIs represent both medical conditions and surgical procedures that are
amenable to detection using HCUP-NIS administrative data and are potentially
nursing sensitive to measuring the quality of care (Romano et al., 2003).
Supporting evidence of PSI construct validity was provided in a study
using VA data from 2000 to 2001 (Rosen et al., 2005). Researchers applied the
AHRQ’s PSIs to VA data, examined differences in actual and risk-adjusted VA
data, and compared the VA data to non-VA data sources. Results revealed that the
most frequent PSI complications were failure to rescue, decubitus ulcer, and deep
vein thrombosis and pulmonary embolism. Researchers found the VA risk-
adjusted rates to be significantly lower than both HCUP-NIS and Medicare event
rates for decubitus ulcer, infection due to medical care, postoperative respiratory
failure, and postoperative sepsis in the comparison of VA and non-VA data.
Three studies (Isaac & Jha, 2008; Rivard et al., 2008; Vartak et al., 2008)
were conducted in 2008 with significant findings related to the AHRQ’s PSIs.
The first was a follow-up study performed by Rivard et al. (2008) to work
performed by Rosen et al. (2005) using nine of the AHRQ’s PSIs from October
2000 to September 2001. Rivard et al. 2008 found all nine selected PSIs to be
associated with increased cost, the length of stay, and mortality. In comparing VA
84
data and non-VA data, outcomes were consistent with the study by Rosen et al.
(2005).
In 2008, Isaac and Jha used specified PSIs to examine a relationship with
other measures of hospital quality using 2003 MedPAR data and scores from the
Hospital Quality Alliance Program. Only one indicator⎯failure to rescue⎯was
consistently associated with better performance on the quality measures. Other
PSIs selected⎯death in low mortality diagnosis-related groups (DRGs), decubitus
ulcer, and infections due to medical care⎯were not associated with quality
measures. Vartak et al. (2008) found higher rates of complications at teaching
hospitals in their study of six postoperative PSIs⎯postoperative sepsis,
postoperative deep vein thrombosis and pulmonary embolism, postoperative hip
fracture, postoperative respiratory failure, postoperative metabolic derangement,
and postoperative hemorrhage.
Thornlow and Merwin (2009) investigated the relationships among
hospital systems, use of patient safety practices as measured by hospital
accreditation overall scores, and patient safety outcomes in acute care hospitals to
determine if the use of patient safety practices influenced the rates of four
PSIs⎯the AHRQ’s PSI infections, postoperative respiratory failure, decubitus
ulcers, and failure to rescue. The researchers found that selected hospital
accreditation standards significantly overlapped in two of the four
measures⎯higher decubitus rates and hospital infection rates. Hospitals considered
lower-performing in the accreditation standard of assessing patient needs had
85
higher rates of infection than those with higher scores. Hospitals with poor
performance under the accreditation standard of care procedure had higher rates
of decubitus ulcers than did hospitals with better performance. Use of patient
safety practices was not associated with hospital rates of postoperative respiratory
failure or failure to rescue.
The three PSIs selected for investigation in this study have been shown to
be influenced by organizational characteristics (AHRQ, 2007; Romano et al.,
2003; Miller et al., 2001) and care processes (Lake & Freise, 2006; Gastmeier &
Geffers, 2006; Kovner & Gergen, 1998). Further, the medical conditions and
surgical procedures represented in the data set are sensitive to the indicators
selected (Romano et al., 2003) and the quality indicators are amenable to
detection. Therefore, there is significant support for the selection of the three
indicators chosen for analysis in this study. Further explanation and detail of the
selected indicators are defined more completely in Chapter 3.
American Hospital Association
The AHA annual survey database, through the services of Health Forum
L.L.C., collects survey data in the fall of each year for 6,000 U.S. hospitals. The
2011 survey database consisted of 6,317 hospitals. An enormous amount of data
has been collected annually since 1946 and is widely deemed as the healthcare
industry’s most comprehensive source of data for profiling and categorizing
hospitals (AHA, 2013). Hospitals choose to complete the voluntary survey either
online or via mailed questionnaire. The survey generally has an excellent response
86
rate. However, response rates vary by question. For nonreporting hospitals or
instances when data elements are omitted, data estimations are created by
statistical modeling or data is derived from similar hospital facilities using the
most recently available hospital data (AHA, 2013).
Variables pertinent to hospital systems such as teaching status, location,
and size are available in both the AHA dataset and NIS inpatient data set.
Considered the most significant information for this study is the provision of
demographic and hospital identification data provided in the data set. This data
was used to crosslink hospital information for HCUP-NIS and The Joint
Commission. According to the AHA user agreement, it can be readily linked with
the HCUP-NIS dataset.
Summary
This chapter described several efforts to improve safety that have been
encumbered, in part, by the difficulty in examining systemic failures that routinely occur
in complex and dynamic environments such as hospitals. Despite marked efforts, experts
suggest that patient safety has not substantially improved (Rothschild et al., 2006). Given
the growing emphasis on patient safety and increasingly complex nature of healthcare, it
becomes exceedingly important to determine if differences in preventable adverse events
among acute care hospitals are reflective of differences in organizational systems and
processes implemented in accredited hospitals.
Clinicians and healthcare leaders are compelled to examine how patient safety
practice is operationalized and how organizational characteristics of acute care hospitals
87
affect patient safety outcomes in order to significantly improve patient safety. Without a
commitment to use collected data on patient safety practices to identify and correct
systemic issues, the safety of patients will continue to be jeopardized.
The Joint Commission accreditation process is tantamount with quality and safety
of clinical care. As a result, hospitals spend a significant portion of their budgets to
participate in The Joint Commission accreditation process. However, the extent that the
accreditation process, specifically implementation of NPSGs, truly is associated with
safety and improved outcomes is relatively unknown (Miller et al., 2005). Examining the
relationship of healthcare system characteristics and patient safety practices in acute care
hospitals is key to identifying system failures and influences that lead to potentially
preventable medical errors. At this time, there is little to no published research examining
the relationship between the implementation of NPSGs and patient outcomes.
Research related to The Joint Commission process has focused on the relationship
between accreditation and compliance scores and core measure variables such as heart
failure and ventilator-associated pneumonia (Masica et al., 2009). There is a significant
gap in the literature examining the impact of the 2003 NPSG implementation and
evidenced-linked outcomes such as the AHRQ’s PSIs. PSIs are considered as the state-
of-the-art measure for safe hospital care.
The AHRQ emphasized that improving patient safety is critical to improving
healthcare quality in the United States (AHRQ, 2007). There are many unanswered
questions regarding the relationship between acute hospital characteristics and
compliance with The Joint Commission’s NPSGs on preventable, adverse events,

88
specifically on the AHRQ’s PSIs. Chapter Three will describe this study’s
methodological properties.
89
CHAPTER 3: METHODOLOGY
Previous chapters presented an overview of this study; conceptual framework
used to examine relationships among acute care hospital systems, patient safety practices,
and patient outcomes; and a review of existing literature. This chapter introduces the
study’s research design, questions to be answered, theoretical model, population and
sample, constructs measured, and data analyses to be used to answer the research
questions. Additionally, human subject confidentiality and data protection methods are
also disclosed.
Research Design
A descriptive, correlational research design was used in this study to examine the
relationships between hospital characteristics and NPSGs, and to explore their
relationship to selected patient safety outcomes in Joint Commission accredited hospitals
in the United States. Secondary data from a probability sample representing
approximately 20% U.S. community hospitals (AHRQ, 2011) and the 2011 Joint
Commission accreditation performance reports derived from 2011 HCUP-NIS
participating hospitals from across the United States were used to explore the
relationships among hospital systems, patient safety practices, and patient outcomes.

90
Conceptual Model
The study was based on the Donabedian conceptual model depicted in Figure 1. The
aims of this study were three-pronged. First, the study examined the strength and
direction of the relationship between organizational characteristics (structural elements)
of acute care hospitals such as teaching status, hospital location, and bed size, and
implementation of patient safety practices (process elements), specifically The Joint
Commission’s NPSGs. Second, the relationship between patient safety practice
implementation (process elements) and patient safety indicator outcomes for selected
PSIs was examined. PSIs are defined as potentially preventable complications resulting
from care. Indicators were measured for each hospital using criteria in an AHRQ
software specifically designed to identify PSIs found in the hospital-based discharge
database (AHRQ, 2011). Third, patient safety outcomes were risk-adjusted via the
AHRQ software formula to account for patient characteristics. This formula also was
used to examine hospital structural variables associated with patient outcome variables
among the acute care hospitals of interest.
Creation of the Analytic Data File
The research database was composed of data obtained from multiple sources,
including the 2011 AHA crosswalk file, the 2011 HCUP-NIS hospital file, and The Joint
Commission, in which files were retrieved online from The Joint Commission Quality
Check® site for hospital compliance with NPSGs. Secondary data were procured at two
levels of analysis for patients and hospitals. Hospital-level data include the 2011 AHA
annual survey data and the 2011 Joint Commission accreditation performance reports.

91
Patient-level data were obtained from the 2011 NIS discharge dataset, which is a subset
of the HCUP databases. A description of each dataset follows.
The AHA database, through the services of Health Forum LLC, collects survey
data in the fall of each year for approximately 6,000 hospitals in the United States. The
2011 AHA survey database consisted of data from 6,317 U.S. hospitals representing all
sizes, locations, and teaching status. It provided all nurse staffing values for all hospitals
throughout the United States. Accreditation status and hospital demographics such as
hospital identification and location also were provided by this source. The HCUP-NIS
hospital file was linked to the 2011 AHA file using identifiers present in both the AHA
crosswalk file and the HCUP-NIS file. The information on The Joint Commission
Quality Check® website provided sufficient hospital identifiers to link each hospital to
the AHA and HCUP-NIS files. The 149 HCUP-NIS hospitals participating in the
accreditation process in 2011 represented 3.5% of the total hospitals in the United States
accredited by The Joint Commission, according to AHA records. Only one Joint
Commission accredited hospital was unable to be linked due to insufficient identification
information (Health Forum, LLC, 2008).
The AHRQ WinQI software reported expected rates, risk-adjusted PSI rates, and
smoothed rates from the NIS data file for the variables of interest in this research. A total
of three PSI files were merged with selected AHA data, HCUP-NIS data, and The Joint
Commission survey results to create a file for data analysis. The sample of hospitals was
selected after the construction of the study sample datasets. Graduate Statistical Package
for the Social Sciences® 23 was used to analyze the resulting data set.
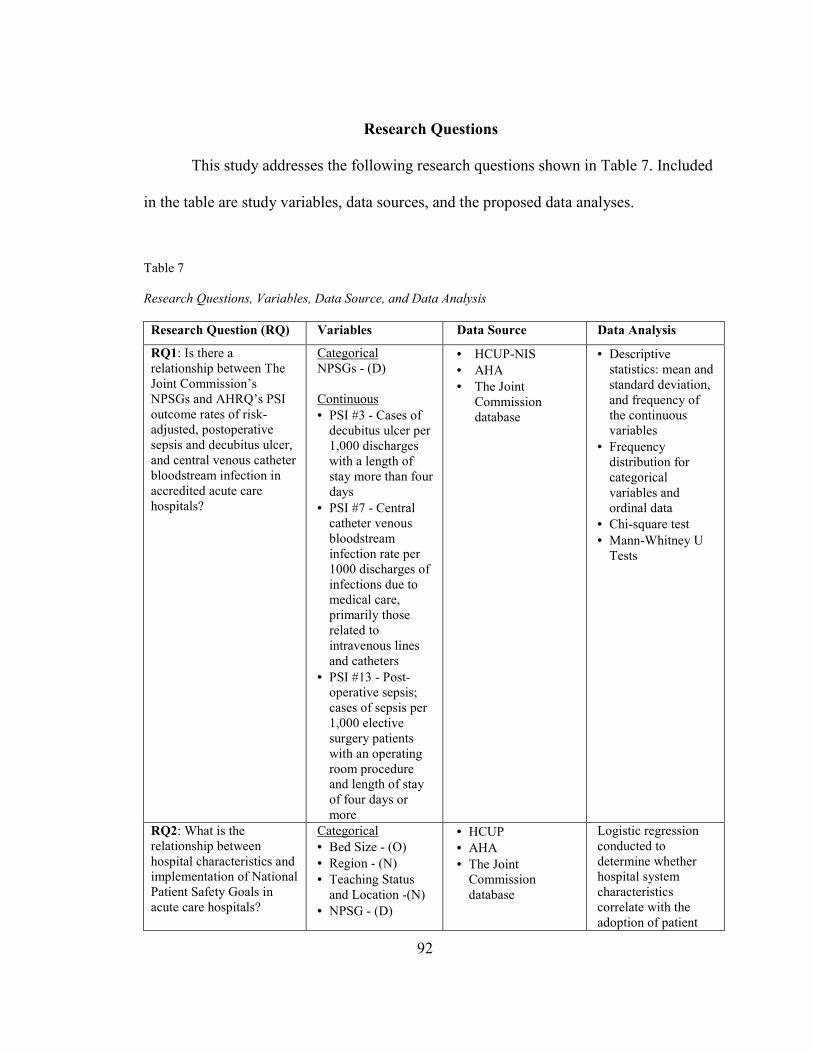
92
Research Questions
This study addresses the following research questions shown in Table 7. Included
in the table are study variables, data sources, and the proposed data analyses.
Table 7 Research Questions, Variables, Data Source, and Data Analysis
Research Question (RQ) Variables Data Source Data Analysis
RQ1: Is there a relationship between The Joint Commission’s NPSGs and AHRQ’s PSI outcome rates of risk-adjusted, postoperative sepsis and decubitus ulcer, and central venous catheter bloodstream infection in accredited acute care hospitals?
Categorical NPSGs - (D) Continuous
• PSI #3 - Cases of decubitus ulcer per 1,000 discharges with a length of stay more than four days
• PSI #7 - Central catheter venous bloodstream infection rate per 1000 discharges of infections due to medical care, primarily those related to intravenous lines and catheters
• PSI #13 - Post-operative sepsis; cases of sepsis per 1,000 elective surgery patients with an operating room procedure and length of stay of four days or more
• HCUP-NIS
• AHA
• The Joint Commission database
• Descriptive statistics: mean and standard deviation, and frequency of the continuous variables
• Frequency distribution for categorical variables and ordinal data
• Chi-square test
• Mann-Whitney U Tests
RQ2: What is the relationship between hospital characteristics and implementation of National Patient Safety Goals in acute care hospitals?
Categorical
• Bed Size - (O)
• Region - (N)
• Teaching Status and Location -(N)
• NPSG - (D)
• HCUP
• AHA
• The Joint Commission database
Logistic regression conducted to determine whether hospital system characteristics correlate with the adoption of patient

93
Research Question (RQ) Variables Data Source Data Analysis
safety practices
RQ3: What is the relationship between hospital characteristics and AHRQ patient safety indicators outcome rates of risk-adjusted diabetes, postoperative sepsis, and central venous catheter bloodstream infection in accredited acute care hospitals?
Categorical
• RN FTE APD - (O)
• LPN FTE APD - (O)
• Total Licensed APD - (O)
Continuous HCUP-NIS indicators risk-adjusted PSIs
• PSI #3 - Cases of decubitus ulcer per 1,000 discharges with length of stay more than four days
• PSI #7 - Central catheter venous bloodstream infection rate per 1000 discharges of infections due to medical care, primarily those related to intravenous lines and catheters
• PSI #13 - Post-operative sepsis; cases of sepsis per 1,000 elective surgery patients with an operating room procedure and length of stay of four days or more
• HCUP-NIS
• AHA
• The Joint Commission database
• Kruskal-Wallis
• Descriptive statistics: mean and standard deviation, and frequency of the continuous variables frequency distribution for categorical variables and ordinal data
• Chi-square test
RQ4: What are the independent predictors of AHRQ risk-adjusted PSIs for decubitus ulcer, postoperative sepsis, and central venous catheter bloodstream infection in
Categorical
• NPSGs - (D)
• Bed size - (O)
• Region - (N)
• Teaching-Location status - (N)
• RN FTE APD - (O)
• LPN FTE APD -
• HCUP-NIS
• AHA
• The Joint Commission database
• Multiple logistic regression conducted to determine which hospital characteristics are predictors AHRQ PSIs in accredited

94
Research Question (RQ) Variables Data Source Data Analysis
accredited acute care hospitals?
(O)
• Total Licensed APD - (O)
Dichotomous HCUP-NIS indicators risk-adjusted PSIs
• PSI #3 - Cases of decubitus ulcer
• PSI #7 - Central catheter venous bloodstream infection rate
• PSI #13 - Post-operative sepsis; cases of sepsis
acute care hospitals
• Descriptive statistics: mean and standard deviation, and frequency of the continuous variables
Note. NPSG = national patient safety goals. AHRQ = Agency for Healthcare Research and Quality. PSI = patient safety indicator. HCUP-NIS = Healthcare Cost and Utilization Project-Nationwide Inpatient Sample. AHA = American Hospital Association. O = ordinal. N = nominal. D = dichotomous. RN = registered nurse. FTE = full-time equivalency. APD = adjusted patient discharge.
Population and Sample
Population
The population for this study was nongovernmental, acute care community
hospitals across the United States, as classified by the AHA, that were included in the
HCUP-NIS database. The hospital population of the AHRQ NIS database was drawn
from states participating in HCUP. The HCUP database includes more than 95% of the
inpatient hospitalized U.S. population. It is derived from a 20% stratified sample of
discharges from all U.S. community hospitals, excluding rehabilitation and long-term,
acute care hospitals. Hospitals excluded from this study are children’s hospitals and
specialty hospitals because the study PSIs do not apply.
95
Sample
The sample for this study was derived from two secondary datasets. First, the
2011 HCUP-NIS administrative dataset was used to identify acute care community
hospitals in the 46 states that participated in the HCUP from across the United States.
There were 1,049 hospitals with 8,023,590 discharges during this period. Of the 1,049
hospitals that participated in the NIS sample, 446 met the inclusion criteria as being
accredited by The Joint Commission. An additional hospital inclusion criterion was that
the hospital must have participated in the accreditation process in 2011. As a result, the
study sample was limited to 28 states and consisted of 149 acute care community
hospitals. The excluded hospitals were located in Alabama, Delaware, the District of
Columbia, and Idaho. New Hampshire participated in HCUP-NIS but did not submit data
in time to be included in the database. The number of hospitals per state in the 2011 NIS
sample ranged from two to 90.
Secondly, the NPSG implementation was taken from a 2011 Joint Commission
dataset. The 2011 AHA list shows that 6,320 hospitals were reviewed to identify a
sample of hospitals that participated in The Joint Commission accreditation process in
2011.
Of the 46 states in the NIS sample, four restricted the identification of hospital
structural characteristics, and 19 prohibited the release of hospital identifiers, which are
one of the variables for the study. Stratified data elements identifying control, ownership,
location, teaching status, and bed size were excluded for 18 states. However, those
96
elements were obtained from the AHA dataset. Further reductions occurred through the
elimination of hospitals that did not seek accreditation from The Joint Commission.
Data from the AHA for 2011 included hospitals that completed The Joint
Commission accreditation survey in that year. Therefore, data analysis was matched in
the same year.
Data validation and duplication were done by linking the AHA crosswalk
file⎯using hospital identifiers, address, city, state, and zip code⎯to the HCUP-NIS
hospital identification number using the name, address, city, state, and zip code. As a
result, the sample included 149 acute care hospitals in 21 states.
Determination of the appropriate sample size was a crucial part of the study
design. The required sample size for regression analysis depends on various issues,
including the desired power, alpha level of significance, and the expected effect size
(DuPont & Plummer, 1998). NQueryadvisor7.0® study planning software (Elashoff,
2007) was used to determine the required sample size for this study. A sample size of at
least 100 hospitals was recommended to achieve a significance level with p = 0.05 and
80% power. Power is defined as the likelihood of rejecting the null hypothesis and
avoiding a Type 2 error (Munro, 2005). Power of 80% generally is viewed as adequate.
Significance was achieved at R2 = .0913. Tabachnik and Fidell (2001) were used
as a cross-reference. The suggested sample size equation for testing the multiple
correlation is N > = 50 + 8m (where m = number of independent variables) and for
testing individual predictors N > = 104 + m. A medium-size relationship is assumed
between the independent variables. Therefore, a power of 80%, significance level of 0.05,
97
and an effect size of .20 was used. Based on these suggested equations to test the
considered seven variables, the example equation would be 50 + 8(7) = 106 and the
equation to test regression formula of the individual variables is 104 + 7 = 111.
Datasets
The HCUP-NIS is a stratified probability sample of U.S. hospitals, where the
universe of community hospitals across the United States is divided into strata using five
hospital characteristics: ownership and control, bed size, teaching status, urban or rural
location, and U.S. region having sampling probabilities proportional to the number of
U.S. community hospitals in each stratum (AHRQ, 2010c).
The sampling procedure used in this study is adequate to ensure representation in
the HCUP-NIS sample (AHRQ, 2010d). The procedure is multi-tiered. First, hospitals are
stratified by geographic location. Next, hospitals are sorted by zip code stratum. Finally,
a systematic random sample of up to 20% of the total number of hospitals within each
stratum is drawn. All hospitals within that stratum are selected for inclusion only if a
sufficient number of hospitals are found in the frame. A minimum of two hospitals within
each stratum frame is required for inclusion in the HCUP-NIS sample.
Hospital-Level Data
The number of hospitals identified by NIS in each state ranged from 11 to 486. As
noted in Table 8, hospital discharges per state ranged from 235 to 638,000. Excluded
from consideration were VA hospitals and other federal facilities such as those of the
DOD and HHS’s Indian Health Service; short-term rehabilitation hospitals; long-term,
non-acute- care hospitals; psychiatric hospitals; and alcoholism and chemical dependency
98
treatment facilities. However, 94% of the excluded states previously were excluded. Of
the stratified listing exclusions and hospital identifier exclusions, one state was not
included on both lists. Of the four states restricting hospital structural identification, the
restrictions were not pertinent to the study. Therefore, they did not affect the sample size.
Overall, 43% of the total population of hospitals was excluded from the study. Twenty-
seven states with 149 accredited general medical/surgical hospitals remain.
Table 8
Hospital Discharges Per State for 2011 National Inpatient Sample
State Discharges State Discharges
Alaska 3,796 Nevada 58,015
Arizona 168,667 New Jersey 207,319
Arkansas 87,095 New Mexico 46,313
California 834,410 New York 598,902
Colorado 136,934 North Carolina 250,166
Connecticut 99,594 North Dakota 13,916
Florida 584,887 Ohio 326,764
Georgia 205,583 Oklahoma 95,997
Hawaii 235 Oregon 81,472
Illinois 349,835 Pennsylvania 400,938
Indiana 230,634 Rhode Island 35,921
Iowa 61,618 South Carolina 118,814
Kansas 75,570 South Dakota 28,714
Kentucky 128,410 Tennessee 205,619
Louisiana 137,103 Texas 638,165
Maine 16,660 Utah 69,054
Maryland 220,059 Vermont 25,278
Massachusetts 153,881 Virginia 251,779
Michigan 200,895 Washington 109,487
Minnesota 142,629 West Virginia 70,698
Mississippi 105,108 Wisconsin 153,115
Missouri 249,518 Wyoming 10,356
Montana 9,145
Nebraska 24,522 Total 8,023,590
Note. Data from Healthcare Cost and Utilization Project, 2013.
99
Study Variables
PSIs were designed to compare risk-adjusted hospital rates for several types of
preventable complications and adverse events in studies using administrative data from
discharge abstracts in conjunction with HCUP-NIS data (Elixhauser et al., 2006). The
AHRQ-designed PSI software version 5.0a was run on the combined file (core + NIS
hospital) to identify patient safety outcome variables of interest to this study.
The software generated an algorithm to calculate rates that used the date of
procedure, ICD-9-CM diagnosis and procedure codes, and patient characteristics,
including age, gender, and DRG to flag potentially preventable complications. Each of
the PSIs was analyzed in three forms, as recommended by the software: unadjusted ratio,
risk-adjusted ratio, and risk-adjusted ratio with smoothing. The unadjusted ratio is the
number of observed encounters divided by the number of discharges. The program
calculated observed PSI rates regardless of the number of cases available (numerator or
denominator). The numerators consist of the complications of interest, and denominators
consist of the population at risk (AHRQ, 2010a).
Patient risk adjustment was controlled for by application of the AHRQ
comorbidity software (HCUP, 2011c). Because NIS is a stratified sample, proper
statistical techniques were used to calculate standard errors and confidence intervals. The
outcome variables’ validation of the AHRQ’s PSIs is still in its early stages. PSI rates
were risk-adjusted for case mix, age, gender, age-gender interactions, comorbid
conditions specific to each indicator, and DRGs specific to each indicator (Elixhauser et
al., 2006).
100
Elements in the combined file were renamed or recoded in the AHRQ data
dictionary prior to running the program to conform to the PSI software requirements: (1)
gender: “female” was renamed and recoded to “sex,” (2) admission source: “source” was
renamed and recoded as “point of originub04,” and (3) patient state and county code
“hfipsstco” was renamed “fips.”
Risk-adjusted rates for three PSIs were used in this study. The software applied
pre-calculated coefficient adjustments using the HCUP-NIS database and computed risk-
adjusted PSI rates for 149 selected hospitals in 28 states for the three selected PSIs
(HCUP, 2011c).
PSI rates for the three selected indicators were merged into the hospital-level
HCUP-NIS analytic file using the HCUP identifier to create the patient safety outcome
variables selected for this study as shown in Table 9. The output file was re-combined
with the NIS hospital-level file to identify individual AHA hospitals. Successful file
merging was validated by comparing the initial file data for discharge abstracts on
hospital identity, teaching status, ownership, and others identifiers with the final hospital-
level file. Beginning October 1, 2007, the UB-04 data (point of admission) may affect the
prevalence of the outcome of interest and the risk-adjusted rates by excluding secondary
diagnoses coded as complications from the identification of covariates in the database.
In summary, the combined risk-adjustment approach at the patient level enhances
the reliability and internal validity of the instruments used for identifying potentially
preventable adverse events in hospital discharge data. This approach is done while taking
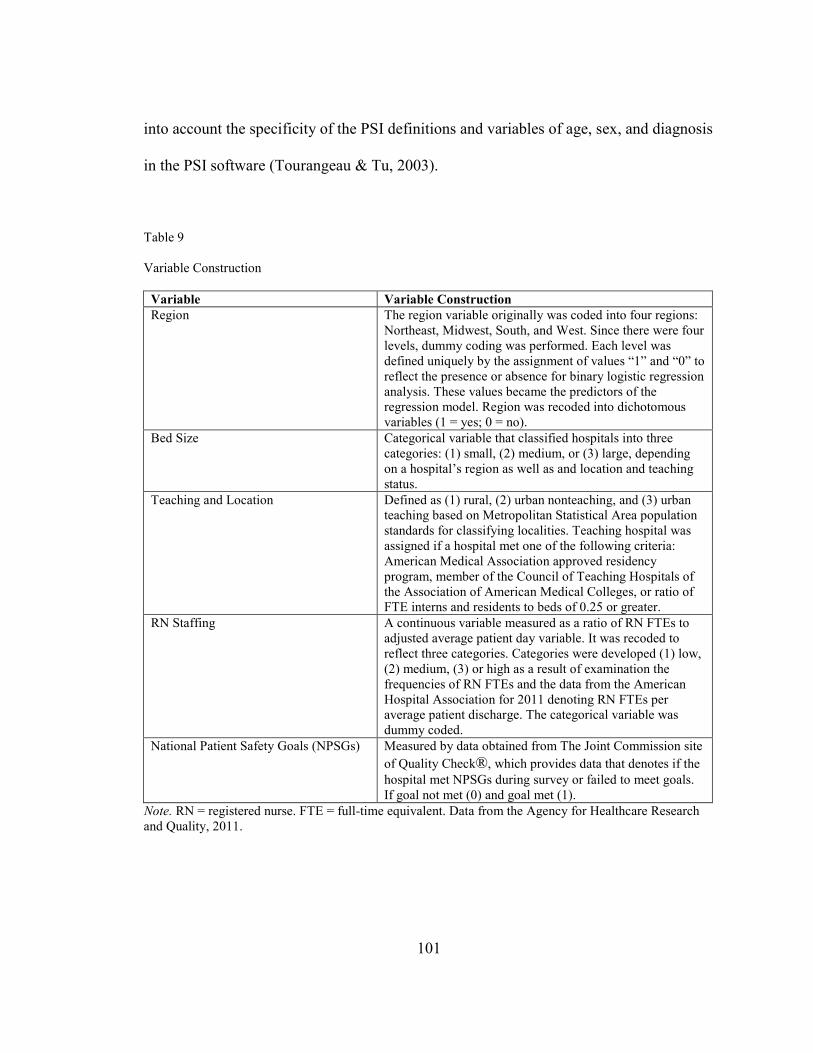
101
into account the specificity of the PSI definitions and variables of age, sex, and diagnosis
in the PSI software (Tourangeau & Tu, 2003).
Table 9 Variable Construction
Variable Variable Construction
Region
The region variable originally was coded into four regions: Northeast, Midwest, South, and West. Since there were four levels, dummy coding was performed. Each level was defined uniquely by the assignment of values “1” and “0” to reflect the presence or absence for binary logistic regression analysis. These values became the predictors of the regression model. Region was recoded into dichotomous variables (1 = yes; 0 = no).
Bed Size Categorical variable that classified hospitals into three categories: (1) small, (2) medium, or (3) large, depending on a hospital’s region as well as and location and teaching status.
Teaching and Location Defined as (1) rural, (2) urban nonteaching, and (3) urban teaching based on Metropolitan Statistical Area population standards for classifying localities. Teaching hospital was assigned if a hospital met one of the following criteria: American Medical Association approved residency program, member of the Council of Teaching Hospitals of the Association of American Medical Colleges, or ratio of FTE interns and residents to beds of 0.25 or greater.
RN Staffing A continuous variable measured as a ratio of RN FTEs to adjusted average patient day variable. It was recoded to reflect three categories. Categories were developed (1) low, (2) medium, (3) or high as a result of examination the frequencies of RN FTEs and the data from the American Hospital Association for 2011 denoting RN FTEs per average patient discharge. The categorical variable was dummy coded.
National Patient Safety Goals (NPSGs) Measured by data obtained from The Joint Commission site
of Quality Check®, which provides data that denotes if the
hospital met NPSGs during survey or failed to meet goals. If goal not met (0) and goal met (1).
Note. RN = registered nurse. FTE = full-time equivalent. Data from the Agency for Healthcare Research and Quality, 2011.
102
Group Size, Missing, and Outlier Data
Treatment of missing values was contingent upon whether the missing value was
hospital- or patient-level data. Missing values for hospital-level data such as hospital
teaching status, ownership, size, location, and Quality Check® data provided by The
Joint Commission was addressed first by attempting to replace the value by searching
alternative datasets or other sources for prior year’s data, especially AHA data. Patient-
level missing data for variables such as age, sex, or DRG resulted in the exclusion of that
case from the PSI software analysis (AHRQ, 2012a).
There was no missing data in the descriptive hospital characteristics for The Joint
Commission accredited hospitals group. In addition, missing data were examined for the
PSI dataset. Missing data were a concern in the staffing variables, specifically the RN
FTE (n = 14), LPN FTE (n = 13), and the total license FTE (n = 14). The cases were not
excluded. Missing was included as a category when examining PSI data to determine if
there were significant relationships in the outcome PSIs. Missing RN staffing cases were
excluded when analysis of variables other than PSIs was performed.
The data were examined for outliers using Mahalanobis distance. This distance is
the multivariate measure of distance from the centroid (mean of all the variables).
Mahalanobis distance reported the highest and lowest five cases for the each of the PSI
variables selected. Only the cases with the greatest value from the mean were examined.
The outliers in the study variables were examined for proper data entry. Outliers were
identified in PSI #3 decubitus ulcer rates, PSI #7 central venous catheter bloodstream
103
infection rates, and PSI #13 postoperative sepsis rates. Two outliers were found in both
decubitus ulcer and postoperative sepsis. Only one outlier was identified in PSI #7.
Hospital demographics were examined using box plots to explore each outlier.
The box plot displays the distribution of Mahalanobis distances intuitively and identifies
extreme values. Upon exploration of the case numbers, it was discovered that the outliers
in PSI #3 and PSI #7 had the same hospital identification number: a small, rural hospital
located in the South with fewer than 360 discharges. Demographics for postoperative
sepsis also were explored. The cases identified as outliers were not deleted or
transformed from the sample because of the relationship to other data elements within the
sample and the value that is added to the analysis.
Data Analysis
Data were analyzed using the latest Graduate Statistical Package for the Social
Sciences® 23. The methods, measures, and analysis of the variables are delineated in
Table 7. Hospital rates of occurrence for each of three AHRQ PSIs for decubitus ulcers
and infections, postoperative sepsis, and central venous line bloodstream infection were
calculated by applying the PSI software version 5.0 to the NIS dataset.
The five structural variables of the study were NPSGs, RN FTE staffing per APD,
geographic region, hospital bed size, and hospital teaching status and location. The
outcome variables were the risk-adjusted PSI rates for decubitus ulcer, central venous
catheter bloodstream infection, and postoperative sepsis. A detailed description of the
analyses for each of the four research questions will follow.

104
Descriptive statistics such as mean, median, range, and frequency on the
continuous variable of RN FTEs were calculated, and a frequency distribution was
conducted for categorical variables of teaching status, NPSG, bed size, and location. The
study framework for structural components (hospital characteristics), process components
(patient safety practices), and outcome elements (PSIs) were examined using the
frequency and distribution of the sample and sample characteristics. The association of
the independent variable to the dependent variable was assessed by conducting univariate
and multivariate regression analyses. Logistic regression was performed to identify
variable relationships to model the criterion variables and provide odds ratios to
determine the probability of changes in regressor values.
The data were examined in the following manner: The relationship between
hospital characteristics (teaching status, bed size, geographic location, and nurse staffing
levels) on patient safety practices was examined first using a Mann Whitney U test. Next,
the association of NPSG compliance and its relationship to patient safety outcomes was
evaluated for each PSI using a logistic regression analysis. Finally, the association of
hospital characteristics of teaching status, bed size, geographic location, nurse staffing,
and NPSG compliance with patient outcomes was evaluated using Kruskal-Wallis.
Data Analysis Plan
Research Question 1
Is there a relationship between NPSG compliance and the AHRQ’s PSI risk-
adjusted hospital outcome rates for decubitus ulcer, postoperative sepsis, and central
105
venous catheter bloodstream infection in acute care hospitals accredited by The Joint
Commission?
Aim: To explore whether a relationship exists between the implementation of
NPSGs and differences in the AHRQ’s PSI outcomes. Statistics were used to describe the
characteristics of accredited hospitals that implemented NPSGs, versus those hospitals
that did not implement NPSGs. Mean, median, range, and frequency were identified on
all continuous variables within the study (decubitus ulcer, central venous catheter-related
bloodstream infection, and postoperative sepsis).
Mann-Whitney U tests were conducted to determine whether hospital NPSG-
compliance was associated with select adverse outcomes (PSIs) in accredited acute care
hospitals. A chi square analysis also was performed to explore differences in the groups,
specifically the number and type of PSIs.
Research Question 2
What is the relationship between hospital characteristics and NPSG compliance in
acute care hospitals?
Aim: To describe which acute care hospital organizational
characteristics⎯teaching status, region, location, or bed size⎯are associated with the
implementation of patient safety practices as measured NPSG compliance in accredited
acute care hospitals.
The relationship between the independent variables (bed size, geographic region,
teaching status and location, and RN staffing levels) to the dependent variable (NPSG-
compliance) was explored using univariate and simple logistic regression analyses.

106
Regression was used to develop a model for study variables that were related as follows:
Statistics for the overall model fit, classification table predicting group membership, and
summary of model variables were performed. Chi square statistics were calculated with
levels of significance for the mode, block, and step. The calculation was appropriate as
the resulting model represents the difference between the constant-only and model
generated (Mertler & Vannatta, 2005).
Several statistics⎯B, S.E. Wald, df, Sig., R, Exp(B), and odds ratio 95% CI⎯were
interpreted for each variable. The odds ratio represents the risk increase⎯or decrease if
Exp (B) is less than 1⎯as the predictor variable increases by one unit. Logistic regression
did not require adherence to any assumptions about the distribution of predictor variables
(Tabachnik & Fidell, 2001).
Research Question 3
What is the relationship between hospital characteristics and AHRQ Patient
Safety Indicator outcome rates of decubitus ulcer, postoperative sepsis, and central
venous catheter bloodstream infection in accredited acute care hospitals?
Aim: Explore the relationship between hospital characteristics (bed size, census
region, teaching status and location, RN staffing levels, and NPSGs) and selected AHRQ
PSIs (postoperative sepsis, central venous line bloodstream infection, and decubitus
ulcer). The independent variables included both continuous variables (nurse staffing) and
categorical variables (geographic region, teaching status and location, and bed size). The
AHRQ’s PSIs were treated as the dependent variables (postoperative sepsis, central
venous line bloodstream infection, and decubitus ulcer).
107
The Kruskal-Wallis test was used to conduct this analysis. It is a nonparametric
test used when the assumptions of the ANOVA statistical test are not met for one or more
reasons. The test was used in this research because each group of PSIs was not distributed
normally in the sample, and the variance of the score for each group of interest was not
equal. It assessed significant differences on the continuous dependent variable by
grouping independent variables (with three or more groups). It is considered as an
equivalent to the ANOVA.
Research Question 4
What are the independent predictors of adverse hospital AHRQ PSIs for decubitus
ulcer, postoperative sepsis, and central venous catheter bloodstream infection in
accredited acute care hospitals?
Aim: Identify the independent predictors for AHRQ’s risk-adjusted PSI rates
(decubitus ulcer, postoperative sepsis, and central venous catheter bloodstream infection)
in accredited acute care hospitals associated with hospital characteristics of bed size,
teaching status and location, and RN staffing levels. The independent variables were
hospital characteristics, including RN staffing levels, and the dependent variables were
the three PSIs used for this study. Binary logistic regression was utilized to determine
which combinations of the five independent variables⎯hospital bed size, geographic
region, teaching status and location, RN FTE/1,000 APD days, and NPSG-
compliance⎯predict the probability of occurrence of the selected adverse event PSIs
(decubitus ulcer, central venous line bloodstream infection, and postoperative sepsis).
108
In a multiple regression model such as this, independent categorical variables with
more than two levels were dummy coded to ensure that results were interpretable. These
steps include recoding the categorical variable into a number of separate, dichotomous
variables. Dummy code variable is a variable created to represent an attribute with two or
more distinct categories or levels. Independent variables recoded were as follows:
hospital bed size, geographic region, teaching status and location, and RN staffing level.
Each PSI in this study was used as a dependent variable. They also were dummy coded
into two dichotomous variables. Each PSI dependent variable was divided into two
groups related to the likelihood of having or avoiding a PSI.
Human Subject Protection
The researcher obtained permission for the study through George Mason
University’s Human Subjects Review Board. Because no human subjects were directly
involved in this study, an institutional review board waiver was requested and granted.
This study was exempt from board review because of the use of secondary data and
because analysis of administrative data of all hospitals was de-identified. An HCUP
orientation course was required by the AHRQ prior to the release of the NIS data.
The data use agreement signed with the AHRQ executes the data protections of
the Health Insurance Portability and Accountability Act of 1996 and the AHRQ’s
confidentiality statute. This agreement prohibits any attempt to identify any person’s or
individual organization’s data within the HCUP-NIS database. The AHA and Joint
Commission data were linked to HCUP-NIS using the AHA and HCUP hospital
identifiers. All identifiers were removed from the data file, and random numbers were
109
assigned to the hospitals included in the study. Participating hospitals were not identified
by name for data variables.
The Joint Commission quality data are available to the public through its website,
The Joint Commission Quality Check®, at http://www.jcaho.org. HCUP-NIS and AHA
data are confidential. However, once the data are linked, the data were secured and
protected on a computer and an external hard drive that required an access code. Only the
researcher had access to the database codes and data. Prohibitions on the data agreement
included disclosing the dataset to parties outside of the agreement, and use by any other
party other than the requester and persons who completed the NIS-HCUP training
module. De-identified data printouts were stored in a locked file drawer accessible only
by the researcher.
110
CHAPTER 4: RESULTS
This study examined the relationship among Joint Commission accredited
hospitals, hospital characteristics, and AHRQ’s PSIs to gain a broader understanding of
the possible influence of accreditation and other structural processes on selected adverse
patient outcomes. The results of this study may inform hospital leaders’ knowledge about
the differences in adverse patient outcomes and how hospital structure and process
variables relate to such selected adverse outcomes (PSIs).
This chapter commences with an overview of variable construction and a
description of the population and sample of hospitals as depicted using central tendency
statistics. It includes a description of data notes for the study database and discloses the
results of the statistical analysis for each of the four research questions. The chapter
concludes with a summary of key findings.
Descriptive Analysis
This section presents descriptive statistics from the study. The study sample was
derived from the 2011 HCUP-NIS, a survey of U.S. hospitals that included 1,049
hospitals and more than 8 million inpatient discharge records. The inclusion criteria
yielded 1,737,242 inpatient discharge records from 149 hospitals in 28 states for this
study sample.
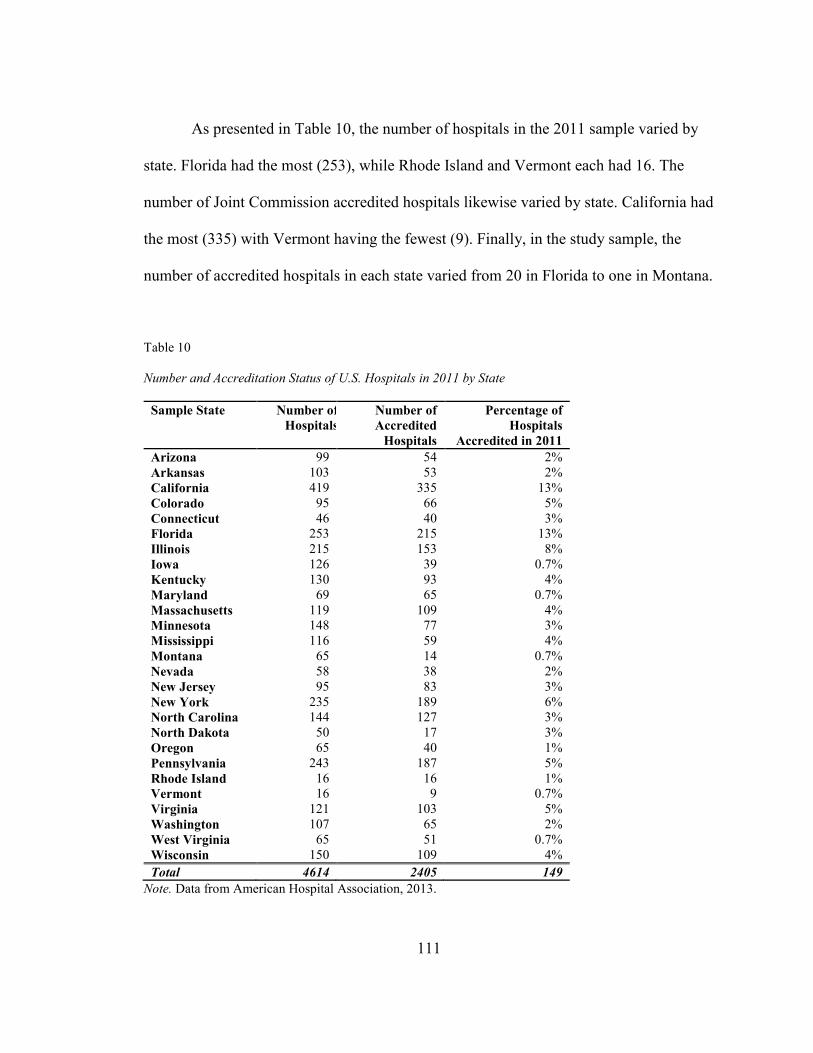
111
As presented in Table 10, the number of hospitals in the 2011 sample varied by
state. Florida had the most (253), while Rhode Island and Vermont each had 16. The
number of Joint Commission accredited hospitals likewise varied by state. California had
the most (335) with Vermont having the fewest (9). Finally, in the study sample, the
number of accredited hospitals in each state varied from 20 in Florida to one in Montana.
Table 10
Number and Accreditation Status of U.S. Hospitals in 2011 by State
Sample State
Number of
Hospitals
Number of
Accredited
Hospitals
Percentage of
Hospitals
Accredited in 2011
Arizona 99 54 2%
Arkansas 103 53 2%
California 419 335 13%
Colorado 95 66 5%
Connecticut 46 40 3%
Florida 253 215 13%
Illinois 215 153 8%
Iowa 126 39 0.7%
Kentucky 130 93 4%
Maryland 69 65 0.7%
Massachusetts 119 109 4%
Minnesota 148 77 3%
Mississippi 116 59 4%
Montana 65 14 0.7%
Nevada 58 38 2%
New Jersey 95 83 3%
New York 235 189 6%
North Carolina 144 127 3%
North Dakota 50 17 3%
Oregon 65 40 1%
Pennsylvania 243 187 5%
Rhode Island 16 16 1%
Vermont 16 9 0.7%
Virginia 121 103 5%
Washington 107 65 2%
West Virginia 65 51 0.7%
Wisconsin 150 109 4%
Total 4614 2405 149
Note. Data from American Hospital Association, 2013.

112
The demographic characteristics of hospitals that were of interest to this
investigator were the type of hospital, geographic location, teaching status, and size.
Table 11 presents the demographics of hospitals in the study sample (n = 149).
Table 11
Distribution of Hospitals by Region, Size, Teaching Status, and Location
Characteristic
Category Frequency (n
= 149)
Percentage
Region
1-Northeast 2-Midwest 3-South 4-West
34 24 49 42
22.8% 16.1% 32.9% 28.2%
Bed Size
1-Small 2-Medium 3-Large
51 38 60
34.2% 25.5% 40.3%
Teaching Status
and Location
1-Rural 2-Urban nonteaching 3-Urban teaching
40 74 35
26.8% 49.7% 23.5%
NPSG
No Yes
20 129
13.4% 85.9%
Note: Healthcare Cost and Utilization Project National Inpatient Sample 2011
database and The Joint Commission Quality Check® data.
Table 12 presents a listing of the 28 HCUP-participating states by region.
Table 12
Healthcare Cost and Utilization Project-Participating Hospitals by States
and Region
Region States
Northeast Connecticut, Maine, Massachusetts, New Jersey, New York, Rhode Island, Vermont, Pennsylvania
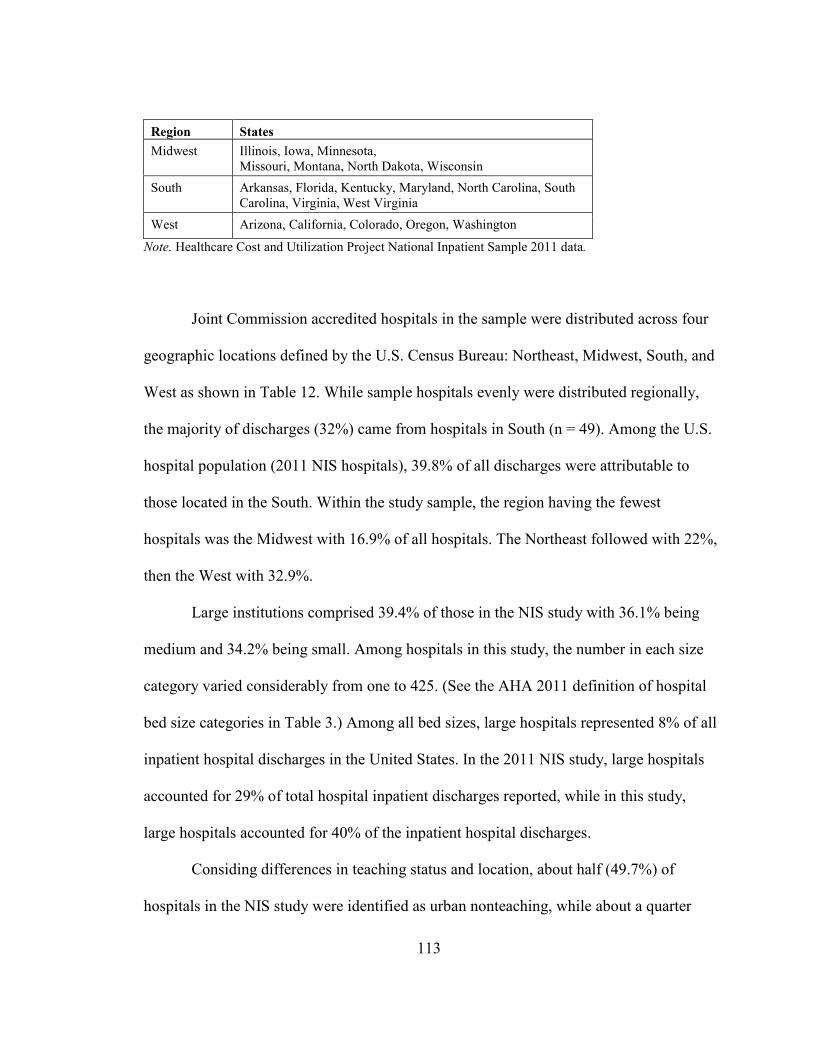
113
Region States
Midwest Illinois, Iowa, Minnesota, Missouri, Montana, North Dakota, Wisconsin
South Arkansas, Florida, Kentucky, Maryland, North Carolina, South Carolina, Virginia, West Virginia
West Arizona, California, Colorado, Oregon, Washington
Note. Healthcare Cost and Utilization Project National Inpatient Sample 2011 data.
Joint Commission accredited hospitals in the sample were distributed across four
geographic locations defined by the U.S. Census Bureau: Northeast, Midwest, South, and
West as shown in Table 12. While sample hospitals evenly were distributed regionally,
the majority of discharges (32%) came from hospitals in South (n = 49). Among the U.S.
hospital population (2011 NIS hospitals), 39.8% of all discharges were attributable to
those located in the South. Within the study sample, the region having the fewest
hospitals was the Midwest with 16.9% of all hospitals. The Northeast followed with 22%,
then the West with 32.9%.
Large institutions comprised 39.4% of those in the NIS study with 36.1% being
medium and 34.2% being small. Among hospitals in this study, the number in each size
category varied considerably from one to 425. (See the AHA 2011 definition of hospital
bed size categories in Table 3.) Among all bed sizes, large hospitals represented 8% of all
inpatient hospital discharges in the United States. In the 2011 NIS study, large hospitals
accounted for 29% of total hospital inpatient discharges reported, while in this study,
large hospitals accounted for 40% of the inpatient hospital discharges.
Considing differences in teaching status and location, about half (49.7%) of
hospitals in the NIS study were identified as urban nonteaching, while about a quarter
114
(24.5%) were classified as urban teaching and another quarter (25.8%) were rural.
Inpatient hospital discharges were distributed evenly between hospitals classified as rural
and urban teaching. Approximately half of hospital inpatient discharges from the study
sample were attributable to nonteaching facilities in urban areas. This finding is
comparable to the 2011 NIS hospital population that had a similar distribution. Urban
nonteaching hospitals accounted for 43% of discharges in the 2011 NIS population and
49.7% of discharges in the study sample. Joint Commission accredited urban hospitals
accounted for 64% of all hospitals in the sample, and 54% were classified further as
nonteaching.
A greater concentration of large hospitals (n = 60) and those classified as urban
nonteaching (n = 74) were located in the South (n = 49). They accounted for the largest
number of hospital inpatient discharges in the study sample. Among 2011 NIS hospitals,
fewer were classified as large hospitals and more classified as small. Hospitals with the
fewest number of inpatient discharges in the sample were reported among medium-size
facilities (n = 38) and urban teaching hospitals (n = 35) located in the Midwest. Table 11
presents the distribution of hospitals in the study sample (n = 149) by the demographic
characteristics of interest to this study.
There were 149 Joint Commission sample hospitals accredited in 2011. Hospitals
surveyed by The Joint Commission comprised 33% of the 1,049 NIS hospitals in 2011.
About 85% of Joint Commission accredited hospitals were NPSG-compliant. Among
Joint Commission hospitals in the study sample, 13% did not meet NPSGs.
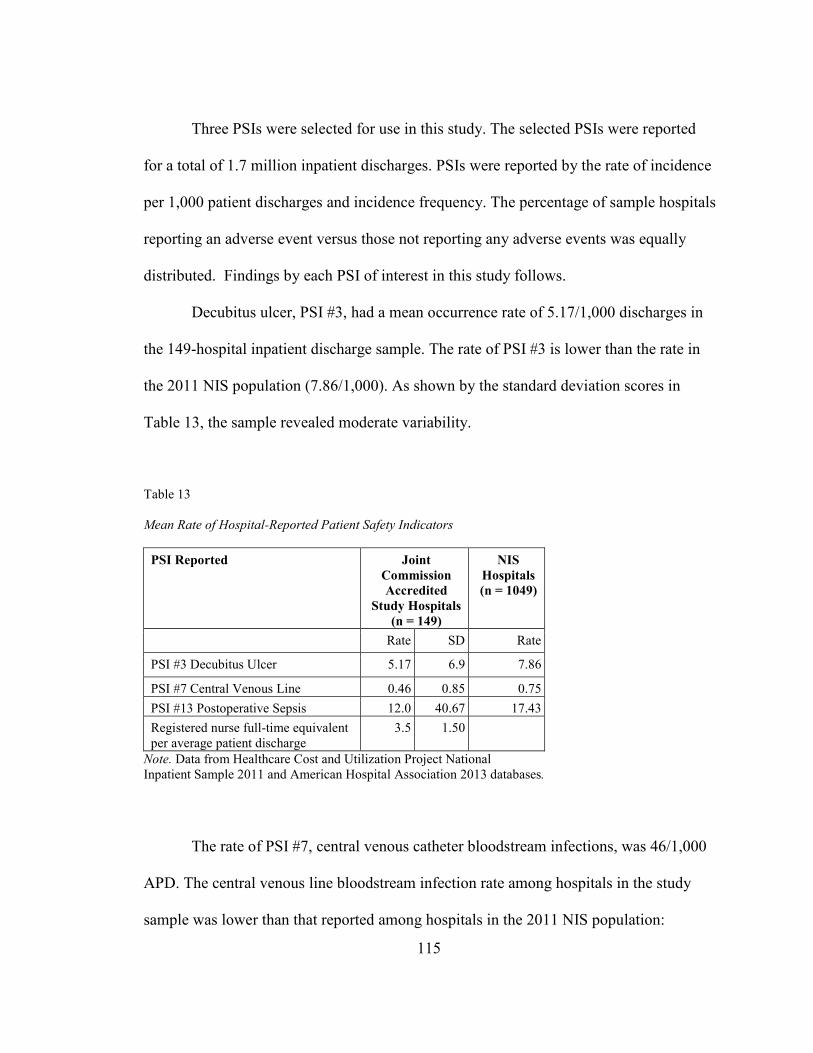
115
Three PSIs were selected for use in this study. The selected PSIs were reported
for a total of 1.7 million inpatient discharges. PSIs were reported by the rate of incidence
per 1,000 patient discharges and incidence frequency. The percentage of sample hospitals
reporting an adverse event versus those not reporting any adverse events was equally
distributed. Findings by each PSI of interest in this study follows.
Decubitus ulcer, PSI #3, had a mean occurrence rate of 5.17/1,000 discharges in
the 149-hospital inpatient discharge sample. The rate of PSI #3 is lower than the rate in
the 2011 NIS population (7.86/1,000). As shown by the standard deviation scores in
Table 13, the sample revealed moderate variability.
Table 13
Mean Rate of Hospital-Reported Patient Safety Indicators
PSI Reported Joint
Commission
Accredited
Study Hospitals
(n = 149)
NIS
Hospitals
(n = 1049)
Rate SD Rate
PSI #3 Decubitus Ulcer 5.17 6.9 7.86
PSI #7 Central Venous Line 0.46 0.85 0.75
PSI #13 Postoperative Sepsis 12.0 40.67 17.43
Registered nurse full-time equivalent per average patient discharge
3.5 1.50
Note. Data from Healthcare Cost and Utilization Project National Inpatient Sample 2011 and American Hospital Association 2013 databases.
The rate of PSI #7, central venous catheter bloodstream infections, was 46/1,000
APD. The central venous line bloodstream infection rate among hospitals in the study
sample was lower than that reported among hospitals in the 2011 NIS population:
116
0.75/1,000 discharges compared with PSI #7. Little variation was revealed between
study-sample hospitals and the population of NIS hospitals for this indicator. This is
reflected in the frequencies of hospital-reported PSIs in Table 14. While central venous
line bloodstream infection was reported by 59% of study hospitals, it had the highest rate
of occurrence. However, central venous line bloodstream infections accounted for the
lowest observed rate among the three, inpatient PSI outcomes.
PSI #13, postoperative sepsis, had an observed rate of 12/1,000 APD in the study
hospitals. This rate was the highest among studied PSIs as shown in Table 14. The
observed rate of postoperative sepsis was lower than that reported by 2011 NIS hospitals,
which was 17.43/1,000 discharges. Postoperative sepsis had the largest variability in the
sample (standard deviation of 40.67) as depicted in Table 14. Postoperative sepsis, PSI
#13, accounted for one of the lowest frequencies of adverse outcomes among the three
PSIs analyzed in this study.
Findings Reported by Research Questions
The results of the data analysis reported in this section are organized according to
the research questions. This exploratory, descriptive research project utilized quantitative
methods to analyze the relationship between select adverse patient outcomes and hospital
characteristic predictor variables.
Research Question 1
To identify and describe the relationship between NPSGs and risk-adjusted PSI
outcome rates (postoperative sepsis, decubitus ulcer, and central venous catheter
bloodstream infection).
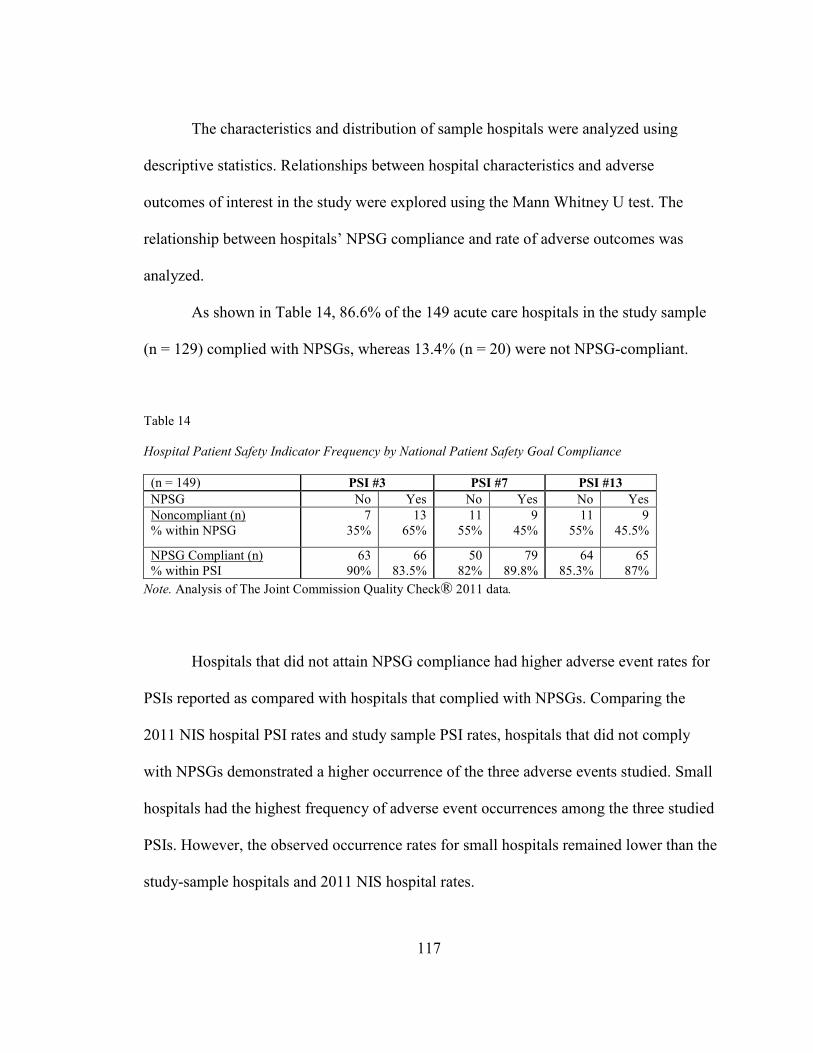
117
The characteristics and distribution of sample hospitals were analyzed using
descriptive statistics. Relationships between hospital characteristics and adverse
outcomes of interest in the study were explored using the Mann Whitney U test. The
relationship between hospitals’ NPSG compliance and rate of adverse outcomes was
analyzed.
As shown in Table 14, 86.6% of the 149 acute care hospitals in the study sample
(n = 129) complied with NPSGs, whereas 13.4% (n = 20) were not NPSG-compliant.
Table 14
Hospital Patient Safety Indicator Frequency by National Patient Safety Goal Compliance
(n = 149) PSI #3 PSI #7 PSI #13
NPSG No Yes No Yes No Yes
Noncompliant (n) % within NPSG
7 35%
13 65%
11 55%
9 45%
11 55%
9 45.5%
NPSG Compliant (n) % within PSI
63 90%
66 83.5%
50 82%
79 89.8%
64 85.3%
65 87%
Note. Analysis of The Joint Commission Quality Check® 2011 data.
Hospitals that did not attain NPSG compliance had higher adverse event rates for
PSIs reported as compared with hospitals that complied with NPSGs. Comparing the
2011 NIS hospital PSI rates and study sample PSI rates, hospitals that did not comply
with NPSGs demonstrated a higher occurrence of the three adverse events studied. Small
hospitals had the highest frequency of adverse event occurrences among the three studied
PSIs. However, the observed occurrence rates for small hospitals remained lower than the
study-sample hospitals and 2011 NIS hospital rates.

118
Among hospitals that attained compliance with NPSGs, the incidence of
occurrence was similar within all three PSIs. Overall rates of occurrence of adverse
events for the selected PSIs in hospitals that complied with NPSGs were lower for two of
three PSIs compared with the hospital sample and 2011 NIS rates. The study next
analyzed PSI occurrence in U.S. hospitals by hospital characteristics as shown in Table
15. It begins with an examination of geographic location.
Table 15
Patient Safety Indicator Rates by National Patient Safety Goal Compliance for Sample
Hospitals Studied
(n = 149) PSI #3 Rate PSI #7 Rate PSI #13 Rate
Study Sample Rate 5.17 .46 12.0
NPSG compliance No Yes No Yes No Yes
Rate/1000 discharges 36.77 8.16 .487 .259 5.87 5.07
Bed Size
Small 5.49 3.77 .183 .51 16.0 4.8
Medium 7.36 4.49 .176 .44 37.27 9.83
Large 6.51 5.50 .311 .496 9.9 10.26
Region
Northeast 5.02 4.88 .180 .418 8.93 7.32
Midwest 10.76 2.89 .676 .335 8.8 5.74
South 8.63 7.48 .222 .744 73.85 10.94
West 2.60 2.20 .150 .338 27.04 7.02
Teaching
Status/Location
Rural 5.87 1.05 .211 .177 22.0 2.59
Urban Nonteaching 7.23 5.60 .375 .646 67.0 9.15
Urban Teaching 7.60 1.10 .110 .444 11.05 1.34
Note. Analysis of Healthcare Cost and Utilization Project National Inpatient Sample 2011 data.
NIS hospitals located in the North, Midwest, and West that attained compliance
with NPSGs had lower rates of adverse outcomes than did hospitals in the study sample.
NIS hospitals located in the South that attained NPSG compliance had higher PSI rates
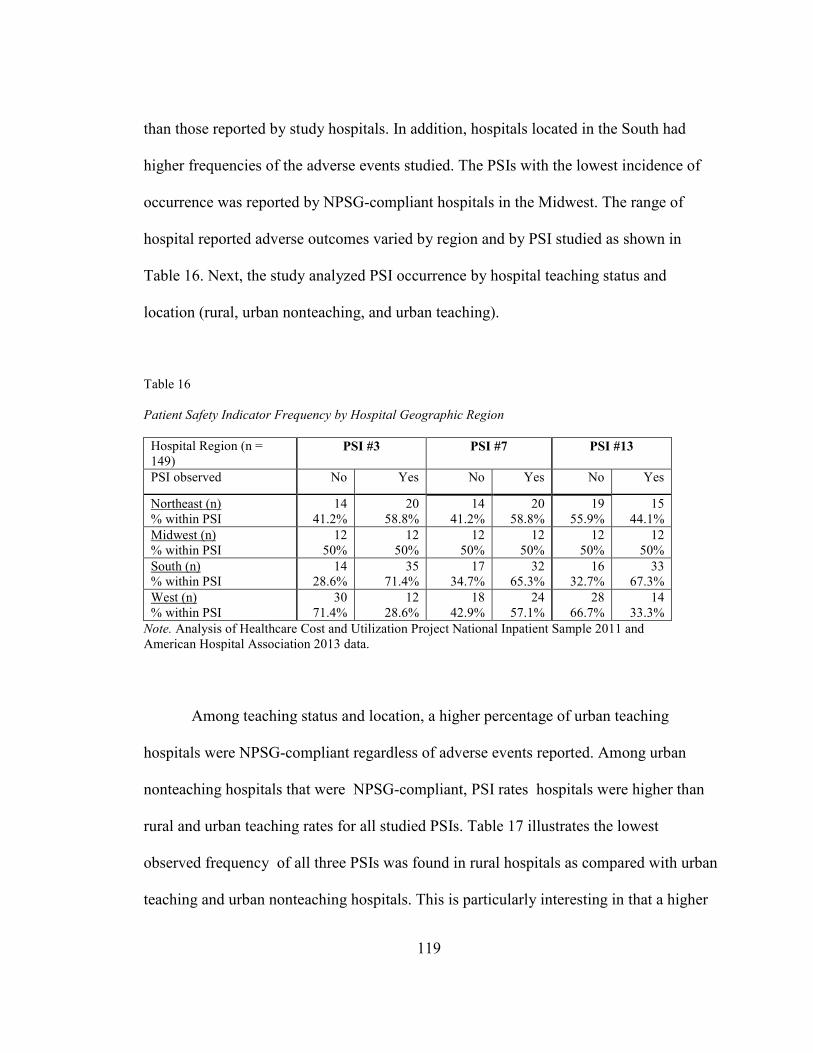
119
than those reported by study hospitals. In addition, hospitals located in the South had
higher frequencies of the adverse events studied. The PSIs with the lowest incidence of
occurrence was reported by NPSG-compliant hospitals in the Midwest. The range of
hospital reported adverse outcomes varied by region and by PSI studied as shown in
Table 16. Next, the study analyzed PSI occurrence by hospital teaching status and
location (rural, urban nonteaching, and urban teaching).
Table 16
Patient Safety Indicator Frequency by Hospital Geographic Region
Hospital Region (n = 149)
PSI #3 PSI #7 PSI #13
PSI observed No Yes No Yes No Yes
Northeast (n) % within PSI
14 41.2%
20 58.8%
14 41.2%
20 58.8%
19 55.9%
15 44.1%
Midwest (n) % within PSI
12 50%
12 50%
12 50%
12 50%
12 50%
12 50%
South (n) % within PSI
14 28.6%
35 71.4%
17 34.7%
32 65.3%
16 32.7%
33 67.3%
West (n) % within PSI
30 71.4%
12 28.6%
18 42.9%
24 57.1%
28 66.7%
14 33.3%
Note. Analysis of Healthcare Cost and Utilization Project National Inpatient Sample 2011 and American Hospital Association 2013 data.
Among teaching status and location, a higher percentage of urban teaching
hospitals were NPSG-compliant regardless of adverse events reported. Among urban
nonteaching hospitals that were NPSG-compliant, PSI rates hospitals were higher than
rural and urban teaching rates for all studied PSIs. Table 17 illustrates the lowest
observed frequency of all three PSIs was found in rural hospitals as compared with urban
teaching and urban nonteaching hospitals. This is particularly interesting in that a higher
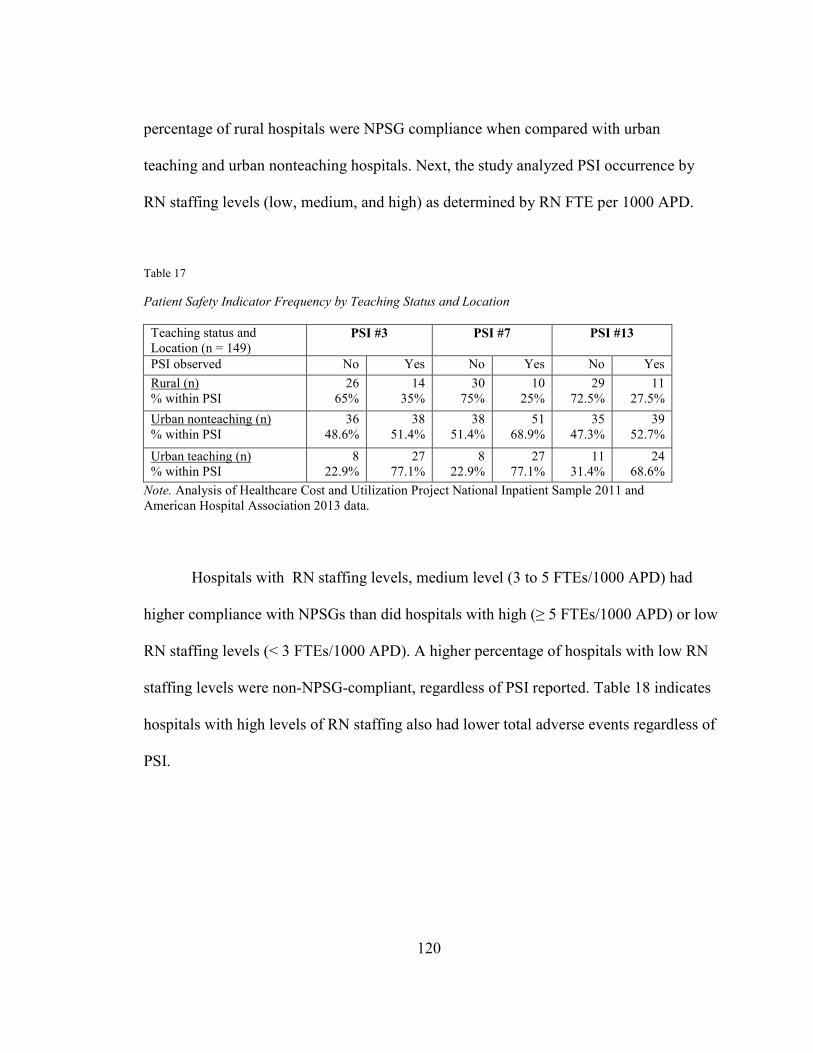
120
percentage of rural hospitals were NPSG compliance when compared with urban
teaching and urban nonteaching hospitals. Next, the study analyzed PSI occurrence by
RN staffing levels (low, medium, and high) as determined by RN FTE per 1000 APD.
Table 17
Patient Safety Indicator Frequency by Teaching Status and Location
Teaching status and Location (n = 149)
PSI #3 PSI #7 PSI #13
PSI observed No Yes No Yes No Yes
Rural (n) % within PSI
26 65%
14 35%
30 75%
10 25%
29 72.5%
11 27.5%
Urban nonteaching (n) % within PSI
36 48.6%
38 51.4%
38 51.4%
51 68.9%
35 47.3%
39 52.7%
Urban teaching (n) % within PSI
8 22.9%
27 77.1%
8 22.9%
27 77.1%
11 31.4%
24 68.6%
Note. Analysis of Healthcare Cost and Utilization Project National Inpatient Sample 2011 and American Hospital Association 2013 data.
Hospitals with RN staffing levels, medium level (3 to 5 FTEs/1000 APD) had
higher compliance with NPSGs than did hospitals with high (≥ 5 FTEs/1000 APD) or low
RN staffing levels (< 3 FTEs/1000 APD). A higher percentage of hospitals with low RN
staffing levels were non-NPSG-compliant, regardless of PSI reported. Table 18 indicates
hospitals with high levels of RN staffing also had lower total adverse events regardless of
PSI.
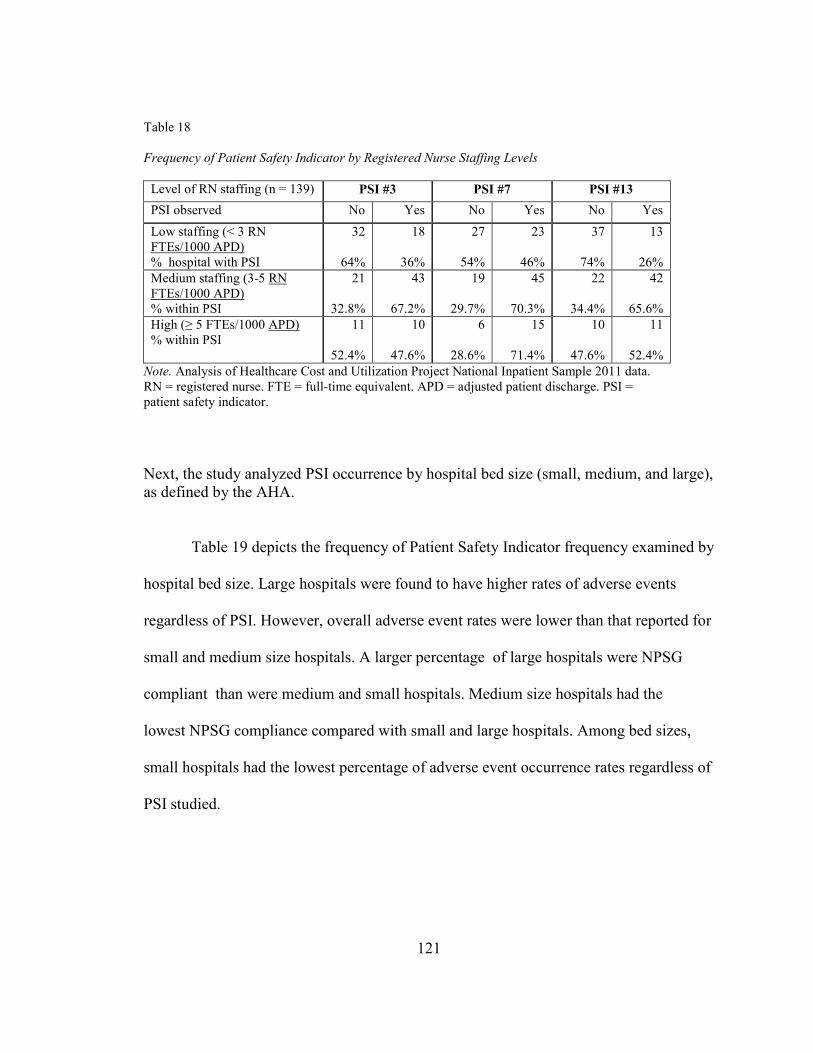
121
Table 18
Frequency of Patient Safety Indicator by Registered Nurse Staffing Levels
Level of RN staffing (n = 139) PSI #3 PSI #7 PSI #13
PSI observed No Yes No Yes No Yes
Low staffing (< 3 RN FTEs/1000 APD) % hospital with PSI
32
64%
18
36%
27
54%
23
46%
37
74%
13
26%
Medium staffing (3-5 RN FTEs/1000 APD) % within PSI
21
32.8%
43
67.2%
19
29.7%
45
70.3%
22
34.4%
42
65.6%
High (≥ 5 FTEs/1000 APD) % within PSI
11
52.4%
10
47.6%
6
28.6%
15
71.4%
10
47.6%
11
52.4%
Note. Analysis of Healthcare Cost and Utilization Project National Inpatient Sample 2011 data. RN = registered nurse. FTE = full-time equivalent. APD = adjusted patient discharge. PSI = patient safety indicator.
Next, the study analyzed PSI occurrence by hospital bed size (small, medium, and large), as defined by the AHA. Table 19 depicts the frequency of Patient Safety Indicator frequency examined by
hospital bed size. Large hospitals were found to have higher rates of adverse events
regardless of PSI. However, overall adverse event rates were lower than that reported for
small and medium size hospitals. A larger percentage of large hospitals were NPSG
compliant than were medium and small hospitals. Medium size hospitals had the
lowest NPSG compliance compared with small and large hospitals. Among bed sizes,
small hospitals had the lowest percentage of adverse event occurrence rates regardless of
PSI studied.

122
Table 19
Patient Safety Indicator Frequency by Hospital Bed Size
Hospital by bed size (n = 149)
PSI #3 PSI #7 PSI #13
PSI observed No Yes No Yes No Yes
Small hospital % with PSI
35 68.6%
16 31.4%
33 64.7%
18 35.3%
38 74.5%
13 25.5%
Medium hospital % with PSI
19 50%
19 50%
13 34.2%
25 65.8%
20 52.6%
18 47.4%
Large hospital % with PSI
16 26.7%
44 73.3%
15 25%
45 75%
17 28.3%
43 71.7%
Note. Analysis of Healthcare Cost and Utilization Project National Inpatient Sample 2011 and American Hospital Association study data.
This section covers hospital reported adverse events by selected PSIs (decubitus
ulcer, central venous catheter bloodstream infection, and postoperative sepsis). Among
NPSG-compliant hospitals in the study sample, the rates of each reported PSIs varied.
The rate of decubitus ulcer (M = 8.16/1000 APD) were higher in the 2011 NIS
population than were found in the study’s sample. Large hospitals’ adverse event rates for
decubitus ulcer (M = 5.50/1000 APD) were higher than both the 2011 NIS population
and the study’s sample. The decubitus ulcer rates in small and medium hospitals were
lower than that reported for the 2011 NIS population hospitals (7.86/1000 APD). The rate
observed for PSI #3 was lower than that found in sample hospitals (NPSG-compliant and
noncompliant). The risk-adjusted rate for decubitus ulcer in hospitals that were not
NPSG-compliant was higher (M = 5.87/1000 APD) than was found in the sample for
decubitus ulcer. It was not however as high as the 2011 NIS population rate of 7.86/1000
APD. For NPSG-compliant hospitals in the South, higher rates of decubitus ulcer
(7.48/1000 APD) were found, as compared to that reported for hospitals in the sample

123
(5.12/1000 APD). Hospitals with RN staffing levels classified as high (≥ 5.0 FTE/1000
APD) experienced the highest rates of decubitus ulcer.
Central venous catheter bloodstream risk-adjusted infection rates were low for
both NPSG compliant and noncompliant hospitals in the NIS population. Both groups
had a rate that was lower than reported by hospitals in the sample (rate of .46/1000
discharges).
The risk-adjusted postoperative sepsis rate for NPSG-compliant hospitals was
5.07/1000 discharges. This rate was lower than both the observed rate in the hospital
study sample (12.00/1000 APD) and the 2011 NIS (17.43/1000 APD). However, the
mean rate of postoperative sepsis in non-NPSG-compliant hospitals was higher
(36.77/1000 APD). NPSG compliant large hospitals and those located in the South had
higher postoperative sepsis rates. Conversely, their sepsis rate was lower than that found
in both the hospital study sample and the 2011 NIS population. Postoperative sepsis had
the highest mean rate among all three PSIs studied.
The frequency and presence of each adverse event were analyzed for all study
sample hospitals. Over 38% of the hospitals in the study sample (n = 149) reported all
three PSIs studied. Of the hospitals in the study, only 14% had two-PSI adverse events,
whereas 23.4% reported one adverse event. Further, 25% of the hospitals in the study
sample did not report any adverse event. Of the sample hospitals that reported two PSIs,
more than 40% included a central venous catheter-related bloodstream infection event.
Central venous catheter-related bloodstream infection was the most the frequent adverse
event reported among the PSIs studied, yet these adverse event rates were the lowest per
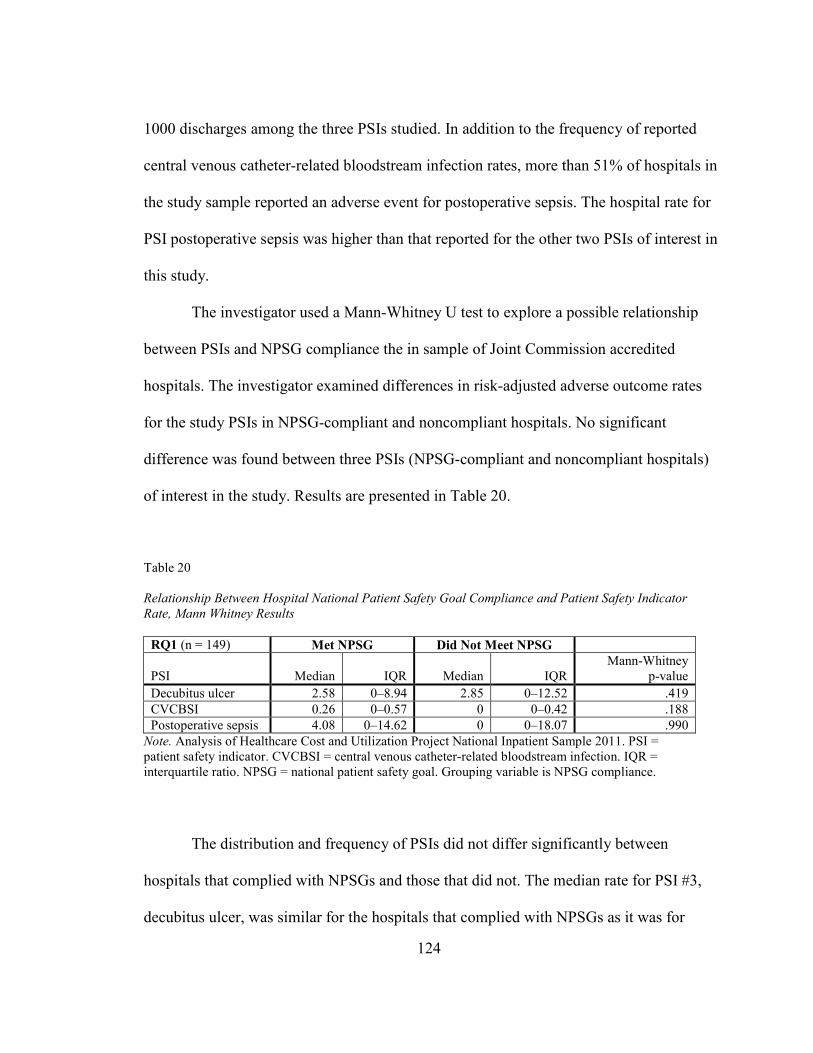
124
1000 discharges among the three PSIs studied. In addition to the frequency of reported
central venous catheter-related bloodstream infection rates, more than 51% of hospitals in
the study sample reported an adverse event for postoperative sepsis. The hospital rate for
PSI postoperative sepsis was higher than that reported for the other two PSIs of interest in
this study.
The investigator used a Mann-Whitney U test to explore a possible relationship
between PSIs and NPSG compliance the in sample of Joint Commission accredited
hospitals. The investigator examined differences in risk-adjusted adverse outcome rates
for the study PSIs in NPSG-compliant and noncompliant hospitals. No significant
difference was found between three PSIs (NPSG-compliant and noncompliant hospitals)
of interest in the study. Results are presented in Table 20.
Table 20
Relationship Between Hospital National Patient Safety Goal Compliance and Patient Safety Indicator
Rate, Mann Whitney Results
RQ1 (n = 149) Met NPSG Did Not Meet NPSG
PSI Median IQR Median IQR Mann-Whitney
p-value
Decubitus ulcer 2.58 0–8.94 2.85 0–12.52 .419
CVCBSI 0.26 0–0.57 0 0–0.42 .188
Postoperative sepsis 4.08 0–14.62 0 0–18.07 .990
Note. Analysis of Healthcare Cost and Utilization Project National Inpatient Sample 2011. PSI = patient safety indicator. CVCBSI = central venous catheter-related bloodstream infection. IQR = interquartile ratio. NPSG = national patient safety goal. Grouping variable is NPSG compliance.
The distribution and frequency of PSIs did not differ significantly between
hospitals that complied with NPSGs and those that did not. The median rate for PSI #3,
decubitus ulcer, was similar for the hospitals that complied with NPSGs as it was for
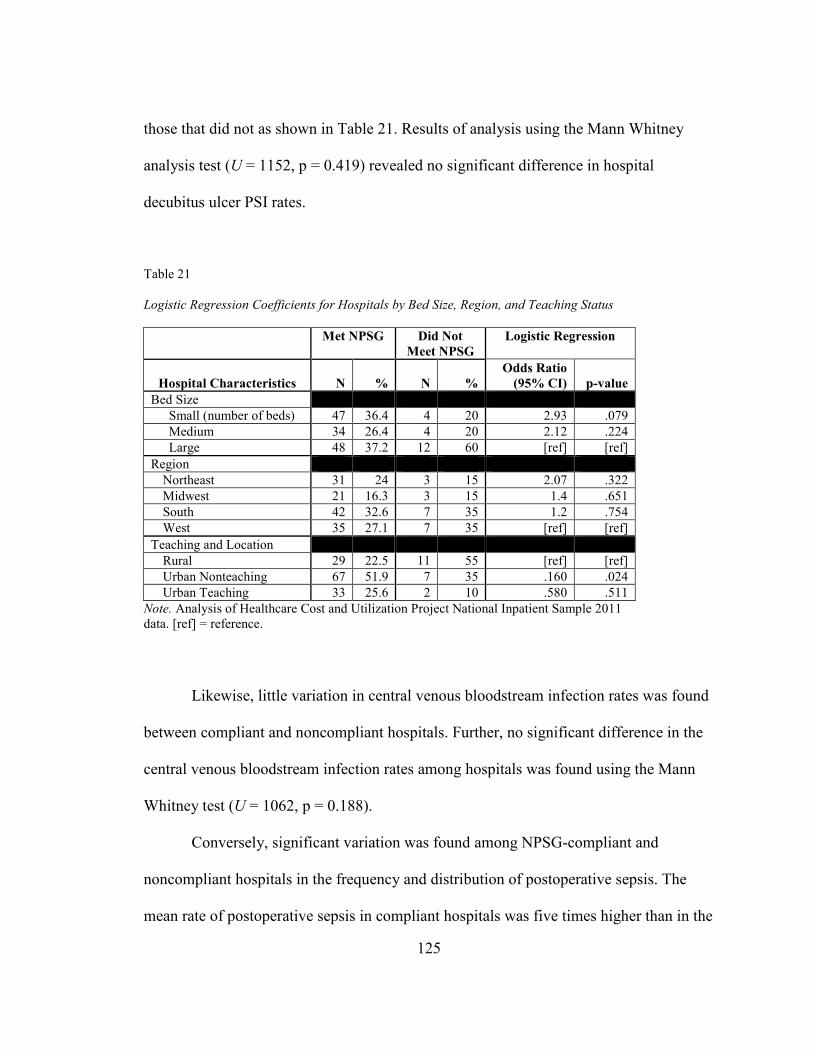
125
those that did not as shown in Table 21. Results of analysis using the Mann Whitney
analysis test (U = 1152, p = 0.419) revealed no significant difference in hospital
decubitus ulcer PSI rates.
Table 21 Logistic Regression Coefficients for Hospitals by Bed Size, Region, and Teaching Status
Met NPSG Did Not
Meet NPSG
Logistic Regression
Hospital Characteristics N % N %
Odds Ratio
(95% CI)
p-value
Bed Size
Small (number of beds) 47 36.4 4 20 2.93 .079
Medium 34 26.4 4 20 2.12 .224
Large 48 37.2 12 60 [ref] [ref]
Region
Northeast 31 24 3 15 2.07 .322
Midwest 21 16.3 3 15 1.4 .651
South 42 32.6 7 35 1.2 .754
West 35 27.1 7 35 [ref] [ref]
Teaching and Location
Rural 29 22.5 11 55 [ref] [ref]
Urban Nonteaching 67 51.9 7 35 .160 .024
Urban Teaching 33 25.6 2 10 .580 .511
Note. Analysis of Healthcare Cost and Utilization Project National Inpatient Sample 2011 data. [ref] = reference.
Likewise, little variation in central venous bloodstream infection rates was found
between compliant and noncompliant hospitals. Further, no significant difference in the
central venous bloodstream infection rates among hospitals was found using the Mann
Whitney test (U = 1062, p = 0.188).
Conversely, significant variation was found among NPSG-compliant and
noncompliant hospitals in the frequency and distribution of postoperative sepsis. The
mean rate of postoperative sepsis in compliant hospitals was five times higher than in the

126
noncompliant institutions. However, the Mann Whitney results indicated no significant
difference in the postoperative sepsis rate (U = 1288, p = 0.99) in the two groups.
Research Question 2
To identify and describe the relationship between hospital characteristics and
compliance with NPSGs.
Descriptive statistics and logistic regression was used to explore whether hospital system
characteristics were related to hospital adoption of patient safety practices and adverse
outcomes. The majority of hospitals in the study sample (n=149), 86.5%, were NPSG-
compliant (n= 129).
Hospitals NPSG compliance based on bed size (small = 36.4%, medium = 26.4%,
and large = 37.2%) were evenly distributed. However, hospitals that did not meet NPSGs
were more likely to be large (60%). Considering hospital location, Table 22 shows that
hospitals that met NPSGs were distributed evenly across three geographic regions with
the smallest proportion of the sample found in the Midwest (16.3%). The South and West
had larger numbers of hospitals with NPSG compliance equally distributed at 35% for
each of the two. The two groups differed on teaching status and location. More than half
of NPSG-compliant hospitals were located in urban nonteaching facilities (51.9%), and
most of the hospitals that did not meet NPSGs were found to be rural facilities (55%).
Bed size and geographic region did not predict whether hospitals would be more
likely to meet NPSG compliance. Teaching status and location were, however, significant
predictors of whether a hospital would meet NPSGs. Hospitals classified as urban
teaching (p = .024) were virtually no less likely to meet NPSG compliance than rural
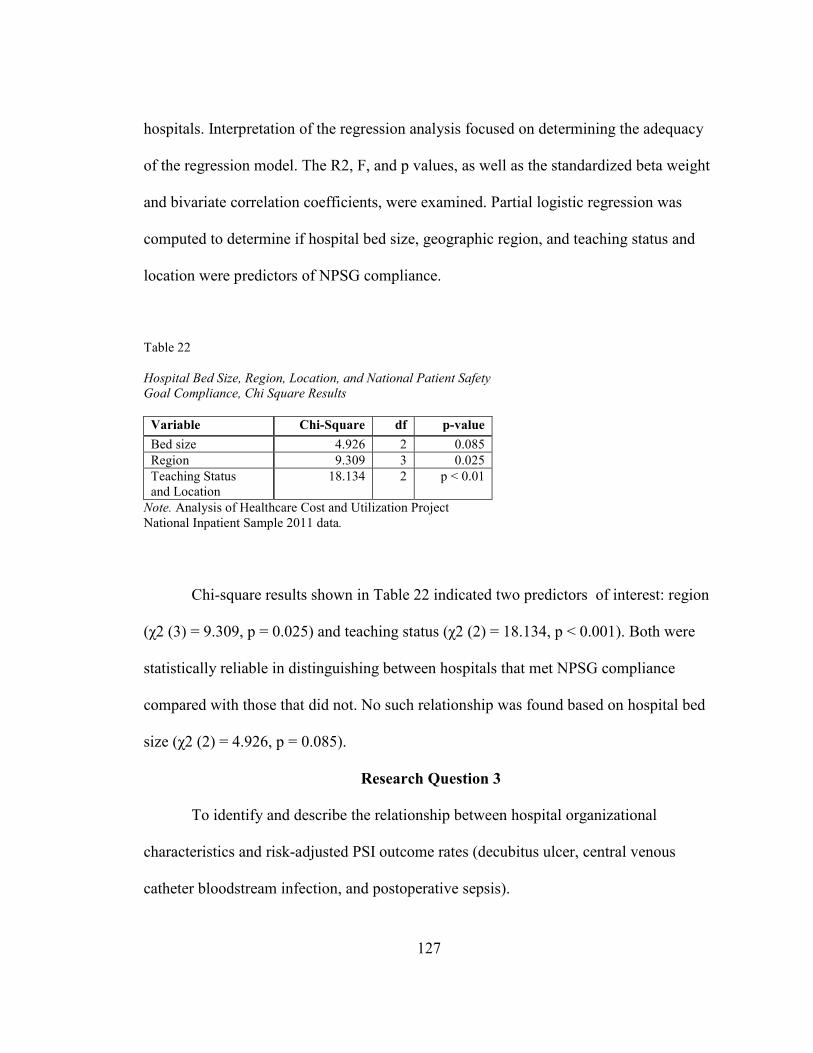
127
hospitals. Interpretation of the regression analysis focused on determining the adequacy
of the regression model. The R2, F, and p values, as well as the standardized beta weight
and bivariate correlation coefficients, were examined. Partial logistic regression was
computed to determine if hospital bed size, geographic region, and teaching status and
location were predictors of NPSG compliance.
Table 22
Hospital Bed Size, Region, Location, and National Patient Safety
Goal Compliance, Chi Square Results
Variable Chi-Square df p-value
Bed size 4.926 2 0.085
Region 9.309 3 0.025
Teaching Status and Location
18.134 2 p < 0.01
Note. Analysis of Healthcare Cost and Utilization Project National Inpatient Sample 2011 data.
Chi-square results shown in Table 22 indicated two predictors of interest: region
(χ2 (3) = 9.309, p = 0.025) and teaching status (χ2 (2) = 18.134, p < 0.001). Both were
statistically reliable in distinguishing between hospitals that met NPSG compliance
compared with those that did not. No such relationship was found based on hospital bed
size (χ2 (2) = 4.926, p = 0.085).
Research Question 3
To identify and describe the relationship between hospital organizational
characteristics and risk-adjusted PSI outcome rates (decubitus ulcer, central venous
catheter bloodstream infection, and postoperative sepsis).
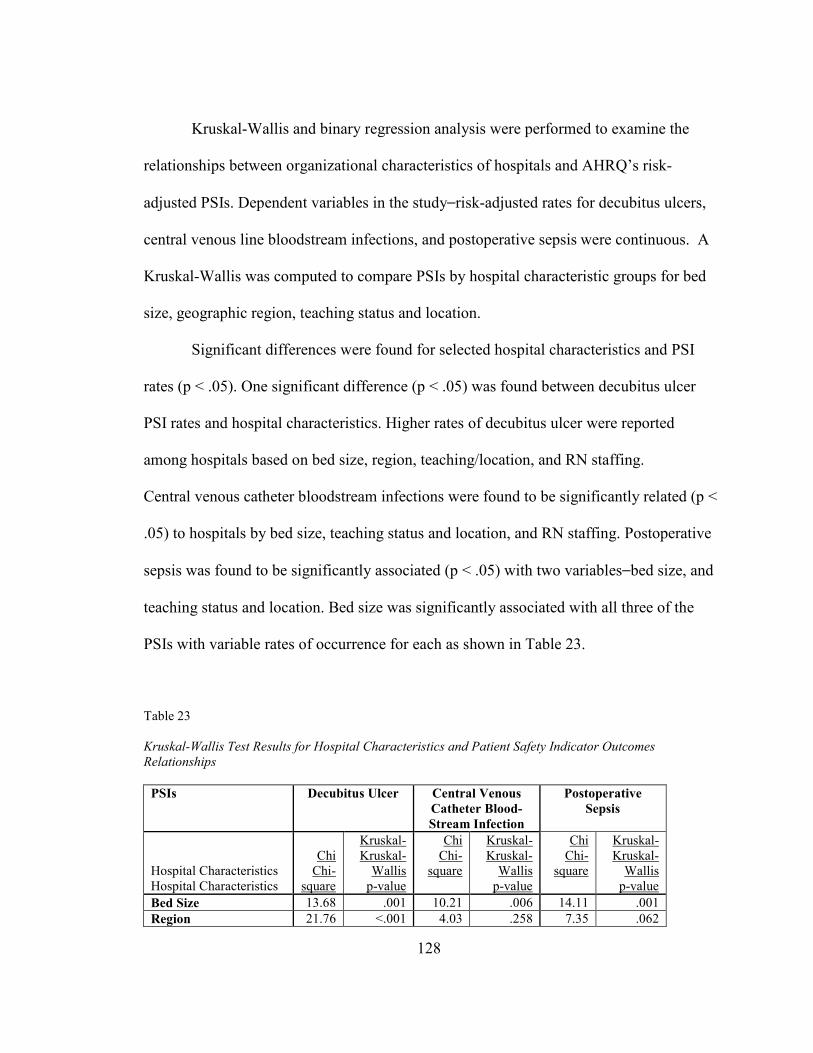
128
Kruskal-Wallis and binary regression analysis were performed to examine the
relationships between organizational characteristics of hospitals and AHRQ’s risk-
adjusted PSIs. Dependent variables in the study⎯risk-adjusted rates for decubitus ulcers,
central venous line bloodstream infections, and postoperative sepsis were continuous. A
Kruskal-Wallis was computed to compare PSIs by hospital characteristic groups for bed
size, geographic region, teaching status and location.
Significant differences were found for selected hospital characteristics and PSI
rates (p < .05). One significant difference (p < .05) was found between decubitus ulcer
PSI rates and hospital characteristics. Higher rates of decubitus ulcer were reported
among hospitals based on bed size, region, teaching/location, and RN staffing.
Central venous catheter bloodstream infections were found to be significantly related (p <
.05) to hospitals by bed size, teaching status and location, and RN staffing. Postoperative
sepsis was found to be significantly associated (p < .05) with two variables⎯bed size, and
teaching status and location. Bed size was significantly associated with all three of the
PSIs with variable rates of occurrence for each as shown in Table 23.
Table 23
Kruskal-Wallis Test Results for Hospital Characteristics and Patient Safety Indicator Outcomes
Relationships
PSIs Decubitus Ulcer Central Venous
Catheter Blood-
Stream Infection
Postoperative
Sepsis
Hospital Characteristics Hospital Characteristics
Chi Chi-
square
Kruskal-Kruskal-
Wallis p-value
Chi Chi-
square
Kruskal- Kruskal-
Wallis p-value
Chi Chi-
square
Kruskal- Kruskal-
Wallis p-value
Bed Size 13.68 .001 10.21 .006 14.11 .001
Region 21.76 <.001 4.03 .258 7.35 .062

129
PSIs Decubitus Ulcer Central Venous
Catheter Blood-
Stream Infection
Postoperative
Sepsis
Teaching and Location 14.37 .001 20.64 <.001 8.37 .013
NPSG .654 .419 1.73 .188 <.001 .990
RN Staffing 10.59 .005 9.30 .010 14.46 .001
Note. NPSG = national patient safety goal. RN = registered nurse.
Hospital region was found to be significant (H(3) = 21.76, p < .001) for PSI
decubitus ulcer, and the adverse event rates varied by geographic region. These data
indicate that patients discharged from hospitals in the South had the highest rate of
decubitus ulcer adverse event outcomes among all regions in the study sample. The West
had the lowest adverse rate for decubitus ulcer. These results are consistent with
descriptive statistics shown in Table 24 in which the South had the highest mean rate
among all three of the PSIs examined. The data further indicate that patients discharged
from urban teaching hospitals had the highest adverse event rate (M = 9.37/1000 APD)
for decubitus ulcer. This rate was higher than that found in the hospital study sample (M
= 5.17/1000 APD). Among hospitals by teaching status and location, rural hospitals had
the lowest average rates for decubitus ulcer (M = 3.06/1000 APD). Bed size was also
significant for decubitus ulcer (p = .001). Medium-sized hospitals had the highest rate
(M = 7.83/1000 APD) of decubitus ulcer compared with small hospitals and in
comparison with the study sample of hospitals (M = 5.17/1000 APD). Small hospitals
had the lowest rate of decubitus ulcers (M = 6.86/1000 APD) and this PSI was found to
be the lowest for any of the three PSIs studied. This said, the small hospital rate for
decubitus ulcers was higher than that reported by hospitals in the study sample (M =
5.17/1000 APD).
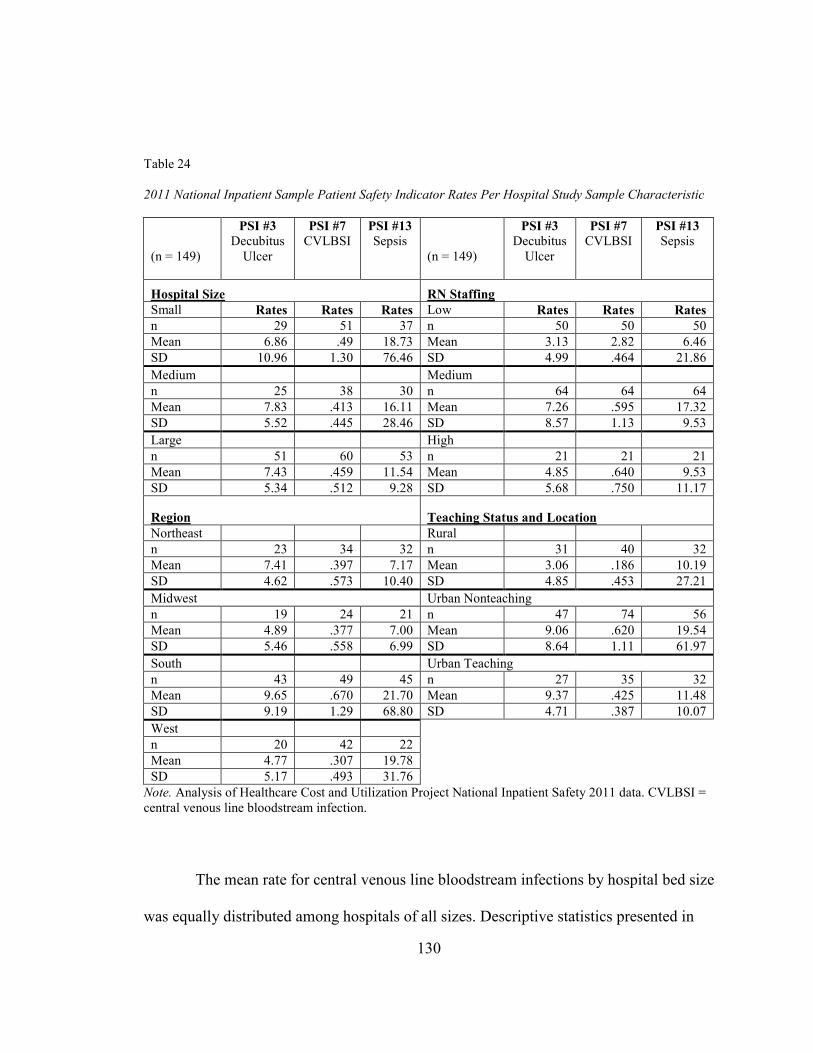
130
Table 24
2011 National Inpatient Sample Patient Safety Indicator Rates Per Hospital Study Sample Characteristic
(n = 149)
PSI #3
Decubitus Ulcer
PSI #7
CVLBSI PSI #13
Sepsis
(n = 149)
PSI #3
Decubitus Ulcer
PSI #7
CVLBSI
PSI #13
Sepsis
Hospital Size RN Staffing
Small Rates Rates Rates Low Rates Rates Rates
n 29 51 37 n 50 50 50
Mean 6.86 .49 18.73 Mean 3.13 2.82 6.46
SD 10.96 1.30 76.46 SD 4.99 .464 21.86
Medium Medium
n 25 38 30 n 64 64 64
Mean 7.83 .413 16.11 Mean 7.26 .595 17.32
SD 5.52 .445 28.46 SD 8.57 1.13 9.53
Large High
n 51 60 53 n 21 21 21
Mean 7.43 .459 11.54 Mean 4.85 .640 9.53
SD 5.34 .512 9.28 SD 5.68 .750 11.17
Region Teaching Status and Location
Northeast Rural
n 23 34 32 n 31 40 32
Mean 7.41 .397 7.17 Mean 3.06 .186 10.19
SD 4.62 .573 10.40 SD 4.85 .453 27.21
Midwest Urban Nonteaching
n 19 24 21 n 47 74 56
Mean 4.89 .377 7.00 Mean 9.06 .620 19.54
SD 5.46 .558 6.99 SD 8.64 1.11 61.97
South Urban Teaching
n 43 49 45 n 27 35 32
Mean 9.65 .670 21.70 Mean 9.37 .425 11.48
SD 9.19 1.29 68.80 SD 4.71 .387 10.07
West
n 20 42 22
Mean 4.77 .307 19.78
SD 5.17 .493 31.76
Note. Analysis of Healthcare Cost and Utilization Project National Inpatient Safety 2011 data. CVLBSI = central venous line bloodstream infection.
The mean rate for central venous line bloodstream infections by hospital bed size
was equally distributed among hospitals of all sizes. Descriptive statistics presented in
131
Table 24 indicate that the mean central venous line bloodstream infections rates were
lower among all hospitals (regardless of demographic characteristic) as compared to the
rate of decubitus ulcer and postoperative sepsis rates. Conversely, the central venous line
bloodstream infections rate for the South (M = .670) was higher than reported by
hospitals in other regions, and was higher than in the hospital study sample (M =
0.46/1000 APD). In addition, the South had the highest percentage (58.8%) of hospitals
with an occurrence of central venous catheter bloodstream infections.
The rate of postoperative sepsis was significant for hospitals by bed size (p =
.001). Hospitals classified as small had the highest mean rate (M = 18.73/1000 APD), and
large hospitals had the lowest mean rate (M = 11.54/1000 APD). Small hospital adverse
event rates were higher than the hospital study sample rate (M = 12.0/1000 APD).
Conversely, large hospitals’ postoperative sepsis mean rates were lower compared with
the hospital study sample rates. Hospital characteristics, teaching, and location also were
significantly related to postoperative sepsis (p = .013/1000 APD). Patients discharged
from urban nonteaching hospitals had the highest mean rate of postoperative sepsis (M =
19.54/1000 APD). The PSI postoperative sepsis adverse event outcome rate was higher in
urban nonteaching hospitals compared with both the hospital study sample rate and 2011
NIS population rate. Both rural and urban teaching hospital postoperative sepsis rates
were lower than the hospital study sample rate.
In addition, RN staffing was also found to be significantly related to postoperative
sepsis. Hospitals that had RN staffing classified as medium (3.0 to 5.0 RN FTE/1,000
APD) had the highest mean rate of postoperative sepsis (M = 17.32).
132
Further analysis using multiple logistic regression was performed to determine
predictors of decubitus ulcer, central venous line bloodstream infections, and
postoperative sepsis based on hospital region, bed size, teaching status and location,
NPSGs, and RN FTE APD.
Research Question 4
Binary logistic regression was used to determine which combinations of the five
independent variables (hospital bed size, geographic region, teaching status and location,
RN FTE/1,000 patient days, and NPSG compliance) would predict the probability of an
adverse event of at least one PSI (decubitus ulcer, central venous line bloodstream
infection, or postoperative sepsis). Independent categorical variables with more than two
levels were dummy coded to ensure that the results were interpretable. These steps
included recoding the categorical variable into a number of separate, dichotomous
variables. Multicollinearity was assessed by evaluating tolerance, variance inflation
index, and condition index for each independent variable. The assumption of
multicollinearity was met.
Each PSI dependent variable was divided into two groups: (1) hospitals with
scores of zero or (2) hospitals with scores greater than zero, as required to perform
logistic regression analysis. Before multivariate analysis, a simple logistic regression was
conducted with each independent and dependent variable. The goal was to examine the
probabilities of adverse event outcomes (decubitus ulcer, central venous bloodstream
infection, and postoperative sepsis) for each independent variable (hospital bed size,
133
region, teaching status and location, RN FTE per 1,000 patient days, and NPSG
compliance).
Univariate analysis results revealed that PSI #3, decubitus ulcer, adverse events
were more likely to be found in the following: small versus large hospitals (p = < 0.001),
rural versus urban teaching (p = 0.001), and hospitals located in the following regions:
Northeast (p = 0.011) and South (p = < 0.001). RN staffing classified as low (< 3 RN
FTE/1000 APD) was significantly related to all adverse event outcomes studied.
PSI #7, central venous line bloodstream infections, was found to be more
significantly associated with the following hospital characteristics: small compared with
large bed-size hospitals (p = < 0.001), and rural compared with urban teaching hospitals
(p = 0.001). In univariate analysis, central venous line bloodstream infection was not
found to be significant by region. RN staffing classified as low (< 3 RN FTE/1,000 APD)
was found to be significantly related to central venous line bloodstream infection rates.
Region was not found to be significantly related to central venous line bloodstream
infection.
In univariate analysis, PSI #13, postoperative sepsis, was significantly more
common in small (p = < 0.001) and medium hospitals (p = 0.017) versus those with large
numbers of beds, rural versus urban teaching (p = 0.001), and hospitals located in the
South (p = < 0.001) compared with those in the West. RN staffing classified as low (< 3
RN FTE/1,000 APD) was significant when examining all adverse event outcomes
independently.
134
The multivariate logistic regression model included four of the five original
predictors. At each initial step of the regression, the test compared the actual values for
the cases on the dependent variable with the predicted values. All steps resulted in
significant values (p < .001), indicating that the overall model of the four predictors
(hospital bed size, geographic region, teaching status and location, and RN FTEs) was
significant and important in predicting each dependent variable (decubitus ulcer, central
venous catheter bloodstream infection, and postoperative sepsis). Each of the PSIs was
statistically reliable in distinguishing between hospitals with zero PSI occurrences versus
those with any PSIs (PSI #3: χ² (10) = 61.04, p < .001; PSI #7: χ² (10) = 50.19, p < .001;
and PSI #13: χ² (10) = 59.01, p < .001). The model correctly classified 80% of decubitus
ulcer and central venous line bloodstream infections and 58% of postoperative sepsis.
Three separate logistic regression analyses were conducted to determine the
relationship to each PSI based upon the hospital characteristic variables of bed size,
region, teaching status and location, and RN staffing FTEs. Regression coefficient results
are presented in Tables 25, 26, and 27. Overall, significant differences were noted in PSI
occurrences based on hospital bed size (p < = .05) for all three PSIs (decubitus ulcer,
central venous line bloodstream infection, and postoperative sepsis). Geographic region
of the hospital was found to be a significant predictor (p = < .05) of occurrences for two
of the three PSIs (decubitus ulcer and postoperative sepsis). Teaching status and location
were also a significant predictor for hospitals with all adverse event outcomes (decubitus
ulcer, central venous line bloodstream infection, and postoperative sepsis). RN staffing
(RN FTE 1000/APD) was not a significant predictor (p = > .05) for any of the outcome
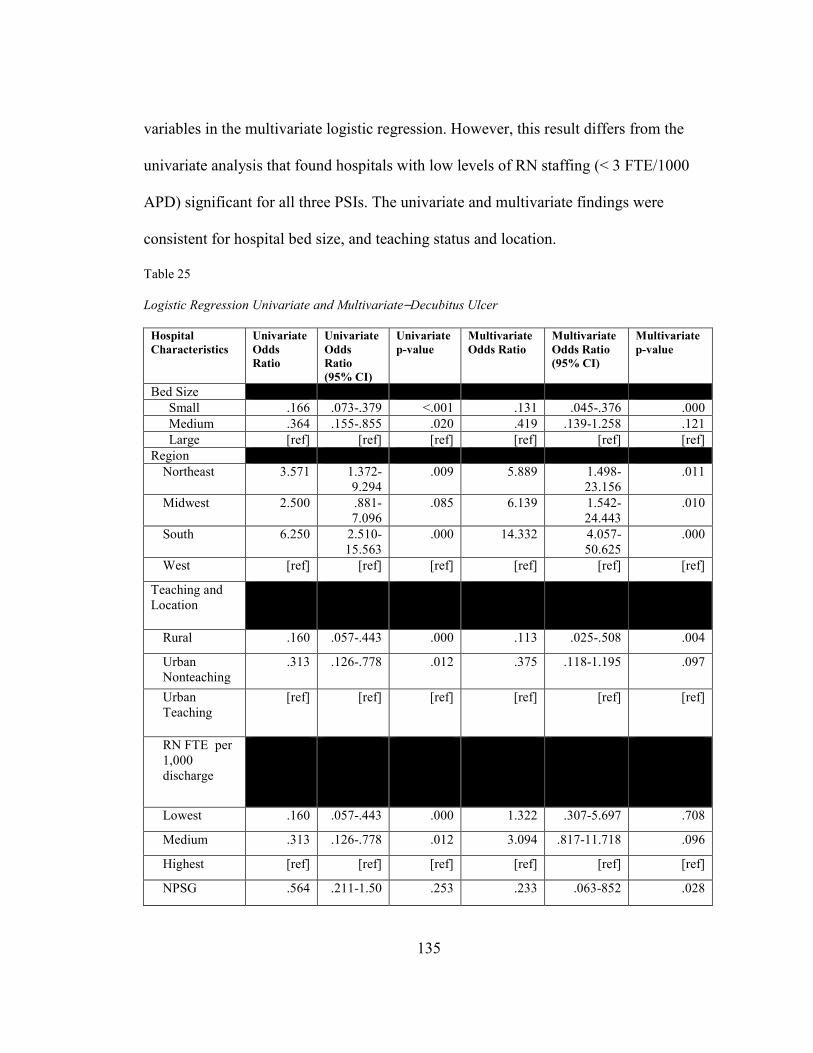
135
variables in the multivariate logistic regression. However, this result differs from the
univariate analysis that found hospitals with low levels of RN staffing (< 3 FTE/1000
APD) significant for all three PSIs. The univariate and multivariate findings were
consistent for hospital bed size, and teaching status and location.
Table 25
Logistic Regression Univariate and Multivariate⎯Decubitus Ulcer
Hospital
Characteristics
Univariate
Odds
Ratio
Univariate
Odds
Ratio
(95% CI)
Univariate
p-value
Multivariate
Odds Ratio
Multivariate
Odds Ratio
(95% CI)
Multivariate
p-value
Bed Size
Small .166 .073-.379 <.001 .131 .045-.376 .000
Medium .364 .155-.855 .020 .419 .139-1.258 .121
Large [ref] [ref] [ref] [ref] [ref] [ref]
Region
Northeast 3.571 1.372-9.294
.009 5.889 1.498-23.156
.011
Midwest 2.500 .881-7.096
.085 6.139 1.542-24.443
.010
South 6.250 2.510-15.563
.000 14.332 4.057-50.625
.000
West [ref] [ref] [ref] [ref] [ref] [ref]
Teaching and Location
Rural .160 .057-.443 .000 .113 .025-.508 .004
Urban Nonteaching
.313 .126-.778 .012 .375 .118-1.195 .097
Urban Teaching
[ref] [ref] [ref] [ref] [ref] [ref]
RN FTE per 1,000 discharge
Lowest .160 .057-.443 .000 1.322 .307-5.697 .708
Medium .313 .126-.778 .012 3.094 .817-11.718 .096
Highest [ref] [ref] [ref] [ref] [ref] [ref]
NPSG .564 .211-1.50 .253 .233 .063-852 .028
136
Note. Analysis of Healthcare Cost and Utilization Project National Inpatient Sample 2011 data. [ref] = reference.
Logistic regression results indicated that certain hospital characteristics⎯rural,
small bed size, and hospital locations in the Northeast, Midwest, and South⎯were
reliable predictors of decubitus ulcer occurrences. Rural hospitals reported fewer
decubitus ulcer occurrences (p = .004) compared with urban teaching and nonteaching
hospitals. Rural hospitals accounted for the smallest percentage (25%) of accredited
hospitals in the sample and had the smallest RN staffing mean rates (M = 2.42 RN
FTE/1,000 APD). While small hospitals (p = < 0.001) were a significant predictor of
decubitus ulcer, the odds ratio was very small (Expo (B) = .131) compared with large
hospitals. Among regions, three of the four were significant predictors for decubitus
ulcer. Hospitals located in the Northeast (p = 0.011) were six times more likely to have
an adverse event rate for decubitus ulcer than hospitals located in the West. Midwest
hospitals (p = 0.010) were likewise six times more likely to have a higher adverse event
rate for decubitus ulcer than hospitals located in the West.
Finally, hospitals located in the South (p = < .001) were found to be 14 times
more likely to have a decubitus ulcer incident than hospitals located in the West as
shown in Table 26. Hospitals in the South had the highest incidence (44%) of decubitus
ulcer as shown in Table 26. Hospitals with high levels of RN FTE staffing (≥5.0/1000
APD) had the lowest incidence of decubitus ulcer. In 2006, there were 503,300 total
hospital stays with pressure ulcers noted as a diagnosis⎯an increase of nearly 80% since
1993. Adult stays totaled $11 billion in hospital costs. More than 90% of pressure ulcer-
137
related stays among adults were for the principal treatment of other conditions such as
septicemia, pneumonia, and urinary tract infections (Lyder et al., 2012). The 95%
confidence interval for the odds ratio comparing regions that had an incident of
decubitus ulcer in the West was wide (1.49 to 50.62).
The South also had the highest percentages of adverse events among central
venous line bloodstream infections and postoperative sepsis. However, region was not
significant for central venous line bloodstream infections. Logistic regression results
indicated that neither geographic region nor RN staffing were significant predictors of
central venous line bloodstream infections. Rural hospitals and those classified as small
bed size were predictors of central venous line bloodstream infections. While small
hospitals were a significant predictor of central venous line bloodstream infections (p = <
.001), the odds ratio was small (Expo (B) = .097) when compared with the constant of
large hospitals as shown in Table 26. Rural hospitals were more likely to have a central
venous line bloodstream infection incident than hospitals located in the West (p = <
.001).
Table 26
Logistic Regression Univariate and Multivariate⎯Central Venous Line Bloodstream Infection
Hospital
Characteristics
Univariate
Odds Ratio
Univariate
Odds Ratio
(95% CI)
Univariate
p-value
Multivariate
Odds Ratio
Multivariate
Odds Ratio
(95% CI)
Multivariate
p-value
Bed Size
Small .182 .080-.413 <.001 .097 .030-.319 .000
Medium .641 .263-1.56 .327 .362 .106-1.237 .105
Large [ref] [ref] [ref] [ref] [ref] [ref]
Region
Northeast 1.071 .428-2.679 .883 1.315 .349-4.963 .686
138
Hospital
Characteristics
Univariate
Odds Ratio
Univariate
Odds Ratio
(95% CI)
Univariate
p-value
Multivariate
Odds Ratio
Multivariate
Odds Ratio
(95% CI)
Multivariate
p-value
Midwest .750 .274-2.053 .575 1.163 .304-4.440 .826
South 1.412 .604-3.297 .426 1.926 .607-6.109 .266
West [ref] [ref] [ref] [ref] [ref] [ref]
Teaching and Location
Rural .099 .034-.287 .000 .028 .005-.153 .000
Urban Nonteaching
.657 .259-1.665 .376 .406 .115-1.437 .162
Urban Teaching
[ref] [ref] [ref] [ref] [ref] [ref]
RN FTE average patient
discharge per 1,000
Lowest .099 .034-.287 .000 1.324 .306-5.726 .707
Medium .657 .259-1.665 .376 1.185 .310-4.526 .804
Highest [ref] [ref] [ref] [ref] [ref] [ref]
NPSG 1.93 .747-4.99 .174 1.14 .343-3.75 .83
Note: Analysis of Healthcare Cost and Utilization Project National Inpatient Sample 2011 data. [ref] = reference.
The importance of this finding is assumed to be related to The Joint
Commission’s recent focus on reducing central venous line bloodstream infections. The
overall incidence of central venous line bloodstream infections was extremely low for
this study sample. The central venous line bloodstream infections mean occurrence rate
was .46/1,000 APD in the 149-hospital inpatient discharge sample. This rate was even
lower than the 2011 NIS population rate of 0.75/1000 APD. Central venous line
bloodstream infections also had small variability in the sample as shown by the standard
deviation scores. Further, rural hospitals accounted for the smallest portion of the sample
(25%). Therefore, this finding for rural hospitals may have questionable significance.
139
Table 27
Logistic Regression Univariate and Multivariate⎯Postoperative Sepsis
Note. Analysis of Healthcare Cost and Utilization Project National Inpatient Sample 2011 data. [ref] = reference.
Analysis results indicated that rural hospitals with bed size classified as small (p =
0.001) and those classified as medium (p = 0.033) located in the Midwest and South were
Hospital
Characteristics
Univariate
Odds
Ratio
Univariate
Odds
Ratio
(95% CI)
Univariate
p-value
Multivariate
Odds Ratio
Multivariate
Odds Ratio
(95% CI)
Multivariate
p-value
Bed Size
Small 1.35 .058-.314 .000 .101 .034-.302 .000
Medium .356 .152-.832 .017 .296 .097-.904 .033
Large [ref] [ref] [ref] [ref] [ref] [ref]
Region
Northeast 1.579 .621-4.013
.337 1.723 .435-6.825 .439
Midwest 2.000 .717-5.577
.185 5.154 1.268-20.943
.022
South 4.125 1.717-9.909
.002 8.904 2.580-30.727
.001
West [ref] [ref] [ref] [ref] [ref] [ref]
Teaching and Location
Rural .174 .064-.470 .001 .082 .017-.399 .002
Urban Nonteaching
.511 .219-1.191
.120 .416 .128-1.35 .145
Urban Teaching
[ref] [ref] [ref] [ref] [ref] [ref]
RN FTE per 1,000 discharge
Lowest .319 .110-.926 .036 .691 .165-2.898 .614
Medium 1.736 .639-4.716
.280 2.191 .611-7.853 .229
Highest [ref] [ref] .827 [ref] [ref] [ref]
NPSG 1.25 .482-3.19 .654 .962 .277-3.33 .952

140
predictors of postoperative sepsis. Hospitals located in rural areas (p = .011) also were
significant predictors of postoperative sepsis. Rural hospitals accounted for the smallest
percentage (25%) of accredited hospitals in the sample and had the smallest RN staffing
mean (M = 2.42 RN FTE/1000 APD) among the variables. While rural hospital status
was a significant predictor of postoperative sepsis, the odds ratio was small (Expo (B) =
.197) when compared to against the constant of urban nonteaching hospitals.
Hospitals in the Midwest region were five times more likely to have a higher rate
of postoperative sepsis than were hospitals in the West. Hospitals in the South (p = .001)
were nine times more likely to have an incident of postoperative sepsis than were
hospitals in the West. Hospitals in the South also had the highest mean rate of
postoperative sepsis (M = 8.47/1000 APD). Further, descriptive statistics reflected that
hospitals located in the South had the highest incidence (45%) of postoperative sepsis.
Exactly why hospital location is related to unfavorable outcomes is not known. A number
of extraneous organizational factors such as nurse education, skill mix, unit manager
leadership, and socio-economics are thought to influence this finding.
Summary of Results
PSI rates did not differ significantly between hospitals that complied with NPSGs
and those that did not. Descriptive statistics revealed differences in the sample based on
the characteristics of compliance with NPSGs, bed size, location, RN FTEs per 1000
APD, and teaching status and location. Postoperative sepsis had higher mean rates on all
variables associated with bed size, region, RN staffing FTE/1000 APD, NPSG
141
compliance, and teaching status and location. Central venous line bloodstream infection
had the lowest mean rates among all variables associated with bed size, region, RN
staffing FTE/1000 APD, NPSG compliance, and teaching status and location.
The Mann Whitney U test did not find a significant difference in PSI adverse
outcome rate (decubitus ulcer, postoperative sepsis, and central venous catheter
bloodstream infection) in hospitals with NPSG compliance versus those that were not
NPSG-compliance.
Hospitals compliant with NPSGs were more balanced across bed sizes (small =
36.4%, medium = 26.4%, and large = 37.2%), while hospitals that were not NPSG-
compliant were primarily large in size (60%). Hospitals that were NPSG-compliant were
distributed more evenly across the three regions with the smallest sample in the Midwest
(16.3%). The South and West had larger samples but were equal in distribution (South =
35% and West = 35%). The two groups differed on teaching status and location. Most
NPSG-compliant hospitals were located in urban nonteaching areas (51.9%). The
noncompliant NPSG hospitals were rural (55%) facilities.
The reliability of the overall model of two predictors, region (χ2 (3) = 9.309, p <
.05) and teaching status (χ2 (2) = 18.134, p < .05), was identified through regression
analysis. These predictors were statistically reliable in distinguishing between NPSG-
compliant and noncompliant hospitals. However, bed size was questionable (χ2 (2) =
4.926, p > .05).
Several significant differences (p < .05) among hospital characteristics and
adverse event outcomes were found through the Kruskal-Wallis analysis. Significance (p
142
< .05) was found in the relationship between decubitus ulcer and a number of hospital
characteristics (bed size, region, RN staffing, and teaching status and location). Results of
the analysis indicated a significant (p < .05) relationship between PSI #7, central venous
line bloodstream infection, and several hospital characteristics (bed size, teaching status
and location, and RN staffing). Postoperative sepsis was found to have a significant (p <
.05) relationship between two variables (bed size, and teaching status and location).
Statistical significance for bed size (p < = .05) and all three adverse event
outcome variables (decubitus ulcer, central venous line bloodstream infection, and
postoperative sepsis) were found through the binary logistic regression analysis. Region
was a significant predictor (p = < .05) for two of three outcome variables (decubitus ulcer
and postoperative sepsis). Teaching status and location also was found to be a significant
predictor for all three adverse event outcome variables (decubitus ulcer, central venous
line bloodstream infection, and postoperative sepsis). Further discussions and
implications of these findings will be addressed in Chapter 5.
143
CHAPTER 5: DISCUSSION AND RECOMMENDATIONS
Hospitals struggle with the impact and consequences of organizational structure
and process at the system level. In 2013, hospital deaths associated with preventable
errors was estimated at more than 200,000 per year (James, 2013). This estimate is more
than double the original estimates provided more than a decade ago in the IOM report To
Err is Human: Building a Safer Health System (Kohn et al., 2000). The loss of life and
irreversible harm to patients in hospitals generates an urgency and increased vigilance to
address the problem of harm to patients who seek safe, high-quality care. This chapter
addresses implications for nursing research, the role of leaders in steering a quality-
focused organization, comparison literature related to the study’s findings, study
limitations, and recommendations for further research.
Because of the heightened attention toward improving patient safety over the past
decade, healthcare leaders have turned to the safety science literature to help explain
patient safety and provide direction for creating safety management systems (Flin, 2007).
Efforts to improve safety have been encumbered, in part, by the difficulty in examining
systemic failures that occur in complex, dynamic environments such as hospitals. Adding
to the challenge is the realization that the influences of patient safety practices remain
relatively unexplored in healthcare settings. Thornlow and Merwin (2009) assert that the
relationship between utilization of patient safety practices, specifically The Joint
144
Commission’s NPSGs, has not been well studied, making it difficult for hospitals to
understand and identify useful actions to solve problems and create improved patient
outcomes. This study’s findings add insight to the understanding of the relationship
between patient safety practices and patient outcomes.
Existing data from HCUP-NIS, AHA, and The Joint Commission were used to
analyze relationships among selected risk-adjusted PSIs (decubitus ulcer, central venous
line bloodstream infection, and postoperative sepsis), NPSG compliance, and hospital
structural characteristics, including RN FTE/1,000 APD. Study results provided evidence
that hospital system characteristics such as bed size, region, teaching status and location,
and nurse staffing levels are related to hospital compliance of NPSGs, and this, in turn,
predicts the findings as discussed regarding the selected PSIs.
Question 1
In this study, outcome rates for three selected PSIs⎯decubitus ulcer, central
venous line bloodstream infections, and postoperative sepsis⎯were not found to be
significantly related to the implementation of patient safety practices such as NPSGs.
Hospitals accredited in 2011 make up 33% of the total Joint Commission 2011 NIS
database. Eighty-six percent of the sample hospitals are NPSG-compliant, while only
14% are noncompliant. Distributions for the selected outcome variables did not
significantly differ between hospitals that complied with the national patient safety
practice guidelines and those that did not.
While the analysis was not statistically significant, the data revealed crucial
findings that support the value of patient safety practices. Within hospitals that were

145
found not NPSG-compliant, higher rates of adverse events were seen for each of the PSIs
in this study. Moreover, little research has examined the influence of patient safety
practices such as NPSG-compliance on patient safety outcomes. Specifically, past studies
were limited to measuring Joint Commission accreditation scoring and the relationships
with the AHRQ’s PSIs (Miller et al., 2005; Masica et al., 2009; Thornlow & Merwin,
2009).
Two studies examined the association between Joint Commission accreditation
scores, quality measures, and mortality (Chen et al., 2003) and inpatient quality and PSIs
(Miller et al., 2005). Consistent with the findings of this study, the 2003 research found
no significant relationship between The Joint Commission accreditation decisions and
performance. Chen et al. (2003) examined the association between Joint Commission
hospital accreditation, the hospitals’ quality of care using three quality indicators and
survival among Medicare patients hospitalized for acute myocardial infarction. Hospitals
not surveyed by The Joint Commission revealed lower quality and higher 30-day
mortality rates than those surveyed. Although the variables of the 2003 study differ from
the present study in that it examined outcomes in Joint Commission accredited hospitals
compared with those not accredited, the results are similar. In the present study, hospitals
that complied with NPSGs had lower adverse event rates for two of the three PSIs
compared with the hospital sample and 2011 NIS rates.
In 2005, Miller et al. (2005) examined the relationship between Joint Commission
accreditation scores and PSIs from HCUP administrative data (n = 24 states and n =
2,116 hospitals) and Joint Commission accreditation data from 1997 to 1999. The study

146
revealed that when Joint Commission scores did not vary significantly, the PSI rates
exhibited wide variation. The conclusion was that no relationship exists between Joint
Commission accreditation and the PSIs studied. In contrast, this study uses Joint
Commission NPSG compliance rather than Joint Commission scoring, which no longer is
used in the accreditation process. The findings from this study are consistent with the
findings of the research reported by Miller et al (2005).
Question 2
In this study, compliance with NPSGs varied by hospital characteristic, some of
which were found to be predictive of adverse outcomes. Hospital bed size and geographic
region were not found to predict hospital compliance with NPSGs. Teaching status and
location of a hospital were, however, significant predictors of whether a hospital was
NPSG-compliant. Urban teaching hospitals were less likely to be NPSG-compliant than
were rural hospitals. No studies were found in the literature that examined the
relationship between hospital characteristics and compliance with hospital NPSGs (a
proxy for patient safety practices).
While studies have shown associations between hospital characteristics such as
bed size, teaching status, and patient outcomes (Ayanian & Weissman, 2002; Devereaux
et al., 2002; Kupersmith, 2005; Thornlow & Merwin, 2009), little or no published
evidence that examines how these structural characteristics affect utilization of patient
safety practices in accredited hospitals was found. One research study (Al-Haider & Wan,
1991) found higher mortality rates, and another found an increase in preventable adverse
events (Thornlow & Stukenborg, 2006) among patients in urban teaching hospitals. In

147
addition, consistent with this study’s findings, several researchers reported poorer
outcomes for patients receiving care in rural hospitals (Baldwin et al., 2004; Maynard et
al., 2000).
In this current study, rural hospitals had the lowest rate of NPSG compliance
when compared with urban teaching and urban nonteaching hospitals. Likewise, rural
hospitals had the highest rates of noncompliance with NPSGs across all specified PSIs.
In this study, hospital adverse outcomes differed depending on selected hospital
characteristics; this finding was consistent with previous studies (Baker et al., 2002;
Romano et al., 2003; Thornlow & Merwin, 2009; Thornlow & Stukenborg, 2006). This
study found that teaching hospitals and those with medium RN staffing levels (3 to 5
FTEs/1000 APD) had a higher percentages of compliance with NPSGs for all three
selected adverse events, especially as compared with rural and urban nonteaching
hospitals. Low RN staffing levels was associated with the highest rates of noncompliance
with NPSGs, regardless of PSI. If, as the data suggest, urban teaching hospitals are less
likely to meet or implement patient safety practices such as NPSGs, the failure to
embrace recommended hospital practices may explain the high adverse event rates for
teaching hospitals as compared with nonteaching institutions.
The Joint Commission accreditation process attempts to create evidenced-based
practices (Kizer & Blum, 2005; Shojania et al., 2002), but no study to date has examined
patient outcomes and the relationship of hospital system structures with the
implementation of NPSGs. Statistical analysis did not reveal a relationship between
NPSG compliance and selected adverse events in this study. Descriptive statistics showed
148
that teaching hospitals, large hospitals, and those with RN staffing levels at a medium
frequency (3 to 5 FTEs/1000 APD) had high percentages of NPSG compliance for all
three selected adverse events compared with rural and urban nonteaching hospitals.
Teaching hospitals’ leadership structure is more formalized, thereby creating an
environment that is more supportive of the implementation of practice guidelines.
Staffing levels have a direct impact on NPSG compliance and patient outcomes.
Hospitals with low RN staffing levels had lower rates of NPSG compliance, regardless of
the PSI studied.
Question 3
This study analyzed multiple hospital characteristics to determine whether a
relationship exists between hospital characteristics and the rate of each selected PSI. The
current study did not consistently find hospital system characteristics related to the three
selected adverse patient outcomes. Study findings reveal that relationships between
hospital characteristics and PSIs varied. In particular, there is a significant relationship
between bed size, teaching, and location for all three selected PSIs. Region was
significant for two of the three PSIs. This finding is consistent with those from previous
studies in which patient outcomes differed based on the hospital characteristic variable
studied (Baker et al., 2002; Romano et al., 2003; Thornlow & Merwin, 2009; Thornlow
& Stukenborg, 2006).
The hospital characteristics in this study that were associated significantly with
the adverse outcome of decubitus ulcer were bed size, teaching, location, region, and RN
staffing. Central venous catheter bloodstream infections significantly were related to

149
hospitals by bed size, teaching status and location, and RN staffing. Three variables⎯bed
size, teaching status, and location⎯were found to be significantly associated with
postoperative sepsis rates. RN staffing was significant in univariate analysis. However,
RN staffing was not found to be significant when multivariate factors such as bed size,
teaching status and location, and region were added.
Hospital Bed Size
In this study, comparing hospital bed size was one fundamental approach to
benchmarking that will provide meaningful data for the nation’s smallest hospitals,
whose service volumes, patient characteristics, and system resources may varymore than
do those of larger hospitals. Hospital bed size was statistically significant for all three of
the PSIs studied with variable rates of occurrence; hospital bed size was significant for
the PSI decubitus ulcer (p = .001).
In 2006, the AHRQ (2013a) examined the relationship between the effects of low
volume and patient outcomes. Researchers found strong evidence of patient volume-
outcome effect with low volumes being associated with poorer outcomes. For comparison
purposes, low volume is an analogous variable with small and medium bed-size hospitals
for this study. This study found medium size hospitals to have the highest rate for
decubitus ulcer (M = 7.83), which were found to be higher than those reported in the
hospital study sample (M = 5.17). Small hospitals had the highest mean rate (M = 18.73)
of postoperative sepsis. Rates for small hospitals were also higher in the NIS population
than in the hospital study sample rate (M = 12.0).
150
Finally, the current study found large NPSG-compliant hospitals to have higher
adverse outcome rates for both decubitus ulcer and postoperative sepsis. These findings
are consistent with a study conducted by the ANA (2013) in which hospitals with more
than 200 beds had higher rates of decubitus ulcers compared with those having fewer
than 200 beds.
Teaching Status and Location
Both teaching status and location are hospital characteristics and study variables
used for comparison in this study. While both variables were found to be significant,
hospital teaching status could not be disentangled from hospital location. There is
evidence that quality of care is generally higher in teaching hospitals than in nonteaching
institutions (based on lower rates of adverse outcomes). Further, acute care hospital
system characteristics such as teaching status were found to be related to more favorable
adverse event rates (Ayanian & Weissman, 2002; Kupersmith, 2005). These findings are
consistent with those in the studies cited. A higher percentage of urban teaching hospitals
were NPSG-compliant, regardless of PSI. Further, adverse event rates for NPSG-
compliant hospitals were higher in urban nonteaching hospitals than in rural and urban
teaching hospitals for all studied PSIs.
Rivard et al. (2008) were among the first to compare teaching and nonteaching
hospitals using a regression model that incorporated hospital structural characteristics
similar to those used in this study. Using AHRQ’s PSIs and adult male patient discharges
from VA and nonfederal hospitals, the researchers examined the likelihood of incurring
an adverse event classified as a PSI. Consistent with the results of this current study, they
151
found higher PSI rates in major teaching hospitals than in nonteaching hospitals, and that
PSI events were more likely to occur in teaching hospitals compared with nonteaching
hospitals (Rivard et al., 2008). In this study, adverse event rates for decubitus ulcer were
likewise higher in urban teaching hospitals compared with nonteaching facilities. In
contrast, several studies of potentially preventable adverse events reported inconsistent
findings from teaching and nonteaching hospitals (Romano et al., 2003; Thornlow &
Stukenborg, 2006; Kohn et al., 2000). Similarly, this study found the same
inconsistencies in the relationship between teaching status and various patient safety
outcomes. The relationship between teaching status and patient safety appears to be less
clear.
RN Staffing
The findings related to hospital RN staffing are of particular importance. RN
staffing significantly is associated with the frequency of the selected PSIs in this study.
This study found RN staffing was related to lower infection rates, similar to findings in
other research projects examining the relationship between staffing and patient outcomes.
Specifically, higher RN staffing levels were found to be related to lower nosocomial
infection rates in multiple studies (ANA, 2013; Kane et al., 2007; Kovner & Gergen,
1998; Lichting et al., 1999; Needleman et al., 2002a, 2002b). In this study, hospitals with
high RN staffing levels (≥ 5 FTEs/1000 APD) experienced lower adverse event
occurrences regardless of the studied PSI. Seago’s (2001) evidence-based review of
literature similarly found low RN staffing levels associated with increased postoperative
152
sepsis infections. According to Fridkin et al. (1996), hospitals with low RN staffing levels
experienced the highest rates of central venous catheter-related bloodstream infection.
Geographic Region
This study found hospital region to be a significant factor related to PSI outcomes.
Past studies (Skinner, Staiger, & Fisher, 2006; Fisher et al., 2003) have examined the
relationship between medical spending, hospital beds, and outcomes by geographic
region. It can be hypothesized from existing geographic studies that in regions where
there are more hospital beds per capita, Medicare spending will be higher. This reasoning
also applies to regions where there are more intensive care unit beds. More patients will
be cared for in the ICU, and Medicare will spend more on ICU care (Skinner et al., 2006;
Fisher et al., 2003). Conversely, higher spending does not necessarily translate into better
access to healthcare. The findings of this current study are consistent with the arguments
of Skinner, Staiger, and Fisher (2006) in which they contend that an increase in
hospitalizations leads to an increase in the risk of errors and adverse events.
In this study sample, 149 hospitals (48%) were large facilities. More than 45% of
all large hospitals in the sample were located in the South. Findings of this study illustrate
that the South has the highest adverse event rates among the four regions.
In summary, no single factor influences higher adverse events in one region over
another. Findings form this study indicate that ecology of the local healthcare
environment⎯local reimbursement rates, capacity, and social norms⎯may influence
patient care processes and, ultimately, patient outcomes.
153
Question 4
The study examined the predictors of hospital bed size, region, teaching status and
location, RN FTEs, and NPSGs. This is the first study to date to compare patient safety
outcomes and patient safety practices across hospitals, based exclusively on their
geographic region.
Teaching Status and Location
This current study shows that small and rural hospitals have a higher rate of all
three of the specified PSIs. This finding is consistent with studies that report high rates of
decubitus ulcer, central venous line bloodstream infection, and postoperative sepsis using
univariate and multivariate regression analysis. However, no appreciable differences
were noted in the strength or direction of the relationship. Both teaching status and
location relied on hospital comparisons in this study.
In this study, patients in urban nonteaching hospitals were more likely to
experience postoperative sepsis and central venous line bloodstream infection as
compared with rural and teaching hospitals. Small hospitals had higher rates of central
venous line bloodstream infection and postoperative sepsis. Conversely, a study by Vogel
et al. (2010) found that patients in large-size hospitals were more likely to develop sepsis
after elective surgical procedures, compared with patients in small-size hospitals.
Urban teaching and large hospitals had higher rates of decubitus ulcer. Studies
comparing the quality of care in urban and rural hospitals are limited, and those that exist
have produced mixed results (Baker et al., 2002; Romano et al., 2003; Thornlow &
Merwin, 2009; Thornlow & Stukenborg, 2006). The findings from this study replicate
154
previous work cited above in which associations differed, depending on the variable and
outcome event measured.
Thornlow and Merwin (2009) reported that large hospitals exhibited higher rates
of adverse outcomes than smaller hospitals for two of the four indicators
analyzed⎯infections and postoperative respiratory failure. In contrast, a previously
reported AHRQ study (2013a) examined the relationship between the effects of low
volume and patient outcomes. The study found a strong relationship between low patient
volumes and adverse outcomes. There is much debate in the literature suggesting that
smaller hospitals, often in rural settings, vary in their adherence to evidence-based
guidelines and practice patterns compared with larger hospitals (Werner, Goldman, &
Dudley, 2008; Lutfiya et al., 2007). In this current study, findings suggest higher adverse
event rates for central venous line bloodstream infection in small hospitals compared with
medium and large hospitals. The findings of this study are consistent with the literature
reporting a variance in small hospitals’ adherence to practice patterns and evidence-based
guidelines, ultimately leading to poor outcomes.
Studies (Brennan, 2000; Romano et al., 2003) that compared patient safety
outcomes or adverse event rates among urban and rural hospitals reported better patient
safety outcomes and lower adverse event rates at rural hospitals than at urban hospitals.
Brennan (2000) used medical records reviews to examine the rates of adverse events in
New York state hospitals. The researchers found rural hospitals in upstate New York to
have significantly fewer adverse events than urban hospitals. Further, Romano et al.
(2003), using risk-adjusted rates for 19 PSIs, evaluated urban and rural hospitals and
155
discovered that rural hospitals had the lowest overall PSI rates compared with urban
teaching facilities. This finding suggested a higher level of patient safety at rural hospitals
and differed from the findings of this study in which PSI rates were higher in rural
hospitals.
One conjecture that may explain this difference is lack of adequate nurse staffing
or the characteristics of the nurses and other resources in small hospitals that may result
in poorer outcomes. In some cases, small hospitals are affiliated with larger hospital
systems where additional resources are available, as compared with rural hospitals that
are most often standalone facilities. As hospital patient volume shifts, small and rural
hospitals lack the flexibility to address adequately the challenge of nurse staffing. Both
small and rural hospitals have lower RN-staffing-to-bed ratios. Therefore, when there is a
census increase, it is likely that RN staffing does not increase. In addition, small hospitals
do not have specialty patient care units. As such, patients with multiple diagnoses are
placed in one unit with the expectation that staff will be equipped to manage care that
actually requires multiple specialized skill sets. Vartak et al. (2008) found that small
hospitals had a higher percentage of surgical admissions as well as a higher average DRG
weight, which indicates that they either treat sicker patients or perform more complicated
procedures, or both.
Patient outcomes are affected by many factors in small and rural hospitals. The
implementation of evidence-based guidelines in rural hospitals is laden with factors that
prove challenging. Nurse-manager support is vital to the effectiveness and execution of
evidenced-based guidelines. However, such support is challenging in rural hospitals
156
because many do not possess the requisite skills or knowledge base to support evidenced-
based practice. Other factors that affect patient outcomes in small hospitals include
education and training as most nurses working in small rural hospitals are trained locally
and gain their experience within the geographic area where they were educated. Further,
many nurses working in small hospitals are educated at local community colleges at the
associate-degree level. Therefore, experience and exposure to new guidelines or practice
patterns may be limited.
Geographic Region
All regions⎯Northeast, Midwest, South, and West⎯were found to be significant
predictors of two of the three outcome indicators studied: decubitus ulcer and
postoperative sepsis. Specifically, hospitals located in the South had the highest adverse
occurrence rates for all three indicators. The study findings indicate that patients admitted
to hospitals in the South have a higher risk of decubitus ulcer and postoperative sepsis.
These findings are consistent with the 2011 National Health Disparities Report (AHRQ,
2012a) in which western states (Montana, New Mexico, Nevada, and Wyoming) made up
the majority of the worst performers in preventive care, while southern states (Alabama,
Arkansas, Kentucky, Louisiana, Mississipi, Oklahoma, Texas, and Tennessee) made up
the majority of the worst performers in acute care. The report (AHRQ, 2012a) also found
states in the South were most often in the bottom quartile. In comparison, 2006 NIS data
found that the Northeast had the highest rates of decubitus ulcer (Lyder et al., 2012).
The exact reasons for how locality influences outcomes are unclear. Two previous
studies (Skinner et al., 2006; Fisher et al., 2003) document the difficulty in making the

157
connection between outcomes and region. The first, conducted by Skinner et al. (2006),
found that regions experiencing the greatest increase in healthcare spending for
myocardial patients exhibited the least improvement in health outcomes. The second
study (Fisher et al., 2003) found that regions including the South with high healthcare
spending had higher mortality following acute myocardial infarction, hip fracture, and
colorectal cancer diagnoses. The finding of this study reveals that the South had the
highest rates of adverse outcomes among all regions. Further, the South had the largest
number of hospitals in the study sample had the largest percentage (46%) of large
hospitals. It is possible that that high volume leads to increased risk and adverse events,
and as such, may explain the regional differences observed in this study.
According to Meade and Erickson (2000), one of the challenges of examining the
influences of region on outcomes relates to the linking of individual patient events with
population rates. More importantly, it comes down to the process by which health data
are reported. These researchers contend that data are compiled according to the political
and administrative organization of governments. As in this study, risk-adjusted rates for
the PSIs were based on denominators expressed as the population of a unit. Meade and
Erickson (2000) assert that rates and indicators that reflect the community context and
healthcare workers are influenced by both clinical and political factors.
It is difficult to characterize a single factor that influences higher adverse events
in one region compared with another. However, it is evident that the local ecology of
healthcare, which includes such factors as the local reimbursement rate, capacity, and
social norms, strongly influences clinical decisions of providers, thereby influencing

158
patient outcomes (Fisher et al., 2003). As demonstrated by the work of other researchers,
findings are inconsistent regarding the relationship between hospital characteristics and
patient outcomes.
Recommendations for Further Nursing Research
Given the increasingly sophisticated nature of healthcare and the continued
emphasis on patient safety, it is of utmost importance to determine what structural
factors, including hospital characteristics, may affect patient outcomes. Further, it is
paramount not only to understand the relationship between structural influences and
patient outcomes but also to examine factors that affect the implementation of patient
safety practices. One cannot effectively design and implement systems and safety
solutions in healthcare without a complete understanding of how and why an
organization’s structural characteristics affect patient outcomes.
Few published studies have examined the influence of the AHRQ’s PSIs and their
relationship with NPSGs. Given that the influence of patient safety practices and adverse
event outcome variables have not been widely studied, it is challenging to monitor trends
and patterns of nurse-sensitive adverse events that can lead to safety and quality
improvements. The Joint Commission’s NPSG component of the accreditation process
contains a large element related to infection prevention, specifically post-surgical
infections and central venous lines. This study found no relationship between patient
safety practices and infection rates. Given the importance of hospital infections, this area
requires further inquiry.
159
The AHRQ’s PSIs have been used as outcome measurements for public reporting
for many entities assessing healthcare quality and outcomes. The Joint Commission
examines hospital quality against its evidence-based clinical processes for certain
conditions, including heart attack, heart failure, pneumonia, surgical care, children’s
asthma, inpatient psychiatric services, venous thromboembolism, stroke, perinatal care,
immunization, tobacco treatment, and substance use (The Joint Commission, 2012).
According to the 2000 IOM report, structure, process, and outcome indicators are
commonly recognized as measures of quality. It is uncertain whether there is uniformity
in the measurement and definition of quality among quality-focused organizations. Few
studies have been published that examine quality measures of other quality-focused
groups against patient safety outcome indicators, which further widens the gap in
research in patient safety.
The findings from this study indicate the geographic location of hospitals to be a
significant predictor for two of the three selected outcomes⎯risk-adjusted decubitus ulcer
and postoperative sepsis. A better understanding of geographic uniqueness and how it
influences patient care practices and nurse performance (especially related to nursing
education and staff training) is needed. Further study is also needed to explore other
factors that may explain patient outcome differences in geographic areas such as hospital
ownership, socioeconomics, population, health disparities, and health care delivery
models.
The methodology used in this study represents an approach to examining the
implementation of patient safety processes and their association with patient outcomes.
160
Accredited hospitals may use this approach to examine and screen for adverse events
while identifying opportunities for improvement. Further exploration and research are
needed to determine the effectiveness of the implementation of NPSGs overall on patient
safety outcomes.
Finally, further research to determine whether other organizational characteristics,
beyond those in this study, affect patient safety outcomes.
Implications for Nursing Practice
Hospitals perceive that they are delivering high-quality care, and most Americans
want to believe that they are receiving the best care available. However, Americans
receive appropriate, evidence-based care when they need it only 55% of the time,
according to Asch, Adams, Keesey, Hicks, DeCristofaro, and Kerr. (2003). It is,
therefore, essential that efforts be made to influence quality agencies’ collaboration to
shape analogous measurements of quality. The path toward improving the quality of
healthcare lay in establishing a common method of measurement. Perhaps nurse-sensitive
outcome measures as used in this study should guide the focus of further research in
patient safety.
A prerequisite to designing patient safety solutions is having a clear
understanding of the association between patient safety practices and hospital system
characteristics, including nurse staffing and patient outcomes. Nursing leaders throughout
the United States are best positioned to influence hospital healthcare quality. In the
healthcare workforce, nurses make up the largest component of workers. Further, the
nurse’s role in detecting and abating adverse events is central to patient safety.

161
The findings in this study suggest that some hospital characteristics are predictors
of decubitus ulcer outcomes. Equally important, researchers (Russo, Steiner, & Spector,
2008) have found decubitus ulcer events to be significant independent predictors of
hospital costs, in which more than $11 billion in hospital expenses have been linked to
decubitus ulcer. According to researchers, decubitus ulcers can be treated successfully or
prevented when evidence-based care protocols are implemented. The use of Guidelines
for the Prevention and Treatment of Pressure Ulcers (National Pressure Ulcer Advisory
Panel, 2014) in clinical practice is fundamental to prevention, decrease in length of stay,
and the costs associated with decubitus ulcers. Research into quality outcome measures
related to the implementation of patient safety practices by hospitals is necessary to
improve the quality of care.
In 2009, 18,000 central-line bloodstream infections occurred in patients
hospitalized in ICUs. This number represents 58% fewer infections compared with 2001.
Overall, the decrease in infections saved approximately 27,000 lives (CDC, 2011).
Representative of the impact of evidenced-based practices, references such as the
Guidelines for the Prevention of Intravascular Catheter-Related Infections (O’Grady et
al., 2002) reduce catheter-related bloodstream infection rates (Behrenholtz et al., 2004;
Stone et al., 2007).
Along with how effectively guidelines are implemented, another factor affecting
hospital infection rates relates to healthcare worker compliance with infection control
policies and procedures, and hand-washing compliance (Peterson & Walker, 2006;
Thornlow & Merwin, 2009). Patient outcome measures that are affected by nurse
162
clinicians and practitioners and those that have the most potential impact, such as
nosocomial infection rates, should be a priority for future research. Nurses perform an
important role in the delivery of safe, high-quality healthcare. It is imperative that
strategies are developed to mitigate adverse events that begin at the point of care
delivery. Such strategies must be evidenced-based and linked to SPO relationships.
The World Health Organization in 2014 estimated that one out of every 10
hospitalized patients in the United States would acquire a healthcare-associated infection.
Findings of this current study suggest that selected adverse events such as postoperative
sepsis and central venous line bloodstream infections may be shaped and reduced through
process standards that are reflected in The Joint Commission’s NPSGs. Implementation
of Joint Commission standards is highly dependent upon the commitment of both hospital
administration and nursing leaders. Likewise, it is important to establish the linkage
between The Joint Commission’s accreditation assessments of quality care and adverse
patient outcome measures by other quality organizations such as the AHRQ.
The Joint Commission is the premier organization utilized for assessing patient
safety and healthcare quality, but no existing studies were found that examined
relationships between The Joint Commission’s assessments and other independent,
quality agency outcome measures as performed in this study. Further exploration is
needed to determine whether a single set of measures can serve multiple purposes. In
other words, does a hospital that meets NPSGs as reviewed by The Joint Commission
fare well on the AHRQ’s PSIs? The lack of answers suggests the need for considerable

163
research regarding analogous measurements of patient quality. Development of
equivalent quality measurements should be an aim of future patient safety research.
Strengths and Limitations
Strengths
One of the strengths of this research is the use of a large, nationally representative
sample derived from an administrative database⎯HCUP-NIS⎯that provided access to
multiple sites and a variety of patients. The sample included patients discharged from 149
hospitals representing 28 states. It also included more than 1.7 million discharge records,
providing greater opportunity to analyze a considerable number of subjects. The HCUP-
NIS hospital-level data were designed to link readily with other data sources such as
AHA data, making available a number of organizational characteristic variables at the
hospital level for analysis.
Additional strengths included using HCUP-NIS and The Joint Commission
accreditation Quality Check data, which are readily accessible and publicly available
from federal, private, and nonprofit agencies. Since HCUP-NIS data are available dating
to 1988, there is greater availability to use the data set for research purposes. Data can be
compared and trended over time, and easily replicated. Further, hospital discharge
abstracts are based on computerized data collected by nearly all U.S. hospitals. That
makes using administrative datasets suitable (Romano et al., 2003).
Donabedian’s quality assessment framework was used to support the study’s
underpinnings. The selection was appropriate and adequate, considering the focus of the
study relating quality outcomes to structural components. Using study variables, two out
164
of three main elements of quality⎯structure and outcome⎯were evaluated. Overall, the
use of large secondary data was extremely beneficial to the relevance of the study
findings.
Limitations
Limitations of this study include those related to study design and sampling
methodology that affect the generalizability of the findings. The study results are limited
to Joint Commission accredited hospitals in the United States. Characteristics of the
sample revealed that most hospitals were large, urban nonteaching institutions located in
the South. The study’s sample hospitals differed from the 2011 NIS sample because the
study sample had fewer small hospitals, rural hospitals, and hospitals located in the
Midwest. Because the study’s hospitals differed from the national sample, there is limited
ability to generalize findings to rural and small hospital populations.
Several limitations are inherent in using secondary administrative data to study
the quality of care delivered by healthcare providers. There is an inherent potential that
administrative data may reflect bias in the timeliness of data availability (Rantz &
Connolly, 2004), coding bias or accuracy, missing data elements, or incomplete data due
to fear of reprisal and lack of clinical detail (Iezzoni et al., 1994; Lawthers et al., 2000;
Miller et al., 2001; Weingart et al., 2000; Zhan & Miller, 2003).
For this study, a potential coding bias existed in detecting certain types of patient
safety events, specifically surgical complications. Surgical complications are more
amenable to ICD-9-CM coding (Rosen et al., 2005). Therefore, administrative databases
are better screens for detecting surgical complications compared with the detection of
165
medical complications (Lawthers et al., 2000). Postoperative sepsis was an indicator used
in the study, which relied on the identification of surgical complications. Decubitus ulcer
and central venous line bloodstream infection relied on reporting of both medical and
surgical complications.
Timeliness of data is a limitation of administrative datasets (Rantz & Connolly,
2004). The 2011 NIS data were used for this study. Data available for 2011 by HCUP
represented 46 states. The inclusion criteria for the study further limited the sample,
which limited findings to those states participating in HCUP and Joint Commission
accredited hospitals that underwent survey in 2011. VA hospitals and other federal
facilities were not represented in the HCUP sample. Findings from this study are
therefore limited, and will not be generalizable to the patient population served by VA
and other federal hospitals.
Accuracy is an inherent limitation based on the notion that coded documentation
found within discharge records is only as accurate as that coded by trained staff. There is
a real possibility that poor documentation quality and coding could lead to capture of
lower complication rates, thus indicating fewer adverse events and an assumption of
higher quality and safety.
Caution must be exercised in the use of administrative data sets regarding the
limited clinical detail (Rosen et al., 2005) and the calculation of severity of illness (Zhan
& Miller, 2003b). In this study, the AHRQ’s comorbidity measure was designed to adjust
for severity of illness using administrative data in conjunction with the PSI software
(Elixhauser et al., 1998).

166
Codes are subject to change each October, as new codes are introduced annually
(AHRQ, 2010c), and may limit data comparisons. In addition, midway through 2007, the
national coding standards were revised. According to HCUP (2015), the changeover date
was not followed universally by all states and hospitals, and it could affect how hospital-
level data were to be loaded into quality improvement programs. Data comparisons over
time may be limited by these anomalies.
There were limitations for 2011 data as they applied to the state of New
Hampshire (AHRQ, 2011). New Hampshire was not included in the HCUP-NIS data
because the data were submitted past the deadline. Therefore, New Hampshire hospitals
were unavailable for study.
Finally, data elements related to nurse staffing were retrieved from AHA and
merged with HCUP data for this study. Nursing characteristics such as education level,
years of experience, and specialty certification were unavailable. The unavailability of
these components may influence the value of the study findings. Researchers have linked
some of these characteristics to patient outcomes (Aiken et al., 2003).
Conclusion
This research provided evidence that the characteristics of some hospitals were
related to patient safety practices that are associated with poor patient outcomes. The
effect of implementing patient safety practices associated with NPSGs, specifically the
resultant impact on patient outcomes, varied and for selected adverse outcomes was
associated with adverse PSI rates. For example, a number of hospital characteristics were
167
significantly associated with selected adverse outcomes (decubitus ulcer and
postoperative sepsis) but not others (central venous bloodstream infections). Findings
indicate that bed size was a predictor of central venous line bloodstream infections and
postoperative sepsis and not decubitus ulcer. Patients in hospitals classified as small were
more likely to experience an adverse event than those in large hospitals. Whereas small
hospitals had higher postoperative sepsis rates, larger hospitals demonstrated higher
decubitus ulcer rates. Geographic region was a predictor for two of the three adverse
patient outcomes, and teaching status and location were significant predictors in all three
of the selected outcomes. These findings provide evidence of the challenges in managing
hospital structural characteristics and patient care processes to reduce adverse patient
outcomes.
Previous research has shown that preventive procedures such as protocols and
guidelines may reduce adverse events related to decubitus ulcer and infections. However,
the results of this study highlight the need to understand how organizational
characteristics and patient safety practices are related and influences patient outcomes
beyond the variables in this study. This study contributes important knowledge to the
body of nursing and hospital management science in understanding organizational and
structural variable and patient care practices related to patient safety and quality of care.
Each year, The Joint Commission evaluates its NPSGs to determine their
effectiveness and whether other areas should be placed on a high-priority list of new
goals. While this evaluation is valuable, more research is needed to determine if these
patient safety practices, for which hospitals allocate enormous resources, actually
168
influence patient outcomes. Such research will provide significant movement toward
uniformity in the measurement and definition of quality among quality-focused
organizations to decrease adverse outcomes of hospitalized patients. Because of the
growing complexity of healthcare and the public’s focus on patient safety, additional
research is needed to fully elucidate the relationships between hospital systems, patient
safety practices, and patient safety outcomes.
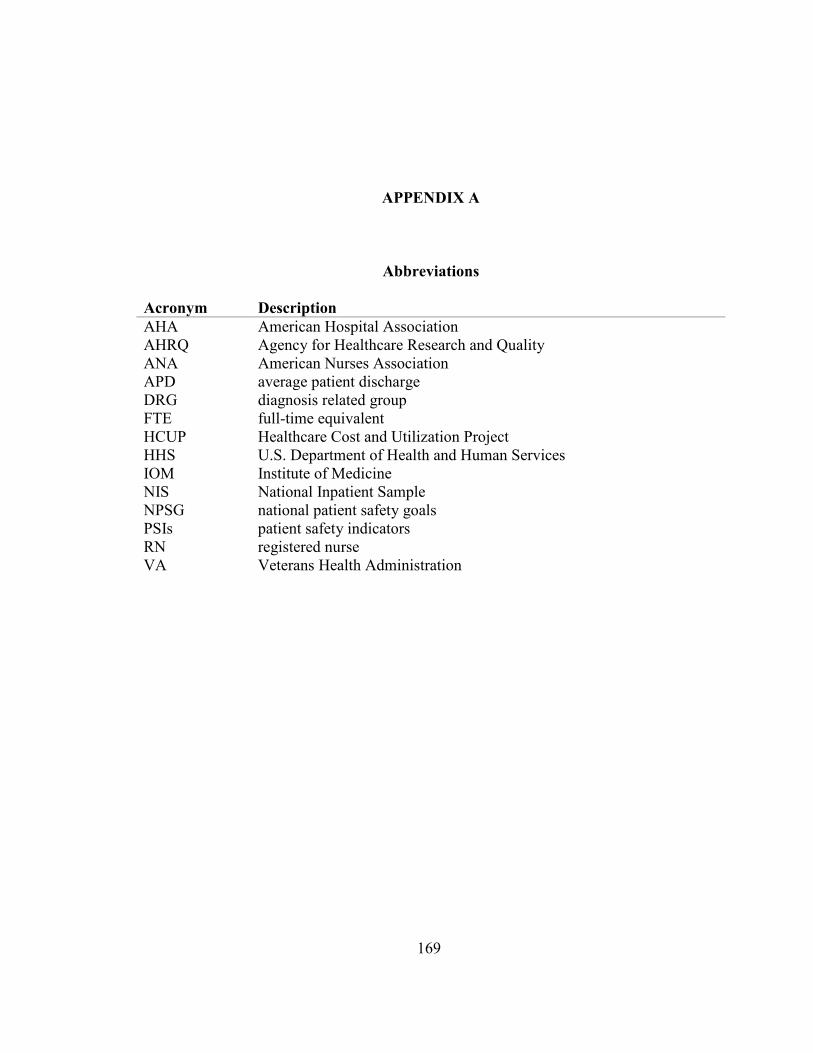
169
APPENDIX A
Abbreviations
Acronym Description
AHA AHRQ ANA APD DRG
American Hospital Association Agency for Healthcare Research and Quality American Nurses Association average patient discharge diagnosis related group
FTE HCUP HHS IOM NIS NPSG PSIs
full-time equivalent Healthcare Cost and Utilization Project U.S. Department of Health and Human Services Institute of Medicine National Inpatient Sample national patient safety goals patient safety indicators
RN VA
registered nurse Veterans Health Administration
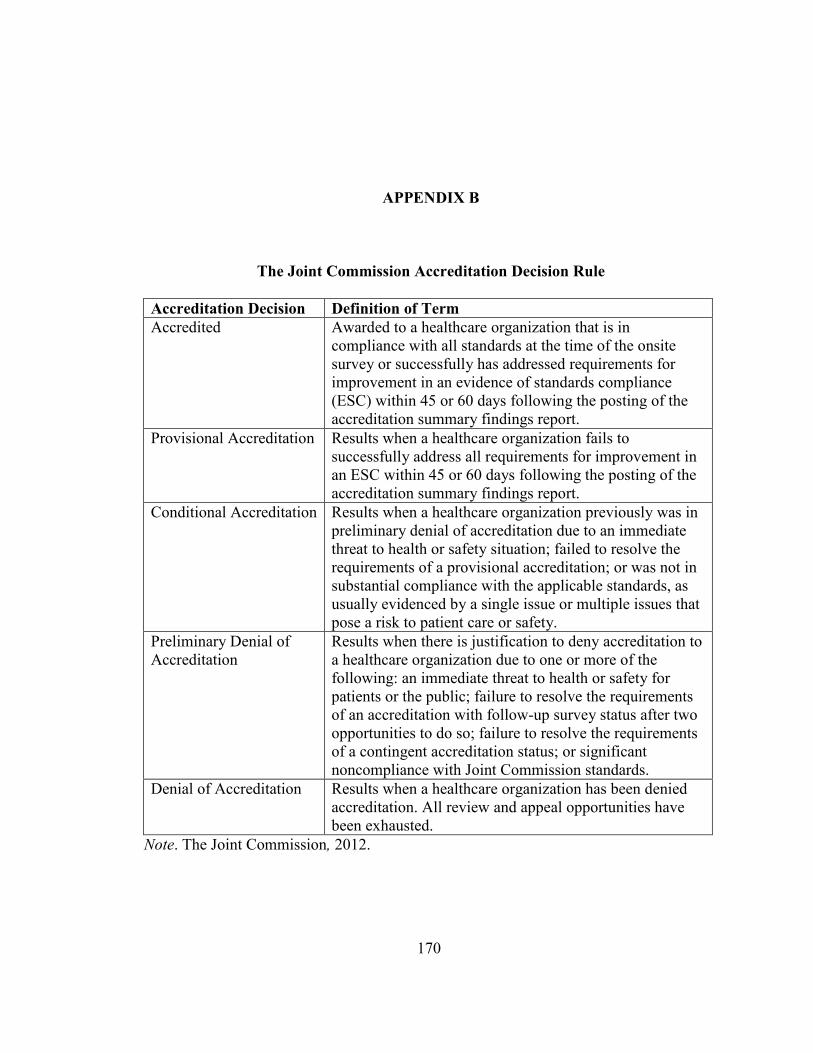
170
APPENDIX B
The Joint Commission Accreditation Decision Rule
Accreditation Decision Definition of Term
Accredited Awarded to a healthcare organization that is in compliance with all standards at the time of the onsite survey or successfully has addressed requirements for improvement in an evidence of standards compliance (ESC) within 45 or 60 days following the posting of the accreditation summary findings report.
Provisional Accreditation Results when a healthcare organization fails to successfully address all requirements for improvement in an ESC within 45 or 60 days following the posting of the accreditation summary findings report.
Conditional Accreditation Results when a healthcare organization previously was in preliminary denial of accreditation due to an immediate threat to health or safety situation; failed to resolve the requirements of a provisional accreditation; or was not in substantial compliance with the applicable standards, as usually evidenced by a single issue or multiple issues that pose a risk to patient care or safety.
Preliminary Denial of Accreditation
Results when there is justification to deny accreditation to a healthcare organization due to one or more of the following: an immediate threat to health or safety for patients or the public; failure to resolve the requirements of an accreditation with follow-up survey status after two opportunities to do so; failure to resolve the requirements of a contingent accreditation status; or significant noncompliance with Joint Commission standards.
Denial of Accreditation Results when a healthcare organization has been denied accreditation. All review and appeal opportunities have been exhausted.
Note. The Joint Commission, 2012.
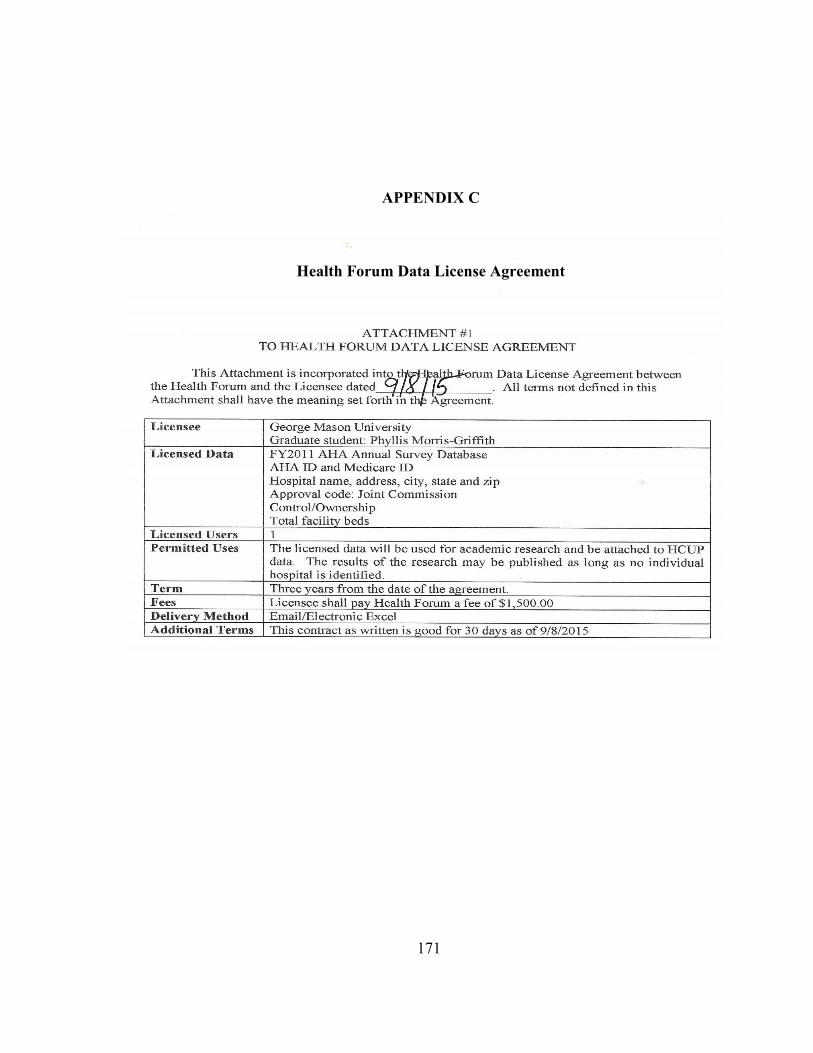
171
APPENDIX C
Health Forum Data License Agreement
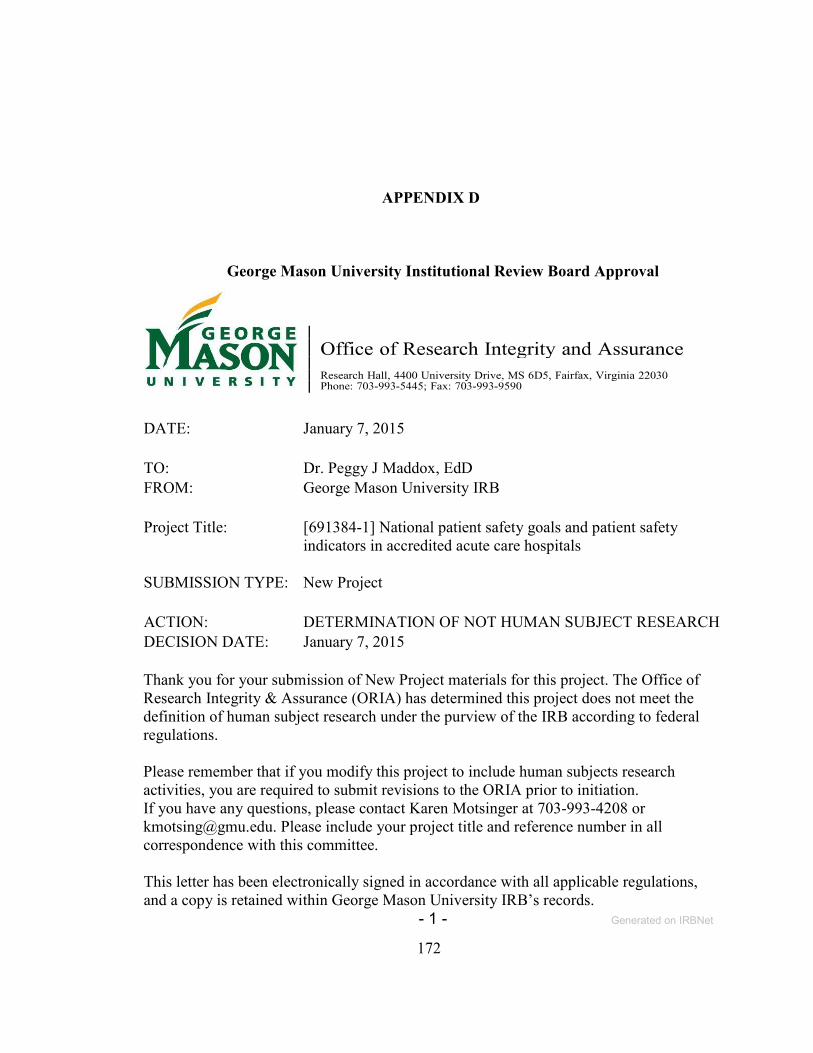
172
APPENDIX D
George Mason University Institutional Review Board Approval
DATE: January 7, 2015
TO: Dr. Peggy J Maddox, EdD
FROM: George Mason University IRB
Project Title: [691384-1] National patient safety goals and patient safety indicators in accredited acute care hospitals
SUBMISSION TYPE: New Project
ACTION: DETERMINATION OF NOT HUMAN SUBJECT RESEARCH
DECISION DATE: January 7, 2015
Thank you for your submission of New Project materials for this project. The Office of Research Integrity & Assurance (ORIA) has determined this project does not meet the definition of human subject research under the purview of the IRB according to federal regulations. Please remember that if you modify this project to include human subjects research activities, you are required to submit revisions to the ORIA prior to initiation. If you have any questions, please contact Karen Motsinger at 703-993-4208 or [email protected]. Please include your project title and reference number in all correspondence with this committee. This letter has been electronically signed in accordance with all applicable regulations, and a copy is retained within George Mason University IRB’s records.
- 1 - Generated on IRBNet

173
APPENDIX E
Healthcare Cost and Utilization Project Indemnification and Training Agreements

174
175
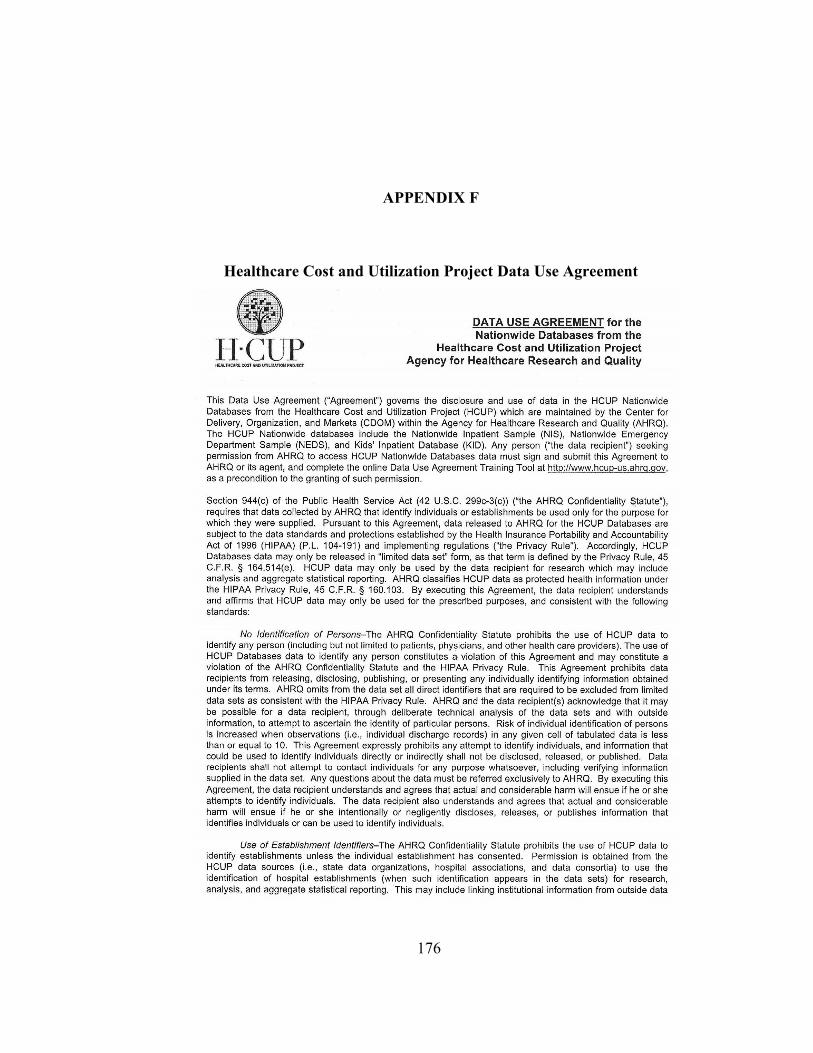
176
APPENDIX F
Healthcare Cost and Utilization Project Data Use Agreement
177

178

179
180
REFERENCES
Agency for Healthcare Research and Quality. (2002). Measures of patient safety based on
hospital administrative data⎯The patient safety indicators. Retrieved from http://www.qualityindicators.ahrq.gov/documentation.html
Agency for Healthcare Research and Quality. (2007). AHRQ quality indicators.
Retrieved from http://www.qualityindicators.ahrq.gov Agency for Healthcare Research and Quality. F(2010a). Guide to the prevention quality
indicators. Retrieved from http://www.qualityindicators.ahrq.gov/downloads/pqi/pqi_guide_v31.pdf
Agency for Healthcare Research and Quality. (2010b). Hospital survey on patient safety
culture: 2010 user comparative database report. Retrieved from http://www.ahrq.gov/qual/hospsurvey10/hosp/ochl.htm
Agency for Healthcare Research and Quality. (2010c). AHRQ quality indicators. Patient
safety indicators: Technical specifications. Retrieved from http://www.qualityindicators.ahrq.gov
Agency for Healthcare Research and Quality. (2010d). Introduction to the HCUP
nationwide inpatient sample (NIS). Retrieved from http://hcup-us.ahrq.gov/db/nation/NIS/2006NIS_introduction.pdf
Agency for Healthcare Research and Quality. (2011). AHRQ quality indicators.
Retrieved from http://www.qualityindicators.ahrq.gov Agency for Healthcare Research and Quality. (2012a). National healthcare disparities
report (AHRQ Publication No. 12-0006). Retrieved from http://archive.ahrq.gov/research/findings/nhqrdr/nhdr11/nhdr11.pdf
Agency for Healthcare Research and Quality. (2012b). Refinement of the HCUP quality
indicators (AHRQ Publication No. 01-0035). Retrieved from http://www.qualityindicators.ahrq.gov

181
Agency for Healthcare Research and Quality. (2013a). Medical teamwork and patient
safety. Retrieved from http://archive.ahrq.gov/research/findings/final-reports/medteam/index.html
Agency for Healthcare Research and Quality. (2013b). HCUP data use agreement for the
nationwide inpatient sample from Healthcare Cost and Utilization Project. Retrieved from http://www.hcupus.ahrq.gov/team/NIS%20DUA_%20062508.pdf
Agency for Healthcare Research and Quality. (2013c). Healthcare Cost and Utilization
Project data use agreement course. Retrieved from http://www.hcup us.ahrq.gov/DUA/508_course_032008/module/00_introduction/lp_00_010.htm
Aiken, L., Clarke, S., Cheung, R., Sloane, D., & Silber, J. (2003). Educational levels of
hospital nurses and surgical patient mortality. The Journal of the American
Medical Association, 290(12), 1617-1623. Aiken, L., Sloane, D., & Klocinski, J. (1997). Hospital nurses’ occupational exposure to
blood: Prospective, retrospective, and institutional reports. American Journal of Public Health, 81(1), 103-107.
Aiken, L., Sochalski, J., & Lake, E. (1997). Studying outcomes of organizational change
in health services. Medical Care, 35 [Supplemental material], NS6-NS18. Al-Haider, A., & Wan, T. (1991). Modeling organizational determinants of hospital
mortality. Health Services Research, 26(3), 303-323. Allison, J., Kiefe, C., Weissman, W., Person, S., Rouscupp, M., Canto, J., … Centor, R.
(2000). Relationship of hospital teaching status with quality of care and mortality for Medicare patients with acute MI. The Journal of the American Medical
Association, 284, 1256-1262. Altair, D., Gacki-Smith, J., Bauer, M. R., Jepsen, D., Paparella, S., VonGoerres, B., &
MacLean, S. (2009). Barriers to emergency department’s adherence to four medication safety-related joint commission national patient safety goals. The Joint
Commission Journal on Quality and Patient Safety, 35(1), 49-59. American Hospital Association. (2013). American Hospital Association annual survey
database. Prepared by Health Forum, L.L.C. Retrieved from http://www.ahadataviewer.com
American Nurses Association. (2013). Nurse staffing and patient outcomes in the
inpatient hospital setting. Washington, DC: American Nurses Publishing.
182
Andrews, L., Stocking, C., Krizek, T., Gottlief, L., Krizek, C., Vargish, T., & Siegler, M. (1997). An alternative strategy for studying adverse events in medical care. Lancet, 349, 309-13.
Apolone, G. (2000). The state of research on the multipurpose severity of illness scoring
systems: Are we on target? Intensive Care Medicine, 26, 1727-1729. Asch, S. M., Adams, J., Keesey, J., Hicks, J., DeCristofaro, A., & Kerr, E. A. (2003).The
quality of health care delivered to adults in the United States. The New England
Journal of Medicine, 348, 2635-2645. Ayanian, J. Z., & Weissman, J. S. (2002). Teaching hospitals and quality of care: A
review of the literature. Milbank Quarterly, 80(3), 569-593. Baker, C. M., Messmer, P. L., Gyurko, C. C., Domagala, S. E., Conly, F. M., Eads, T. S.,
… Layne, M. K. (2002). Hospital ownership, performance, and outcomes: Assessing the state-of-the-science. The Journal of Nursing Administration, 30(5), 227-240.
Baldwin, L., MacLehose, R. F., Hart, G., Beaver, S. K., Every, N., & Chan, L. (2004).
Quality of care for acute myocardial infarction in rural and urban U.S. hospitals. The Journal of Rural Health, 20(2), 99-108.
Ball, J. K., Elixhauser, A., Johantgen, M., Harris, D. R., & Goldfarb, M. (1998). HCUP
quality indicators, software user’s guide, version 1.1: Outcome, utilization, and
access measures for quality improvement (AHCPR Publication No. 98-0036). Rockville, MD: Agency for Healthcare Policy and Research.
Behrenholtz, S., Pronovost, P., & Lipsett, P. (2004). Eliminating catheter-related
bloodstream infections in the intensive care unit. Critical Care Medicine, 32(10), 2014-2020.
Berntsen, K. J. (2004). Valuable lessons in patient safety. Journal of Nursing Care
Quality, 19(3), 177-179. Blegen, M., Goode, C., & Reed, L. (1998). Nurse staffing and patient outcomes. Nursing
Research, 47(1), 43-50. Blegen, M., Goode, C., Spetz, J., Vaughn, T., & Park, S. (2011). Nurse staffing effects on
patient outcomes: Safety-net and non-safety-net hospitals. Medical Care, 49(4), 406-414.
183
Blegen, M. A., Vaughn, T., Pepper, G., Vojir, C., Stratton, K., Boyd, M., Armstrong, G. (2004). Patient and staff safety: voluntary reporting. American Journal of Medical
Quality, 19(2), 67-74. Bradley, E. H., Curry, L.A., Webster, T. R., Mattera, J. A., Roumanis, S. A., Radford, M.
J., Krumholz, H. M. (2006). Achieving rapid door-to-door balloon times: How top hospitals improve complex clinical systems. Circulation, 113(8), 1079-1085.
Brennan, T. A. (2000). The Institute of Medicine report of medical errors⎯Could it do harm? The New England Journal of Medicine, 342(15), 1123-1125.
Brennan, T. A., Hebert, L., Laird, N., Lawthers, A., Thorpe, K., Leape, L., … Hiatt, H.
(1991). Hospital characteristics associated with adverse events and substandard care. The Journal of the American Medical Association, 265(24), 3265-3269.
Brennan, T. A., Leape, L. L., Laird, N., Hebert, L., Localio, R., Lawthers, A., … Hiatt, H.
(1991). Incidence of adverse events and negligence in hospitalized patients: Results of the Harvard Medical Practice Study I. The New England Journal of
Medicine, 324, 370-376. Brook, R., McGlynn, E., & Cleary, P. (1996). Quality of health care. Part 2: Measuring
quality of care. The New England Journal of Medicine, 334(13), 996-970. Buerhaus, P. (2004). Lucian Leape on patient safety in the U.S. hospitals. Journal of
Nursing Scholarship, 36(4), 366-370. Campbell, E., Singer, S., Kitch, B. T., Iezzoni, L. I., & Myer, G. S. (2010). Patient safety
climate in hospitals: Act locally on variation across units. The Joint Commission
Journal on Quality and Safety, 36(7), 319-326. Centers for Disease Control and Prevention. (2011). Making health care safer. Retrieved
from http://www.cdc.gov/VitalSigns/pdf/2011-03-vitalsigns.pdf Centers for Disease Control and Prevention, National Center for Health Statistics. (2005).
NCHS overview. Retrieved from http://www.cdc.gov/nchs/data/factsheets/factsheet_overview.htm
Centers for Medicare & Medicaid Services. (2005). Premier hospital quality incentive
demonstration. Retrieved from http://www.cms.hhs.gov/HospitalQualityInits/35_HospitalPremier.asp
Centers for Medicare & Medicaid Services. (2010). Hospital quality initiatives. Retrieved
from http://www.cms.hhs.gov/HospitalQualityInits/16_InpatientMeasures.asp
184
Chaiken, B. P., & Holmquest, D. L. (2002). Patient safety: Modifying processes to eliminate medical errors. Journal of Quality Healthcare, 1(2), 20-23.
Chassin, M. R., & Leob, J. M. (2011). The ongoing quality improvement journey: Next
stop, high reliability. Health Affairs, 30(4), 559-568. Chen, J., Rathore, S. S., Radford, M. J., & Krumholz, H. M. (2003). JCAHO
accreditation and quality of care for acute myocardial infarction. Health Affairs,
22(2), 243-254. Choi, J., Bakken, S., Larson, E., Du, Y., & Stone, P. (2004). Perceived nursing work
environment of critical care nurses. Nursing Research, 53, 370-378. Clarke, S. P. (2014). Review: A realist logic model of the links between nurse staffing
and the outcomes of nursing. Journal of Research in Nursing, 19(1), 24-25. Clarke, S. P., & Aiken L. H. (2011). Failure to rescue: Needless deaths are prime
examples of the need for more nurses at the bedside. American Journal of
Nursing, 103, 42-47. Classen, D., Resar, R., Griffin, F., Federico, F., Frankel, T., Kimmel, N. … Brent, J.
(2011). Global trigger tool show that adverse events in hospitals may be ten times greater than previously measured. Health Affairs, 30(4), 581-589.
Cohen, H., Robinson, E. S., & Mandrack, M. (2003). Getting to the root of medication
errors: Survey results. Nursing 2003, 33(9), 36-45. Cohen, J. (1988). Statistical power analysis for the behavioral sciences (2nd ed.).
Hillsdale, NJ: Lawrence Erlbaum Associates, Inc. Cohen, J., & Cohen, P. (1983), Applied Multiple Regression. Hillsdale, NJ: Lawrence
Erlbaum Associates. Cooper J. B., Gaba, D. M., Liang B., Woods, D., & Blum, L. N. (2000). National Patient
Safety Foundation agenda for research and development in patient safety. Retrieved from http://www.medscape.com/viewarticle/408064
Couzigou, C., Lamory, J., Salmon-Ceron, D., Figard, J., & Vidal-Trecan, G. (2004).
Short peripheral venous catheters: Effect of evidence-based guidelines on insertion, maintenance and outcomes in a university hospital. Journal of Hospital
Infection, 59, 197-204.
185
Covell, C. L., & Ritchie, J. A. (2009). Nurse’s responses to medication errors: Suggestions for the development of organizational strategies to improve reporting. Journal of Nursing Quality Care, 24(4), 287-297.
Creswell, J. W. (2003). Research design: Qualitative, quantitative, and mixed methods
approaches (2nd ed.). Thousand Oaks, CA: Sage Publishing. Cunningham, W., Tisnado, D., Lui, H. H., Nakazono, T., & Carlisle, D. M. (1999). The
effect of hospital experience on mortality among patients hospitalized with acquired immunodeficiency syndrome in California. American Journal of
Medicine, 107, 137-143. Curchoe, R. M., Powers, J., & El-Daher, N. (2002). Weekly transparent dressing changes
linked to increased bacteria rates. Infection Control and Hospital Epidemiology,
23(12), 730-732. Death. (2012). In MedicineNet. Retrieved from
http://www.medterms.com/script/main/art.asp?articlekey=33438 Devereaux, P. J., Choi, P., Lachetti, C., Weaver, B., Schunemann, H., Haines, T. …
Guyatt, G. (2002). A systematic review and meta-analysis of studies comparing mortality rates of private for-profit and private not-for profit hospitals. Canadian
Medical Association Journal, 166, 1399-1406. Devers, K. J., Pham, H., & Liu, G. (2004). What is driving hospitals’ patient-safety
efforts? Health Affairs, 23(2), 103-115. Donabedian, A. (1966). Evaluating the quality of medical care [Supplemental material].
Milbank Quarterly, 44, 166-206. Donabedian, A. (1969). Part II-Some issues in evaluating the quality of nursing care.
American Journal of Public Health, 59(10), 1833-1835. Donabedian, A. (1978). The quality of medical care. Science, 200, 856-864. Donabedian, A. (1980). Exploration in quality assessment and monitoring. Vol. 1: The
definition of quality and approaches to its assessment. Ann Arbor, MI: Health Administration Press.
Donabedian, A. (1988). The quality of care: How can it be assessed? Journal of the
American Medical Association, 260(12), 1743-1748. Donabedian, A. (1997). The quality of care. How can it be assessed? 1988. Archives of
Pathology & Laboratory Medicine, 121(11), 1145-1150.

186
Donabedian, A. (2003). An introduction to quality assurance in health care. (1st ed., Vol.
1). New York, NY: Oxford University Press. Donabedian, A. (2005). Evaluating the quality of medical care. 1966. The Milbank
Quarterly, 83(4), 691-729. Dudley, R., Johanser, K., Brand, R., Rennie, D., & Milstein, A. (2000). Selective referral
to high-volume hospitals: Estimating potentially avoidable deaths. Journal of the
American Medical Association, 283, 1159-1166. Duffy, M. E. (2002). Methodological issues in web-based research. Journal of Nursing
Scholarship, 34(1), 83-88. Duggirala, A., Chen, F., & Gergen, P. (2004). Postoperative adverse events in teaching
and nonteaching hospitals. Family Medicine. 36(7), 508-513. Dupont, W., & Plummer, W. (1998). Sample size calculation for studies using linear
regression. Controlled Clinical Trials, 19, 589-601. Eaton, J., & Struthers, C. W. (2002). Measures of patient safety based on hospital
administrative data—The patient safety indicators. Retrieved from http://www.qualityindicators.ahrq.gov/documentation.html
Eaton, J., & Struthers, C. W. (2002). Using the Internet for organizational research: A
study of cynicism in the workplace. Cyber Psychology & Behavior, 5(4), 305-313.
Elashoff, J. D. (2007). NQueryadvisor® Release 7.0 Study Planning Software [Software].
Boston, MA: Statistical Solutions, Ltd. Elixhauser, A., Steiner, C., & Fraser, I. (2003). Volume thresholds and hospital
characteristics in the United States. Health Affairs, 22(2), 167-177. Elixhauser, A., Steiner, C., Harris, R., & Coffey, R. (2006). Comorbidity measures for
use with administrative data. Medical Care, 36(1), 8-27. Edmond M., & Eickhoff, T. C. (2008). Who is steering the ship? External influences on
infection control programs. Clinical Infectious Diseases, 11(46), 1746-1750. Etchells, E., Lester, R., Morgan, B., & Johnson, B. (2005). Striking a balance: Who is
accountable for patient safety? Healthcare Quarterly, 8, 146-150.
187
Fareed, N. (2012). Size matters: A meta-analysis on the impact of hospital size on patient mortality. International Journal of Evidence-Based Healthcare, 10, 103-111.
Fisher, E. S., Wennberg, D. E., Stukel, T. A., Gottlieb, D. J., Lucas, F. L., & Pinder, E. L.
(2003). The implications of regional variations in Medicare spending. Part 1: The content, quality, and accessibility of care. Annals of Internal Medicine, 138, 273-287.
Flanagan, J. C. (1954). The critical incident technique. Psychological Bulletin, 4(51),
327-358. Fleming, S., McMahon, L., Deshamais, S., Chesney, J., & Wroblewski, R. (1991). The
measurement of mortality: A risk-adjusted variable time window approach. Medical Care, 29, 815-828.
Flin, R. (2007), Measuring safety culture in healthcare: A care for accurate diagnosis.
Safety Science, 45, 653-667. Flood, S., & Diers, D. (1988). Nurse staffing, patient outcomes and cost. Nursing
Management, 19(5), 35-43. Fonarow, C., Yancy, C., & Heywood, J. (2005). Adherence to heart failure quality of care
indicators in U.S. hospitals: Analysis of the Adhere registry. Archives of Internal
Medicine, 135(13), 1469-1477. Frankenfield, D., Sugarman, J., Presley, R., Helgerson, S., & Rocco, M. (2000). Impact
of facility size and profit status on intermediate outcomes in chronic dialysis patients. American Journal of Kidney Diseases, 36(2), 318-326.
Fridkin, S., Pear, S., Williamson, T., Gallgiani, J., & Jarvis, W. (1996). The role of
understaffing in central venous catheter-associated bloodstream infections. Infection Control and Hospital Epidemiology, 17, 150-158.
Galpern, D., Guerrero, A., Tu, A., Fahoum, B., & Wise, L. (2008). Effectiveness of a
central line bundle campaign on line-associated infections in the intensive care unit. Journal of Surgery, 144, 492-495.
Gastmeier, P., & Geffers, C. (2006). Prevention of catheter-related bloodstream
infections: Analysis of studies published between 2002 and 2005. Journal of
Hospital Infection, 64(4), 326-335. Glickman, S. W., Baggett, K. A., Krubert, C. G., Peterson, E. D., & Schulman, K. A.
(2007). Promoting quality: The health-care organization from a management perspective. International Journal of Quality Health Care, 19(6), 341-348.
188
Goldman, L. E., & Dudley, R. A. (2008). United States rural hospital quality in the
hospital: Compare database-accounting for hospital characteristics. Health Policy,
87(1), 112-127. Hall, M. J., Levant, S., & DeFrances, C. J. (2013). Trends in inpatient hospital deaths:
National hospital discharge survey, 2000-2010 (Data Brief No. 118). Retrieved from http://www.cdc.gov/nchs/data/databriefs/db118.htm
Halm, E., Lee, C., & Chassin, M. (2002). Is volume related to outcome in health care? A
systematic review and methodologic critique of literature. Annals of Internal
Medicine, 137(137), 511-520. Hart, A., & Stegman, M. (Eds.). (2007). ICD-9-CM expert for hospitals: International
classification of diseases, 9th revision clinical modification. Salt Lake City, UT: Ingenix.
Hartz, A., Krakauer, H., Kuhn, E., Young, M., Jacobsen, S., Gay, G., … Rimm, A. (1989). Hospital characteristics and mortality rates. The New England Journal of
Medicine, 321(25), 1720-1725. Healthcare Cost and Utilization Project. (2011a). Introduction to the HCUP nationwide
inpatient sample 2011. Retrieved from http://www.hcup-us.ahrq.gov/db/nation/nis/NIS_Introduction_2011.pdf
Healthcare Cost and Utilization Project. (2011b). HCUP summary statistics report: 2011
AHA annual survey of hospitals, contents of AHA survey file. Retrieved from http://www.hcup-us.ahrq.gov/db/other/aha/AHA_2011_Survey_SummaryStats.PDF
Healthcare Cost and Utilization Project. (2011c). Elixhauser Comorbidity Software,
Version 3.7. Retrieved from http://www.hcup-us.ahrq.gov/toolssoftware/comorbidity/comorbidity.jsp
Healthcare Cost and Utilization Project. (2013). NIS Description of data elements:
Region of hospital. Retrieved from http://www.hcup-us.ahrq.gov/db/vars/hosp_region/nisnote.jsp
Healthcare Cost and Utilization Project. (2015). NIS description of data elements:
Bedsize of hospital. Retrieved from http://www.hcup-us.ahrq.gov/db/vars/hosp_bedsize/nisnote.jsp
189
Healthgrades. (2004). Patient safety in American hospitals. Retrieved from http://www.providersedge.com/ehdocs/ehr_articles/Patient_Safety_in_American_Hospitals-2004.pdf
Healthgrades. (2010). Patient safety incidents at U.S. hospitals show no decline: Cost $9
billion. Retrieved from https://www.healthgrades.com/about/press-room/patient-safety-incidents-at-us-hospitals-show-no-decline-cost-9-billion
Healthgrades. (2014). American hospital quality outcomes. Retrieved from
https://d2dcgio3q2u5fb.cloudfront.net/56/90/e07df9f64a5fb741ab59924a9e0d/2013-american-hospital-quality-outcomes-2014-healthgrades-report-to-the-nation.pdf
Health Forum, LLC. (2008). Data sources for AHAData.com. Retrieved from
http://www.ahadataviewer.com Hegyvary, S. (1991). Issues in outcomes research. Journal of Nursing Quality Assurance,
5(2), 1-6. Hibbard, J. H., & Pawlson, L. G. (2004).Why not give consumers a framework for
understanding quality? Joint Commission Journal on Quality Improvement, 30(6), 347-351.
Hoff, T. J., & Sutcliffe, K. M. (2006). Studying patient safety in health care
organizations: Accentuate the qualitative. Joint Commission Journal on Quality &
Patient Safety, 32(1), 5-15. Hofmann, D. A., & Mark, B. (2006). An investigation of the relationship between safety
climate and medication errors as well as other nurse and patient outcomes. Personnel Psychology, 59(4), 847-869.
Houchens, R., Elixhauser, A., & Romano, P. (2008). How often are potential patient
safety events present on admission? The Joint Commission Journal on Quality &
Patient Safety, 34(3), 154-163. Hougland, P., Nebeker, J., Pickard, S., Tuinen, M., Masheter, C., Elder, S., … Xu, W.
(2008). Using ICD-9-CM codes in hospital claims data to detect adverse events in
patient safety surveillance. Retrieved from http://www.ahrq.gov/downloads/pub/advances2/vol1/advances-Hougland_26.pdf
Hughes, R., & Kelly, P. (2008). The health care environment. In P. Kelly (Ed.), Nursing
leadership and management (2nd ed.). Clifton Park, NY: Delmar Learning.

190
Hussey, P., Mattke, S., Morse, L., & Ridgely, M. (2006). Evaluation of the use of the
AHRQ and other quality indicators (Rand Report WR-426-HS, Prepared for the Agency for Healthcare Research and Quality). Santa Monica, CA: Rand Health.
Hyman, W. (2014). A work plan for The Joint Commission alarm national patient safety
goal. Journal of Clinical Engineering, 39(1), 23-27. Iezzoni, L. I. (1994). Risk adjustment for medical effectiveness research: An overview of
conceptual and methodological considerations. Journal of Investigative Medicine,
43(2), 136-150. Iezzoni, L. I. (1997). Assessing quality using administrative data. Annals of Internal
Medicine, 127, 666-674. Iezzoni, L. I., Daley, J., Heeren, T., Foley, S. M., Hughes, J. S., Fisher, E., ... Coffman,
G. A. (1994). Using administrative data to screen hospitals for high complication rates. Inquiry, 31, 40-45.
Iezzoni, L. I., Mackiernan, Y. D., Cahalane, M. J., Phillips, R. S., Davis, R. B., & Miller,
K. (1999). Screening inpatient quality using post-discharge events. Medical Care, 37(4), 384-398.
Institute for Healthcare Improvement. (2006). 100K Lives Campaign. Retrieved from
http://www.ihi.org/engage/initiatives/completed/5MillionLivesCampaign/Pages/default.aspx
Institute for Healthcare Improvement. (2010). Respectful management of serious clinical
adverse events. Retrieved from https://www.transplantpro.org/wp-content/uploads/sites/3/IHIManagementofClinicalAdverseEventsSep10.pdf
Institute of Medicine. (1999). Medicare: A strategy for quality assurance (Vol. 1).
Washington, DC: National Academies Press. Institute of Medicine. (2000). To err is human: Building a safer health system.
Washington, DC: The National Academies Press. Institute of Medicine. (2001). Crossing the quality chasm: A new health system for the
21st century. Washington, DC: The National Academies Press.
Institute of Medicine. (2003). Health professions education: A bridge to quality. A. Greiner, & E. Knebal (Eds.). Washington, DC: The National Academies Press.
Institute of Medicine. (2004a). Keeping patients safe: Transforming the work
environment of nurses. Washington, DC: The National Academies Press.
191
Institute of Medicine. (2004b). Patient safety: Achieving a new standard for care.
Washington, DC: The National Academies Press. Isaac, T., & Jha, A. (2008). Are patient safety indicators related to widely used measures
of hospital quality? Journal of General Internal Medicine, 23(9), 1373-1378. James, J. T. (2013). A new, evidence-based estimate of patient harms associated with
hospital care. Journal of Patient Safety, 9(3), 122-128. Jha, A. K., Li. Z., Orav, E. J., Epstein, A. M. (2005). Care in U.S. hospitals: The hospital
quality alliance program. The New England Journal of Medicine, 353(3), 265-274.
Kane, R., Shamliyan, T., Mueller, C., Duval, S., & Wilt, T. (2007). Nursing staffing and
quality of care (Prepared by Minnesota Evidence-based Practice Center under Contract No. 290-02-0009, Evidence Report, Technology Assessment No. 151). Rockville, MD: Agency for Healthcare Research and Quality.
Kim, J., An, K., Kang Kim, M., & Yoon, S. H. (2007). Nurses perception of error
reporting and patient safety culture in Korea. Western Journal of Nursing
Research, 29(7), 827-844. King, T., & Byers, J. F. (2007). A review of organizational culture instruments for nurse
executives. The Journal of Nursing Administration, 37(1), 21-31. Kizer, K. W., & Blum, L. N. (2005). Safe practices for better health care. In Agency for
Healthcare Research and Quality, Advances in Patient Safety: From research to
implementation (AHRQ Publication No. 05-0021-4). Rockville, MD: Agency for Healthcare Research and Quality.
Kohn, L. T., Corrigan, J. M., & Donaldson, M. S. (1999). To err is human: Building a
safer health system. Retrieved from http://www.nap.edu/catalog/9728.html Kohn, L. T., Corrigan, J. M., & Donaldson, M. S. (2000). To err is human: Building a
safer health system. A report of the Committee on Quality of Health Care in
America, Institute of Medicine. Washington, DC: The National Academies Press. Kovner, C., & Gergen, P. (1998). Nurse staffing levels and adverse events following
surgery in U.S. hospitals. Journal of Nursing Scholarship, 30(4), 315-321. Kovner, C., Jones, J., Zhan, C., Gergen, P., & Basu, J. (2002). Nurse staffing and
postsurgical adverse events: An analysis of administrative data from a sample of U.S. hospitals, 1990-1996. Health Services Research, 37(3), 611-629.
192
Kramer, M., & Hafner, L. P. (1989). Shared values: Impact on staff nurse job satisfaction
and perceived productivity. Nursing Research, 38(3), 172-177. Kupersmith, J. (2005). Quality of care in teaching hospitals: A literature review.
Academic Medicine, 80(5), 458-466. Lagasse, R. (2002). Anesthesia safety: Model or myth. Anesthesiology, 97(6), 1609-1617. Lake, E. T., & Friese, C. R. (2006). Variations in nursing practice environments: Relation
to staffing and hospital characteristics. Nursing Research, 1(55), 1-9. Landrigan, C. P., Parry, G. J., Bones, C. B., Hackbarth, A. D., Goldmann, D. A., &
Sharek, P. J. (2010). Temporal trends in rates of patient harm resulting from medical care. The New England Journal of Medicine, 363, 2124-2134.
Lang, T. A., Hodge, M., Olson, V., Romano, P. S., & Kravitz, R. L. (2004). Nurse-patient
ratios: A systematic review on the effects of nurse staffing on patient, nurse employee, and hospital outcomes. The Journal of Nursing Administration 34(7-8), 326-337.
Lawthers, A., McCarthy, E., Davis, R., Peterson, L., Palmer, H., & Iezzoni, L. I. (2000).
Identification of in-hospital complications from claims data: Is it valid? Medical
Care, 35(8), 785-795. Leape, L. L. (1994). Error in medicine. The Journal of American Medical Association,
272(23), 1851-1857. Leape, L. L. (2002). Reporting of adverse events. The New England Journal of Medicine,
347(20), 1633-1638. Leape, L. L., & Berwick, D. M. (2005). Five years after To Err is Human: What have we
learned? The Journal of the American Medical Association, 293(19), 2384-2390. Leape, L. L., Berwick, D. M, & Bates, D. (2002). What practices will most improve
safety? The Journal of the American Medical Association, 288(4), 501-507. Leape, L. L., Brennan, T., Laird, N., Hebert, L., Localio, R., Lawthers, A., … Hiatt, H.
(1991). The nature of adverse in hospitalized patients: Results of the Harvard Medical Practice Study II. The New England Journal of Medicine, 324, 377-384.
Lee, J., Chang, B., Pearson, M., Kahn, K., & Rubenstein, L. (1999). Does what nurses do
affect clinical outcomes for hospitalized patients? A review of the literature. Part 1. Health Services Research, 34(5), 1011-1027.
193
Lehman, L., Puopolo, A., Shaykevich, S., & Brennan, T. (2005). Iatrogenic events
resulting in intensive care admission: Frequency, cause, and disclosure to patients and institutions. The American Journal of Medicine, 118, 409-413.
Levit, K., Ryan, K., Elixhauser, A., Stranges, E., Kassed, C., & Coffee, R. (2007). HCUP
facts and figures: Statistics on hospital-based care in the United States, 2005. Retrieved from https://www.hcup-us.ahrq.gov/reports/factsandfigures/HAR_2005.pdf
Lichting, L., Knauf, R., & Milholland, D. (1999). Some impacts of nursing on acute care
hospital outcomes. The Journal of Nursing Administration, 29(2), 25-33. Loux, S., Payne, S., & Knott, A. (2005). Comparing patient safety in rural hospitals by
bed count. In Agency for Healthcare Research and Quality, Advances in patient
safety: From research to implementation, Vol. 1 (AHRQ Publication No. 05-0021-1). Retrieved from http://www.ahrq.gov/sites/default/files/wysiwyg/professionals/quality-patient-safety/patient-safety-resources/resources/advances-in-patient-safety/vol1/Loux.pdf
Lyder, C. H., Wang, Y., Metersky, M., Curry, M., Kliman R., Verzier, N. R., & Hunt, D.
R. (2012). Hospital-acquired pressure ulcers: Results from the national Medicare patient safety monitoring system study. Journal of the American Geriatrics
Society, 60(9), 1603-1608. Maddox, P. J., Wakefield, M., & Bull, J. (2001). Patient safety and the need for
professional and educational change. Nursing Outlook, 49(1), 8-13. Mangram, A. J., Horan, T. C., Pearson, M. L., Silver, L., & Jarvis, W. (1999). Guideline
for prevention of surgical site infection, 1999. Infection Control & Hospital
Epidemiology. Retrieved from https://www.cdc.gov/hicpac/pdf/SSIguidelines.pdf Masica, A., Richter, K., Convery, P., & Haydar, Z. (2009). Linking Joint Commission
inpatient core measures and national patient safety goals with evidence. Baylor
University Medical Center Proceedings, 22(2), 103-111. Maynard, C., Every, N., Chapko, M. K., & Ritchie, J. L. (2000). Outcomes of coronary
angioplasty procedures performed in rural hospitals. The American Journal of
Medicine, 108(9), 710-713. McDonald, K., Romano, P., Geppert, J., Davies, S., Duncan, B., & Shojania, K. (2002).
Measures of patient safety based on hospital administrative data: The patient
safety indicators (Prepared by the University of California San Francisco-

194
Stanford Evidence-based Practice Center under Contract No. 290-97-0013, AHRQ Publication No. 02-0038). Rockville, MD: Agency for Healthcare Research and Quality.
McGillis Hall, L., Irvine Doran, D., Baker, G., Pink, G., Sidani, S., O’Brien-Pallas, L., &
Donner, G. (2001). A study of the impact of nursing staff mix models and
organizational change strategies on patient, system and nurse outcomes. Toronto, Ontario: Faculty of Nursing, University of Toronto and Canadian Health Service Research Foundation/Ontario Council of Teaching Hospitals.
McGillis Hall, L., Irvine Doran, D., & Pink, G. H. (2004). Nurse staffing models, nursing
hours, and patient safety outcomes. The Journal of Nursing Administration, 34(1), 41-45.
Meade, M., & Erickson, R. J. (2000). Medical Geography. New York, NY: The Guilford
Press. Mello, M. M., Kelly, C. N., & Brennan, T. A. (2005). Fostering rational regulation of
patient safety. Journal of Health Politics, Policy and Law, 30(3), 375-426. Merrill, C. A., & Elixhauser, A. (2005). Hospitalization in the United States, 2002
(HCUP Fact Book No. 6., AHRQ Publication No. 05-0056). Rockville, MD: Agency for Healthcare Research and Quality.
Mertler, C. A., & Vannatta, R. A. (2005). Advanced and multivariate statistical methods
(3rd ed.). Glendale, CA: Pyrczak Publishing. Merwin, E., & Thomlow, D. (2006). Methodologies used in nursing research designed to
improve patient safety. Annual Review of Nursing Research, 24, 273-292. Miller, M. R., Elixhauser, A., Zhan, C., & Meyer, G. S. (2001). Patient safety indicators:
Using administrative data to identify patient safety concerns. Health Services
Research, 36, 110-132. Miller, M. R., Pronovost, P. J., Donithan, M., Zeger, S., Zhan, C., Morlock, L., & Meyer,
G. S. (2005). Relationship between performance measurement and accreditation: Implications for quality of care and patient safety. American Journal of Medical
Quality, 20(5), 239-252. Mitchell, P., & Shortell, S. (1997). Adverse outcomes and variations in organization of
care delivery. Medical Care, 35, NS19-NS32.

195
Mitchell, P. H., Ferketich, S., Jennings, B. M., & American Academy of Nursing Expert Panel on Quality Health Care. (1998). Quality health outcomes model. Journal of
Nursing Scholarship, 30(1), 43-46. Moody, R. F. (2006). Safety culture on hospital nursing units: Human performance and
organizational system factors that make a difference (Unpublished dissertation). Indiana University, Indianapolis, IN.
Moore, L., Moore, F. A., Todd, S. R., Jones, S. L., Turner, K., & Bass, B. L. (2010).
Sepsis in general surgery: The 2005-2007 National Surgical Quality Improvement Program perspective. Archives of Surgery, 145(7), 695-700.
Moorhead, S., Johnson, M., Maas, M., & Swanson, E. (2008). Outcome development and
significance. In S. Moorhead, M. Johnson, M. Maas, & E. Swanson (Eds.), Nursing Outcomes Classification (4th ed.). St. Louis, MO: Mosby Elsevier.
Morello, R., Lowthian, J., Barker, A. L., Mcginnes, R. A., Dunt, D., & Brand, C. (2012).
Strategies for improving patient safety culture in hospitals: A systematic review. BJM Quality and Safety, 22(1), 1-8.
Morgan, D. L. (1998). Practical strategies for combining qualitative and quantitative
methods: Applications to health research. Qualitative Health Research, 8(3), 362-376.
Morse, J. M. (1991). Approaches to qualitative-quantitative methodological triangulation.
Nursing Research, 40, 120-123. Munro, B. H. (2005). Statistical methods for health care research (5th ed.). Philadelphia,
PA: Lippincott Williams & Wilkins. National Patient Safety Foundation. (2003). National agenda for action: Patients and
families in patient safety, Nothing about me, without me. Retrieved from http://c.ymcdn.com/sites/www.npsf.org/resource/collection/abab3ca8-4e0a-41c5-a480-6de8b793536c/Nothing_About_Me.pdf
National Pressure Ulcer Advisory Panel, European Pressure Ulcer Advisory Panel, & Pan
Pacific Pressure Injury Alliance. (2014). Interventions for prevention and treatment of pressure ulcers. In Prevention and treatment of pressure ulcers:
Clinical practice guideline. Retrieved from http://www.guideline.gov/content.aspx?id=48865
National Quality Forum. (2006). Safe practices for better healthcare: A consensus report.
Washington, DC: National Quality Forum.
196
National Quality Forum. (2010). Safe practices for better healthcare: A consensus report.
Washington, DC: National Quality Forum. National Quality Forum. (2010). About us. Retrieved from
http://www.qualityforum.org/about Needleman, J., Buerhaus, P., Mattke, S., Stewart, M., & Zelevinsky, K. (2001). Nurse
staffing and patient outcomes in hospitals (Report No. 230-99-0021). Boston, MA: Health Services Administration.
Needleman, J., Buerhaus, P., Mattke, S., Stewart, M., & Zelevinsky, K. (2002). Nurse
staffing levels and the quality of care in hospitals. The New England Journal of
Medicine, 346, 1715-1722. Nieva, V., & Sorra, J. (2003). Safety culture assessment: A tool for improving patient
safety in health care organizations. Quality & Safety in Health Care,
12(Supplement 2), ii17-ii23. Nordgren, L. D., Johnson, T., Kirschbaum, M., & Peterson, M. L. (2004). Medical errors:
Excess hospital costs and lengths of stay. Journal for Healthcare Quality, 26(2), 42-48.
O’Grady, N. P., Alexander, M., Dellinger, P., Gerberding, J., Heard, S., Maki, D. …
Weinstein, R. A. (2002). Guidelines for the prevention of intravascular catheter-related infections, 2002. Infection Control and Hospital Epidemiology, 23(12), 759-769.
O’Malley, K., Cook, K., Price, M. D., Wildes, K. R., Hurdle, J. F., & Ashton, C. M.
(2005). Measuring diagnoses: ICD code accuracy. Health Services Research,
40(5), 1620-1639. Park, E. R., Brook, R. H., Kosecoff, J., Keesey, J., Rubenstein, L., Keeler, E., … Chassin,
M. R. (1990). Explaining variations in hospital death rates randomness, severity of illness, quality of care. The Journal of the American Medical Association, 264(4), 484-490.
Pedhazur, E. J. (1984). Sense and nonsense in hierarchical regression analysis: Comment
on Smyth. Journal of Personality and Social Psychology, 46(2), 479-482. Perrin, E. (2002). Some thought on outcomes research, quality improvement, and
performance measurement. Medical Care. 40(6), 89-91.
197
Person, S. D., Allison, J. J., Kiefe, C., Weaver, M. T., Williams, O. D., Centor, R., & Weissman, N. W. (2004). Nurse staffing and mortality for Medicare patients with acute myocardial infarction. Medical Care, 42(1), 4-12.
Peterson, A. M., & Walker, P. H. (2006). Hospital-acquired infections as patient safety
indicators. Annual Review of Nursing Research, 24, 75-99. Peterson, E., DeLong, E., Jollis, J., Muhlbaier, L., & Mark, D. (1998). The effects of New
York’s bypass surgery provider profiling on access to care and patient outcomes in the elderly. Journal of American College of Cardiology, 32, 993-999.
Pierce, S. F. (1997). Nurse-sensitive health care outcomes in acute care settings: An
integrative analysis of the literature. Journal of Nursing Care Quality, 11(4), 7-8. Polit, D. F., & Beck, C. T. (2004). Nursing research: Principles and methods (7th ed.).
Philadelphia, PA: Lippincott, Williams & Wilkins. Polit, D. F., & Beck, C. T. (2008). Nursing research: Principles and methods (8th ed.).
Philadelphia, PA: Lippincott Williams & Wilkins. Pringle, D., & Doran, D. M. (2003). Patient outcomes as an accountability. In D. Doran
(Ed.), Nursing-sensitive outcomes: State of the science (pp.1-25). Sudbury, MA: Jones and Bartlett.
Pronovost, P. J., Weast, B., Holzmueller, C. G., Rosenstein, B. J., Kidwell, R. P., Haller,
K. B., & Rubin, H. R. (2003). Evaluation of the culture of safety: Survey of clinicians and managers in an academic medical center. Quality and Safety in
Health Care, 12, 405-410. Rantz, M. J., & Connolly, R. P. (2004). Measuring nursing care quality and using large
data sets in non-acute care settings: State of the science. Nursing Outlook, 52, 23-37.
Reason, J. T. (1990). The contribution of latent human failures to the breakdown of
complex systems. Philosophical Transactions of the Royal Society of London, 327, 475-484.
Reason, J. T. (1998). Human error. Cambridge, United Kingdom: Cambridge University
Press. Reason, J. T. (2000). Human error: Models and management. British Medical Journal,
3(20), 768-770.

198
Respiratory Failure. (n.d.). In MedicineNet.com. Retrieved from http://www.medterms.com/script/main/art.asp?articlekey=10698
Rivard, P. E., Luther, S., Christiansen, C., Zhao, S., Loveland, S., Elixhauser, A., …
Rosen, A. K. (2008). Using patient safety indicators to estimate the impact of potential adverse events on outcomes. Medical Care Research and Review, 65(1), 67-87.
Rivard, P. E., Rosen, A. K., & Carroll, J. S. (2006). Enhancing patient safety through
organizational learning: Are patient safety indicators a step in the right direction? Health Services Research, 41(4), 1633-1649.
Rogowski, J., Horbar, J. D., Staiger, D., Kenny M., Carpenter, J., & Geppert, J. (2004).
Indirect and direct hospital quality indicators for very low weight birth weight infants. The Journal of the American Medical Association, 291(2), 202-209.
Rojas, M., Silver, A., Llewellyn, C., & Ranees, L. (2005). Study of adverse occurrences
and major functional impairment following surgery. Advances in patient safety:
From research to implementation (AHRQ Publication Nos. 050021 1-4). Rockville, MD: Agency for Healthcare Research and Quality.
Romano, P. S., Chan, B. K., Schembri, M. E., & Rainwater, J. A. (2002). Can
administrative data be used to compare postoperative complication rates across hospitals? Medical Care, 40(10), 856-867.
Romano, P. S., Geppert, J. J., Davies, S., Miller, M. R., Elixhauser, A., & McDonald, K.
M. (2003). A national profile of patient safety in U.S. hospitals. Health Affairs,
22(2), 154-165. Romano, P. S., Mull, H. J., Rivard, P. E., Zhao, S., Henderson, W. G., Loveland, S., …
Rosen, A. K. (2009). Validity of selected AHRQ patient safety indicators based on VA national surgical quality improvement program data. Health Services
Research, 44, 182-204. Romano, P. S., Roos, L. L., & Jollis, J. G. (1993). Adapting a clinical comorbidity index
for use with ICD-9-CM administrative databases: Differing perspectives. Journal
of Clinical Epidemiology, 45, 613-619. Rondenau, K. V., & Waga, T. H. (2002). Organizational learning and continuous quality
improvement: Examining the impact on nursing home performance. Healthcare
Management Forum, 15(2), 17-23.
199
Rosen, A. K., Rivard, P., Zhao, S., Loveland, S., Tsilimingras, D., Christiansen, C. L., … Romano, P. S. (2005). Evaluating the patient safety indicators: How well do they perform on Veterans Health Administration data? Medical Care, 43(9), 873-884.
Rosen, A., Zhao, S., Rivard, P., Loveland, S., Montez-Rath, M., & Elixhauser, A. (2006).
Tracking rates of patient safety indicators over time: Lessons from the Veterans Administration. Medical Care, 44(9), 850-861.
Rosenthal, G., Harper, D., Quinn, L., & Cooper, G. S. (1997). Severity-adjusted mortality
and length of stay in teaching and nonteaching hospitals. The Journal of the
American Medical Association, 278(6), 485-490. Rothschild, J. M., Hurley, A. C., Landrigan, C. P., Cronin, J. W., Martell-Waldrop, K.,
Foskett, C., … Bates, D. W. (2006). Recovery from medical errors: The critical care nursing safety net. Joint Commission Journal on Quality and Patient Safety, 32(2), 63-72.
Russo, C. H., Steiner, C., & Spector, W. (2008). Hospitalizations related to pressure
ulcers among adults 18 years and older. Rockville, MD: Agency for Healthcare Research and Quality.
Salive, M., Mayfield, J., & Weissman, N. (1990). Patient outcomes research teams and
the Agency for Health Care Policy and Research. Health Services Research, 25, 697-708.
Sammer, C. E., Lykens, K., Singh, K. P., Mains, D. A., & Lackan, N. A. (2010). What is
patient safety culture? A review of the literature. Journal of Nursing Scholarship,
42(2), 156-165. Sandhu, A., Moscucci, M., Dixon, S., Wohns, D. H., Share, D., LaLonde, T., … Gurm,
H. S. (2013). Differences in the outcome of patients undergoing percutaneous coronary interventions at teaching versus nonteaching hospitals. American Heart
Journal, 166(3), 401-408. Savitz, L. A., Jones, C. B., & Bernard, S. (2004). Quality indicators sensitive to nurse
staffing in acute care settings. Advances in Patient Safety, 4, 375-385. Schein, E. (1995). Defining organizational culture. In J. T. Wren (Ed.), The leader’s
companion: Insights on leadership through the ages. New York, NY: The Free Press.
Schimmel, E. M. (1964). The hazards of hospitalization. Annals of Internal Medicine, 60,
100-109.

200
Scott, T., Mannion, R., Davies, H., Martin N., & Marshall, M. (2003). Implementing culture change in health care: Theory and practice. International Journal for
Quality in Health Care, 15(2) 111-118. Scott-Cawiezell, J., Vogelsmeier, A., McKenney, C, Rantz, M., Hicks, L., & Zellmer, D.
(2006). Moving from a culture of blame to a culture of safety in nursing home setting. Nursing Forum, 41, 133-140.
Seago, J. (2001). Nurse staffing, models of care delivery, and interventions: Evidence
report, technology assessment No. 43. Rockville, MD: Agency for Healthcare Research and Quality.
Sepsis. (n.d.). In Sepsis Alliance. Retrieved from http://www.sepsis.org/sepsis/definition Schimmel, E. M. (1964). The hazards of hospitalization. Annuals of Internal Medicine,
60, 100-109. Sharpe, V.A. (2003). Promoting patient safety: An ethical basis for policy deliberation.
Hasting Center Report, 33, S1-S20.
Shojania, K., Duncan, B., McDonald, K., & Wachter, R. (2001). Making health care
safer: A critical analysis of patient safety practices (Evidence Report, Technology Assessment No. 43, No 01-E058). Rockville, MD: Agency for Healthcare Research and Quality.
Shojania, K., Duncan, B., McDonald, K., & Wachter, R. (2002). Safe but sound: Patient
safety meets evidence-based medicine. The Journal of the American Medical
Association, 288(4), 508-513. Shreve, J, van Den Bos, J., Gray, T., Halford, M., Rustagi, K., & Ziemkiewicz, E. (2010)
The economic measurement of medical errors. Retrieved from https://www.soa.org/files/research/projects/research-econ-measurement.pdf
Silber, J. H., Williams, S. V., Krakauer, H., & Schwartz, J. S. (1992). Hospital and
patient characteristics associated with death after surgery: A study of adverse occurrence and failure to rescue. Medical Care, 30(7), 615-629.
Singer, S. J., Gaba, D. M., Geppert, J. J., Sinaiko, A. D., Howard, S. K., & Park, K. C.
(2003). The culture of safety: Results of an organization-wide survey in 15 California hospitals. Quality & Safety in Health Care, 12(2), 112-118.
Skinner J. S., Staiger, D. O., Fisher, E. S. (2006). Is technological change in medicine
always worth it? The case of acute myocardial infarction. Health Affairs, 25, 34-47.
201
Sloan, F., Conover, C. J., & Provenzale, D. (2000). Hospital credentialing and quality of
care. Social Science Medicine, 50, 77-88. Sorra, J. S., & Dyer, N. (2010). Multilevel psychometric properties of the AHRQ hospital
survey on patient safety culture. BMC Health Services Research, 70, 199. Sorra, J. S., & Nieva, V. F. (2004). Hospital survey on patient safety culture (Prepared by
Westat under Contract No. 290-96-0004, AHRQ Publication No. 04-0041). Rockville, MD: Agency for Healthcare Research and Quality.
Stanton, M. (2004). Hospital nurse staffing and quality of care. In Research in Action
(Issue 14, AHRQ Publication No. 04-0029). Rockville, MD: Agency for Healthcare Research and Quality.
Stelfox, H. T., Palmisiani, S., Scurlock, C., Orav, E. J., & Bates, D. W. (2006). The “to
err is human” report and the patient safety literature. Quality and Safety Health
Care, 15, 174-178. Stone, P. W., & Gershon, R. (2006). Nurse work environments and occupational safety in
intensive care units. Policy, Politics, and Nursing Practice, 7(4), 240-247. Stone, P. W., Harrison, M. I., Feldman, P., Linzer, M., Peng, T., Roblin, D. … Williams,
E. S. (2005). Organizational climate of staff working conditions and safety–an integrative model. In Advances in patient safety: From research to
implementation (AHRQ Publication Nos. 050021, 1-4). Rockville, MD: Agency for Healthcare Research and Quality.
Stone, P. W., Mooney-Kane, C., Larson, E., Horan, T., Glance, L., Zwanziger, J., &
Dick, A. W. (2007). Nurse working conditions and patient safety outcomes. Medical Care, 45(6), 571-578.
Swan, B. A., & Boruch, R. F. (2004). Quality of evidence: Usefulness in measuring the
quality of health care. Medical Care, 42[2 supplemental)], 1112-1120. Tabachnik, B. G., & Fidell, L. S. (2001). Using multivariate statistics (4th ed.). Boston,
MA: Allyn & Bacon. Taunton, R., Kleinbeck, S., Stafford, R., Woods, C., & Bott, M. (1994). Patient
outcomes: Are they linked to registered nurse absenteeism, separation, or workload? The Journal of Nursing Administration, 24(4S), 48-55.
202
Taylor, D. H., Whellan, D., & Sloan, F. A. (1999). Effects of admission to a teaching hospital on the cost and quality of care for Medicare beneficiaries. The New
England Journal of Medicine, 340, 293-299. The Joint Commission. (2002). National patient safety goals. Retrieved from
http://www.jointcommission.org/PatientSafety/NationalPatientsafetyGoals The Joint Commission. (2006). National patient safety goals 2010. Retrieved from
http://www.jointcommission.org The Joint Commission. (2009). Top 10 standards compliance issues in 2009. Joint
Commission Perspectives, 30(5), 12-18. The Joint Commission. (2010a). Comprehensive Accreditation Manual for Hospitals:
The Official Handbook (CAMH Update 1). Retrieved from http://www.jointcommission.org/assets/1/6/2011_CAMH_Update_1.pdf
The Joint Commission. (2010b). Hospital national patient safety goals. Retrieved from
http://www. jointcommission.org The Joint Commission. (2012). Facts about patient safety. Retrieved from
http://www.jointcommission.org The Joint Commission Quality Check. (2013). Facts about patient safety. Retrieved from
http://www.qualitycheck.org The Joint Commission Perspectives. (2004). Compliance data for The Joint Commission
2003 national patient safety goals. Joint Commission Perspectives, 24(9), 12-18. The Joint Commission Perspectives. (2005). Compliance data for The Joint Commission
2004 and 2005 national patient safety goals. Joint Commission Perspectives, 25(11), 7-8.
The Joint Commission Perspectives. (2009). Top 10 standards compliance issues in 2009.
Joint Commission Perspectives, 30(5), 12-18. Thomas, E. J., & Brennan, T. A. (2000). Incidence and types of preventable adverse
events in elderly patients: Population based review of medical records. British
Medical Journal, 320, 741-744. Thomas, E. J., Studdert, D., Burstin, H., Orav, E., Zeena, T., Williams, E. J., … Brennan,
T. A. (2000). Incidence and types of adverse events and negligent care in Utah and Colorado. Medical Care, 38(3), 261-271.
203
Thornlow, D. K., & Merwin, E. (2009). Managing to improve quality: The relationship between accreditation standards, safety practices, and patient outcomes. Health
Care Management Review, 34(4), 262-272. Thornlow, D. K., & Stukenborg, G. J. (2006). The association between hospital
characteristics and rates of preventable complications and adverse events. Medical
Care, 44(3), 265-269.
Tourangeau, A. E., Giovenniti, P., Tu, J. V., & Wood, M. (2002). Nursing-related determinants of 30-day mortality for hospitalized patients. Canadian Journal of
Nursing Research, 33(4), 71-88. Tourangeau, A. E., & Tu, J. V. (2003). Developing risk-adjusted 30-day hospital
mortality rates. Research in Nursing & Health, 26(6), 483-496. Ulrich, B. T., Buerhaus, P. I., Donelan, K., Norman, L., & Dittus, R. (2007). Magnet
status and registered nurse views of the work environment and nursing as a career. The Journal of Nursing Administration, 37(5), 212-220.
Unruh, L. (2003). Licensed nurse staffing and adverse events in hospitals. Medical Care,
41(1), 142-152. U. S. Department of Health and Human Services. (2008). Hospital-acquired conditions
(HAC) and hospital outpatient healthcare-associated conditions (HOP-HAC)
listening session. Retrieved from http://www.cms.gov/HospitalAcqCond/Downloads/HAC_Listening_Session_12-18-2008_Transcript.pdf
U. S. Department of Health and Human Services, Office of Inspector General. (2008).
Adverse events in hospitals: Case study of incidence among Medicare
beneficiaries in two selected counties. Retrieved from http://oig.hhs.gov/oei/reports/OEI-06-08-00220.pdf
U.S. Department of Health and Human Services, Office of the Inspector General. (2010).
Adverse events in hospitals: National incidence among Medicare beneficiaries (Report No. OEI-06-09-00090). Retrieved from https://oig.hhs.gov/oei/reports/oei-06-09-00090.pdf
Van Den Bos, J., Rustagi, K., Gray, T., Halford, M., Ziemkiewicz, E., & Shreve, J.
(2011). The $17.1 billion problem: The annual cost of measurable medical errors. Health Affairs, 30(4), 596-603.
204
Van Doren, E. S., Bowman, J., Landstrom, G. L., & Graves, S. Y. (2004). Structure and process variables affecting outcomes for heart failure clients. Lippincotts Case
Management, 9(1), 21-26. Vartak, S., Ward, M., & Vaughn, T. (2008). Do postoperative complications vary by
hospital teaching status? Medical Care, 46(1), 25-32. Vogel, T. R., Dombrovsly, N. B., Carson, J, L., Graham, A. M., & Lowry, S. F. (2010),
Postoperative sepsis in the United States. Annals of Surgery, 6, 1065-1071. Wachter, R. M. (2004). The end of the beginning: Patient safety five years after to err is
human. Health Affairs, W4, 534-545. Wachter, R. M. (2006). In conversation with J. Bryan Sexton, PhD, MA: Perspectives on
safety. Retrieved from http://www.webmm.ahrq.gov/perspective.aspx?perspectiveID=34
Wachter, R. M., Foster, N. E., & Dudley, R. A. (2008). Medicare’s decision to withhold
payment for hospital errors: The devil is in the detail. Joint Commission Journal
of Quality and Patient Safety. 34(2), 116-123. Wald, H., & Shojania, K. G. (2001). Root cause analysis. In K. Shojania, B. Duncan, K.
McDonald, & R. Wachter (Eds.), Making health care safer: A critical analysis of
patient safety practices. Rockville, MD: Agency for Healthcare Research and Quality.
Wan, T. (1992). Hospital variations in adverse patient outcomes. Quality Assurance
Utilization Review, 7(2), 50-53.
Waring, J. J. (2004). A qualitative study of the intra-hospital variations in incident
reporting. International Journal for Quality in Health Care, 16(5), 347-352. Weingart, S., Iezzoni, L. L., Davis, R., Palmer, R., Cahalane, M., Hamel, M., … Banks,
N. J. (2000). Use of administrative data to find substandard care. Medical Care,
38, 796-806. Weissman, J. S., Annas, C. L., Epstein, A. M., Schneider, E. C., Clarridge, B., Kirle, L.,
… Ridley, N. (2005). Error reporting and disclosure systems: Views from hospital leaders. The Journal of the American Medical Association, 293, 1359-1366.
Weissman, J. S., Schneider, E. C., Weingart, S. N., Epstein, A. M., David-Kastan, J.,
Feibelmann, S., … Gatsonis, C. (2008). Comparing patient-reported hospital adverse events with medical records reviews: Do patients know something that hospitals do not? Annals of Internal Medicine, 149, 100-108.

205
Werner, R. M., Goldman, L. E., & Dudley, R. A. (2008). Comparison of change in
quality of care between safety-net and non-safety-net hospitals. The Journal of the
American Medical Association, 299(18), 2180-2187. Whalen, D., Houchens, R., & Elixhauser, R. (2005). HCUP nationwide inpatient sample
(NIS) comparison report (Report No. 2008-01). Retrieved from http://www.hcup-us.ahrq.gov/reports/methods/methods_topic.jsp
White, P., & McGillis Hall, L. (2003). Patient safety outcomes. In D. M. Doran, Nursing
sensitive outcomes: State of the science. Sudbury, MA: Jones and Bartlett Publishers.
World Health Organization. (2014). 10 facts on patient safety. Retrieved from
http://www.who.int/features/factfiles/patient_safety/patient_safety_facts/en Yuan, Z., Cooper, G. S., Einstadter, D., Cebul, R. D., & Rimm, A. A. (2000). The
association between hospital type and mortality and length of stay: A study of 16.9 million hospitalized Medicare beneficiaries. Medical Care, 38(2), 231-245.
Zhan, C., Kelley, E., Yang, H. P., Keyes, M., Battles, J., Borotkanics, R. J., & Stryer, D.
(2005). Assessing patient safety in the United States: Challenges and opportunities. Medical Care, 43(3 supplement), I42-II47.
Zhan, C., & Miller, M. (2003a). Administrative data based patient safety research: A
critical review. Quality and Safe Health Care, 12(Supplement lll), ii58-ii63. Zhan, C., & Miller, M. (2003b). Excess length of stay, charges and mortality attributable
to medical injuries during hospitalization. The Journal of the American Medical
Association, 290(14), 1868-1874. Zhang, J. (2007). What’s the relative risk? A method of correcting the odds in cohort
studies of common outcomes. The Journal of the American Medical Association, 280(19), 1690-1691.
Zohar, D. (2002). The effects of leadership dimensions, safety climate, and assigned
priorities on minor injuries in work groups. Journal of Organizational Behavior, 23, 75-92.
206
BIOGRAPHY
Phyllis Morris-Griffith is a registered nurse with more than 25 years of experience in healthcare. She has spent more than half of her career as a leader within healthcare institutions, serving in roles such as chief nursing officer, chief operating officer, and vice president of patient services. She spent more than five years working with the premier healthcare accrediting organization, The Joint Commission, as a surveyor. Her work includes the evaluation of the quality of care provided by healthcare organizations nationwide and abroad. She has been the owner and principal consultant for Kay Associates, Healthcare Consultants. In 2013, she was selected as a Carefirst BlueCross fellow to complete her dissertation work at George Mason University in Fairfax, Virginia. She also serves an adjunct faculty member at George Mason University in the College of Health and Human Services, teaching graduate classes. Phyllis holds a bachelor’s of science degree in nursing from the University of Southern Mississippi and a
master’s degree in health care from Mississippi College.
Recommended