@TexasDemography
The Population and Health Issues in Texas
It’s Time Texas Summit
San Antonio, Texas
August 2, 2016
Growing States, 2000-2015
2
2000
Population
2010
Population
2015
Population
Numeric
Change
2010-2015
Percent
Change
2000-2010
United States281,421,906 308,745,538 321,418,820 12,673,282 4.1%
Texas 20,851,820 25,145,561 27,469,114 2,323,553 9.2%
California33,871,648 37,253,956 39,144,818 1,890,862 5.1%
Florida 15,982,378 18,801,310 20,271,272 1,469,962 7.8%
Georgia 8,186,453 9,687,653 10,214,860 527,207 5.4%
North Carolina 8,049,313 9,535,483 10,042,802 507,319 5.3%
Arizona 5,130,632 6,392,017 6,828,065 436,048 6.8%
Source: U.S. Census Bureau. 2000 and 2010 Census Count, 2015 Population Estimates.
0.00
5.00
10.00
15.00
20.00
25.00
30.00
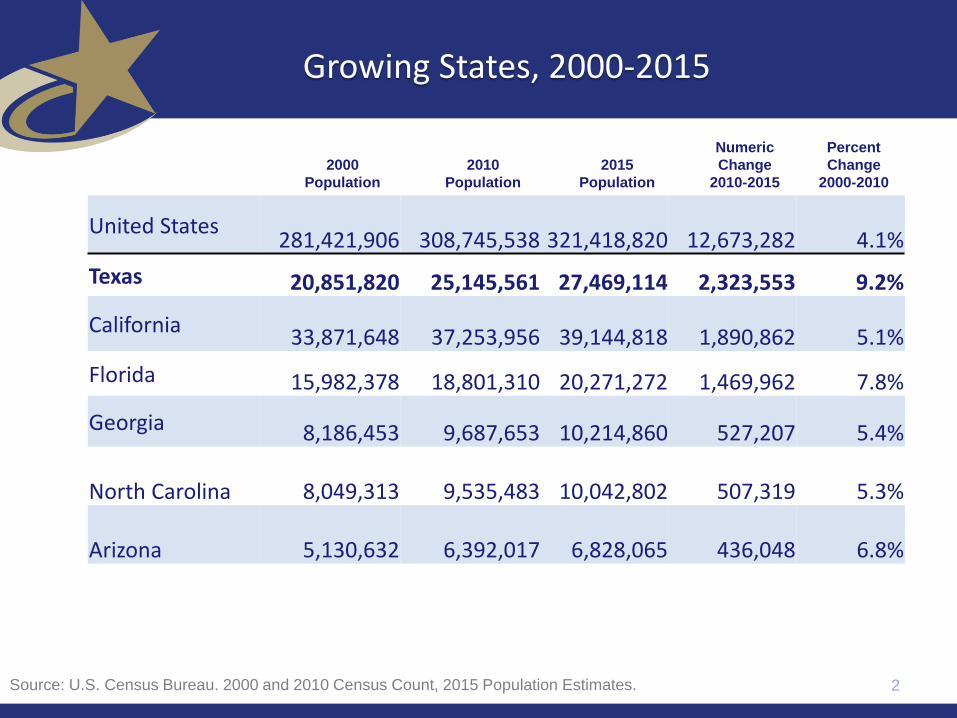
1950 1960 1970 1980 1990 2000 2010 2011 2012 2013 2014 2015
Numeric Change (Millions) Population (Millions)
All values for the decennial dates are for April 1st of the indicated census year. Values for 2012-2014 are for July 1 as estimated by the U.S. Census Bureau.
Total Population and Population Change in Texas, 1950-2014
Source: U.S. Census Bureau, Census Counts and Population Estimates3
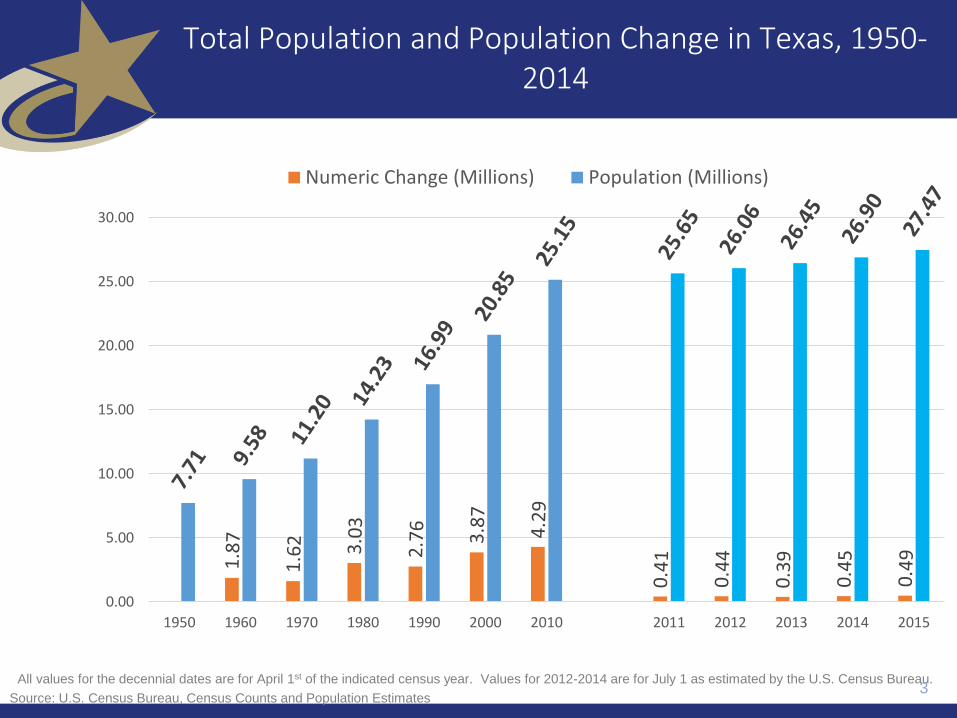
89.5% 86.7%
41.5%
65.9%
49.7% 53.7%
10.5% 13.3%
58.5%
34.1%
50.3% 46.3%
1950s 1960s 1970s 1980s 1990s 2000s
Migration
Natural Increase
Components of Population Change by Percent
in Texas, 1950-2010
Source: U.S. Census Bureau, Population Estimates

Dallas
Howard
FoardFloyd
Brewster
FranklinHunt
Newton
Starr
Kinney
Collingsworth
Tom
Green
Coleman
Brazoria
Leon
Duval
Lamb
Morris
Smith
Jackson
Medina
Wheeler
Dallam
Callahan
Lamar
Coryell
Gaines
Kendall
Nacogdoches
Milam
Hays
Willacy
Johnson
Reagan
Webb
Shackelford
Bowie
Scurry
Kenedy
Somervell
Oldham
Taylor
King
Borden
Walker
Stephens
Deaf
Smith
Roberts
Tyler
Val
Verde
Brown
Parker
Harris
Zapata
Red
River
Karnes
Palo
Pinto
Glasscock
Shelby
Wood
Crosby
Refugio
Burnet
Sterling
Montgomery
San
Augustine
Rains
Nueces
Jack
Swisher
Camp
Brazos
Orange
Colorado
Pecos
Cochran
Parmer
Freestone
Winkler
Wichita
Gray
Schleicher
Hardeman
TravisGillespie
Yoakum
Fayette
Uvalde
Grimes
Van
Zandt
Throckmorton
Falls
Grayson
Ellis
Hall
Dickens
TrinityReeves
Marion
Terrell
Lynn
La Salle
Jasper
Jones
Castro
Victoria
Kleberg
Briscoe
Clay
Matagorda
Brooks
Runnels
Carson
Liberty
Lee
Hale
Bexar
Garza
Montague
Upton
Hamilton
FisherDawson
Dimmit
Hutchinson
Llano
Presidio
Eastland
Wharton
Rusk
Tarrant
Lavaca
Childress
Hidalgo
Kaufman
Moore
Menard
Edwards
San
Patricio
Terry
Crockett
Houston
Waller
Coke
Ward
Titus
Lampasas
Haskell
Martin
Atascosa
Hemphill
Hartley
Young
Burleson
Hardin
Gonzales
McMullen
Erath
Galveston
Hopkins
McLennan
MadisonMcCulloch
Donley
Kent
Real
Sutton
Midland
Hudspeth
Zavala
Harrison
ComancheMitchell
Navarro
Crane
Lubbock
Wise
Washington
Jeff
Davis
El Paso
Gregg
Williamson
Lipscomb
Mason
Henderson
Hansford
Chambers
Hill
Potter
Jim
Wells
DeltaStonewall
Ector
Cameron
Maverick
Collin
Baylor
Panola
Guadalupe
Bastrop
Austin
Andrews
Anderson
Blanco
DeWitt
Bandera
Bell
Aransas
Archer
Armstrong
Bee
Angelina
Bailey
Jefferson
Frio
Fannin
Goliad
Loving
Cass
Fort
Bend
Bosque
Hockley
San
Saba
Kerr
Mills
Cooke
Wilbarger
Irion
Caldwell
Jim
Hogg
Culberson
Upshur
Cherokee
Denton
Concho
Randall
Kimble
Knox
Polk
Hood
San
Jacinto
Robertson
Wilson
Nolan
Cottle
Calhoun
Rockwall
Live
Oak
Motley
Sherman
Ochiltree
Comal
Total Estimated Population by County, Texas, 2015
Source: U.S. Census Bureau, 2015 Vintage Population Estimates
tl_2010_48_county10
POPESTIMATE2015
112 - 10,000
10,001 - 50,000
50,001 - 100,000
100,001 - 500,000
500,001 - 4,538,028
5
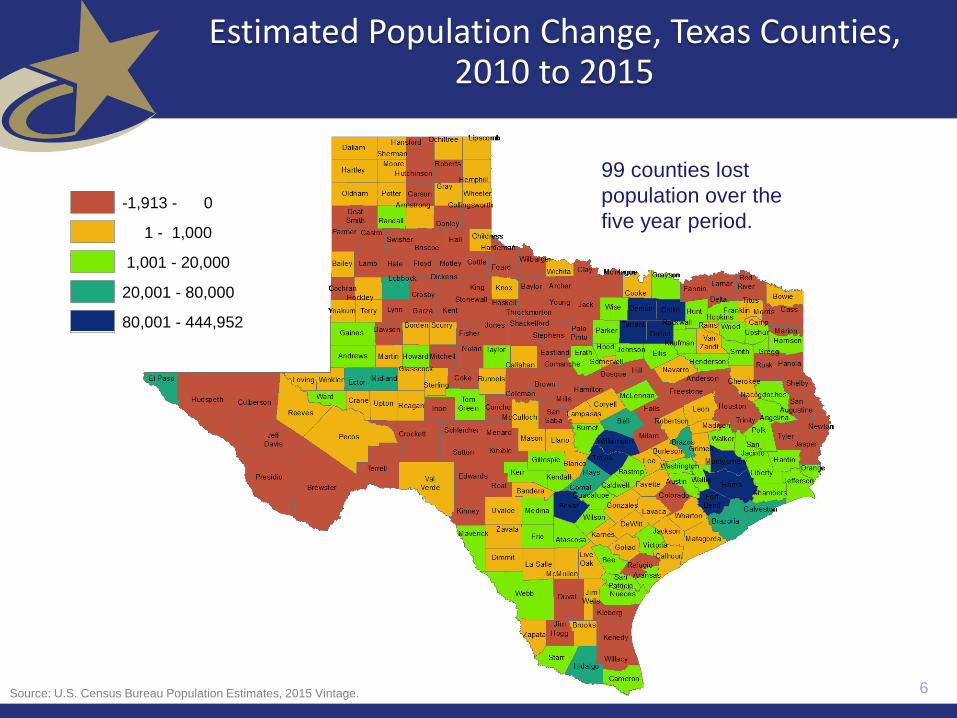
Estimated Population Change, Texas Counties, 2010 to 2015
Source: U.S. Census Bureau Population Estimates, 2015 Vintage.
99 counties lost
population over the
five year period.
tl_2010_48_county10
NPOPCH1015
-1,913 - 0
1 - 1,000
1,001 - 20,000
20,001 - 80,000
80,001 - 444,952
6
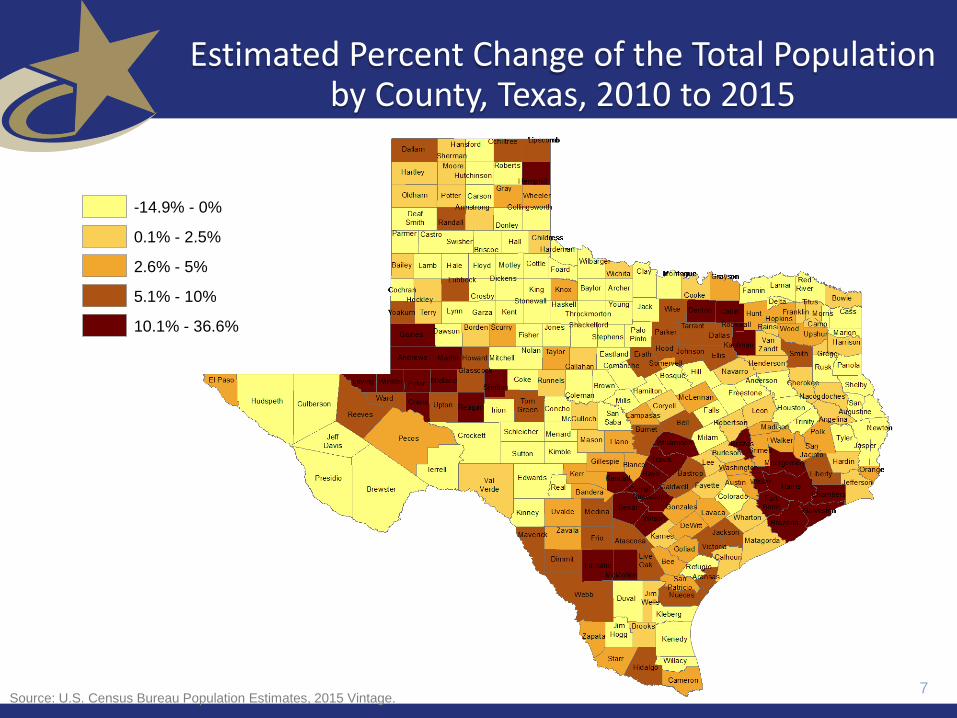
Estimated Percent Change of the Total Population by County, Texas, 2010 to 2015
Source: U.S. Census Bureau Population Estimates, 2015 Vintage.
tl_2010_48_county10
PctPOPCH1015
-14.9% - 0%
0.1% - 2.5%
2.6% - 5%
5.1% - 10%
10.1% - 36.6%
7

County
U.S. Rank
Population
Change
Population
Change
Percent of
Change from
Natural
Increase
Percent
Change
from
Migration
Percent
Change from
International
Migration
Harris 1 90,451 49.3% 50.7% 32.0%
Bexar 5 37,479 41.2% 58.8% 17.0%
Tarrant 6 36,152 46.3% 53.7% 20.2%
Dallas 9 33,760 68.1% 31.9% 39.0%
Fort Bend 13 29,437 20.7% 79.3% 16.5%
Collin 14 28,075 24.8% 75.2% 15.8%
Denton 16 25,820 25.5% 74.5% 11.7%
Travis 17 25,562 42.5% 57.5% 22.9%
Williamson 27 19,086 20.9% 79.1% 6.7%
Montgomery 29 18,505 19.2% 80.8% 9.9%*Dallas had net out domestic migration over this period.
Source: U.S. Census Bureau, 2015 Vintage Population Estimates
Top Counties for Numeric
Growth in Texas, 2014-2015

Top Counties for Percent
Growth* in Texas, 2014-2015
County U.S.
Rank
2014-2015
Percent
Population
Change
Percent
Change
from
Migration
Percent
Change from
International
Migration
Hays 1 5.2% 85.5% 1.9%Comal 2 4.5% 90.7% 2.1%
Fort Bend 4 4.3% 79.3% 16.5%Williamson 7 3.9% 79.1% 6.7%
Montgomery 10 3.6% 80.8% 9.9%Denton 12 3.4% 74.5% 11.7%
Ector 18 3.3% 63.1% 3.1%Midland 19 3.3% 66.2% 3.2%
Collin 23 3.2% 75.2% 15.8%Kaufman 25 3.1% 79.8% 3.2%
Parker 29 2.8% 89.8% 2.2%Brazos 32 2.8% 69.2% 27.4%
Guadalupe 38 2.7% 78.8% 4.6%Ellis 39 2.7% 77.2% 2.7%
*Among Counties with 10,000 or more population in 2014
Source: U.S. Census Bureau, 2015 Vintage Population Estimates
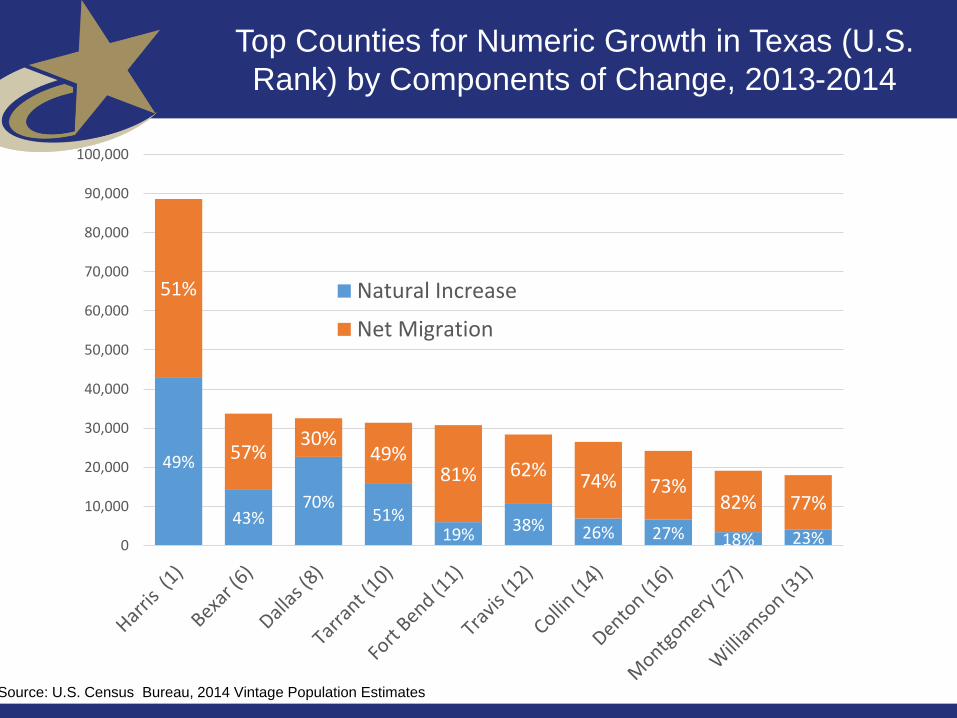
49%
43%70%
51%19%
38% 26% 27% 18% 23%
51%
57%30%
49%81% 62%
74% 73%82% 77%
0
10,000
20,000
30,000
40,000
50,000
60,000
70,000
80,000
90,000
100,000
Natural Increase
Net Migration
Top Counties for Numeric Growth in Texas (U.S.
Rank) by Components of Change, 2013-2014
Source: U.S. Census Bureau, 2014 Vintage Population Estimates

Percent Population by Race and Ethnicity, Texas, 2000 and 2010
Hispanic or Latino38%
NH White45%
NH Black 11%
NH Asian4%
NH Other2%
Hispanic or Latino32%
NH White52%
NH Black 11%
NH Asian3%
NH Other2%
Source: U.S. Census Bureau 2000 and 2010 Decennial Census, SF1
20102000
11

Texas White (non-Hispanic) and Hispanic Populations by Age, 2014
0
50,000
100,000
150,000
200,000
250,000
Po
pu
lati
on
Age
White (non-Hispanic)
Hispanic
12Source: U.S. Census Bureau 2010 Decennial Census, SF1
250,000 200,000 150,000 100,000 50,000 0 50,000 100,000 150,000 200,000 250,000
Under 1 year
5 years
10 years
15 years
20 years
25 years
30 years
35 years
40 years
45 years
50 years
55 years
60 years
65 years
70 years
75 years
80 years
85 + years
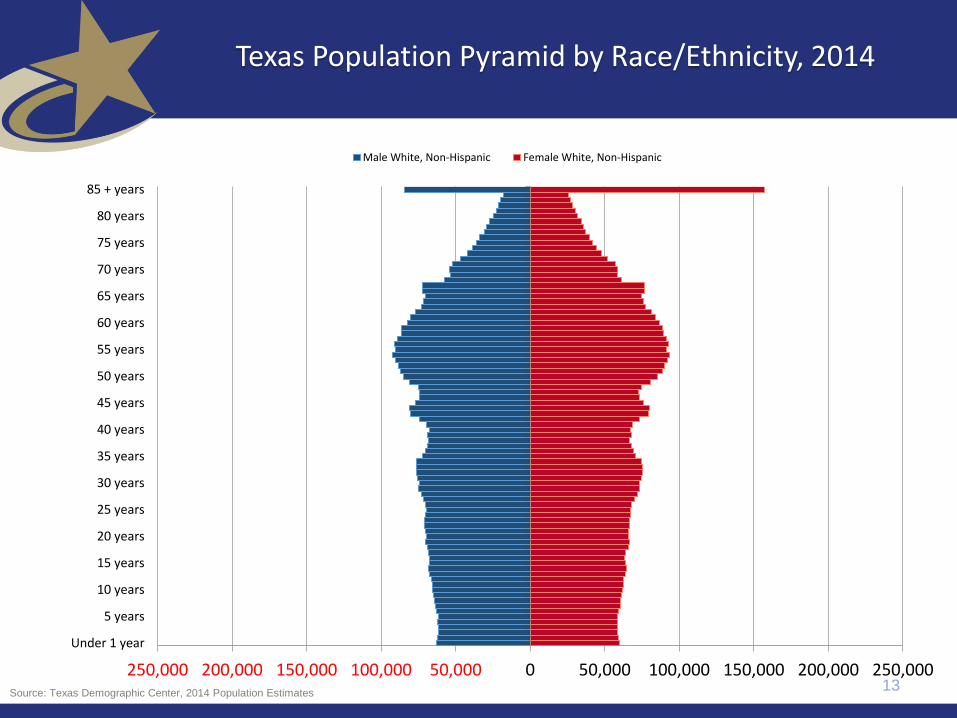
Male White, Non-Hispanic Female White, Non-Hispanic
13
Texas Population Pyramid by Race/Ethnicity, 2014
Source: Texas Demographic Center, 2014 Population Estimates

250,000 200,000 150,000 100,000 50,000 0 50,000 100,000 150,000 200,000 250,000
Under 1 year
5 years
10 years
15 years
20 years
25 years
30 years
35 years
40 years
45 years
50 years
55 years
60 years
65 years
70 years
75 years
80 years
85 + years
Male Black, Non Hispanic Male Other, Non Hispanic Male Hispanic Female Black, Non Hispanic Female Other, Non Hispanic Female, Hispanic
14
Texas Population Pyramid by Race/Ethnicity, 2014
Source: Texas Demographic Center, 2014 Population Estimates

250,000 200,000 150,000 100,000 50,000 0 50,000 100,000 150,000 200,000 250,000
Under 1 year
5 years
10 years
15 years
20 years
25 years
30 years
35 years
40 years
45 years
50 years
55 years
60 years
65 years
70 years
75 years
80 years
85 + years
Male White, Non-Hispanic Male Black, Non Hispanic Male Other, Non Hispanic Male Hispanic
Female White, Non-Hispanic Female Black, Non Hispanic Female Other, Non Hispanic Female, Hispanic
15
Texas Population Pyramid by Race/Ethnicity, 2014
Source: Texas Demographic Center, 2014 Population Estimates
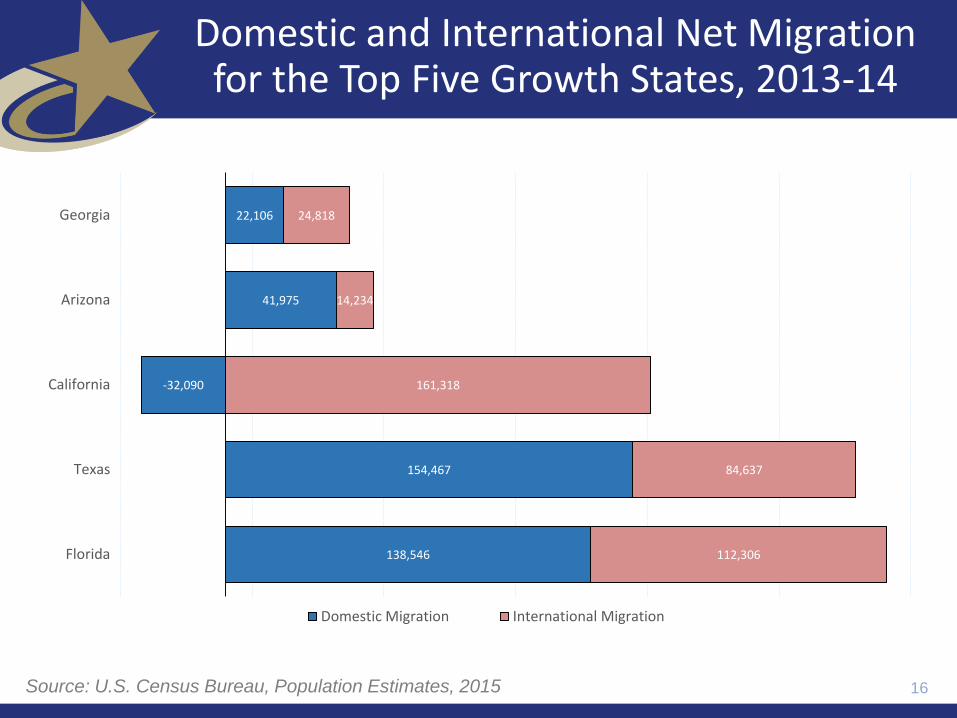
Domestic and International Net Migration for the Top Five Growth States, 2013-14
16
138,546
154,467
-32,090
41,975
22,106
112,306
84,637
161,318
14,234
24,818
Florida
Texas
California
Arizona
Georgia
Domestic Migration International Migration
Source: U.S. Census Bureau, Population Estimates, 2015

Top 10 Gross Migration States for Domestic Migration to Texas, 2013
17
62,386
28,906
33,321
28,457
30,672
19,139
19,451
22,049
21,129
18,924
31,499
29,051
19,988
22,259
12,719
23,141
18,428
15,504
14,803
14,715
California
Oklahoma
Florida
Louisiana
Illinois
Colorado
Arizona
New Mexico
New York
Georgia
Out-Migrants From Texas In-Migrants to Texas
U.S. Census Bureau ACS 1-Year PUMS,2013

Top 10 Destination Counties for Interstate Domestic Migration to Texas, 2009-2013
18
74,661
42,472
40,259
37,521
30,340
24,540
21,653
20,687
17,351
14,693
52,968
32,995
37,448
28,556
21,309
23,990
17,669
16,100
12,351
6,042
Net Migration=21,693
Net Migration=2,811
Net Migration=9,477
Net Migration=8,965
Net Migration=9,031
Net Migration=550
Net Migration=3,984
Net Migration=4,587
Net Migration=5,000
Net Migration=8,651
Harris
Bexar
Dallas
Tarrant
Travis
El Paso
Bell
Collin
Denton
Williamson
Domestic Out-Migration Domestic In-Migration
U.S. Census Bureau ACS 5-Year Summary Data, 2009-2013
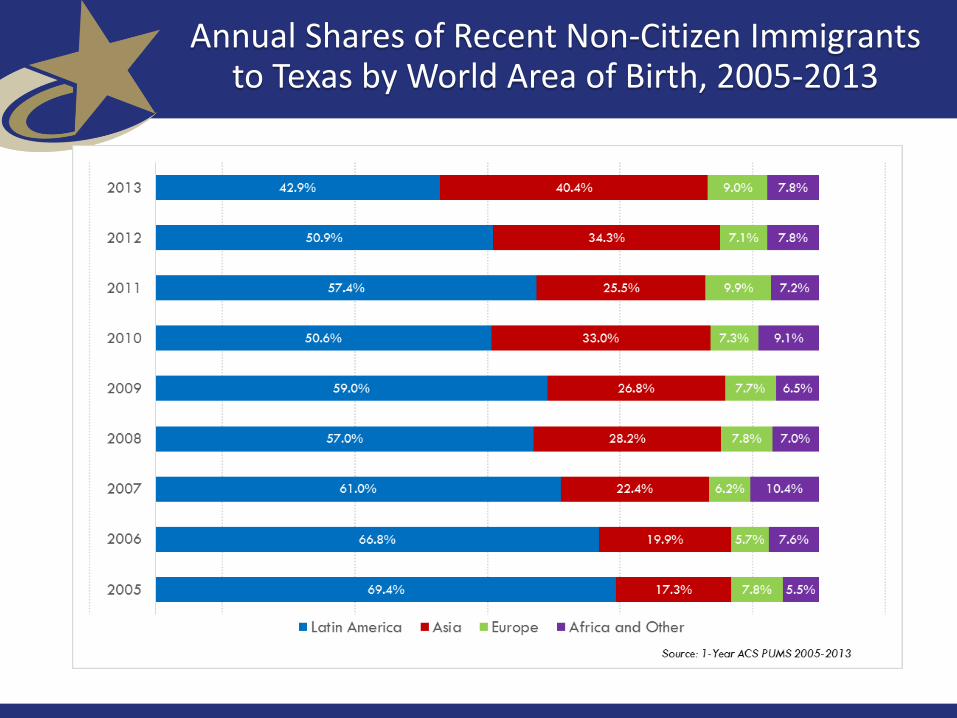
Annual Shares of Recent Non-Citizen Immigrants to Texas by World Area of Birth, 2005-2013
20
21

22

23
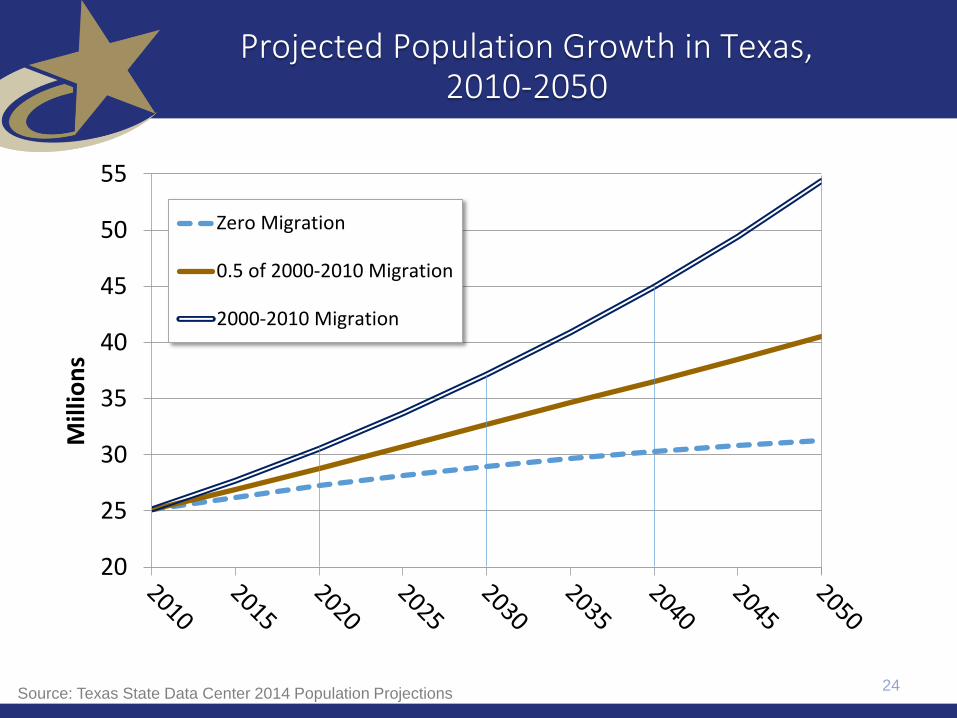
20
25
30
35
40
45
50
55
Mill
ion
s
Zero Migration
0.5 of 2000-2010 Migration
2000-2010 Migration
Projected Population Growth in Texas, 2010-2050
24Source: Texas State Data Center 2014 Population Projections
24
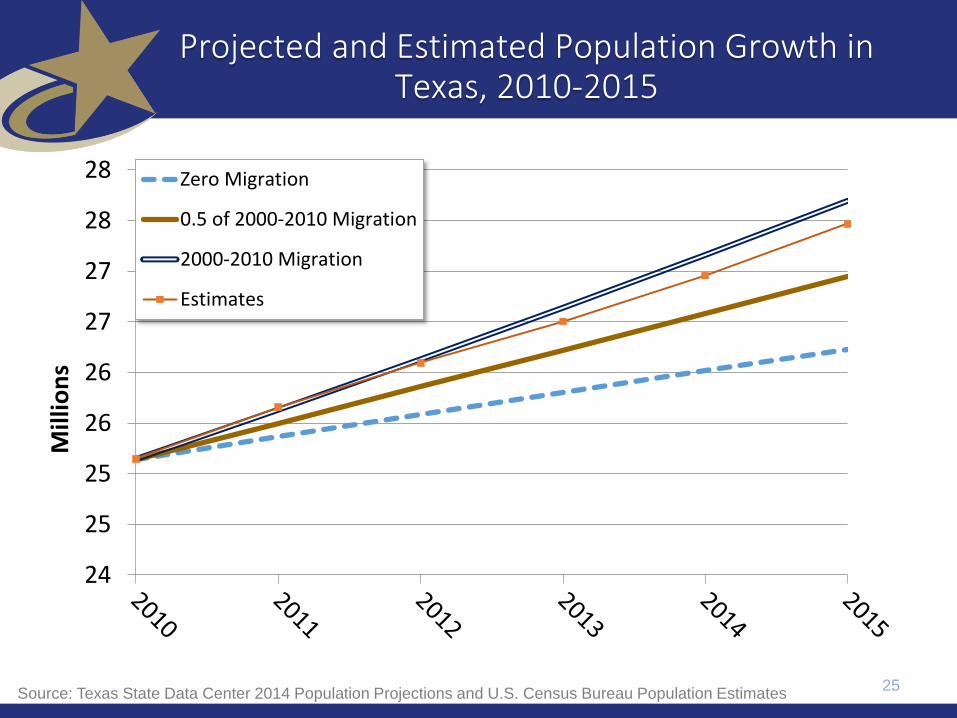
25
25
26
26
27
27
28
28
Mill
ion
s
Zero Migration
0.5 of 2000-2010 Migration
2000-2010 Migration
Estimates
Projected and Estimated Population Growth in Texas, 2010-2015
25Source: Texas State Data Center 2014 Population Projections and U.S. Census Bureau Population Estimates

-
5,000,000
10,000,000
15,000,000
20,000,000
25,000,000
30,000,000
35,000,000
19
50
19
60
19
70
19
80
19
90
20
00
20
10
20
14
20
20
20
30
20
40
20
50
Under 18
18 to 64
65+
Censuses Estimates Projections
26
Population Change by Age Group, Texas, 1950-2050
Sources: US Census Bureau, 1950-2010 Censuses
US Census Bureau, State Population Estimates
Texas State Data Center, 2014 Population Projections, 1.0 Migration Scenario
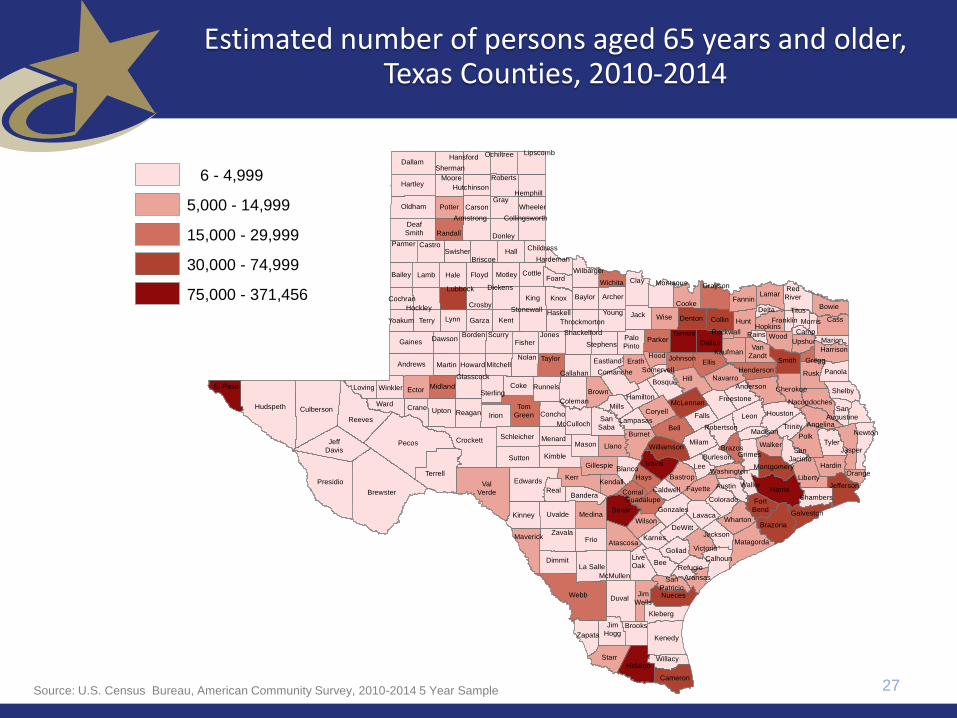
Estimated number of persons aged 65 years and older, Texas Counties, 2010-2014
Dallas
Howard
FoardFloyd
Brewster
FranklinHunt
Newton
Starr
Kinney
Collingsworth
Tom
Green
Coleman
Brazoria
Leon
Duval
Lamb
Morris
Smith
Jackson
Medina
Wheeler
Dallam
Callahan
Lamar
Coryell
Gaines
Kendall
Nacogdoches
Milam
Hays
Willacy
Johnson
Reagan
Webb
Shackelford
Bowie
Scurry
Kenedy
Somervell
Oldham
Taylor
King
Borden
Walker
Stephens
Deaf
Smith
Roberts
Tyler
Val
Verde
Brown
Parker
Harris
Zapata
Red
River
Karnes
Palo
Pinto
Glasscock
Shelby
Wood
Crosby
Refugio
Burnet
Sterling
Montgomery
San
Augustine
Rains
Nueces
Jack
Swisher
Camp
Brazos
Orange
Colorado
Pecos
Cochran
Parmer
Freestone
Winkler
Wichita
Gray
Schleicher
Hardeman
TravisGillespie
Yoakum
Fayette
Uvalde
Grimes
Van
Zandt
Throckmorton
Falls
Grayson
Ellis
Hall
Dickens
TrinityReeves
Marion
Terrell
Lynn
La Salle
Jasper
Jones
Castro
Victoria
Kleberg
Briscoe
Clay
Matagorda
Brooks
Runnels
Carson
Liberty
Lee
Hale
Bexar
Garza
Montague
Upton
Hamilton
FisherDawson
Dimmit
Hutchinson
Llano
Presidio
Eastland
Wharton
Rusk
Tarrant
Lavaca
Childress
Hidalgo
Kaufman
Moore
Menard
Edwards
San
Patricio
Terry
Crockett
Houston
Waller
Coke
Ward
Titus
Lampasas
Haskell
Martin
Atascosa
Hemphill
Hartley
Young
Burleson
Hardin
Gonzales
McMullen
Erath
Galveston
Hopkins
McLennan
MadisonMcCulloch
Donley
Kent
Real
Sutton
Midland
Hudspeth
Zavala
Harrison
ComancheMitchell
Navarro
Crane
Lubbock
Wise
Washington
Jeff
Davis
El Paso
Gregg
Williamson
Lipscomb
Mason
Henderson
Hansford
Chambers
Hill
Potter
Jim
Wells
DeltaStonewall
Ector
Cameron
Maverick
Collin
Baylor
Panola
Guadalupe
Bastrop
Austin
Andrews
Anderson
Blanco
DeWitt
Bandera
Bell
Aransas
Archer
Armstrong
Bee
Angelina
Bailey
Jefferson
Frio
Fannin
Goliad
Loving
Cass
Fort
Bend
Bosque
Hockley
San
Saba
Kerr
Mills
Cooke
Wilbarger
Irion
Caldwell
Jim
Hogg
Culberson
Upshur
Cherokee
Denton
Concho
Randall
Kimble
Knox
Polk
Hood
San
Jacinto
Robertson
Wilson
Nolan
Cottle
Calhoun
Rockwall
Live
Oak
Motley
Sherman
Ochiltree
Comal
27
tl_2010_48_county10
Pop65P
6 - 4,999
5,000 - 14,999
15,000 - 29,999
30,000 - 74,999
75,000 - 371,456
Source: U.S. Census Bureau, American Community Survey, 2010-2014 5 Year Sample
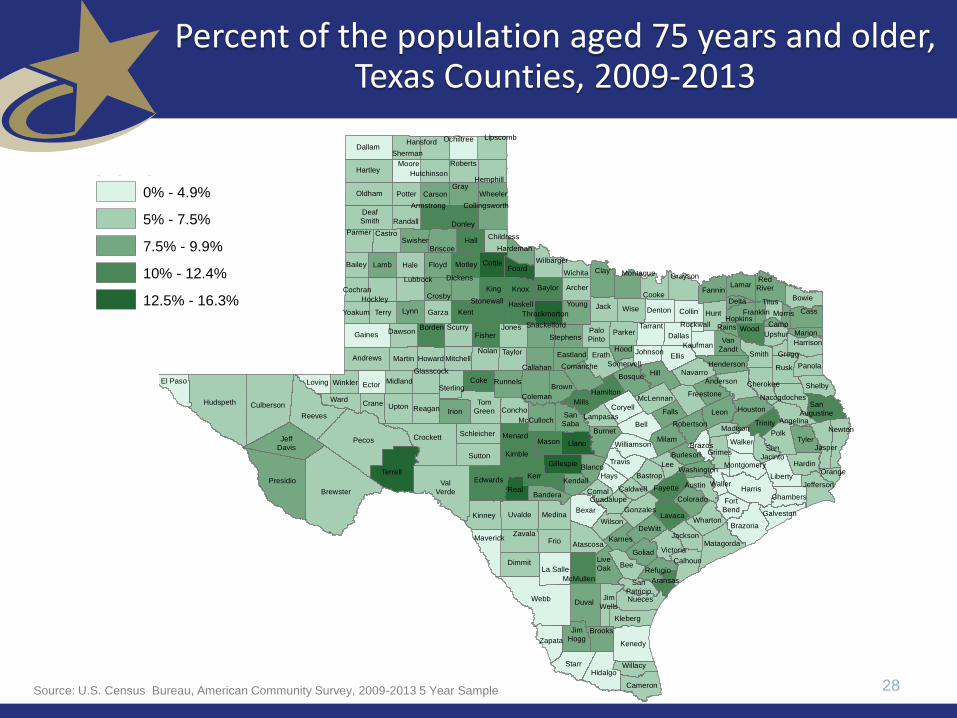
Percent of the population aged 75 years and older, Texas Counties, 2009-2013
28
Dallas
Howard
FoardFloyd
Brewster
FranklinHunt
Newton
Starr
Kinney
Collingsworth
Tom
Green
Coleman
Brazoria
Leon
Duval
Lamb
Morris
Smith
Jackson
Medina
Wheeler
Dallam
Callahan
Lamar
Coryell
Gaines
Kendall
Nacogdoches
Milam
Hays
Willacy
Johnson
Reagan
Webb
Shackelford
Bowie
Scurry
Kenedy
Somervell
Oldham
Taylor
King
Borden
Walker
Stephens
Deaf
Smith
Roberts
Tyler
Val
Verde
Brown
Parker
Harris
Zapata
Red
River
Karnes
Palo
Pinto
Glasscock
Shelby
Wood
Crosby
Refugio
Burnet
Sterling
Montgomery
San
Augustine
Rains
Nueces
Jack
Swisher
Camp
Brazos
Orange
Colorado
Pecos
Cochran
Parmer
Freestone
Winkler
Wichita
Gray
Schleicher
Hardeman
TravisGillespie
Yoakum
Fayette
Uvalde
Grimes
Van
Zandt
Throckmorton
Falls
Grayson
Ellis
Hall
Dickens
TrinityReeves
Marion
Terrell
Lynn
La Salle
Jasper
Jones
Castro
Victoria
Kleberg
Briscoe
Clay
Matagorda
Brooks
Runnels
Carson
Liberty
Lee
Hale
Bexar
Garza
Montague
Upton
Hamilton
FisherDawson
Dimmit
Hutchinson
Llano
Presidio
Eastland
Wharton
Rusk
Tarrant
Lavaca
Childress
Hidalgo
Kaufman
Moore
Menard
Edwards
San
Patricio
Terry
Crockett
Houston
Waller
Coke
Ward
Titus
Lampasas
Haskell
Martin
Atascosa
Hemphill
Hartley
Young
Burleson
Hardin
Gonzales
McMullen
Erath
Galveston
Hopkins
McLennan
MadisonMcCulloch
Donley
Kent
Real
Sutton
Midland
Hudspeth
Zavala
Harrison
ComancheMitchell
Navarro
Crane
Lubbock
Wise
Washington
Jeff
Davis
El Paso
Gregg
Williamson
Lipscomb
Mason
Henderson
Hansford
Chambers
Hill
Potter
Jim
Wells
DeltaStonewall
Ector
Cameron
Maverick
Collin
Baylor
Panola
Guadalupe
Bastrop
Austin
Andrews
Anderson
Blanco
DeWitt
Bandera
Bell
Aransas
Archer
Armstrong
Bee
Angelina
Bailey
Jefferson
Frio
Fannin
Goliad
Loving
Cass
Fort
Bend
Bosque
Hockley
San
Saba
Kerr
Mills
Cooke
Wilbarger
Irion
Caldwell
Jim
Hogg
Culberson
Upshur
Cherokee
Denton
Concho
Randall
Kimble
Knox
Polk
Hood
San
Jacinto
Robertson
Wilson
Nolan
Cottle
Calhoun
Rockwall
Live
Oak
Motley
Sherman
Ochiltree
Comal
tl_2010_48_county10
pop75p
0% - 4.9%
5% - 7.5%
7.5% - 9.9%
10% - 12.4%
12.5% - 16.3%
Source: U.S. Census Bureau, American Community Survey, 2009-2013 5 Year Sample
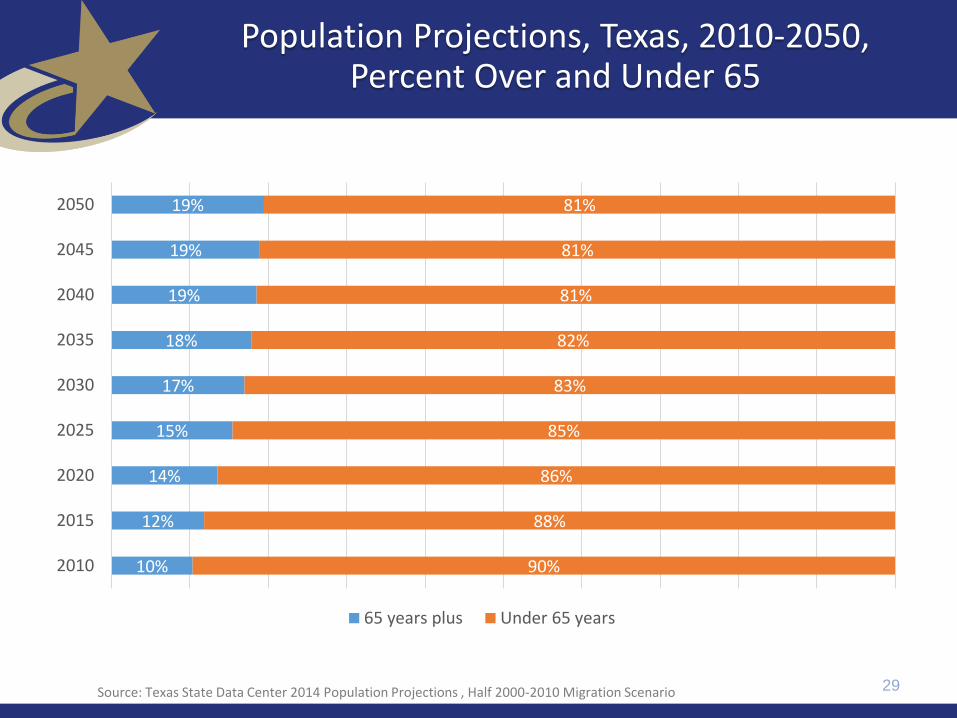
Population Projections, Texas, 2010-2050,Percent Over and Under 65
29
19%
19%
19%
18%
17%
15%
14%
12%
10%
81%
81%
81%
82%
83%
85%
86%
88%
90%
2050
2045
2040
2035
2030
2025
2020
2015
2010
65 years plus Under 65 years
Source: Texas State Data Center 2014 Population Projections , Half 2000-2010 Migration Scenario

Projected Racial and Ethnic Percent, Texas, 2010-2050
0
5,000,000
10,000,000
15,000,000
20,000,000
25,000,000
30,000,000
35,000,000
NH-White
NH-Black
Hispanic
NH-Other
30Source: Texas State Data Center 2012 Population Projections , 2000-2010 Migration Scenario
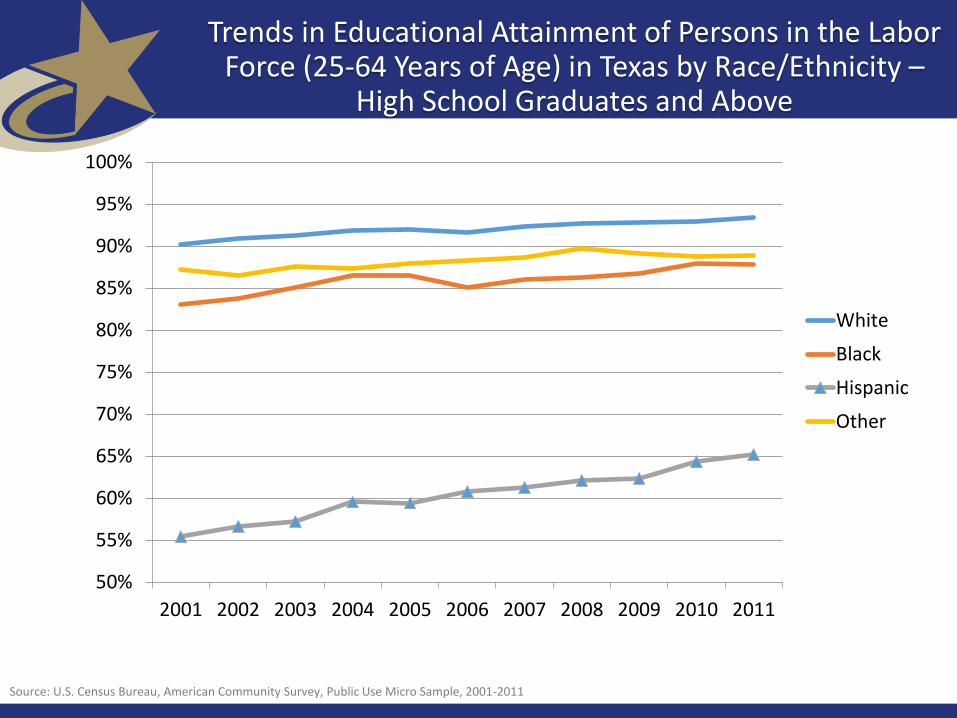
Trends in Educational Attainment of Persons in the Labor Force (25-64 Years of Age) in Texas by Race/Ethnicity –
High School Graduates and Above
50%
55%
60%
65%
70%
75%
80%
85%
90%
95%
100%
2001 2002 2003 2004 2005 2006 2007 2008 2009 2010 2011
White
Black
Hispanic
Other
Source: U.S. Census Bureau, American Community Survey, Public Use Micro Sample, 2001-2011
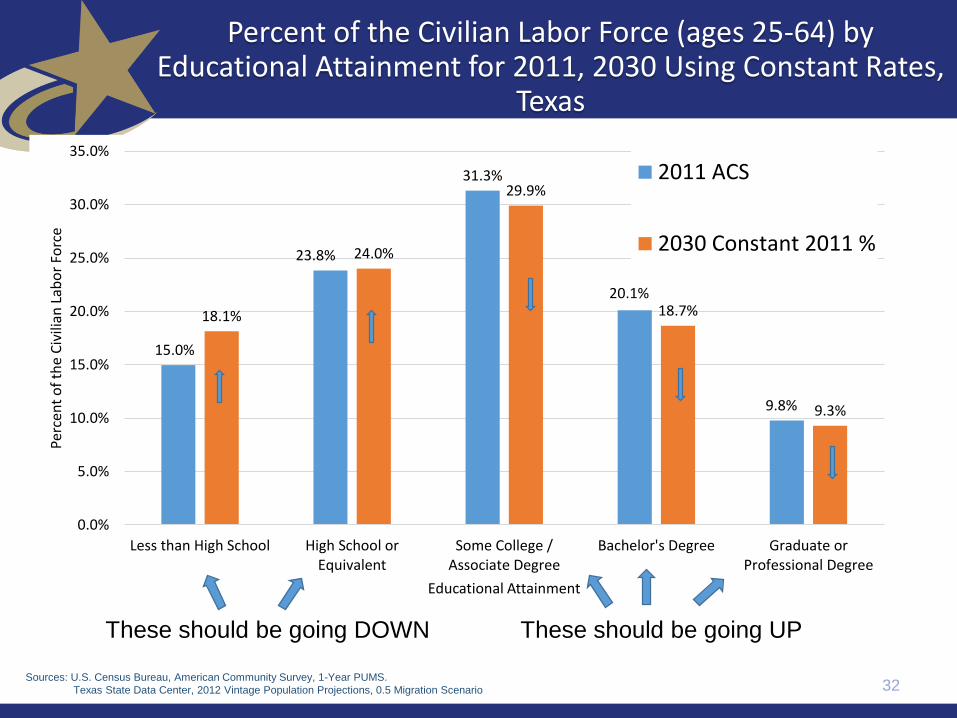
Percent of the Civilian Labor Force (ages 25-64) by Educational Attainment for 2011, 2030 Using Constant Rates,
Texas
32
15.0%
23.8%
31.3%
20.1%
9.8%
18.1%
24.0%
29.9%
18.7%
9.3%
0.0%
5.0%
10.0%
15.0%
20.0%
25.0%
30.0%
35.0%
Less than High School High School orEquivalent
Some College /Associate Degree
Bachelor's Degree Graduate orProfessional Degree
Perc
ent
of
the
Civ
ilian
Lab
or
Forc
e
Educational Attainment
2011 ACS
2030 Constant 2011 %
These should be going DOWN These should be going UP
Sources: U.S. Census Bureau, American Community Survey, 1-Year PUMS.
Texas State Data Center, 2012 Vintage Population Projections, 0.5 Migration Scenario
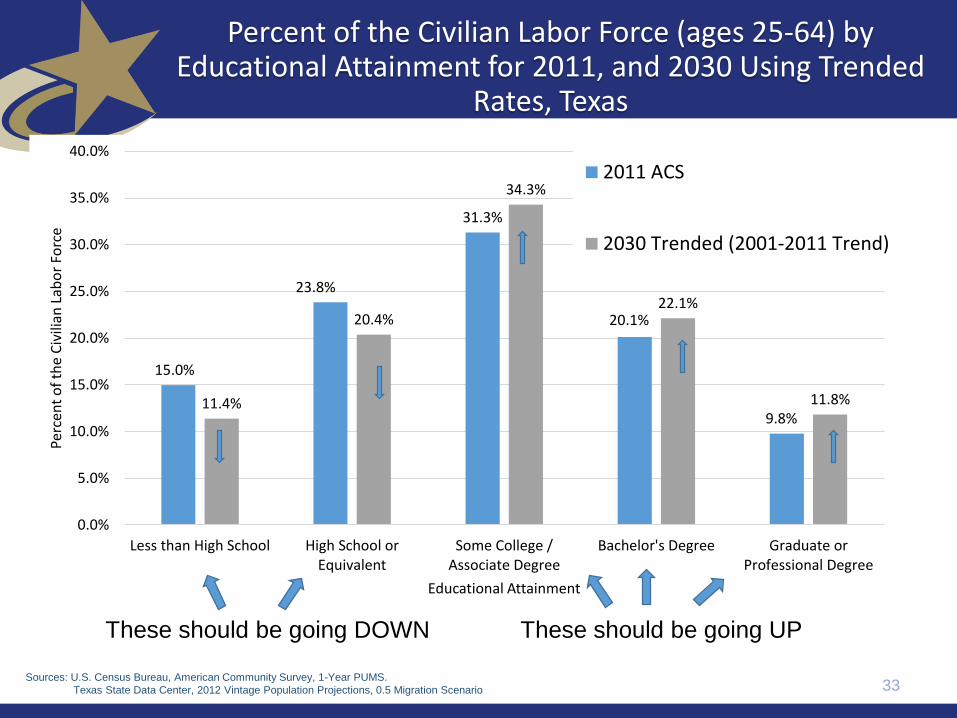
Percent of the Civilian Labor Force (ages 25-64) by Educational Attainment for 2011, and 2030 Using Trended
Rates, Texas
33
15.0%
23.8%
31.3%
20.1%
9.8%11.4%
20.4%
34.3%
22.1%
11.8%
0.0%
5.0%
10.0%
15.0%
20.0%
25.0%
30.0%
35.0%
40.0%
Less than High School High School orEquivalent
Some College /Associate Degree
Bachelor's Degree Graduate orProfessional Degree
Perc
ent
of
the
Civ
ilian
Lab
or
Forc
e
Educational Attainment
2011 ACS
2030 Trended (2001-2011 Trend)
These should be going DOWN These should be going UP
Sources: U.S. Census Bureau, American Community Survey, 1-Year PUMS.
Texas State Data Center, 2012 Vintage Population Projections, 0.5 Migration Scenario

Teen (ages 15-19 years) birth rates, the U.S. and select states, 2014
Area RankBirth Rate Per 1,000 Women
UnitedStates 24.2Arkansas 1 39.5Oklahoma 2 38.5Mississippi 3 38.0New Mexico 4 37.8
Texas 5 37.8West Virginia 6 36.6Louisiana 7 35.8Kentucky 8 35.3Tennessee 9 33.0Alabama 10 32.0Wyoming 11 30.1Arizona 12 29.9South Carolina 13 28.5Nevada 14 28.5District of Columbia 15 28.4
34Source: National Center for Health Statistics at the Centers for Disease Control and Prevention
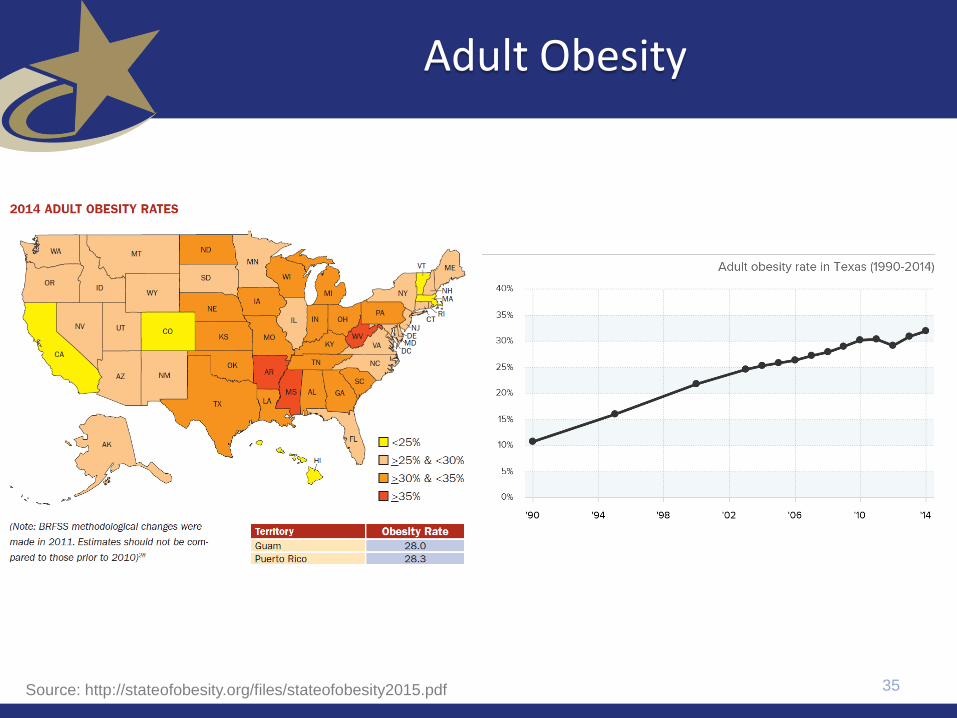
Adult Obesity
35Source: http://stateofobesity.org/files/stateofobesity2015.pdf
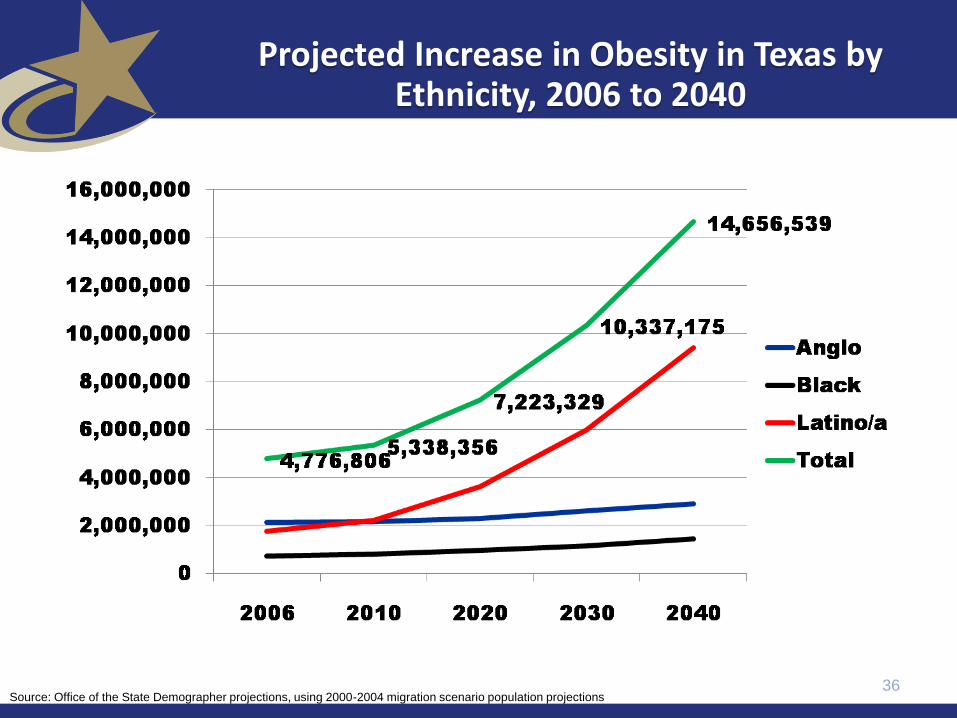
Projected Increase in Obesity in Texas by Ethnicity, 2006 to 2040
36Source: Office of the State Demographer projections, using 2000-2004 migration scenario population projections

Projected Number of Adults with Diabetes by Race and Ethnicity, Texas, 2010-2040
37
0
2,000,000
4,000,000
6,000,000
8,000,000
Total
Latino
Anglo
African American
Other
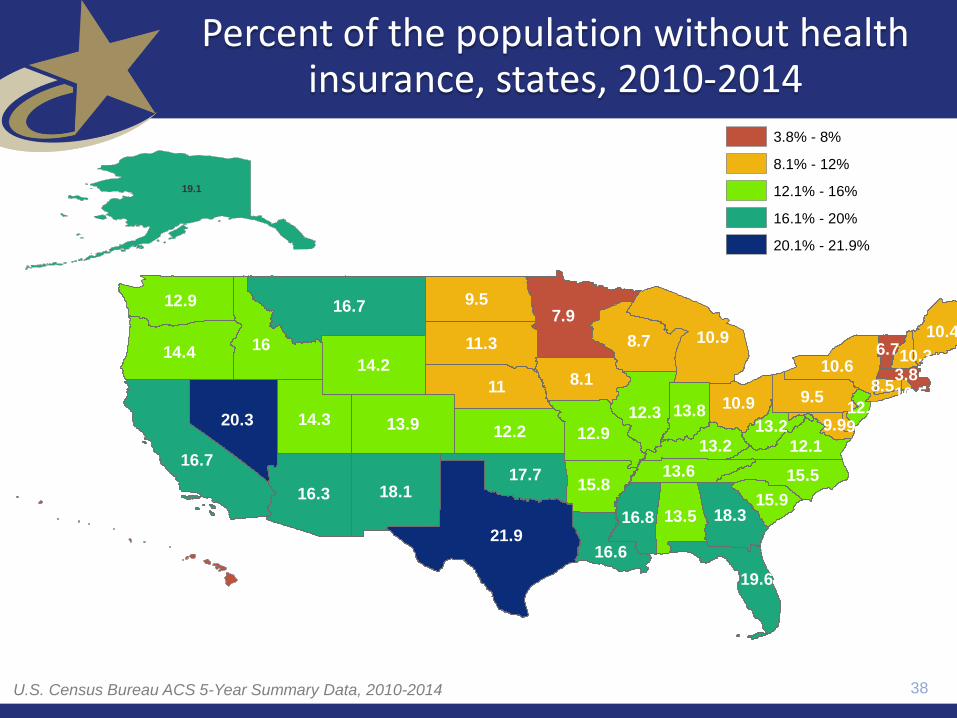
Percent of the population without health insurance, states, 2010-2014
21.9
16.7
16
16.7
11
7.9
18.1
9.5
20.3
16.3
14.410.9
13.9
14.2
8.711.3
14.3
8.1
12.9
12.2 12.9
17.7
9.512.3
10.6
18.3
15.515.8
13.5
16.6
10.9
16.8
12.1
13.6
13.2
10.4
13.8
15.9
19.1
19.6
13.2 9.9
3.8
6.710.3
12.59
8.5
7.2
10.5
38
Legend
tl_2014_us_state
PctUnins
3.8% - 8%
8.1% - 12%
12.1% - 16%
16.1% - 20%
20.1% - 21.9%
19.1
14.4
16.7
12.9
6.76.76.7
6.7
6.7
U.S. Census Bureau ACS 5-Year Summary Data, 2010-2014
39
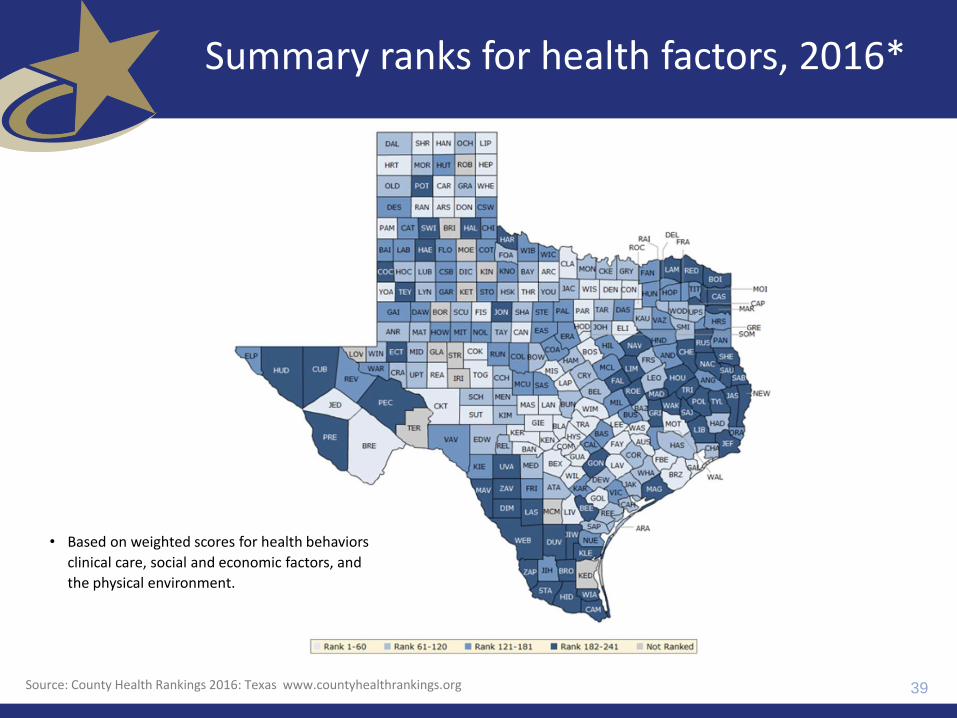
Summary ranks for health factors, 2016*
• Based on weighted scores for health behaviors
clinical care, social and economic factors, and
the physical environment.
Source: County Health Rankings 2016: Texas www.countyhealthrankings.org
Contact
Office: (210) 458-6530
Email: [email protected]
Internet: demographics.texas.gov
Lloyd Potter, Ph.D.
@TexasDemography
40
Recommended