THE INFLUENCE OF WAGES AND NONWAGE
AMENITIES ON THE LABOUR MARKET FOR HIGH
SCHOOL TEACHERS IN NEW SOUTH WALES
A thesis submitted in fulfilment of the requirements for the award of the
degree
Doctor of Philosophy
from
University of Wollongong
by
Anthony R. Stokes, MEc (Soc. Sc.)(Hons), BA, Dip.Ed.
Department of Economics
2005

CERTIFICATION I, Anthony R. Stokes, declare that this thesis submitted in fulfilment of the requirements for the award of Doctor of Philosophy, in the Department of Economics, University of Wollongong, is wholly my own work unless otherwise referenced or acknowledged. The document has not been submitted for qualifications at any other academic institution. Anthony R. Stokes ___________________ 2005

ACKNOWLEDGEMENTS
I would especially like to thank my principal supervisor, Professor Don Lewis, for seven
and a half years of guidance, perseverance and support. I would also like to thank my co-
supervisor, Dr Frank Neri, for his approach as ‘devils advocate’. I think it kept us
questioning the issues being investigated.
I have to thank the NSW Department of Education, various Catholic Education Offices,
school principals and teachers who supported and participated in this project. In addition, I
would like to thank the universities, lecturers and students who assisted in the surveys of
university students.
Thank you also to my colleagues and students for your interest in and support of the project
and the motivation you provided to keep going.
Finally, I would like to thank my family for their support and encouragement both in this
thesis and through out my lifetime.

ABSTRACT
This thesis focuses on the teacher labour market in NSW and examines the effects of the
current wage fixation system and labour market conditions on the quantity and quality of
teachers in NSW high schools. Allowing for the budget constraints facing the NSW
Government and other employer groups, this thesis explores alternative ways to increase
teacher utility and thus incentives to work as teachers through improvements in nonwage
amenities. This thesis uses hedonic wage theory to examine how workers will try to
maximise their utility based on their individual preferences for wage and nonwage
amenities and applies this framework to the high school teacher labour market in NSW.
The thesis suggests ways of improving the level of teacher satisfaction (utility) in NSW
high schools with the aim of improving teacher retention rates and attracting more high
quality university graduates to the teaching profession. These policy recommendations
are designed to alleviate the shortages of teachers that already exist in some disciplines
and locations. In addition, the shortage of teachers is likely to grow unless remedial
actions are taken. The promotion of greater job satisfaction among teachers may not only
help to alleviate this shortage but can also lead to increased teacher effectiveness, which
ultimately affects student achievement.

Table of Contents
Certification Acknowledgements Abstract Table of Contents List of Tables List of Figures
Chapter Page
Introduction i An Overview of the Argument iii Thesis Outline vii
1 An Introduction to the Labour Market for Teachers
1
1.1 Introduction 1 1.2 A Competitive Teacher Labour Market 6 1.3 What Factors Determine the Level of Job Satisfaction among
American Teachers? 15
1.4 Conclusion 32
2 Labour Market Theories
35
2.1 The Market for Labour 35 2.2 Hedonic Wage Theory 47 2.2.1 Nonwage Amenities in the Teacher Labour Market 49 2.2.2 The Role of Isoprofit Curves 55 2.3 Conclusion 60
3 The Demand for High School Teacher in New South Wales
63
3.1 Introduction 63 3.2 The Employers of Teachers in NSW High Schools 65 3.3 Determinants of Demand for Teachers in NSW High Schools 67 3.4 What are the Trends in the Demand for High School Teachers in
NSW? 80
3.4.1 Age Retirement 82
3.4.2 Resignations 84 3.4.3 Redundancy 87 3.4.4 Contract Expired (and Not Renewed) 87 3.4.5 Going on Extended Leave of at Least One Term Duration 87 3.4.6 Other 88 3.5 Conclusion 90
4 The Supply of High School Teachers in New South Wales
92
4.1 The Factors Influencing the Overall Supply of Teachers in NSW High Schools
92
4.1.1 New Graduates 92 4.1.2 Teachers Returning from Leave 100 4.1.3 Former Teachers Returning to Teaching 101 4.1.4 The Pool of Trained Teachers who are not Employed Full-
time as Teachers 102
4.1.5 Teachers who have Moved into NSW from another State or from Overseas
106
4.2 Factors Influencing the Supply of Teachers in Specialisation Classifications
110
4.3 Factors Influencing Supply by Geographic Location 113 4.4 The International Supply of Teachers 121 4.5 Projections of Teacher Supply in NSW 125 4.6 Conclusion
135
5 Models of Teacher Labour Supply
137
5.1 Introduction 137 5.2 Teacher Supply Projection Models 138 5.3 A Model of Teacher Labour Supply in a Particular Geographic or
Socio-economic Area 139
5.4 The Effect of Gender on Teacher Labour Supply Models 144 5.5 A Dynamic Model of High School Teacher Labour Supply 145 5.6 A Model of High School Teacher Labour Supply for a Particular
Location in NSW 145
5.6.1 A Description of the Sample 152 5.6.2 The Model Estimated 154 5.7 Gender Models of High School Teacher Labour Supply for a
Particular Location in NSW 158
5.8 A Time Series Study of Changes in the Relative Wages of Male and Female Teachers in NSW High Schools 1976-2002
164
5.9 Male Teachers and Relative Wages 167

5.10 The Private Rate of Return of Teachers 169 5.11 Teacher Salary Relativities: A Benchmarking Approach 170 5.12 Conclusion
176
6 A Survey of Teachers in NSW High Schools on the Influence of Salaries and Nonwage Amenities in Determining Job Satisfaction
177
6.1 Introduction 177 6.2 Methodology of the Study 178 6.3 A Description of the Sample 181 6.4 How Important were Wages to the Teachers? 184 6.5 What Determines Job Satisfaction for High School Teachers in
NSW? 193
6.6 How Does Job Satisfaction Vary with the Different Characteristics of High School Teachers?
195
6.6.1 Hypothesis Testing by Gender 195 6.6.2 Hypothesis Testing by Age 202 6.6.3 Hypothesis Testing by School System 205 6.6.4 Hypothesis Testing by Level of Academic Qualifications 212 6.6.5 Hypothesis Testing by Location of the School 216 6.7 What is the Level of Job Satisfaction among High School
Teachers in NSW? 222
6.8 How Does the Level of Job Satisfaction Vary with the Characteristics of Teachers in NSW High Schools?
225
6.8.1 Hypothesis Testing by Gender 225 6.8.2 Hypothesis Testing by School System 230 6.8.3 Hypothesis Testing by Age of Teachers 242 6.8.4 Hypothesis Testing by Level of Academic Qualifications 251 6.8.5 Hypothesis Testing by Location of the School 253 6.9 A Weighted Satisfaction Score for High School Teachers in NSW 260 6.10 A Regression Model of Teacher Satisfaction 269 6.11 Conclusion
273
7 What Factors Influence the Decisions of University Students to Become Teachers?
275
7.1 Introduction 275 7.2 Surveys of University Students 275 7.3 Methodology of the Study 276 7.4 A Description of the Sample 279 7.5 A Regression Model of the Factors Influencing University 282

Students’ Intentions to Teach 7.6 How Would Higher Teacher Salaries Affect Students’ Career
Choices? 286
7.7 What Factors Influence the Career Choices of University Students?
288
7.8 Factors Influencing the Career Choices of University Students Regarding Teaching
291
7.9 How Did the Students Rate Employment Conditions in NSW High Schools?
299
7.10 How Do University Students’ Views on Teachers’ Working Conditions Vary Depending on their Intention to Teach?
302
7.11 Do University Students’ Attitudes to Pursuing a Teaching Career Vary between Genders?
308
7.12 Do University Students’ Attitudes to Pursuing a Teaching Career Vary across Discipline Areas?
311
7.13 How Did Certain Extrinsic Factors Influence the Students’ Decisions to Pursue a Career in Teaching?
313
7.14 Conclusion
321
8 Conclusions and Policy Implications of the Study
324
8.1 Conclusions of the Study 324 8.2 Policy Implications 338 8.2.1 National Issues 339 8.2.2 State Issues 344 8.2.3 System Issues 353 8.2.4 Individual School Issues 359 8.3 Conclusion
361
List of References
363
Appendix A 373 Appendix B 381 Appendix C 385

List of Tables Table Page 1.1 The Factors Underlying the Differences in Salaries of Public and
Private School Teachers, by Private School Type
8
1.2 Salaries of Teachers with Selected Undergraduate Majors, as a Percentage Difference from General Elementary Majors, 1990-91
11
1.3 Salaries of Teachers by Highest Degree Earned, as a Percentage Difference from Teachers with Bachelor's Degrees, 1990-91
12
1.4 Percentage Effect of Teacher Attitudes and Perceptions on Salaries, by Sector, 1990-91
14
1.5 Percentage of High School Teachers across Levels of Satisfaction, by School Sector and Teacher Compensation Factors, 1993-94
16
1.6 Percentages of High School Teachers across Levels of Satisfaction, by School Sector, Selected Attitudes, and Perceptions of Workplace Conditions, 1993-94
18
1.7 Percentage of High School Teachers who Agree with the Following Statements, by School Sector, 1993-94
31
3.1 Median Salaries and Level of Full-time Employment of Initial Education Graduates, by State and Territory, 2002
64
3.2 Percentages of Teachers in New South Wales High Schools, by Category of School
66
3.3 Sources of Income per Student in Schools in NSW, by System, 2000
71
3.4 Highest Formal Qualifications of Teachers in Australia, by School System 2001
78
3.5 Separations (Other than through Leave of Absence) from the Government Permanent Teaching Workforce in Australian High Schools, as a Percentage of that Workforce, 1996 and 1999
82
4.1 Projections of Total Completions from Secondary Teacher Training Courses in NSW, 1999 to 2003
98
4.2 Year 12 Completion Rates by Locality and Gender, Australia, 1994-1998 (%)
116
4.3 Percentage of Lower Secondary Teaching Staff 50 Years and Over, and Percentage of Women Among Lower Secondary Teaching Staff, 1992 and 1999
123
4.4 Projections of High School Teachers in NSW, 2000-2005
132
5.1 Descriptive Statistics across Regions of NSW, High School Teacher Model (1)
153
5.2 Coefficients of the High School Teacher Model (1)
156
5.3 Coefficients of the High School Teacher Model (1a)
157
5.4 High School Teacher Model (1a) Summary
157
5.5 Summary Table of the Teacher Models
160
5.6 Measurements of the Private Rate of Return to Higher Education
170
5.7 Measurements of the Private Rate of Return to Teaching (%) 170
6.1 Gender Distribution of Teachers’ Surveyed and Actual Percentages in NSW High Schools
182
6.2 Age Distribution of Teachers Surveyed and Estimated Percentages in NSW Schools
183
6.3 Distribution of Teachers Surveyed Based on Teaching Experience
183
6.4 Distribution of Teachers Surveyed Based on the Location of the School
183
6.5 Distribution of Teachers Surveyed Based on the School System and Actual Percentages in NSW High Schools
184
6.6 Teachers’ Supplementary Income
185
6.7 Source of Supplementary Income
185
6.8 Annual Additional Income
185
6.9 Income Supplementation of Teachers, Based on Gender
188

6.10 Other Income Sources, Based on Gender
188
6.11 Annual Additional Income, Based on Gender
189
6.12 Teachers’ Attitudes to their Salaries
190
6.13 Relative Salaries and Job Choice
191
6.14 The Importance of the Level of Salary in Changing School Systems
193
6.15 The Importance of Factors in Measuring Teacher Satisfaction
196
6.16 Gender and the Importance of Factors in Determining Job Satisfaction Summary Table
198
6.17 Gender and Support from Administration
198
6.18 Gender and Low Level of Stress
199
6.19 Gender and Number of Holidays
200
6.20 Support of Student’ Parents
201
6.21 Age and the Importance of Factors in Determining Job Satisfaction Summary Table
203
6.22 Age and the Possibility of Promotion
204
6.23 School Systems and the Importance of Factors in Determining Job Satisfaction Summary Table
206
6.24 School System and Number of Holidays
207
6.25 School System and Hours of Work
208
6.26 School System and the Attitude of Students
210
6.27 School System and the Attitude of the General Public
211
6.28 Level of Academic Qualifications and the Importance of Factors in Determining Job Satisfaction Summary Table
213
6.29 Level of Academic Qualifications and the Possibility of Promotion
214
6.30 Level of Academic Qualifications and Support of Your Family
216

6.31 Location of School and the Importance of Factors in Determining Job Satisfaction Summary Table
218
6.32 Location and Attitude of Peers
219
6.33 Location and Attitude of Students
221
6.34 Levels of Teacher Satisfaction
224
6.35 Gender and the Level of Teacher Job Satisfaction Summary Table
227
6.36 Gender and the Satisfaction of Student Achievement
227
6.37 Gender and the Possibility of Promotion
229
6.38 Gender and a Low Level of Stress
230
6.39 School System and the Level of Teacher Job Satisfaction Summary Table
231
6.40 School System and Level of Salary
233
6.41 School System and Support from Administration
234
6.42 School System and the Attitude of Students
235
6.43 School System and the Satisfaction of Student Achievement
237
6.44 School System and the Support of Students’ Parents
238
6.45 School System and Attitude of the General Public
240
6.46 School System and the Possibility of Promotion
241
6.47 Age and the Level of Teacher Job Satisfaction Summary Table
243
6.48 Age and Low Level of Stress
244
6.49 Age and the Possibility of Promotion
246
6.50 Age and Support from Administration
247
6.51 Age and Attitude of Peers
248
6.52 Age and Attitude of the General Public
250

6.53 Level of Academic Qualifications and the Level of Teacher Job Satisfaction Summary Table
252
6.54 Qualifications and the Possibility of Promotion
252
6.55 Location of School and Level of Teacher Job Satisfaction Summary Table
254
6.56 Location of the School and the Support from Administration
255
6.57 Location of the School and the Support from the Students’ Parents
257
6.58 Location of the School and the Attitude of the Students
259
6.59 Descriptive Statistics for Weighted Satisfaction Scores by Categories
262
6.60 Coefficients of the High School Teacher Satisfaction Model (1a) 271
6.61 Coefficients of the High School Teacher Satisfaction Model (1b) 272
7.1 Year of Study at University
279
7.2 Gender of Students
279
7.3 Age Distribution of Students
279
7.4 University Admission Index
280
7.5 Residential Distribution
280
7.6 Field of Study
281
7.7 Type of School Attended
282
7.8 Student Intentions about Pursuing a Teaching Career
282
7.9 Coefficients of the University Students’ Intentions to Teach (1a) 285
7.10 Coefficients of the University Students’ Intentions to Teach (1b) 286
7.11 Student Intentions towards Pursuing a Teaching Career and Teachers’ Salaries
287
7.12 The Importance of Factors in Students’ Decisions to Pursue Particular Careers
290

7.13 Factors Influencing Career Choice and Intention to Teach Summary Table
291
7.14 Attitude of the General Public in Career Choice and Intention to Teach Summary Table
292
7.15 Desire to Help Others in Career Choice and Intention to Teach
294
7.16 Level of Salary in Career Choice and Intention to Teach
295
7.17 Number of Holidays in Career Choice and Intention to Teach
297
7.18 Interest in the Work in Career Choice and Intention to Teach
298
7.19 University Student Views on Teachers’ Working Conditions
301
7.20 University Student Views on Teachers’ Working Conditions and Intention to Teach Summary Table
302
7.21 Level of Salary and Intention to Teach
303
7.22 Number of Holidays and Intention to Teach
305
7.23 Hours of Work and Intention to Teach
306
7.24 Attitude of the General Public and Intention to Teach
307
7.25 Gender and Intention to Teach
308
7.26 Gender and Intention to Teach Related to Salary Increase
310
7.27 Field of Study and Intention to Teach
312
7.28 The Attitude of Teachers and Intention to Teach
315
7.29 The Attitude of Parents and Intention to Teach
316
7.30 Experience of School and Intention to Teach
318
B.1 Distribution of Teachers Surveyed Based on Highest Qualification
382
B.2 Distribution of Teachers Surveyed Based on Education Qualifications
382
B.3 Distribution of Teachers Surveyed Based on Area of Academic Qualification
382

B.4 Distribution of Teachers Surveyed Based on Salary
383
B.5 Distribution of Teachers Surveyed Based on Place of Residence
383
B.6 Distribution of Teachers Surveyed Based on Non-English Speaking Background of Students
383
B.7 Distribution of Teachers Surveyed Based on their Main Teaching Field
384
B.8 Distribution of Teachers Surveyed Based on Main Classes Taught 384

List of Figures Figure Page 2.1 Shortages in the Labour Market for Teachers 37
2.2 Surplus in The Labour Market for Teachers 38
2.3 Hours of work for a salaried worker when work and leisure are perfect substitutes
40
2.4 The efficiency wage model 44
2.5 An indifference map for wages and nonwage amenities 49
2.6 A group of isoprofit curves for an employer 56
2.7 Matching Employee and Employers 58
3.1 Discrimination in the teacher labour market 76
3.2 An indifference map for wages and nonwage amenities 79
3.3 Number of teaching staff in NSW high schools, 1984-2002 80
3.4 Age of school teachers in Australia, 1991 and 2001 83
3.5 School teachers by years of experience in all NSW Catholic high schools, 1992-2002
84
4.1 Total commencements of and completions from secondary teacher training courses in New South Wales, 1988 to 1999
97
4.2 Commencements of postgraduate and undergraduate secondary teacher training courses in NSW, 1989 to 1999
97
4.3 Annual net migration flow of school teachers in Australia from 1995-96 to 1999-2000
108
4.4 Annual net residents flow of school teachers in Australia from 1995-96 to 1999-2000
109
5.1 Relative wages of teachers and the quantity of teachers per student across regions
147
5.2 Relative wages of teachers and the quantity of teachers per student in equilibrium and in disequilibrium
148
5.3 Location of high school teachers in SLAs in NSW, based on their distance from major cities (klms)
150
5.4 The labour market for qualified and unqualified teachers 163
5.5 The relative average weekly earnings of male and female teachers in Australia 1976-2002
165
5.6 The ratio of males to female teachers in high schools in NSW 1977–2003
166

i
Introduction
The labour market is the market for the factor of production labour. It is made up of those
who have a demand for labour, employers and those who supply the labour, workers. The
labour market differs from other markets in that the item being exchanged is embodied in a
human being (Ginzberg 1976). The purchaser of the labour and the supplier of the labour
have a personal relationship between each other. The workers, as human beings will have
personal preferences in regard to the conditions that they work under. Thus the labour
market is not only dependent on wages and on-costs, but non-financial factors that are
largely absent from product markets. These factors include the safety and quality of the
work environment, the hours of work, opportunities for promotion, the status and public
perception of the job and the attitude of management and fellow employees. The
importance of these factors varies with the individual preferences of workers. Decisions of
firms, regarding whom to employ, are determined by a complex array of considerations,
involving not only monetary returns but also non-pecuniary advantages and disadvantages
associated with the job or workers.
The high school teacher labour market in NSW is comprised of three major employer
groups. The main employer of teachers in NSW high schools is the NSW Government,
through the NSW Department of Education and Training (DET). The Government is also
partly responsible for the funding of Catholic and independent schools in NSW. The
Government is faced with limitations on their ability to fund education. Their ability to
fund teachers’ wages is constrained by their budgets and the political repercussions of

ii
increases in taxation or cuts in the Government’s expenditure in other areas to fund teacher
wage increases. This has a major influence on the operation of the teacher labour market in
NSW. The limited funding and the monopsonist employer position of the NSW
Government has led to a situation of market disequilibrium, with wage levels insufficient to
attract teachers at least in some discipline areas and locations. The free operation of market
forces would lead to wages rising and falling in response to changes in demand and supply.
This does not occur in the Australian teacher labour market at this time.
This thesis focuses on the teacher labour market in NSW and examines the effects of the
current wage fixation system and labour market conditions on the quantity and quality of
teachers in NSW high schools. Allowing for the budget constraints facing the NSW
Government, and other employer groups, this thesis explores alternative ways to increase
teacher utility and thus incentives to work as teachers through improvements in nonwage
amenities. Hedonic wage theory suggests that workers will try to maximise their utility
based on their individual preferences for wage and nonwage amenities. In occupations
where nonwage amenities are greater there is a tendency to find lower wages, and in
occupations with negative nonwage amenities, wages will tend to be higher. Thus it can be
expected that there are two ways of increasing utility and the likelihood of people becoming
teachers and remaining in teaching, i.e. improved wages and/or improved nonwage
amenities.
The thesis will suggest ways of improving the level of teacher satisfaction in NSW high
schools with the aim of improving teacher retention rates and attracting more high quality

iii
university graduates to the teaching profession to alleviate shortages of teachers, existing in
some disciplines and locations now and in the future. The promotion of greater job
satisfaction among teachers can also lead to increased teacher effectiveness, which
ultimately affects student achievement.
An Overview of the Argument
Research in the USA (National Center for Education Statistics 1996, 1997), where there is a
relatively flexible labour market for teachers, shows that employee compensation reflects,
at least in part, the forces of demand and supply. The effect on wages of particular teacher
characteristics, such as qualifications and experience, reflect a combination of the perceived
value of the attribute to the employer and the availability of that attribute in the market. In
teaching areas where there were perceived shortages or competition from the private non-
school sector, there tended to be higher wages, as theory would suggest in a flexible labour
market.
The studies (National Center for Education Statistics 1996, 1997) showed that teacher
compensation was not the most important factor in determining where teachers were
employed. Teachers in public schools earned up to 119 percent more than those in private
schools. Teachers in private schools were willing to accept lower wages because of the
perceived better conditions in terms of their overall level of job satisfaction. The 1997
National Center for Education Statistics (NCES) study found that student behaviour and
school atmosphere, administrative support and leadership, and teacher control over working
conditions were the most important factors in determining teacher job satisfaction in both

iv
private and public high schools. These characteristics were all more prominent in the
private school sector rather than the public school sector and acted as a trade-off for the
higher wages on offer in the public sector. Private high school teachers were willing to
accept much lower wages in return for these characteristics. In turn public high school
teachers received higher wage rates to teach in schools that were perceived as having less
of these favourable characteristics. Overall it was shown that teacher compensation
showed little relationship to the level of job satisfaction of teachers.
Research in this area is extremely limited in Australia. Webster et al. (2004) consider that
“there appears to be no analytic studies of labour market motivations of teachers (in
Australia).” This thesis will provide the basis for an understanding of the labour market
motivations of teachers and those who could become teachers. It will also consider policies
that could act to improve the motivation to teach and improve educational outcomes in high
schools in NSW.
Australia does not have as flexible a teacher labour market as the USA. The majority of
teachers in NSW are employed in public schools. They are all paid the same salary based
on the Crown Employees (Teachers in Schools and TAFE and Related Employees) Salaries
and Conditions Award. The NSW Department of Education and Training (DET) allocate
teachers to schools. There is not the flexibility to offer different salaries in different
schools to attract teachers. Salary incremental progression is based on a 13-step scale, with
progression based on years of teaching service not productivity. The next largest teacher
employer group in NSW, the Catholic systemic schools, have salary scales generally the
v
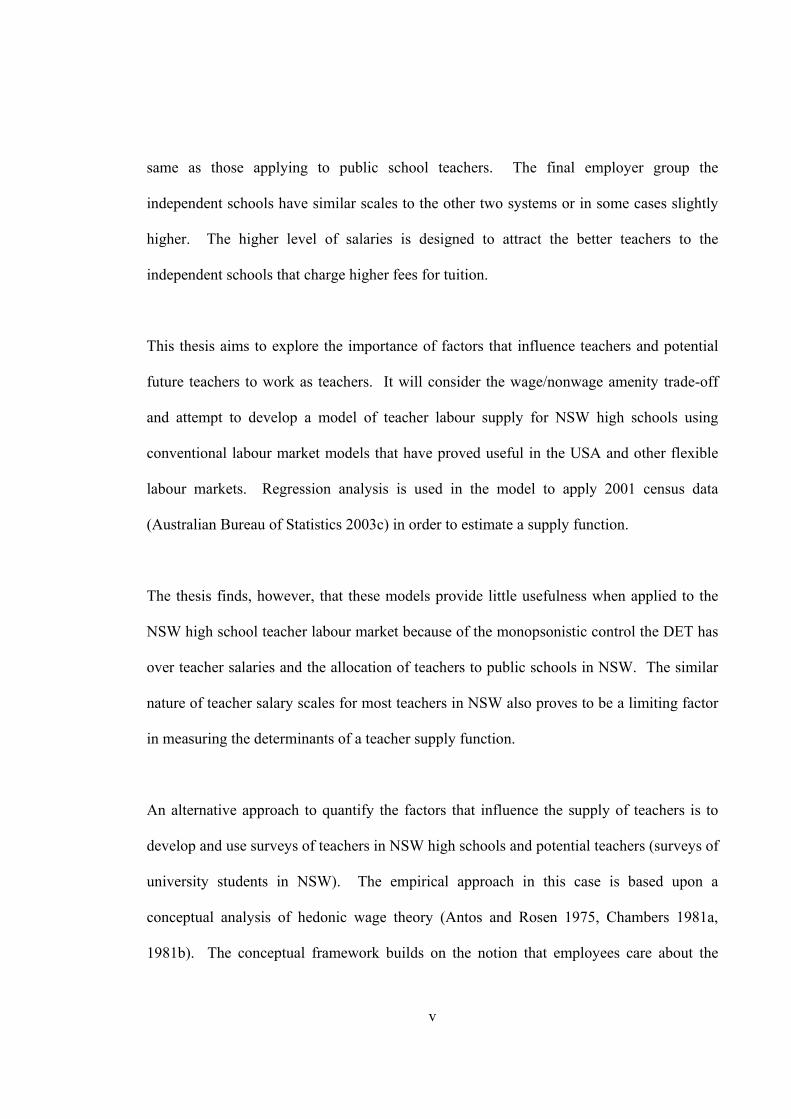
same as those applying to public school teachers. The final employer group the
independent schools have similar scales to the other two systems or in some cases slightly
higher. The higher level of salaries is designed to attract the better teachers to the
independent schools that charge higher fees for tuition.
This thesis aims to explore the importance of factors that influence teachers and potential
future teachers to work as teachers. It will consider the wage/nonwage amenity trade-off
and attempt to develop a model of teacher labour supply for NSW high schools using
conventional labour market models that have proved useful in the USA and other flexible
labour markets. Regression analysis is used in the model to apply 2001 census data
(Australian Bureau of Statistics 2003c) in order to estimate a supply function.
The thesis finds, however, that these models provide little usefulness when applied to the
NSW high school teacher labour market because of the monopsonistic control the DET has
over teacher salaries and the allocation of teachers to public schools in NSW. The similar
nature of teacher salary scales for most teachers in NSW also proves to be a limiting factor
in measuring the determinants of a teacher supply function.
An alternative approach to quantify the factors that influence the supply of teachers is to
develop and use surveys of teachers in NSW high schools and potential teachers (surveys of
university students in NSW). The empirical approach in this case is based upon a
conceptual analysis of hedonic wage theory (Antos and Rosen 1975, Chambers 1981a,
1981b). The conceptual framework builds on the notion that employees care about the

vi
quality of their work environment as well as monetary rewards associated with particular
employment alternatives. As a result workers will seek to attain the greatest possible
personal satisfaction by selecting a job with the appropriate combination of monetary and
non-monetary rewards. The non-monetary rewards can include factors such as the quality
of their work environment and the overall level of job satisfaction. In a free market,
employers and employees will have different sets of factors that determine the demand for
different types of labour and the supply of labour under different conditions. In theory, the
employer will be more willing to employ labour with those characteristics that they value
most. This in turn means that those workers will generally receive higher remuneration
compared to the less desired workers. The employee on the other hand would be willing to
trade-off wages in exchange for better working conditions and satisfaction or utility.
The thesis proposes that wages are just one of a number of factors that influence decisions
about employment in the teaching field. The nonwage amenities such as satisfaction from
student achievement, interest in the subject taught and the attitude of peers can be more
important to teachers than the wages they receive in determining their individual utility.
The thesis will explore this through an analysis of the results of the surveys. Consideration
will also be given to assessing differences in teacher satisfaction based on differences in
teacher and school characteristics.
The thesis supports the proposition by Webster et al. (2004: 2) that the “entrenched
inflexibilities in the payments system have contributed towards chronic shortages of
qualified teachers in specialised teacher labour markets and poor incentives for excellent
teachers to remain in teaching.” The conclusions of this are that the inflexibility of the
vii
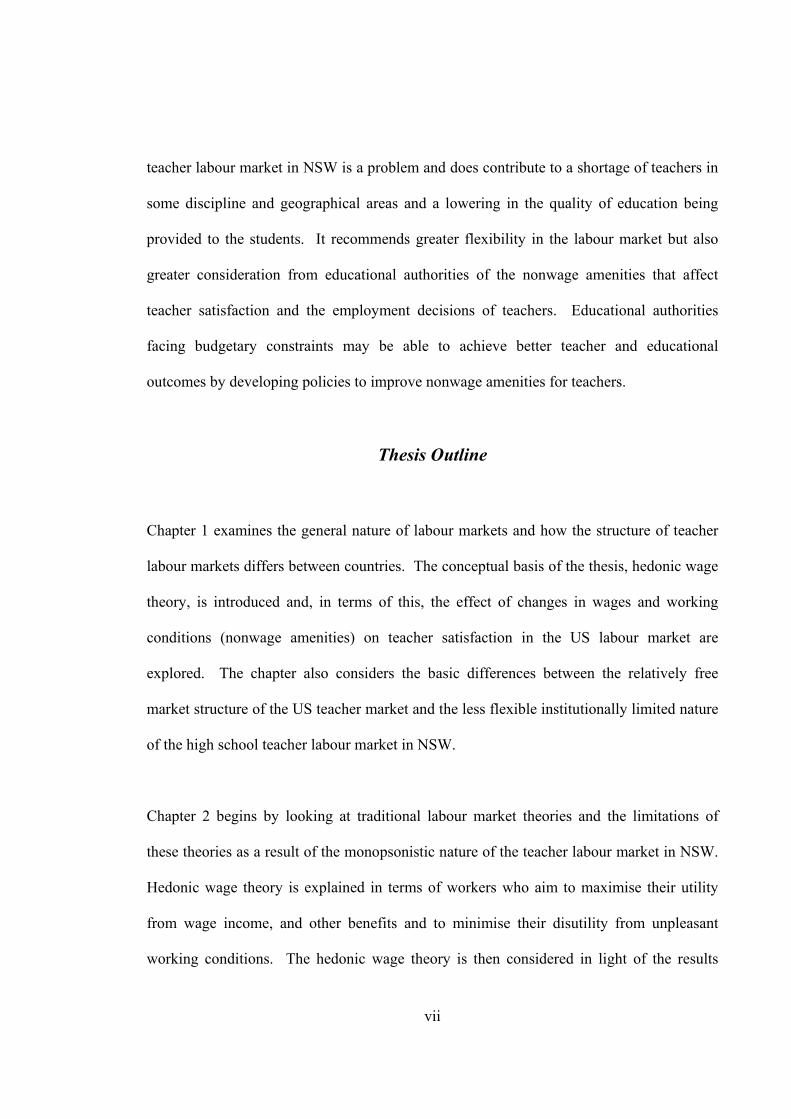
teacher labour market in NSW is a problem and does contribute to a shortage of teachers in
some discipline and geographical areas and a lowering in the quality of education being
provided to the students. It recommends greater flexibility in the labour market but also
greater consideration from educational authorities of the nonwage amenities that affect
teacher satisfaction and the employment decisions of teachers. Educational authorities
facing budgetary constraints may be able to achieve better teacher and educational
outcomes by developing policies to improve nonwage amenities for teachers.
Thesis Outline
Chapter 1 examines the general nature of labour markets and how the structure of teacher
labour markets differs between countries. The conceptual basis of the thesis, hedonic wage
theory, is introduced and, in terms of this, the effect of changes in wages and working
conditions (nonwage amenities) on teacher satisfaction in the US labour market are
explored. The chapter also considers the basic differences between the relatively free
market structure of the US teacher market and the less flexible institutionally limited nature
of the high school teacher labour market in NSW.
Chapter 2 begins by looking at traditional labour market theories and the limitations of
these theories as a result of the monopsonistic nature of the teacher labour market in NSW.
Hedonic wage theory is explained in terms of workers who aim to maximise their utility
from wage income, and other benefits and to minimise their disutility from unpleasant
working conditions. The hedonic wage theory is then considered in light of the results

viii
reported in Chapter 1 dealing with the behaviour of teachers in the labour market in the
USA and studies of teacher satisfaction previously carried out on the teacher labour market
in New South Wales.
Chapter 3 considers the factors that determine the demand for high school teachers in
NSW. It begins by discussing the role and significance of the three main employer groups,
classified by the Australian Bureau of Statistics (ABS) as:
• Government;
• Non-Government Catholic; and
• Non-Government Independent.
The Thesis then considers the factors determining the quantity of teachers that will be
demanded at a particular point in time and trends in the demand. Teachers returning to the
classroom who were employed in schools the previous year meet most of the annual
demand for teachers. Each year, however, some new teachers need to be employed due to
some teachers leaving and due to changes in a number of other factors. The demand for
these additional teachers in NSW high schools is a function of:
• the number of teachers leaving the workforce (permanently or on leave); and
• the ‘growth demand for teachers’ (MCEETYA 2001).
The number of teachers leaving the workforce depends on:
• the number of teachers retiring;
• the number of teachers going on leave; and

ix
• the number of teachers quitting for various reasons, including going into other areas
of teaching, excluding NSW high schools.
The growth demand for teachers depends on changes in:
• the size of the school age population;
• participation rates at various ages and especially the retention rate to Year 12;
• the level of government and private funding of schools, and teacher and ancillary
costs; and
• policies regarding class sizes and curricula (which can affect class sizes).
These issues are discussed, along with the significance of the aging teacher workforce
generating an increasing demand for additional new teachers over time.
Chapter 4 examines the supply of teachers in NSW high schools. This chapter focuses on
the sources of additional (or new) teachers to cover separations and any net increase in
demand for teachers. The principal sources of new teachers discussed include:
• new graduates;
• teachers returning from leave;
• former teachers returning to teaching;
• the pool of trained teachers who are not employed full-time as teachers; and
• teachers who have moved into NSW from another state or from overseas.
x
This chapter also considers projections of high school teacher labour supply for NSW and
issues involving the use of projections in education planning.
Chapter 5 develops models of teacher labour supply for NSW high schools. The models
are designed to measure the significance of variables that will affect the supply of high
school teachers in particular locations in NSW. Models of high school teacher labour
supply are developed not only for all high school teachers in NSW but also gender specific
models. The literature shows that males and females have different behaviours in the
labour market, so gender specific models are developed to enable a better understanding of
the supply of teachers and to develop policies that can achieve better labour market
outcomes.
Chapter 5 considers the effect of changes in relative wages on the teacher labour supply.
Trends in the proportion of male teachers to female teachers in NSW high schools are
explored and their relationship to trends in relative wages for male and female teachers,
measured in terms of the percentages of average weekly earnings are examined. Labour
market theory suggests that lower relative wages for one group would tend to reduce the
proportion of that group in the labour supply. The private rate of return for teachers is
compared to other areas of graduate employment and the effect of differences in wages
between occupations based on job descriptions is also considered through a benchmarking
process.

xi
Chapter 6 identifies the main factors and the relative importance of these factors in
influencing the overall job satisfaction of teachers in NSW high schools. The results are
based on a survey of 269 high school teachers throughout NSW. The literature suggests
that improved job satisfaction will increase teacher retention rates, encourage more
university graduates to enter teaching and lead to increased teacher effectiveness, which
ultimately should lead to an improvement in student achievement. The chapter considers
how the level of teacher satisfaction varies across different characteristics of teachers and
schools such as:
• gender;
• age;
• school system;
• level of academic qualifications; and
• location of the school.
The results of this chapter provide an insight into the areas that are most important in
improving the level of satisfaction amongst teachers and as a result may suggest areas for
policy implementation to improve teacher and education outcomes.
Chapter 7 examines the factors that influence university students (potential future teachers)
in deciding whether to become teachers and to enter the high school teacher labour market
in NSW. As university students are the main source of new teachers it is important to
know the factors that influence their decisions to become or not to become teachers.

xii
Improving the utility of wage and nonwage amenities associated with teaching is likely to
increase the proportion of university students who pursue teaching as a career.
The results are based on a survey of 201 first year students and 209 third/final year students
throughout NSW. There are a number of issues that are considered. First, what can be
done to increase the overall number of university graduates entering teaching? Second, are
there different factors that influence the decisions of male and female university graduates
to enter the teacher labour market? Third, what factors influence the decisions of students
to pursue careers in teaching compared to other careers? Finally what perceptions do
students have of a career as a teacher? The results of the surveys show the importance of
various factors in the students choosing a career and the students’ impressions of the
employment conditions for teachers in NSW high schools. The study also considers what
effect changes in teachers’ salaries would have on their likelihood to become teachers and
the effect of a range of increases in teacher salary scales on their decisions.
Chapter 8 summarises the conclusion of the study and develops policy implications from
these conclusions. The implications are considered on a number of levels, namely:
• national issues;
• state issues;
• system issues; and
• individual school issues.

xiii
They provide a blueprint for creating a more efficient high school teacher labour market;
for increasing levels of teacher satisfaction; and improving the quality of education
provided in NSW.

1
Chapter 1. An Introduction to the Labour Market for Teachers
1.1 Introduction The purpose of this chapter is to examine the general nature of labour markets and to see
how teachers fit into this model. Firstly it is important to realise that labour markets differ
greatly from product markets in both structure and characteristics. Possibly the most
important distinguishing feature, as emphasised by Ginzberg (1976), is that the item being
exchanged is embodied in a human being. In product markets basic commodities are
owned and can be exchanged between buyer and seller. Neither party has any personal
interest in the product in terms of personal characteristics such as age, sex, religion, race, or
personality. The commodity, in turn, has no preference in regard to the price it is sold for
or to whom it is sold. Labour, while being a factor of production, is also a service. The
service depends on the person supplying it. The purchaser of the labour and the supplier of
the labour have a personal relationship between each other. The workers, as human beings
will have personal preferences in regard to the conditions that they work under. Thus the
labour market is not only dependent on wages and on-costs, but non-financial factors that
are largely absent from product markets. These factors include the safety and quality of the
work environment, the hours of work, opportunities for promotion, the status and public
perception of the job and the attitude of management and fellow employees. The
importance of these factors varies with the individual preferences of workers. Decisions of
firms, regarding whom to employ, are determined by a complex array of considerations,
involving not only monetary returns but also non-pecuniary advantages and disadvantages
associated with the job or workers.

2
Second, the labour market generally involves a long-term relationship. Most commodities
are bought and sold at a set point in time and the transaction is completed. The buyer is
trying to purchase the product at as low a price as possible and the seller is aiming to
maximise price and thus profits. Thus the individual buyers and sellers carrying out
transactions may vary from day to day. The labour relationship is an ongoing one.
Employers tend to prefer relatively stable work forces. There are considerable costs
incurred in hiring new employees and training them in a new work environment. Workers
in turn may wish to remain with employees for a lengthy period of time to achieve higher
wages with experience, promotion, and other fringe benefits including long service leave
and superannuation. The workers may also feel more secure in a familiar working and
social environment. A study by Topel and Ward (1992) found that a typical male worker
could expect to have 10 jobs between 18 and 65, two thirds of which are in the first 10
years of work life. Once the worker has found what they want they tend to stay there for a
period of time. A worker, who continually changes employment, may also be viewed by
prospective employers as being unreliable and unstable. The nature of the internal labour
market (Kaufman 2000, Norris 2000, McConnell 2003) also contributes to workers tending
to remain in a particular firm. The internal labour market refers to the situation where
competition to fill a vacancy in a firm is limited to workers already employed in the firm.
Workers moving to other firms may also have to reestablish themselves in the new firm and
may start at a lower level of salary or position. These factors influence the decision of a
worker to remain longer in a particular job.
3
One result of the long-term nature of the labour relationship is that it reduces the effect of
changes in the price level, i.e. wages, on the quantity of labour demanded and supplied.
The labour market, as a result, is less flexible and has less mobility of factors compared to
other markets. At least in the short-term, excess demand for labour over supply will not
always lead to increased wages and over supply will not lead to lower wage rates.
Institutions also play an important part in the limited mobility of labour and the flexibility
of wages, especially in a downward direction. Historically, the industrial relations system
in Australia (Norris 1999, Deery 2001) has been dominated by centralised wage fixing
institutions and a system of awards determining minimum wage levels. Even allowing for
the growth in enterprise bargaining and individual agreements in Australia in recent years,
which at least in theory are designed to increase flexibility in the labour market, wage
adjustments often reflect a government’s1 or an industrial court’s decision2. The nature of
general teacher training, of at least four years duration, reinforces the inflexibility of the
supply of labour for teachers. Thus prices in commodity markets will tend to adjust more
quickly than those in labour markets, especially in the downward direction. There is some
evidence, though, that short-term labour markets, such as day labourers, do have a greater
degree of flexibility, similar to that of commodity markets (Campbell 1997).
A third feature is that labour is arguably the most heterogenous of all products. Many
commodities are homogeneous and the decision to buy or sell is purely determined by
1 The NSW Government granted almost all public servants including, teachers, nurses and police a similar wage rise of 16 percent over a three to four year period in 2000. 2 In May 2002, 58 percent of workers in Australia were paid under awards or collective (enterprise) agreements. In the public sector, 88.6 percent of workers were covered by collective agreements. Less than 2 percent of workers were covered by registered individual agreements. The registered individual agreements also limit wage flexibility, as there is a no disadvantage test against the relevant award applied to them. This prevents reductions in money wages below the award (ABS Employee Earnings and Hours Cat. No.6306.0).

4
price. Other products, such as consumer goods, are similar and differentiated by forms of
non-price competition such as brands and packaging. No unit of labour is identical to any
other unit of labour. The productivity of the individual unit of labour can even change from
day to day. Individual workers differ as a result of factors such as age, gender, race,
physical and mental ability, education, experience and motivation to work and their
relationships with their employer and fellow employees. In reality, each worker is an
individual product that should have an individual demand and would have an individual
supply. This creates a very complex market. In situations where workers are offered
individual contracts based on an individual's performance then this is close to the market
functioning correctly. What often takes place though, even in the case of individual
contracts, is that workers are not offered contracts based on their individual characteristics
but on the demand and supply for the group. In teaching there tends to be an increase in the
heterogeneous nature of the workers, compared to say process workers, as their output
(educated pupils) is also human and individual. Studies in the USA and Australia (NCES
1996, Dinham 1995, Dinham and Scott 1996, 1997) have found that teacher job satisfaction
is influenced considerably by their relationship with their students. Teachers will often
have different levels of qualifications, experience, gender, reasons for being teachers,
motivating factors and commitment to their students. They also have different capabilities
of teaching. There is an important distinction between knowing how to teach and being
able to teach another group of heterogeneous humans. This also provides a major challenge
to the employer. They do not have perfect knowledge of the labour units they are
considering purchasing. The employer cannot gauge the individual worth of each unit of
labour. The price that is paid to each individual tends to be the relative value the employer

5
puts on the group of workers, as a whole, at that particular stage or level of work. In some
cases, the distinction is made that qualifications and experience should be rewarded, as the
workers with these attributes generally achieve better results with their students (see
Ferguson 1991, 1998, Goldhaber and Brewer 2000, Mayer, Mullens, and Moore 2000).
Teachers in NSW high schools are paid annual increments in salary with experience, up to
step 13. Teachers with higher qualifications also begin teaching on a higher salary step.
Two year trained teachers begin on step two, three year trained step three, four year trained
step five and five year trained step six (Crown Employees (Teachers in Schools and TAFE
and Related Employees) Salaries and Conditions Award 2000). The overall effect of the
heterogeneity of labour will be for some individuals to be overpaid for their worth, while
others will be underpaid. In a market like teaching, where individual differences can be
greater, this distinction may be even larger.
A final important feature of the labour market is that the composition of an individual
market can change. School teachers can move from school system to school system, from
state to state or even country to country. Teachers can also change from being school
teachers to become university lecturers, economists, computer programmers, researchers,
business managers, and a diverse range of other occupations. So workers can move from
one market to another in response to changes in wages, working conditions and individual
preferences. Generally the more skilled and qualified the worker the greater the
opportunity they would have to move from one labour market to another.

6
The empirical approach in this thesis is based upon a conceptual analysis of hedonic wage
theory (Antos and Rosen 1975, Chambers 1981a, 1981b). The conceptual framework
builds on the notion that employees care about the quality of their work environment as
well as monetary rewards associated with particular employment alternatives. As a result
workers will seek to attain the greatest possible personal satisfaction by selecting a job with
the appropriate combination of monetary and non-monetary rewards. The non-monetary
rewards can include factors such as the quality of their work environment and the overall
level of job satisfaction. The employers, on the other hand, care about the wage they pay
and the productive outcomes of the employees they employ. In a free market, employers
and employees will have different sets of factors that determine the demand for different
types of labour and the supply of labour under different conditions. In theory, the employer
will be more willing to employ labour with those characteristics that they value most. This
in turn means that those workers will generally receive higher remuneration compared to
the less desired workers. The employee on the other hand would be willing to trade-off
wages in exchange for better working conditions and satisfaction or utility.
1.2 A Competitive Teacher Labour Market
The teacher labour market in North America is considerably different from the labour
market that exists in Australia and specifically the NSW high school system. In the USA
and Canada there have been a number of attempts to look at the factors that determine the
number of teachers employed, the composition of the teacher labour market, (Mitchell
1983, Darling-Hammond 1990, Beaudin 1993) and the effect of changes in wage

7
relativities on teachers’ behaviour (NCES 1996, 1997). These studies relate more to a
competitive labour market where teachers are offered different wages in different schools.
The differences in wages vary between public and private schools, between types of private
schools, between school districts and between subjects taught, among other factors that will
be looked at later in this chapter. The studies show, however, that teachers do change
schools depending on the different wages, remunerations and conditions in schools. In
Australia, salaries in public schools are the same throughout a state. Even many Catholic
systemic schools3 have had very similar wage structures to the public schools. Often this
pattern has come about due to the heavy reliance on Federal and State Governments for
funding for teacher salaries and the institutional role of industrial tribunals in wage setting.
It is important to investigate the functioning of the teacher labour market in a relatively
flexible money wage environment in order to understand the factors that influence teachers'
decisions to teach in various environments and thus to gain an insight into the relative
importance of money wages to other factors in this labour market. The USA has a
relatively flexible teacher labour market structure where teachers can move between
schools and locations in response to differences in wages and conditions. In addition
education authorities in the USA, unlike most other countries, have the relevant statistical
data sources and research on the influence of both wage and non-wage factors on teacher
decision making. For example Zabalza (1979:201-2) considers that there are “limitations
on observations inherent in the institutional characteristics of British teacher markets.”
These are a result of the uniform salary scale under conditions of market disequilibrium. In
3 The structure of the school system in Australia is divided into three categories. They are Government (72.3 percent of students); Catholic (Systemic) 17.7 percent and Other Non-Government (Independent) 10 percent (ABS Schools Australia 2001 Cat. No. 4221.0).
8
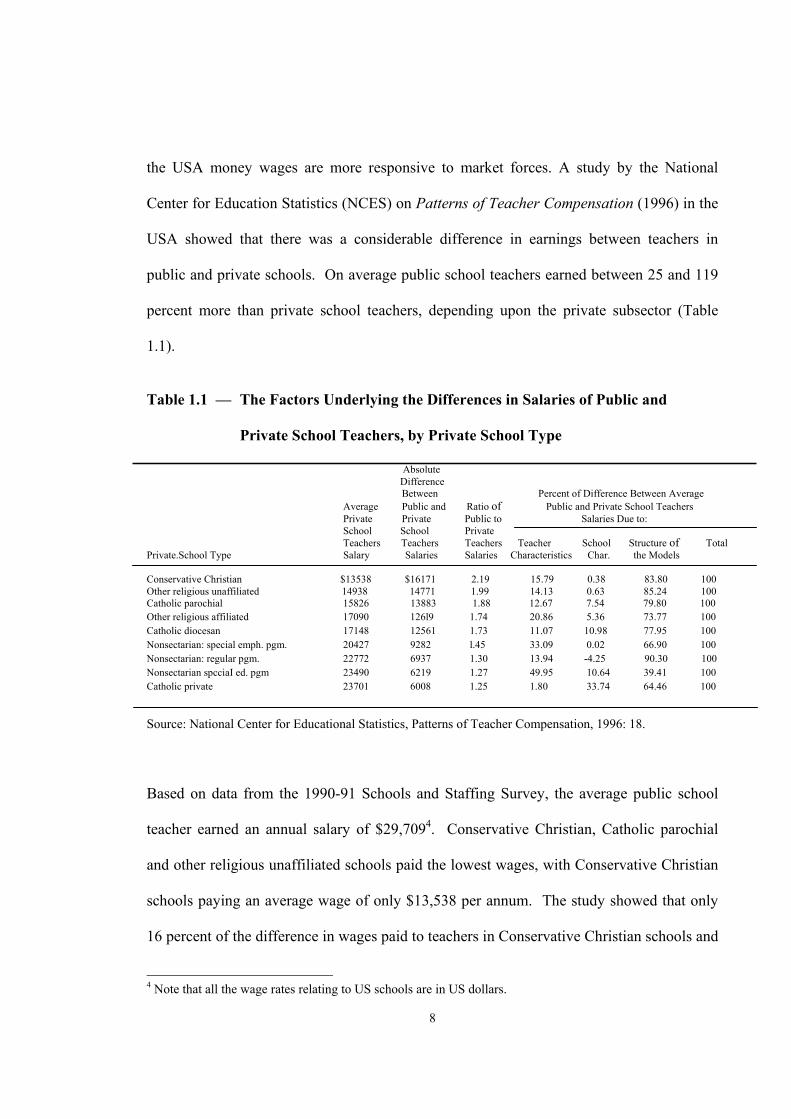
the USA money wages are more responsive to market forces. A study by the National
Center for Education Statistics (NCES) on Patterns of Teacher Compensation (1996) in the
USA showed that there was a considerable difference in earnings between teachers in
public and private schools. On average public school teachers earned between 25 and 119
percent more than private school teachers, depending upon the private subsector (Table
1.1).
Table 1.1 — The Factors Underlying the Differences in Salaries of Public and
Private School Teachers, by Private School Type
Absolute Difference Between Percent of Difference Between Average Average Public and Ratio of Public and Private School Teachers Private Private Public to Salaries Due to: School School Private Teachers Teachers Teachers Teacher School Structure of Total Private.School Type Salary Salaries Salaries Characteristics Char. the Models Conservative Christian $13538 $16171 2.19 15.79 0.38 83.80 100 Other religious unaffiliated 14938 14771 1.99 14.13 0.63 85.24 100 Catholic parochial 15826 13883 1.88 12.67 7.54 79.80 100 Other religious affiliated 17090 126l9 1.74 20.86 5.36 73.77 100 Catholic diocesan 17148 12561 1.73 11.07 10.98 77.95 100 Nonsectarian: special emph. pgm. 20427 9282 l.45 33.09 0.02 66.90 100 Nonsectarian: regular pgm. 22772 6937 1.30 13.94 -4.25 90.30 100 Nonsectarian spcciaI ed. pgm 23490 6219 1.27 49.95 10.64 39.41 100 Catholic private 23701 6008 1.25 1.80 33.74 64.46 100 Source: National Center for Educational Statistics, Patterns of Teacher Compensation, 1996: 18.
Based on data from the 1990-91 Schools and Staffing Survey, the average public school
teacher earned an annual salary of $29,7094. Conservative Christian, Catholic parochial
and other religious unaffiliated schools paid the lowest wages, with Conservative Christian
schools paying an average wage of only $13,538 per annum. The study showed that only
16 percent of the difference in wages paid to teachers in Conservative Christian schools and
4 Note that all the wage rates relating to US schools are in US dollars.

9
public schools could be attributed to differences in teacher characteristics, such as
qualifications and experience. When comparing all school systems, between two and 50
percent of the public-private difference could be accounted for by differences in teacher
characteristics. In the Catholic private schools sector, where teachers earned 20 percent
less than in the public system, only two percent of the overall difference in salaries was
accounted for by differences in teacher characteristics.
Some of this difference involved structural rigidities that prevented the free flow of
teachers from one sector to another. The main difference was the minimum certification
requirements necessary for a teacher to be qualified for public school employment. The
study found that 33 percent of private school teachers had no certification compared to only
three percent of the public school teachers. After allowing for the differences in teacher
and school characteristics, the study found that there was evidence that the private school
system was a more desirable place to work and that teachers were willing to sacrifice wages
to remain in the private sector.
This result was reinforced by a further study of the National Center for Education Statistics
(1997), Job Satisfaction Among American Teachers. It showed that despite the wage
differences, 47.6 percent of private school teachers had a high level of job satisfaction
compared to only 32.0 percent for public school teachers. In addition, only 18.0 percent of
private school teachers had a low level of job satisfaction compared to 33.4 percent for
public school teachers (NCES 1997: 11-13).

10
The NCES study (1996) also examined the importance of experience in determining the
level of wages a teacher receives in the USA. It found that salary tends to increase with
experience for the first 12-15 years due to annual longevity salary increments. The school
systems reward teachers, at least up to a certain stage, for their acquisition and
accumulation of general knowledge of the teaching profession. This resulted in annual
salary increments of just over 2 percent in public schools and 1.6 percent in the private
sector. Another important factor was the number of years teaching in the present school.
This resulted in a reward for specific knowledge of an individual school and school system
and perhaps for loyalty. Years in a particular school added 0.9 percent to a teacher's salary
in the public system and 1.2 percent in the private system per annum.
In a competitive market, salary differentials can be an indicator of relative teacher shortages
in a field or subject area. The shortage would put upward pressure on the wage offered to
teachers in that field. The NCES study (1996) found that teachers who majored in certain
fields of study received above average wage levels (Table 1.2). In the public school sector
people with Education majors in Business, Physical Education5, Vocational Education and
Special Education received above average wages. For non-education majors, Business
received a wage more than 2 percent above the average, along with Mathematics, Music,
Performing Arts, and Social Science. The private sector did display some differences but
overall, Mathematics, Business, and Special Education received higher wages in both
sectors. The NCES study (1996: 38) noted that at that time, education policy makers in the
USA were concerned about increasing the importance of Mathematics and Science teaching
5 It should be noted that the wage advantage noted for Physical Education could at least in part be due to extra payments for coaching sporting teams.

11
and also the need to cater for those students with particular disabilities. It could also be
argued that teachers of Business and Vocational Studies courses could be in demand from
employers in non-school teaching occupations. The results do show that the USA teacher
labour market does respond, at least partially, to changes in demand and supply for
particular fields by altering the wage level.
Table 1.2 - Salaries of Teachers with Selected Undergraduate Majors, as a Percentage
Difference from General Elementary Majors, 1990-91
Variables Public Schools Private Schools
Education Majors Mathematics Education -0.54 2.58 Business Education 1.63 1.22 Physical Education 0.84 3.84 Special Education 4.92 -0.07 Vocational Education 3.02 * Non-education Majors Foreign Languages -0.95 5.60 Business 2.92 8.05 Mathematics 2.37 3.09 Music 4.03 -13.76 Natural Science 0.44 2.21 Performing Arts 2.60 * Social Science 2.17 -1.99 Other Miscellaneous 9.53 * * Not reported because of insufficient sample sizes.
Source: National Center for Educational Statistics, Patterns of Teacher Compensation, 1996: 39.
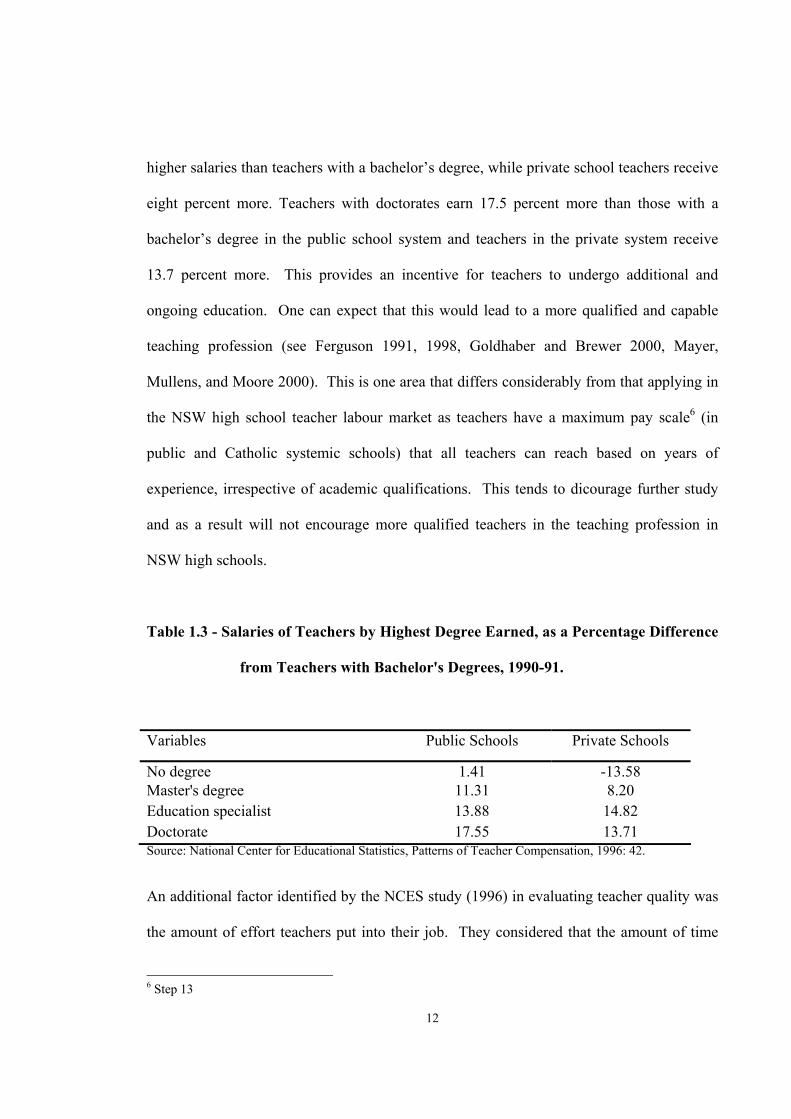
In the US teacher labour market, higher education qualifications are translated into higher
salaries (Table 1.3). Teachers in both the private and public sector receive higher salaries
for higher qualifications. Public school teachers with a master’s degree earn 11 percent
12
higher salaries than teachers with a bachelor’s degree, while private school teachers receive
eight percent more. Teachers with doctorates earn 17.5 percent more than those with a
bachelor’s degree in the public school system and teachers in the private system receive
13.7 percent more. This provides an incentive for teachers to undergo additional and
ongoing education. One can expect that this would lead to a more qualified and capable
teaching profession (see Ferguson 1991, 1998, Goldhaber and Brewer 2000, Mayer,
Mullens, and Moore 2000). This is one area that differs considerably from that applying in
the NSW high school teacher labour market as teachers have a maximum pay scale6 (in
public and Catholic systemic schools) that all teachers can reach based on years of
experience, irrespective of academic qualifications. This tends to dicourage further study
and as a result will not encourage more qualified teachers in the teaching profession in
NSW high schools.
Table 1.3 - Salaries of Teachers by Highest Degree Earned, as a Percentage Difference
from Teachers with Bachelor's Degrees, 1990-91.
Variables Public Schools Private Schools
No degree 1.41 -13.58 Master's degree 11.31 8.20 Education specialist 13.88 14.82 Doctorate 17.55 13.71 Source: National Center for Educational Statistics, Patterns of Teacher Compensation, 1996: 42.
An additional factor identified by the NCES study (1996) in evaluating teacher quality was
the amount of effort teachers put into their job. They considered that the amount of time
6 Step 13
13
teachers put in beyond normal school hours to provide additional services to students, such
as tutoring, coaching sports, or guiding an extra-curricula activity and the amount of
homework7 and the mentoring of less experienced teachers were factors that reflected this
effort. In the US school system this extra effort is rewarded by increased pay. The survey
showed that each additional hour per week is worth about 0.1 percent extra pay in the
public sector and 0.2 percent in the private sector (NCES 1996: 43-4). The survey also
found that the average teacher in both sectors spent more than 10 hours per week involved
in before and after school activities. This effort can be translated to a salary increase of one
percent for public school teachers and two percent for private school teachers. The
flexibility of the wage system to reward for extra effort in the USA does not apply in NSW
public high schools and in most Catholic systemic schools. The private (non-government)
school system (excluding the Catholic systemic schools) in NSW does have the flexibility
to reward teachers for this extra-curricula involvement. An analysis of the effects of
financial rewards for extra-curricula activity in NSW high schools will be made later in this
thesis.
Working conditions in a school also influence teachers' decisions to work there and as a
result the level of pay that is offered to teachers to attract them to that school. Hedonic
wage theory would predict that, all else being equal, teachers salaries would be higher in
schools with more challenging and more difficult work environments. In turn, schools with
relatively positive working conditions would be able to attract teachers with relatively
7 Setting a large amount of homework, in itself, is not necessarily a sign of greater effort nor would it necessarily lead to better student results. It is likely, however, that students who spend more time studying a subject will get better results, all other things being equal. It is also likely that a teacher who takes time to set and mark homework, provided they devote a comparable amount of time, in relation to their peers, preparing lessons, will be devoting more time to teaching and thus making a greater effort.

14
lower salary levels. The NCES study (1996: 47-5) considered the relative perception of
teachers in regard to a number of school characteristics. The study found that teachers in
both public and private schools, characterised by what was perceived as being higher levels
of student violence, lower levels of administrative support and larger class sizes were being
paid higher salaries (Table 1.4)8. Teachers in schools with perceived violent student
behaviour received 0.7 percent higher wages in public schools and 0.3 percent higher
wages in private schools. In schools with a perceived supportive environment, teachers
were prepared to sacrifice 0.9 percent of their wages in public schools and 0.4 percent in
private schools. Teachers with much larger classes were also compensated by 0.5 percent
higher wages in public schools and 1.0 percent higher wages in private schools.
Table 1.4 - Percentage Effect of Teacher Attitudes and Perceptions on Salaries, by
Sector, 1990-91
Percentage difference in salary associated with a one standard deviation increase in the level of the teacher's perceptions of:
Public school teacher
Private school teacher
Violent student behaviour 0.70 0.34
Support within the environment -0.93 -0.44
A 50% increase in class sizes 0.50 1.00
Source: National Center for Educational Statistics, Patterns of Teacher Compensation, 1996: 48, 51.
This apparent trade-off between wages and particular working conditions will be discussed
further in the next chapter, which looks at the relationship between wages and utility, and
the hedonic wage model.
8 It is conjecturable, as to whether teachers are paid more for teaching larger classes or because of the high pay the classes need to be larger to compensate for the cost.

15
1.3 What Factors Determine the Level of Job Satisfaction among American Teachers?
A further study9, by the National Center for Education Statistics (1997), Job Satisfaction
Among American Teachers, looked at how workplace conditions, background
characteristics, and teacher compensation influenced the level of job satisfaction among
teachers. The NCES (1997) examined a number of measures of teacher compensation,
including salary, number of benefits, and supplemental income received both within and
outside of the school. Overall, it found that compensation showed little relation to job
satisfaction among teachers (Table 1.5). Looking at salary, the study found that 27.8
percent of public high school teachers earning less than $25,000 per annum had a high level
of job satisfaction. At the same time 27.1 percent of public high school teachers earning in
excess of $40,000 per annum had a high level of job satisfaction. When considering public
high school teachers earning less than $25,000 per annum, 39.4 percent had a low level of
job satisfaction. Out of the public high school teachers earning more than $40,000 per
annum, 37.3 percent had a low level of job satisfaction. There appears no strong link in the
study between higher salaries for public school teachers generating increased job
satisfaction. These results may not be as straight forward as they appear. From the results
shown in Table 1.3 regarding teacher qualifications and the incremental nature of teacher
salary scales with experience, it would be expected that the teachers earning the lowest
wages would be least qualified and least experienced. Considering this they may be
relatively satisfied with their salaries. Teachers earning over $40,000, generally being
more qualified and experienced, would likewise expect a higher relative salary. As a result
9 Data used in the study came from the 1993-94 Schools and Staffing Survey, produced by the NCES.

16
of this it cannot be assumed that paying a teacher a higher relative salary would not
increase job satisfaction.
There was, however, a greater correlation between salaries and job satisfaction for private
high school teachers. The study found that 44.0 percent of private high school teachers
earning less than $25,000 per annum had a high level of job satisfaction. At the same time
47.3 percent of private high school teachers earning in excess of $40,000 per annum had a
high level of job satisfaction. In turn, considering private high school teachers earning less
than $25,000 per annum, 23.3 percent had a low level of job satisfaction. Out of the private
high school teachers earning more than $40,000 per annum, 20.4 percent had a low level of
job satisfaction.
Table 1.5 - Percentage of High School Teachers across Levels of Satisfaction, by
School Sector and Teacher Compensation Factors, 1993-94
Public PrivateHigh School Teachers High School Teachers
Characteristics Levels of Satisfaction Levels of SatisfactionHigh Medium Low High Medium Low
SalaryLess than $25,000 27.8 32.8 39.4 44.0 32.6 23.3$25,000 - $40,000 26.1 33.0 40.9 44.4 33.2 22.5Over $40,000 27.1 35.7 37.3 47.3 32.4 20.4BenefitsNone 23.2 32.4 44.4 40.9 32.0 27.21-3 types 25.0 33.1 41.9 42.3 32.0 25.74-6 types 28.9 34.5 36.6 46.5 33.2 20.37-8 types * * * 42.3 46.1 11.6Earn additional compensation through schoolYes 29.5 34.4 36.2 44.6 33.2 22.1No 22.5 33.0 44.5 44.2 32.4 23.4
* No teacher received seven or eight types of benefits in the public high school system.
Source: National Center for Educational Statistics, Job Satisfaction Among American Teachers, 1997: 24.

17
When looking at the benefits teachers could receive, such as medical insurance, there was a
positive correlation between the level of job satisfaction and those receiving benefits. In
the public high school system, only 23.2 percent of teachers receiving no benefits were
highly satisfied compared to 28.9 percent receiving 4-6 types of benefits. In addition, 44.4
percent of those with no benefit had a low level of job satisfaction compared to 36.6
percent for those receiving 4-6 benefits. A similar pattern was found in private high
schools. In the private high school system, only 40.9 percent of teachers receiving no
benefits were highly satisfied compared to 46.5 percent receiving 4-6 types of benefits and
27.2 percent of those with no benefit had a low level of job satisfaction compared to only
20.3 percent for those receiving four to six benefits.
The ability to earn additional compensation through the school did increase the level of job
satisfaction, especially in the public school system. In public high school 29.5 percent of
teachers receiving additional compensation through the school had a high level of job
satisfaction compared to 22.5 percent for those who received no compensation. The
difference in the private school system was marginal, with 44.6 percent of the teachers
receiving additional compensation through the school having a high level of job satisfaction
compared to 44.2 percent for those who received no compensation.
Teachers' attitudes and perceptions of the workplace are also important factors influencing
the level of job satisfaction. While there are many factors that all sectors of high school
teachers consider important, there are some factors that differ in importance between the
public and private sectors (Table 1.6).

18
Table 1.6 Percentages of High School Teachers across Levels of Satisfaction, by
School Sector, Selected Attitudes, and Perceptions of Workplace Conditions, 1993-94
Public PrivateHigh School Teachers High School Teachers
Characteristics Levels of Satisfaction Levels of SatisfactionHigh Medium Low High Medium Low
Total 26.7 33.7 39.6 44.4 32.9 22.7
Administration is supportive and encouragingAgree 29.4 35.4 35.3 46.7 34.0 19.4Disagree 18.1 28.5 53.5 34.3 27.9 37.8
The level of student behaviour in the school interferes with teachingAgree 19.6 30.8 49.6 30.0 30.3 39.7Disagree 32.8 36.3 31 48.1 33.5 18.4
Teachers participate in making important school decisionsAgree 32.4 36.2 31.5 35.6 32.9 31.5Disagree 21.1 31.4 47.5 35.6 32.9 31.5
Parents support teachers' workAgree 33.4 36.2 30.4 47.8 33.7 18.5Disagree 21.7 31.9 46.4 32.8 30.0 37.2
Routine duties and paperwork interfere with teachingAgree 22.9 33.3 43.8 38.0 32.3 29.7Disagree 36.5 34.8 28.7 50.4 33.4 16.2
Staff members are recognised for a job well doneAgree 31.6 36.2 32.2 47.9 33.9 18.1Disagree 18.9 29.8 51.2 34.7 29.9 35.3
Principals frequently discuss instructional practices with teachersAgree 34.0 34.6 31.4 53.9 29.5 16.6Disagree 22.7 33.2 44.1 37.0 35.2 26.9
Necessary materials are availableAgree 28.9 34.9 36.2 44.7 33.5 21.8Disagree 20.7 30.6 48.7 42.6 29.1 28.3
There is a great deal of cooperative effort among the staffAgree 28.6 35.2 36.2 46.3 33.8 19.8Disagree 21.7 30.1 48.2 32.1 26.8 41.1
Student absenteeism is a problemAgree 24.3 33.3 42.3 33.6 33.7 32.8Disagree 32.2 34.6 33.1 48.2 32.6 19.3

19
Table 1.6 Percentage of High School Teachers across Levels of Satisfaction, by
School Sector, Selected Attitudes, and Perceptions of Workplace Conditions, 1993-94
(continued)
Public PrivateHigh School Teachers High School Teachers
Characteristics Levels of Satisfaction Levels of SatisfactionHigh Medium Low High Medium Low
Total 26.7 33.7 39.6 44.4 32.9 22.7
Student apathy is a problemAgree 23.2 33.1 43.7 33.7 32.3 34.0Disagree 38.3 36.0 25.7 51.4 33.2 15.4
Has a student from the school ever physically attacked you?Yes 21.6 29 49.4 62.0 19.3 18.7No 27.1 34.1 38.7 44.0 33.2 22.8
Teachers have complete control in the classroom*32.4 34.8 32.8 46.3 33.9 19.8
* Teachers were asked a series of questions about how much control they had in the classroom. They answered each question on a "5" point scale, with "0" meaning no control and "5" meaning complete control. The numbers reported here are the percentage of teachers whose average response to the questions was above "4". Source: National Center for Educational Statistics, Job Satisfaction Among American Teachers, 1997: 26-31. The NCES found that the main factors that influenced the level of job satisfaction for high
school teachers in both sectors were:
• the level of support and encouragement from the administration;
• the level and effect of student misbehaviour in the school;
• parents' support of teachers' work;
• the level of interference in teaching of routine duties and paperwork;
• the recognition of staff for a job well done; and
• the principal frequently discussing instructional practices with teachers.

20
One factor that was not an important consideration was the threat of injury or physical
attack from a student. This could be related to the overall low incidence of threat of injury
and violence towards all teachers, which was noted in the study (NCES 1997: 25).
In public high schools, 29.4 percent of teachers who agree that the administration is
supportive have high levels of job satisfaction (Table 1.6). Only 18.1 percent of teachers
who disagree have high levels of job satisfaction. In turn, 53.5 percent of public high
school teachers, who do not feel that they are supported, have a low level of job
satisfaction, while 35.5 percent of those, who feel that they are supported, have a low level
of job satisfaction. The results for teachers in private high schools are similar, with 46.7
percent of teachers who agree that the administration is supportive having high levels of job
satisfaction and 34.3 percent of teachers who disagree having high levels of job
satisfaction. In addition, 37.8 percent of private high school teachers, who do not feel that
they are supported, have a low level of job satisfaction, while only 19.4 percent of those,
who feel that they are supported, have a low level of job satisfaction.
Teachers who think that student misbehaviour interferes with teaching have a lower level of
job satisfaction than those who do not think that it is a problem. In public high schools,
only 19.6 percent of teachers who agree that the level of student behaviour interferes with
teaching have high levels of job satisfaction. This compares to 32.8 percent of teachers,
who do not feel that student behaviour is a problem, having high levels of job satisfaction.
In turn, 31.0 percent of public high school teachers, who do not feel that there is a problem,
have a low level of job satisfaction, while 49.6 percent of those, who feel that student

21
behaviour is a problem, have a low level of job satisfaction. The results for teachers in
private high schools are similar, with 48.1 percent of teachers who disagree that the level of
student behaviour interferes with teaching having high levels of job satisfaction. This
compares to 30.0 percent of teachers, who consider that there is a problem with student
behaviour in their school, having a high level of job satisfaction. In addition, only 18.4
percent of private high school teachers, who do not feel that student behaviour is a problem,
have a low level of job satisfaction, while 39.7 percent of those, who feel that it is a
problem, have a low level of job satisfaction.
Parents' supporting the work of the teachers was another important factor promoting the
level of job satisfaction among teachers in both public and private high schools. In public
high schools, 33.4 percent of teachers who agree that parents are supportive have high
levels of job satisfaction. Only 21.7 percent of teachers who disagree have high levels of
job satisfaction. In turn, 46.4 percent of public high school teachers, who do not feel that
they are supported, have a low level of job satisfaction, while 30.4 percent of those, who
feel that they are supported, have a low level of job satisfaction. The results for teachers in
private high schools are similar, with 47.8 percent of teachers who agree that parents are
supportive having high levels of job satisfaction, while only 32.8 percent of teachers who
disagree have high levels of job satisfaction. In addition, 37.2 percent of private high
school teachers, who do not feel that they are supported, have a low level of job
satisfaction, while only 18.5 percent of those, who feel that they are supported, have a low
level of job satisfaction.
22
Teachers were generally frustrated by the way routine duties and paperwork interfered with
their teaching duties. This factor reduced job satisfaction in areas where it was perceived to
be a problem. In public high schools, only 22.9 percent of teachers, who agree that routine
duties and paperwork interfere with teaching, have high levels of job satisfaction. This
compares to 36.5 percent of teachers, who do not feel that routine duties and paperwork
interfere with teaching, having high levels of job satisfaction. In turn, 28.7 percent of
public high school teachers, who do not feel that this is a problem, have a low level of job
satisfaction, while 43.8 percent of those, who feel that routine duties and paperwork
interfere with teaching, have a low level of job satisfaction. The results for teachers in
private high schools follow a similar pattern, with 50.4 percent of teachers, who disagree
that routine duties and paperwork interfere with teaching, having high levels of job
satisfaction. This compares to 38.0 percent of teachers, who consider that there is a
problem with the level of routine duties and paperwork, having a high level of job
satisfaction. In addition, only 16.2 percent of private high school teachers, who do not feel
that routine duties and paperwork interfere with teaching, have a low level of job
satisfaction, while 29.7 percent of those, who feel that it is a problem, have a low level of
job satisfaction.
In the category of administrative support and leadership the NCES study (1997) found that
one item was strongly associated with the level of teacher satisfaction: 'Staff members are
recognised for a job well done'. Public high school teachers were especially sensitive to
this item. In public high schools, 31.6 percent of teachers, who agree that they are
recognised for a job well done, have high levels of job satisfaction. Only 18.9 percent of

23
teachers who disagree have high levels of job satisfaction. Those who did not believe that
they were recognised for a job well done were clustered in the low level of job satisfaction
category. Fifty one point two percent of public high school teachers, who do not feel that
they are recognised for a job well done, had a low level of job satisfaction, while 32.2
percent of those, who feel that they are recognised for a job well done, had a low level of
job satisfaction. The results for teachers in private high schools are similar but the issue
does not tend to be as important as for public high school teachers, with 47.9 percent of
teachers, who agree that they are recognised for a job well done, having high levels of job
satisfaction, while 34.7 percent of teachers who disagree still have high levels of job
satisfaction. For private high school teachers with a low level of job satisfaction, 35.3
percent do not feel that they are recognised for a job well done, while only 18.1 percent feel
that they are recognised for a job well done.
The final factor that was important for both public and private high school teachers' levels
of job satisfaction was having an environment where the principal frequently discussed
instructional practices with teachers. In public high schools, 34.0 percent of teachers who
agree, that the principal frequently discusses instructional practices with them, have high
levels of job satisfaction. Only 22.7 percent of teachers who disagree have high levels of
job satisfaction. In turn, 44.1 percent of public high school teachers, who do not feel that
the principal frequently discusses instructional practices with them, have a low level of job
satisfaction, while 31.4 percent of those, who feel that the principal frequently discusses
instructional practices with them, have a low level of job satisfaction. The results for
teachers in private high schools are similar, with 53.9 percent of teachers who consider that

24
the principal frequently discusses instructional practices with them having high levels of
job satisfaction, while only 37.9 percent of teachers who disagree have high levels of job
satisfaction. In addition, 26.9 percent of private high school teachers, who do not feel that
the principal frequently discusses instructional practices with them, have a low level of job
satisfaction, while only 16.6 percent of those who disagree have a low level of job
satisfaction.
The main areas where there were differences between the responses of public and private
high school teachers in regard to what influences their levels of job satisfaction (Table 1.6)
were:
• teachers' participation in making important school decisions;
• the level of cooperative effort among staff;
• the perception of student absenteeism being a problem;
• the effects of physical violence from students; and
• the level of control that teachers have in the classroom.
While teachers' participation in making important school decisions was of considerable
importance to public school teachers, it had no effect on the job satisfaction of private
school teachers. In public high schools, 32.4 percent of teachers, who agree that teachers
participate in making important school decisions, have high levels of job satisfaction. Only
21.1 percent of teachers, who disagree, have high levels of job satisfaction. In turn, 47.5
percent of public high school teachers, who do not feel that they participate in decision-
making, have a low level of job satisfaction, while 31.5 percent of those, who feel that they
25
do participate, have a low level of job satisfaction. The results for teachers in private high
schools are quite different. The same proportion of teachers, with high levels of job
satisfaction, thinks it is important, as those who do not think it is important, 35.6 percent.
In addition, 31.5 percent of private high school teachers, who do not feel that they
participate in important decision making, have a low level of job satisfaction. The same
percentage of teachers, who feel that they do participate, have a low level of job
satisfaction. It appears private high school teachers are relatively unconcerned whether or
not they are involved in making important school decisions.
The level of cooperative effort among staff was another factor that had a different impact
on teacher job satisfaction in the different school sectors. Having a great deal of
cooperative effort among staff contributed much more to job satisfaction for private high
school teachers compared to public high school teachers. Forty six point three percent of
teachers in private high schools, who thought that there was a great deal of cooperative
effort among the staff, have high levels of job satisfaction, while only 32.1 percent of
teachers, who did not believe there was a great deal of cooperative effort, have high levels
of job satisfaction. In addition, 41.1 percent of private high school teachers, who do not
feel that there is a cooperative effort among staff, have a low level of job satisfaction, while
only 19.8 percent of those, who feel that they are supported, have a low level of job
satisfaction. In public high schools, 28.6 percent of teachers, who agree that there is a great
deal of cooperative effort among the staff, have high levels of job satisfaction, whereas 21.7
percent of teachers, who disagree, still have high levels of job satisfaction. Even though
48.2 percent of public high school teachers, who do not feel that there is a great deal of

26
cooperative effort, have a low level of job satisfaction, there are still 36.2 percent of those,
who feel that they are supported, with a low level of job satisfaction.
The level of student absenteeism was also seen to be a factor that worked to reduce job
satisfaction for teachers, who perceived it to be a problem in their school. The perception
of student absenteeism being a problem, also, had a bigger impact on the level of job
satisfaction in private high schools than in public high schools. In public high schools, 24.3
percent of teachers, who agree that student absenteeism is a problem, still have high levels
of job satisfaction. This compares to 32.2 percent of teachers, who do not feel that student
absenteeism is a problem, having high levels of job satisfaction. In turn, 33.1 percent of
public high school teachers, who do not feel that this is a problem, have a low level of job
satisfaction, while 42.3 percent of those, who feel that student absenteeism is a problem,
have a low level of job satisfaction. The results for teachers in private high schools show a
wider distribution of effects on teacher satisfaction, with 48.1 percent of teachers, who
disagree that student absenteeism is a problem, having high levels of job satisfaction. This
compares to 33.6 percent of teachers, who consider that there is a problem with the level of
student absenteeism, having a high level of job satisfaction. In addition, only 19.3 percent
of private high school teachers, who do not feel that student absenteeism is a problem, have
a low level of job satisfaction, while 32.8 percent of those, who feel that it is a problem,
have a low level of job satisfaction.
The effects of physical violence from students would generally be considered as something
that would have a major impact on the level of job satisfaction. While this might be true at

27
an individual level, it is not seen as being a major issue overall in the level of job
satisfaction. There is quite a distinct difference between the responses by teachers in public
and private high schools in regard to this issue. In public high schools, 21.6 percent of
teachers, who concede that a student from the school has physically attacked them, still
have high levels of job satisfaction. This compares to 27.1 percent of teachers, who have
not had a student from the school physically attack them, having high levels of job
satisfaction. In turn, 49.4 percent of public high school teachers, who have been attacked,
have a low level of job satisfaction, while 38.7 percent of those, who report that a student
from the school has not physically attacked them, have a low level of job satisfaction. The
results for teachers in private high schools show an unexpected response on the effects of
student violence on teacher satisfaction, with 62 percent of teachers, who reported that a
student from the school has physically attacked them, having high levels of job satisfaction.
This compares to 44 percent of teachers, who have not been attacked, having a high level of
job satisfaction. In addition, only 18.7 percent of private high school teachers, who have
been attacked by a student from the school, have a low level of job satisfaction, while 22.8
percent of those, who have not been attacked, have a low level of job satisfaction. The
differences in the responses could be due to the level of students who have attacked
teachers in each system. The NCES study (Table1.7) shows that the rate of student attacks
on teachers is much higher in public high schools than private high schools. Eight percent
of public high school teachers have been attacked by a student from their school, while only
2.5 percent of teachers in private high schools have been attacked. In both cases, a higher
proportion of teachers with low levels of job satisfaction has been attacked. In the public
system, 5.5 percent of the most satisfied teachers have been attacked compared to 12.3

28
percent of the least satisfied teachers and in the private system, 3.5 percent of the most
satisfied teachers have been attacked compared to 4.4 percent of the least satisfied teachers.
It appears that as the level of student violence towards teachers increases so does the
adverse effect it has on the level of job satisfaction.
The final factor, that had different levels of effects on teacher satisfaction between school
sectors, was the level of control that teachers have in the classroom. A greater percentage
of private high school teachers felt that they had complete control in the classroom, 74.5
percent, compared to 55.3 percent in public high schools (Table1.7). In public high
schools, 32.4 percent of teachers, who felt that they had complete control in the classroom,
had high levels of job satisfaction, however 32.8 percent of teachers, who felt that they had
complete control in the classroom, had a low level of job satisfaction. The results for
teachers in private high schools show that it is a more important influence on teacher
satisfaction than for public high school teachers, with 46.3 percent of private high school
teachers, who felt that they had complete control in the classroom, having high levels of job
satisfaction. Only 19.8 percent of teachers, who had complete control in the classroom, had
a low level of job satisfaction.
One aspect of workplace conditions had very little effect on the job satisfaction of the high
school teachers in either sector in the survey. That aspect was whether necessary materials
were available. While it may be considered that the issue of whether necessary materials
were available to teachers would affect the level of job satisfaction, it was not an important
issue as 72.8 percent of teachers felt that necessary materials were available in public

29
schools and 85.8 percent in private schools (Table 1.7). There was still a small effect on
availability of materials increasing teacher job satisfaction. In public high schools, 28.9
percent of teachers, who agree that the necessary materials are available, have high levels
of job satisfaction. At the same time, 20.7 percent of teachers, who disagree, still have high
levels of job satisfaction. In addition, 48.7 percent of public high school teachers, who do
not feel that the necessary materials were available, had a low level of job satisfaction,
while 36.2 percent of those, who feel that the necessary materials were available, had a low
level of job satisfaction. The results for teachers in private high schools are similar but the
issue tends to have even less importance than for public high school teachers, with 44.7
percent of teachers, who agree that the necessary materials are available, having high levels
of job satisfaction, while 44.2 percent of teachers who disagree still have high levels of job
satisfaction. For private high school teachers with a low level of job satisfaction, 28.3
percent do not feel that the necessary materials are available, while 21.8 percent feel that
the necessary materials are available.
In examining why teachers in private school sector are willing to accept lower wages than
in the public sector (Table 1.1), it is important to consider the overall level of teacher
satisfaction with the working environment. Table 1.7 shows that teachers in private schools
consider that they have better conditions in every factor surveyed. This in turn helps to
explain their overall higher level of teacher satisfaction. The main differences in
characteristics between the two sectors relate to areas of student behaviour and parental
support. The percentage of teachers in state high schools, who consider that the level of
student misbehaviour interferes with teaching, is more than double that in the private high

30
schools, 46.1 percent compared to 20.1 percent. This is reinforced by much higher
concerns by public high school teachers over the problems of student apathy, 76.9 percent
compared to 39.3 percent, and absenteeism, 70.2 percent compared to 25.0 percent. The
threat of injury and the level of student physical attacks on teachers are also much higher in
the public school sector. Teachers in public high schools also believe that they have much
lower levels of parental support, 42.6 percent, compared to those in private schools, 77.5
percent. The view of hedonic wage theory would be that these factors would act to increase
the need for financial compensation in the public school sector in relation to the private
school sector. The results of the NCES studies in 1996 and 1997 tend to support this view.
The 1997 NCES study also looked at the relative importance of compensation, school, and
teacher background and workplace conditions in the overall satisfaction of teachers10 as a
whole (47-51). It found that student behaviour and school atmosphere were the most
important factors in determining the level of teacher satisfaction, at 12 percent.
Administrative support and leadership and teacher control over working conditions were
equally next in importance, at nine percent each, followed by school and teacher
background characteristics, at five percent. Teacher compensation only explained two
percent of the variation in teacher satisfaction.
10 This included elementary and high school teachers in both public and private schools.

31
Table 1.7 - Percentage of High School Teachers who Agree with the Following
Statements, by School Sector, 1993-94
Public PrivateCharacteristics Sector Sector
Administration is supportive and encouraging 76.3 82.0
The level of student behaviour in the school interferes with teaching 46.1 20.1
Teachers participate in making important school decisions 49.6 63.4
Parents support teachers' work 42.6 77.5
Routine duties and paperwork interfere with teaching 72.1 48.1
Staff members are recognised for a job well done 61.3 73.6
Principals frequently discuss instructional practices with teachers 35.4 40.7
Necessary materials are available 72.8 85.8
There is a great deal of cooperative effort among the staff 71.6 86.6
Student absenteeism is a problem 70.2 25.0
Student apathy is a problem 76.9 39.3
Has a student from the school ever physically attacked you? 8.0 2.5
A student from the school has ever threatened to injure you 32.2 10.7
Teachers have complete control in the classroom* 55.3 74.5
* Teachers were asked a series of questions about how much control they had in the classroom. They answered each question on a "5" point scale, with "0" meaning no control and "5" meaning complete control. The numbers reported here are the percentage of teachers whose average response to the questions was above "4". Source: National Center for Educational Statistics, Job Satisfaction Among American Teachers, 1997: 41-42.
32
1.4 Conclusion
The teacher labour market is a distinctive market. It has a variety of factors that determine
an employer's willingness to hire a particular teacher and also the willingness of the teacher
to accept employment in that particular school. These factors may vary between individual
employers and between individual employees. One reason that an understanding of this
relationship is important, as pointed out by the US National Center for Education Statistics,
is that "a high quality teaching staff is the cornerstone of a successful education
system...(and that)…attracting and retaining high quality teachers is, thus, a primary
necessity for education (1997:1)".
The studies (NCES 1996, 1997) in the USA, where there exists a relatively flexible labour
market for teachers, are important in determining the factors that are important in achieving
a qualified and satisfied teaching service. The greater satisfaction is arguably a source of
greater commitment and higher teacher retention rates. The New South Wales education
system does not have the same level of flexibility. It is possible that education authorities
in New South Wales, and indeed all of Australia, can learn from the findings that can be
made from the US studies. First, in the flexible market, employee compensation reflects, at
least in part, the forces of demand and supply. Employees offer a variety of personal
characteristics to employers, while the employers offer differing working places and
conditions of employment. Teacher salary scales in the public sector reflect the results of
collective bargaining agreements. The teacher scales in turn are based on the length of time
that teachers have spent in the school district and their academic qualifications. The
teachers, on the other hand, consider the characteristics of the school, their job assignment,

33
and the rates of pay being offered in determining their willingness to teach in a school,
district, or system. In the private school system in the USA, there is relatively little
collective bargaining involved in determining salaries. While there is generally not a
formal salary scale tied to length of service and qualifications, these are generally important
in determining the wages paid to teachers in the private sector and the wages that teachers
receive reflect the importance of these two characteristics.
The effect on wages of particular teacher characteristics, such as qualifications and
experience, reflect a combination of the perceived value of the attribute to the employer and
the availability of that attribute in the market. In teaching areas where there were perceived
shortages or competition from the private non-school sector, there tended to be higher
wages, as theory would suggest in a flexible labour market.
The second important result that came from the studies was that teacher compensation was
not the most important factor in determining where teachers were employed. Teachers in
public schools earned up to 119 percent more than those in private schools. When
differences in teacher characteristics were factored in this only explained between 2 percent
and 50 percent of the difference in compensation. Teachers in private schools were willing
to accept lower wages because of the perceived better conditions in terms of their overall
level of job satisfaction. The 1997 NCES study found that student behaviour and school
atmosphere, administrative support and leadership, and teacher control over working
conditions were the most important factors in determining teacher job satisfaction in both
private and public high schools. These characteristics were all more prominent in the

34
private school sector rather than the public school sector and acted as a trade-off for the
higher wages on offer in the public sector. Private high school teachers were willing to
accept much lower wages in return for these characteristics. In turn public high school
teachers received higher wage rates to teach in schools that were perceived as having less
of these favourable characteristics. Overall there was little relationship between teacher
compensation and the level of job satisfaction of teachers. It can be concluded that what is
more important in attracting and keeping good quality teachers is not the level of
compensation but rather creating a positive working environment, where teachers feel
important and are empowered to carry out the role of teaching and educating.

35
Chapter 2. Labour Market Theories
Traditional labour market theories (Kaufman 2000, Norris 2000, McConnell 2003) consider
that there are three broad forces operating to determine the price and allocation of labour.
These three forces are market forces, institutional forces, and sociological forces.
The market forces, that influence the determination of the price and allocation of labour, are
the demand and supply of labour. While there are non-economic factors that influence the
pricing and distribution of labour, most economists would consider that the interaction of
the demand and supply of labour is the most important determinant of labour market
outcomes.
2.1 The Market for Labour
The purchasers of labour are business firms and non-profit organizations, such as
governments, which compete for workers with various skills, experience, and
qualifications. The demand for labour is basically derived from the value of the goods and
services it produces. The standard model of labour demand in economics is the
neoclassical marginal productivity theory of demand (for an introduction see Kaufman
2000, Norris 2000, McConnell 1999). The greater the marginal productivity of a particular
type of labour, the higher the demand for that labour, and as a result the higher the relative
wage rate. However, as Zabalza (1979) points out, there are several reasons why such an
analysis is inadequate. First, the marginal productivity theory of wages would have to be
applied differently to the teacher labour market as it is difficult, if not almost impossible, to

36
measure the productivity of teachers. Second, the dominance of the public sector makes the
education department a near monopsonistic buyer of teachers’ labour. In such an
environment the quantity of labour demanded at a particular wage rate is strongly
influenced by the policy makers in the education department and the government. Zabalza
(1979: 17) states that “the allocation of resources will have already been made on the basis
of political considerations, and the number of teachers demanded will then constitute a
datum of the problem rather than something subject to economic analysis.” As a result the
number of teachers that will be demanded will really be determined by the amount of
money that education authorities are willing to spend on employing teachers at the existing
teacher wage rates. In addition policy makers determine desired pupil-teacher ratios and
staffing formulas for the schools. As a result, the three independent variables in the analysis
of demand for teachers (Zabalza 1979) become:
• the number of pupils to be educated and the desired pupil teacher ratio,
• the amount of money education authorities are willing to spend on teacher salaries,
and
• the average level of salaries per teacher.
Figure 2.111 demonstrates such a market. Average wages (W) are on the vertical axis and
the number of teachers (S) on the horizontal axis. SS is a linear representation of the supply
function. The vertical line D shows the demand for teachers based on a given desired pupil-
teacher ratio. The curve BB represents the demand relationship given a particular financial
budget constraint. Each of the BB curves in Figure 2.1 represents different ways of
spending the budget. 11 Figure 2.1 is based on Zabalza 1979 and Sloan 1990.

37
B1
B0
B0 B1
S
D
B0
B1
W1 W2 W3
Figure 2.1: Shortages in the labour market for teachers
S0 S1 S2
If the budget constraint is B0B0 and the average wage is W3, the quantity of teachers willing
to work will be S0. This quantity will not use up all of the budget and will create a teacher
shortage as quantity demanded is S2 and the quantity supplied at wage, W3, is only S0. If the
wage rate is increased to W2, and the allocated budget is exhausted, there will be an
increase in the quantity supplied of teachers to S1 but a teacher shortage would still exist,
the gap S1S2. Only by increasing the budget constraint to B1B1 and increasing the wage rate
to W1 will the quantity demanded and quantity supplied of teachers be in equilibrium.
In this market situation it is also possible that wages will be set in excess of market
equilibrium. In Figure 2.2, the wage rate is fixed at W4. At this wage rate, S4 qualified
people would like to work as teachers. Education authorities would like to employ S3
Average Wage Rate
Quantity of Teachers

38
B0
B0
S
D
B0
W4
Quantity of Teachers
teachers to meet the desired pupil-teacher ratio. However, given the budget constraint B0B0,
only S1 teachers would be employed leading to a gap of S1S4 unemployed teachers. If
wages were flexible and given the budget constraint, S2 teachers would be employed but
now there would actually be a shortage of teachers, the gap S2S3. The implications of this
model will be discussed in terms of the impact this has on both the quantity and quality of
teachers in the NSW teacher labour market in Chapter 5.
Figure 2.2: Surplus in the labour market for teachers
S1 S2 S3 S4
.
Average Wage Rate

39
According to neo-classical theory, the supply of labour is determined by the number of
people willing to work in a particular field of employment and by the number of hours each
person will supply at a particular wage rate. One of the assumptions of the neo-classical
labour theory is that individuals have the freedom to choose their hours to be worked per
week. This assumption is unrealistic in the teacher labour market. A full-time high school
teacher has a set minimum number of hours that he or she must work. This is generally
measured as 20 hours of face to face teaching plus other duties that would require a teacher
to be in a school a minimum of between 35-40 hours a week depending on the school12. In
addition any extra time put in is generally unpaid in NSW state high schools and most
Catholic systemic schools. Some independent schools do pay allowances for extra-
curricula activities, such as sports coaching, and dramatic or musical performances13. This
introduces another area where traditional wage theory falls down. The theory would
suggest that if the teacher were only being paid for a 35-hour week, there would be no
incentive to work longer hours. While this is probably the case for some teachers, many
teachers work in excess of the 35 hours a week for no additional payment. Other teachers
will still receive the same wage but do the minimum amount of work necessary to keep
their job, which will be somewhere between the minimum of 20 hours and the normal
expectation of between 30 and 35 hours. This can partly be explained through the
indifference curves of many salaried employees in terms of the satisfaction that they
achieve in their jobs. If workers enjoy their jobs, then work is no longer a source of
12 The average hours of paid work for school teachers in Australia was 36 hours per week, in May 2000 (ABS, Employee Earnings and Hours, Australia Cat. No 6306.0). 13 In May 2000 only 1.8 percent of education employees in Australia were paid overtime, by far the lowest of any industrial sector. The proportion of full-time adult non-managerial employees paid overtime was 23.0 percent in Australia overall (ABS, Employee Earnings and Hours, Australia Cat. No 6306.0).

40
disutility (at least to some degree) that a worker must be offered extra money to perform,
but is rather an activity willingly taken on that gives the worker satisfaction. This view is
supported by work done by Mabry (1969) and Lutz and Lax (1979) on salaried and
professional workers and by evidence on the teacher labour market in the United States in
Chapter 1 of this thesis and from the National Center for Education Statistics (1997), Job
Satisfaction Among American Teachers. Consider Figure 2.3, if the individual is paid a
salary, the budget constraint changes from a linear relationship to become ABC. The
salary, Ys, is paid if the individual works for a minimum of 168 - L1 hours of work. In
other words, they are limited to L1 hours of leisure. Any amount to the right of L1 is not
sufficient for the employer and the person will earn zero income. The person can work any
amount to the left of L1 but it would mean a loss of leisure but no increase in income.
Figure 2.3: Hours of work for a salaried worker when work and leisure are perfect
substitutes
B
I N C O M E
LEISURE (Hours per Week) L2 L3 L1
C
Ys A
I2 I1
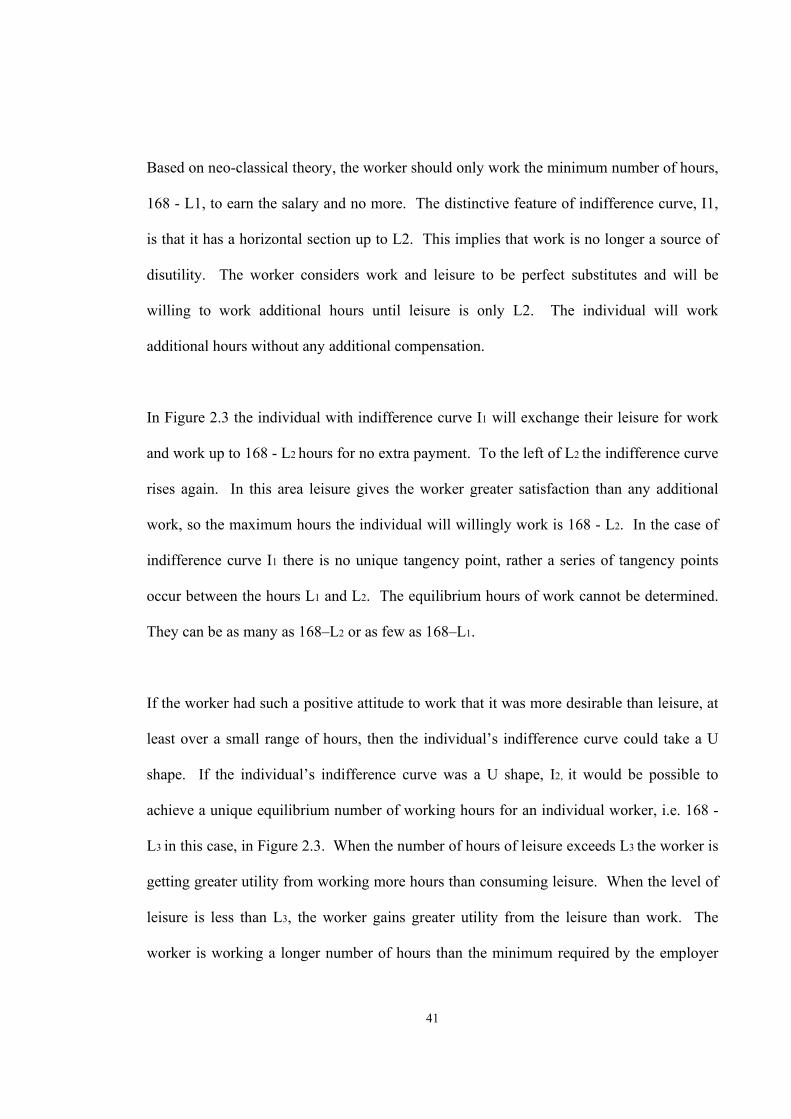
41
Based on neo-classical theory, the worker should only work the minimum number of hours,
168 - L1, to earn the salary and no more. The distinctive feature of indifference curve, I1,
is that it has a horizontal section up to L2. This implies that work is no longer a source of
disutility. The worker considers work and leisure to be perfect substitutes and will be
willing to work additional hours until leisure is only L2. The individual will work
additional hours without any additional compensation.
In Figure 2.3 the individual with indifference curve I1 will exchange their leisure for work
and work up to 168 - L2 hours for no extra payment. To the left of L2 the indifference curve
rises again. In this area leisure gives the worker greater satisfaction than any additional
work, so the maximum hours the individual will willingly work is 168 - L2. In the case of
indifference curve I1 there is no unique tangency point, rather a series of tangency points
occur between the hours L1 and L2. The equilibrium hours of work cannot be determined.
They can be as many as 168–L2 or as few as 168–L1.
If the worker had such a positive attitude to work that it was more desirable than leisure, at
least over a small range of hours, then the individual’s indifference curve could take a U
shape. If the individual’s indifference curve was a U shape, I2, it would be possible to
achieve a unique equilibrium number of working hours for an individual worker, i.e. 168 -
L3 in this case, in Figure 2.3. When the number of hours of leisure exceeds L3 the worker is
getting greater utility from working more hours than consuming leisure. When the level of
leisure is less than L3, the worker gains greater utility from the leisure than work. The
worker is working a longer number of hours than the minimum required by the employer

42
(168–L1). This would also imply that if the worker’s satisfaction with their job declined,
that the worker would work fewer hours above the minimum level and the time spent on
leisure would increase. Alternatively increased job satisfaction would lead to increased
levels of unpaid work. This is a significant finding as it demonstrates that if teacher job
satisfaction increases then at least some teachers will be willing to work longer unpaid
hours. This is supported by the empirical evidence on the teacher labour market in the
United States in Chapter 1 of this thesis and from the National Center for Education
Statistics (1997), Job Satisfaction Among American Teachers. It could also be considered
that increased job satisfaction could be traded off at least to some degree as an alternative to
a wage rise. Alternatively it could be seen that a loss of job satisfaction would require
larger wage rises to achieve the same level of worker commitment.
A second explanation, for salaried professionals working more than the minimum hours
required for their salary, rests on a more economic argument that distinguishes between the
reward structures of wage and salaried employees. It is not greater job satisfaction that
leads to more unpaid work but rather financial rewards they hope to receive in the future in
terms of future pay rises and promotion. This is a possible explanation for many salaried
workers but perhaps is limited in the teaching profession. Teachers in NSW high schools
have automatic pay increases based on years of service up to step 13. After this level,
further increases are allowances for extra administration as year or subject coordinators,
deputy principals or as principals. The numbers of these positions in each school are
limited and most teachers do not go past the final incremental stage of payment.

43
A third explanation relates to the lack of job security. Downsizing of business firms
especially since the beginning of the 1990s has led to a loss of full-time employment and a
growing casualisation of the workforce in Australia. Littler et al. (1997) point out that the
job losses due to downsizing were mainly in the area of white-collar and managerial
positions, unlike previous periods when it tended to be blue-collar workers. Many salaried
employees will try and make a good impression in the hope that they will not be retrenched.
They will work longer hours for no pay in order to safeguard future income earnings. In
Australia in 1980, 14.7 percent of employees worked more than 49 hours a week. By 1999
this figure had increased to 20.6 percent of employees (ABS, The Labour Force). Again
this tends not to be a valid argument when looking at the teaching profession. Job security
in teaching is quite high once a teacher has passed an initial probationary period usually of
12 months. Therefore, it is unlikely that teachers do extra hours to safeguard their job
security. Teachers who work the minimum hours are still quite secure in their employment
especially in state high schools, where there is little scope for retrenching a teacher from
their employment. A teacher may be moved to another school to meet changes in staffing
but the possibility of retrenchment is very low. Therefore it seems most likely that teachers
in public schools who decide to work longer hours than the minimum do so based on job
satisfaction rather than any of the other reasons put forward.
In independent schools there is a greater use of fixed term contracts, so in this area there is
more incentive to work longer hours to preserve job security but wages are also generally
higher, so any additional hours of work may be expected in order to safeguard their
employment at a higher wage level. In some independent schools, as distinct from Catholic

44
systemic schools, where wages are closely linked to the public school teachers’ wages, the
wage level is higher than the equilibrium level. This can be linked to the efficiency wage
model. The increase in the wage is designed to increase worker efficiency and labour
demand (McConnell 2003). Consider Figure 2.4, independent schools have a higher
demand D2 and are willing to increase the wage from W1 to W2. The schools will still
employ Q1 teachers but at the wage rate W2 the available supply would be Q2, as a result
there is a level of permanent unemployment, the gap Q1Q2. The effect of the higher wage
and the pool of unemployed workers is two fold. First, the possibility of losing a high paid
job and becoming part of the unemployed group works as a mechanism to encourage full
effort from employees. Second, it acts as a disincentive to quit this job. The opportunity
cost of leaving a job in an independent school and seeking employment in a Catholic
systemic school or a public school is greater, as the wage they would receive in the
alternative job is lower at W1.
Figure 2.4: The Efficiency Wage Model
Wage (W) D1 D2 S
Q1 Q2 Quantity of Labour
W2
W1
45
The empirical evidence of teachers in the USA demonstrated that there is a trade-off
between wages and job satisfaction. Higher job satisfaction of teachers in private schools
in the USA (Table 1.6) compensated them sufficiently to be willing to receive lower
payments compared to public school teachers (Table 1.1).
An important consideration in determining the market for teachers in New South Wales
high schools is the power of the major employer groups. The New South Wales
Department of Education and Training (DET) is by far the major employer of teachers in
New South Wales high schools. DET employs more than 70% of teachers in New South
Wales high schools. This effectively gives DET major influence as an employer of
teachers in New South Wales. DET’s role can most accurately be examined as that of a
monopsonist. A monopsonist is a market situation where there is only one buyer of a
product, in this case high school teachers in New South Wales. The various Catholic
Education Offices (CEOs) are the second largest purchaser of high school teacher labour in
New South Wales. The CEOs model their wage policies closely on that of DET. This is
done for a number of reasons not the least of which is to ensure continued State
Government funding of salaries. The other non-government schools are largely a loose
group of independent employers who tend to follow DET’s wage policies but with extra
allowances to attract better staff and for some co-curricula and extra-curricular activities.
This is aimed at enhancing the quality of the schooling and the reputation of the school.
These are both important in attracting students, whose parents are paying considerable
more for the schooling than in a public school.

46
Another important consideration in labour market theory is occupational wage differentials
and involves the theory of compensating wage differentials. As we saw in the teacher
labour market in the USA, jobs and working conditions are heterogeneous not
homogeneous. Heterogeneous employment situations have different skill and experience
requirements, have differing nonwage attributes, and may have wage structures that vary in
their approach to paying efficiency wages to increase productivity. Employers also vary
depending on areas such as firm and market size, union status and power, and
discrimination. In the high school teacher labour market in NSW, the State Government is
the dominant employer. The various Catholic Education Offices are the next most
important and the remaining group tend to be individual schools employing staff. The
wage determined by the State Government in enterprise agreements with the NSW
Teachers Federation becomes the benchmark for wages in the state. As discussed earlier
changes in the wage levels may be more based on Education Department budgets14 and
political party policies rather than marginal productivity theory. This is reflected in a
variety of major wage agreement made by the NSW State Government from 1999 to 2000.
Various sections of the public service including nurses, teachers, and the police force all
received on average a 16 percent pay increase over a period of approximately three years.
There appeared to be no flexibility in the process and no scope for looking at the individual
circumstances in each of the differing public service labour markets.
14 The problem of education funding is further highlighted by the decline in education expenditure in the NSW Government Budget from 28.4 percent of total expenditure in 1989-90 to 22.0 percent in 2001-2002 (Budget Papers No.2).
47
2.2 Hedonic Wage Theory
An important theoretical approach when considering the teacher labour market is hedonic
wage theory. Hedonic wage theory is based on the belief that workers try to maximise the
happiness or satisfaction that they get from a particular job i.e. their utility15. Individuals
try to maximize their utility from their work. This occurs by maximizing the utility from
wage income, and other benefits and minimizing the disutility from unpleasant working
conditions such as injury. According to hedonic wage theory workers will want to
maximize their net utility and are willing to trade-off something that gives utility in
exchange for something that will reduce the level of disutility. For example a worker may
trade-off higher wages in exchange for greater job satisfaction. On the other hand a worker
may trade-off lower levels of job satisfaction in exchange for higher wages. This situation
is reflected in the teacher labour market in the USA in Tables 1.1 and 1.6. Public school
teachers have a lower level of job satisfaction than private school teachers but this is
compensated for by higher wage levels. A common example of an application of the
hedonic model is the trade-off workers accept between higher wages and the risk of injury
(Kaufman 2000, Ehrenberg and Smith 2000, McConnell 2003). For example Xiangdong
Wei (1999) applied hedonic wage theory to examine the workers' demand function for job
safety using British General Household Survey data. The estimation showed that there was
a significant wage compensation for job risk in the United Kingdom.
15 The analysis of hedonic wage theory is based on the work of Sherwin Rosen (1974).

48
The model that will be used here will consider the relationship between wages and
nonwage factors that affect the utility of the workers in the labour market. McConnell et al.
(2003) see this as the trade-off between a ‘good’ factor, (the wage) and a ‘bad’ factor
(probability of an injury). If the probability of injury is quite low, then this becomes a
‘good’ factor. The theory can therefore be presented in terms of a trade-off between wages
and nonwage amenities. These nonwage amenities can be favourable or unfavourable.
Favourable job attributes could include high job security, flexible working hours, and close
proximity to work. Unfavourable nonwage amenities could include a greater risk of injury,
higher levels of stress and an unpleasant working environment. Favourable nonwage
amenities, like wages, will increase utility for the worker. This can be demonstrated in
Figure 2.5. The wage rate is measured on the vertical axis and the net value of nonwage
amenities on the horizontal axis. The more positive the nonwage amenities the greater the
utility will be at a relatively lower wage level. Each indifference curve in Figure 2.5 shows
various combinations of wage rates and nonwage amenites that yield a specific level of
utility. Each successive curve upward to the right reflects a higher level of total utility for
the individual.
The steeper, that the indifference curves are, the more adverse the individual is to
unfavourable nonwage amenities. The steeper the indifference curve the greater the
substitution rate of higher wages will be for less favourable nonwage amenities. In other
words the individual will expect a greater increase in wages to compensate them for a
smaller increase in unfavourable nonwage amenities. If the indifference curves are flatter
workers will be willing to give up a larger proportion of favourable nonwage amenities or
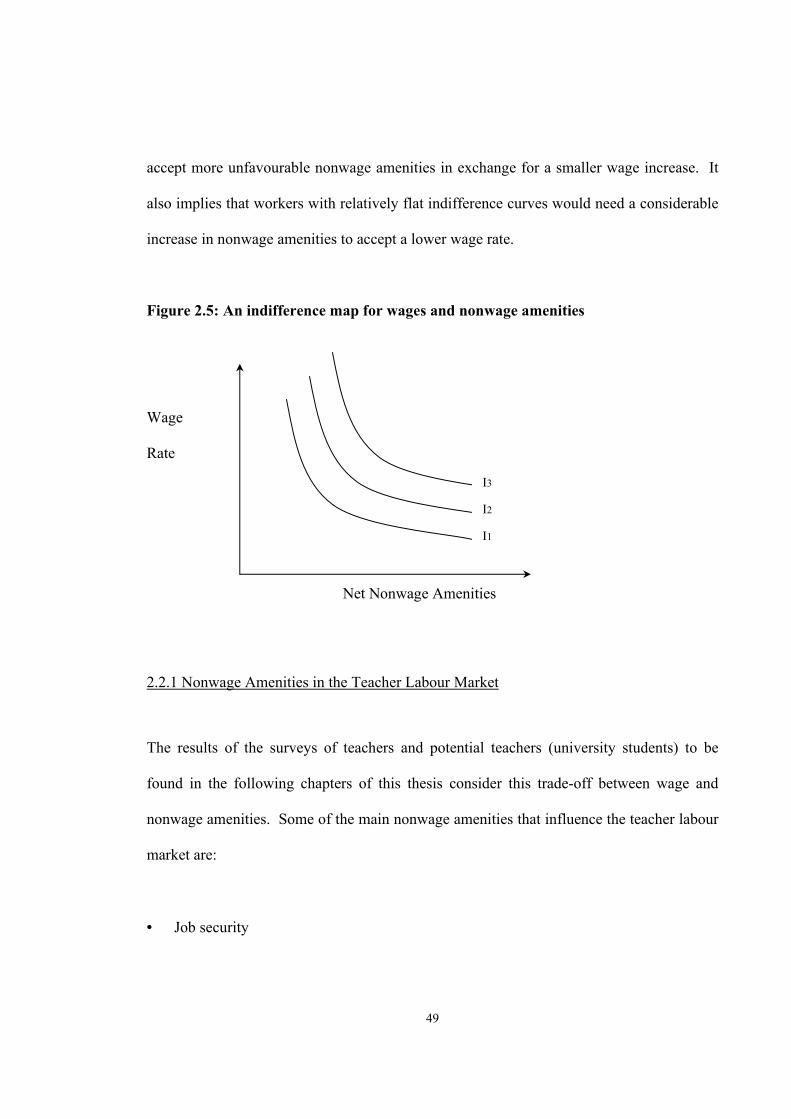
49
accept more unfavourable nonwage amenities in exchange for a smaller wage increase. It
also implies that workers with relatively flat indifference curves would need a considerable
increase in nonwage amenities to accept a lower wage rate.
Figure 2.5: An indifference map for wages and nonwage amenities
Wage
Rate
2.2.1 Nonwage Amenities in the Teacher Labour Market
The results of the surveys of teachers and potential teachers (university students) to be
found in the following chapters of this thesis consider this trade-off between wage and
nonwage amenities. Some of the main nonwage amenities that influence the teacher labour
market are:
• Job security
Net Nonwage Amenities
I3 I2 I1

50
An increase in job security is considered a favorable nonwage amenity, while any reduction
in job security is seen as an unfavourable nonwage amenity that would act to reduce an
individual’s utility.
• Level of stress
Stress is viewed as being an unfavourable factor that will lower an individual’s utility. It is
similar to the risk of injury in the workplace. A higher level of stress in a particular job will
require an increase in the wage level otherwise utility will decline. Workers may reject
promotion and as a result higher wages because of the increase in stress that the increase in
responsibility and tasks may cause. On the other hand, research by Dinham and Scott
(1999) showed that generally teachers in positions of higher responsibility had lower levels
of stress than those in lower positions in New South Wales high schools. Researchers have
speculated that this may be due to the lower levels of control over their jobs and work
requirement that those on lower levels of responsibility have (see Marmot and Therorell
1988, Marmot, Bosma, et al. 1997). It could also be argued that teachers who can cope
with the level of stress better are likely to perform better and will be promoted to these
positions of higher responsibility, or are more likely to apply for these positions as they do
not see the extra responsibilities as being too stressful.
• Number of holidays
On average in New South Wales high school teachers receive twelve weeks holiday a
year16. The normal holiday period for workers in New South Wales is four weeks annual
16The twelve weeks comprises six weeks at Christmas and two weeks break between each of the other terms. Public schools in the western areas of NSW are further compensated by an additional week due to the
51
leave. The extra holidays increase the individual’s utility and as a result are a favourable
nonwage amenity.
• Hours of work
The hours of work of a teacher can vary considerably. While the normal school hours may
be in the range of six to seven hours a day and the maximum level of face-to-face teaching
is 20 hours per week, the actual number of hours a teacher works may be considerably
more than that. Some teachers surveyed for this thesis reported working up to seventy
hours a week. Many teachers reported that they usually worked over the weekend. Indeed
in many independent schools it is an expectation of employment that teachers will engage
in extra-curricula activities at least one day of the weekend. Some teachers left the
independent system while others were dettered from teaching in this system because of the
weekend work requirement. For some individual teachers the hours of work would be
considered a favourable nonwage amenity, while others would consider them to be an
unfavourable nonwage amenity.
• Support and encouragement from administration
Studies by the National Center for Education Statistics (NCES 1996) found that support
and encouragement from administration was an important factor in influencing the level of
job satisfaction in the US teacher labour market (Table 1.6). Teachers, who considered that
they had support and encouragement from their administration, generally had a higher level
conditions in summer. Many independent schools also have in excess of twelve weeks holidays, part of this does compensate for weekend sport commitments.

52
of job satisfaction compared to those who did not feel supported and encouraged. Positive
support and encouragement would be considered as a favourable nonwage amenity.
• The attitude and support of peers
Teachers in the US had greater job satisfaction when there was a ‘great deal of cooperative
effort among the staff’ (Table 1.6). Surveys of teachers in New South Wales high schools
(Chapter 6) also showed that the attitude and support of peers was considered to be
important to teachers. A working environment of friendly co-operation and support would
increase the level of favourable nonwage amenitities for an individual. The level would
decline, if the environment were seen as not being positive and supportive.
• The attitude and support of students
Of considerable importance to teachers is the attitude and support of their students. NCES
studies in the US showed that if student behaviour interfered with teaching then teacher
satisfaction levels declined (Table 1.6). The Vinson Report, ‘Inquiry into the Provision of
Public Education in NSW’ (2002) states that bad behaviour of some students is a serious
problem. It “disrupts learning and drains the morale of staff…The total lack of respect for
teachers and the verbal abuse sometimes showered upon them by disruptive students causes
some teachers to ‘count the days’ until they can flee the situation (xvii).” A positive
attitude and support of students will increase the level of favourable nonwage amenities.
The disruptive behaviour of some students on the other hand will have a considerable effect
on increasing the level of unfavourable nonwage amenities.
53
• The satisfaction of student achievement
Studies by Dinham (1995), and Dinham and Scott (1996, 1997) concluded that the greatest
source of teacher satisfaction in New South Wales schools is pupil achievement and the
obvious sense of teacher accomplishment that occurs as a result of that. The sense of
student achievement is different for a teacher than other occupations. While many workers
may get satisfaction from what they have achieved at a particular point in time, a teacher’s
satisfaction is not just measured in the present but is an ongoing process. It is not just
measured in terms of academic success of the students in the present but also their personal
development and growth over their lifetime. It is not uncommon for teachers to attend
school reunions with past students, one, ten or twenty or more years after they taught those
students. Often the teacher is there to see how well the students finally turn out. A positive
level of satisfaction of student achievement is a major factor promoting favourable
nonwage amenities, while a low level of satisfaction will reduce the level of nonwage
amenities.
• The support of pupils’ parents
Teachers not only react with students but also with the parents of students. If parents are
supportive, this acts as an encouragement to a teacher, whereas condemnation and
harassment lowers teacher morale and satisfaction. NCES studies in the USA (Table 1.6)
reflect the situation that in situations where teachers feel that parents support the work of
the teachers that the level of satisfaction is much higher than in situations where teachers do
not feel that they have the support of the parents. Positive support will increase favourable

54
nonwage amenities while a feeling of a lack of support from parents will generate an
increase in unfavourable nonwage amenities.
• Attitude of the general public towards teachers
The attitude of the general public and the media towards teachers can influence the self-
esteem of the individual as a teacher. The status of teaching and teachers as perceived by
the public and media can influence individuals’ decisions to enter the teaching profession
or remain as a teacher. A positive status and public perception of teachers would increase
favourable nonwage amenities. Research by Dinham and Scott (1997) showed that the two
least satisfying aspects out of seventy-five factors influencing teacher satisfaction in New
South Wales schools were “the image of teachers portrayed in the media (and) the
community’s opinion of the ‘official’ working hours and holidays in teaching.” The sixth
least satisfying factor was “the status of teachers in society.”17
• The support of the teacher’s family
The support of family varies depending on the age and family structure that the individual
is involved with. A single teacher is more likely to react to the support or lack of support
from parents and siblings. A teacher who is in a relationship or married is more likely to be
influenced by their partner and whether there are children or not. Dinham (1997) found
that families having a teacher as one of the parents impacted negatively upon the family. In
some circumstances it worsened relationships as the teacher was not devoting sufficient
17 Teachers were asked the question “How satisfying do you find…?” On a scale up to 100 percent, teachers responded with the lowest scores of three percent for “the image of teachers portrayed in the media (and) the community’s opinion of the ‘official’ working hours and holidays in teaching”. The factor, “the status of teachers in society,” was given a score of six percent.

55
time to the family due to their work commitments and the ‘open-endedness’ of teachers’
work. The support or lack of support of the family can have considerable impact on the
individual’s level of nonwage amenities.
Another consideration involves the moral satisfaction of one’s job. If individuals are
concerned about doing the ‘right thing’ and helping others, then the types of jobs that offer
this opportunity should find it easier to attract workers than jobs that may be seen as
lacking ‘social responsibility’. Robert Frank (1996) of Cornell University found that when
he compared jobs and earnings of recent graduates from Cornell, those who had socially
responsible occupations, such as teachers, medical workers and counselors received lower
wages than those consider to be socially less responsible such as stock brokers, salesmen
and marketing analysts. Socially responsible jobs paid workers on average 30 percent less
than otherwise similar workers in the jobs rated least socially responsible.
2.2.2 The Role of Isoprofit Curves
The employer is able to affect the nonwage amenities offered to the worker. Some of these
nonwage amenities will represent a cost to the employer, so the employer is faced with a
trade-off between the wages offered and the level of favourable nonwage amenities. For
example a policy to reduce class sizes would require the employment of additional teachers
and a higher total wage bill for the employer. While the level of teacher satisfaction and as
a result favourable nonwage amenities would increase, the costs to the employer would also
rise. In order to maintain any given level of profits for the firm, the employer can either

56
·
·
pay lower wages to workers and provide a higher level of favourable nonwage amenities or
pay higher wages and reduce the level of favourable nonwage amenities i.e. increase class
sizes. Figure 2.6 shows a number of possible isoprofit curves for an employer. Curve P2 is
a normal profit isoprofit curve, which indicates the various combinations of wage rates and
nonwage amenities that yield a given level of normal profit. It is assumed in this case that
the level of competition among firms will result in only normal profits being made, i.e. zero
economic profits. Curve P1 represents above zero economic profit and curve P3 is below
zero economic profit.
Figure 2.6: A group of isoprofit curves for an employer
A
Wage
Rate B
Note that the shapes of the isoprofit curves are concave. This is derived from the ‘realistic’
assumption18 that each unit of added job satisfaction comes at an increasing expense and
therefore results in a successively larger wage reduction. Successive units of wage
reductions yield diminishing returns to nonwage amenities. Marginal costs typically rise as
18 See McConnell et al. 2003: 262-3, Ehrenberg and Smith 2000: 263-4.
Net Nonwage Amenities
P3
P2 P1

57
a greater level of favourable nonwage amenities is provided. For example at A on the
isoprofit curve P2, the curve is relatively flat, so there can be a relatively large increase in
nonwage amenities with little reduction in the wage rate. However at B, the isoprofit curve
is steeper and any increase in favourable nonwage amenities will require a larger reduction
in the wage rate.
An important consideration for employers in the teacher labour market is, that while some
improvements in nonwage amenities will increase costs for the employer, such as smaller
class sizes, other improvements in nonwage amenities may require little or no increase in
costs to the employer. For example from Table 1.6, ‘an increase in recognition of staff
members for a job well done’, an administration that is ‘supportive and encouraging’ and
‘principals frequently discussing instructional practices with teachers’ would all increase
the level of job satisfaction and favourable nonwage amenities at no cost to the employer.
Recognition of a job well done could be as simple as praising a teacher in front of their
peers and/or students, or a written note of commendation from the school principal or the
Department of School Education.
It is now possible to match the employees with the employers. The aim of the employee is
to achieve the highest level of utility from their choice of job. If an employee is offered
two jobs at the same wage rate, they will choose the job with the highest net nonwage
amenities. If two jobs have the same level of nonwage amenities the individual will choose
the job with the highest wage rate. The overall decision will be based on choosing the job
that occurs on the highest indifference curve. The employers on the other hand can
generally not afford to provide very high wages and a high level of nonwage amenities,
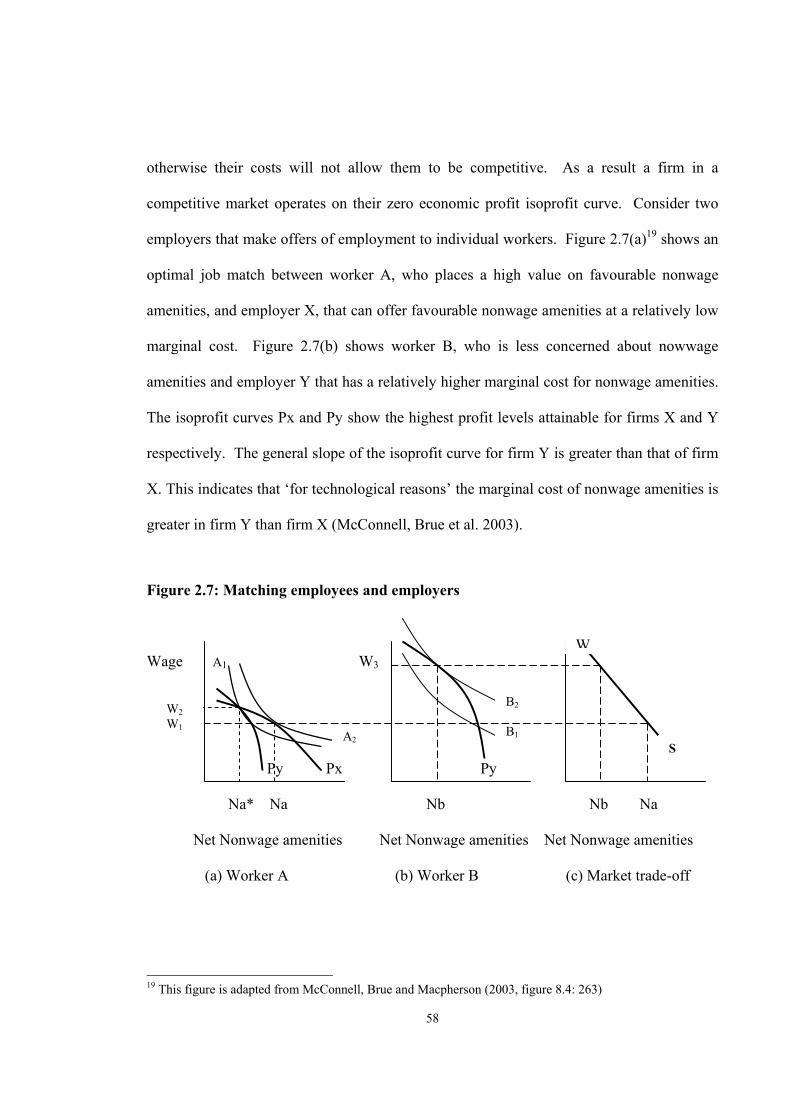
58
otherwise their costs will not allow them to be competitive. As a result a firm in a
competitive market operates on their zero economic profit isoprofit curve. Consider two
employers that make offers of employment to individual workers. Figure 2.7(a)19 shows an
optimal job match between worker A, who places a high value on favourable nonwage
amenities, and employer X, that can offer favourable nonwage amenities at a relatively low
marginal cost. Figure 2.7(b) shows worker B, who is less concerned about nowwage
amenities and employer Y that has a relatively higher marginal cost for nonwage amenities.
The isoprofit curves Px and Py show the highest profit levels attainable for firms X and Y
respectively. The general slope of the isoprofit curve for firm Y is greater than that of firm
X. This indicates that ‘for technological reasons’ the marginal cost of nonwage amenities is
greater in firm Y than firm X (McConnell, Brue et al. 2003).
Figure 2.7: Matching employees and employers
Wage A1 W3
Py Px Py
Na* Na Nb Nb Na
Net Nonwage amenities Net Nonwage amenities Net Nonwage amenities
(a) Worker A (b) Worker B (c) Market trade-off
19 This figure is adapted from McConnell, Brue and Macpherson (2003, figure 8.4: 263)
A2
W2 W1
B2 B1
W
S

59
Workers who have a much greater preference for higher wages than improved nonwage
amenities will work for employer Y and those who have a greater preference for nonwage
amenities will work for employer X. Graphing the worker indifference curves and isoprofit
curves together can show which workers will choose which job offers. Each worker will
maximise his or her total utility where his or her highest indifference curve is tangential to
the employer’s zero-economic profit isocost curve.
In Figure 2.7(a) worker A maximises utility on indifference curve A2 by working for
employer X at wage rate W1 and receiving nonwage amenities, Na. If worker A accepted
the offer of employer Y and received wage W2 and nonwage amenities Na*, the level of
utility would be lower at indifference curve A1. Worker A values favourable nonwage
amenities highly and wage rate W2 is not sufficient to compensate for the loss of nonwage
amenities. Worker B on the other hand has a relatively flat indifference curve, Figure
2.7(b). If worker B accepted the wages offered by firm X, W1, utility would be lower on
indifference curve B1, compared to wage rate W3 that would be offered by firm Y. At wage
rate W3, worker B is receiving wages and nonwage amenities that provide greater utility at
indifference curve B2.
WS in Figure 2.7(c) demonstrates the general relationship between wages and nonwage
amenities in a labour market characterised by many heterogeneous workers, not just A and
B, and many firms, not just X and Y. It demonstrates that higher wage rates are associated
with lower nonwage amenities and lower wage rates are associated with higher nonwage
amenities, ceterus paribus.
60
2.3 Conclusion The hedonic wage model has some important implications in regard to the teacher labour
market in New South Wales high schools. First, workers with identical levels of human
capital will be willing to work for different wage levels depending on the nonwage
amenities available and their individual preferences for nonwage amenities compared to
wages. A situation of fewer nonwage amenities but a relatively higher wage would attract
some workers. This is most relevant in regards to teacher shortages in isolated schools.
These schools tend to have less social amenities for teachers compared to that existing in
regional centers and large cities. The hedonistic wage model would suggest that higher
relative wages in school areas that are fairly isolated would be a trade-off for the lower
level of nonwage amenities.
Second, the hedonic wage model tells us that wages can be traded–off for nonwage
amenities. The major employer of teachers in NSW high schools is the NSW State
Government. Their ability to fund teachers’ wages is constrained by their budgets and the
political repercussions of increases in taxation or cuts in Government expenditure in other
areas to fund the teacher wage increases. There is also the issue of flow-on effects to other
workers in the public service, which would put further pressure on the Government’s
budget. An alternative, at least in part, to wage increases offered by the hedonic wage
model is improved nonwage amenities for teachers. Later chapters of this thesis will
examine the main nonwage amenities that teachers seek and consider the relative cost of
adopting those amenities. Some of those nonwage amenities have a relatively low cost to
implement and may increase teacher retention and entry rates if adopted.

61
Third, the indifference curves, on average, for males and females may be quite different.
Females, overall, generally receive lower wages than men in the labour market (Ehrenberg
2000, McConnell 2003, Norris 2000); this may, in part, reflect differing tastes for positive
job nonwage amenities such as pleasant working condition, suitable work times to fit in
with a family, low risk of injury and short commuting distances. Men may be more
concerned about having sufficient income, to look after the family financially both in the
present and in the future (superannuation), that they may accept relatively lower levels of
nonwage amenities in exchange for higher wages. Research by Filer (1985) found that
female workers are more likely to accept lower paid jobs that had relatively better nonwage
amenities compared to men. This issue will be examined further in later chapters that look
at the decline in the percentage of male high school teachers in NSW and the relative
decline in teachers’ wages compared to average weekly earnings in Australia. This would
support the hypothesis that lower relative wages would have a bigger impact on the supply
of male teachers compared to female teachers. Filer’s results could lead us to consider the
proposition that, if school authorities wish to increase the quantity of male high school
teachers, an increase in wages would be a more important factor in comparison to
increasing wages to increase the quantity of female teachers.
Finally, improvements in utility for workers and thus the achievement of higher
indifference curves could also occur as a result of greater flexibility in nonwage benefits.
Many organisations have set benefits that apply to all workers. Greater utility could be
achieved for some workers if they were able to trade-off some of those benefits for
increased wages and visa versa. If organisations consider the marginal cost of providing
benefits then they could have lower relative costs by offering certain benefits. While a

62
retail firm may give its workers discounts on merchandise, schools could offer free
education for children of teachers in a particular education system. The teachers who
accept this benefit would trade-off wages or another benefit to have the free education for
their children. While this would be limited in the public school system in NSW, it would
be a potential benefit for both teachers and administrators in the Catholic and independent
systems, as an incentive to work in that system and also to send their children to school in
that system. If the schools had excess capacity, the cost of the extra student would only be
equal to the marginal cost to the school. The teachers could be offered this as an alternative
tradeoff to higher money wages being paid to them. This issue will be considered further in
the policy recommendations in Chapter 8.

63
Chapter 3. The Demand for High School Teachers in New South Wales
3.1 Introduction
The labour market for teachers is made up of those groups who employ teachers
20 and the teachers who are available for work. For the purpose of this chapter the demand
for teachers will be restricted to those groups who operate registered and accredited high
schools in New South Wales and employ teachers. The supply of teachers will be restricted
to residents of New South Wales who are qualified to teach in New South Wales high
schools and are willing and able to work as high school teachers. While there are teachers
who move across state boundaries there are limited records of the numbers of these and the
net effect is likely to be small. If there were a high level of mobility then theory would
suggest that teachers would move to areas of highest relative wages and greatest job
opportunities. This does not appear to be the case. The state and territory with the highest
median initial salaries for Education graduates, Victoria and the Northern Territory, also
have the highest level of fulltime initial graduate employment (Table 3.1).
20 Teachers are defined as staff at schools that spend the majority of their time in contact with students, i.e. support students either by direct class contact or on an individual basis and have teaching duties, that is, are engaged to impart the school curriculum. Teaching staff includes principals, deputy principals, and senior teachers who may be involved in administrative duties. Excluded are emergency and casual relief teaching staff (Australian Bureau of Statistics, Schools Australia, 2002)
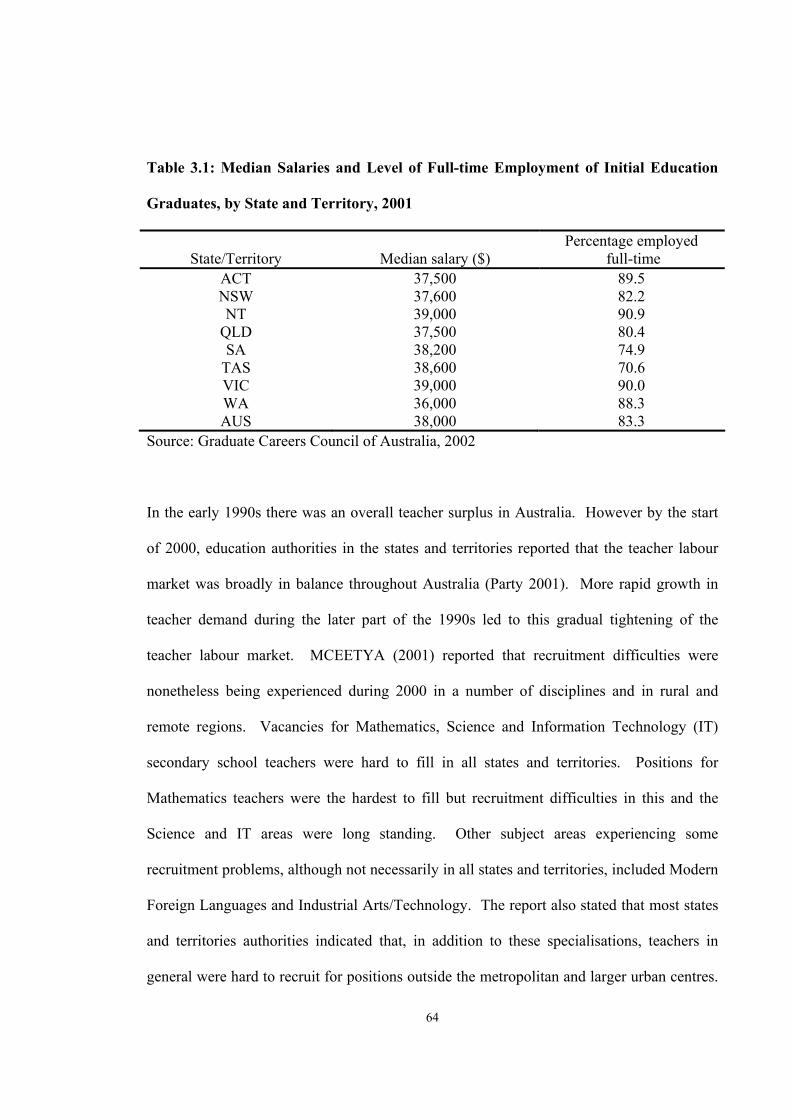
64
Table 3.1: Median Salaries and Level of Full-time Employment of Initial Education
Graduates, by State and Territory, 2001
State/Territory Median salary ($) Percentage employed
full-time ACT 37,500 89.5 NSW 37,600 82.2 NT 39,000 90.9
QLD 37,500 80.4 SA 38,200 74.9
TAS 38,600 70.6 VIC 39,000 90.0 WA 36,000 88.3 AUS 38,000 83.3
Source: Graduate Careers Council of Australia, 2002
In the early 1990s there was an overall teacher surplus in Australia. However by the start
of 2000, education authorities in the states and territories reported that the teacher labour
market was broadly in balance throughout Australia (Party 2001). More rapid growth in
teacher demand during the later part of the 1990s led to this gradual tightening of the
teacher labour market. MCEETYA (2001) reported that recruitment difficulties were
nonetheless being experienced during 2000 in a number of disciplines and in rural and
remote regions. Vacancies for Mathematics, Science and Information Technology (IT)
secondary school teachers were hard to fill in all states and territories. Positions for
Mathematics teachers were the hardest to fill but recruitment difficulties in this and the
Science and IT areas were long standing. Other subject areas experiencing some
recruitment problems, although not necessarily in all states and territories, included Modern
Foreign Languages and Industrial Arts/Technology. The report also stated that most states
and territories authorities indicated that, in addition to these specialisations, teachers in
general were hard to recruit for positions outside the metropolitan and larger urban centres.

65
This trend was supported by the National and State Skill Shortage Lists Australia (DEWR,
various) that showed there was an increasing shortage of particular categories of teachers
especially in high schools.
3.2 The Employers of Teachers in NSW High Schools
In 2002 there were 38,447 teachers employed full-time in high schools in NSW (ABS,
Schools Australia, 2003). There are three main categories of employers of high school
teachers in NSW21. The Australian Bureau of Statistics classifies these as:
• Government;
• Non-Government Catholic; and
• Non-Government Independent.
As shown in Table 3.2, 62.7 percent of high school teachers in NSW are employed in
government schools, 21.6 percent in Catholic schools, and 15.7 percent in independent
schools. The ratios of male to female teachers vary slightly between the three systems. The
independent schools have the highest proportion of male teachers at 45.9 percent, while the
Catholic system has least with 42.7 percent. One area where there is a considerable
difference is the number of students per teacher. The largest student teacher ratio occurs in
Catholic schools at 13.3 students per teacher and the lowest is in independent schools at
21 It should be noted that teacher graduates may not only be employed by schools in NSW, but may be employed by TAFE, schools interstate and overseas, and by universities. The Graduate Careers Council of Australia (GCCA) survey (2002) found that 91.3 percent of Education graduates worked in the field of Education.

66
10.6 students per teacher. Government schools were in the middle with 12.5 students per
teacher. These results would generally mean that class sizes would be greatest in Catholic
schools and least in independent schools.
Table 3.2: Percentages of Teachers in New South Wales High Schools, by Category of
School22
Percentages of teachers Government Catholic Independent Male teachers, as a % of all teachers, by system
45.2 42.7 45.9
Female teachers as a % of all teachers, by system
54.8 57.3 54.1
% of teachers in each school classification
62.7 21.6 15.7
Student/teacher ratios 12.5 13.3 10.6 Source: Australian Bureau of Statistics, Schools Australia, Cat. No. 4221.0, 2002.
Teachers returning to the classroom who were employed in schools the previous year meet
most of the annual demand for teachers. Each year, however, some new teachers need to
be employed due to some teachers leaving and due to changes in a number of other factors.
The demand for these additional teachers in NSW high schools is a function of:
• the number of teachers leaving the workforce (permanently or on leave); and
• what is referred to as the ‘growth demand for teachers’ (MCEETYA, 2001).
The number of teachers leaving the workforce depends on:
• the number of teachers retiring;
• the number of teachers going on leave; and
• the number of teachers quitting for various reasons, including going into other areas
of teaching, excluding NSW high schools.
22 The teacher numbers are measured as full-time equivalent teaching staff.

67
The most important factor at the present time is the ageing teacher workforce. In March
2002, 48 percent of the teachers working in public high schools in NSW were 45 years of
age or older (DET 2002). While no figures were available for the non-government sector
the figure would most likely be similar. As this group moves towards retirement in the next
15 years the demand for new teachers will increase. This issue is discussed more fully later
in this chapter.
3.3 Determinants of Demand for Teachers in NSW High Schools
The demand for teachers depends on:
• the wage rate and the budget constraint (as discussed in Chapter 2)
• the size of the school age population;
• participation rates at various ages and especially the retention rate to Year 12;
• the level of government and private funding of schools, and teacher and ancillary
costs; and
• policies regarding class sizes and curricula (which can affect class sizes).
Changes in the above factors will lead to changes in the demand for teachers. The
Conference of Education Systems Chief Executive Officers (CESCEO) National Teacher
Supply and Demand Working Party estimate that the number of teachers employed grew
throughout Australia at 1.1 percent per annum during the 1990s, slightly higher than 1.0
percent in the 1980s. This largely came about because of increased student enrolment and
increased school retention rates, especially in years 11 and 12. From 1996 to 2001, the
68
school retention rate from year 10 to year 12 rose from 77.3 percent to 79.4 percent
throughout Australia (ABS, Schools Australia, 2002). This was in turn accompanied by a
decline in student to staff ratios. In NSW public high schools the student staff ratio
declined from 12.8 per teacher in 1996 to 12.5 in 2002 (DET 2003). Overall the strongest
growth was experienced by secondary student enrolments in the non-government sector
(see Figure 3.3).
The NSW Department of Education and Training (DET) base the number of teachers that is
employed in a particular public school on a set staffing formula. The formula varies
depending on the number of students enrolled in various years of the school. For example
if there are 83 students in a primary school, then the school is entitled to three teachers. If
the number increases to 84, the school can now employ four teachers. Changes in the
staffing formula would cause a change in the demand for teachers, ceterus paribus.
The major source of funding for Catholic schools is the Commonwealth Government,
followed by the State Government, parents and parishioners. Parents contribute to their
schools through school fees, voluntary work and fund raising as well as through their taxes.
Catholic systemic schools make up the vast majority of Catholic schools. They can be
parish primary schools or regional secondary schools. The diocesan Catholic education
offices (CEOs) administer these schools. There are 11 dioceses in NSW/ACT. The
Catholic systemic schools are funded by:
• the Commonwealth Government approximately 60%;
• the State Government approximately 25%; and
69
• parents (fees) and parishioners (donations) approximately 15% (Catholic Education
Commission 2002).
Commonwealth and State Government grants and school fees are paid into an account for
each of the 11 dioceses and the money is distributed ‘according to need across the schools
in the Diocese’ (Catholic Education Commission 2002). Expenditure includes schools'
operating costs, teachers' salaries, resources, maintenance, capital works, and system
administration costs.
There are between 40 and 50 Catholic high schools in NSW that are not under the direct
control of the diocesan Catholic education offices (Catholic Education Commission 2002).
These are the Catholic congregational schools. Congregational schools are owned and
operated by religious congregations. They vary considerably in the fees they charge. Some
charge fees that are comparable to CEO schools, while others such as St. Joseph’s College
at Hunters Hill and St. Ignatius’ College at Riverview have fees that are similar to the
wealthiest independent schools. Congregational schools are generally funded at a lower
rate than systemic schools and therefore set their own fees to cover the cost of salaries,
buildings, and equipment. In addition many congregational schools gain additional funds
by having boarders. In the past, the distribution of funds to congregational and independent
schools has been based on the Commonwealth Government's classification of schools
according to a needs index that measures the total resources available to a school. This
classification has now being replaced with a new socio-economic status (SES) funding
model. An overall comparison of funding of schools in NSW can be found in Table 3.3.

70
The demand for teachers will vary with the number of pupils in each school but also with
the level of government funding and private revenue. The CEOs also have a staffing
formula, based on student numbers, and fund each school to employ that number of
teachers. The school fees charged by the Catholic systemic schools are set by each of the
dioceses and vary with the year of schooling the student is undertaking. There are also
discounts available for families with more than one child in a Catholic school. In 2000 the
private revenue raised from fees and charges was equal to $1241 per student in NSW
Catholic schools (Table 3.3). The total expenditure from all sources of funds per student in
public schools in NSW was $6907 per annum, while in the NSW Catholic systemic schools
it was $6473 per annum. The difference in funding of $434 per student has led to a lower
demand for teachers per pupil, as reflected in the higher student teacher ratio in Catholic
schools in NSW (Table 3.2). This shortfall has also meant that Catholic diocesan education
offices aim to have wage rates at the same level as for public high school teachers and
cannot offer the higher wages that are used to attract teachers to private independent high
schools. This creates a situation that effectively 84.3 percent of teachers in NSW high
schools have their wages determined by the agreement between the State government and
public school teachers. This leads to a monopsonist position (as discussed in Chapter 2) for
the NSW Government where they can determine the wages for 84.3 percent of the teachers
in NSW high schools, through the current enterprise bargaining process23. Schools that do
23 In 2003 both the NSW Teachers Federation (representing public school teachers) and the Independent Education Union (Catholic school teachers) have lodged separate applications for their log of claims to be heard as a special case in the NSW Industrial Relations Commission. The log of claims in both cases seeks a 25 percent pay rise, after both the State Government and the Catholic dioceses offered three percent per
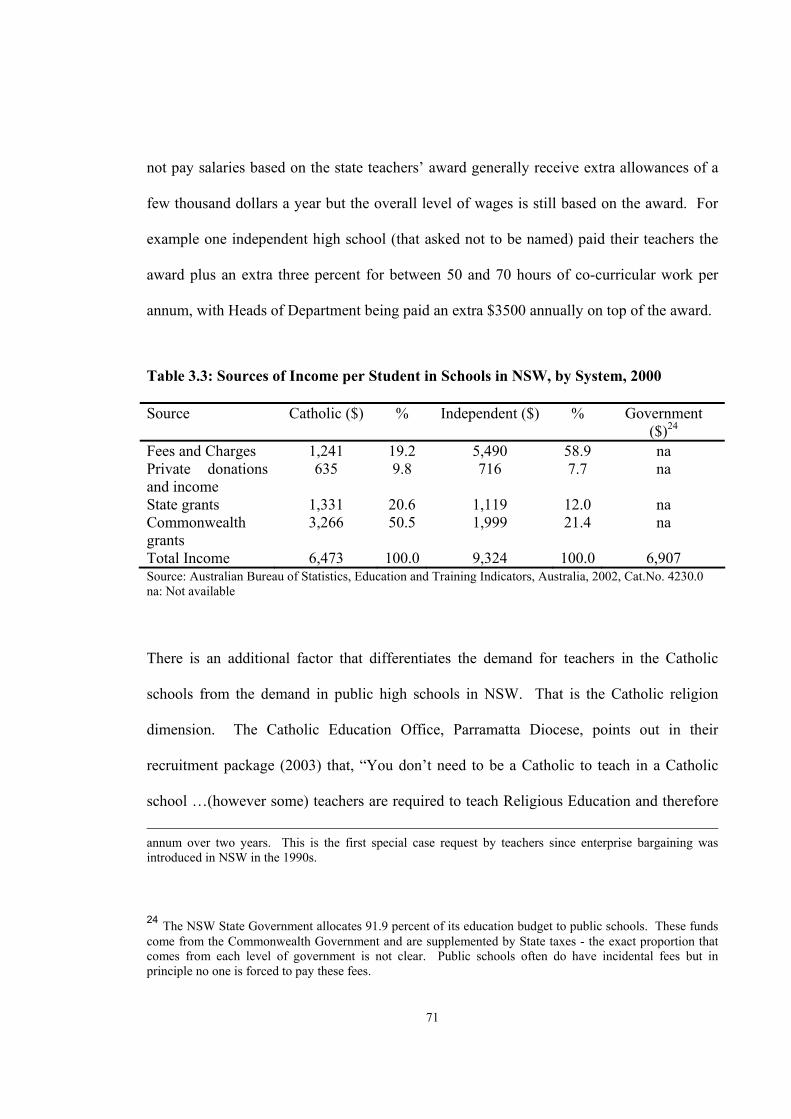
71
not pay salaries based on the state teachers’ award generally receive extra allowances of a
few thousand dollars a year but the overall level of wages is still based on the award. For
example one independent high school (that asked not to be named) paid their teachers the
award plus an extra three percent for between 50 and 70 hours of co-curricular work per
annum, with Heads of Department being paid an extra $3500 annually on top of the award.
Table 3.3: Sources of Income per Student in Schools in NSW, by System, 2000
Source Catholic ($) % Independent ($) % Government ($)24
Fees and Charges 1,241 19.2 5,490 58.9 na Private donations and income
635 9.8 716 7.7 na
State grants 1,331 20.6 1,119 12.0 na Commonwealth grants
3,266 50.5 1,999 21.4 na
Total Income 6,473 100.0 9,324 100.0 6,907 Source: Australian Bureau of Statistics, Education and Training Indicators, Australia, 2002, Cat.No. 4230.0 na: Not available
There is an additional factor that differentiates the demand for teachers in the Catholic
schools from the demand in public high schools in NSW. That is the Catholic religion
dimension. The Catholic Education Office, Parramatta Diocese, points out in their
recruitment package (2003) that, “You don’t need to be a Catholic to teach in a Catholic
school …(however some) teachers are required to teach Religious Education and therefore
annum over two years. This is the first special case request by teachers since enterprise bargaining was introduced in NSW in the 1990s.
24 The NSW State Government allocates 91.9 percent of its education budget to public schools. These funds come from the Commonwealth Government and are supplemented by State taxes - the exact proportion that comes from each level of government is not clear. Public schools often do have incidental fees but in principle no one is forced to pay these fees.

72
need to be accredited.” The vision statement also highlights that “the system of Catholic
schools in the Parramatta Diocese seeks to be authentically Catholic.” In addition the
Targeted Teacher Graduate Program Application Form requires the name and address of
two referees, the first of whom must be a priest. The Catholic Education Offices also
prevent non-Catholic teachers from holding positions of principal, deputy principal, first
assistant and religious education coordinator in their schools. These policies have the effect
of limiting demand predominately to teachers with a Catholic religious background and
imply a preference to those trained in religious education. In 2002, 73.0 percent of high
school teachers in Catholic schools in NSW were Catholic (Catholic Education
Commission 2003), compared to an overall population proportion of Catholics in the
general community of 26.6 percent (Australian Bureau of Statistics 2003c). The reference
to “an appreciation and acceptance of Catholic teaching and values” in the Parramatta CEO
documentation including the application for classification form would most likely reduce
the supply of applicants for teaching in Catholic schools. At least, as a minimum, agnostics
and atheists would probably see themselves as not being suitable for this system and would
not be likely to apply. A number of non-Catholic trainee teachers who attended a
Parramatta CEO talk, at ACU National, on teacher recruitment expressed the view that they
did not believe that they would get a job in a Catholic school and there was no point
applying for a position in a Catholic school.
The final category of employers of high school teachers in NSW is the independent schools
system. They are a diverse group of schools serving a range of different communities.
Many independent schools provide a religious or values based education. Others promote a

73
particular education philosophy or interpretation of mainstream education. Independent
schools include:
• schools affiliated with Christian denominations, for example, Anglican, Lutheran,
Presbyterian schools;
• non denominational Christian schools;
• Islamic schools;
• Jewish schools;
• Montessori schools;
• Rudolf Steiner schools;
• Aboriginal community schools, and
• schools that specialise in meeting the needs of students with disabilities (ISCA
2003).
For the independent sector, as a whole, 63 percent of schools’ income was from private
sources and 37 percent from government sources in the 2000-01 financial year.
Government expenditure per student in independent schools was, on average, some 48
percent of that for students attending government schools (ISCA 2003).
Independent high schools, as a whole, charge considerably higher fees for students than
Catholic systemic schools. While the average level of fees and donations in Catholic
schools is $1241 per pupil per annum, the amount and range of fees is much higher in
independent schools. For example, the Illawarra Christian School in 2000 charged fees

74
ranging from $2030 for a single child to $3215 (for a family of four) depending on the year,
while Sydney Grammar School had fees ranging from $11910 to $12375 for a single child,
depending on the year (Wilton 2000). When it is considered that the total expenditure from
all sources of funds per student in public schools in NSW was $6907 per annum in 2000
(Table 3.3), these fees and government funding provide the wealthier independent schools
with the greatest level of income. The larger capacity the school has to charge fees the
higher the wages the school can offer to attract staff or alternatively the greater the number
of teachers that they can afford to employ, or a combination of both. The higher relative
income compared to public and Catholic schools, also allows independent schools, overall,
to have the smaller student/teacher ratios and class sizes.
The demand for teachers by independent schools can also be affected by the religious
denomination and attitude of the governing authority. Unlike the strong structure of the
diocesan Catholic education offices, the independent schools are a loose association of
schools in regard to policies on employing individual teachers. Many of the religiously
affiliated schools do have religious criteria for employment and require a local minister of
religion as a referee. At times, ministers of religion may also be involved on interviewing
panels. This restricts the demand for some categories of teachers but increases the demand
for others. The only major employer of high school teachers in NSW that cannot
discriminate on religious grounds is the NSW Department of Education and Training.
The demand for teachers by independent schools also differs in regard to the expectation of
the teacher to be involved in weekend or other out of school hours sporting, activities, or
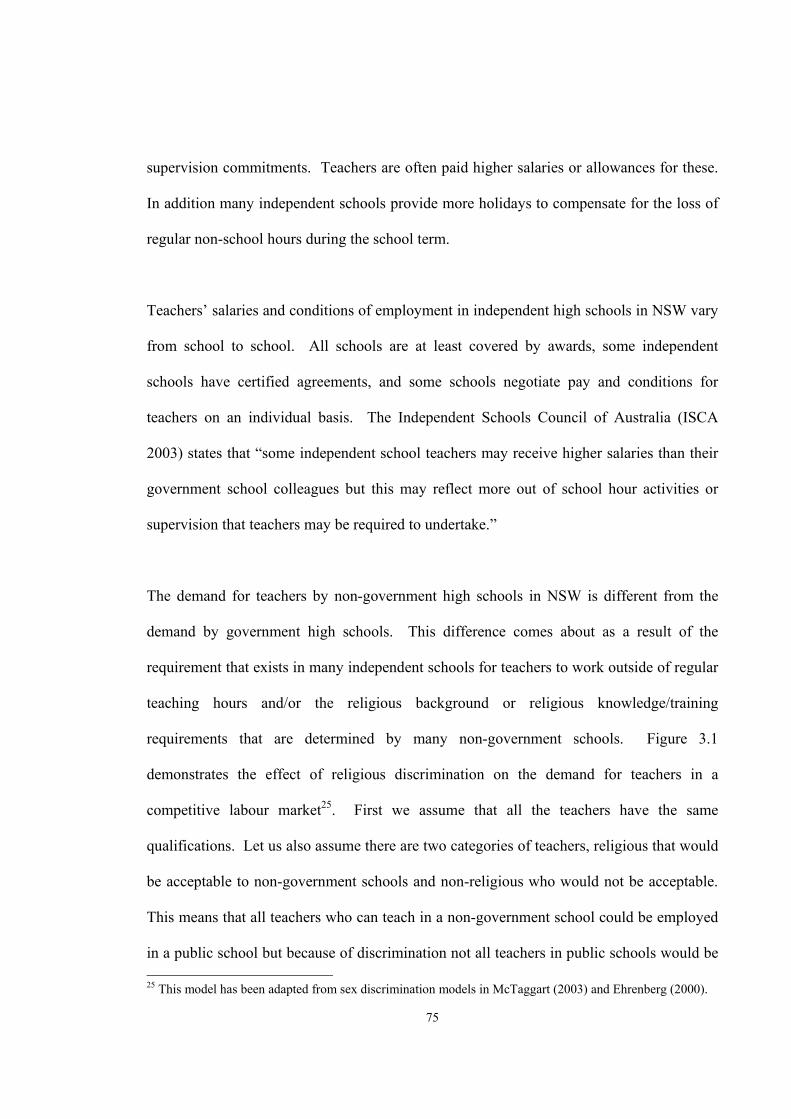
75
supervision commitments. Teachers are often paid higher salaries or allowances for these.
In addition many independent schools provide more holidays to compensate for the loss of
regular non-school hours during the school term.
Teachers’ salaries and conditions of employment in independent high schools in NSW vary
from school to school. All schools are at least covered by awards, some independent
schools have certified agreements, and some schools negotiate pay and conditions for
teachers on an individual basis. The Independent Schools Council of Australia (ISCA
2003) states that “some independent school teachers may receive higher salaries than their
government school colleagues but this may reflect more out of school hour activities or
supervision that teachers may be required to undertake.”
The demand for teachers by non-government high schools in NSW is different from the
demand by government high schools. This difference comes about as a result of the
requirement that exists in many independent schools for teachers to work outside of regular
teaching hours and/or the religious background or religious knowledge/training
requirements that are determined by many non-government schools. Figure 3.1
demonstrates the effect of religious discrimination on the demand for teachers in a
competitive labour market25. First we assume that all the teachers have the same
qualifications. Let us also assume there are two categories of teachers, religious that would
be acceptable to non-government schools and non-religious who would not be acceptable.
This means that all teachers who can teach in a non-government school could be employed
in a public school but because of discrimination not all teachers in public schools would be 25 This model has been adapted from sex discrimination models in McTaggart (2003) and Ehrenberg (2000).
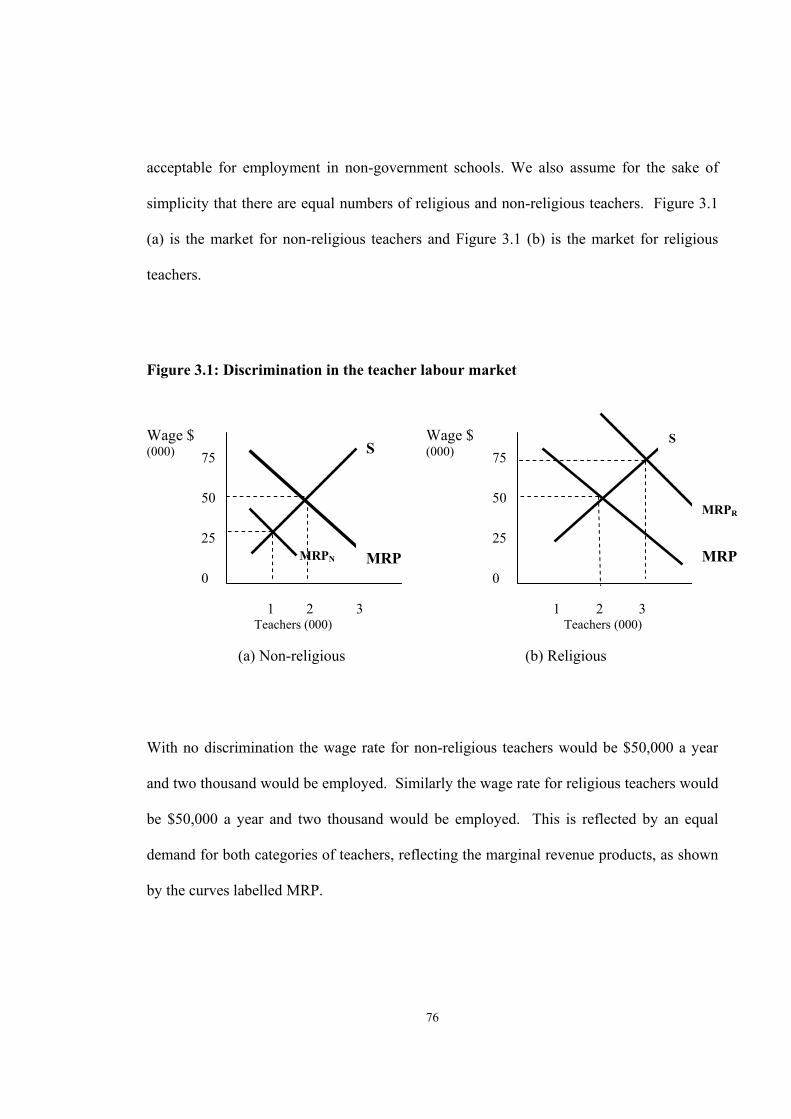
76
75 50 25 0
75 50 25 0
1 2 3 1 2 3 Teachers (000) Teachers (000) (a) Non-religious (b) Religious
acceptable for employment in non-government schools. We also assume for the sake of
simplicity that there are equal numbers of religious and non-religious teachers. Figure 3.1
(a) is the market for non-religious teachers and Figure 3.1 (b) is the market for religious
teachers.
Figure 3.1: Discrimination in the teacher labour market
Wage $ Wage $ (000) (000)
MRPN
With no discrimination the wage rate for non-religious teachers would be $50,000 a year
and two thousand would be employed. Similarly the wage rate for religious teachers would
be $50,000 a year and two thousand would be employed. This is reflected by an equal
demand for both categories of teachers, reflecting the marginal revenue products, as shown
by the curves labelled MRP.
S
MRP
MRPR
MRP
S

77
With discrimination the non-government schools will not employ non-religious staff and
the demand for non-religious staff will fall from MRP to MRPN in Figure 3.1 (a). The
wage rate for the non-religious teachers would fall to $25,000 and only 1000 teachers
would be employed. The demand for religious staff will increase and the demand curve
will shift to the right in Figure 3.1 (b) from MRP to MRPR. This will increase the wage for
religious teachers from $50,000 to $75,000 and the number employed from 2000 to 3000.
The discrimination model concludes that the favoured group, the religious group or others,
who are prepared to trade-off higher wages for loss of leisure for school weekend sport
commitments, etc., should receive higher wages than the discriminated group. While this
may be the case in independent schools, where higher wages can be paid because of the
higher income the schools receive, this is not the case for Catholic systemic schools. The
Catholic schools are effectively restricted to paying the wages offered to public high school
teachers or employing fewer staff and increasing student teacher ratios further. Another
possibility is that teachers employed in Catholic systemic schools in NSW are a lower
quality than those employed in other schools. The available evidence points out that the
opposite is true in comparison to teachers employed in government schools. The Quality
Teaching Survey (Commonwealth Quality Teacher Programme 2001) showed that teachers
in Catholic schools had overall higher qualifications than government school teachers but
lower than teachers in independent schools (Table 3.4). In addition to this, Catholic school
teachers were the largest group upgrading and furthering their qualifications. In total, 19.4
percent of Catholic teachers were currently enrolled in another formal course, compared to
10.1 percent for government school teachers and 13.9 percent for independent school
78
teachers (Commonwealth Quality Teacher Programme 2001). This result could reflect the
willingness of the CEOs to support religious education training by time release and funding
and/or the requirement to complete religious education qualifications as part of the Catholic
school teachers’ employment conditions or for promotion.
Table 3.4: Highest Formal Qualifications of Teachers in Australia, by School System
2001
Highest qualification Percentage of respondents
Government schools
Catholic schools
Independent schools
Certificate/diploma 19.2 23.2 13.3 10.3 Bachelor degree 42.9 43.0 45.0 43.0 Postgraduate diploma 28.1 26.6 30.0 28.1 Masters degree 9.3 7.0 11.5 16.0 Doctorate 0.5 0.2 0.2 2.2 Source: Commonwealth Quality Teacher Programme 2001
Offering higher wages relative to public school teachers is probably not an option for the
Catholic system considering the possible flow on effect that could occur and again the
restoration to the same wage structure. The question becomes how can Catholic systemic
schools attract sufficient of the discriminated teachers when their wage rates are the same
as in public schools? The answer must be the non-wage amenities that the Catholic
systemic system must provide, that are considered more favourable to some teachers than
that found in public schools. This situation can be demonstrated in Figure 3.2. Indifference
curve I2 demonstrates a higher level of worker satisfaction (utility) than indifference curve
I1. The discrimination model would suggest that the favoured teachers would be paid wage
rate WC and the discriminated teachers should be paid the lower wage WP. Public high
school teachers should be paid WP and the non-government high school teachers, WC. The

79
A1 A2
favoured teachers would increase their utility from I1 to I2. Wage level WC is not a
satisfactory outcome for the diocesan Catholic education offices, as they can only afford to
pay wage rate WP. The favoured teachers are capable of achieving higher utility on
indifference curve I2. If the wage rate is WP for public and Catholic systemic high school
teachers, then the only way the favoured teachers can achieve the higher level of utility is if
nonwage amenities are greater for the Catholic systemic high school teachers than the
public high school teachers. This implies that the levels of nonwage amenities are A1 in
public high schools and A2 in Catholic systemic high schools. This proposition will be
examined in Chapter 5 of this thesis.
Figure 3.2: An indifference map for wages and nonwage amenities
WC
Wage
Rate WP
Research in the USA (NCES 1996) has already demonstrated that teachers in US Catholic
schools were actual paid less than the public school teachers but continued to teach in
Catholic schools and had higher levels of teacher satisfaction than the public school
teachers (Tables 1.1 and 1.6).
Nonwage Amenities
I2 I1

80
3.4 What are the Trends in the Demand for High School Teachers in NSW?
In the period from 1984 to 2002 the total number of teachers employed in NSW high
schools increased by just over 20 percent or approximately one percent per annum from
31,952 to 38,447 (Figure 3.3).
Figure 3.3: Number of teaching staff in NSW high schools, 1984-200226
0
5000
10000
15000
20000
25000
30000
35000
40000
45000
1984 1986 1988 1990 1992 1994 1996 1998 2000 2002
Years
Teac
hers Government
Non-governmentAll Schools
Source: Australian Bureau of Statistics, Schools Australia, Cat. No. 4221.0.
In contrast, the total employment of teachers in NSW public high schools has remained
fairly constant over the 18 years. The growth in demand has only been 2.2 percent over the
period, or 0.1 percent per annum. Government high school teacher numbers rose from
23,844 in 1984 to 24,372 in 2002. The substantial growth in demand for high school
26 The teacher numbers are measured as full-time equivalent teaching staff.
81
teachers has occurred in the non-government sector with teacher numbers increasing 73.6
percent in the period from 8,108 to 14,075 or at approximately four percent per annum.
While the overall demand for high school teachers in NSW is fairly predictable and stable,
there is also the need to consider the demand for replacement teachers and new teachers as
these are less predictable. ‘Replacement demand’ arises as a result of teachers resigning,
retiring or taking leave. These departing teachers, who reduce the available supply and as a
result increase the quantity of replacement teachers required, are referred to technically as
total separations (MCEETYA 2001). The total separations in NSW public high schools
have risen from 3.6 percent of the workforce in 1996 to 4.7 percent in 1999. There is no
available data for Catholic systemic schools or independent schools. The CESCEO
National Teacher Supply and Demand Working Party (MCEETYA 2001) classify the main
categories of (gross) separation as:
• age retirement;
• resignations which include:
• leaving teaching;
• leaving to take up a position in another teaching jurisdiction or overseas;
• leaving but intends to continue as a relief, casual or emergency teacher;
• leaving the workforce to travel, look after children, etc;
• leaving for personal reasons;
• taking a voluntary separation package; and
• leaving for other reasons.
• redundancy;
• contract expired (and not renewed);

82
• going on extended leave of at least one term duration; and
• other.
3.4.1 Age Retirement Age retirement depends on the age distribution of teachers, their retirement intentions, and
superannuation arrangements. Table 3.5 provides data on retirement, resignations, and
other forms of separations (other than leave of absence) for permanent teachers in
government high schools in Australia. The data shows that retirements have not been as
important a reason for separations among the teaching profession as resignations. This
relationship could change in the future because of the rapid ageing of the teaching
workforce. In 1991, 3.9 percent of schoolteachers in Australia were 55 years of age and
over, by 2001 this percentage had risen to 10.2 percent (Figure 3.4). Similarly the
percentage of teachers in the 50-54 age bracket has risen from 6.7 percent in 1991 to 13.4
percent in 2001, with the largest group of teachers progressing from the 35-39 age bracket
in 1991 to the 45-49 age bracket in 2001. In March 2002, 48 percent of the teachers
working in public high schools in NSW were 45 years of age or older (DET 2002).
Table 3.5: Separations (Other than through Leave of Absence) from the Government
Permanent Teaching Workforce in Australian High Schools, as a
Percentage of that Workforce, 1996 and 1999
Reason for the separation 1996 1999 Retirement 0.8 1.1 Resignation 2.5 2.9 Other27 0.7 0.6 Total 4.0 4.7 Source: DETYA 2000 27 The ‘other’ category includes deaths, retrenchments, dismissals, and transfers to the Public Service.

83
Figure 3.4: Age of school teachers in Australia, 1991 and 2001
0
5
10
15
20
25
24 and under
25-29
30-34
35-39
40-44
45-49
50-54
55 and over
Age in years
%
19912001
Source: ABS data available on request, Labour Force Survey, 2003.
While there is no specific data available on separations in non-government high schools in
NSW, the number of years of experience of teachers in Catholic systemic schools and
congregational schools would also suggest an ageing teaching workforce. The Catholic
Education Commission in NSW does not collect data on the age of their teachers only their
years of experience. Figure 3.5 shows the pattern of an increasing proportion of teachers in
Catholic systemic and congregational schools with 21 or more years experience in teaching.
Allowing that the teachers could have began teaching at an age of 21 or 22; this would
imply at least 33 percent of the teachers would be over the age of 42 in 2002. While this is
considerably lower than the figure for government high school teachers, the use of years of
teaching experience would give a lower figure than age, for teachers who left teaching for
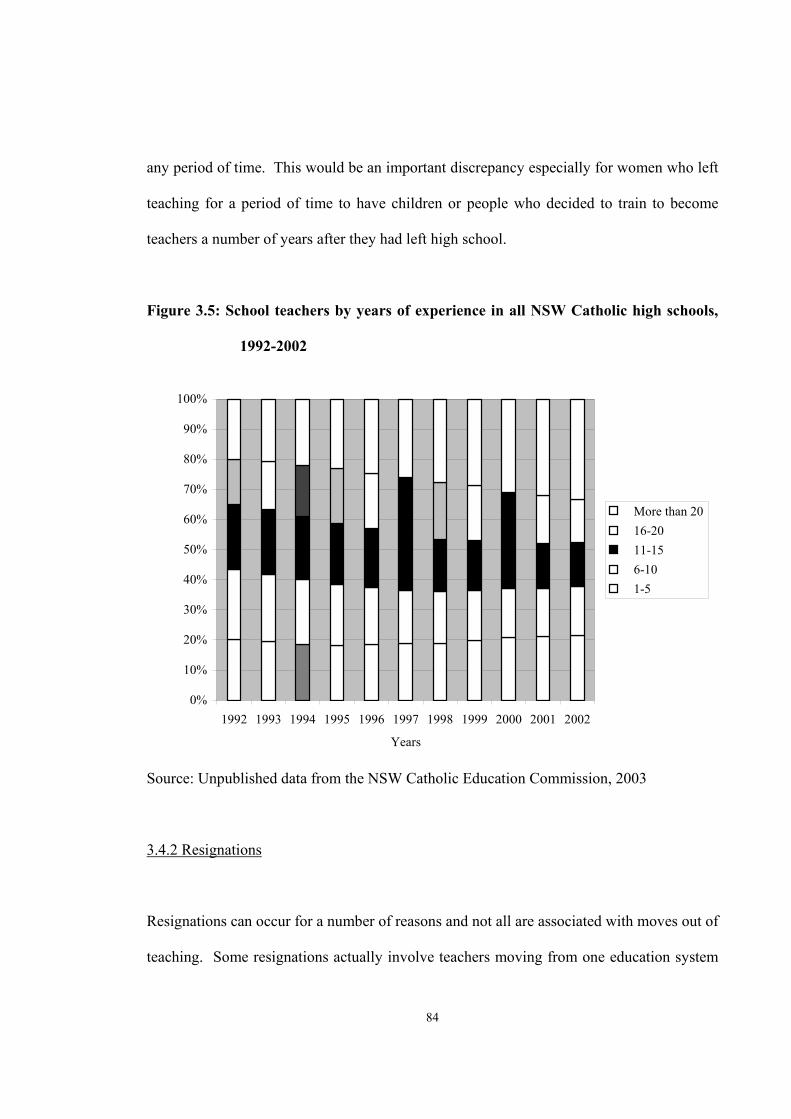
84
any period of time. This would be an important discrepancy especially for women who left
teaching for a period of time to have children or people who decided to train to become
teachers a number of years after they had left high school.
Figure 3.5: School teachers by years of experience in all NSW Catholic high schools,
1992-2002
0%
10%
20%
30%
40%
50%
60%
70%
80%
90%
100%
1992 1993 1994 1995 1996 1997 1998 1999 2000 2001 2002
Years
More than 20 16-20 11-15 6-10 1-5
Source: Unpublished data from the NSW Catholic Education Commission, 2003
3.4.2 Resignations
Resignations can occur for a number of reasons and not all are associated with moves out of
teaching. Some resignations actually involve teachers moving from one education system

85
to another or from one state to another, or as a result of the developing global teacher
shortage, from one country to another. Research indicates that resignations out of teaching
are affected significantly by the state of the economy and the characteristics of the teaching
labour force, such as the age structure. During the recession of the early 1990s resignations
fell and according to Burke (1994) this was largely due to the reduced opportunities for
other employment in the labour market. As a result, other teachers, who may have wished
to take some time off teaching with the intention of re-entering at a later date, may be
deterred from doing so, knowing that in the future opportunities for re-entering may be
curtailed, if fewer teachers resign.
Burke (1994) also concludes that resignation rates tend to rise when the general labour
market conditions, such as low unemployment rates, favour job seekers. There are also
indications that resignations are more common for younger male teachers in the early part
of their careers, especially in the first four years, compared to teachers over 35 years old.
Department of Education figures, obtained by the Sydney Morning Herald (Wainwright
2001), show that there is a leakage from the system of teachers aged between their mid-
twenties and thirties, who are resigning at twice the rate of any other age group. More than
five percent of teachers aged between 25 and 29 resigned in 2000, compared with an
average of 2.1 percent across all age brackets. This supports data from the NSW DET
(2002) that in 2001 the resignation rate of NSW government high school teachers was
almost four times as large in their first four years of teaching as in their fourth to twelfth
year of teaching.

86
After teachers have reached a reasonable level of seniority in the school system they may
find it more difficult to secure jobs with similar pay and conditions outside teaching. They
may have to start their new career at a lower level of salary and conditions. Exiting teachers
may also have to undergo retraining and pay for further study to upgrade their
qualifications. In addition, teachers may not wish to relinquish superannuation benefits
they have accrued. This is especially the case for teachers who were employed in
government high schools under the State Superannuation Scheme (SSS) that applied to
teachers joining the profession prior to June 1985 (NSW Government 2000). The SSS is a
defined benefit scheme, subsidised by the Department of Education and Training. The
benefit on retirement is directly related to the teacher’s salary on retirement. Normal
retirement age is 60 except for female members who elected on joining to retire at age 55
and, as a result, contributed at a higher rate to provide for this earlier retirement. Teachers
who have joined since June 1985 have a more flexible superannuation scheme. First State
Super is the fund that covers teachers who have joined since the early 1990s. This has
greater flexibility and allows members to rollover their funds, if they leave the public
teaching service. This scheme has a lower cost to teachers who leave the teaching
profession compared to the older SSS model. As a result those who are covered by the SSS
model (mostly 40 years or older) are less likely to resign from the NSW public school
system, because of superannuation, compared to teachers under 35 years old. It is possible,
however, that resignation rates may increase in the future, as these teachers with a more
flexible superannuation scheme get older.

87
3.4.3 Redundancy MCEETYA (2001) found that redundancy had played only a small part in teacher
separations in recent years and then only in some states.
3.4.4 Contract Expired (and Not Renewed)
MCEETYA (2001) reported that contract teachers comprise a significant part of the
teaching workforce in some states, like Victoria and Western Australia, where contract
teaching has been an established institutional arrangement especially for new teachers. In
these instances, contract teachers were used both to fill in for teachers going on leave and to
occupy an ongoing position. However, in most states, including NSW, only teachers going
on leave are backfilled from the casual teaching labour force. These casual teachers may be
employed on contract for the period of the break or, most often, as a casual for the entire
period. In NSW high schools there is greater use of ongoing contracts for reasons other
than casual vacancies for teachers in independent schools, than for public or Catholic
systemic schools.
3.4.5 Going on Extended Leave of at Least One Term Duration Leave is provided to teachers for a variety of purposes. In NSW high schools the main
types of leave are in the categories of long service, family, sickness, carers, study, and
maternity leave. The types of leave and their availability vary from system to system. One
important reason for taking leave among the female teaching workforce is to look after
children while they are still young and not at school. While the statutory entitlement for

88
maternity leave is one year in NSW, teachers may leave teaching, often for periods ranging
from five to seven years, to have and look after children, with the intention of returning to
teaching. While there was no available data for NSW schools, Queensland provided
MCEETYA (2001) data that showed that maternity leave accounted for around 40 percent
of extended leave taking in recent years.
It was reported to MCEETYA (2001) that during 1999, 8.3 percent of the permanent
workforce in the government secondary sector took leave lasting at least one term. This
was considerably higher than the exit rate due to retirements, resignations, and other non-
leave related separations. Leave for a year or more has often represented the bulk (half or
more) of total gross separations.
3.4.6 Other The other category includes deaths, retrenchments, dismissals, and net transfers to the
Public Service. Teachers in Catholic schools may also be recruited to work as
administrators and advisers in the Catholic Education Offices. A relatively small number
of teachers move back and forth between administration and teaching in each of the
systems. The total of the ‘other’ category is not a significant proportion of separations.
The most relevant measure of the demand for additional teachers in a particular year is the
net separation rate. The net separation rate is the difference between the numbers leaving
the teaching force minus the numbers returning or re-entering the teaching force as a
percentage of the total teacher work force. There are no exact figures on net separation rates

89
only estimates and projections. Even in the government high school sector, where there is
some data available, this only produces an estimate of net separations for government high
schools. Some teachers who have left the public school system could have entered the non-
government school sector and visa versa. As a result you cannot calculate the total number
of teacher separations by just adding up the separations for each of the three school
systems, as there would be some double counting.
The findings of the DETYA 2000 survey suggest that typically in the government sector
around eight percent of teachers go on leave each year. However, while some teachers go
on leave others return. It can be expected that some teachers going on leave will resign
while they are on leave, so that there will be a net loss of teachers through this process.
Data from the states and territories indicates that separations arising from (net) leave
movements have been in the vicinity of two percent a year.
Resignation rates fluctuate over the business cycle and across states, with the rate being
somewhere between two and four percent a year. A commonly accepted average
resignation rate in high schools throughout Australia is just over two percent a year. In the
1990s retirements are estimated to be have been just below one percent a year and reached
one percent in 1999. Results from the DETYA 2000 survey and other analyses (NSW
Department of Education and Training 2002, Preston 2000) suggest retirements are likely
to rise in the future as baby boomers start to retire. This data suggests that exits from
teaching through leave, retirements and resignations can amount to typically between eight
and eleven percent a year within the government school system. When teachers returning
90
from leave are taken into account, however, the estimate for net separations from the
government school system falls to typically around five to seven percent a year.
The Catholic Education Commission in NSW does not collect data on new entrants or exits
from their teacher work force. However, there has been an increasing number of first year
teachers employed by the system. First year teachers have risen from 3.1 percent of the
Catholic high school teachers in NSW in 1994 to 4.4 percent in 2001. The Catholic
Education Commission in NSW ceased to collect this data after this time “partly because of
changes to the privacy legislation and partly because the data was unreliable.” (McKinnon
2003) These figures cannot be interpreted as the net separation rate as it forms only part of
this rate, but it shows a trend of an increase in demand for new teachers in Catholic high
schools. There is no available data from the remainder of the non-government school
sector in NSW. Preston (2000) has estimated the net separation rate in NSW high schools
overall to be approximately 3.3 percent in 2000, but rising by 0.2 percentage points a year
after that, at least till 2005, largely due to increasing age retirements.
3.5 Conclusion While the overall demand for teachers is fairly predictable and consistent, the level of new
teachers required each year is not. The demand for teachers is related to the cumulative
demand of the three school systems that operate in NSW. Making accurate predictions or
projections of the demand for teachers is not possible without this cumulative result. The
DET does have information on a wide variety of teacher separation factors that influence
replacement demand but the same cannot be said for the non-government sector. This lack
91
of information makes the projections largely unreliable as teachers can move back and forth
within the three systems over time. There needs to be a central registry of data for all
schools in NSW that will include teacher numbers dealing with various aspects of net
teacher separations, including age, resignations, and leave. This will allow the Government
and other education providers to develop policies that may ensure that the quantity supplied
of available teachers will be suitable to the quantity demanded.

92
Chapter 4. The Supply of High School Teachers in New South Wales
Most of the annual requirement for teachers in NSW high schools is supplied from
previously employed teachers who return at the start of each year. The analysis in this
chapter examines the sources of additional (or new) teachers to cover separations and any
net increase in demand for teachers.
4.1 The Factors Influencing the Overall Supply of Teachers in NSW High Schools
The principal sources for additional teachers in NSW high schools are:
• new graduates;
• teachers returning from leave;
• former teachers returning to teaching;
• the pool of trained teachers who are not employed full-time as teachers; and
• teachers who have moved into NSW from another state or from overseas.
It should be noted that this supply of teachers is generally available for employment in both
the government and non-government sectors.
4.1.1 New Graduates
Until recently there have been two main sources of new graduate teachers. First, there was
a four year undergraduate degree in initial teacher training such as a Bachelor of Education
or a combined Bachelor of Teaching or Education with another degree. The second was a
one or two year graduate diploma in teaching (generally called a Graduate Diploma of
Education), following completion of an undergraduate degree in an area without teaching

93
or education qualifications, such as Science, Economics, or Arts. An additional source of
trained teachers in particular subject areas in NSW high schools involves the Accelerated
Teacher Training Program. Skilled workers from industry28 are supported by the NSW
Department of Education and Training (DET) to help them obtain teacher qualifications in
Mathematics, Science and Technology and Applied Studies (TAS), through an 18-month
university Accelerated Teacher Training Program, which recognises work skills and
industry experience. The program pays for tuition and course administration costs,
provides a $1500 training allowance and guaranteed employment as a teacher at NSW
public schools in non-coastal areas and Sydney's west and south-west. In 2002, 147
training places were offered to applicants in the following teacher training areas: Industrial
Arts (66), Computing (26), Mathematics (23), Food Technology (15), Physics (9) and
Agriculture (8) (NSW Department of Education and Training 2002).
According to the NSW Education Minister John Watkins’ media release, (NSW
Department of Education and Training 2002) the people being fast-tracked as teachers
include:
• A senior IT manager, who wants a more fulfilling job, will teach Physics.
• A motor mechanic, with extensive involvement in community projects, will become
an Industrial Arts teacher.
28 Admission to the program is based on the assessment of qualifications and industry experience. TAS applicants require a minimum trade certificate III (or equivalent), an indentured trade, evidence of ongoing study and 3-5 years related industry experience. The prior learning for Mathematics and Science would be in the form of a TAFE diploma or part degree and professional experience and/or a degree in a related field. Entry requirements must be equivalent to at least two years Recognised Prior Learning (RPL) (NSW Department of Education and Training 2002).

94
• A catering manager for a very large organisation will retrain to teach Food
Technology.
• An industrial chemist and engineering manager will be trained to teach Physics.
The NSW DET also has a number of retraining strategies to secure ‘experienced and
qualified’ teachers to work in areas of NSW with a staffing need in specialist teaching
areas. The priorities in 2002-03 were for retraining in the curriculum areas of TAS,
Mathematics, and Science, especially Physics (NSW Department of Education and Training
2002). While this retaining does not change the total supply of teachers it does increase the
number of ‘new’ teachers in a particular subject area. This ‘fast track’ training of teachers
raises the issue of teacher quality which will be discussed later in this chapter.
The Commonwealth Department of Education, Science and Training (DEST) (2003)
reported that while the overall number of people graduating from universities in Australia
increased over the decade to 2001, the number of people completing a university
qualification in the field of teacher education decreased by 13 percent to 19,400 in 2001.
Three-quarters of the students who completed university courses in 2001 in the field of
teacher education were women. Similar patterns occur in the number of people
commencing and continuing study in teacher education courses. In 2002, there were
72,400 people studying a university course in the field of teacher education, including
30,900 people who commenced in 2002. Almost three-quarters of these students were
women. From 1983 to 2000 the proportion of higher education students studying

95
Education declined from 21.3 percent to 10.6 percent. Across Australia the actual number
of Education students fell from 74,314 in 1983 to 73,680 in 2000. While the number of
female students studying Education increased over the period by 13.8 percent, the number
of male students declined by 28.8 percent (DEST 2003).
In New South Wales, 12 institutions - 11 universities and the Seventh Day Adventist
Avondale College, provide teacher education. The total numbers of secondary teacher
training commencements and completions, covering undergraduate courses and graduate
diploma courses (referred to as postgraduate courses hereafter) have fluctuated
considerably in NSW. This is shown in Figure 4.1 for the period 1988 to 1999 (DETYA
2000).
Total commencements fell from 1989 to 1992 but have been rising steadily since then so
that towards the end of the 1990s they were slightly above the levels at the beginning of the
decade. This is reflected, with a lag, in the rising levels of completions since around 1992.
The exact time of the lag varies with the level of teacher training. For undergraduates it is
at least four years and for postgraduates generally one year. The ratio of secondary trainee
teacher commencements to completions in NSW averaged 71.7 percent over the period.

96
Figure 4.1: Total commencements of and completions from secondary teacher
training courses in New South Wales, 1988 to 1999
0
500
1000
1500
2000
2500
1988 1990 1992 1994 1996 1998
Years
Num
bers
CommencementsCompletions
Source: DETYA 2000
Another important trend has been the increase in the number of commencing postgraduate
students in secondary teaching courses in NSW and the decline in undergraduate
commencing students, as shown in Figure 4.2. From a low of 5.7 percent of the total
secondary trainee teacher commencements in 1990, postgraduate commencements rose to
overtake undergraduate commencements in 1998, comprising 50.4% of total
commencements. This trend makes projections of the number of teacher completions over
a period of two to four years more unreliable because of the shorter training lag for
postgraduates.
As can be seen from Figure 4.1 the total number of secondary trainee teacher
commencements is not as volatile as the individual components shown in Figure 4.2.

97
Whether this is just a change of student preferences to a broader degree followed by
postgraduate Education qualification, instead of just a specialist Education qualification, or
greater volatility in both groups is unclear. If the result were independent of a change of
preferences, then projections of the number of secondary trainee teacher commencements
and completions would be more difficult to make. DETYA (2000) projections for 1999-
2003 show that completions may vary from year to year for secondary teachers in NSW by
up to 180 teachers or over 14 percent during the period, as shown in Table 4.1.
Figure 4.2: Commencements of postgraduate and undergraduate secondary teacher
training courses in NSW, 1989 to 1999
0
200
400
600
800
1000
1200
1400
1600
1800
1989 1990 1991 1992 1993 1994 1995 1996 1997 1998 1999
Years
Num
bers
UndergraduatePostgraduate
Source: DETYA 2000

98
Table 4.1 Projections of Total Completions from Secondary Teacher Training
Courses in NSW, 1999 to 2003
Year Projection of completions 1999 1409 2000 1361 2001 1492 2002 1372 2003 1552
Source: DETYA 2000 It is important to note that not all graduating Education students become teachers, so the
actual numbers who are available to work as teachers are lower than the completion
numbers. Data from the Graduate Destination Survey conducted by the Graduate Careers
Council of Australia (GCCA) indicates that most but not all teaching graduates go into the
labour market immediately after graduating. The 2002 study (Graduate Careers Council of
Australia 2002) based on students who graduated in 2001, showed that 83.3 percent of
Education graduates with an initial bachelors degree (available for full-time employment)
and 86.7 percent with postgraduate Education qualifications were in full-time employment,
across Australia. The remaining 16.7 percent of Education graduates with an initial
bachelors degree and 13.3 percent with postgraduate Education qualifications, who were
seeking full-time employment, were working part-time or casual or unemployed. Of the
Graduate Survey respondents 8.5 percent of Education graduates with an initial bachelors
degree and 4.7 percent with postgraduate Education qualifications were not seeking full-
time employment but were undertaking further study. This effectively delays their entry
into the labour market, some by a year and others (e.g. Masters and PhD students) for
longer. Only 2.9 percent of Education graduates with an initial bachelors degree and 5.0
99
percent with postgraduate Education qualifications were seeking full-time employment and
not working. The Graduate Survey data for NSW shows that 82.2 percent of graduates
with an initial bachelors degree in Education and 84.5 percent with postgraduate Education
qualifications, seeking full-time employment, were in full-time employment. The
remaining 17.8 percent of Education graduates with an initial bachelors degree and 15.5
percent with postgraduate Education qualifications, who were seeking full-time
employment, were working part-time or casual or unemployed. Of the Graduate Survey
respondents from NSW 11.0 percent of Education graduates with an initial bachelors
degree and 4.4 percent with postgraduate Education qualifications were not seeking full-
time employment but were undertaking further study. The Graduate Destination Survey
gathers information about the job obtained and reported that across Australia around 85.7
percent of all Education graduates from 2001, in full-time employment, had obtained a job
in teaching. The remainder took up positions in government and the private sector, with the
most popular choice being management and administration with 3.4 percent.
As a result, there are a percentage of Education graduates who do not enter teaching but
find careers in other fields or carry out further study. This contributes to the difficulty of
projecting the number of new Education graduates who will enter the teaching workforce.
In addition the entry of new graduates into teaching does not provide any guarantee of
continuity in this career. This issue will be discussed later in this chapter.
100
4.1.2 Teachers Returning from Leave
The number of teachers going on leave (discussed in Chapter 3) is a factor that influences
the replacement demand for teachers. Their counterparts are teachers who return to the
classroom as permanent, full or part-time teachers after a period of extended leave. This
influences the available supply of teachers. Teachers returning from leave are an important
source of new teachers in the annual intake in all states in Australia. Data provided by the
education authorities throughout Australia to MCEETYA (2001) indicates that around six
percent of the government permanent teacher workforce in 1999 was made up of teachers
returning from leave. The percentages were more or less the same in both the primary and
secondary sectors. In any one year, the number of teachers returning from leave may
exceed or be less than those going on leave. However, over a longer period, it can be
expected that the number of teachers who return is less than the number of teachers who
leave as some teachers resign while on leave. Longer-term data is not available but data
from 1999 from five states and territories29, which were able to provide information on a
consistent basis, indicate that teachers going on leave exceeded those returning. In 1999
almost 25 percent of high school teachers going on leave for one term or more did not
return to teaching at the end of the leave period.
One of the states that was not able to provide data that satisfied the methodological
approach applied by DETYA was NSW. From the NSW data that was available the
29 The states and territories were Victoria, Queensland, South Australia, Western Australia, and the Northern Territory.

101
difference expressed as a percentage of the permanent teaching workforce was around two
percentage points.
In addition to the limitations of suitable data, the number of teachers going on leave and
returning to teaching from leave is likely to vary over time. This also makes it difficult to
develop accurate long run projections of the teacher labour supply.
4.1.3 Former Teachers Returning to Teaching
A second and related group is those teachers who resign and leave teaching altogether, but
after a period of time return to teaching. Some of these teachers may have resigned from
teaching only because they were unable to secure leave of absence long enough for their
needs. To the extent that these teachers intended from the start to return to teaching, they
are akin to those teachers who go on extended leave. Others, however, would have left
with no clear intention of returning to teaching. They may have found that they could not
find other employment or their circumstances have changed. On returning to teaching,
these former teachers re-enter the classroom directly from outside teaching or via the relief
and casual teacher arrangements. Again there is no reliable data on this category of supply.
It is likely though that changes in employment condition may affect the number of people
returning to teaching. Cyclical downturns would tend to increase the number of returns
while a high level of alternative job opportunities may reduce the number. The number of
teaching jobs available and/or changes in conditions of employment could also influence
the likelihood of former teachers returning to the teaching workforce. An oversupply of

102
existing teachers would tend to discourage teachers returning, while improved conditions of
employment could act as an incentive to return to the teaching workforce.
4.1.4 The Pool of Trained Teachers who are not Employed Full-time as Teachers
The high school teacher pool in NSW refers to individuals who are qualified to teach in
NSW high schools that are not currently employed as teachers but are available for
employment in such positions. The pool consists broadly of three groups:
• qualified teachers on waiting lists for casual, part-time and/or full-time
employment;
• relief and casual teachers, who may be available for full-time or additional casual or
part-time employment; and
• contract teachers on less than their desired annual hours of work.
It may also be possible that there are a number of former teachers not currently actively
involved in teaching who may be encouraged to return to teaching, if a suitable position
became available.
New South Wales, Queensland, Western Australia and South Australia are the only states
with a recording system whereby people with teaching qualifications, who are not
employed as teachers, can indicate their interest in teaching and be placed on an
employment list for permanent positions in teaching. In March 2000 there were over
18,000 seeking employment as teachers in New South Wales government schools, which

103
represents over 35 per cent of the permanent teaching workforce (DETYA 2000). While
this may appear to be a substantial and significant reserve of teachers on which to draw, not
all those listed as seeking employment are available to teach in all areas of the State, or
qualified to teach in subjects where there are shortages of teachers. There is also a number
who are employed in Catholic and independent schools and still on the list for government
schools. Others may have full-time employment in non-teaching areas and if they were
offered employment, as teachers, may not accept it. There is considerable evidence that the
number of available teachers, especially in secondary schools in NSW, is much smaller
than on the Departmental list. As early as 1999 the Australia Secondary Principals
Association (ASPA) (Australian Secondary Principals' Association 1999) claimed that the
data was invariably dated, inaccurate and thus unreliable and that there were critical
curriculum areas not even represented. For schools in some hard to staff areas there were
no teachers willing or able to be appointed. In key curriculum areas teachers were
increasingly hard to find, e.g. Mathematics, Technology, Languages other than English
(LOTE), Home Economics, Senior Schooling/Vocational Education and Training (VET),
Music, Teacher Librarians. Replacement teachers that were provided frequently did not
match the vacancies that they were expected to fill. A similar problem existed in the
Catholic system by 2001. Brother Kelvin Canavan (Baird 2001), executive director of
schools for the Archdiocese of Sydney, was reported as saying that a survey of more than
40 Catholic secondary schools in the metropolitan area of Sydney revealed that there were
17 permanent teaching positions still unfilled at the beginning of term two, 2001. In some
instances there were no applicants for the positions. The greatest difficulty was finding
teachers in Mathematics, the Sciences, Computing, Design and Technology, senior English
104
and some languages. The situation was even more severe in regional NSW. The Catholic
year 7-10 school at Glen Innis was forced to close because after advertising in NSW and
Queensland, as well as on the internet, they could not find sufficient staff.
Apart from those on lists for employment as permanent teachers another source of teacher
supply is the pool of relief and casual teachers. Every state and territory has a system of
relief and casual teachers, some of whom are only available for relief work, but others are
available for permanent and/or contract positions. According to the Premier of NSW
(Totaro 2003), Bob Carr, there are 30,000 casual teachers on the Department of Education’s
lists. Yet despite this there was a shortage of casual and relief teachers in government
schools in NSW. The Premier said “unfortunately some principals have had to make up to
60 phone calls, taking several hours, to get a casual teacher”(Totaro 2003).
The lists of number of available teachers in the teaching pool appear to over estimate the
real number of individuals who are willing to work as teachers in NSW. This is especially
the case for locations and subjects with the most need for teachers.
There are an additional two groups that could be added to the supply of teachers and
teachers’ time. These groups include:
• trained teachers who are not actively seeking employment but would be available
to take up teaching if a suitable job were offered to them; and
• trained high school teachers working in other occupations.

105
In 2000 the percentage of Education graduates unemployed was 1.7% (Australian Bureau
of Statistics 2001). This is a relatively small proportion and most of these would be picked
up in the employment lists mentioned above. There is, however, a relatively high number
of Education qualified persons not working as teachers. In 2000, only 48 percent of
Education graduates were working as school teachers and a further six percent were
employed in an associate occupation (Australian Bureau of Statistics 2001). Some of these
graduates were working in teacher-related positions within education organisations, such as
the Board of Studies, the Department of Education and Training and the Catholic schools
offices. Other Education graduates left their employment in high schools and were now
teaching in TAFE and in universities. The ABS report on Australian Social Trends (2001)
states that 28.3 percent of Education graduates were working in occupations that were not
associated with teaching, while a further 16 percent of Education graduates, in the age
range 15-64 years, were not in the labour force at all30. The fact that the proportion of
Education graduates not working as teachers is large suggests that, in principle at least,
there may be some scope for attracting back into teaching some of these former teachers.
As suggested by evidence from the United Kingdom and New Zealand, Straker (1991)
noted that in the United Kingdom it was estimated that “the pool of qualified teachers under
the age of 60 which is currently inactive exceeds the number of teachers who are currently
in teaching posts”. Straker pointed out that in 1989 almost 60 per cent of new
appointments were teachers returning to the profession and that this pool remained a
valuable source of recruitment, provided that updating of skills and knowledge of curricula
could be achieved.
30 This would partly reflect the relatively high proportion of women as school teachers and their family commitments.

106
As shown on the previous page, 52% of individuals with training as school teachers in
Australia do not work as school teachers. There is therefore scope to increase the supply of
teachers by developing policies to attract at least some of this group back into teaching.
4.1.5 Teachers who have Moved into NSW from another State or from Overseas
Interstate movements can be an important source of flexibility in the teacher labour
markets, with surplus teachers from one state or territory helping to overcome shortages in
other areas. MCEETYA (2001) reported that research from the Graduate Destination
Survey of graduates from 1998 showed that around 8.4 per cent of graduates in Australia,
who found employment soon after graduation, moved from the state or territory where they
obtained their qualification. The proportion varied from almost two thirds in the Australian
Capital Territory to less than three per cent in Queensland. In the case of New South
Wales, South Australia and the Australian Capital Territory, during 1999 a greater number
of new teaching graduates left the State/Territory to take up a teaching position than came
into the State/Territory. Most of the New South Wales graduates, who leave the State, go
to Queensland, while most of the ACT graduates, who leave the Territory, go to New South
Wales. Only 34.8 percent of ACT new graduates teach in the Territory and 46.7 percent of
new graduate teachers come from other states and territories. For NSW, 11.8 percent of the
State’s new teacher graduates teach outside of NSW, while the inflow is only 5.3 percent
from other states and territories.

107
It is important to note that these results relate only to the movement of new teaching
graduates. Graduates of previous years and currently employed teachers are not included in
the Graduate Destination Survey. In the case of New South Wales a number of interstate
teachers and interstate teaching graduates of previous years apply for employment with the
Department of Education and Training each year. Once graduates obtain a job, their
mobility declines. Data from the 1996 census, for instance, show that over a five-year
period three to four per cent of all employed teachers moved interstate, but this varied from
one state and territory to another. In the case of New South Wales, 2.6 percent of the high
school teachers came from interstate and 2.5 percent moved interstate, leading to a net gain
of 0.1 percentage points. So overall interstate movements of practicing teachers have a
minimal effect on the supply of high school teachers in NSW.
This absence of any substantial net movement in teachers shows that current wage
differentials between the states and territories does not appear to be a major contributing
factor in teacher movements, although it may have some affect on commencing teachers.
Table 3.1 showed the annual wage levels of initial Education graduates and employment
levels in the states and territories of Australia. In Victoria and the Northern Territory the
local graduates have the highest median salaries, each at $39,000 and full-time employment
rates of 90.0 and 90.9 percent respectively. Despite this, in the five years from 1991 to
1996 Victoria was a net exporter of teachers with a net loss of 1.8 percent of its teachers to
other states and territories (MCEETYA 2001). Tasmania and South Australia have only
slightly lower median annual salaries, $400, and $800 respectively but considerably lower

108
levels of graduate employment, 70.6, and 74.9 percent. This suggests a lack of interstate
mobility even for initial Education graduates.
Data from Department of Immigration and Multicultural Affairs (DIMA) (2001), as shown
in Figure 4.3, indicate that, at least in recent years, Australia has been a net gainer of
teachers through the migration process31. However, the net gain has slowed in recent years
and there was a small loss in 1998-99.
Figure 4.3: Annual net migration flow of school teachers in Australia from 1995-96 to
1999-2000
-500
0
500
1,000
1,500
2,000
1995-96 1996-97 1997-98 1998-99 1999-2000
Years
Num
bers
Source: Department of Immigration and Multicultural Affairs 2001
31 Three broad categories of movers are distinguished by DIMA as; those arriving as permanent residents or settlers, net residents and net visitors. Settlers or permanent residents include all those who initially arrive in Australia holding permanent resident visas. They also include New Zealanders where such persons indicate that their stay in Australia is permanent. Once in Australia, however, settlers are regarded for the purposes of this study as part of the overall stock of residents. The second category, net residents, refers to the difference between the number of permanent residents leaving Australia who say that their departure is permanent or long-term and the number who return after a long-term stay overseas. The third category, net visitors, refers to the difference between the number of those who arrive in Australia with a visa allowing them to work, who indicate that their stay is to be for a year or more, and those who leave Australia after a long-term stay of a year or more.

109
Most of the inflow/outflow is associated with Australian residents leaving to go overseas or
returning, the net resident category (see Figure 4.4). The largest net loss of residents
occurred to the UK. This could be explained by a desire of teachers to combine work with
travel. DIMA data suggest that each year around 4000-4600 teachers leave Australia, at
least for a short period of time, to teach overseas with this number increasing in recent
years. Preston (2000), for example, has estimated that around 2000 teachers have been
recruited, while still in Australia, by recruitment agencies for the year 2000-01 northern
hemisphere school year. As a result of this increasing trend in residents leaving for periods
overseas, the previous balance between resident teachers leaving and those returning has
shifted from a net gain of 36 in 1995-96 to a net loss of 1,863 in 1999-2000, as shown in
Figure 4.4.
Figure 4.4: Annual net residents flow of school teachers in Australia from 1995-96 to
1999-2000
-3000-2500-2000-1500-1000
-5000
500
1995-96 1996-97 1997-98 1998-99 1999-2000
Years
Num
bers
Source: Department of Immigration and Multicultural Affairs 2001

110
As a result of the rise in the number of Australian residents leaving to teach overseas, the
positive effect of migration on the teacher labour supply has declined from approximately
1800 extra teachers in 1995-96 to only 800 in 1999-2000. It should also be noted that not
all teachers with overseas qualifications settling in Australia will actually teach in
Australian schools. The various state, territory, and non-government education authorities
may not accept their qualifications, or they may seek other careers once they have settled in
Australia.
4.2 Factors Influencing the Supply of Teachers in Specialisation Classifications
So far the supply of teachers in NSW high schools has been largely examined at an
aggregate level. It is also necessary to break down the aggregate and look at teacher
mobility both in terms of subject areas to be taught and the willingness of teachers to teach
in particular locations. In terms of the supply of teachers available to teach a specific
subject or specialisation, there are a number of issues to be considered. First, what are the
basic qualifications a teacher should have to teach a particular subject? What are the
desirable qualifications a teacher should have to teach that subject? For example, should a
teacher have a major in Physics to be able to teach it or is a first year qualification in
another area of Science an acceptable level? The issues of suitability of qualifications or
the quality of teachers are not always considered when considering the supply of teachers.
A lowering of qualifications or acceptable standards will usually lead to an increase in the
supply of labour. Research by the NCES32 (National Center for Education Statistics 2002),
in the USA, found a relatively high incidence of teachers teaching outside their areas of
32 See for example Bobbitt 1994, Ingersoll 1999, and Neuschatz and McFarling 1999.

111
subject matter training and certification, referred to as ‘out-of-field’ teaching. While there
is no specific data available on this for NSW high schools, the DET, the Catholic Schools
Commission, and independent school principals have all expressed concern about the
difficulty of finding teachers in particular fields of study. As early as 2000 the NSW DET
had reported to Ministerial Council on Education, Employment, Training and Youth Affairs
(MCEETYA 2001) that shortages had been experienced in Technological and Applied
Studies (which includes Computing), Mathematics, and Science. The NSW DET also
reported that an oversupply existed for recent graduates in some subject areas, especially
Creative and Performing Arts, Personal Development, Health, and Physical Education. The
Catholic Education Commission and regional Catholic Education Offices reported
shortages to MCEETYA in Science, Mathematics, Technological and Applied Studies, and
Computing. According to McMullen (2002), Head of Secondary Curriculum, Sydney
Catholic Education Office, apart from these subjects principals are increasingly reporting
difficulties finding quality teachers for English, the Humanities, and Languages. He also
expressed concern about the future of Vocational Education and Training (VET) subjects as
they were limited by ... “schools’ abilities to find teachers qualified according to the
increasingly stringent guidelines, especially in courses that are technology based.” The
National and State Skill Shortage Lists Australia – 2003 (DEWR 2003) reported a state-
wide shortage in NSW of teachers in the following teaching areas:
• Manual Arts/Tech Studies;
• Maths;
• Physics/Chemistry; and

112
• General Science.
In most cases classes in these teaching areas, which are not taken by specialists in the field,
would be taken by ‘out-of-field’ teachers. In a worse case scenario as reported in the
Vinson Report on Public Education in NSW (2002: xii), students would be instructed to ...
“go to the front lawn,” and grouped with other students for minding rather than formally
being taught.
The issue of teachers having few or no qualifications in subjects that they are teaching is
quite important. There is considerable evidence that teachers' knowledge and ability are
associated with student learning in the classroom. A 1992 study in the USA (Hanushek,
Gomes-Neto, and Harbison, as cited in Monk 1994) used measures of teachers' subject
matter knowledge and student learning gains, and found a positive relationship between
how much teachers knew about the subject taught and their students' learning gains in that
subject. In a 1994 analysis of student performance and the Science and Mathematics
subject matter preparation of their teachers, Monk reported a positive relationship between
student gains in performance and the number of courses their teachers had taken in the
subject taught. Other research in the USA by Goldhaber and Brewer (1997) that analysed
the quality of teachers' postsecondary degrees and students' Mathematics performance
found a positive relationship between these variables, with higher levels of performance
among students whose teachers held a bachelors or masters degree in Mathematics than
among students whose teachers were out-of-field. In 2000, Goldhaber and Brewer
examined data on the postsecondary degrees and certification status of teachers and their

113
students' performance in Mathematics and Science. They observed a positive relationship
between teachers' degrees and student performance in Mathematics consistent with earlier
findings. They also found that students whose teachers were certified in Mathematics but
did not hold a postsecondary degree in Mathematics did not perform as well as students
whose teachers held a postsecondary degree in Mathematics.
While a partly trained Mathematics teacher might be better than no Mathematics teacher at
all, these results call into question the ‘quick fix’ policy of the accelerated teacher training
program33. The program may provide more teachers in the areas of shortage but the
qualifications of the teachers may be lower and thus a lower level of student achievement
could result.
4.3 Factors Influencing Supply by Geographic Location
Geographical mobility is the second issue relating to teacher supply. Positions in some
school locations are more difficult to fill than others. In NSW high schools, the main
concerns relate to rural and remote schools and schools in particular areas of the Sydney
metropolitan region. According to Bladen (2001), A/Director of Training and
Development, the NSW DET Mathematics, and Science Retaining Programs were set up
with the “aim to recruit and retrain teachers in the area of secondary Mathematics and
secondary Science to address a shortfall particularly in the southwestern and western areas
of Sydney and non-coastal NSW”. The NSW DET also recognises the problem of finding
33Skilled workers from industry are supported to help them obtain teacher qualifications in Mathematics, Science and TAS, through an 18-month university Accelerated Teacher Training Program, which recognises work skills and industry experience.

114
staff in particular remote or climatically undesirable areas by paying an allowance to attract
teachers to these areas. According to the Crown Employees Award for teachers, any
teacher that is appointed to a school or campus located in the “Western Division of New
South Wales upon or to the west of a line starting from a point on the right bank of the
Murray River opposite Swan Hill (Victoria), and thence by straight lines passing through
the following towns or localities in the order stated, viz., Conargo, Coleambally, Hay,
Rankins Springs, Marsden, Condobolin, Peak Hill, Nevertire, Gulargambone,
Coonabarabran, Wee Waa, Moree, Warialda, Ashford and Bonshaw” (Industrial Relations
Commission of NSW 2000), can be paid allowances of over $5000 per annum depending
on their personal circumstances34 and location of the school. In addition a teacher
appointed to a school or campus “within a zone of New South Wales established by the 0
Degrees Celsius July Average Minimum Temperature Isotherm as contained in the
Climatic Atlas of Australia, June 1974 as amended, and published by the Bureau of
Meteorology” (Industrial Relations Commission of NSW 2000), can also be paid
allowances of over $5000 per annum depending on their personal circumstances. For
example ABS census data (Australian Bureau of Statistics 2003c) shows that the median
wage for high school teachers in a number of locations in these regions, including, Blayney,
Boorowa, and Jerilderie, is in excess of $1200 per week, compared to $1000 in Sydney.
Despite these benefits teacher shortages still exist in these regions. According to the
Human Rights and Equal Opportunity Commission (HREOC) (2000) there are difficulties
in staffing rural and remote schools in all states and territories in Australia and that these
schools also have a higher staff turnover rate than metropolitan schools. In addition
34 A teacher with a dependent partner is currently paid $150 (01-01-2003) per annum in addition to the basic allowance compared to a teacher without a dependent partner. There is also additional funding for dependent children.
115
HREOC considers that staff retention rates might be an important determinant of the
quality of the education being delivered to rural and remote children. HREOC reported that
recruitment and retention difficulties meant that a disproportionate number of country
teachers are inexperienced and English as a Second Language (ESL), Mathematics, Science
and Information Technology (IT) staffs, in particular, are in short supply. In one
submission from Trangie Central School in NSW to the HREOC, it was stated:
Small rural schools have always had a problem with finding then keeping
specialist staff. A looming teacher shortage will exacerbate the problem;
however, a lack of Maths, Science, and Information Technology teachers has had
an impact in our area already. Consequently in all rural schools you have staff
teaching out of their faculty areas. This cannot be for the overall good of the
student.
Throughout Australia school student retention and completion rates are lower in rural and
remote schools compared to metropolitan schools. Table 4.2 indicates the lower levels of
retention for rural and remote students and, within these groups, the lower levels of
completions for boys compared to girls.

116
Table 4.2 Year 12 Completion Rates by Locality and Gender, Australia, 1994-1998 (%)
Year Urban Rural Remote
Males Females Total Males Females Total Males Females Total 1994 66 76 71 57 71 64 51 65 58 1995 64 75 69 54 70 62 46 59 52 1996 62 72 67 55 72 63 46 65 55 1997 61 71 66 54 70 62 43 62 51 1998 62 73 67 55 71 63 48 61 54 Source: Human Rights and Equal Opportunity Commission 2000: 8 Table 4.2 also shows a decline in all three regional classifications35 in school completion
rates over the period. The decline in completion rates has been greatest in the remote areas
as a percentage of completing students but has not been as large in rural schools in
comparison to remote or urban schools.
In NSW 34.6 percent of students attend rural and remote schools. School retention rates in
these regions are overall lower than the State average. Some of these rural and isolated
schools receive special assistance from the Commonwealth Government to improve the
teaching situation in those schools. The Country Areas Program (CAP) is a
Commonwealth funded program targeting small and isolated schools. Commonwealth
program guidelines prescribe the eligibility criteria that relate to population and distance
from major centers. In NSW in 1997 there were 2,594 students attending non-government
schools and 26,975 attending government schools under the CAP program. The year 7-10
apparent retention rate was 80.2 percent; 14.4 percentage points below the NSW State
average. The year 7-12 apparent retention rate was 43.7 percent; 19.2 percentage points
35 The Human Rights and Equal Opportunity Commission define rural and remote school locations by using the data and references from the various State and Territory Department of Educations’ Country Areas Program indices.

117
below the NSW State average (Council on the Cost and Quality of Government 1998).
These figures may over estimate the difference between the rural, remote, and metropolitan
high schools in NSW. The Council on the Cost and Quality of Government (1998) pointed
out that there is a substantial net movement of students from CAP schools to other
government or non-government high schools. Even for those CAP schools offering senior
enrolment, many students chose to move to other government or non-government high
schools for senior years to take advantage of the broader curriculum offered at larger
schools. Thus the comparison with State rates shows a large negative difference that does
not necessarily mean the students have left schooling.
The performance of CAP school students is also below the State average. In 1997, only 25
percent of CAP students achieved results in the top 30 percent of the State in English, along
with only 21 percent of CAP students achieving results in the top 30 percent of the State in
Advanced Mathematics (Council on the Cost and Quality of Government 1998).
Monitoring of these performances could be a useful way of examining the effectiveness of
policies to improve schooling in these rural and remote locations. The effect of changes in
funding, the use of the funding and variations in the number and qualifications of teachers
employed would all be important considerations to consider. This process is, however,
beyond the intended scope of this thesis but worthy of consideration in other research.
The problem of teacher shortages does not just relate to rural and remote areas of NSW.
The NSW State Government instigated the Casual Teacher Plan 2002 to combat a shortage
of casual teachers in NSW. The Government announced that they would not only have
priority targets in the rural areas of Broken Hill, Griffith, Dubbo, Deniliquin and Moree, but

118
also in the Sydney metropolitan school districts of Blacktown, Fairfield, Granville,
Campbelltown, and Mount Druitt (NSW Department of Education and Training 2002).
In Blacktown Girls’ High School’s Submission to The Inquiry into The Provision of Public
Education in New South Wales it was pointed out that while there was a relatively stable
staff population for the school as a whole, there was high turnover in certain subject areas
and in particular in Mathematics and Computing. They considered that some consequences
of this high turnover were:
• student dissatisfaction (sick of changing teachers);
• overburden on Head Teachers (continuously inducting new teachers and very often
having to supervise several probationary teachers); and
• insufficient permanent experienced staff to do the needed faculty tasks such as program
development. This becomes critical in a time of major curriculum change as has been the
case with the new HSC and will continue with the review and implementation of Years 7-
10 syllabus documents (Vinson 2002).
The submission also claimed that many newly appointed teachers to the school,
particularly, but not exclusively, in Mathematics and Science were overseas-trained
teachers and that growing vacancies in the TAS area were being filled predominantly
through a DET retraining program. Their concerns about the overseas-trained teachers
related to:

119
• Overseas trained and retrained teachers often being sent to the most difficult
locations, where they are most likely to encounter challenging educational
situations. Many of them are not sufficiently trained to deal with this.
• Classroom management was a ‘huge’ issue for overseas teachers who lacked the
necessary language skills. This created significant workload implications for those
in supervisory positions.
• Overseas teachers often found it difficult to adopt new teaching strategies, for
example, changing from teacher centred instruction to student centred learning.
• Students who have been in the class of a struggling overseas teacher were often
initially hostile towards other overseas-trained teachers. This hostility was often
also expressed by parents in the form of demands to have their child placed in
another class (Vinson 2002).
The submission also claimed that TAS vacancies were filled by teachers from primary and
other secondary backgrounds who were being given a ‘brief and very limited retraining
program’ and lacked the particular classroom and resource management skills required to
teach TAS subjects (Vinson 2002).
The Vinson Report36 (2002) found this to be a common problem facing schools in the
western suburbs of Sydney. Another school submitted the following:
36The Vinson Report’s official title is Report of the Independent Inquiry into Public Education in New South Wales. It should be noted that teachers from the Public Education Fund with a contribution from the Parents and Citizens Association funded the Inquiry. This may create an element of bias in the Inquiry’s approach and findings.

120
Located in the far western suburbs of Sydney, our school has experienced
extraordinary changes in staffing over recent years. In a recent two-year
period over forty teachers (executive staff and classroom teachers) left the
school. This represents approximately 80% of the teaching staff. Forty-two
of the forty-six current members of the executive and teaching staff are in their
first appointment in those positions. In the past four years just one member of
the school's executive has remained at the school. Difficulties in attracting
staff to schools such as ours means that a significant proportion of the staff are
beginning teachers and teachers trained overseas, who are required to make a
quantum leap in adjusting to teaching in Sydney's western suburbs.
The schools that have the greatest difficulty in finding staff tend to be in the more socially
disadvantaged areas of Sydney. The Federal and State Governments have jointly
introduced the Priority Schools Funding Program (PSFP), which is designed to assist
school communities to improve the learning outcomes of students in schools with high
concentrations of students from low socio-economic status (SES) background. While the
extra funds available should provide a certain level of benefit, the extra funding does not
necessarily mean that the PSFP will attract the more qualified and experienced teachers to
these SES schools. The additional staffing allocation, which totals around 280 extra
teachers across the State, is generally used to reduce class sizes, assist with the appointment
of Support Teacher Learning Difficulties or to provide teacher release for team teaching
(Vinson 2002).

121
4.4 The International Supply of Teachers The shortage of high school teachers facing NSW also faces Australia, as a whole, and is
part of a global problem. The National and State Skill Shortage Lists for Australia (2003)
show there is a nation wide shortage of high school teachers in:
• Manual Arts/Tech Studies;
• Maths;
• Physics/Chemistry; and
• General Science.
In addition there are shortages of high school teachers in other states in the areas of:
• Music;
• Languages;
• Home Economics;
• Information Technology;
• Senior English;
• Special Needs;
• Agricultural Science; and
• Physical Education.
An UNESCO-ILO study (2002) reported that the global teacher shortage was causing a
decline in the quality of education. The study found that the number of school-aged
children had outpaced the growth in the number of teachers worldwide in the 1990s,
packing classrooms in some developing countries with as many as 100 students per teacher.
122
At the same time, the study revealed that declining working conditions and low relative
salaries in the industrialised nations had discouraging new recruits to the profession,
creating shortages and threatening to diminish the quality of education at a time when the
need for new knowledge and skills is growing dramatically. In addition teacher shortages
in wealthier countries such as the USA, UK, Canada, Australia and New Zealand are
causing a drain on the poorer countries as higher wages were attracting teachers to the
highest bidder. For example, in 2001 the Chicago school district, as part of its Global
Educators Outreach Program, hired 36 teachers from more than 20 countries, including
countries such as Kenya and Bangladesh (American Teacher 2001).
An OECD study of teacher supply and demand (Directorate for Education 2002) indicated
that these supply difficulties were increasing across most OECD countries and being
exacerbated in some cases by other factors, including, increases in the size of the school
student population. The OECD report notes, however, that despite widespread predictions
of teacher shortages, school systems and other employers of teachers were generally able to
fill teaching vacancies. The report indicates that the predicted shortages in the ‘quantity’ of
teachers supplied are most often overcome by reducing the ‘quality’ of teachers supplied.
In some OECD countries strategies to balance supply and demand do not always involve
efforts to increase supply. For example, in France and Holland supply difficulties were
being alleviated by increasing class sizes and reducing face-to-face teaching time. The
report concluded that regardless of whether unqualified or partially qualified teachers are
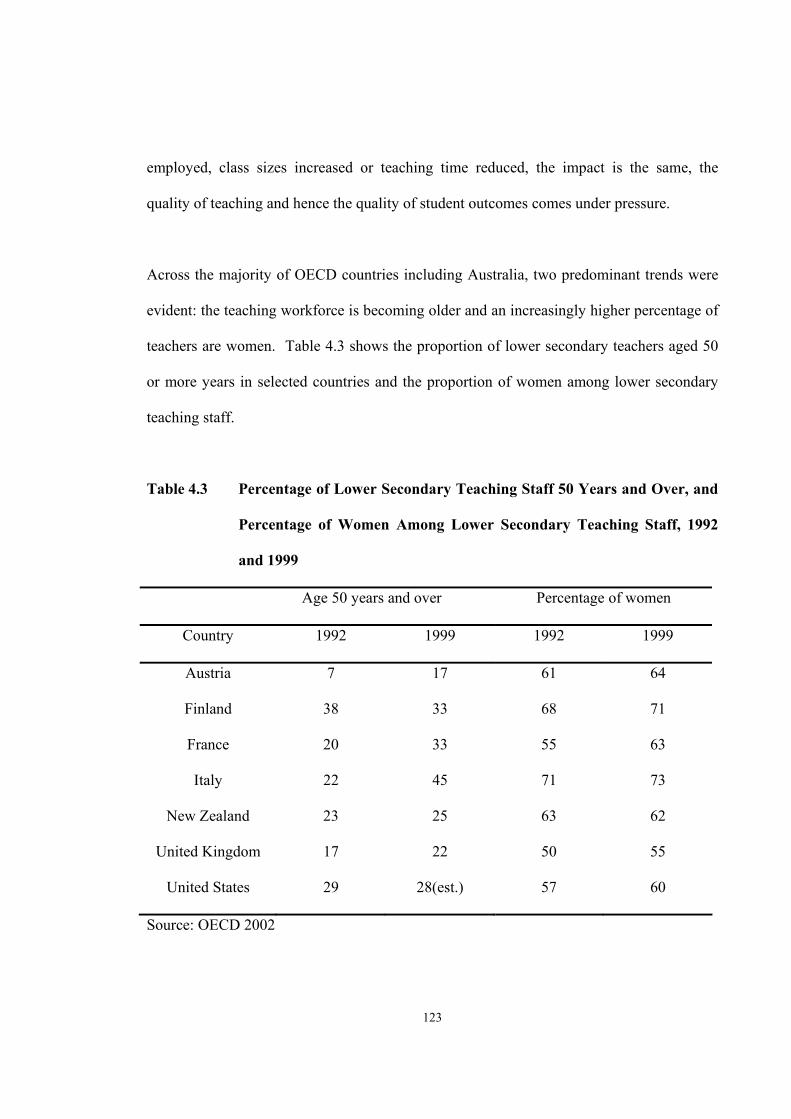
123
employed, class sizes increased or teaching time reduced, the impact is the same, the
quality of teaching and hence the quality of student outcomes comes under pressure.
Across the majority of OECD countries including Australia, two predominant trends were
evident: the teaching workforce is becoming older and an increasingly higher percentage of
teachers are women. Table 4.3 shows the proportion of lower secondary teachers aged 50
or more years in selected countries and the proportion of women among lower secondary
teaching staff.
Table 4.3 Percentage of Lower Secondary Teaching Staff 50 Years and Over, and
Percentage of Women Among Lower Secondary Teaching Staff, 1992
and 1999
Age 50 years and over Percentage of women
Country 1992 1999 1992 1999
Austria 7 17 61 64
Finland 38 33 68 71
France 20 33 55 63
Italy 22 45 71 73
New Zealand 23 25 63 62
United Kingdom 17 22 50 55
United States 29 28(est.) 57 60
Source: OECD 2002

124
This data indicates that the proportion of teachers over 50 years is not uniform across
countries but is overall on the rise. This raises the concern of a global shortage of teachers
occurring unless there are measures put in place to attract more individuals into the teacher
work force and to keep them there. These policy issues will be discussed in Chapters 8 of
this thesis. The data on gender balance in teaching shows a general trend of increasing
proportions of women among lower secondary teaching staff37. The data for Australia
shows similar trends. In 1982 there were 0.8 female high school teachers for every male
high school teacher. The ratio in 2002 was 1.2 females for every male high school teacher
(Australian Bureau of Statistics 2003b). The ageing of the Australian teacher workforce is
reflected in the increase in the median age of teachers from 34 years in 1986 to 43 years in
2001. Over the same period the number of Australian teachers aged 45 and over increased
from 17 percent to 44 percent (Australian Bureau of Statistics 2003b).
It is important to point out that the trend of increasing proportions of females in the
teaching profession in OECD countries has of itself no particular implications for the
quality of educational outcomes. There are, however, some important issues raised by this
trend. The first is the government and public concern of the largely unknown implications
of what is seen as an inadequate representation of male role models in the teaching service
for the socialisation of both boys and girls38. While this has largely involved concerns
relating to primary education in Australia, this could develop into a concern in secondary
schools if Australia follows the trend of countries such as Belgium (87.3 percent of females
37 The OECD data that is available shows that in most countries the percentage of women involved in upper secondary teaching is not as high as in lower secondary but is still in excess of 50 percent of the teaching staff (Directorate for Education 2002). 38 See House of Representatives Standing Committee on Education and Training 2002, Buckingham 2002, Wood 2002.
125
among lower secondary teaching staff) and Canada (81 percent) (Directorate for Education
2002).
The second is concern about the potential for reduced curricular and co-curricular offerings
where no male teachers are employed in a school. This is not just relating to activities that
require male supervision but may also relate to the availability of women, who have
responsibilities caring for their own children, for after school activities. In Australia male
teachers tend to work longer hours than female teachers. ABS 2001 census data stated that
in the week before census night 25 percent of male teachers reported working more than 50
hours, compared with 17 percent of female teachers (Australian Bureau of Statistics
2003b).
4.5 Projections of Teacher Supply in NSW
Projections are used widely in economic and social analysis to inform stakeholders of
future outcomes under certain conditions and explicit assumptions. Projections of teacher
supply are designed to inform stakeholders of what is likely to happen, ceteris paribus,
based on the assumptions underlying the projections. The projections are only as useful as
the data that the projections are based on and the accuracy of the assumptions. Actions that
stakeholders take in response to the projections may change the actual outcomes and as a
result bring into question the validity and accuracy of the original projections. This in itself
is not a bad thing, if it is correcting a problem that was suggested by the projections. It is a
good thing if the actual outcome differs from that projected because school authorities,

126
universities or other stakeholders have taken action to prevent projected shortfalls or
surpluses of teachers in particular years, subjects or regions. Preston (2000) points out that
in recent years some universities, informed by past projections, have been able to adjust
intakes of students. This occurred in Tasmania as a result of changes in the school starting
age. There had been significant fluctuations in the demand for primary and secondary
teachers from year to year as the small cohort, resulting from a change in school starting
age, had moved through primary and then secondary school. The University of Tasmania
adjusted its intakes into primary and secondary initial teacher Education programs to
somewhat overcome the projected imbalances.
There have been a number of organisations and individuals who have made projections of
the teacher labour market in Australia and NSW. These projections will differ as they are
based on different sources of data and different assumptions. MCEETYA (2001) provided
projections for teacher requirements and the supply of teachers up to 2003, at the national
and state and territory level. The year 2003 was chosen as this was the last year for which
projections of graduations could be based on actual data that they had for commencements
in undergraduate courses. The analysis by MCEETYA included an assessment of whether
projected graduations are likely to lead to a tightening or loosening of the labour market for
teachers at the national level in the early 2000s, compared to that at the end of the 1990s.
The analysis then goes on to examine projections at the state and territory level and
concludes by discussing sources of flexibility on the demand and the supply side, which
assist in the adjustment of the teacher labour market within a jurisdiction and across
jurisdictions. Projections in this report are based on assumptions about key factors, which

127
influence demand and supply. The projections for school enrolments are based on the ABS
population projections by age and assume that grade progression rates remain at the 1999
level. Teacher numbers are broadly based on projected enrolments (for the government and
non-government sectors, within the primary and secondary levels) divided by the most
recent student-teacher ratios, but education authorities have used additional information to
estimate teacher requirements within the government sector in their State or Territory
(MCEETYA 2001).
Projections for the number of teachers to be recruited to 2003, as discussed earlier in this
chapter, are made up of the need to satisfy the growth in requirements and the need to
replace teachers who leave teaching. MCEETYA estimates that the Australia wide annual
requirement for ‘new’ high school teachers will increase from 6000 in 2000 to 7100 in
2003. At the same time the annual requirement for primary school teachers will decline by
950. While there may be some scope for retraining some of any excess of primary school
teachers as secondary school teachers, not all primary teachers will be willing to teach in
high schools or undergo the extra training. The overall result of the projections suggests
that there will be a need for education authorities to encourage more individuals to train to
become teachers or to encourage former teachers to return to the teaching profession.
On the supply side, MCEETYA made their projections of completions from initial teacher
training courses based on information on commencements in these courses and applying an
expected completion rate. To project completions in the period to 2003, the following
assumptions were made for the different streams:
128
Undergraduate completions:
• For the period to 2003, completions equal commencements four years earlier
multiplied by an average completion rate of 60 percent.
Post-graduate completions:
• For the period to 2000, completions equal commencements one year earlier
multiplied by an average completion rate of 85 percent.
For the period between 2001 and 2003, commencements in postgraduate teaching courses
have been assumed to run at a level equal to the average during the previous five years.
During that time postgraduate commencements were on a slightly upward trend. The
‘completion rates’ have been calculated by comparing commencements and completions,
suitably lagged, over the 1990s and averaged. The initial secondary teacher Education
graduates are projected to rise slightly over the period from 4360 graduates in 1999 to 4493
in 2003.
MCEETYA, taking into account the fact that less than half of government additional
teacher recruitments nationally was met by hiring new graduates, suggests that balance in
the teacher labour market could be maintained over the next few years with a flow of 8500
new graduates a year on average, across the primary and secondary sectors. MCEETYA
concludes that the number of graduates at the national level that are projected to be
available for teaching jobs in the next few years (starting at 8260 in 1999 and rising to 9770
in 2003) appears to be broadly in line with the requirements for a stable teacher labour
market at the national level. MCEETYA warned that in the period after 2003, however,

129
with retirement pressures starting to emerge, overall replacement needs will rise and an
increase in graduate numbers will become necessary.
In NSW the projected number of high school teachers available was projected to remain
relatively constant over the period 1999-2003, at approximately 37,000 (MCEETYA 2001).
The initial secondary Education graduates in NSW are expected to increase by
approximately 10 percent from 1409 in 1999 to 1552 in 2003. While the number of
secondary Education graduates varies from year to year, the overall number of secondary
Education graduates over the period was projected to rise by 2.5 percent per annum.
There are a number of concerns about the accuracy of the projections and the conclusions
that have been made by MCEETYA. First the total number of high school teachers
employed in Australia was projected to be 109,000 in 2002 but the actual number in full-
time employment was 110,900 (Australian Bureau of Statistics 2003b). Thus the quantity
of teachers demanded by high school educational authorities and institutions was 1900
more than that projected, meaning any net positive outcome/surplus in the high school
teacher labour market would have been overestimated and implying future projections
could also under estimate the demand for teachers. The situation is relatively worse in
NSW. The total number of full-time high school teachers was projected by MCEETYA to
be 37,014 in 2002 but the actual number was 38,447 (Australian Bureau of Statistics
2003b), 3.9 percent higher than projected. The projections of high school teacher demand
in NSW were understated implying potentially larger shortages than projected. The
quantity of qualified high school teachers supplied could also be overstated, if the trend for
130
teacher annual net resident migration flows continues in its negative direction, as discussed
earlier in this chapter.
On the supply side MCEETYA (2001) have used DETYA statistics on ‘initial teacher
Education’ to develop estimates of future supply. This is problematic for two reasons.
First, data on recent enrolments (commencements, completions) cannot take account of
future plans to change intakes or to change course length or structure in a way that will
change the number of graduates in particular years in the future. Second, Preston (2000)
considers that the data is generally of poor quality for such purposes. This is because of
ambiguities or misunderstandings in course nomenclature and classifications. For example,
in the DETYA collection many pre-service Diploma in Education courses are classified as
‘post-initial’, and many inservice fourth year Bachelor of Education courses are classified
as ‘initial’ teacher Education. Preston (2000) refers to one example of this occurring in the
MCEETYA report of 1998, the 1996 total secondary initial teacher education completions
in South Australia were reported at just 100 (fewer in the three preceding years), when the
actual number was over 250.
The most common projections referred to in the literature, and used by a number of
Catholic Education Offices in NSW and others, were those of Preston (2000) for the
Australian Council of Deans of Education. Preston points out that the teacher labour
market in Australia has some advantages over labour markets in general for making
projections. There is “relatively good data and reasonable assumptions possible for some
major inputs of a projections model (especially student enrolments, pupil teacher ratios, and
131
graduate supply), and entry requirements (qualifications) are relatively clear-cut.” (Preston
2000) Despite this there are a number of problems involved in making accurate projections
of the teacher labour market in Australia. First there is a relatively high rate of separation
from the teacher labour force. ABS census data for 1996 showed that a little over 50
percent of people with Education qualifications were actually employed as teachers.
Second, the availability of alternative employment and the relative attractiveness of
teaching (about 30 percent of men and women with teaching qualifications are in
occupations other than teaching) fluctuate over time with economic and other
circumstances. Preston also concedes that future trends in separations are difficult to
project and current separation rates are difficult to measure. This is made more difficult by
the lack of data for the non-government sector and the limitations of the data for most
government education authorities (for example, those on casual or short term appointments
ceasing to be available are not accounted for, and extended leave creates measurement
difficulties). Preston concludes, “what appear to be small changes or differences in
separation rates can have a very large impact on demand.” (2000) The Preston projections
do have an advantage on the supply side, as the source for the graduate supply projections
is a survey completed by all initial teacher Education providers in Australia. This results in
generally high quality, up-to-date projections, though university plans and the reality of
student enrolments and completions can differ from that assumed when the survey form
was completed. It also takes greater account of recent trends in the international
recruitment of graduates and experienced teachers from Australia.

132
Irrespective of limitations of data the value of projections are important for planning
involving the teacher labour market in NSW. Preston’s projections (2000) for high school
teachers in NSW are shown in Table 4.4.
Table 4.4 Projections of High School Teachers in NSW, 2000-2005 2000 2001 2002 2003 2004 2005 1 Enrolments 464,546 465,243 469,122 473,398 476,891 481,4702 PTR (FTE) 12.57 12.57 12.57 12.57 12.57 12.57 3 Persons: FTE (teachers) 1.083 1.088 1.093 1.097 1.102 1.106 4 PTR (persons) 11.6 11.55 11.5 11.46 11.4 11.36 5 Total teachers 40,034 40,279 40,801 41,324 41,819 42,373 6 Change from prev. yr 12 245 522 523 495 555 7 Net separation (%) 0.033 0.035 0.037 0.039 0.041 0.043 8 Net separation number 1,313 1,403 1,503 1,604 1,707 1,814 9 Recruits required 1,325 1,648 2,025 2,127 2,201 2,368 10 Graduates (%) 0.95 0.88 0.87 0.95 0.97 0.97 11 Graduates number 1,259 1,451 1,762 2,020 2,135 2,297 12 Avail/suit (%) 0.8 0.8 0.8 0.8 0.8 0.8 13 Total graduates (demand) 1,574 1,813 2,202 2,526 2,669 2,872 14 Total graduates (supply) 2,032 2,215 2,183 2,238 2,294 2,312 15 Surplus/shortage (number) 458 402 -19 -288 -375 -560 16 Surplus/shortage (% of total) 0.011 0.01 0 -0.007 -0.009 -0.013 17 Surplus/shortage (% of demand) 0.291 0.222 -0.009 -0.114 -0.141 -0.195 18 Surplus/shortage (% of supply) 0.226 0.181 -0.009 -0.128 -0.163 -0.242 19 Supply as % of demand 1.291 1.222 0.991 0.886 0.859 0.805 Source: Preston, Table 2, 2000 Notes on Table 4.4. 1. Enrolments projections are for government and non government schools combined; provided by DETYA, April 2000. 2. PTR (FTE) from ABS, 1999 Schools Australia , with no change assumed during the period. 3. Persons: FTE is derived from ABS, Schools Australia, 1990 to 1999. The projections are concerned with the relationship between the supply and demand of persons, not full time equivalents. 4. PTR (persons) is derived from rows 2 and 3. 5. Total teachers is derived from the PTR (persons) and Enrolments (rows 4 and 1). 6. Change is the difference from the previous year's total teachers. 7. Net separation % takes account of returnees and reentrants as well as those leaving (resignations, retirements, unavailability after a period of casual or limited term employment, or the taking of or returning from leave not accounted for in PTR). 8. Net separation No is derived by applying the rate to the total number of teachers in that year (rows 7 and 5). 9. Recruits required is derived by adding the change in teacher numbers to the separation number (rows 6 and 8). 10. Graduates % is the proportion of recruits who are graduates of the previous year. Those not included in

133
'graduates %', and thus make up the residual, are mostly graduates of earlier years. Re-entrants and returnees are accounted for in ‘net separation’. Graduates of earlier years are included in more substantial numbers when there is a surplus in the previous year. The proportion of any surplus of the previous year that is carried over varies according to the national surplus or shortfall (and thus the likelyhood that graduates would have taken up interstate positions). These projections do not take account of any future active recruitment campaigns to attract teachers from interstate. 11. Graduates No is derived from the previous two rows. 12. Availability/suitability % is the proportion of all graduates who are available and suitable for employment. It is generally assumed to be 80% (consistent with the assumption underlying Net separation % and Graduates % that about 80% of graduates enter teaching soon after graduating, and a usually small proportion enter teaching later on). 'Available' means generally available for actual vacancies - not for only the most desirable positions. 13. Total graduates (demand) is the minimum number of graduates (who completed the previous year) required to meet demand, and is derived from rows 11 and 12 - that is, row 11 is the percentage indicated in row 12, of row 13. 14. Total graduates (supply) is derived from graduate projections provided for all initial teacher education programs by education faculties (or schools of teacher education). Graduates of early childhood and other programs that prepare graduates for non-school as well as school settings are appropriately apportioned. 15. Surplus/shortage (no) is the difference between demand and supply in number of persons. 16. Surplus/ shortage (% of total teachers) is row 15 as a percentage of 'Total teachers' (row 5). This is a key indicator for school authorities to judge the magnitude of any shortfall they have to manage. 17. Surplus/shortage (% of supply) is row 15 as a percentage of 'Total graduates (supply)' (row 14). 18. Surplus/shortage (% of demand) is row 15 as a percentage of 'Total graduates (demand)' (row 13) 19. Supply as % of demand is row 14 as percentage of row 13. It shows the number of expected graduates (as planned by the universities) as a percentage of the minimum number of graduates required to meet expected demand. Note that 'graduates' are those who completed their course at the end of the previous year. This is the key indicator of the magnitude of expected shortage/surplus of graduates.
The Preston projections are at a general statewide level. They do not take account of:
• the quality39 of teachers (except that only those with formal primary or secondary
teaching qualifications are included);
• subject and other specialisations; and
• the availability of teachers for particularly hard to staff locations and schools.
Preston (2000) projects that by the end of 2002 there will be a small shortage (19) of high
school teachers in NSW but this shortage will grow in the years following (Table 4.4). It
could be argued that there was no overall shortage of high school teachers at the end of
39 The OECD Directorate for Education considers the quality of teachers to be related to the level of teacher academic qualifications, teacher certification, academic tested ability, teacher experience, and professional development (2002).

134
2002 but there were definitely some problems in filling vacancies in a number of subject
areas and school locations. The Preston Report (2000) suggests that this will worsen in the
years ahead and become more widespread. The NSW Government has reduced the effect
of certain aspects of the projections by attempting to increase the supply of teachers by
advertising campaigns such as ‘Teach and Make a Difference’, the Accelerated Teacher
Training Program, and the Pre-service Teacher Education Scholarship Program40.
The Baumgart Review of staffing in New South Wales also projected a serious shortage of
teachers in the decade beginning around 2005 (Baumgart 1995). Furthermore, the Ramsey
Report on teaching in New South Wales, which also discusses this issue in detail, draws
similar conclusions, though with some caution. "There is no doubt that the supply of
teachers will tighten in the long-term with the effects being more dramatic in some states
and in some teaching areas than others."(Ramsey 2000: 201) Thus, although there is room
for difference over the extent of shortages and how soon they will emerge, there is
widespread agreement that if there is not an increase in the supply of high school teachers
then there will be shortages in the period nearing 2005 and thereafter. Actions by
government and other school authorities may be able to prevent or delay the shortages, but
this may be at a cost of the quality of teaching. This could mean teachers teaching ‘out-of-
field’ or with lower formal qualifications than their peers.
40 Scholarships were offered to allow students to complete the final one, two, three or four years of a four-year teacher education program, or four years of a five-year program. The scholarships were for study, which would qualify students to teach Mathematics, Science, Technology, or English. The program pays each student’s HECS liability plus a $1,500 gross per annum training allowance for the period of the scholarship (NSW Department of Education and Training 2002).
135
4.6 Conclusion
The supply of high school teachers depend on a large number of variables, including the
number and proportion of new graduates, who wish to become teachers; teachers returning
from leave; former teachers returning to teaching; the pool of relief and casual teachers; the
net movement of teachers into NSW from another state or from overseas; and the overall
state of the alternate job market for teachers. Many of these factors vary from year to year.
It is thus difficult to project how many teachers will be available to teach in NSW high
schools at some particular point in time. Even if there is sufficient aggregate supply for the
State, it is most likely that there will still be shortages in particular subject areas and some
locations in the State.
The issue of measuring the supply of teachers is made more difficult by the lack of
information in regard to teachers going on and returning from leave and teachers re-
entering the teacher labour force after resigning. Different state and territory bodies may
not have comparable data. There is little accurate data on casual teacher and limited term
employed teacher availability and movements into and out of teaching positions. In the
non-government sector the problem is even worse with no central data on staff turnover,
patterns of leave, or even the age of teaching staff. There needs to be a national body
similar to the NCES in the USA to collect and provide the data for educational
stakeholders. This would improve the reliability of projections and provide useful data in
matching the demand and supply of teachers in Australia for policy makers and

136
administrators. This issue will be discussed in more detail in the policy recommendation
section in Chapter 8.
There are three factors that are contributing most to the changes in the current labour
supply for high school teachers in NSW. They are the ageing teacher population, the lower
proportion of new teaching graduates, and the decline in the proportion of males seeking to
become teachers. All of these factors create an environment where it is most likely that
there will be a shortage of high school teachers in NSW starting sometime in the period
2003-2005 and continuing into the foreseeable future after that. While it is acknowledged
that the NSW Department of Education and Training and other school authorities are taking
some steps to deal with this, more may be required. These steps will be discussed further in
later chapters. To attract more teachers it is necessary to understand the factors that
influence the decisions of individuals to teach in NSW high schools. This will be examined
in the next chapter.

137
Chapter 5. Models of Teacher Labour Supply 5.1 Introduction
As seen in Chapters 3 and 4, the demand for high school teachers is fairly predictable at
least in the short term of two to three years. The supply of high school teachers is much
less predictable. Projections in Chapter 4 imply that the quantity of high school teachers
supplied in NSW and in many other nations will be less than the quantity demanded at least
in the period from 2005-2010. The aim of this chapter is to develop a model of teacher
labour supply for high school teachers in NSW. This model should enable policy makers to
consider various options to increase the quantity of supply of teachers.
There have been a number of models of teacher labour supply offered for consideration by
researchers. They generally relate to overseas teacher labour markets, especially the USA.
These cannot be applied directly to the NSW high school teacher labour market but can
offer some insights into the functioning of teacher labour supply models. From these and
the research carried out on teachers and potential teachers in NSW, we will attempt to
develop a teacher labour supply model that relates to the NSW high school teacher labour
market. One issue that the model cannot address is the quality of teachers. Policy makers
and school administrators are often more concerned about having a teacher in every
classroom, rather than the minimum qualifications and quality of the teacher. An increased
number of high school teachers can be achieved by lowering the standard below that of the
current teaching workforce, such as substituting a four year trained Mathematics teacher

138
with a teacher with three years primary training and one year or six months Mathematics
training. This issue will be discussed later in this chapter.
5.2 Teacher Supply Projection Models
Many teacher labour supply models are actually projection models. They do not consider
the factors that influence individuals to become teachers or to leave teaching, but rather the
number of individuals who will be in the teacher labour supply at a point in time. Teacher
projection models can provide information as was shown in Chapter 4 about possible
teacher shortages but they cannot provide solutions to the problem or offer alternative
approaches to dealing with the situation. There have been a number of projection models
introduced over the years by the National Center for Education Statistics (NCES) in the
USA. According to Barro (1992) these models differ in certain important respects but they
all have a teacher supply model that has two basic components. They are:
• a submodel for projecting the supply of continuing or retained teachers (or a model
of teacher attrition), and;
• a submodel of the supply of potential entrants into teaching.
These two taken together are intended to yield projections of the total teacher supply,
similar to those seen in Chapter 4. A review by Barro and others, as reported in Barro
(1992), on teacher supply and demand projection methods for the National Research
Council in 1986, found attrition models ‘generally to be crude’. Barro considered that there

139
were also weaknesses in projecting the supply of potential entrants. He considered that
many models equate the projected supply of potential entrants to the stock of persons
certified to teach in a particular state. The weaknesses in this proposition are that many of
these people certified may not be willing to teach under the current circumstances while
others who are not certified may be available to teach. Barro also believes that basing
projections on past entry rates is also flawed, as the rate of entry is strongly influenced by
demand. If there is a low quantity demanded for new entrants, then the quantity supplied
would invariably also be low. Thus entry rates are automatically low when quantity
demanded is low and rise as quantity of new entrants demanded increases. The general
conclusion by Barro is that teacher demand and supply projection models are largely
mechanical not behavioural. They can only project future demand and supply under the
implicit assumption that all influences on demand and supply remain unchanged or follow
the same predetermined pattern. They do not consider the impact of changes in wages and
other teaching circumstances and conditions on supply and fail to predict how changes in
policy and conditions of teaching will affect the teacher labour market.
5.3 A Model of Teacher Labour Supply in a Particular Geographic or Socio-economic
Area
The labour supply of teachers is an aggregate of individual labour supply decisions. There
are a variety of decisions made at different points in time based on different information
and influences. In the pre-teaching phase a person begins with a decision to train for
teaching and with successful completion of teacher training to meet the requirements of the

140
educational authorities, the person then moves to the application and job matching process.
The first employment decision is to consider if they still wish to become a teacher, or under
what conditions or circumstances are they prepared to teach in a particular geographical or
socio-economic area or a particular school. As seen in Chapter 4, not all people graduating
with educational qualifications to be teachers actually enter the teacher work force. If they
do pursue a teaching position another phase of decision-making begins. Having been hired
at a particular school, the career path is determined by continuation and retention decisions
of both teachers and schools. These decisions may be made on an ongoing basis, especially
for a teacher who may be on a fixed term contract.
The standard model of the supply of labour to schools in a particular geographical area j
can be characterised by:
Qj = f (wj, WCj, Aj, Oj )41 (5.1)
where Qj is the quantity of teachers supplied in area j; wj and WCj are wages and working
conditions, respectively, in area j; and Aj and Oj are amenities and other employment
opportunities, respectively, in area j. Consideration of each of these elements allows us to
examine the basic conditions to make an analysis of the teacher labour supply.
Wages (wj). A fundamentally important issue in the consideration of teacher labour markets
is which wage differences to look at and how they should be interpreted. In some countries
such as the USA, with a relatively flexible wage structure when compared to Australia,
teacher wages vary within geographical areas and across districts. In NSW high schools 41 This model is based on work done by Hanushek et al. (2001)

141
the level of nominal wages is, in large, centrally determined, as discussed in Chapter 4.
There are 13 steps in the basic teacher salary scales that apply to most high school teachers
in NSW. These wage differences in the steps reflect teaching experience and graduate
education levels.
Alternative Earnings Opportunities and Amenities (Oj, Aj). In considering the willingness
of an individual to become a teacher, it is important to consider opportunity cost. It is
necessary to take account of differences in alternative earning opportunities for teachers. It
is also important to consider the different alternative earning opportunities for teachers in
certain specialisations, such as Mathematics, Science, and Computing teachers versus those
in other specialisations where there is a lower level of alternative earning opportunities
(Kershaw and McKean 1962, Zarkin 1985, Murnane et al. 1991). These considerations
may also vary from one geographical location to another. If areas differ by prices or
amenities or if labour markets are geographically confined, wages must also be considered
in comparison to the relevant group of competing districts.
Dolton and van der Klaauw (1995, 1999) and van der Klaauw (1997) found evidence that
opportunity wages affect the probabilities of both entry to and exit from the labour market
in the United Kingdom. These results are consistent with earlier work by Murnane and
Olsen (1989, 1990), who found that opportunity wages affected duration in teaching in both
Michigan and North Carolina in the USA.

142
Working Conditions (WCj). As shown in Chapter 1, there are many other considerations
that affect teacher satisfaction and the willingness to work in particular school systems
apart from just the overall salary or compensation levels. Some of the earliest work
considered how teacher preferences might affect the selection of schools (Greenberg and
McCall 1974, Murnane 1981). More generally, teachers might be willing to take lower
salaries to obtain better conditions in their schools, a proposition introduced by Antos and
Rosen (1975) and subsequently pursued in a variety of other analyses (e.g., Baugh and
Stone 1982, and NCES 1996, 1997). It has even been argued that the push for lower class
sizes by teachers reflects an element of teacher compensation, as opposed to an educational
policy designed to improve student achievement (Grissmer and Kirby 1992).
While this model can observe the relationship between wages, and other variables, and
employment, it is not possible to infer a priori that the relationship is a ‘supply function’
for teachers. Rather district hiring and retention practices are an important element in the
labour market for teachers. This premise is supported by Ballou and Podgursky (1995,
1997) and Ballou (1996). It is important because it frames the interpretation of movements
observed in the market. This will also be an important consideration in assessing the
results obtained for the high school teacher labour market in NSW, to be discussed later in
this chapter.
Personnel policies are also an important issue in determining the teacher labour market,
especially in NSW. The NSW high school teacher market is largely a monopsony, as
discussed in Chapter 2, and as a result the decisions of the NSW DET and the Catholic

143
Education Offices have a large impact on the numbers of teachers employed in particular
locations in high schools in NSW. Both the NSW DET and the Catholic Education Offices
have staffing formulas that determine how many teachers will be offered employment in a
particular school, based on the number of pupils in that school. In public high schools
teachers are allocated to schools throughout the State. A teacher can refuse to accept an
allocated position and become unemployed or work as a casual teacher. Alternatively they
can apply for a position in a Catholic systemic or private school or apply for a non-teaching
job. In addition, as discussed in Chapter 4, wages are determined by a single enterprise
agreement, with a common salary schedule, covering all teachers in Government schools
with a follow-on process to cover the Catholic systemic schools. With one exception, the
only sources of variation in the wage across teachers in these two systems are teaching
experience and the amount of formal qualifications. The exception from the rule is the
allowance paid to teachers who work in climatically disadvantaged areas in NSW.
Normally it would be expected that when wages are common at all public and Catholic
systemic schools, that there would be excess quantity demanded at some schools and excess
quantity supplied at others (Falch 2003). This is generally not the case when there is an
excess quantity of supply of teachers in the labour market as the educational authorities
allocate teachers between the schools to overcome these imbalances. Shortages in schools
will only become obvious when there is an overall shortage in the total labour market for
teachers. There may be shortages in some subject areas but these will be covered by
teachers in subject areas that have an over supply. The quantity of supply of teachers at a
particular wage rate in a period of balanced supply or a small over supply is largely
‘demand driven’. The quantity of teacher supply will largely be those teachers who are

144
employed in schools. Teachers who cannot gain full-time employment as teachers will
most likely seek out casual teaching positions or non-teaching jobs. Therefore the quantity
of supply at the award wage will be very close to the teacher employment level42.
5.4 The Effect of Gender on Teacher Labour Supply Models
Individuals consider many things when deciding to choose teaching as a job or a career, the
wage level is just one of those factors. Individuals generally do not make career choices
each year independently of their past decisions or future plans. Marriage and family in
particular have been found to have considerable influence on individuals’ decisions to
choose an occupation and to decide whether to work each year (Van der Klaauw 1996,
Stinebrickner 2001). Teaching may be viewed as an attractive occupation by those
individuals desiring to have a family as it has comparatively flexible hours and does not
penalise individuals as much as other occupations for taking time off to raise children. The
'flexibility option,' that female teachers who take temporary leaves to raise children do not
suffer subsequent wage loss upon re-entry, is shown to be an important attraction of the
teaching profession to women (Flyer and Rosen 1997). Research by Stinebrickner (2001)
indicates that the decisions of males and females are quite similar in the first years after
certification, but become quite different as the number of years after certification increases.
As time goes on married women are much more likely to leave teaching than married men.
Teacher labour market supply models need to consider these differences between the
42 This is supported by the low unemployment rate for teachers in Australia – 1.7 percent in 2000 (ABS, Australian Social Trends 2001 Cat. No. 4102.0).

145
decisions of male and females in order to understand the factors that influence the numbers
of teachers in the market.
5.5 A Dynamic Model of High School Teacher Labour Supply
Csellak (2002) and Stinebrickner (2001) use dynamic models to estimate the importance of
various factors in determining the decisions of individuals to teach. Csellak (2002) showed
that amongst the factors that determined the teacher labour supply were the teaching wage,
the non-teaching wage, the gender of the individual, the number of children the individual
had and the children’s age and the state unemployment rate. Stinebrickner’s model (2001),
while accepting that marital status and number of children are very important predictors of
exits out of the workforce for women, did not measure the complete effect due to the
limited data sample. Estimates of the wage equations in the model support the notion that
lower teaching participation rates for academically gifted teachers stem in part from the
ability of these teachers to obtain wage premiums in the non-teaching sector but not in the
teaching occupation. This again supports the premise that the relationship between
teachers’ wages and non-teaching alternative incomes is also important in decisions to
teach, especially so for the more academically gifted teachers.
5.6 A Model of High School Teacher Labour Supply for a Particular Location in NSW
After considering the various models provided in the literature, a model has been adopted
that may provide some understanding of the factors that affect the quantity of high school

146
teachers, who will be willing to work in a particular location in NSW. The quantity of
teachers supplied for a particular geographical location is QSj. QS
j is measured by the
teacher student ratio in high schools in that geographical location. The teacher student ratio
has been selected as the proxy for the quantity of teachers for two reasons. First, the
number of teachers in a particular location will generally be a function of the number of
students in that location. This is especially the case in regard to staffing formulas applied
by the DET and Catholic Schools Offices that are used to allocate teachers to particular
schools based on the number of students in that school. Second, the quantity of teachers
supplied in NSW at the time of this study was largely ‘demand driven’, as discussed earlier
in this chapter. Individuals would seek employment as teachers in a particular location if
there were teaching positions available and the demand for teachers and the quantity
employed is a derived demand based on the number of pupils in that location.
The quantity of supply of teachers within a geographical location, j, can be characterised
by:
QSj = f (Wj, Uj, WCj, Mj,Cj, Nj F,T) (5.2)
Wj is the relative nominal income of teachers compared to nominal incomes for all
occupations in location j. It is measured by dividing the median income of teachers by the
median incomes of all persons in that location. It includes benefits paid to teachers in
certain locations. This relative wage measure has been selected as we are looking at
aggregate supply of teachers and not individual supply schedules. The literature showed
that teacher supply was influenced by teacher wages relative to alternative earning

147
opportunities (Kershaw and McKean 1962, Zarkin 1985, Murnane et al. 1991). Census
data (Australian Bureau of Statistics 2003c) allows for a comparison between the median
income of teachers and the median income of all persons in each particular location. We
would expect the model to show that increased relative wages (incomes) should lead to an
increased quantity of supply of teachers relative to students in a location. The observed
values of relative wages, eg.rw1, rw2, and rw3, and teacher student ratios at each location,
eg. 0.9, 0.8, and 0.7,ceterus paribus, would determine a supply schedule. The plotting of
the schedule would create a supply curve for high school teachers in NSW. It could be
expected that this would create an upward sloping supply curve as shown in Figure 5.1.
Figure 5.1: Relative wages of teachers and the quantity of teachers per student across
regions
Relative Sj
Wage rw1
rw2
rw3
0.7 0.8 0.9
Teacher/student ratio
It is important to note that the number of teachers who are working in schools is not the
actual supply of teachers in the market. The supply of teachers is determined by the
number of teachers willing to work at various wage rates, where as the observed quantities
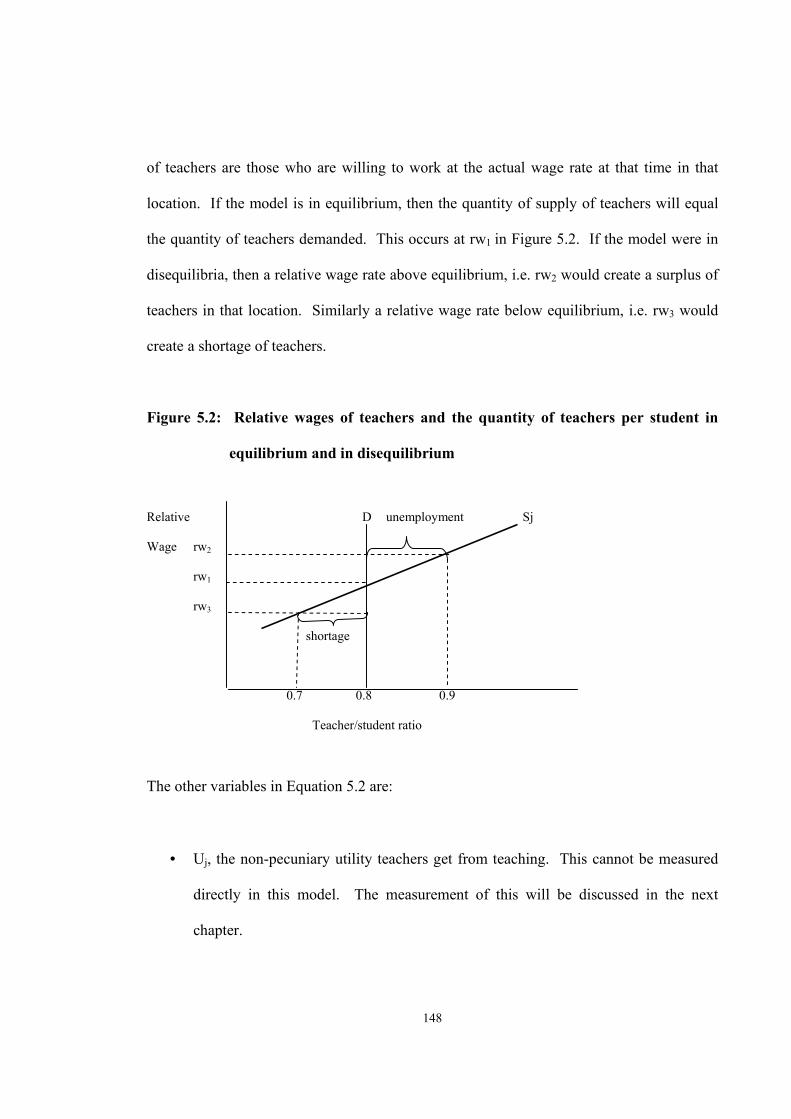
148
of teachers are those who are willing to work at the actual wage rate at that time in that
location. If the model is in equilibrium, then the quantity of supply of teachers will equal
the quantity of teachers demanded. This occurs at rw1 in Figure 5.2. If the model were in
disequilibria, then a relative wage rate above equilibrium, i.e. rw2 would create a surplus of
teachers in that location. Similarly a relative wage rate below equilibrium, i.e. rw3 would
create a shortage of teachers.
Figure 5.2: Relative wages of teachers and the quantity of teachers per student in
equilibrium and in disequilibrium
Relative D unemployment Sj
Wage rw2
rw1
rw3
shortage
0.7 0.8 0.9
Teacher/student ratio
The other variables in Equation 5.2 are:
• Uj, the non-pecuniary utility teachers get from teaching. This cannot be measured
directly in this model. The measurement of this will be discussed in the next
chapter.

149
• WCj, working conditions, including hours of work, and holidays. These would
generally be similar across locations43. There is no data available to distinguish
working conditions in the various locations in NSW, such as Statistical Local Areas
(SLAs)44, and as such is treated as a constant in this model.
• Mj, the distance of the location from a major city. This is a function of distance of
the location from a capital city or a large regional city with a population in excess of
100,000 people. The cities included are Sydney, Newcastle, Wollongong, Canberra,
Brisbane, Melbourne, and Adelaide.
In 2001, 71.1 percent of the population of NSW lived in major cities. A further 20.6
percent lived in inner regional areas and the balance in outer regional and remote and very
remote areas (Australian Bureau of Statistics 2003b). It would be expected that there would
be fewer teachers further away from the major cities. Figure 5.3 shows the numbers of high
school teachers in NSW and the distances that they are located from the major cities, based
on the NSW Statistical Local Areas (SLAs) where they live. As can be seen, the largest
numbers of teachers live in SLAs in or near the major cities and there are fewer teachers
located further from the major cities. If there were a shortage of teachers in NSW, we
would expect the teacher pupil ratios to be highest near the major cities and smallest further
43 In certain areas in the Western Region of NSW there is an additional one weeks holiday for teachers at Christmas due to the high temperatures that exist in these locations.
44 The Statistical Local Area (SLA) is an Australian Standard Geographical Classification (ASGC) defined area, which consists of one or more Collection Districts (CDs). SLAs are Local Government Areas (LGAs), or parts thereof. Where there is no incorporated body of local government, SLAs are defined to cover the unincorporated areas. SLAs cover, in aggregate, the whole of Australia without gaps or overlaps.

150
from the major cities. These locations that are further from major cities are further away
from the amenities and job opportunities offered by major cities and also tend to be further
from the coast and as a result more climatically unfavourable with wider ranges of
temperature.
Figure 5.3: Location of high school teachers in SLAs in NSW, based on their distance
from major cities (klms)
Cj, in Equation 5.2, is the distance of the location from the coast. It is generally considered
that people prefer to live near the coast rather than inland. This is supported by the
allowance that the NSW DET pays to teachers in more isolated geographical regions. This
hypothesis will also be tested in this model. There is likely to be some co-linearity between
0 250 500 750
Distance from major city
0.00
400.00
800.00
1200.00
Tota
l num
ber o
f tea
cher
s
151
Mj and Cj as most of the major cities are near the coast. This will be adjusted for in the
model.
Nj, in Equation 5.2, is the overall level of unemployment in a particular location. It could
be expected that an area with a low level of unemployment would tend to attract more
teachers because of better job prospects and therefore an increased quantity of supply of
teachers. Inversely it could be expected that locations with high levels of unemployment
would have a lower teacher/student ratio.
F, in Equation 5.2, represents a vector of variables determining the family situation. These
include gender, marital status, and number and age of children. In this initial model these
variables are assumed to be a constant.
T, in Equation 5.2, is the quantity of trained teachers. This is a function of the numbers of
new graduates, teachers returning from leave, former teachers returning to teaching, the
pool of relief and casual teachers, unemployed teachers and teachers marginally attached to
the labour force, migrating teachers from overseas and interstate and teachers leaving
teaching. There is no available data on the number of trained teachers in particular SLAs at
a particular point in time. For the purpose of this model T will be treated as a constant.

152
5.6.1 A Description of the Sample
ABS 2001 Census Data is used to estimate the model. All high school teachers (36,985),
who were staying in NSW (the 'place of enumeration' 45) on census night, are included in
the data and they are classified according to 190 Statistical Local Areas (SLAs). The
number of students and teachers in particular SLAs refers to their places of enumeration not
specifically where the teachers work or the students attend school. It is assumed in this
model that students and teachers would live close to where they attend and work at schools,
respectively, and as such are satisfactory proxies for the location of school attendance and
place of work. While there would be some net movement between SLAs especially in the
Sydney region, where they are geographically quite close, the difference is assumed to be
minor in other regions.
The relative wage of high school teachers, Wj, is measured by dividing the median income
of high school teachers in a particular SLA, by the median income of all persons in that
SLA, as reported in the 2001 Census. The distances from the coast and major cities were
measured as traveling distances by road. This is considered as a more significant
measurement of transport distances for teachers to travel rather than straight-line
measurement46. This will enable us to examine the importance of traveling distances from
major cities and their amenities as an issue for teachers. The distance from the coast is also
45 The population count for place of enumeration is a count of every person, who spent census night in Australia, based on where he/she was counted, and is the source of population data for this study.
46 2001 Census data (ABS 2003c) shows that almost 80 percent of NSW workers travel to work by car, either as a driver or a passenger.

153
a consideration in terms of changes in climatic conditions. Generally the further a location
is from the coast the more unfavourable are the climatic conditions with greater variations
of temperature. As discussed in Chapter 4, there are allowances for high school teachers in
NSW who live in more isolated and less favourable climatic conditions. These allowances
are already included in the median income of high school teachers and as a result the
relative wage, Wj. Descriptive statistics describing the data sets for the variables from the
19947 SLAs in NSW are displayed in Table 5.1.
Table 5.1 Descriptive Statistics across Regions of NSW, High School Teacher Model
(1)
Statistics
Teacher student
ratio
Teachers/all persons income
Distance from major city (km)
Distance from coast
(km) Unemployment
rate % Population in SLAs Valid 190 190 190 190 190 199 Number Missing 9 9 9 9 9 0
Mean 0.090 1.845 224 164 7.540 31818 Std. Error of Mean 0.003 0.024 13.40 12.41 0.236 3028 Median 0.088 1.849 195 100 7.0 11469 Std. Deviation 0.043 0.335 184 171 3.246 42716 Range 0.330 1.628 740 690 17.70 181443 Minimum 0.020 0.983 10 10 2.00 280 Maximum 0.350 2.611 750 700 19.70 181723
There were no high school teachers living in nine of the SLAs in NSW. There were
considerable differences in the population sizes of the SLAs ranging from a population of
280 in Yarrowlumbla to 181,723 in Wollongong. This contributed to the relatively large
range in the teacher/student ratio between SLAs. The maximum teacher/student ratio
occurred in the inner region of Newcastle at 0.3495 teachers per pupil. Thirty six high
school teachers lived in this SLA but only 103 students. In the inner city SLA of Sydney
there were no teachers living in the region but there were 148 students living there. 47 Not all 199 SLAs in NSW had teachers living in those areas.

154
Obviously in some of the city SLAs there will be movement of both teachers and students
between SLAs from places of residence to schools but in general this is assumed to balance
out. The lower levels of teacher/all person’s income tended to occur in the richer parts of
the Sydney region, with Mosman having the lowest with 0.9834. The highest relative
income levels were in the rural areas with Barraba achieving the highest with 2.6108. The
weekly median income level in Barraba was only $424 compared to the State average of
$618. The lower relative incomes in the country SLAs had the effect of increasing the
relative incomes of teachers compared to the rest of the population in those SLAs. If the
teachers’ incomes in the rural SLAs were compared to the State average of median
incomes, the relative income levels would be considerably lower.
5.6.2 The Model Estimated
The model of high school teacher labour supply for a particular location in NSW will be
estimated using a multiple regression equation. It is assumed four independent variables
are potentially related to the dependent variable. Thus the model is represented by the
following equation:
QSj = β0 + β1 Wj + β2 Mj + β3 Cj + β4 Nj + e (5.3)
QSj is the dependent variable. Wj, Mj, Cj, Nj are the independent variables, β0...β4 are the
coefficients and e is the random error component, made necessary because not all
observations are likely to fall directly on the regression line. It is important to note that the
independent variables may actually be functions of other variables and will require testing
to verify or dismiss these possible relationships.

155
In a competitive model of teacher labour supply it would normally be expected that the
coefficient of teachers’ relative wage would be positive. The higher the relative wage the
greater the quantity of teachers who would wish to work in that location. Normally it
would be expected that individuals would prefer to live in more favourable environmental
conditions closer to the coast and closer to major cities and the amenities they provide. As
a result the coefficients of these two variables would be expected to be negative. The
further the distance from the coast and major cities the lower the supply of teachers would
be. It is expected that the coefficient for the level of unemployment would be negative, as
teachers would be more likely to go to areas where there chances of employment were
greater. So increased unemployment rates would suggest a lower teacher/student ratio.
The data has been processed through SPSS statistical analysis and data management system
to report the following results. Table 5.2 displays the coefficients of the variables. The
least square estimates of the coefficients of the variables appear in Table 5.2 in the column
under the heading ‘B’, thus β0 = 0.151, β1 = -0.039, β2 = 3.060E-5, β3 = 0.151, and β4 =
0.000. The standard errors of the estimators are given in the column under ‘Std Error’. The
T value for testing the null hypothesis given by H0: Bi = 0 i = 0,1,2,3,4 is in the column
headed ‘t’ on the same line as B. The significance of the coefficients can also be tested by
using the p-values reported in the table under the column heading of ‘sig’.

156
Table 5.2 Coefficients of the High School Teacher Model (1)
Variablesa Unstandardised coefficients t Sig.
B Std. Error
(Constant) 0.151 0.018 8.329 0.000
Teachers/all persons income -0.039 0.011 -3.650 0.000
Distance from major city 3.060E-05 0.000 0.918 0.360
Distance from coast 5.804E-6 0.000 0.165 0.869
Unemployment rate (%) 0.000 0.001 0.361 0.719
a. Dependent Variable: Teacher/student ratio
The estimated regression equation is:
QSj = 0.151 - 0.039Wj + 3.060E-05Mj + 5.804E-6Cj + 0.000Nj (5.4)
(0.018) (0.011) (0.000) (0.000) (0.001)
The coefficient of teachers’ median relative income, Wj, is negative. This suggests that a
10 percent change in the teachers’ relative incomes would change the teacher/student ratio
by 0.0039. Considering the median teacher pupil ratio is 0.088077, the change would lead
to a 4.4 percent change in the teacher/student ratio. It suggests that changes in teachers’
relative wages would not only have a negative effect but would also be quiet significant on
the teacher/student ratio in particular locations in NSW. The coefficient of distance from
major city, Mj is positive and very small. This suggests that the further schools are located
from major cities the greater the teacher/student ratio there would be in those particular
locations in NSW. The coefficient for distance from the coast, Cj, is also positive and
small. This suggests that the further schools are located from the coast the greater the
teacher/student ratio there would be in those particular locations in NSW. This also implies

157
that class sizes further from the coast would be slightly smaller. The coefficient of the
unemployment rate, Nj, is zero. It suggests that difference in the unemployment rate has no
influence on the teacher/student ratio in particular locations in NSW.
In an attempt to improve the validity of the model the least useful independent variables
were dropped. The value of the F-statistic for each independent variable remaining in the
model decides which variable to eliminate. The model was improved by dropping distance
from coast. The model was improved further by also dropping the next least useful
variable, the unemployment rate. This produced the model with the highest adjusted R
square value. Tables 5.3 and 5.4 show the new coefficients and regression statistics after
the elimination of these least useful variables.
Table 5.3 Coefficients of the High School Teacher Model (1a)
Variablesa Unstandardized coefficients t Sig. VIF
B Std. Error
(Constant) 0.152 0.017 8.841 0.000 Teachers/all persons income
-0.038 0.010 -3.866 0.000 1.170
Distance from major city
3.547E-05 0.000 2.004 0.046 1.170
a Dependent Variable: Teacher/student ratio
Table 5.4 High School Teacher Model (1a) Summary
R R square Adjusted R square Std. error of the estimate 0.275 0.076 0.066 0.0415
The value of the model increased from an adjusted R square of 5.6 to 6.6 percent. The new
model for teacher labour supply in a location is given by:
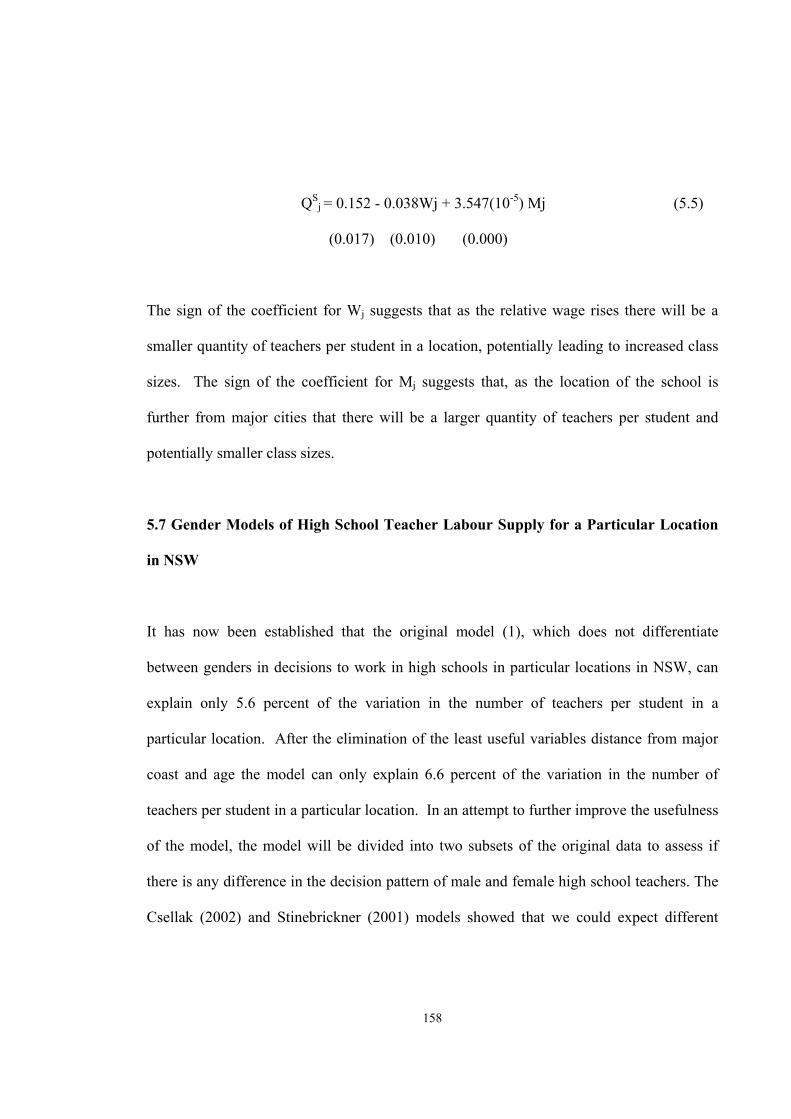
158
QSj = 0.152 - 0.038Wj + 3.547(10-5) Mj (5.5)
(0.017) (0.010) (0.000)
The sign of the coefficient for Wj suggests that as the relative wage rises there will be a
smaller quantity of teachers per student in a location, potentially leading to increased class
sizes. The sign of the coefficient for Mj suggests that, as the location of the school is
further from major cities that there will be a larger quantity of teachers per student and
potentially smaller class sizes.
5.7 Gender Models of High School Teacher Labour Supply for a Particular Location
in NSW
It has now been established that the original model (1), which does not differentiate
between genders in decisions to work in high schools in particular locations in NSW, can
explain only 5.6 percent of the variation in the number of teachers per student in a
particular location. After the elimination of the least useful variables distance from major
coast and age the model can only explain 6.6 percent of the variation in the number of
teachers per student in a particular location. In an attempt to further improve the usefulness
of the model, the model will be divided into two subsets of the original data to assess if
there is any difference in the decision pattern of male and female high school teachers. The
Csellak (2002) and Stinebrickner (2001) models showed that we could expect different
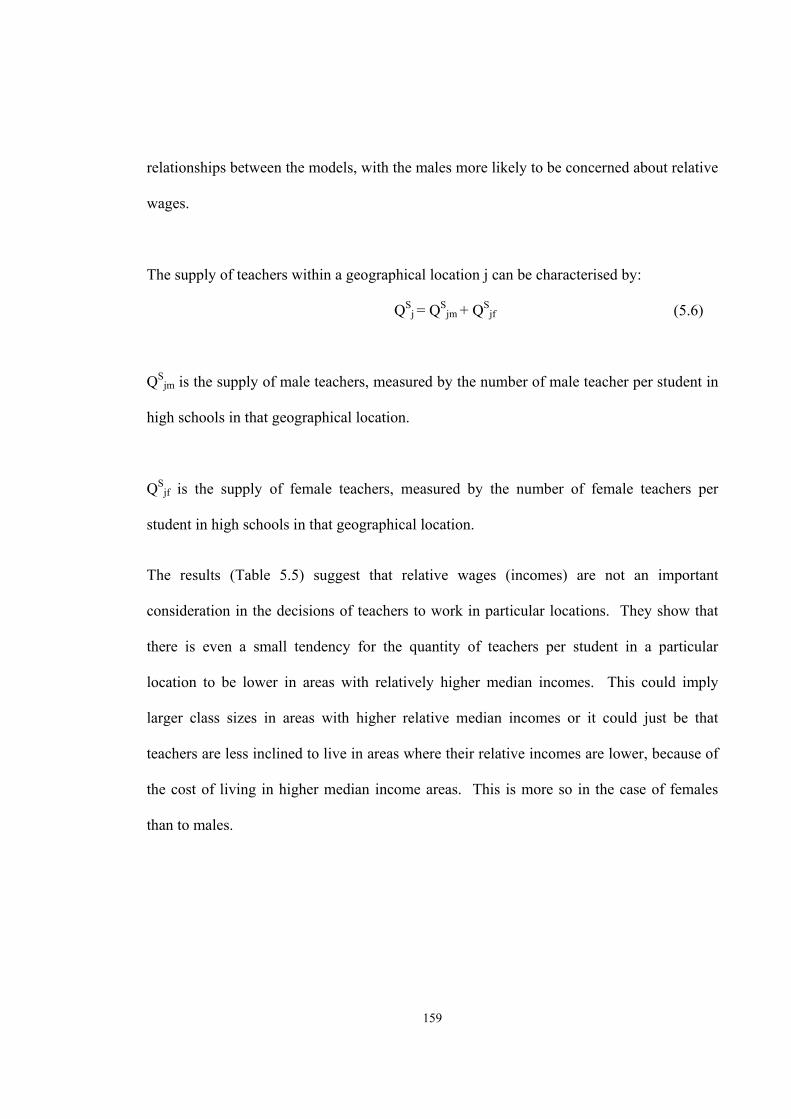
159
relationships between the models, with the males more likely to be concerned about relative
wages.
The supply of teachers within a geographical location j can be characterised by:
QSj = QS
jm + QSjf (5.6)
QSjm is the supply of male teachers, measured by the number of male teacher per student in
high schools in that geographical location.
QSjf is the supply of female teachers, measured by the number of female teachers per
student in high schools in that geographical location.
The results (Table 5.5) suggest that relative wages (incomes) are not an important
consideration in the decisions of teachers to work in particular locations. They show that
there is even a small tendency for the quantity of teachers per student in a particular
location to be lower in areas with relatively higher median incomes. This could imply
larger class sizes in areas with higher relative median incomes or it could just be that
teachers are less inclined to live in areas where their relative incomes are lower, because of
the cost of living in higher median income areas. This is more so in the case of females
than to males.
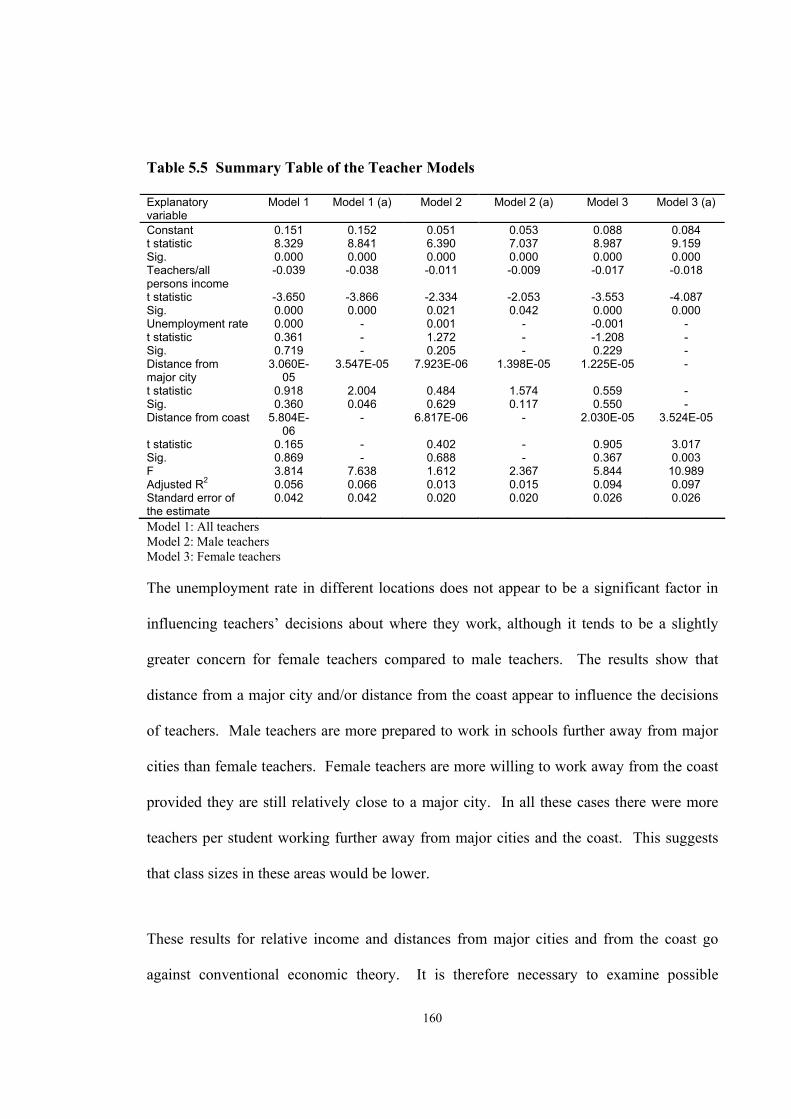
160
Table 5.5 Summary Table of the Teacher Models
Explanatory variable
Model 1 Model 1 (a) Model 2 Model 2 (a) Model 3 Model 3 (a)
Constant 0.151 0.152 0.051 0.053 0.088 0.084 t statistic 8.329 8.841 6.390 7.037 8.987 9.159 Sig. 0.000 0.000 0.000 0.000 0.000 0.000 Teachers/all persons income
-0.039 -0.038 -0.011 -0.009 -0.017 -0.018
t statistic -3.650 -3.866 -2.334 -2.053 -3.553 -4.087 Sig. 0.000 0.000 0.021 0.042 0.000 0.000 Unemployment rate 0.000 - 0.001 - -0.001 - t statistic 0.361 - 1.272 - -1.208 - Sig. 0.719 - 0.205 - 0.229 - Distance from major city
3.060E-05
3.547E-05 7.923E-06 1.398E-05 1.225E-05 -
t statistic 0.918 2.004 0.484 1.574 0.559 - Sig. 0.360 0.046 0.629 0.117 0.550 - Distance from coast 5.804E-
06 - 6.817E-06 - 2.030E-05 3.524E-05
t statistic 0.165 - 0.402 - 0.905 3.017 Sig. 0.869 - 0.688 - 0.367 0.003 F 3.814 7.638 1.612 2.367 5.844 10.989 Adjusted R2 0.056 0.066 0.013 0.015 0.094 0.097 Standard error of the estimate
0.042 0.042 0.020 0.020 0.026 0.026
Model 1: All teachers Model 2: Male teachers Model 3: Female teachers The unemployment rate in different locations does not appear to be a significant factor in
influencing teachers’ decisions about where they work, although it tends to be a slightly
greater concern for female teachers compared to male teachers. The results show that
distance from a major city and/or distance from the coast appear to influence the decisions
of teachers. Male teachers are more prepared to work in schools further away from major
cities than female teachers. Female teachers are more willing to work away from the coast
provided they are still relatively close to a major city. In all these cases there were more
teachers per student working further away from major cities and the coast. This suggests
that class sizes in these areas would be lower.
These results for relative income and distances from major cities and from the coast go
against conventional economic theory. It is therefore necessary to examine possible
161
reasons for these results. The most likely reasons go back to the institutional constraints
discussed earlier in this chapter. The number of teachers in a particular public high school
in a location is determined by Departmental staffing formulas. These formulas allocate a
slightly higher proportion of staff to smaller schools. The schools with the smallest
numbers tend to be further away from the populated city and coastal regions of NSW. The
Catholic systemic schools are subject to similar staffing formulas. It could be expected
therefore that more teachers would be allocated to these schools. The staffing formulas
would lead to an expectation of higher staff student ratios the further that locations are from
major cities and from the coast, which is what these results demonstrate. While this
appears to be an issue of demand, the supply of teachers in a location in 2001 could be
considered as ‘demand driven’ as there was not an overall shortage of teachers in NSW
high schools at that point in time. It is also likely that unemployed teachers would not
move to a new location unless they had been offered a job in that location.
The static nature of this study is a further consideration as to why some of the results defy
the expected outcomes. The majority of teachers in NSW high schools are faced with a
common salary schedule. Changing schools will generally not lead to any change in money
wages for teachers. Teachers who are not satisfied with the relative salary they are
receiving may have already left teaching or will leave at the end of the year. Others who
have been at a school for many years may be happy there and will not be willing to move to
other locations. In some locations there could be unfilled positions, so there could be more
teachers employed in some locations, if there were suitably qualified teachers in those
locations. The Department also applies restrictions on the ability of teachers to move
between schools. Generally a teacher must have taught at least three years in a school
162
before they can even apply for a transfer. The application does not guarantee a transfer.
The transfer also depends on a suitable position being available in the school requested.
Another possible consequence of the differences in relative wages between locations could
be differences in the quality of teachers being employed. There is considerable anecdotal
evidence of a lowering of the standard of the teachers being employed in NSW schools
because of the increasing shortage of qualified teachers in particular subject areas and
geographical locations (Vinson 2002, Canavan 2004). Canavan, Executive Director of
Schools for the Sydney CEO, reported that principals are reporting increasingly that
advertisements for teachers fail to attract ‘suitable applicants’ (2004: 20). In one Catholic
systemic school, with a good reputation, a head teacher referred to the lack of quality
applicants for a particular position leading to the employment of a teacher from a non-
English speaking and cultural background. This teacher was employed rather than having
no teacher in the classroom. It was discovered that the teacher did not have the skills to
teach these students. To avoid this group of students facing the full consequences of this
teacher, the school rotated this teacher with the other Mathematics teachers in that year,
every five weeks, thus sharing the burden. The level of award wages paid to teachers in
particular locations and subjects may not be sufficient to employ the required number of
fully qualified teachers. In some instances this shortfall is made up by employing less
qualified teachers. The effect of this can be seen in Figure 5.4.

163
Figure 5.4: The labour market for qualified and unqualified teachers D1 Sq (qualified) Wage W1 St (qualified and unqualified) W2
q1 qe Quantity of high school teachers
The demand for teachers is based on the staffing formulas set by the educational
authorities. At a particular point in time the demand for teachers will be a constant. The
demand curve will be perfectly inelastic, D1. There will be two possible supply curves Sq,
the supply of suitably qualified teachers and St, the total supply of teachers (suitably fully
qualified and unsuitably qualified48). The number of suitably qualified and unqualified
teachers will be determined by the wage offered by the employing authorities in their
enterprise agreements with the teachers.
At a wage rate of W1, the quantity of supply of fully qualified teachers will be able to match
the quantity demanded. If the wage rate is set below W1, there will be a shortage of fully
qualified teachers at this lower wage. This shortage will be made up from the supply of
unqualified teachers. At a wage rate of W2 there will be quantity q1 qualified teachers
48 The distinction is made that the fully qualified teachers are those trained in teaching students in that subject area and with appropriate educational training and the not suitably qualified are teachers without either or both of these requirements.

164
employed and quantity qe minus q1 unqualified teachers employed. There will be no
official teacher shortage present, at this wage rate, as there are teachers in the classrooms.
The quality of the education is however likely to suffer. Only when the wage rate falls
below W2, will there be a statistically observable teacher shortage.
The model of lower relative wages leading to less qualified teachers is supported by data,
obtained by the Daily Telegraph (Parker 2004) through the Freedom of Information Act,
that shows that in April 2004 there were 41 teachers in NSW public schools teaching
Mathematics who were not qualified Mathematics teachers. In addition the NSW DET had
set up a program advertising for teachers to be retrained as Mathematics teachers in six
months on full pay, much less than the normal period of up to four years.
At this point the significance of wage relativities on the supply of teachers is questionable.
The next section of this chapter will explore the effect of changes in teacher relative wages
over time on the employment decisions of male and female teachers.
5.8 A Time Series Study of Changes in the Relative Wages of Male and Female
Teachers in NSW High Schools 1976-2002
The previous models considered the median relative incomes of teachers in NSW, based on
2001 Census data. The following time series study will compare the average weekly
earnings of male and female teachers in Australia to the level of average weekly earnings

165
for all adult males and females in Australia49. As can be seen in Figure 5.5 there has been a
general decline in the relative earnings of both male and female teachers in the period.
In 1976 the average earnings of a male teacher was 14.7 percent higher than male average
weekly earnings and for a female teacher it was 23.5 percent greater than average female
weekly earnings. By 2002 the average weekly earnings of male teachers had fallen to less
than male average weekly earnings (-0.3 percent), while female earnings had declined to be
17.6 percent more than female average weekly earnings. The relative earnings of male
teachers have declined 20 percentage points in the period 1976 to 2002, while the relative
earnings of female teachers have declined only 5.9 percentage points.
Figure 5.5: The relative average weekly earnings of male and female teachers in Australia 1976-2002
0.9
1
1.1
1.2
1.3
1.4
1976
1986
2000
Years
Rat
ios Male teacher earnings to male
AWE
Female teacher earnings tofemale AWE
Source: Australian Bureau of Statistics, Employee Earnings and Hours, Cat. No. 6306.0. 49 Due to changes in ABS classifications in the period 1977 to 2003 the average wages for males and female teachers are for all teachers not just high school teachers. For years with data specifically on high school teachers their average wages are five to six percent higher than that for primary teachers. Changes in teacher salaries have generally been similar over the time period between states.

166
In the period 1977 to 2003 the number of high school teachers in NSW increased 42.4
percent. The number of female high school teachers increased by 70 percent, while the
number of male teachers rose by only 18.7 percent. In 1977 the ratio of male teachers to
female teachers in NSW high schools was 1.16 to 1, rising to 1.25 to 1 in 1981. The
decline in the male/female teacher ratio began after the 1983 economic recession. By 1991
there were more female teachers in NSW high schools than male teachers. By 2003 the
ratio of male to female teachers had fallen to 0.81 (Figure 5.6).
Figure 5.6: The ratio of males to female teachers in high schools in NSW, 1977–2003
0.7
0.8
0.9
1
1.1
1.2
1.3
1977
1979
1981
1983
1985
1987
1989
1991
1993
1995
1997
1999
2001
2003
Years
Rat
io
Source: Australian Bureau of Statistics, Schools Australia, Cat. No. 4221.0
The decline in the relative number of male teachers accompanied the relatively larger
decline in relative earnings for male teachers. The relative earnings of female teachers was

167
not only greater in absolute terms but had also declined by a smaller proportion than the
relative earnings for male high school teachers during the period.
Since 1988 there has been a decline in absolute terms in the number of male teachers in
NSW high schools by 2.7 percent from 17,961 to 17,485 and an increase in the number of
female teachers in NSW high schools by 31 percent from 16,474 to 21,580. At the same
time the relative wage for male teachers declined by 10 percentage points. There appears to
be a link between the time series data on relative wages and the quantity of teachers, at least
in the case of males. The decline in the relative wage of males is associated with fewer
males teaching in high schools in NSW. The relationship with female teachers is more
complex as the decline in the relative wage of females has been less and the relative wage
of female teachers is still more than 17 percent higher than other females in the workforce.
These factors would tend to make teaching an attractive proposition for females at least for
the time being. The proportion of male teachers in NSW high schools was highest when
the relative wage of male teachers was at least ten percent higher than male average weekly
earnings.
5.9 Male Teachers and Relative Wages The importance of relative wages to males in regard to teaching is supported by research
conducted by Lewis and Butcher (2002). They surveyed 1413 Year 12 students from 15
Catholic schools in the Sydney Diocese, representing 58 percent of a total potential
population of 2436 Year 12 students across the diocese. There were 1059 male and 354
female respondents: a ratio of 75 percent to 25 percent. The study showed that teaching

168
was not seen as an attractive career choice by males compared to females. Fifteen point
two percent of the females’ surveyed intended to become teachers but only 5.9 percent of
the male respondents stated the same intention. When the data for those who intended to
pursue teaching was analysed with respect to the gender of the respondents the following
differences were found. More of the males agreed to, or found, the following factors
attractive:
• high public professional status;
• good salary;
• promotion and career opportunities;
• predicted demands for teachers; and
• working with communities.
More of the female respondents found the following factors attractive:
• being able to help others;
• good working hours and holidays; and
• offers a secure job.
The differences between male and female responses related to good salary (Chi-square
value 7.1, df =1, significance 0.008) and promotion and career opportunities (Chi-square
value 8.37, df =1, significance 0.004) were statistically significant. Only 13.6 percent of
respondents, who considered teaching but had decided not to pursue that career, believed
that teachers had a ‘good salary’ compared to 19.8 percent who intend to become teachers.

169
Results of surveys of current high school teachers in NSW in regard to the importance of
wages also showed that it was a more important consideration for male teachers than
female teachers. (These results will be examined in Chapter 6 of this thesis).
5.10 The Private Rate of Return for Teachers
A further factor that is likely to influence the decisions of people to seek employment as
teachers or follow alternative career paths is the private rate of return for teachers compared
to other occupations. There have been a number of studies (Miller 1982, Maglen 1994,
Borland 2000, Johnson and Lloyd 2000, Borland 2001, Lewis 2004) of private rates of
return to higher education in Australia (see Table 5.6). Only two studies have attempted to
measure the private rate of return for teachers. Chapman and Salvage (1997) and
Productivity Commission (1997) show that the private rate of return for teachers is below
the average private rate of return for higher education. In addition the private rate of return
for male teachers is considerably lower than the rate of return for female teachers. There is
also a difference in rates of return between teachers depending on the courses that they
studied (Table 5.7). Teachers who study higher HECS band courses such as Business,
Computing, Economics, Law, Mathematics and Science have lower private rates of return
than those who study English, History and Art. The implications of this can be
demonstrated by comparing the private rates of return for computer professions compared
to computer teachers. The private rate of return for computer professionals was estimated
by the Productivity Commission (1997) at 20.8 percent but the private rate of return for a
male computer teacher in a school was only 6.1 percent.

170
Table 5.6 Measurements of the Private Rate of Return to Higher Education
Study Private rate of return (%) Miller (1982) 21.1 Maglen (1994) 13.5 Chapman and Salvage (1997) 9.4 Johnson and Lloyd (2000) 13.4 Borland (2001) 14.5 Lewis et al. (2004) 15.9 Source:Lewis et al.(2004), Borland (2001).
Table 5.7 Measurements of the Private Rate of Return to Teaching (%)
Source Occupation Male Female Average Productivity Commission (1997)
Teacher Ia 6.5 13.2 10.4
Teacher IIb 6.1 13.0 10.1 Chapman and Salvage (1997)
Teacher IIb 5.7 12.3
a Teacher I is an English/History teacher b Teacher II is a Mathematics/Science teacher Source: Productivity Commission (1997), Chapman and Salvage (1997).
5.11 Teacher Salary Relativities: A Benchmarking Approach
Another approach in examining the relative wage of high school teachers in NSW
compared to other occupations is by benchmarking. Horsley and Stokes (2005) conducted
a benchmarking exercise comparing teachers in NSW with four other areas of employment
that teachers might consider. For this benchmarking research project a leading
international firm, Mercer Human Resource Consulting undertook a remuneration
benchmarking study of private sector positions, job descriptions, and salaries in four job
families in Australia.
171
Job families are classifications of private sector occupational groups that reflect common
training and expertise. Human resources firms typically develop job families as a way of
classifying skills and experiences across a range of occupations. The project team required
Mercer to collect data on four job families:
• Information Technology;
• Finance and Administration;
• Engineering and Scientific; and
• Human Resources.
The job families were selected to enable a comparison between teaching and a large range
of professional occupations and to compare within these job families, where clear salary
pressure is evident. For example the Science and Engineering job families that Mercer
collected data on reflected a number of private sector occupations covered by ABS
employment classification data.
An important consideration in this benchmarking project was the development of
descriptions of the benchmarking positions covered in this study. These were developed by
Mercer and allow a comparison to be made between teachers and other professional groups.
This benchmarking exercise showed that teachers are paid substantially less for comparable
work and responsibilities compared to the private sector. As the level of experience and
qualifications in teaching increase the gap widens between the groups. The difference is
most reflected at the top end of the salary scales, where teachers are not able to reach the
over $100,000 salary levels that are available in the all the private sector job families
benchmarked in this study.
172
For example, of the professions selected for comparison with the private sector, teaching
positions are somewhat comparable with the private sector in Information Technology.
The most direct comparison could be made between Computer teachers and IT workers. In
many instances schools are competing directly with the private sector for teachers with
qualifications in the IT field. IT is also one of the fields highlighted by the National and
State Skill Shortage Lists for Australia (2003) as an area of teacher shortage. A comparison
was made between the two job families over a number of salary bands.
Band A - School Teacher Steps 5-13 ($39,000- $55,000)
Teachers in this range would have at least a four-year degree combining IT and Education.
They would have up to seven years experience in teaching IT subjects in schools and some
would have other relevant industry experience. They would not only know the content
matter of the IT industry but would have the training to convey this knowledge to others.
IT positions in the private sector identified by Mercer typically require a level of experience
ranging from one to six years and formal qualifications ranging from nil to Higher School
Certificate to a degree or diploma.
One example of a private sector IT position matching indicators for positions with a median
salary within the teacher range of $39,000 - $55,000 is that of a Trainee Programmer. The
Trainee Programmer typically has less than one year’s experience with a three or four year
degree or diploma and is paid in a salary range $37,033, $38,657, $49,64550. A three-year
trained teacher with less than one’s years experience would be earning $35,305, while a
50 The salary data is expressed as an interquartile range for the salary selected.

173
four year trained teacher would receive $39,151. A four year trained teacher would need to
have six years experience to be earning $49,000.
Band B - Executive or Head Teacher – ($56,000 - $64,000)
The head teacher of IT could be most closely benchmarked to an Information Technology
Training Manager on a salary level generally between $58,000 and $77,000. The teacher
would generally have 10 or more years teaching experience and have been selected to be
in-charge of IT and be responsible for managing all the operations of that department. The
Information Technology Training Manager in the private sector has extensive experience
developing and delivering training, as well as experience managing an IT unit or similar
training function.
This benchmarking analysis shows that there is a degree of convergence between the job
descriptions of private and school sector positions. Whilst the Training Manager position
can be compared to that of a teacher in charge of IT (an executive teacher), the actual
description does not reflect the full range of tasks of an executive teacher.
Band D Principal – ($79,000 -$95,000)
A school principal could be most directly benchmarked to the Principal Manager of
Information Systems. The High School Principal Grade 1 (PH1) ($90,572) is a highly
experienced teacher who is responsible for the management, organisation, administration,
supervision, and efficiency of a school and all departments in a school with in excess of

174
900 students and with more than 70 staff. The principal MIS executive typically has a three
to five year degree or diploma and over 15 years experience in an IT environment, with at
least 30 staff and an installation cost greater than $900,000. The principal MIS executive is
generally paid in the salary range from $120,000 to $250,000, well in excess of what the
school principal would earn.
What this benchmarking analysis shows is how private sector salaries influence the teacher
labour market. Horsley and Stokes (2005) concluded that because of the poor relative
salaries at all levels of teaching compared to the private sector, potential teachers in the IT
field have been attracted to the private sector by the higher salaries on offer for positions
offering less training, skills and qualifications. In addition IT professionals tend to be
highly mobile and demonstrate enthusiasm for change. They regularly move for
employment opportunities and career progression, enhancement, and job security.
An analysis of the benchmarking exercise carried out between the teaching profession and
the Finance and Administration job family found that there were 20 private sector positions
clearly attracting salaries in the private sector greater than that of the highest teacher salary,
that of principal (PH1). A number of these positions pay salaries in excess of 150 percent
more than that received by the highest paid school principal and had similar managerial
requirements.

175
5.11 Conclusion
The use of traditional labour market models to measure the importance of wage relativities
and other factors on the teacher labour market in NSW high schools is limited. This is due
to a number of factors. Not least of which is the role and institutional control of the NSW
Department of Education and Training, the major employer of teachers in NSW. The DET
determines the placement of teachers throughout the NSW public school system. Teachers
cannot move freely inside the public school system and this limits their ability to move
between locations in response to changes in wages and conditions. The wage fixing system
is also highly centralised with teachers in public and Catholic systemic high schools
following the same salary schedule, with only relatively minor differences applying in the
private school system. The absence of an aggregate shortage of teachers at the time of the
census survey also limits the measurement of teacher labour supply in a location as the
quantity supplied is largely in response to the quantity of teachers demanded in a particular
location. The measurement of teacher labour supply is also limited as there is no data
available on the quality of the teachers who are working or willing to work. There is
considerable anecdotal evidence that lower relative wages may not initially reflect a lower
supply of teachers but rather a lowering of the quality of teachers. There are some relevant
variables that cannot be observed by the model, such as marital status and family structure
and differences in living and working conditions between schools and locations.
If the results of the static models are accepted as valid, then there is the implication that
lower relative wages will lead to an increase in the quantity of teachers per student. The
time-series data has shown that in the case of male high school teachers in NSW, that this is

176
not true. As the earning relativities of male teachers declined so did the quantity of male
teachers in NSW high schools. The time-series data showed that there had been an increase
in the proportion and quantity of female high school teachers in NSW despite a small
decline (5.9 percent) in relative earnings over the 27-year period.
The benchmarking study showed that teachers could earn relatively higher wages in other
occupations with similar levels of responsibilities and qualifications. Some teachers have
moved to these more financially rewarding occupations but many still stay in teaching.
Wage relativities do have some influence but are not necessarily the main factor that
determines teachers’ decisions to teach or not to teach. The relative importance of wages
compared to nonwage amenities will be explored in the next chapter to try and gain a
clearer picture of what factors influence teachers in NSW high schools and the relative
importance of these factors in the decision of being a teacher.

177
Chapter 6. A Survey of Teachers in NSW High Schools on the Influence
of Salaries and Nonwage Amenities in Determining Job Satisfaction
6.1 Introduction
The aim of this chapter is to discover the main factors and the relative importance of those
factors in influencing the overall job satisfaction of teachers in NSW high schools. Job
satisfaction can be defined as an overall feeling about one’s job or career or in terms of
specific facets of the job or career (e.g., compensation, job security, level of support). It
also is a major factor in determining the utility of a worker (see Chapter 2). A teacher’s
satisfaction with his or her career may influence the quality and stability of instruction
given to students. Ostroff (1992) and Ashton and Webb (1986) argue that teachers who do
not feel supported in their work may be less motivated to do their best work in the
classroom. In addition, highly satisfied teachers are less likely to change schools or to
leave the teaching profession altogether, than those who are dissatisfied with many areas of
their work life (Choy, Bobbitt et al. 1993). Workplace conditions that affect not just
current job satisfaction, but satisfaction with teaching as a career, need to be identified and
examined by policy makers. If these conditions can be improved through changes in
policy, then it might be possible to increase the satisfaction levels of the teaching force.
This may lead to an improved retention rate and also attract more university graduates to
the teaching profession. The greater job satisfaction can also lead to increased teacher
178
effectiveness, which ultimately affects student achievement (Ashton and Webb 1986,
Carnegie Task Force on Teaching 1986).
6.2 Methodology of the Study
The aim of the study was to survey teachers across the three categories of school systems in
NSW high schools to determine the importance of various factors on their level of
satisfaction as a teacher. A request was made to the NSW Department of Education and
Training (DET) and the regional Catholic Education Offices (CEOs) to survey teachers in a
randomly selected group of high schools in NSW. The DET and all but one of the CEOs
granted their permission. Each organisation stipulated the condition that the authority was
only given, if the principals of the selected schools agreed for their staff to be surveyed. As
there was no controlling authority for independent schools each of these schools’ principals
was contacted separately. Initially 100 requests were sent out at random to 60 public
schools and 20 catholic and 20 independent school principals. The principals were asked to
select 15 teachers at random and ask them if they would like to participate in the study.
The number of teachers per school was selected to gain a diverse sample of views on the
issues to be surveyed and to provide information that would be representative of the three
school systems and the different geographical regions of NSW. Individual participation in
the surveys, by the teachers, was voluntary and anonymous. The conduct of the survey
involved a teacher receiving an envelope with an information sheet, a survey and a reply
paid envelope. The first round of 100 requests and follow up resulted in only seven high
school principals giving permission for their staff to be surveyed. Despite follow up
communication with the principals, there appeared to be reluctance on their part to be

179
involved in the study. Some replied that they had too much work to do to be involved
while others said that they did not want to put any more burdens on their ‘overworked’
staff. Others were just not interested. Another possible reason could be that the principals
did not want their staff expressing opinions about their level of satisfaction with the school,
which may reflect on the principal’s performance. Altogether it required requests to almost
400 high schools in NSW to obtain the sample of 269 teachers, who were surveyed in this
study. The time frame for completion of the surveys ranged from the middle of 2000 to the
beginning of 2003.
One concern with this process, but the most feasible way of contacting a diverse group of
teachers, was the possibility of bias by principals in deciding the teachers that they chose.
Selecting a sample of teachers from representation at conferences or through union
membership, which may have provided a larger sample in numerical terms, could have
potentially had a greater bias. Principals could also control conference attendance by
teachers and weekend conference attendance might be likely to attract the more enthusiastic
teachers or those without weekend commitments. Overall I believe that the sample is as
valid as possible considering the restrictions placed on the research by the DET, CEOs, and
the school principals. The range of gender, age, qualifications, locations and school
systems does provide a diverse sample and generally the sample numbers in various
categories do allow for testing of the validity of the results.
The teacher survey (see Appendix A) classified teachers based on:
• gender;
• age;

180
• years of teaching experience;
• qualifications;
• salary;
• whether the teachers have supplementary income sources;
• location of the school;
• place of residence;
• type of school;
• non-English speaking background of the school;
• main field of teaching; and
• main classes taught.
The teachers were asked to rate, on a 1-5 scale, the importance of various factors51 in measuring their job satisfaction. Those factors were:
• level of salary;
• job security;
• a low level of stress;
• number of holidays;
• hours of work;
• support and encouragement from administration;
• the attitude and support of peers;
• the attitude and support of students;
• the satisfaction of student achievement;
• the support of the students’ parents; 51 The factors were based on surveys of teacher satisfaction in NSW by Dinham and Scott (1997) and in the USA by National Center for Education Statistics (1997).

181
• attitude of the general public towards teachers;
• the support of your family;
• interest in the subjects taught;
• the possibility of promotion.
The teachers were also asked how they would rate their current level of satisfaction on a 1-
5 scale of the same factors.
The teachers were also asked questions relating to:
• How long they planned to remain in teaching?
• If they had the opportunity to choose a career again, would they still become a
teacher?
• What were their opinions on the levels of teachers’ salaries?
• Would they leave teaching to go to an occupation that provided them with a 10%
higher salary?
• How difficult did they think it would be for them to change careers?
• Whether they have changed from one education system to another and the reasons
for that change?
6.3 A Description of the Sample
The survey provided data on 269 respondents, made up of 127 (47.4 percent) males and
141 (52.6 percent) females with one missing response (Table 6.1). The highest percentage
of teachers (34.2) was in the age range 40-49 years (Table 6.2). The sample group was

182
overall quite experienced with 75 percent of teachers having 10 or more years teaching
experience (Table 6.3). There was a spread of teachers throughout locations in NSW with
59.7 percent teaching in Sydney, 31 percent in country areas and a further 9.4 percent in the
Newcastle–Wollongong city areas (Table 6.4). The teachers were also spread across the
three education systems, with 49.3 percent teaching in public schools, 28.4 percent in
Catholic schools and 22.4 percent in other private schools (Table 6.5). The following
tables also provide comparison data on the actual percentages of teachers in various
categories in NSW high schools where they are available. Further details of the surveyed
group can be found in Appendix B.
Table 6.1 Gender Distribution of Teachers’ Surveyed and Actual Percentages in
NSW High Schools
Gender Frequency Percent Valid percent Actual percent in
2002a
Male 127 47.2 47.4 44.8 Female 141 52.4 52.6 55.2
Valid
Total 268 99.6 100.0 100.0 Missing System 1 0.4 Total 269 100.0 a Australian Bureau of Statistics. Schools Australia, Cat. No 4221.0.

183
Table 6.2 Age Distribution of Teachers Surveyed and Estimated Percentages in NSW
Schools
Age distribution Frequency Percent Valid percent Estimated percent
in 2002b
Valid Under 30 46 17.1 17.1 19.0 30-39 57 21.2 21.2 25.0 40-49 92 34.2 34.2 30.0 50-59 67 24.9 24.9 23.0 Over 59 7 2.6 2.6 3.0 Total 269 100.0 100.0 100.0 b This figure is based on DEST (2003) staffing surveys in 2002 for all schools in NSW.
Table 6.3 Distribution of Teachers Surveyed Based on Teaching Experience
Years Frequency Percent Valid percent Valid 0-3 26 9.7 9.7 4-9 40 14.9 14.9 10-19 82 30.5 30.5 20 or more 121 45.0 45.0 Total 269 100.0 100.0 Table 6.4: Distribution of Teachers Surveyed Based on the Location of the School
Location Frequency Percent Valid percent Valid Sydney - inner city 15 5.6 5.6 Sydney - north 28 10.4 10.4 Sydney - south 53 19.7 19.8 Sydney - east 26 9.7 9.7 Sydney - west 38 14.1 14.2 Newcastle 5 1.9 1.9 Wollongong 20 7.4 7.5 Country 83 30.9 31.0 Total 268 99.6 100.0 Missing System 1 0.4 Total 269 100.0
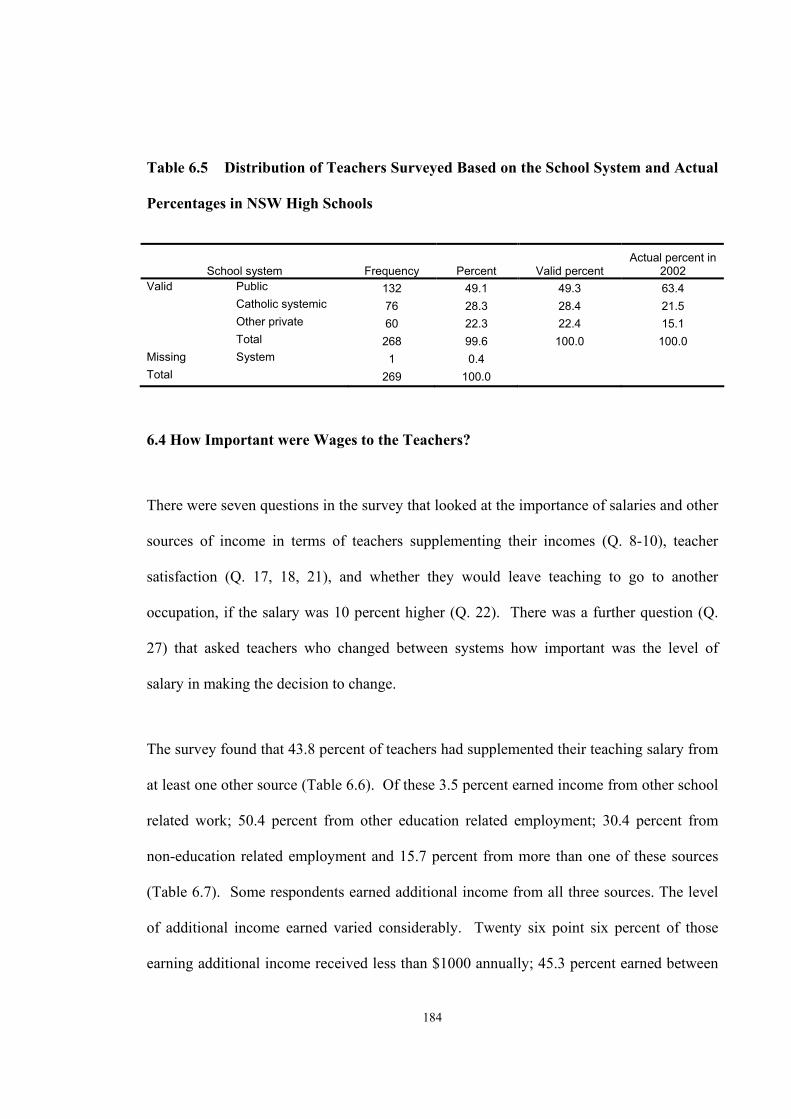
184
Table 6.5 Distribution of Teachers Surveyed Based on the School System and Actual
Percentages in NSW High Schools
School system Frequency Percent Valid percent Actual percent in
2002 Valid Public 132 49.1 49.3 63.4 Catholic systemic 76 28.3 28.4 21.5 Other private 60 22.3 22.4 15.1 Total 268 99.6 100.0 100.0 Missing System 1 0.4 Total 269 100.0
6.4 How Important were Wages to the Teachers?
There were seven questions in the survey that looked at the importance of salaries and other
sources of income in terms of teachers supplementing their incomes (Q. 8-10), teacher
satisfaction (Q. 17, 18, 21), and whether they would leave teaching to go to another
occupation, if the salary was 10 percent higher (Q. 22). There was a further question (Q.
27) that asked teachers who changed between systems how important was the level of
salary in making the decision to change.
The survey found that 43.8 percent of teachers had supplemented their teaching salary from
at least one other source (Table 6.6). Of these 3.5 percent earned income from other school
related work; 50.4 percent from other education related employment; 30.4 percent from
non-education related employment and 15.7 percent from more than one of these sources
(Table 6.7). Some respondents earned additional income from all three sources. The level
of additional income earned varied considerably. Twenty six point six percent of those
earning additional income received less than $1000 annually; 45.3 percent earned between

185
$1000 and $3000; 15.8 percent earned $3001-$6000 and 12.2 percent earned in excess of
$6000 (Table 6.8).
Table 6.6 Teachers’ Supplementary Income
Supplementary income Frequency Percent Valid percent Cumulative percent Yes 116 43.1 43.8 43.8 No 149 55.4 56.2 100.0
Valid
Total 265 98.5 100.0 Missing System 4 1.5 Total 269 100.0
Table 6.7 Source of Supplementary Income
Source of supplementary income Frequency Percent Valid percent Cumulative
percent Other school income 4 1.5 3.5 3.5
Other education related employment 58 21.6 50.4 53.9
Non-education employment 35 13.0 30.4 84.3
More than 1 other source 18 6.7 15.7 100.0
Valid
Total 115 42.8 100.0 Missing System 154 57.2 Total 269 100.0
Table 6.8 Annual Additional Income
Income Frequency Percent Valid percent Cumulative
percent Under $1000 37 13.8 26.6 26.6 $1000-$3000 63 23.4 45.3 71.9 $3001-$6000 22 8.2 15.8 87.8 Over $6000 17 6.3 12.2 100.0
Valid
Total 139 51.7 100.0 Missing System 130 48.3 Total 269 100.0

186
These results show that many teachers do not consider that their salary is sufficient and
work extra hours supplementing their teacher salaries. In order to earn an additional
income in excess of $3000, it would generally be expected that quite a deal of time would
be allocated to these tasks. For those earning in excess of $6000, the time would be even
greater. The amount of time that it would take to earn the additional income would vary
depending the nature of the additional source of income and the hourly rate of pay. For
example, a teacher working extra hours as a cleaner may receive $20 per hour, so it would
take 300 hours of work or six hours a week to earn $6000. A teacher involved in School
Certificate and Higher School Certificate marking may expect to earn $50 per hour, so it
would take 120 hours of work or approximately 2.5 hours a week to earn $6000. In
addition there would most likely be travelling time also associated with earning extra
income. The time allocated to this extra work is time that is not being devoted to teaching
tasks or allocated to leisure. This could lower the quality and/or quantity of the teaching
and subsequently the educational outcomes for students.
There are also considerable differences in the responses towards earning additional income
from male and female teachers. A much greater percentage of male teachers (54.4) earn
additional sources of income compared to female teachers (34.5) (Table 6.9). The Chi-
square test shows that it can be concluded with a 99 percent confidence level that earning
additional sources of income is not independent of the gender of the teacher. This may
reflect the different roles of males and females in society, with the married male teachers
more likely to be the sole income earner and the married female teachers more likely to be
involved in family duties after school hours. In addition the males are more inclined to
have a number of sources of additional income and are more likely to pursue employment

187
not related to teaching (Table 6.10). While 62.7 percent of females pursuing extra income
tend to rely on education related employment, compared to 40.6 percent for males, 34.4
percent of males rely on non-education employment compared to 25.5 percent of females.
An additional 21.9 percent of males gain income from more than one source compared to
only 7.8 percent of females. The Chi-square test shows that it can be concluded with a
greater than 90 percent confidence level that the number of additional sources of income is
not independent of the gender of the teacher. Male teachers are not only more likely to
seek extra sources of income compared to female teachers, but also out of those who do
engage in additional employment, males earn a considerably higher level of income
compared to the female teachers (Table 6.11). Thirty five percent of female teachers, who
earn additional income, receive less than $1000 per annum, compared to 18.7 percent of the
male teachers. Twenty two point seven percent of male teachers earn between $3001 and
$6000 compared to 7.9 percent of female teachers. An additional 16 percent of male
teachers earn in excess of $6000 additional income compared to 7.9 percent of female
teachers. The Chi-square test shows that it can be concluded with a 98 percent confidence
level that the level of additional sources of income is not independent of the gender of the
teacher. These results support the view that male teachers are more concerned about the
level of income that they receive than female teachers and take more steps to gain higher
incomes. These results would tend to suggest that the average weekly earnings data in
Chapter 5 overestimates the average weekly earnings, just from teaching, of male teachers
compared to female teachers.

188
Table 6.9 Income Supplementation of Teachers, Based on Gender
Gender Income supplementation Male Female Total
Count 68 48 116 Yes % within supplement income
58.6% 41.4% 100.0%
Count 57 91 148
No % within supplement income
38.5% 61.5% 100.0%
Count 125 139 264 Total % within supplement income
47.3% 52.7% 100.0%
Chi-Square Tests
Test Value df Asymp. Sig. (2-sided) Pearson Chi-Square 10.546 1 0.001 Continuity Correction 9.755 1 0.002 Likelihood Ratio 10.604 1 0.001 Linear-by-Linear Association
10.506 1 0.001
N of Valid Cases 264 Table 6.10 Other Income Sources, Based on Gender
Gender Other income source Male Female Total
Count 2 2 4 Other school income % within Other
income source 50.0% 50.0% 100.0%
Count 26 32 58 Other education related employment % within Other
income source 44.8% 55.2% 100.0%
Count 22 13 35 Non-education employment % within Other
income source 62.9% 37.1% 100.0%
Count 14 4 18
More than one other source % within Other
income source 77.8% 22.2% 100.0%
Count 64 51 115 Total % within Other income source 55.7% 44.3% 100.0%

189
Chi-Square Tests Test Value df Asymp. Sig. (2-sided) Pearson Chi-Square 7.112 3 0.068 Likelihood Ratio 7.373 3 0.061 Linear-by-Linear Association 6.406 1 0.011 N of Valid Cases 115 Table 6.11 Annual Additional Income, Based on Gender
Gender Annual additional income Male Female Total
Count 14 22 36 Under $1000 % within annual additional income 38.9% 61.1% 100.0%
Count 32 31 63 $1000-$3000 % within annual additional income 50.8% 49.2% 100.0%
Count 17 5 22 $3001-$6000 % within annual additional income 77.3% 22.7% 100.0%
Count 12 5 17
Over $6000 % within annual additional income 70.6% 29.4% 100.0%
Count 75 63 138 Total % within annual additional income 54.3% 45.7% 100.0%
Chi-Square Tests
Test Value df Asymp. Sig. (2-sided) Pearson Chi-Square 10.256 3 0.017 Likelihood Ratio 10.650 3 0.014 Linear-by-Linear Association 8.457 1 0.004 N of Valid Cases 138
Question 21 asks teachers their opinions of the level of teachers’ salaries and had five
possible responses:
• very good;
• good;
• satisfactory;

190
• unsatisfactory;
• poor.
While both male and female teachers largely had similar attitudes to the level of teachers’
salaries, a higher percentage of males tended to find the level of salaries unsatisfactory or
poor (56.7 percent) compared to 48.2 percent of female teachers (Table 6.12). Only 11.8
percent of male teachers and 13.5 percent of female teacher thought that their wages were
good or very good. The Chi-square test shows that it can be concluded with only a 25
percent confidence level that teachers’ attitudes to their salaries are not independent of the
gender of the teacher.
Table 6.12 Teachers’ Attitudes to their Salaries
Teachers’ salaries Gender Very good Good Satisfactory Unsatisfactory Poor Total
Male 2 13 40 50 22 127 Female 2 17 54 46 22 141
Total 4 30 94 96 44 268
Chi-Square Tests
Test Value df Asymp. Sig. (2-sided) Pearson Chi-Square 2.059 4 0.725 Likelihood Ratio 2.063 4 0.724 Linear-by-Linear Association 1.023 1 0.312 N of Valid Cases
268
Question 22 was designed to find out if teachers would change occupations, if they were
offered higher salaries in the other occupation. The question asked teachers whether they
would leave teaching to go to another occupation, if it provided them with a 10 percent
higher salary, and offered five possible responses:

191
• definitely;
• probably would;
• unsure;
• probably would not;
• definitely would not.
Nine percent of respondents said that they would definitely leave teaching, if they could
gain a 10 percent increase in salary in another occupation (Table 6.13). A further 19.8
percent responded that they would probably leave teaching. While this demonstrates that
wage relativities (at least at a level of 10 percent) are important for some teachers, it is not
highly important for all. There were considerable differences in responses between males
and females. Eleven point three percent of female teachers said that they would definitely
change occupations for a 10 percent salary increase compared to only 6.3 percent of male
teachers. In addition, 18.1 percent of male teachers definitely would not leave teaching
compared to 10.6 percent of female teachers. The Chi-square test shows that it can be
concluded with greater than 90 percent confidence level that teachers’ attitudes to leaving
teaching for a relatively higher salaries are not independent of the gender of the teacher.
Table 6.13 Relative Salaries and Job Choice
Leave teaching
Gender Definitely Probably
would Unsure Probably would not
Definitely would not Total
Male 8 25 28 43 23 127 Female 16 28 45 37 15 141
Total 24 53 73 80 38 268

192
Chi-Square Tests
Test Value df Asymp. Sig. (2-sided) Pearson Chi-Square 8.221 4 0.084 Likelihood Ratio 8.299 4 0.081 Linear-by-Linear Association 5.201 1 0.023 N of Valid Cases 268
There are a number of possible explanations for these results. It is possible the difference
in the response between males and females teachers reflects the relatively lower wages of
male teachers compared to other males in comparison to the wage of female teachers
compared to other females (Figure 5. 4) that has existed for a number of years. As shown
in Figure 5.5, the decline in the ratio of male teachers to female teachers, that has occurred,
could indicate that many male teachers who were dissatisfied with their salary have already
left the profession. This is also reflected in the higher percentage of males, who have opted
to stay in teaching despite wage levels below male average weekly earnings, who would
definitely not leave teaching for a 10 percent salary increase. Another important
implication of the responses for this question is that, if the relative wages of female teachers
continue to fall (Figure 5.4), there could be an exodus of female teachers also from the
teaching profession. Allowing for the projections, that already exist, of teacher shortages in
the second half of the first decade of the 21st century, this would worsen the situation
considerably.
Question 27 asked teachers, who had changed school systems how important was the level
of salary in their decision to change. The responses showed that the level of salaries
between school systems was viewed by the respondents as having little importance in the
decision to change between school systems (Table 6.14). The median result on the five

193
possible response scale was 2.0, which reflected ‘little importance’. Only 9.1 percent of the
respondents who changed school systems considered the level of salary as being ‘very
important’ compared to 40.9 percent who considered it ‘very unimportant’ in their decision.
This result may also help to explain the failure of the economic modeling in Chapter 5 to
provide a clear link between changes in relative wages and the locations where teachers
were available to be employed (supply).
Table 6.14 The Importance of the Level of Salary in Changing School Systems
Level of importance Frequency Percent Valid percent Cumulative
percent Very unimportant 36 13.4 40.9 40.9 Little importance 12 4.5 13.6 54.5 Neutral 21 7.8 23.9 78.4 Some importance 11 4.1 12.5 90.9 Very important 8 3.0 9.1 100.0
Valid
Total 88 32.7 100.0 Missing System 181 67.3 Total 269 100.0 The other two questions (17, 18) that related to the importance of wages in measuring job
satisfaction and the current level of teacher satisfaction with their salary levels will be
considered in the next section of the chapter, that includes other factors that affect job
satisfaction.
6.5 What Determines Job Satisfaction for High School Teachers in NSW?
Survey respondents were asked to rate, on a 1-5 scale, the importance of 14 factors in
measuring their job satisfaction. The 1-5 ratings scale was:
5 – very important;

194
4 – some importance;
3 – neutral;
2 – little importance;
1 - very unimportant.
The factors selected were based on the results of surveys of teacher satisfaction in NSW by
Dinham and Scott (1997) and in the USA by the National Center for Education Statistics
(1997). While all of the factors listed were of some importance to at least some teachers,
the most important factors in measuring the job satisfaction of teachers in NSW high
schools (Table 6.15), based on the mean scores, were:
• interest in the subjects taught (4.58);
• the satisfaction of student achievement (4.51);
• the attitude of peers (4.36);
• the attitude of students (4.34);
• job security (4.34);
• support from administration (4.29); and
• level of salary (4.13).
The least important factors for teachers in measuring their job satisfaction were:
• the possibility of promotion (2.91);
• hours of work (3.75);
• attitude of the general public (3.80); and
• the low level of stress (3.94).

195
6.6 How Does Job Satisfaction Vary with the Different Characteristics of High School
Teachers?
Cross tabulations were run on a number of characteristics to describe what are the
important factors in determining satisfaction for teachers with varying characteristics.
These characteristics include:
• gender;
• age;
• school system;
• level of academic qualifications;
• location of the school.
6.6.1 Hypothesis Testing by Gender Chi-squared analysis of independence allows the testing of independence between gender
and the factors that affect teacher satisfaction. The null and alternative hypotheses are as
follows:
The null hypothesis is given by H0: The factor is independent of gender.
Thus the alternative hypothesis is HA: The factor is not independent of gender.

196
Table 6.15 The Importance of Factors in Measuring Teacher Satisfaction
Statistics Level of salary
Job security
Low level of stress
Number of
holidaysHours of
work
Support from
admini-stration
The attitude
of peers
The attitude
of students
The satisfaction of student
achievement
The support
of students' parents
The attitude of the
general public
The support of your family
Interest in the
subjects taught
The possibility
of promotion
Number Valid 268 268 268 268 268 266 267 267 267 267 267 267 267 266 Missing 1 1 1 1 1 3 2 2 2 2 2 2 2 3 Mean 4.13 4.34 3.94 3.65 3.75 4.29 4.36 4.34 4.51 4.02 3.80 4.05 4.58 2.91 Median 4.00 5.00 4.00 4.00 4.00 5.00 5.00 5.00 5.00 4.00 4.00 4.00 5.00 3.00 Std. deviation 0.860 0.856 1.163 1.079 1.067 0.956 0.798 0.813 0.674 .869 1.074 1.017 .712 1.257 Skewness -1.136 -1.643 -1.035 -0.634 -0.764 -1.539 -1.454 -1.411 -1.321 -0.936 -0.670 -0.926 -2.221 -0.031 Std. error of skewness 0.149 0.149 0.149 0.149 0.149 0.149 0.149 0.149 0.149 0.149 0.149 0.149 0.149 0.149
Kurtosis 1.523 3.302 0.308 -0.171 -0.008 2.156 2.771 2.717 2.080 1.150 -0.112 0.289 6.560 -1.032 Std. error of kurtosis 0.297 0.297 0.297 0.297 0.297 0298 0.297 0.297 0.297 0.297 0.297 0.297 0.297 0.298
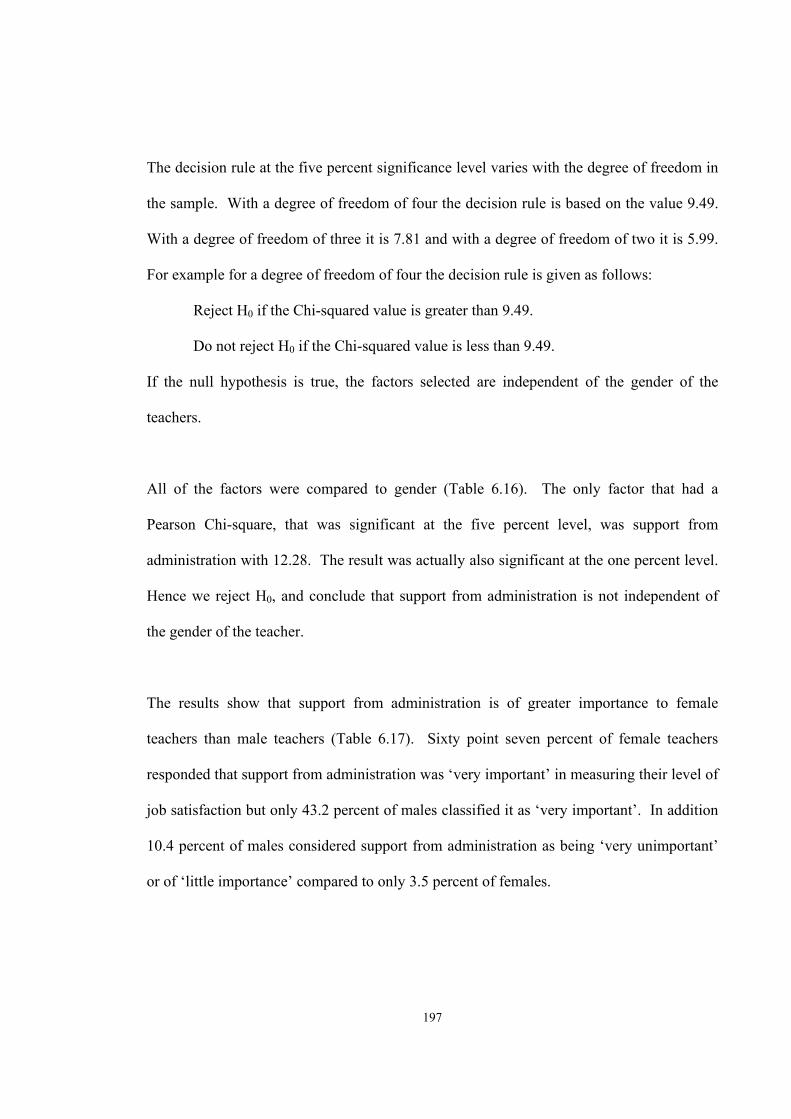
197
The decision rule at the five percent significance level varies with the degree of freedom in
the sample. With a degree of freedom of four the decision rule is based on the value 9.49.
With a degree of freedom of three it is 7.81 and with a degree of freedom of two it is 5.99.
For example for a degree of freedom of four the decision rule is given as follows:
Reject H0 if the Chi-squared value is greater than 9.49.
Do not reject H0 if the Chi-squared value is less than 9.49.
If the null hypothesis is true, the factors selected are independent of the gender of the
teachers.
All of the factors were compared to gender (Table 6.16). The only factor that had a
Pearson Chi-square, that was significant at the five percent level, was support from
administration with 12.28. The result was actually also significant at the one percent level.
Hence we reject H0, and conclude that support from administration is not independent of
the gender of the teacher.
The results show that support from administration is of greater importance to female
teachers than male teachers (Table 6.17). Sixty point seven percent of female teachers
responded that support from administration was ‘very important’ in measuring their level of
job satisfaction but only 43.2 percent of males classified it as ‘very important’. In addition
10.4 percent of males considered support from administration as being ‘very unimportant’
or of ‘little importance’ compared to only 3.5 percent of females.

198
Table 6.16 Gender and the Importance of Factors in Determining Job Satisfaction Summary Table
Factors Chi-square Dfa Asymp. Sig.
(2-sided) Male mean Female mean
Level of salary 4.880 3 0.181 4.17 4.08 Job security 2.966 3 0.397 4.25 4.41 A low level of stress 9.226 4 0.056 3.75 4.11 Number of holidays 8.419 4 0.077 3.70 3.60 Hours of work 3.608 4 0.462 3.67 3.82 Support from administration 12.278 3 0.006 4.07 4.47 The attitude of peers 5.631 3 0.131 4.25 4.45 The attitude of students 2.343 3 0.504 4.28 4.39 The satisfaction of student achievement 4.258 2 0.119 4.44 4.56
The support of students' parents 7.607 3 0.055 3.93 4.10 The attitude of the general public 6.922 4 0.140 3.67 3.91 The support of your family 3.667 3 0.300 4.01 4.09 Interest in the subjects taught 3.655 2 0.161 4.52 4.64
The possibility of promotion 5.113 4 0.276 2.75 3.04
(a) The degrees of freedom have been adjusted where necessary to ensure the accuracy of the results. Table 6.17 Gender and Support from Administration
Support from administration
Gender Very
unimportant Little
importance Neutral Some
importance Very
important Total Male Count 4 9 15 43 54 125 Expected count 2.8 5.7 10.4 40.6 65.6 125 % within gender 3.2% 7.2% 12.0% 34.4% 43.2% 100.0% Female Count 2 3 7 43 85 140 Expected count 3.2 6.3 11.6 45.4 73.4 140 % within gender 1.4% 2.1% 5.0% 30.7% 60.7% 100.0% Total Count 6 12 22 86 139 265 Expected count 6.0 12.0 22.0 86.0 139.0 265.0 % within gender 2.3% 4.5% 8.3% 32.5% 52.5% 100.0% Chi-Square Tests
Test Value df Asymp. Sig. (2-sided) Pearson Chi-Square 12.278 3 0.006 Likelihood Ratio 12.491 3 0.006 Linear-by-Linear Association 11.905 1 0.001 N of Valid Cases 264
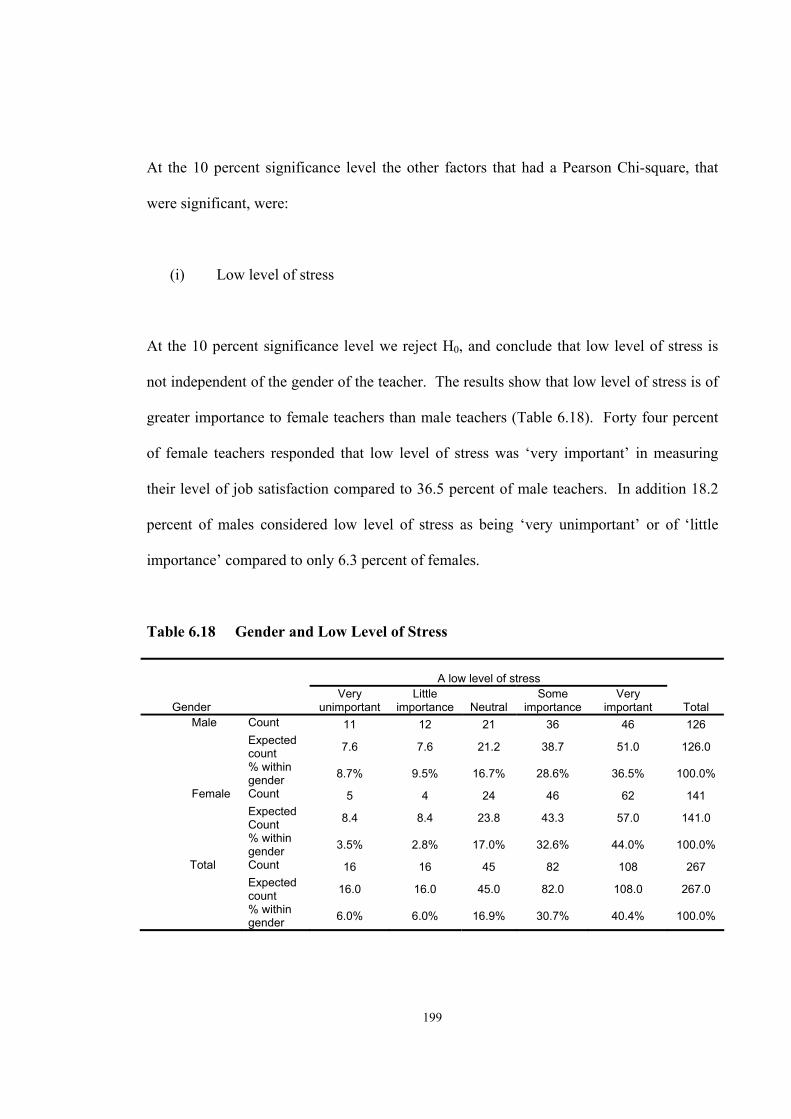
199
At the 10 percent significance level the other factors that had a Pearson Chi-square, that
were significant, were:
(i) Low level of stress
At the 10 percent significance level we reject H0, and conclude that low level of stress is
not independent of the gender of the teacher. The results show that low level of stress is of
greater importance to female teachers than male teachers (Table 6.18). Forty four percent
of female teachers responded that low level of stress was ‘very important’ in measuring
their level of job satisfaction compared to 36.5 percent of male teachers. In addition 18.2
percent of males considered low level of stress as being ‘very unimportant’ or of ‘little
importance’ compared to only 6.3 percent of females.
Table 6.18 Gender and Low Level of Stress
A low level of stress
Gender Very
unimportant Little
importance Neutral Some
importance Very
important Total Male Count 11 12 21 36 46 126 Expected
count 7.6 7.6 21.2 38.7 51.0 126.0
% within gender 8.7% 9.5% 16.7% 28.6% 36.5% 100.0%
Female Count 5 4 24 46 62 141 Expected
Count 8.4 8.4 23.8 43.3 57.0 141.0
% within gender 3.5% 2.8% 17.0% 32.6% 44.0% 100.0%
Total Count 16 16 45 82 108 267 Expected
count 16.0 16.0 45.0 82.0 108.0 267.0
% within gender 6.0% 6.0% 16.9% 30.7% 40.4% 100.0%
200
Chi-Square Tests
Test Value df Asymp. Sig. (2-sided) Pearson Chi-Square 9.226 4 0.056 Likelihood Ratio 9.451 4 0.051 Linear-by-Linear Association 6.386 1 0.012 N of Valid Cases 267
(ii) Number of holidays
At the 10 percent significance level we reject H0, and conclude that number of holidays is
not independent of the gender of the teacher. The results show that number of holidays is
of greater importance to male teachers than female teachers (Table 6.19). Twenty five
point four percent of male teachers responded that that number of holidays was ‘very
important’ in measuring their level of job satisfaction compared to 19.9 percent of female
teachers. The relationship continues with a further 41.3 percent of males ranking number
of holidays as having ‘some importance’ compared to 36.9 percent of females.
Table 6.19 Gender and Number of Holidays
Number of holidays
Gender Very
unimportant Little
importance Neutral Some
importance Very
important Total Male Count 6 16 20 52 32 126 Expected
count 5.7 13.2 29.7 49.1 28.3 126.0
% within gender 4.8% 12.7% 15.9% 41.3% 25.4% 100.0%
Female Count 6 12 43 52 28 141 Expected
count 6.3 14.8 33.3 54.9 31.7 141.0
% within gender 4.3% 8.5% 30.5% 36.9% 19.9% 100.0%
Total Count 12 28 63 104 60 267 Expected
count 12.0 28.0 63.0 104.0 60.0 267.0
% within gender 4.5% 10.5% 23.6% 39.0% 22.5% 100.0%

201
Chi-Square Tests Test Value df Asymp. Sig. (2-sided) Pearson Chi-Square 8.419 4 0.077 Likelihood Ratio 8.591 4 0.072 Linear-by-Linear Association 0.603 1 0.437 N of Valid Cases 267
(iii) The support of students’ parents
At the 10 percent significance level we reject H0, and conclude that the support of students’
parents is not independent of the gender of the teacher. The results show that the support of
students’ parents is of greater importance to female teachers than male teachers (Table
6.20). Eighty three point six percent of female teachers responded that the support of
students’ parents was ‘very important’ or having ‘some importance’ in measuring their
level of job satisfaction compared to 72.2 percent of male teachers. In addition 7.9 percent
of males considered the support of students’ parents as being ‘very unimportant’ or of ‘little
importance’ compared to only 2.9 percent of females.
Table 6.20 Support of Student’ Parents
The support of students' parents
Gender Very
unimportant Little
importance Neutral Some
importance Very
important Total Male Count 4 6 25 51 40 126 Expected
count 1.9 4.7 20.8 60.2 38.4 126.0
% within gender 3.2% 4.8% 19.8% 40.5% 31.7% 100.0%
Female Count 0 4 19 76 41 140 Expected
count 2.1 5.3 23.2 66.8 42.6 140.0
% within gender 0.0% 2.9% 13.6% 54.3% 29.3% 100.0%
Total Count 4 10 44 127 81 266 Expected
count 4.0 10.0 44.0 127.0 81.0 266.0
% within gender 1.5% 3.8% 16.5% 47.7% 30.5% 100.0%
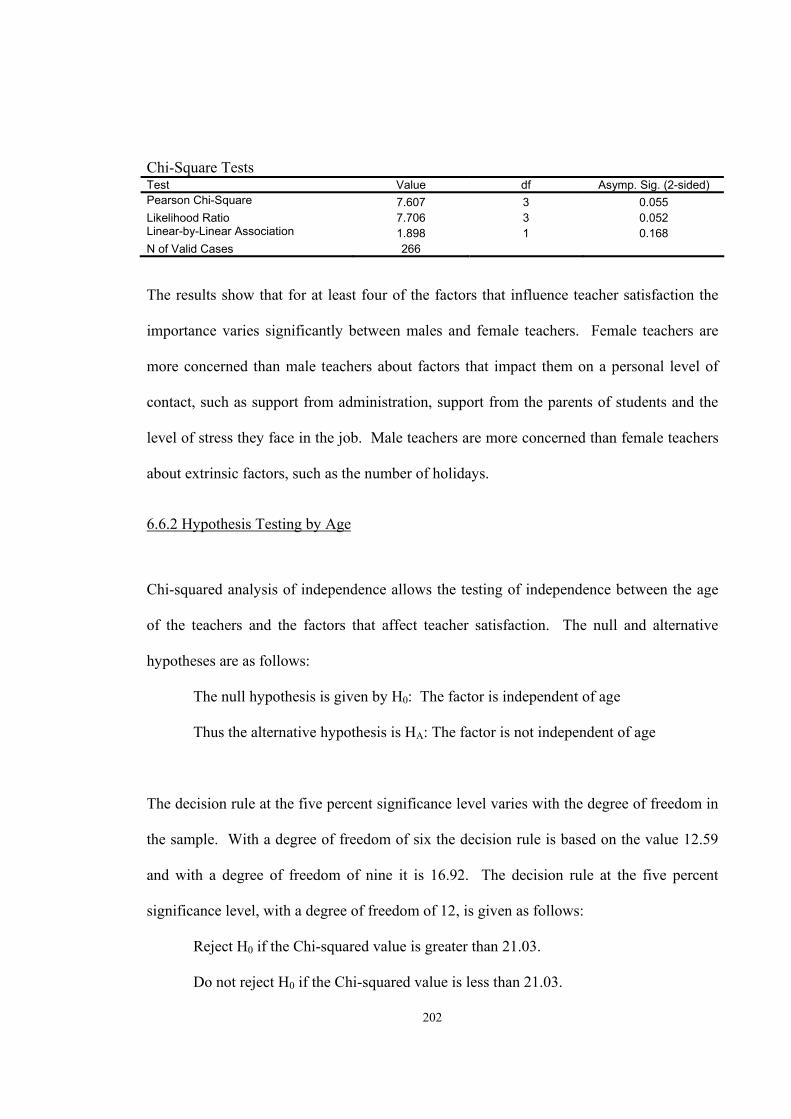
202
Chi-Square Tests Test Value df Asymp. Sig. (2-sided) Pearson Chi-Square 7.607 3 0.055 Likelihood Ratio 7.706 3 0.052 Linear-by-Linear Association 1.898 1 0.168 N of Valid Cases 266 The results show that for at least four of the factors that influence teacher satisfaction the
importance varies significantly between males and female teachers. Female teachers are
more concerned than male teachers about factors that impact them on a personal level of
contact, such as support from administration, support from the parents of students and the
level of stress they face in the job. Male teachers are more concerned than female teachers
about extrinsic factors, such as the number of holidays.
6.6.2 Hypothesis Testing by Age
Chi-squared analysis of independence allows the testing of independence between the age
of the teachers and the factors that affect teacher satisfaction. The null and alternative
hypotheses are as follows:
The null hypothesis is given by H0: The factor is independent of age
Thus the alternative hypothesis is HA: The factor is not independent of age
The decision rule at the five percent significance level varies with the degree of freedom in
the sample. With a degree of freedom of six the decision rule is based on the value 12.59
and with a degree of freedom of nine it is 16.92. The decision rule at the five percent
significance level, with a degree of freedom of 12, is given as follows:
Reject H0 if the Chi-squared value is greater than 21.03.
Do not reject H0 if the Chi-squared value is less than 21.03.

203
If the null hypothesis is true, the factors selected are independent of the age of the teachers.
All of the factors were compared to age (Table 6.21)
Table 6.21 Age and the Importance of Factors in Determining Job Satisfaction
Summary Table
Statistics Chi-
square dfa
Asymp. Sig. (2-sided)
Mean under 30
Mean 30-39
Mean 40-49
Mean over 50
Level of salary 8.516 6 0.203 3.96 4.26 4.08 4.19 Job security 2.294 6 0.891 4.33 4.23 4.43 4.31 A low level of stress 4.035 9 0.909 3.76 3.98 3.93 4.03 Number of holidays 11.60 9 0.237 3.54 3.61 3.84 3.51 Hours of work 11.59 9 0.237 3.54 4.02 3.80 3.62 Support from administration 3.821 6 0.701 4.51 4.30 4.24 4.19
The attitude of peers 6.213 6 0.400 4.53 4.33 4.24 4.42 The attitude of students 10.07 6 0.122 4.38 4.07 4.37 4.47 The satisfaction of student achievement 5.060 6 0.536 4.64 4.35 4.49 4.55
The support of students' parents 1.852 6 0.933 4.13 4.04 3.97 4.00
The attitude of the general public 9.865 9 0.361 3.96 3.98 3.74 3.64
The support of your family 2.042 9 0.991 4.16 4.00 4.02 4.07
Interest in the subjects taught 2.745 6 0.840 4.64 4.51 4.57 4.62
The possibility of promotion 27.12 12 0.007 3.49 3.25 2.67 2.60
(a) The degrees of freedom have been adjusted where necessary to ensure the accuracy of the results.
Only one factor had a Pearson Chi-square result that was significant at the five percent
level. That factor, which was also significant at the one percent level, was the possibility of
promotion with 27.12 (Table 6.21). In this case we reject H0, and conclude that the
importance of the possibility of promotion is not independent of the age of the teacher, in
measuring teacher satisfaction. The results show that the possibility of promotion is of
greatest importance to younger teachers than older teachers (Table 6.22). In the age band

204
under 30, 22.2 percent of teachers responded that the possibility of promotion was ‘very
important’ in measuring their level of job satisfaction compared to 15.8 percent in the 30–
39 age band, 7.7 percent in the 40-49 age band, and 4.1 percent aged 50 and over.
Table 6.22 Age and the Possibility of Promotion
The possibility of promotion
Age Very
unimportant Little
importance Neutral Some
importance Very
important Total Under 30 Count 2 7 13 13 10 45 Expected
count 7.8 9.3 11.8 11.2 4.9 45.0
% within age 4.4% 15.6% 28.9% 28.9% 22.2% 100.0%
30-39 Count 9 5 15 19 9 57 Expected
count 9.9 11.8 15.0 14.1 6.2 57.0
% within age 15.8% 8.8% 26.3% 33.3% 15.8% 100.0%
40-49 Count 20 22 24 18 7 91 Expected
count 15.7 18.8 23.9 22.6 9.9 91.0
% within age 22.0% 24.2% 26.4% 19.8% 7.7% 100.0%
50 and over Count 15 21 18 16 3 73 Expected
count 12.6 15.1 19.2 18.1 8.0 73.0
% within age 20.5% 28.8% 24.7% 21.9% 4.1% 100.0%
Total Count 46 55 70 66 29 266 Expected
count 46.0 55.0 70.0 66.0 29.0 266.0
% within age 17.3% 20.7% 26.3% 24.8% 10.9% 100.0%
Chi-Square Tests Test Value df Asymp. Sig. (2-sided) Pearson Chi-Square 27.122 12 0.007 Likelihood Ratio 29.287 12 0.004 Linear-by-Linear Association 19.063 1 0.000 N of Valid Cases 266

205
It could be expected that younger teachers would see promotion as a goal, whereas older
teachers may have already achieved it or decided to give up pursuing it as a goal, or at least
was not important to them in measuring their job satisfaction level.
At the 10 percent significance level there are no additional factors that are affected by age
(Table 6.21).
6.6.3 Hypothesis Testing by School System
The null and alternative hypotheses are as follows:
The null hypothesis is given by H0: The factor is independent of school system.
Thus the alternative hypothesis is HA: The factor is not independent of school
system.
The decision rule at the five percent significance level varies with the degree of freedom in
the sample. With a degree of freedom of four the decision rule is based on the value 9.49.
With a degree of freedom of six it is 12.59 and with a degree of freedom of eight it is 15.51.
For example for a degree of freedom of four the decision rule is given as follows:
Reject H0 if the Chi-squared value is greater than 9.49.
Do not reject H0 if the Chi-squared value is less than 9.49.
If the null hypothesis is true the factors selected are independent of the school system of the
teachers.
All of the factors were compared to the different school systems (Table 6.23).

206
Table 6.23 School Systems and the Importance of Factors in Determining Job
Satisfaction Summary Table
Statistics Chi-square dfa
Asymp. Sig. (2-sided)
Mean public school
Mean Catholic systemic
Mean other private school
Level of salary 7.645 4 0.105 4.23 4.13 3.90 Job security 6.756 4 0.149 4.28 4.51 4.23 A low level of stress 10.24 6 0.115 3.98 4.16 3.57 Number of holidays 12.73 6 0.048 3.60 3.95 3.38 Hours of work 17.35 6 0.008 3.73 4.09 3.38 Support from administration 5.486 4 0.228 4.18 4.39 4.38 The attitude of peers 5.866 4 0.209 4.40 4.21 4.45 The attitude of students 10.99 4 0.027 4.29 4.47 4.28 The satisfaction of student achievement 2.779 4 0.595 4.54 4.44 4.52
The support of students’ parents 6.700 4 0.153 4.02 3.97 4.08
The attitude of the general public 20.77 6 0.002 4.00 3.76 3.40
The support of your family 9.290 6 0.158 4.05 4.24 3.83 Interest in the subjects taught 6.871 4 0.143 4.50 4.65 4.68
The possibility of promotion 10.57 8 0.227 2.73 2.92 3.30
(a) The degrees of freedom have been adjusted where necessary to ensure the accuracy of the results.
Four factors were important at the five percent significance level. These factors were
number of holidays, hours of work, the attitude of students, and the attitude of the general
public. In these cases we reject H0, and conclude that the number of holidays, hours of
work, the attitude of students, and the attitude of the general public are not independent of
the school system of the teacher.
(i) School systems and number of holidays
The results show that the number of holidays is of greatest importance to teachers in
Catholic schools, than those in public and private school systems (Table 6.24). In the

207
Catholic school system 28.9 percent of teachers responded that number of holidays was
‘very important’ in measuring their level of job satisfaction compared to 22.0 percent in
public schools and 16.7 percent in private schools. In addition only 6.6 percent of teachers
in Catholic schools considered number of holidays as being ‘very unimportant’ or of ‘little
importance’ compared to 25.0 percent of private school teachers and 15.2 percent of public
school teachers. The low rating of importance of holidays for private school teachers could
reflect their satisfaction with generally having more holidays than the other systems or their
preference for the extra financial compensations they receive for their duties in exchange
for less leisure (the substitution effect).
Table 6.24 School System and Number of Holidays
Number of holidays
School system
Very unimportant/little
importance Neutral Some
importance Very
important Total Public Count 20 35 48 29 132 Expected count 19.7 31.0 51.2 30.0 132.0 % within school
type 15.2% 26.5% 36.4% 22.0% 100.0%
Catholic systemic Count 5 14 35 22 76 Expected count 11.3 17.9 29.5 17.3 76.0 % within school
type 6.6% 18.4% 46.1% 28.9% 100.0%
Other private Count 15 14 21 10 60 Expected count 9.0 14.1 23.3 13.7 60.0 % within school
type 25.0% 23.3% 35.0% 16.7% 100.0%
Total Count 40 63 104 61 268 Expected count 40.0 63.0 104.0 61.0 268.0 % within school
type 14.9% 23.5% 38.8% 22.8% 100.0%

208
Chi-Square Tests Test Value df Asymp. Sig. (2-sided) Pearson Chi-Square 12.726 6 0.048 Likelihood Ratio 12.978 6 0.043 Linear-by-Linear Association 0.601 1 0.438 N of Valid Cases 268
(i) School systems and hours of work
The Chi-square test results for hours of work are valid at a one percent significance level.
The results show that the hours of work is of greatest importance to teachers in Catholic
schools, than those in public and private school systems (Table 6.25).
Table 6.25 School System and Hours of Work
Hours of work
School system
Very unimportant/little
importance Neutral Some
importance Very
important Total Public Count 19 22 59 32 132 Expected
count 18.7 24.1 55.2 34.0 132.0
% within school type 14.4% 16.7% 44.7% 24.2% 100.0%
Catholic systemic Count 4 12 33 27 76 Expected
count 10.8 13.9 31.8 19.6 76.0
% within school type 5.3% 15.8% 43.4% 35.5% 100.0%
Other private Count 15 15 20 10 60 Expected
count 8.5 11.0 25.1 15.4 60.0
% within school type 25.0% 25.0% 33.3% 16.7% 100.0%
Total Count 38 49 112 69 268 Expected
count 38.0 49.0 112.0 69.0 268.0
% within school type 14.2% 18.3% 41.8% 25.7% 100.0%

209
Chi-Square Tests Test Value df Asymp. Sig. (2-sided) Pearson Chi-Square 17.350 6 0.008 Likelihood Ratio 17.699 6 0.007 Linear-by-Linear Association 2.909 1 0.088 N of Valid Cases 268
In the Catholic school system 35.5 percent of teachers responded that hours of work was
‘very important’ in measuring their level of job satisfaction compared to 24.2 percent in
public schools and 16.7 percent in private schools. In addition only 5.3 percent of teachers
in Catholic schools considered hours of work as being ‘very unimportant’ or of ‘little
importance’ compared to 25.0 percent of private school teachers and 14.4 percent of public
school teachers. The low rating of hours of work in private schools could reflect the
expectation of the system that teachers who work in private schools will be expected to do
extra duties (usually with financial compensation). The teachers who want to work in the
private school system may choose to do so because they do not consider the hours of work
as being particularly important in their overall job satisfaction.
(ii) School systems and the attitude of students
The results show that the attitude of students is of greatest importance to teachers in
Catholic schools, than those in public and private school systems (Table 6.26). In the
Catholic school system 53.3 percent of teachers responded that the attitude of students was
‘very important’ in measuring their level of job satisfaction compared to 52.3 percent in
public schools and 43.3 percent in private schools.

210
Table 6.26 School System and the Attitude of Students
The attitude of students
School system Very
unimportant Little
importance Neutral Some
importance Very
important Total Public Count 3 0 22 38 69 132 Expected
count 2.0 0.5 15.3 47.5 66.7 132.0
% within school type
2.3% 0.0% 16.7% 28.8% 52.3% 100.0%
Catholic systemic Count 0 0 5 30 40 75 Expected
count 1.1 0.3 8.7 27.0 37.9 75.0
% within school type
0.0% 0.0% 6.7% 40.0% 53.3% 100.0%
Other private Count 1 1 4 28 26 60 Expected
count 0.9 0.2 7.0 21.6 30.3 60.0
% within school type
1.7% 1.7% 6.7% 46.7% 43.3% 100.0%
Total Count 4 1 31 96 135 267 Expected
count 4.0 1.0 31.0 96.0 135.0 267.0
% within school type
1.5% 0.4% 11.6% 36.0% 50.6% 100.0%
Chi-Square Tests
Test Value Dfa Asymp. Sig. (2-sided) Pearson Chi-Square 10.991 4 0.027 Likelihood Ratio 11.303 4 0.023 Linear-by-Linear Association 0.083 1 0.773 N of Valid Cases 267
(a) The results for responses of very unimportant, of little importance and neutral were combined due to the low number of responses in each of these categories.
By including ‘some importance’ with ‘very important’ 93.3 percent of teachers in Catholic
schools considered the attitude of students in measuring their job satisfaction. The total by
including ‘some importance’ with ‘very important’ rose to 90.0 percent for private school
teachers and 81.1 percent for public school teachers.
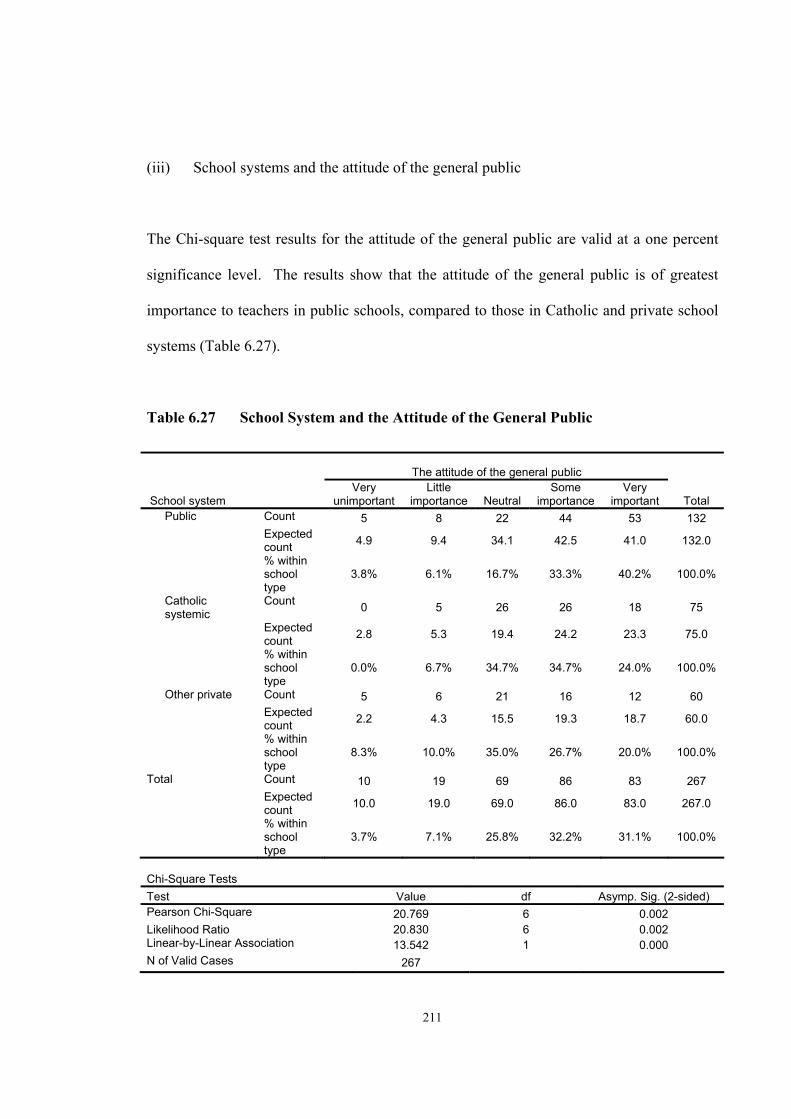
211
(iii) School systems and the attitude of the general public
The Chi-square test results for the attitude of the general public are valid at a one percent
significance level. The results show that the attitude of the general public is of greatest
importance to teachers in public schools, compared to those in Catholic and private school
systems (Table 6.27).
Table 6.27 School System and the Attitude of the General Public
Chi-Square Tests Test Value df Asymp. Sig. (2-sided) Pearson Chi-Square 20.769 6 0.002 Likelihood Ratio 20.830 6 0.002 Linear-by-Linear Association 13.542 1 0.000 N of Valid Cases 267
The attitude of the general public
School system Very
unimportant Little
importance Neutral Some
importance Very
important Total Public Count 5 8 22 44 53 132 Expected
count 4.9 9.4 34.1 42.5 41.0 132.0
% within school type
3.8% 6.1% 16.7% 33.3% 40.2% 100.0%
Catholic systemic
Count 0 5 26 26 18 75
Expected count 2.8 5.3 19.4 24.2 23.3 75.0
% within school type
0.0% 6.7% 34.7% 34.7% 24.0% 100.0%
Other private Count 5 6 21 16 12 60 Expected
count 2.2 4.3 15.5 19.3 18.7 60.0
% within school type
8.3% 10.0% 35.0% 26.7% 20.0% 100.0%
Total Count 10 19 69 86 83 267 Expected
count 10.0 19.0 69.0 86.0 83.0 267.0
% within school type
3.7% 7.1% 25.8% 32.2% 31.1% 100.0%

212
In the public school system 40.2 percent of teachers responded that the attitude of the
general public was ‘very important’ in measuring their level of job satisfaction compared to
24.0 percent in Catholic schools and 20.0 percent in private schools. By including ‘some
importance’ with ‘very important’ 73.5 percent of teachers in public schools considered the
attitude of the general public in measuring their job satisfaction as important. The total by
including ‘some importance’ with ‘very important’ only rose to 46.7 percent for private
school teachers and 58.7 percent for Catholic teachers.
As the media and politicians are generally more critical of public school teachers, this could
explain why the public school teachers are more concerned about the general public’s
perception of them.
6.6.4 Hypothesis Testing by Level of Academic Qualifications
Chi-squared analysis of independence allows the testing of independence between the
academic qualification of the teachers and the factors that affect teacher satisfaction. The
decision rule at the five percent significance level varies with the degree of freedom in the
sample. With a degree of freedom of four the decision rule is based on the value 9.49.
With a degree of freedom of six it is 12.59 and with a degree of freedom of eight it is 15.51.
If the null hypothesis is true the factors selected are independent of the level of academic
qualifications of the teachers.
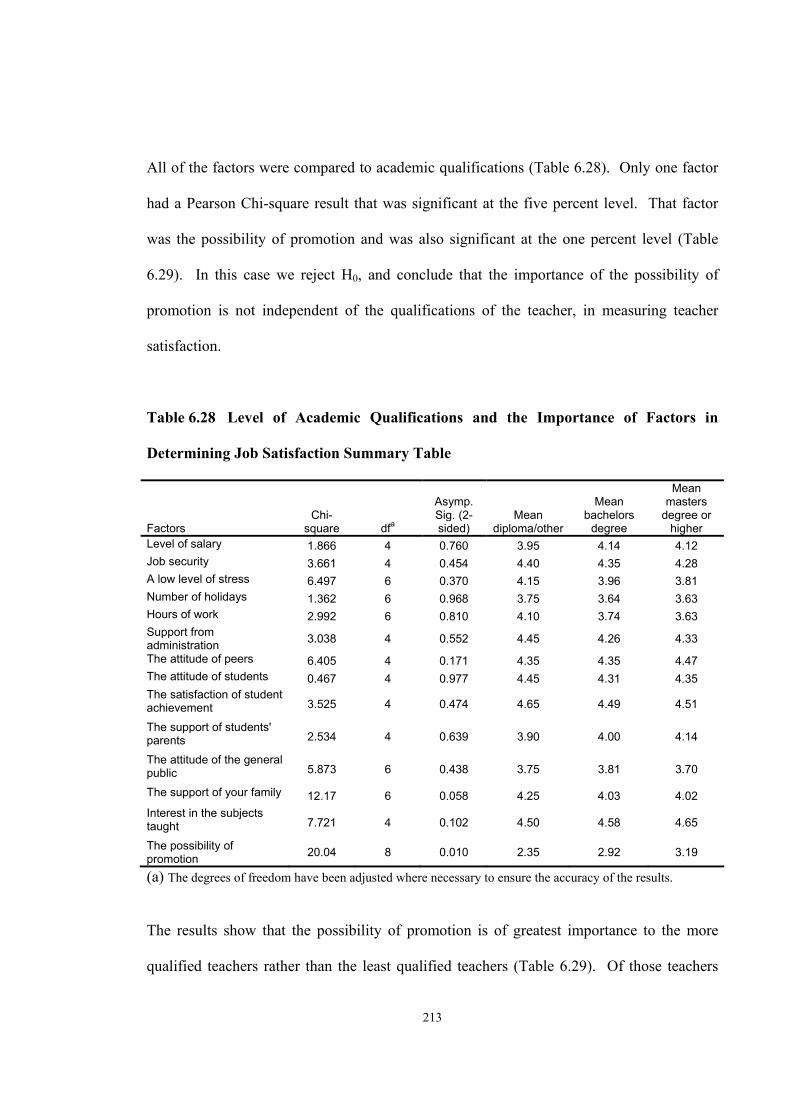
213
All of the factors were compared to academic qualifications (Table 6.28). Only one factor
had a Pearson Chi-square result that was significant at the five percent level. That factor
was the possibility of promotion and was also significant at the one percent level (Table
6.29). In this case we reject H0, and conclude that the importance of the possibility of
promotion is not independent of the qualifications of the teacher, in measuring teacher
satisfaction.
Table 6.28 Level of Academic Qualifications and the Importance of Factors in
Determining Job Satisfaction Summary Table
Factors Chi-
square dfa
Asymp. Sig. (2-sided)
Mean diploma/other
Mean bachelors
degree
Mean masters
degree or higher
Level of salary 1.866 4 0.760 3.95 4.14 4.12 Job security 3.661 4 0.454 4.40 4.35 4.28 A low level of stress 6.497 6 0.370 4.15 3.96 3.81 Number of holidays 1.362 6 0.968 3.75 3.64 3.63 Hours of work 2.992 6 0.810 4.10 3.74 3.63 Support from administration 3.038 4 0.552 4.45 4.26 4.33
The attitude of peers 6.405 4 0.171 4.35 4.35 4.47 The attitude of students 0.467 4 0.977 4.45 4.31 4.35 The satisfaction of student achievement 3.525 4 0.474 4.65 4.49 4.51
The support of students' parents 2.534 4 0.639 3.90 4.00 4.14
The attitude of the general public 5.873 6 0.438 3.75 3.81 3.70
The support of your family 12.17 6 0.058 4.25 4.03 4.02 Interest in the subjects taught 7.721 4 0.102 4.50 4.58 4.65
The possibility of promotion 20.04 8 0.010 2.35 2.92 3.19
(a) The degrees of freedom have been adjusted where necessary to ensure the accuracy of the results.
The results show that the possibility of promotion is of greatest importance to the more
qualified teachers rather than the least qualified teachers (Table 6.29). Of those teachers

214
with masters degrees or higher, 55.8 percent responded that the possibility of promotion
was ‘very important’ or of ‘some importance’ in measuring their level of job satisfaction
compared to 33.4 percent for the next most qualified group, those with bachelors degrees.
Only 20.8 percent of those with the lowest qualifications, diplomas and other, considered
that promotion was important in their measurement of job satisfaction. Indeed 54.2 percent
of teachers with a diploma or other qualification, as their highest qualification earned,
ranked promotion as ‘very unimportant’ or of ‘little importance’ in their measurement of
job satisfaction.
Table 6.29: Level of Academic Qualifications and the Possibility of Promotion
The possibility of promotion
Qualification Very
unimportantLittle
importance NeutralSome
importance Very
important Total Count 7 6 6 3 2 24 Expected count 4.1 5.0 6.3 6.0 2.6 24.0
Diploma/other
% within qualification 29.2% 25.0% 25.0% 12.5% 8.3% 100.0%
Count 31 44 57 42 24 198 Expected count 33.6 41.1 52.3 49.3 21.7 198.0
Bachelors degree
% within qualification 15.7% 22.2% 28.8% 21.2% 12.1% 100.0%
Count 7 5 7 21 3 43 Expected count 7.3 8.9 11.4 10.7 4.7 43.0
Masters degree or higher
% within qualification 16.3% 11.6% 16.3% 48.8% 7.0% 100.0%
Count 45 55 70 66 29 265 Expected count 45.0 55.0 70.0 66.0 29.0 265.0
Total
% within qualification 17.0% 20.8% 26.4% 24.9% 10.9% 100.0%

215
Chi-Square Tests Test Value df Asymp. Sig. (2-sided) Pearson Chi-Square 20.04 8 0.010 Likelihood Ratio 18.55 8 0.017 Linear-by-Linear Association 4.905 1 0.027 N of Valid Cases 265
This result could actually reflect the situation that some teachers have undertaken extra
study to gain extra qualifications, which would lead them in turn to promotion. Having
invested in human capital by undertaking extra study, those teachers would expect a return
on their investment. Once a teacher has reached the top level (Step 13) of the salary scale
the only other source of extra salary inside the teaching profession would be through
promotion. As a result promotion would be a higher priority for this group in measuring
their job satisfaction.
At the 10 percent level of significance, support from the family is also linked to the level of
qualifications of the teachers (Table 6.30). The teachers with the lowest levels of
qualifications considered support from their families as being more important than the other
two more qualified groups. Ninety one point three percent of the diploma/other group
consider support of their families as being very important or of some importance, compared
to 67.8 percent of those with bachelors degrees and 74.4 percent of those with masters or
higher degrees.
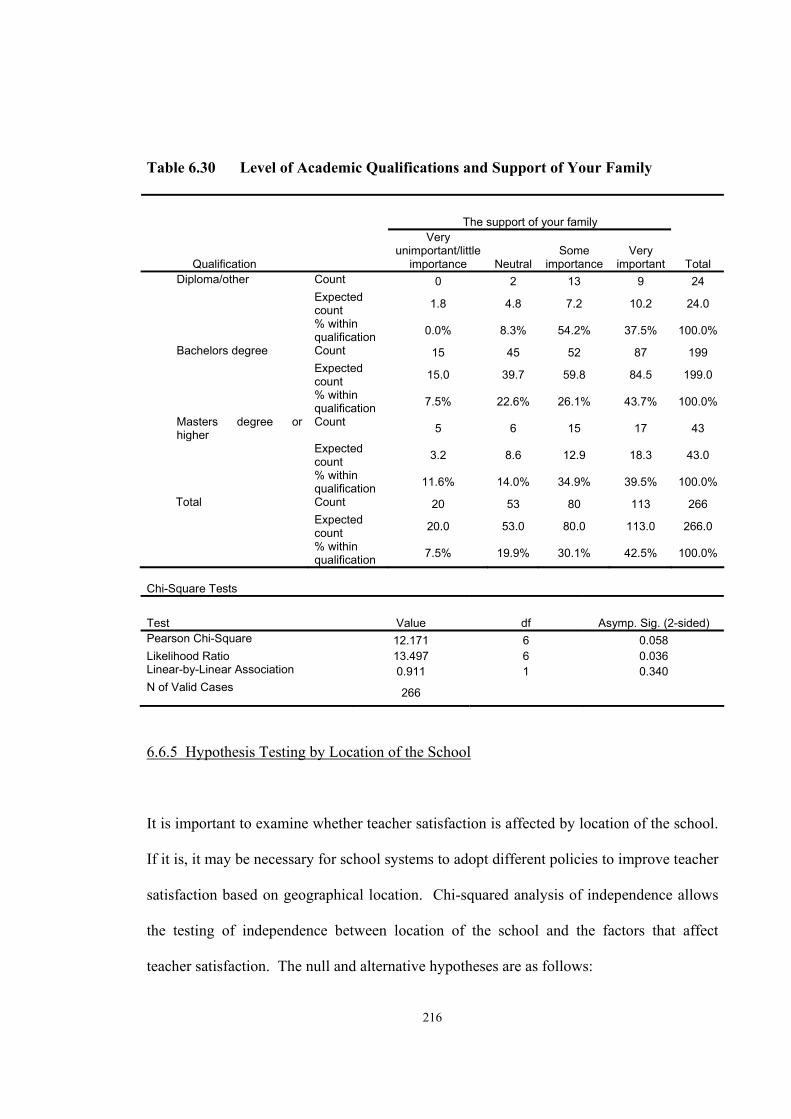
216
Table 6.30 Level of Academic Qualifications and Support of Your Family
The support of your family
Qualification
Very unimportant/little
importance Neutral Some
importance Very
important Total Diploma/other Count 0 2 13 9 24 Expected
count 1.8 4.8 7.2 10.2 24.0
% within qualification 0.0% 8.3% 54.2% 37.5% 100.0%
Bachelors degree Count 15 45 52 87 199 Expected
count 15.0 39.7 59.8 84.5 199.0
% within qualification 7.5% 22.6% 26.1% 43.7% 100.0%
Masters degree or higher
Count 5 6 15 17 43
Expected count 3.2 8.6 12.9 18.3 43.0
% within qualification 11.6% 14.0% 34.9% 39.5% 100.0%
Total Count 20 53 80 113 266 Expected
count 20.0 53.0 80.0 113.0 266.0
% within qualification 7.5% 19.9% 30.1% 42.5% 100.0%
Chi-Square Tests
Test Value df Asymp. Sig. (2-sided) Pearson Chi-Square 12.171 6 0.058 Likelihood Ratio 13.497 6 0.036 Linear-by-Linear Association 0.911 1 0.340 N of Valid Cases 266
6.6.5 Hypothesis Testing by Location of the School
It is important to examine whether teacher satisfaction is affected by location of the school.
If it is, it may be necessary for school systems to adopt different policies to improve teacher
satisfaction based on geographical location. Chi-squared analysis of independence allows
the testing of independence between location of the school and the factors that affect
teacher satisfaction. The null and alternative hypotheses are as follows:

217
The null hypothesis is given by H0: The factor is independent of location of the
school.
Thus the alternative hypothesis is HA: The factor is not independent of location of
the school.
The decision rule at the five percent significance level varies with the degree of freedom for
each factor. If the null hypothesis is true the factors selected are independent of the
location of the school of the teachers. All of the factors were compared to the location of
the school where the respondents were teaching (Table 6.31). The results show that there is
little difference in the importance of any of the factors between city and rural areas, as a
whole. No factors were significant at the five percent level. There were two factors that
were significant at the 10 percent level of significance. They were the attitude of peers and
the attitude of students. The results show that while there is little difference in the
importance of the attitude of peers between city and rural areas, as a whole, there is a
difference inside the Sydney region (Table 6.32).

218
Table 6.31 Location of Schoola and the Importance of Factors in Determining Job
Satisfaction Summary Table
Mean Mean Mean Mean Mean Mean
Factors
Chi-square Dfb
Asymp. Sig. (2-sided)
Sydney inner
city/east
Sydney north
Sydney south
Sydney west
Newcastle/ Wollongong country
Level of salary 6.756 10 0.748 4.23 3.68 4.19 4.18 4.10 4.06 Job security 14.41 10 0.155 4.42 4.14 4.58 4.34 4.35 4.16 A low level of stress 10.20 15 0.807 4.04 3.64 4.17 3.89 3.55 3.99
Number of holidays 9.580 15 0.845 3.88 3.64 3.75 3.71 3.60 3.54
Hours of work 19.31 15 0.200 4.08 3.39 4.02 3.68 3.25 3.80 Support from administration 15.12 10 0.128 4.24 4.07 4.43 4.62 3.95 4.23
The attitude of peers 16.01 10 0.099 4.00 4.36 4.43 4.68 4.30 4.28
The attitude of students 16.33 10 0.091 4.31 4.43 4.53 4.08 4.10 4.29
The satisfaction of student achievement
2.029 10 0.996 4.46 4.50 4.49 4.51 4.55 4.48
The support of students' parents
13.49 10 0.198 3.75 4.11 4.08 3.81 4.15 4.09
The attitude of the general public
22.19 15 0.103 3.50 3.79 4.04 3.89 3.35 3.84
The support of your family 9.821 15 0.831 3.90 3.93 4.21 4.30 4.00 3.91
Interest in the subjects taught 15.17 10 0.126 4.70 4.43 4.72 4.57 4.60 4.48
The possibility of promotion 17.26 20 0.636 3.05 3.15 2.98 3.24 2.80 2.91
(a) Some locations were combined to improve the validity of the results. They were Sydney inner city with Sydney east and the two regional cities Newcastle and Wollongong. (b)The degrees of freedom have been adjusted where necessary to ensure the accuracy of the results.
The attitude of peers is of greatest importance to teachers working in the western suburbs of
Sydney and least important to those in the inner city/eastern suburbs and northern suburbs
of Sydney. Seventy three percent of teachers working in the western suburbs considered
that the attitude of peers was ‘very important’ in measuring their level of job satisfaction
compared to only 41.5 percent of teachers in the inner city/eastern suburbs of Sydney.

219
Table 6.32 Location and Attitude of Peers
The attitude of peers
Location Unimportant/neutral Some
importance Very
important Total Sydney - inner city/east Count 7 17 17 41 Expected
count 4.8 15.2 21.0 41.0
% within location 17.1% 41.5% 41.5% 100.0%
Sydney - north Count 5 6 17 28 Expected
count 3.3 10.4 14.4 28.0
% within location 17.9% 21.4% 60.7% 100.0%
Sydney - south Count 4 22 26 52 Expected
count 6.1 19.2 26.7 52.0
% within location 7.7% 42.3% 50.0% 100.0%
Sydney - west Count 2 8 27 37 Expected
count 4.3 13.7 19.0 37.0
% within location 5.4% 21.6% 73.0% 100.0%
Newcastle/Wollongong Count 2 13 11 26 Expected
count 3.0 9.6 13.3 26.0
% within location 7.7% 50.0% 42.3% 100.0%
Country Count 11 32 38 81 Expected
count 9.5 30.0 41.6 81.0
% within location 13.6% 39.5% 46.9% 100.0%
Total Count 31 98 136 265 Expected
count 31.0 98.0 136.0 265.0
% within location 11.7% 37.0% 51.3% 100.0%
Chi-Square Tests Test Value df Asymp. Sig. (2-sided) Pearson Chi-Square 16.01 10 0.099 Likelihood Ratio 16.47 10 0.087 Linear-by-Linear Association 0.003 1 0.958 N of Valid Cases 265
In addition 17.9 percent of teachers in the northern suburbs and 17.1 percent of teachers in
the inner city/eastern suburbs considered attitude of peers as being ‘very unimportant’ or of
‘little importance’ or ‘neutral’ compared to only 5.4 percent in the western suburbs. These
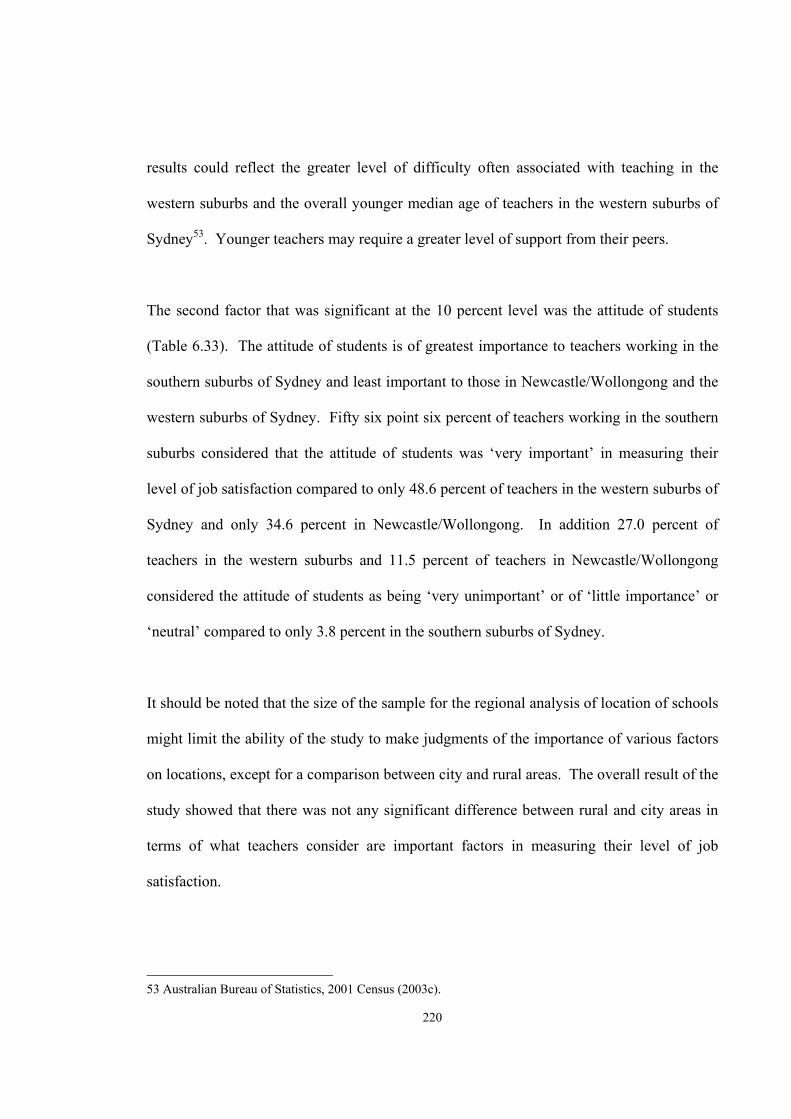
220
results could reflect the greater level of difficulty often associated with teaching in the
western suburbs and the overall younger median age of teachers in the western suburbs of
Sydney53. Younger teachers may require a greater level of support from their peers.
The second factor that was significant at the 10 percent level was the attitude of students
(Table 6.33). The attitude of students is of greatest importance to teachers working in the
southern suburbs of Sydney and least important to those in Newcastle/Wollongong and the
western suburbs of Sydney. Fifty six point six percent of teachers working in the southern
suburbs considered that the attitude of students was ‘very important’ in measuring their
level of job satisfaction compared to only 48.6 percent of teachers in the western suburbs of
Sydney and only 34.6 percent in Newcastle/Wollongong. In addition 27.0 percent of
teachers in the western suburbs and 11.5 percent of teachers in Newcastle/Wollongong
considered the attitude of students as being ‘very unimportant’ or of ‘little importance’ or
‘neutral’ compared to only 3.8 percent in the southern suburbs of Sydney.
It should be noted that the size of the sample for the regional analysis of location of schools
might limit the ability of the study to make judgments of the importance of various factors
on locations, except for a comparison between city and rural areas. The overall result of the
study showed that there was not any significant difference between rural and city areas in
terms of what teachers consider are important factors in measuring their level of job
satisfaction.
53 Australian Bureau of Statistics, 2001 Census (2003c).
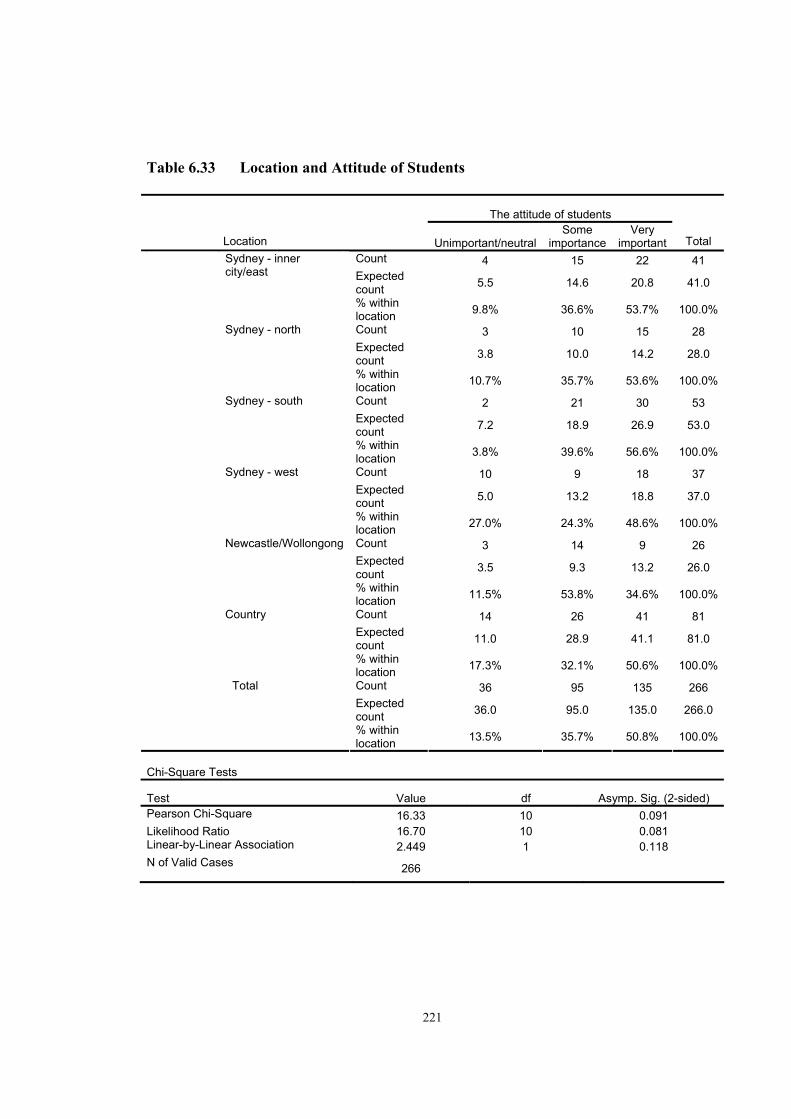
221
Table 6.33 Location and Attitude of Students
The attitude of students
Location Unimportant/neutralSome
importance Very
important Total Count 4 15 22 41 Expected count 5.5 14.6 20.8 41.0
Sydney - inner city/east
% within location 9.8% 36.6% 53.7% 100.0%
Count 3 10 15 28 Expected count 3.8 10.0 14.2 28.0
Sydney - north
% within location 10.7% 35.7% 53.6% 100.0%
Count 2 21 30 53 Expected count 7.2 18.9 26.9 53.0
Sydney - south
% within location 3.8% 39.6% 56.6% 100.0%
Count 10 9 18 37 Expected count 5.0 13.2 18.8 37.0
Sydney - west
% within location 27.0% 24.3% 48.6% 100.0%
Count 3 14 9 26 Expected count 3.5 9.3 13.2 26.0
Newcastle/Wollongong
% within location 11.5% 53.8% 34.6% 100.0%
Count 14 26 41 81 Expected count 11.0 28.9 41.1 81.0
Country
% within location 17.3% 32.1% 50.6% 100.0%
Count 36 95 135 266 Expected count 36.0 95.0 135.0 266.0
Total
% within location 13.5% 35.7% 50.8% 100.0%
Chi-Square Tests
Test Value df Asymp. Sig. (2-sided) Pearson Chi-Square 16.33 10 0.091 Likelihood Ratio 16.70 10 0.081 Linear-by-Linear Association 2.449 1 0.118 N of Valid Cases 266

222
6.7 What is the Level of Job Satisfaction among High School Teachers in NSW?
NSW High school teachers were asked to rate, on a 1-5 scale, their current level of
satisfaction with each of the 14 factors used in this study to measure their job satisfaction.
The 1-5 ratings scale was:
5 – very high;
4 – moderately high;
3 – neutral;
2 – moderately low;
1 – very low.
Overall the level of satisfaction of high school teachers in NSW is not very high. The
factors that the respondents ranked as giving them the highest current levels of satisfaction
(Table 6.34), based on the mean scores, were:
• interest in the subjects taught (4.29);
• the support of their family (4.12);
• job security (4.08);
• number of holidays (3.92);
• the attitude of peers (3.77);
• the satisfaction of student achievement (3.77); and
• the attitude of students (3.55).

223
A number of factors had a mean score rating the level of satisfaction on the low level of the
scale. These were:
• attitude of the general public (2.12);
• a low level of stress (2.23);
• level of salary (2.65);
• the possibility of promotion (2.69); and
• hours of work (2.94).
Many of the most satisfying factors for teachers related to largely intrinsic factors that come
from classroom activities and their relationships and support from family, students, and
peers. On the other hand many of the least satisfying factors are extrinsic in nature relating
to conditions of employment and the public’s perception of teachers. The extrinsic factors
are largely beyond the teachers’ control, so improvements in these areas are largely up to
the administrators of the various systems of education in NSW. The factor ‘attitude of the
general public’ suggests that teachers believe that the general public do not appreciate the
work of teachers or have a negative attitude towards teachers. The image portrayed of
teachers by certain sections of the media and the view that teachers are well paid and have
good working conditions and should not go on strike all probably contribute to this
perception.
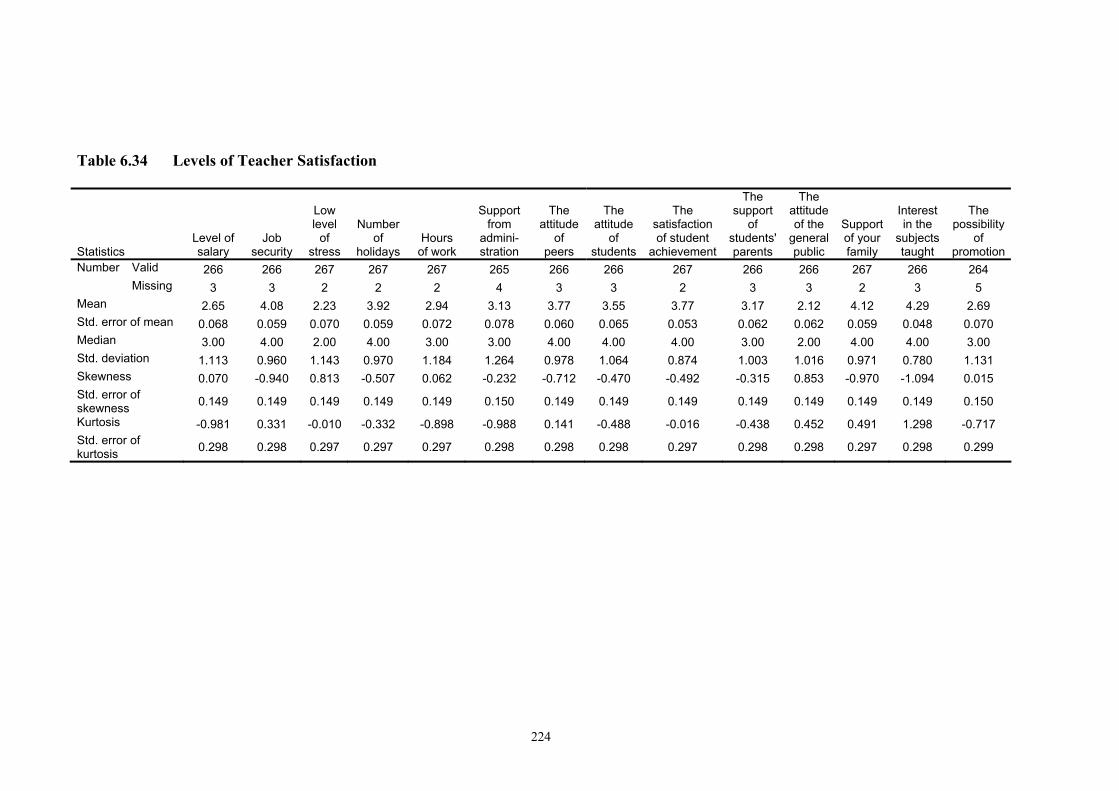
224
Table 6.34 Levels of Teacher Satisfaction
Statistics Level of salary
Job security
Low level
of stress
Number of
holidays Hours
of work
Support from
admini-stration
The attitude
of peers
The attitude
of students
The satisfaction of student
achievement
The support
of students' parents
The attitude of the
general public
Support of your family
Interest in the
subjects taught
The possibility
of promotion
Number Valid 266 266 267 267 267 265 266 266 267 266 266 267 266 264 Missing 3 3 2 2 2 4 3 3 2 3 3 2 3 5
Mean 2.65 4.08 2.23 3.92 2.94 3.13 3.77 3.55 3.77 3.17 2.12 4.12 4.29 2.69 Std. error of mean 0.068 0.059 0.070 0.059 0.072 0.078 0.060 0.065 0.053 0.062 0.062 0.059 0.048 0.070 Median 3.00 4.00 2.00 4.00 3.00 3.00 4.00 4.00 4.00 3.00 2.00 4.00 4.00 3.00 Std. deviation 1.113 0.960 1.143 0.970 1.184 1.264 0.978 1.064 0.874 1.003 1.016 0.971 0.780 1.131 Skewness 0.070 -0.940 0.813 -0.507 0.062 -0.232 -0.712 -0.470 -0.492 -0.315 0.853 -0.970 -1.094 0.015 Std. error of skewness 0.149 0.149 0.149 0.149 0.149 0.150 0.149 0.149 0.149 0.149 0.149 0.149 0.149 0.150
Kurtosis -0.981 0.331 -0.010 -0.332 -0.898 -0.988 0.141 -0.488 -0.016 -0.438 0.452 0.491 1.298 -0.717 Std. error of kurtosis 0.298 0.298 0.297 0.297 0.297 0.298 0.298 0.298 0.297 0.298 0.298 0.297 0.298 0.299

225
6.8 How Does the Level of Job Satisfaction Vary with the Characteristics of
Teachers in NSW High Schools?
Cross tabulations were run on a number of characteristics to describe the levels of
teacher satisfaction in regard to the factors measured in the survey. These
characteristics include:
(i) gender;
(ii) school system;
(iii) age ;
(iv) level of academic qualifications; and
(v) location of the school.
6.8.1 Hypothesis Testing by Gender
All of the factors were compared to gender (Table 6.35). In only four of the 14
categories were male teachers more satisfied than female teachers. In the remaining 10
categories female teachers were more satisfied, suggesting that overall female teachers
are more satisfied with their job than male teachers. This may also assist in explaining
why the ratio of male teachers to female teachers in NSW high schools has been
declining (Figure 5.6).

226
Chi-squared analysis of independence allows the testing of independence between
gender and the level of teacher satisfaction. The null and alternative hypotheses are as
follows:
The null hypothesis is given by H0: The factor is independent of gender.
Thus the alternative hypothesis is HA: The factor is not independent of gender.
The decision rule at the five percent significance level is given as follows:
Reject H0 if the Chi-squared value is greater than 9.49.
Do not reject H0 if the Chi-squared value is less than 9.49.
The value 9.49 is from the Chi-squared distribution with a degree of freedom of 4.
If the null hypothesis is true the factors selected are independent of the gender of the
teachers.
The only factor that had a Pearson Chi-square, that was greater than 9.49, was
satisfaction of student achievement with 12.78 (Table 6.36). Hence we reject H0, and
conclude that satisfaction of student achievement is not independent of the gender of the
teacher. The results show that female teachers are more satisfied as a result of student
achievement than male teachers. Seventy five point two percent of female teachers
responded that their level of satisfaction of student achievement was ‘moderately high’
or ‘very high’ but only 57.6 percent of males classified it as ‘moderately high’ or ‘very
high’. In addition 10.4 percent of males considered their level of satisfaction of student
achievement was ‘very low’ or ‘moderately low’ compared to only 5.7 percent of
females.

227
Table 6.35: Gender and the Level of Teacher Job Satisfaction Summary Table
Factors Chi-Square df Asymp. Sig.
(2-sided) Male mean Female mean
Level of salary 0.936 4 0.919 2.62 2.69 Job security 2.941 4 0.568 4.11 4.05 A low level of stress 8.016 4 0.091 2.41 2.09 Number of holidays 4.645 4 0.326 3.94 3.90 Hours of work 5.958 4 0.202 3.10 2.79 Support from administration 3.824 4 0.430 3.07 3.18 The attitude of peers 5.471 4 0.242 3.70 3.83 The attitude of students 4.019 4 0.403 3.45 3.66 The satisfaction of student achievement 12.78 4 0.012 3.65 3.89
The support of students' parents 2.635 4 0.621 3.10 3.23
The attitude of the general public 7.252 4 0.123 2.10 2.14
The support of your family 2.383 4 0.666 4.08 4.17 Interest in the subjects taught 3.511 4 0.476 4.22 4.36 The possibility of promotion 9.226 4 0.056 2.53 2.83
Table 6.36 Gender and the Satisfaction of Student Achievement
The satisfaction of student achievement
Gender Very low Moderately
low Neutral Moderately
high Very high Total
Male Count 0 13 40 50 22 125 Expected
count 0.9 8.9 31.5 59.2 24.4 125.0
% within gender 0.0% 10.4% 32.0% 40.0% 17.6% 100.0%
Female Count 2 6 27 76 30 141 Expected
count 1.1 10.1 35.5 66.8 27.6 141.0
% within gender 1.4% 4.3% 19.1% 53.9% 21.3% 100.0%
Total Count 2 19 67 126 52 266 Expected
count 2.0 19.0 67.0 126.0 52.0 266.0
% within gender 0.8% 7.1% 25.2% 47.4% 19.5% 100.0%
Chi-Square Tests Test Value df Asymp. Sig. (2-sided) Pearson Chi-Square 12.78 4 0.012 Likelihood Ratio 13.63 4 0.009 Linear-by-Linear Association 5.299 1 0.021 N of Valid Cases 266

228
These results could reflect the situation that there is likely to be a relatively higher
proportion of male teachers teaching in male single sex schools and a higher proportion
of females in female single sex schools. In the NSW Higher School Certificate female
students have a higher success rate compared to male students56, so it could be expected
that female teachers may be more satisfied with their students’ achievements.
If the comparison is expanded to include the 10 percent significance level, then the
decision rule is given as follows:
Reject H0 if the Chi-squared value is greater than 7.78.
Do not reject H0 if the Chi-squared value is less than 7.78.
At the 10 percent significance level the other factors that had a Pearson Chi-square, that
were greater than 7.78, were:
(i) The possibility of promotion
At the 10 percent significance level we reject H0, and conclude that the satisfaction level
associated with the possibility of promotion is not independent of the gender of the
teacher. The results show that the satisfaction level of the possibility of promotion is
lower for male teachers than female teachers (Table 6.37). Forty eight percent of male
teachers responded that their level of satisfaction associated with the possibility of
promotion was ‘moderately low’ or ‘very low’ but only 30.7 percent of females
classified it as ‘moderately low’ or ‘very low’. Considering that there tends to be more
males in promotional positions in schools than females, the results would suggest that
male teachers are generally more concerned about promotion than female teachers.
56In 2003, 58.6 percent of the students who gained a university admission index of 90 or above were female (Universities Admission Centre 2003: 1-2).

229
Table 6.37 Gender and the Possibility of Promotion
The possibility of promotion
Gender Very low Moderately
low Neutral Moderately
high Very high Total
Male Count 29 30 39 20 5 123 Expected
count 24.8 22.9 47.7 21.0 6.5 123.0
% within gender 23.6% 24.4% 31.7% 16.3% 4.1% 100.0%
Female Count 24 19 63 25 9 140 Expected
count 28.2 26.1 54.3 24.0 7.5 140.0
% within gender 17.1% 13.6% 45.0% 17.9% 6.4% 100.0%
Total Count 53 49 102 45 14 263 Expected
count 53.0 49.0 102.0 45.0 14.0 263.0
% within gender 20.2% 18.6% 38.8% 17.1% 5.3% 100.0%
Chi-Square Tests Test Value df Asymp. Sig. (2-sided) Pearson Chi-Square 9.226 4 0.056 Likelihood Ratio 9.279 4 0.054 Linear-by-Linear Association 4.593 1 0.032 N of Valid Cases 263
(ii) Low level of stress
At the 10 percent significance level we reject H0, and conclude that the satisfaction level
associated with a low level of stress is not independent of the gender of the teacher. The
results show that the satisfaction level of a low level of stress is lower for male teachers
than female teachers (Table 6.38).
Even though both groups were overall not satisfied with the level of stress in teaching,
16.8 percent of male teachers responded that their level of satisfaction with a low level
of stress was ‘moderately high’ or ‘very high’ compared to only 10.6 percent of
females. Thirty six point nine percent of female teachers responded that their level of
satisfaction associated with a low level of stress was ‘very low’ compared to 23.2
230
percent of males. The results suggest that female teachers are more dissatisfied by
stress compared to male teachers.
Table 6.38 Gender and a Low Level of Stress
A low level of stress
Gender Very low Moderately
low Neutral Moderately
high Very high Total
Male Count 29 48 27 10 11 125 Expected
count 38.1 43.7 26.3 9.4 7.5 125.0
% within gender 23.2% 38.4% 21.6% 8.0% 8.8% 100.0%
Female Count 52 45 29 10 5 141 Expected
count 42.9 49.3 29.7 10.6 8.5 141.0
% within gender 36.9% 31.9% 20.6% 7.1% 3.5% 100.0%
Total Count 81 93 56 20 16 266 Expected
count 81.0 93.0 56.0 20.0 16.0 266.0
% within gender 30.5% 35.0% 21.1% 7.5% 6.0% 100.0%
Chi-Square Tests Test Value df Asymp. Sig. (2-sided) Pearson Chi-Square 8.016 4 0.091 Likelihood Ratio 8.133 4 0.087 Linear-by-Linear Association 5.290 1 0.021 N of Valid Cases 266
While the null hypothesis cannot be rejected at the five or ten percent level for the other
factors, it is still likely that some of these factors will not be independent of gender
especially those below a 25 percent significance level such as: hours of work, the
attitude of peers, and the attitude of the general public (see Table 6.35).
6.8.2 Hypothesis Testing by School System
In testing, if there are differences between school systems in the level of satisfaction of
teachers in regard to various factors influencing their overall satisfaction level, the null
and alternative hypotheses are as follows:

231
The null hypothesis is given by H0: The factor is independent of school system.
Thus the alternative hypothesis is HA: The factor is not independent of school
system.
The decision rule at the five percent significance level is given as follows:
Reject H0 if the Chi-squared value is greater than 15.51.
Do not reject H0 if the Chi-squared value is less than 15.51.
The value 15.51 is from the Chi-squared distribution with a degree of freedom of 8.
The value becomes 12.59 with a degree of freedom of 6. If the null hypothesis is true,
the factors selected are independent of the school system of the teachers.
Table 6.39 School System and the Level of Teacher Job Satisfaction Summary
Table
Factors Chi-
square dfa
Asymp. Sig. (2-sided)
Mean public school
Mean Catholic systemic
Mean other
private Level of salary 28.07 8 0.000 2.52 2.39 3.28 Job security 9.693 8 0.287 4.00 4.31 3.98 A low level of stress 4.167 8 0.842 2.19 2.29 2.25 Number of holidays 8.645 8 0.373 3.91 3.95 3.90 Hours of work 6.670 8 0.573 3.05 2.80 2.87 Support from administration 18.85 8 0.016 2.86 3.51 3.24
The attitude of peers 5.549 8 0.698 3.70 3.84 3.83 The attitude of students 34.22 6 0.000 3.25 3.84 3.87 The satisfaction of student achievement 20.16 6 0.003 3.59 3.91 4.00
The support of students' parents 23.15 6 0.001 2.88 3.35 3.57
The attitude of the general public 24.77 6 0.000 1.91 2.23 2.43
The support of your family 4.701 8 0.789 4.13 4.19 4.03 Interest in the subjects taught 4.564 6 0.601 4.20 4.35 4.42
The possibility of promotion 16.35 8 0.038 2.54 2.62 3.10
(a) The degrees of freedom have been adjusted where necessary to ensure the accuracy of the results.

232
All of the factors were compared across the school systems (Table 6.39). In eight of the
14 categories teachers in private schools were the most satisfied. In four categories
teachers in Catholic systemic schools were most satisfied and only in two categories
were teachers in public schools most satisfied. This suggests that private school
teachers have the greatest overall level of satisfaction, followed by Catholic school
teachers, with public school teachers being the least satisfied.
There were significant differences in the satisfaction levels between school systems.
Seven factors had Pearson Chi-square results that were significant at the five percent
level; of these five were also significant at the one percent level. These factors were:
• level of salary (Table 6.40);
• support from administration (Table 6.41);
• the attitude of students (Table 6.42);
• the satisfaction of student achievement (Table 6.43);
• the support of students’ parents (Table 6.44);
• the attitude of the general public (Table 6.45); and
• the possibility of promotion (Table 6.46).
(i) School systems and level of salary
The results show that teachers in private schools are more satisfied with their levels of
salary compared to teachers in Catholic and public school systems (Table 6.40). In the
private school system 48.3 percent of teachers responded that their satisfaction with
level of salary was ‘very high’ or ‘moderately high’ compared to 21.9 percent in public
schools and 17.6 percent in Catholic schools. In addition 53.8 percent of teachers in

233
public schools and 55.4 percent of Catholic schools considered their satisfaction with
their level of salary as being ‘very low’ or of ‘moderate low’ compared to only 20.0
percent of private school teachers.
Table 6.40 School System and Level of Salary
Level of salary
School system Very low
Moderately low Neutral
Moderately high
Very high Total
Public Count 26 45 32 25 4 132 Expected
count 23.3 38.2 35.2 31.3 4.0 132.0
% within school type 19.7% 34.1% 24.2% 18.9% 3.0% 100.0%
Catholic systemic Count 18 23 20 12 1 74 Expected
count 13.1 21.4 19.8 17.5 2.2 74.0
% within school type 24.3% 31.1% 27.0% 16.2% 1.4% 100.0%
Other private Count 3 9 19 26 3 60 Expected
count 10.6 17.4 16.0 14.2 1.8 60.0
% within school type 5.0% 15.0% 31.7% 43.3% 5.0% 100.0%
Total Count 47 77 71 63 8 266 Expected
count 47.0 77.0 71.0 63.0 8.0 266.0
% within school type 17.7% 28.9% 26.7% 23.7% 3.0% 100.0%
Chi-Square Tests Test Value df Asymp. Sig. (2-sided) Pearson Chi-Square 28.07 8 0.000 Likelihood Ratio 29.23 8 0.000 Linear-by-Linear Association 14.73 1 0.000 N of Valid Cases 266
The greater level of satisfaction in private schools is not surprising as their salary levels
are generally higher than the other two school systems, which historically tend to have
similar salary scales to each other.

234
(ii) School systems and support from administration
The results show that teachers in the less centralised education systems in Catholic and
private schools are more satisfied with support from administration compared to
teachers in public schools (Table 6.41).
Table 6.41 School System and Support from Administration
Support from administration
School system Very Low
Moderately low Neutral
Moderately high
Very high Total
Public Count 29 25 28 35 15 132 Expected
count 18.4 23.4 31.9 39.4 18.9 132.0
% within school type 22.0% 18.9% 21.2% 26.5% 11.4% 100.0%
Catholic systemic Count 4 11 18 25 16 74 Expected
count 10.3 13.1 17.9 22.1 10.6 74.0
% within school type 5.4% 14.9% 24.3% 33.8% 21.6% 100.0%
Other private Count 4 11 18 19 7 59 Expected
count 8.2 10.5 14.2 17.6 8.5 59.0
% within school type 6.8% 18.6% 30.5% 32.2% 11.9% 100.0%
Total Count 37 47 64 79 38 265 Expected
count 37.0 47.0 64.0 79.0 38.0 265.0
% within school type 14.0% 17.7% 24.2% 29.8% 14.3% 100.0%
Chi-Square Tests Test Value df Asymp. Sig. (2-sided) Pearson Chi-Square 18.85 8 0.016 Likelihood Ratio 19.32 8 0.013 Linear-by-Linear Association 6.270 1 0.012 N of Valid Cases 265
The teachers most satisfied with support from administration were in the Catholic
school system where 55.4 percent of teachers responded that their satisfaction with
support from administration was ‘very high’ or ‘moderately high’ compared to 37.9
percent in public schools and 44.1 percent in private schools. In addition 40.9 percent

235
of teachers in public schools and 25.4 percent of private schools considered their
satisfaction with support from administration as being ‘very low’ or of ‘moderate low’
compared to only 20.3 percent of Catholic teachers.
The issue of support from administration generating different levels of satisfaction
between systems will be considered in Chapter 8 of this thesis as a possible area of
policy response to increase teacher satisfaction and the quality and quantity of teachers.
(iii) School systems and the attitude of students
The results show that teachers in Catholic and private schools are more satisfied with
the attitude of students compared to teachers in public schools (Table 6.42).
Table 6.42 School System and the Attitude of Students
The attitude of students
School System Very low
Moderately low Neutral
Moderately high
Very high Total
Public Count 8 33 32 36 23 132 Expected
count 4.5 19.8 30.8 52.1 24.8 132.0
% within school type 6.1% 25.0% 24.2% 27.3% 17.4% 100.0%
Catholic systemic Count 0 5 18 35 16 74 Expected
count 2.5 11.1 17.2 29.2 13.9 74.0
% within school type .0% 6.8% 24.3% 47.3% 21.6% 100.0%
Other private Count 1 2 12 34 11 60 Expected
count 2.0 9.0 14.0 23.7 11.3 60.0
% within school type 1.7% 3.3% 20.0% 56.7% 18.3% 100.0%
Total Count 9 40 62 105 50 266 Expected
count 9.0 40.0 62.0 105.0 50.0 266.0
% within school type 3.4% 15.0% 23.3% 39.5% 18.8% 100.0%
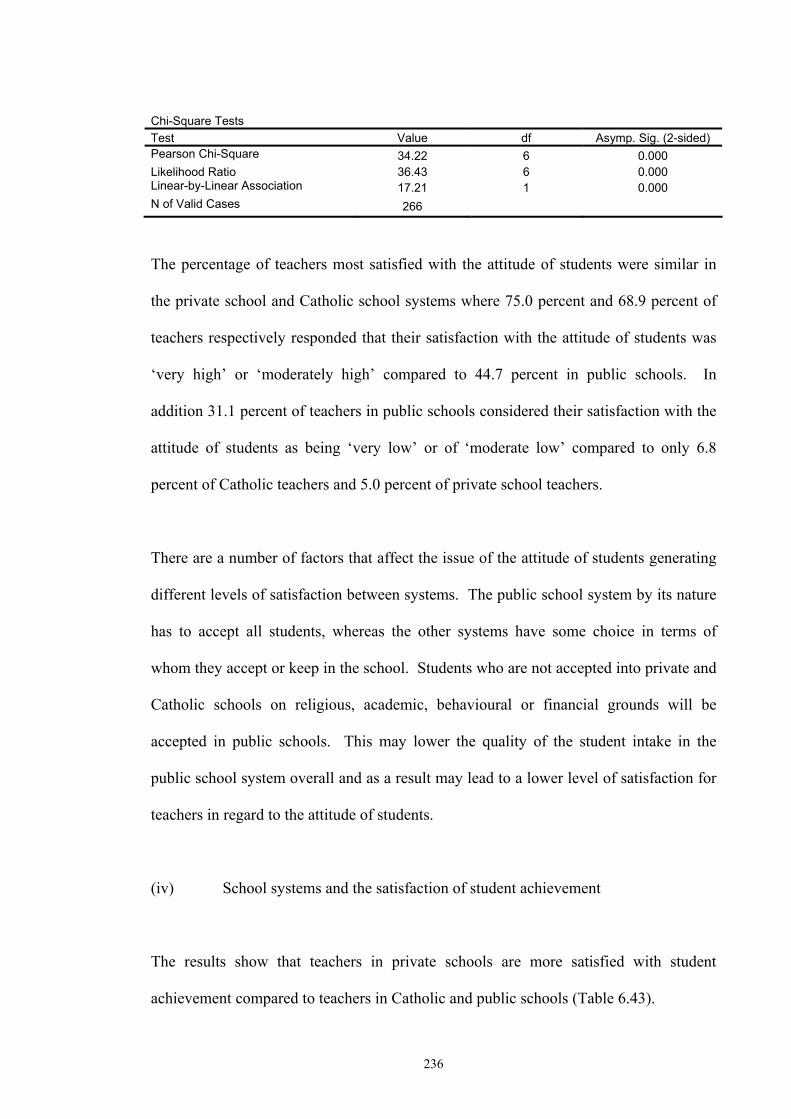
236
Chi-Square Tests Test Value df Asymp. Sig. (2-sided) Pearson Chi-Square 34.22 6 0.000 Likelihood Ratio 36.43 6 0.000 Linear-by-Linear Association 17.21 1 0.000 N of Valid Cases 266
The percentage of teachers most satisfied with the attitude of students were similar in
the private school and Catholic school systems where 75.0 percent and 68.9 percent of
teachers respectively responded that their satisfaction with the attitude of students was
‘very high’ or ‘moderately high’ compared to 44.7 percent in public schools. In
addition 31.1 percent of teachers in public schools considered their satisfaction with the
attitude of students as being ‘very low’ or of ‘moderate low’ compared to only 6.8
percent of Catholic teachers and 5.0 percent of private school teachers.
There are a number of factors that affect the issue of the attitude of students generating
different levels of satisfaction between systems. The public school system by its nature
has to accept all students, whereas the other systems have some choice in terms of
whom they accept or keep in the school. Students who are not accepted into private and
Catholic schools on religious, academic, behavioural or financial grounds will be
accepted in public schools. This may lower the quality of the student intake in the
public school system overall and as a result may lead to a lower level of satisfaction for
teachers in regard to the attitude of students.
(iv) School systems and the satisfaction of student achievement
The results show that teachers in private schools are more satisfied with student
achievement compared to teachers in Catholic and public schools (Table 6.43).

237
Table 6.43 School System and the Satisfaction of Student Achievement
The satisfaction of student achievement
School system Very low
Moderately low Neutral
Moderately high
Very high Total
Public Count 2 17 38 51 24 132 Expected
count 1.0 9.9 33.1 62.3 25.7 132.0
% within school type 1.5% 12.9% 28.8% 38.6% 18.2% 100.0%
Catholic systemic Count 0 1 20 39 15 75 Expected
count 0.6 5.6 18.8 35.4 14.6 75.0
% within school type 0.0% 1.3% 26.7% 52.0% 20.0% 100.0%
Other private Count 0 2 9 36 13 60 Expected
count 0.4 4.5 15.1 28.3 11.7 60.0
% within school type 0.0% 3.3% 15.0% 60.0% 21.7% 100.0%
Total Count 2 20 67 126 52 267 Expected
count 2.0 20.0 67.0 126.0 52.0 267.0
% within school type 0.7% 7.5% 25.1% 47.2% 19.5% 100.0%
Chi-Square Tests Test Value df Asymp. Sig. (2-sided) Pearson Chi-Square 20.16 6 0.003 Likelihood Ratio 22.27 6 0.001 Linear-by-Linear Association 10.35 1 0.001 N of Valid Cases 267
Eighty one point seven percent of teachers in private schools responded that their
satisfaction with student achievement was ‘very high’ or ‘moderately high’ compared to
72.0 percent in Catholic and 56.8 percent in public schools. In addition 14.4 percent of
teachers in public schools considered their satisfaction with student achievement as
being ‘very low’ or of ‘moderate low’ compared to only 1.3 percent of Catholic teachers
and 3.3 percent of private school teachers.
As mentioned previously, the overall quality of the students in public schools is likely to
be lower than those in Catholic and private schools. This could then reflect on the level

238
of student achievement and as a result lower teacher satisfaction in student achievement
by public school teachers.
(v) School systems and the support of students’ parents
The results again show that teachers in private schools overall have the highest levels of
satisfaction compared to teachers in Catholic and public schools (Table 6.44).
Table 6.44 School System and the Support of Students’ Parents
The support of students' parents
School system Very low
Moderately low Neutral
Moderately high
Very high Total
Public Count 15 33 42 37 5 132 Expected
count 7.9 24.8 45.2 45.7 8.4 132.0
% within school type 11.4% 25.0% 31.8% 28.0% 3.8% 100.0%
Catholic systemic Count 0 12 29 28 5 74 Expected
count 4.5 13.9 25.3 25.6 4.7 74.0
% within school type 0.0% 16.2% 39.2% 37.8% 6.8% 100.0%
Other private Count 1 5 20 27 7 60 Expected
count 3.6 11.3 20.5 20.8 3.8 60.0
% within school type 1.7% 8.3% 33.3% 45.0% 11.7% 100.0%
Total Count 16 50 91 92 17 266 Expected
count 16.0 50.0 91.0 92.0 17.0 266.0
% within school type 6.0% 18.8% 34.2% 34.6% 6.4% 100.0%
Chi-Square Tests
Test Value df Asymp. Sig. (2-sided) Pearson Chi-Square 23.15 6 0.001 Likelihood Ratio 23.78 6 0.001 Linear-by-Linear Association 19.73 1 0.000 N of Valid Cases 266
Fifty six point seven percent of teachers in private schools responded that their
satisfaction as a result of the support of students’ parents was ‘very high’ or ‘moderately

239
high’ compared to 44.6 percent in Catholic and 31.8 percent in public schools. In
addition 36.4 percent of teachers in public schools considered their satisfaction as a
result of the support of students’ parents as being ‘very low’ or of ‘moderate low’
compared to only 16.2 percent of Catholic teachers and 10.0 percent of private school
teachers.
If there is a lower level of support from parents in public schools, this could be a result
of the differences in selection criteria between school systems. Parents who are
outlaying funds for school fees may be more supportive of the education system. In
addition it could be argued that parents with a greater interest in their children’s
education may be more willing to pay fees and send their children to private schools.
The ‘free rider’ concept of public education may also create greater apathy from parents
towards public schools and their teachers.
(vi) School systems and the attitude of the general public
The results show that teachers in general are dissatisfied with the attitude of the general
public towards teachers (Table 6.45). The percentages of teachers most satisfied with
the attitude of the general public were similarly low in all three school systems. In the
private school and Catholic school systems only 10.0 percent and 8.2 percent of
teachers respectively responded that their satisfaction with the attitude of the general
public was ‘very high’ or ‘moderately high’ compared to 8.3 percent in public schools.
The largest level of dissatisfaction was in public schools where 80.3 percent of teachers
considered their satisfaction with the attitude of the general public as being ‘very low’

240
or ‘moderate low’. This compared to 64.8 percent of Catholic teachers and 51.7 percent
of private school teachers.
Table 6.45 School System and Attitude of the General Public
Attitude of the general public Total
School system Very Low
Moderately low Neutral
Moderately high
Very high
Public Count 54 52 15 6 5 132 Expected
count 40.7 51.1 28.8 6.9 4.5 132.0
% within school type 40.9% 39.4% 11.4% 4.5% 3.8% 100.0%
Catholic systemic Count 18 30 20 3 3 74 Expected
count 22.8 28.7 16.1 3.9 2.5 74.0
% within school type 24.3% 40.5% 27.0% 4.1% 4.1% 100.0%
Other private Count 10 21 23 5 1 60 Expected
count 18.5 23.2 13.1 3.2 2.0 60.0
% within school type 16.7% 35.0% 38.3% 8.3% 1.7% 100.0%
Total Count 82 103 58 14 9 266 Expected
count 82.0 103.0 58.0 14.0 9.0 266.0
% within school type 30.8% 38.7% 21.8% 5.3% 3.4% 100.0%
Chi-Square Tests Test Value df Asymp. Sig. (2-sided) Pearson Chi-Square 24.77 6 0.000 Likelihood Ratio 25.18 6 0.000 Linear-by-Linear Association 15.35 1 0.000 N of Valid Cases 266
Teachers appear to have the impression that the general public has a poor image of
teachers and this reflects in the low levels of satisfaction of teachers in regard to this
issue across the three systems. While the attitude may be worse for public school
teachers, there is a general low level of satisfaction amongst teachers due to the attitude
of the general public. This attitude could have a major influence on the decisions of
potential teachers to enter the teaching profession. This will be discussed further in
regard to policy implications in Chapter 8.

241
(vii) School systems and the possibility of promotion
The results show that teachers in private schools are more satisfied with the possibility
of promotion compared to teachers in Catholic and public schools (Table 6.46).
Table 6.46 School System and the Possibility of Promotion
The possibility of promotion
School system Very low
Moderately low Neutral
Moderately high
Very high Total
Public Count 31 27 47 21 4 130 Expected
count 26.1 24.1 50.7 22.2 6.9 130.0
% within school type 23.8% 20.8% 36.2% 16.2% 3.1% 100.0%
Catholic systemic Count 14 15 34 7 4 74 Expected
count 14.9 13.7 28.9 12.6 3.9 74.0
% within school type 18.9% 20.3% 45.9% 9.5% 5.4% 100.0%
Other private Count 8 7 22 17 6 60 Expected
count 12.0 11.1 23.4 10.2 3.2 60.0
% within school type 13.3% 11.7% 36.7% 28.3% 10.0% 100.0%
Total Count 53 49 103 45 14 264 Expected
count 53.0 49.0 103.0 45.0 14.0 264.0
% within school type 20.1% 18.6% 39.0% 17.0% 5.3% 100.0%
Chi-Square Tests Test Value df Asymp. Sig. (2-sided) Pearson Chi-Square 16.35 8 0.038 Likelihood Ratio 16.09 8 0.041 Linear-by-Linear Association 8.93 1 0.003 N of Valid Cases 264
Thirty eight point three percent of teachers in private schools responded that their
satisfaction as a result of the possibility of promotion was ‘very high’ or ‘moderately
high’ compared to only 14.9 percent in Catholic and 19.3 percent in public schools. The
highest level of dissatisfaction was in public schools where 44.1 percent of teachers
considered their satisfaction with the possibility of promotion as being ‘very low’ or

242
‘moderate low’. This compared to 39.2 percent of Catholic teachers and 25.0 percent of
private school teachers. The differences reported here could reflect the relatively larger
number of positions of responsibility in private schools and similar promotional
structures in public and Catholic school systems. The policy implications of these
differences will also be considered in Chapter 8.
Overall the level of teacher satisfaction appears to be highest in the private school sector
and lowest in the public school sector. Some of the factors that cause this may be
beyond the scope of public policy such as socio-economic and other factors that
determine which school system students may go to or perhaps be excluded from. Some
other factors such as level of salary, support from administration and the possibility of
promotion are areas that policy makers in school systems can influence. There may
even be ways that policies can be adopted to improve the attitude of students, the
support of student’s parents, and the attitude of the general public towards teachers.
These possibilities will be considered in Chapter 8.
6.8.3 Hypothesis Testing by Age of Teachers
In testing, if there are differences in the level of satisfaction of teachers, based on their
age, in regard to various factors influencing their overall satisfaction level, the null and
alternative hypotheses are as follows:
The null hypothesis is given by H0: The factor is independent of age.
Thus the alternative hypothesis is HA: The factor is not independent of age.

243
The decision rule at the five percent significance level varies with the degrees of
freedom57 in the sample. With six degrees of freedom the decision rule is based on the
value 12.59 and with nine degrees of freedom it is 16.92. The decision rule at the five
percent significance level, with 12 degrees of freedom is given as follows:
Reject H0 if the Chi-squared value is greater than 21.03.
Do not reject H0 if the Chi-squared value is less than 21.03.
If the null hypothesis is true, the factors selected are independent of the age of the
teachers.
Table 6.47: Age and the Level of Teacher Job Satisfaction Summary Table
Factors Chi-
square df
Asymp. Sig. (2-sided)
Mean under 30
years
Mean 30-39 years
Mean 40-49 years
Mean over 50 years
Level of salary 13.330 9 0.148 2.87 2.68 2.70 2.44 Job security 7.321 9 0.604 4.13 4.11 4.04 4.08 A low level of stress 22.106 12 0.036 2.35 2.16 2.29 2.15 Number of holidays 13.520 9 0.140 4.20 3.88 4.00 3.67 Hours of work 13.851 12 0.310 3.17 2.86 2.87 2.95 Support from administration 20.988 12 0.051 3.40 2.91 3.22 3.01
The attitude of peers 16.368 9 0.060 3.80 3.75 3.57 4.00 The attitude of students 5.582 12 0.936 3.49 3.61 3.57 3.52
The satisfaction of student achievement 4.553 9 0.871 3.80 3.72 3.71 3.86
The support of students' parents 10.509 12 0.571 2.96 3.14 3.25 3.21
The attitude of the general public 15.915 9 0.069 1.84 2.46 2.14 1.99
The support of your family 9.026 9 0.435 4.28 4.07 4.04 4.16
Interest in the subjects taught 3.389 6 0.759 4.24 4.19 4.34 4.34
The possibility of promotion 24.044 9 0.004 2.93 3.04 2.68 2.27
All of the factors were compared to the age of the teachers (Table 6.47). There were
significant differences in the satisfaction levels between the ages of teachers in regard to
57 The degrees of freedom vary as some data cells have been combined to ensure the validity of the results.
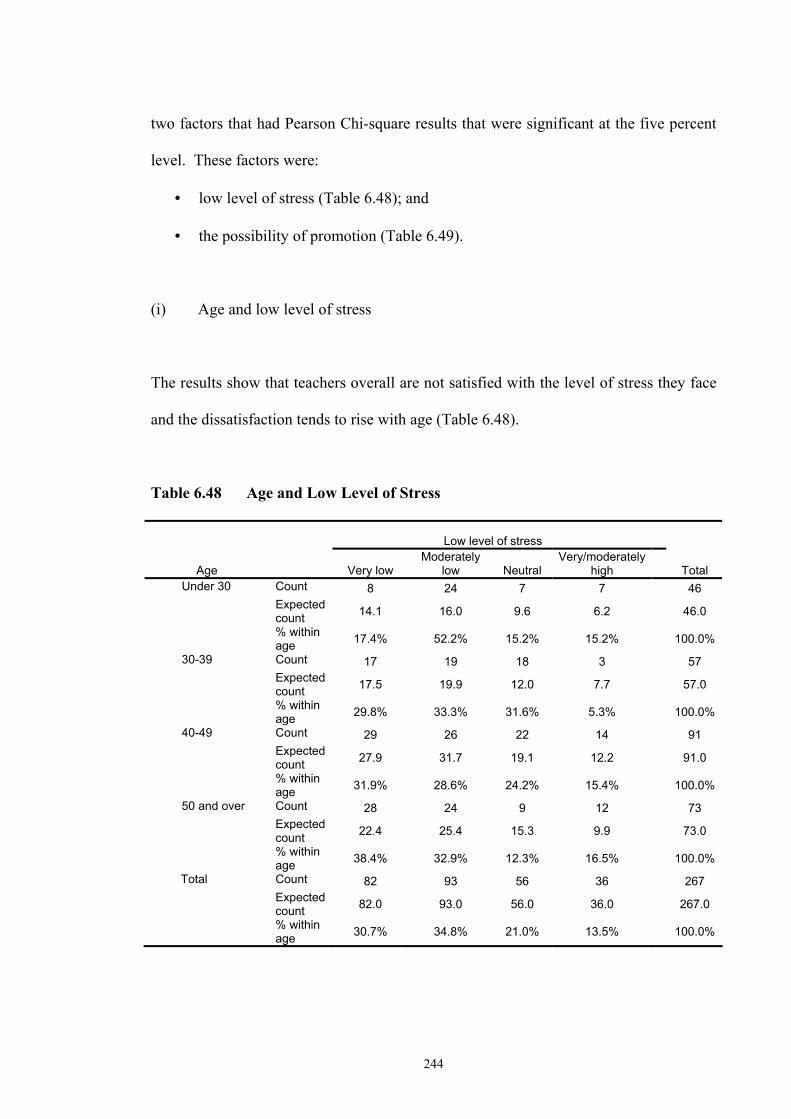
244
two factors that had Pearson Chi-square results that were significant at the five percent
level. These factors were:
• low level of stress (Table 6.48); and
• the possibility of promotion (Table 6.49).
(i) Age and low level of stress
The results show that teachers overall are not satisfied with the level of stress they face
and the dissatisfaction tends to rise with age (Table 6.48).
Table 6.48 Age and Low Level of Stress
Low level of stress
Age Very low Moderately
low Neutral Very/moderately
high Total Under 30 Count 8 24 7 7 46 Expected
count 14.1 16.0 9.6 6.2 46.0
% within age 17.4% 52.2% 15.2% 15.2% 100.0%
30-39 Count 17 19 18 3 57 Expected
count 17.5 19.9 12.0 7.7 57.0
% within age 29.8% 33.3% 31.6% 5.3% 100.0%
40-49 Count 29 26 22 14 91 Expected
count 27.9 31.7 19.1 12.2 91.0
% within age 31.9% 28.6% 24.2% 15.4% 100.0%
50 and over Count 28 24 9 12 73 Expected
count 22.4 25.4 15.3 9.9 73.0
% within age 38.4% 32.9% 12.3% 16.5% 100.0%
Total Count 82 93 56 36 267 Expected
count 82.0 93.0 56.0 36.0 267.0
% within age 30.7% 34.8% 21.0% 13.5% 100.0%
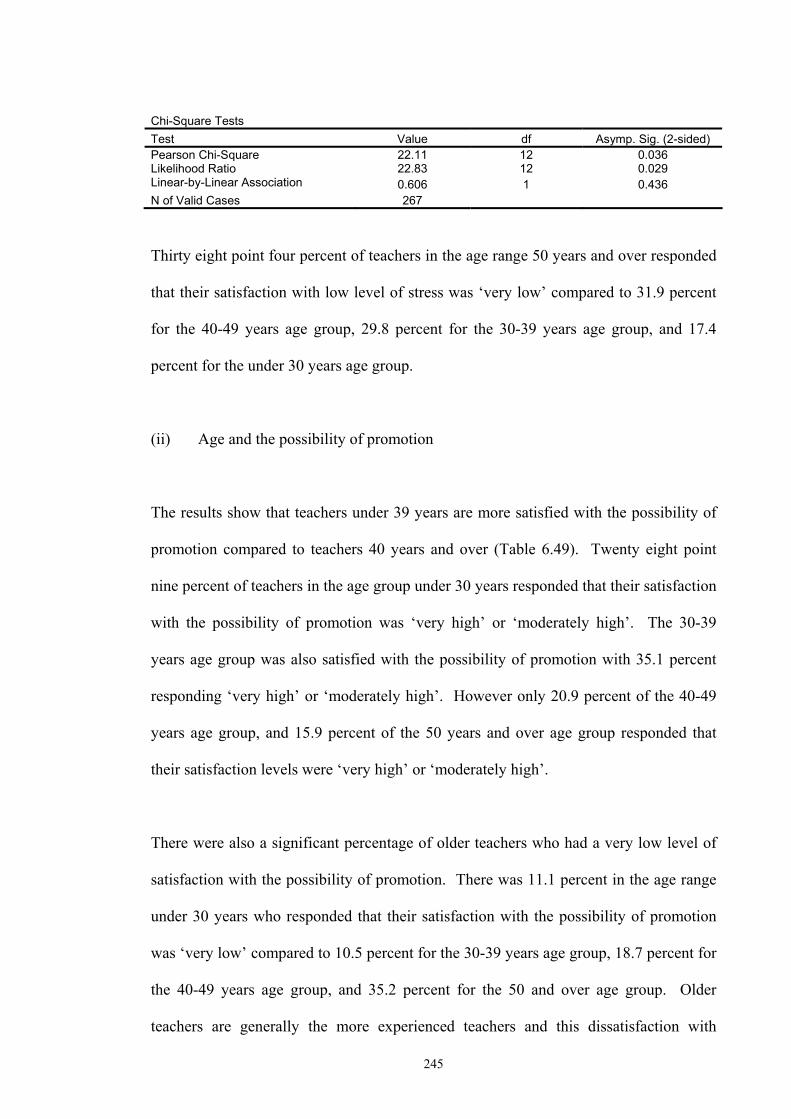
245
Chi-Square Tests Test Value df Asymp. Sig. (2-sided) Pearson Chi-Square 22.11 12 0.036 Likelihood Ratio 22.83 12 0.029 Linear-by-Linear Association 0.606 1 0.436 N of Valid Cases 267
Thirty eight point four percent of teachers in the age range 50 years and over responded
that their satisfaction with low level of stress was ‘very low’ compared to 31.9 percent
for the 40-49 years age group, 29.8 percent for the 30-39 years age group, and 17.4
percent for the under 30 years age group.
(ii) Age and the possibility of promotion
The results show that teachers under 39 years are more satisfied with the possibility of
promotion compared to teachers 40 years and over (Table 6.49). Twenty eight point
nine percent of teachers in the age group under 30 years responded that their satisfaction
with the possibility of promotion was ‘very high’ or ‘moderately high’. The 30-39
years age group was also satisfied with the possibility of promotion with 35.1 percent
responding ‘very high’ or ‘moderately high’. However only 20.9 percent of the 40-49
years age group, and 15.9 percent of the 50 years and over age group responded that
their satisfaction levels were ‘very high’ or ‘moderately high’.
There were also a significant percentage of older teachers who had a very low level of
satisfaction with the possibility of promotion. There was 11.1 percent in the age range
under 30 years who responded that their satisfaction with the possibility of promotion
was ‘very low’ compared to 10.5 percent for the 30-39 years age group, 18.7 percent for
the 40-49 years age group, and 35.2 percent for the 50 and over age group. Older
teachers are generally the more experienced teachers and this dissatisfaction with

246
promotion could lead to a lower performance. Policies to take advantage of this
experience by developing new promotion positions will be discusses in Chapter 8.
Table 6.49 Age and the Possibility of Promotion
The possibility of promotion
Age Very low Moderately
low Neutral Very/moderately
high Total Under 30 Count 5 9 18 13 45 Expected
count 9.0 8.4 17.6 10.1 45.0
% within age 11.1% 20.0% 40.0% 28.9% 100.0%
30-39 Count 6 8 23 20 57 Expected
count 11.4 10.6 22.2 12.7 57.0
% within age 10.5% 14.0% 40.4% 35.1% 100.0%
40-49 Count 17 20 35 19 91 Expected
count 18.3 16.9 35.5 20.3 91.0
% within age 18.7% 22.0% 38.5% 20.9% 100.0%
50 and over Count 25 12 27 7 71 Expected
count 14.3 13.2 27.7 15.9 71.0
% within age 35.2% 16.9% 38.0% 9.9% 100.0%
Total Count 53 49 103 59 264 Expected
count 53.0 49.0 103.0 59.0 264.0
% within age 20.1% 18.6% 39.0% 22.3% 100.0%
Chi-Square Tests
Test Value df Asymp. Sig. (2-sided) Pearson Chi-Square 24.04 9 0.004 Likelihood Ratio 24.11 9 0.004 Linear-by-Linear Association 16.09 1 0.000 N of Valid Cases 264
Three factors were significant at a 10 percent level. They were support from
administration, attitude of peers, and attitude of the general public.

247
(iii) Age and support from administration
The results show that younger teachers are more satisfied with the support they receive
from administration compared to older teachers (Table 6.50).
Table 6.50 Age and Support from Administration
Support from administration
Age Very lowModerately
low Neutral Moderately
high Very high Total
Under 30 Count 0 8 15 18 4 45 Expected
count 6.3 8.0 10.9 13.4 6.5 45.0
% within age 0.0% 17.8% 33.3% 40.0% 8.9% 100.0%
30-39 Count 8 15 14 12 7 56 Expected
count 7.8 9.9 13.5 16.7 8.0 56.0
% within age 14.3% 26.8% 25.0% 21.4% 12.5% 100.0%
40-49 Count 14 13 21 25 18 91 Expected
count 12.7 16.1 22.0 27.1 13.0 91.0
% within age 15.4% 14.3% 23.1% 27.5% 19.8% 100.0%
50 and over Count 15 11 14 24 9 73 Expected
count 10.2 12.9 17.6 21.8 10.5 73.0
% within age 20.5% 15.1% 19.2% 32.9% 12.3% 100.0%
Total Count 37 47 64 79 38 265 Expected
count 37.0 47.0 64.0 79.0 38.0 265.0
% within age 14.0% 17.7% 24.2% 29.8% 14.3% 100.0%
Chi-Square Tests Test Value df Asymp. Sig. (2-sided) Pearson Chi-Square 20.99 12 0.051 Likelihood Ratio 26.52 12 0.009 Linear-by-Linear Association 0.923 1 0.337 N of Valid Cases 265
Forty eight point nine percent of teachers in the age range under 30 years responded that
their satisfaction with support from administration was ‘very high’ or ‘moderately high’
compared to 33.9 percent for the 30-39 years age group, 47.3 percent for the 40-49
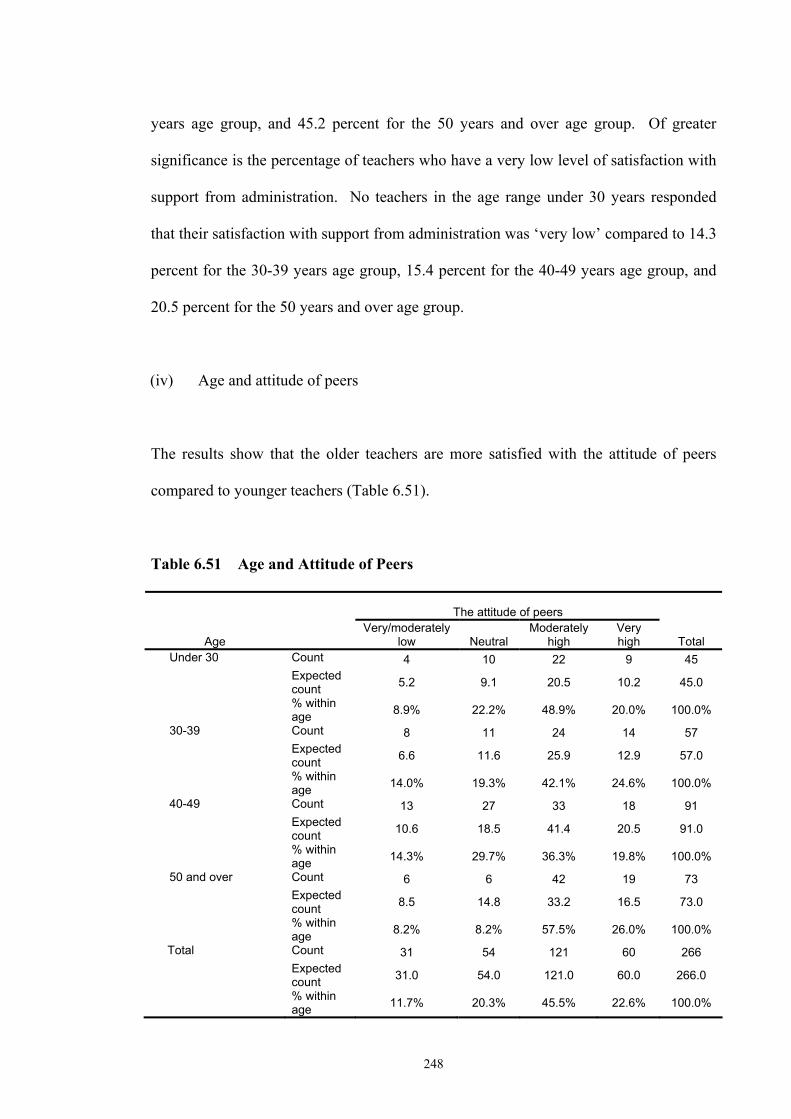
248
years age group, and 45.2 percent for the 50 years and over age group. Of greater
significance is the percentage of teachers who have a very low level of satisfaction with
support from administration. No teachers in the age range under 30 years responded
that their satisfaction with support from administration was ‘very low’ compared to 14.3
percent for the 30-39 years age group, 15.4 percent for the 40-49 years age group, and
20.5 percent for the 50 years and over age group.
(iv) Age and attitude of peers
The results show that the older teachers are more satisfied with the attitude of peers
compared to younger teachers (Table 6.51).
Table 6.51 Age and Attitude of Peers
The attitude of peers
Age Very/moderately
low Neutral Moderately
high Very high Total
Under 30 Count 4 10 22 9 45 Expected
count 5.2 9.1 20.5 10.2 45.0
% within age 8.9% 22.2% 48.9% 20.0% 100.0%
30-39 Count 8 11 24 14 57 Expected
count 6.6 11.6 25.9 12.9 57.0
% within age 14.0% 19.3% 42.1% 24.6% 100.0%
40-49 Count 13 27 33 18 91 Expected
count 10.6 18.5 41.4 20.5 91.0
% within age 14.3% 29.7% 36.3% 19.8% 100.0%
50 and over Count 6 6 42 19 73 Expected
count 8.5 14.8 33.2 16.5 73.0
% within age 8.2% 8.2% 57.5% 26.0% 100.0%
Total Count 31 54 121 60 266 Expected
count 31.0 54.0 121.0 60.0 266.0
% within age 11.7% 20.3% 45.5% 22.6% 100.0%

249
Chi-Square Tests Test Value df Asymp. Sig. (2-sided) Pearson Chi-Square 16.37 9 0.060 Likelihood Ratio 17.41 9 0.043 Linear-by-Linear Association 1.091 1 0.296 N of Valid Cases 266
Eighty three point five percent of teachers in the age range 50 years and over responded
that their satisfaction with the attitude of peers was ‘very high’ or ‘moderately high’
compared to 66.7 percent for the 30-39 years age group, 57.1 percent for the 40-49
years age group, and 68.9 percent for the under 30 years age group. The percentage of
teachers who had a very low or moderate low level of satisfaction with attitude of peers
was greatest in the middle years. There was 8.9 percent in the age range under 30 years,
compared to 14.0 percent for the 30-39 years age group, 14.3 percent for the 40-49
years age group, and 8.2 percent for the 50 years and over age group.
(v) Age and attitude of the general public
The results show that the teachers in the 30-39 years age group are most satisfied with
the attitude of the general public especially compared to the under 30 years group
(Table 6.52). Forty five point six percent of teachers in the age range 30-39 years
responded that their satisfaction with the attitude of the general public was ‘very high’
or ‘moderately high’ compared to 26.0 percent for the 50 years and over age group, 28.6
percent for the 40-49 years age group, and only 22.0 percent for the under 30 years age
group. The percentage of teachers who had a very low level of satisfaction with attitude
of the general public was smallest in the middle years. There was 37.8 percent in the
age range under 30 years, compared to 24.6 percent for the 30-39 years age group, 26.4
percent for the 40-49 years age group, and 37.0 percent for the 50 years and over age
group.
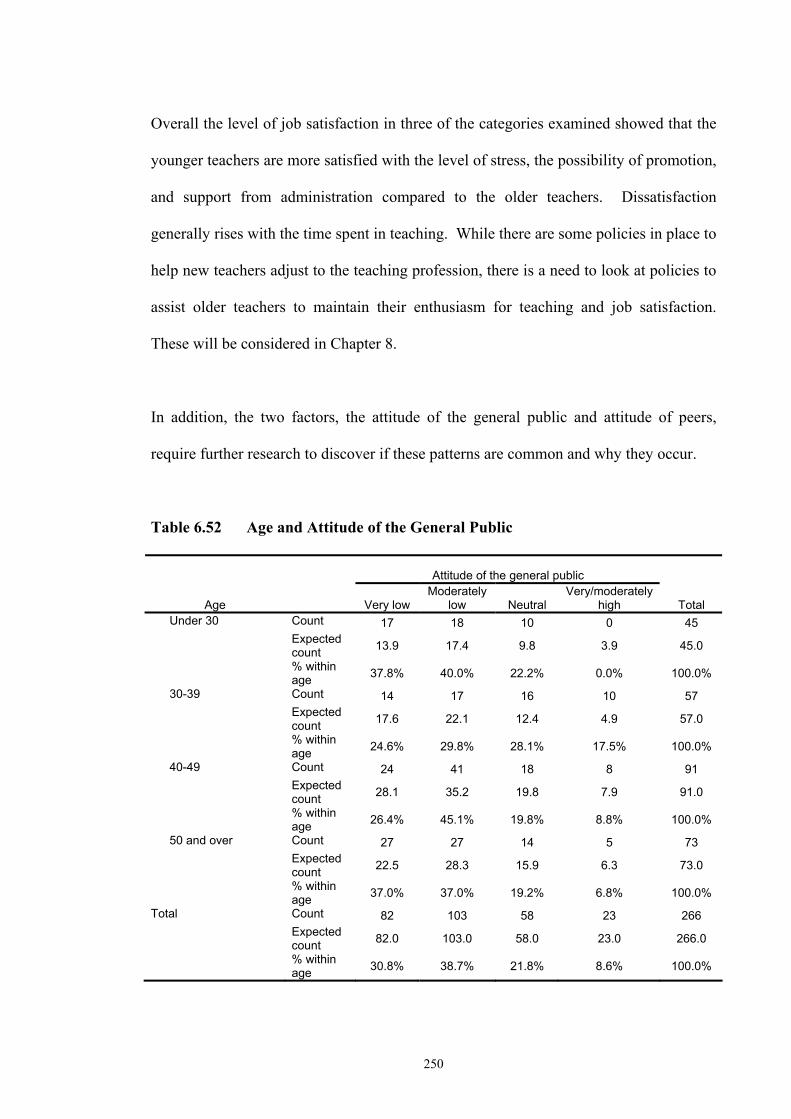
250
Overall the level of job satisfaction in three of the categories examined showed that the
younger teachers are more satisfied with the level of stress, the possibility of promotion,
and support from administration compared to the older teachers. Dissatisfaction
generally rises with the time spent in teaching. While there are some policies in place to
help new teachers adjust to the teaching profession, there is a need to look at policies to
assist older teachers to maintain their enthusiasm for teaching and job satisfaction.
These will be considered in Chapter 8.
In addition, the two factors, the attitude of the general public and attitude of peers,
require further research to discover if these patterns are common and why they occur.
Table 6.52 Age and Attitude of the General Public
Attitude of the general public
Age Very low Moderately
low Neutral Very/moderately
high Total Under 30 Count 17 18 10 0 45 Expected
count 13.9 17.4 9.8 3.9 45.0
% within age 37.8% 40.0% 22.2% 0.0% 100.0%
30-39 Count 14 17 16 10 57 Expected
count 17.6 22.1 12.4 4.9 57.0
% within age 24.6% 29.8% 28.1% 17.5% 100.0%
40-49 Count 24 41 18 8 91 Expected
count 28.1 35.2 19.8 7.9 91.0
% within age 26.4% 45.1% 19.8% 8.8% 100.0%
50 and over Count 27 27 14 5 73 Expected
count 22.5 28.3 15.9 6.3 73.0
% within age 37.0% 37.0% 19.2% 6.8% 100.0%
Total Count 82 103 58 23 266 Expected
count 82.0 103.0 58.0 23.0 266.0
% within age 30.8% 38.7% 21.8% 8.6% 100.0%

251
Chi-Square Tests Test Value df Asymp. Sig. (2-sided) Pearson Chi-Square 15.92 9 0.069 Likelihood Ratio 18.58 9 0.029 Linear-by-Linear Association 0.095 1 0.758 N of Valid Cases 266
6.8.4 Hypothesis Testing by Level of Academic Qualifications
In testing, if there are differences in the level of satisfaction of teachers, based on their
academic qualifications, in regard to various factors influencing their overall
satisfaction level, the null and alternative hypotheses are as follows:
The null hypothesis is given by H0: The factor is independent of academic
qualifications.
Thus the alternative hypothesis is HA: The factor is not independent of academic
qualifications.
All of the factors were compared to the academic qualifications of the teachers. There
were no significant differences in the satisfaction levels between the academic
qualifications of the teachers and any of the factors at the five percent significance level
(Table 6.53). At the 10 percent significance level there was one factor that was
significant, the possibility of promotion. Table 6.54 shows that the level of satisfaction
associated with the possibility of promotion increases with the level of qualifications.
Teachers with diplomas and ‘other’ qualifications had a satisfaction rating in the high or
moderately high categories of 4.2 percent. Those with a degree had a satisfaction rating
in the high or moderately high categories of 21.4 percent and those teachers with
masters or higher degrees had a rating of 37.2 percent. The higher levels of satisfaction
associated with those with higher qualification could reflect that the higher
qualifications have led to a higher proportion of those teachers gaining promotion.

252
Table 6.53 Level of Academic Qualifications and the Level of Teacher Job
Satisfaction Summary Table
Factors Chi-
square dfa
Asymp. Sig. (2-sided)
Mean diploma/
other
Mean bachelors
degree
Mean masters
degree or higher
Level of salary 7.024 8 0.534 2.54 2.69 2.51 Job security 4.502 8 0.809 3.88 4.12 4.02 A low level of stress 3.657 8 0.887 2.00 2.26 2.26 Number of holidays 9.176 8 0.328 4.00 3.90 3.93 Hours of work 9.854 8 0.275 3.00 2.89 3.09 Support from administration 7.808 8 0.452 3.46 3.12 3.00
The attitude of peers 10.43 8 0.236 3.50 3.77 3.86 The attitude of students 10.02 8 0.264 3.46 3.52 3.81 The satisfaction of student achievement 8.922 8 0.349 3.71 3.75 3.95
The support of students' parents 11.10 8 0.196 2.96 3.15 3.37
The attitude of the general public 4.744 8 0.785 2.04 2.13 2.14
The support of your family 9.818 8 0.278 4.17 4.17 3.86
Interest in the subjects taught 6.490 8 0.593 4.21 4.30 4.35
The possibility of promotion 10.71 6 0.098 2.37 2.68 2.91
(a) The degrees of freedom have been adjusted where necessary to ensure the accuracy of the results.
Table 6.54 Qualifications and the Possibility of Promotion
The possibility of promotion
Qualification Very low
Moderately low Neutral
High/moderately high Total
Diploma/other Count 5 6 12 1 24 Expected
count 4.8 4.5 9.3 5.4 24.0
% within qualification 20.8% 25.0% 50.0% 4.2% 100.0%
Bachelors degree Count 40 36 78 42 196 Expected
count 39.5 36.5 76.0 44.0 196.0
% within qualification 20.4% 18.4% 39.8% 21.4% 100.0%
Masters degree or higher Count 8 7 12 16 43 Expected
count 8.7 8.0 16.7 9.6 43.0
% within qualification 18.6% 16.3% 27.9% 37.2% 100.0%
Total Count 53 49 102 59 263 Expected
count 53.0 49.0 102.0 59.0 263.0
% within qualification 20.2% 18.6% 38.8% 22.4% 100.0%
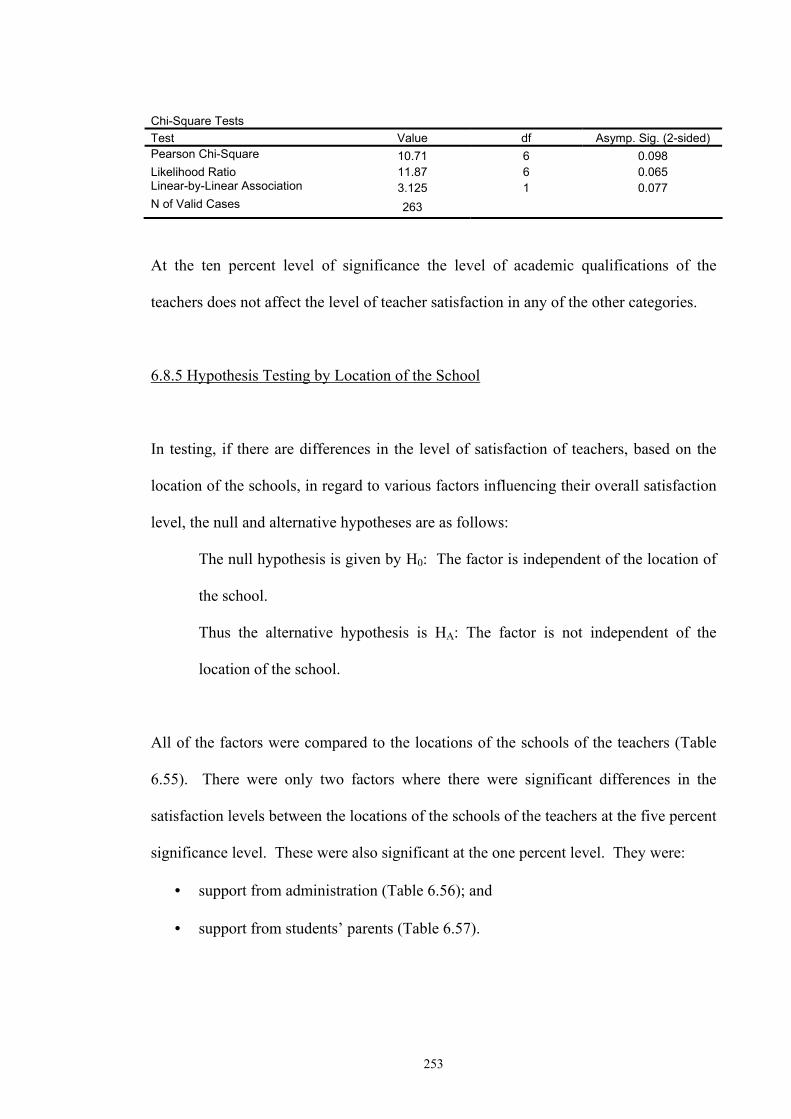
253
Chi-Square Tests Test Value df Asymp. Sig. (2-sided) Pearson Chi-Square 10.71 6 0.098 Likelihood Ratio 11.87 6 0.065 Linear-by-Linear Association 3.125 1 0.077 N of Valid Cases 263
At the ten percent level of significance the level of academic qualifications of the
teachers does not affect the level of teacher satisfaction in any of the other categories.
6.8.5 Hypothesis Testing by Location of the School
In testing, if there are differences in the level of satisfaction of teachers, based on the
location of the schools, in regard to various factors influencing their overall satisfaction
level, the null and alternative hypotheses are as follows:
The null hypothesis is given by H0: The factor is independent of the location of
the school.
Thus the alternative hypothesis is HA: The factor is not independent of the
location of the school.
All of the factors were compared to the locations of the schools of the teachers (Table
6.55). There were only two factors where there were significant differences in the
satisfaction levels between the locations of the schools of the teachers at the five percent
significance level. These were also significant at the one percent level. They were:
• support from administration (Table 6.56); and
• support from students’ parents (Table 6.57).

254
Table 6.55 Location of Schoola and Level of Teacher Job Satisfaction Summary
Table
Mean Mean Mean Mean Mean Mean
Factors
Chi-square Dfb
Asymp. Sig. (2-sided)
Sydney inner
city/east
Sydney north
Sydney south
Sydney west
Newcastle/ Wollongong country
Level of salary 14.35 15 0.499 2.34 2.70 2.53 2.51 5.85 2.86
Job security 20.41 15 0.157 4.15 4.00 4.34 4.24 3.88 3.90 A low level of stress 11.25 15 0.735 2.20 2.22 2.40 2.13 2.15 2.21
Number of holidays 13.96 15 0.529 3.98 3.93 3.96 4.00 3.65 3.89
Hours of work 14.73 20 0.792 2.90 3.04 2.83 3.08 2.73 2.98 Support from administration 31.09 15 0.009 3.17 3.07 3.60 3.32 3.08 2.75
The attitude of peers 12.95 15 0.606 3.85 3.81 3.81 3.89 3.65 3.67
The attitude of students 23.71 15 0.070 3.98 3.56 3.70 3.35 3.54 3.33
The satisfaction of student achievement
17.52 15 0.289 4.05 3.81 3.81 3.74 3.73 3.62
The support of students' parents
32.95 15 0.005 3.49 3.33 3.40 2.89 3.42 2.83
The attitude of the general public
17.62 15 0.283 2.15 2.22 2.19 2.05 2.23 2.02
The support of your family 14.87 15 0.461 3.98 4.04 4.28 4.37 4.00 4.04
Interest in the subjects taught
16.93 15 0.323 4.54 4.30 4.28 4.27 4.19 4.23
The possibility of promotion 9.618 20 0.975 2.75 2.70 2.75 2.78 2.62 2.60
(a) Some locations were combined to improve the validity of the results. They were Sydney inner city with Sydney east and the two regional cities Newcastle and Wollongong. (b)The degrees of freedom have been adjusted where necessary to ensure the accuracy of the results.
(i) Location of the school and support from administration
The results show that teachers working in the country regions of NSW years are
significantly less satisfied with the support from administration compared to the
teachers who live in the city region (Table 6.56). Throughout the State 14.4 percent of
teachers responded that their satisfaction with support from administration was ‘very
high’, whereas in country areas this response rate was only 8.8 percent.

255
Table 6.56 Location of the School and the Support from Administration
Support from administration
Location Low/moderately
low NeutralModerately
high Very high Total
Count 7 10 8 2 27 Expected Count 8.5 6.5 8.1 3.9 27.0
Sydney - north
% within location 25.9% 37.0% 29.6% 7.4% 100.0%
Count 12 6 23 12 53 Expected Count 16.7 12.8 15.9 7.6 53.0
Sydney - south
% within location 22.6% 11.3% 43.4% 22.6% 100.0%
Count 12 14 7 8 41 Expected Count 12.9 9.9 12.3 5.9 41.0
Sydney - inner city/east
% within location 29.3% 34.1% 17.1% 19.5% 100.0%
Count 10 9 10 8 37 Expected Count 11.6 9.0 11.1 5.3 37.0
Sydney - west
% within location 27.0% 24.3% 27.0% 21.6% 100.0%
Count 7 10 8 1 26 Expected Count 8.2 6.3 7.8 3.7 26.0
Newcastle/Wollongong
% within location 26.9% 38.5% 30.8% 3.8% 100.0%
Count 35 15 23 7 80 Expected Count 25.2 19.4 23.9 11.5 80.0
Country
% within location 43.8% 18.8% 28.8% 8.8% 100.0%
Count 83 64 79 38 264 Expected Count 83.0 64.0 79.0 38.0 264.0
Total
% within location 31.4% 24.2% 29.9% 14.4% 100.0%
Chi-Square Tests Test Value df Asymp. Sig. (2-sided) Pearson Chi-Square 31.09 15 0.009 Likelihood Ratio 31.79 15 0.007 Linear-by-Linear Association 7.050 1 0.008 N of Valid Cases 264
Similarly throughout the State, 14.0 percent of teachers responded that their satisfaction
with support from administration was ‘very low’, whereas in country areas this response
rate rose to 27.2 percent. Altogether 43.8 percent of country teachers considered their
level of satisfaction with support from administration as being ‘very low’ or
‘moderately low’.

256
Country teachers are overall not satisfied with support from administration. This could
be caused by a number of factors including regional shortages of teachers, problems of
distance and education policies that are not suitable for country schools. Education
authorities should look at the issue of teacher dissatisfaction with support from
administration in country schools.
(ii) Location of the school and support of students’ parents
The results show that teachers working in the country regions of NSW years are less
satisfied with the support of students’ parents compared to the teachers who live in the
city region (Table 6.57). In the entire Sydney region, with the exception of western
Sydney, more than 40 percent of teachers responded that their satisfaction with support
of students’ parents was ‘very high’ or ‘moderately high’. In the western region of
Sydney only 27 percent were satisfied with support of students’ parents by responding
‘very high’ or ‘moderately high’. In the country region 30.9 percent of teachers
responded that their satisfaction levels were ‘very high’ or ‘moderately high’. The
levels of dissatisfaction were similarly higher in western Sydney and the country areas
of NSW. The average response rate from teachers throughout NSW was that 24.9
percent had a ‘very low’ or ‘moderately low’ level of satisfaction with support of
students’ parents. In the western region of Sydney this rose to 29.7 percent and in the
country region to 43.2 percent.
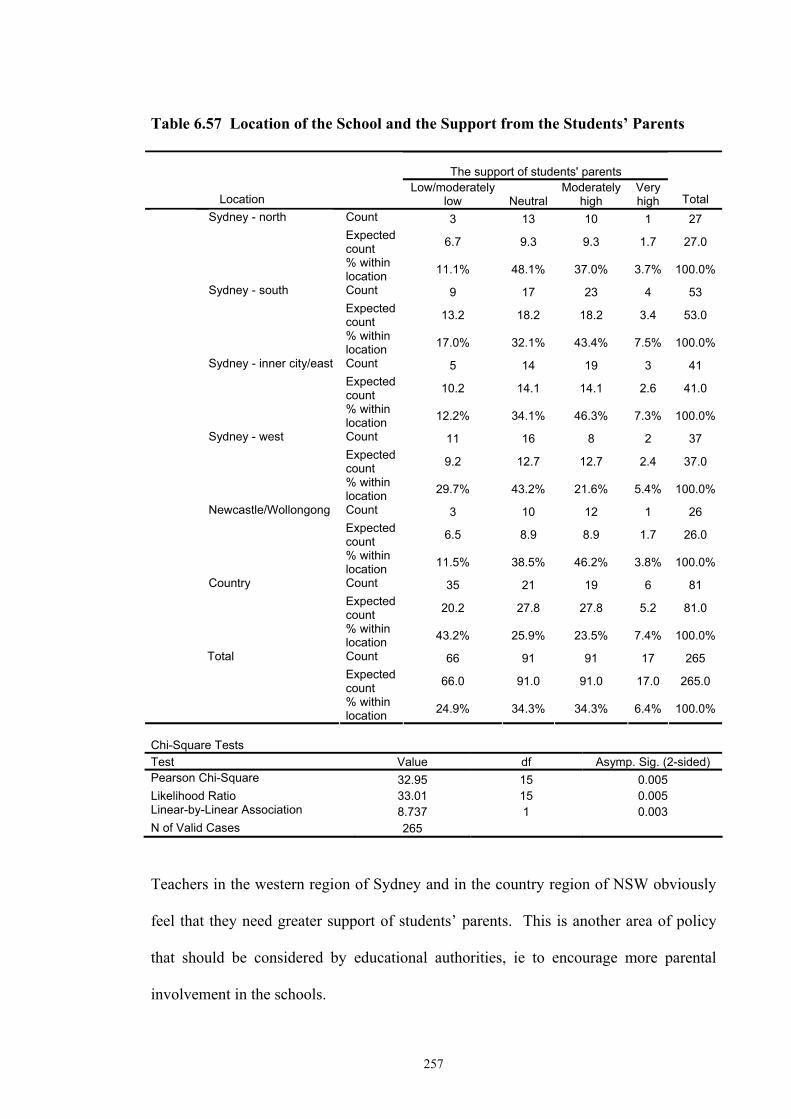
257
Table 6.57 Location of the School and the Support from the Students’ Parents
The support of students' parents
Location Low/moderately
low NeutralModerately
high Very high Total
Count 3 13 10 1 27 Expected count 6.7 9.3 9.3 1.7 27.0
Sydney - north
% within location 11.1% 48.1% 37.0% 3.7% 100.0%
Count 9 17 23 4 53 Expected count 13.2 18.2 18.2 3.4 53.0
Sydney - south
% within location 17.0% 32.1% 43.4% 7.5% 100.0%
Count 5 14 19 3 41 Expected count 10.2 14.1 14.1 2.6 41.0
Sydney - inner city/east
% within location 12.2% 34.1% 46.3% 7.3% 100.0%
Count 11 16 8 2 37 Expected count 9.2 12.7 12.7 2.4 37.0
Sydney - west
% within location 29.7% 43.2% 21.6% 5.4% 100.0%
Count 3 10 12 1 26 Expected count 6.5 8.9 8.9 1.7 26.0
Newcastle/Wollongong
% within location 11.5% 38.5% 46.2% 3.8% 100.0%
Count 35 21 19 6 81 Expected count 20.2 27.8 27.8 5.2 81.0
Country
% within location 43.2% 25.9% 23.5% 7.4% 100.0%
Count 66 91 91 17 265 Expected count 66.0 91.0 91.0 17.0 265.0
Total
% within location 24.9% 34.3% 34.3% 6.4% 100.0%
Chi-Square Tests Test Value df Asymp. Sig. (2-sided) Pearson Chi-Square 32.95 15 0.005 Likelihood Ratio 33.01 15 0.005 Linear-by-Linear Association 8.737 1 0.003 N of Valid Cases 265
Teachers in the western region of Sydney and in the country region of NSW obviously
feel that they need greater support of students’ parents. This is another area of policy
that should be considered by educational authorities, ie to encourage more parental
involvement in the schools.

258
In addition there was one factor where there was a significant difference in the
satisfaction levels between the locations of the schools of the teachers at the 10 percent
level i.e., the attitude of students.
(iii) Location of the school and attitude of the students
The results show that teachers working in the country regions of NSW are significantly
less satisfied with the attitude of the students compared to the teachers who work in the
city region (Table 6.58). Throughout the State 58.1 percent of teachers responded that
their satisfaction with attitude of the students was ‘very high’ or ‘moderately high’,
whereas in country areas this response rate was only 48.2 percent. In the inner city/
eastern suburbs of Sydney location 75.6 percent of teachers responded that their
satisfaction with attitude of the students was ‘very high’ or ‘moderately high’. So there
is a significant difference between the locations.
Similarly throughout the State 18.5 percent of teachers responded that their satisfaction
with attitude of the students was ‘very low’ or ‘moderately low’, whereas in country
areas this response rate rose to 29.6 percent. In the inner city/eastern suburbs of Sydney
location only 4.9 percent of teachers responded that their satisfaction with attitude of the
students was ‘very low’ or ‘moderately low’. The positive response in the inner
city/eastern suburbs location could reflect the relatively higher proportion of private
schools and selective schools in these areas, where students tend to achieve more
highly.
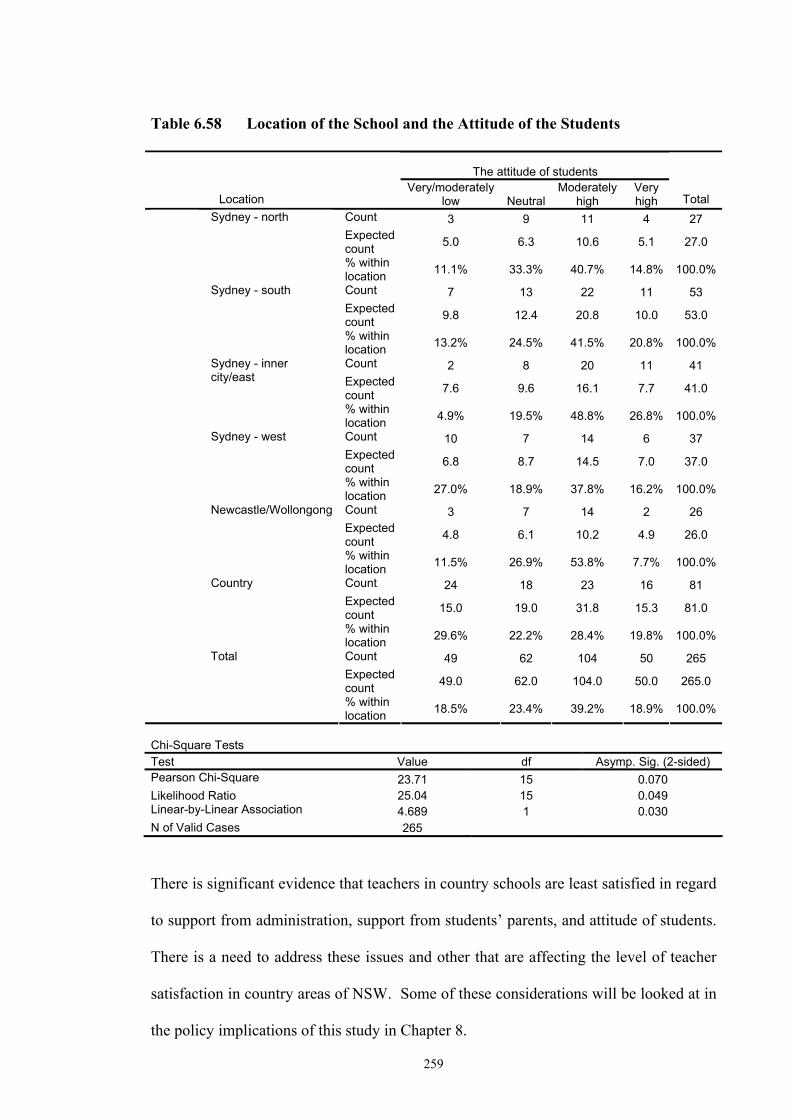
259
Table 6.58 Location of the School and the Attitude of the Students
The attitude of students
Location Very/moderately
low NeutralModerately
high Very high Total
Count 3 9 11 4 27 Expected count 5.0 6.3 10.6 5.1 27.0
Sydney - north
% within location 11.1% 33.3% 40.7% 14.8% 100.0%
Count 7 13 22 11 53 Expected count 9.8 12.4 20.8 10.0 53.0
Sydney - south
% within location 13.2% 24.5% 41.5% 20.8% 100.0%
Count 2 8 20 11 41 Expected count 7.6 9.6 16.1 7.7 41.0
Sydney - inner city/east
% within location 4.9% 19.5% 48.8% 26.8% 100.0%
Count 10 7 14 6 37 Expected count 6.8 8.7 14.5 7.0 37.0
Sydney - west
% within location 27.0% 18.9% 37.8% 16.2% 100.0%
Count 3 7 14 2 26 Expected count 4.8 6.1 10.2 4.9 26.0
Newcastle/Wollongong
% within location 11.5% 26.9% 53.8% 7.7% 100.0%
Count 24 18 23 16 81 Expected count 15.0 19.0 31.8 15.3 81.0
Country
% within location 29.6% 22.2% 28.4% 19.8% 100.0%
Count 49 62 104 50 265 Expected count 49.0 62.0 104.0 50.0 265.0
Total
% within location 18.5% 23.4% 39.2% 18.9% 100.0%
Chi-Square Tests Test Value df Asymp. Sig. (2-sided) Pearson Chi-Square 23.71 15 0.070 Likelihood Ratio 25.04 15 0.049 Linear-by-Linear Association 4.689 1 0.030 N of Valid Cases 265
There is significant evidence that teachers in country schools are least satisfied in regard
to support from administration, support from students’ parents, and attitude of students.
There is a need to address these issues and other that are affecting the level of teacher
satisfaction in country areas of NSW. Some of these considerations will be looked at in
the policy implications of this study in Chapter 8.

260
6.9 A Weighted Satisfaction Score for High School Teachers in NSW
So far the levels of teacher satisfaction in NSW have been measured in comparison to
certain factors that influence the overall level of teacher satisfaction and what factors
are most important to teachers in terms of measuring their levels of satisfaction. From
this information a weighted satisfaction score can be developed. The weighted
satisfaction score is constructed to find out which groups of teachers are the most and
least satisfied and their average level of satisfaction with teaching. The relative
importance of the different factors in measuring satisfaction is important to consider. In
order to increase the overall level of teacher satisfaction it is necessary to consider the
relative importance of different factors to different individuals. The weighted
satisfaction score will be used for descriptive analysis of teacher satisfaction based on
certain teacher and school characteristics. The score will be based on the original
samples with a 1-5 ratings scale with 1, being very low, the minimum score, and 5, very
high, the maximum score.
The rankings of each individual teacher in terms of the importance of the 14 factors
influencing teacher satisfaction in this survey will be multiplied by the actual levels of
satisfaction each teacher reported. The importance of each factor, Ij, is determined by
the individual teacher responses to question 17 in the teacher survey as discussed earlier
in this chapter (Section 6.5). The level of satisfaction reported for each factor, Sj, is
determined by the individual teacher responses to question 18 in the teacher survey as
discussed earlier in this chapter (Section 6.7). A weighted average for each individual,
Siw, is constructed to counteract individual levels of difference in terms of being overly
pessimistic or overly optimistic in their attitudes. This method provides a method that
can be updated over time. It provides a comparable measure of satisfaction even if the

261
factors or relative levels of importance change. Satisfaction is a relative, as well as an
absolute judgment, so it is important to understand how successful school systems, or
individual schools are at satisfying their teachers compared to each other. It is also
important to consider in what ways are some schools better at achieving higher levels of
teacher satisfaction and develop policies that may allow teacher satisfaction to be
increased in other schools.
The formula for an individual’s weighted satisfaction score is:
∑∑==
=m
jijij
m
jij
wi ISIS
11
where i is the individual. The values for i run from 1 the first individual’s survey
responses to n the last individual’s survey responses. The subject j runs from 1 the first
factor to 14 the final factor; hence m = 14.
For example consider two individuals, i =1,2, their responses to three factors are shown
below:
Factor (j) Individual 1 Individual 2
Importance Satisfaction Importance Satisfaction
1 5 2 4 5
2 4 3 4 2
3 3 1 2 1
The weighted satisfaction score for individual 1 would be ∑∑==
=3
1
3
11
jijij
jij
w ISIS
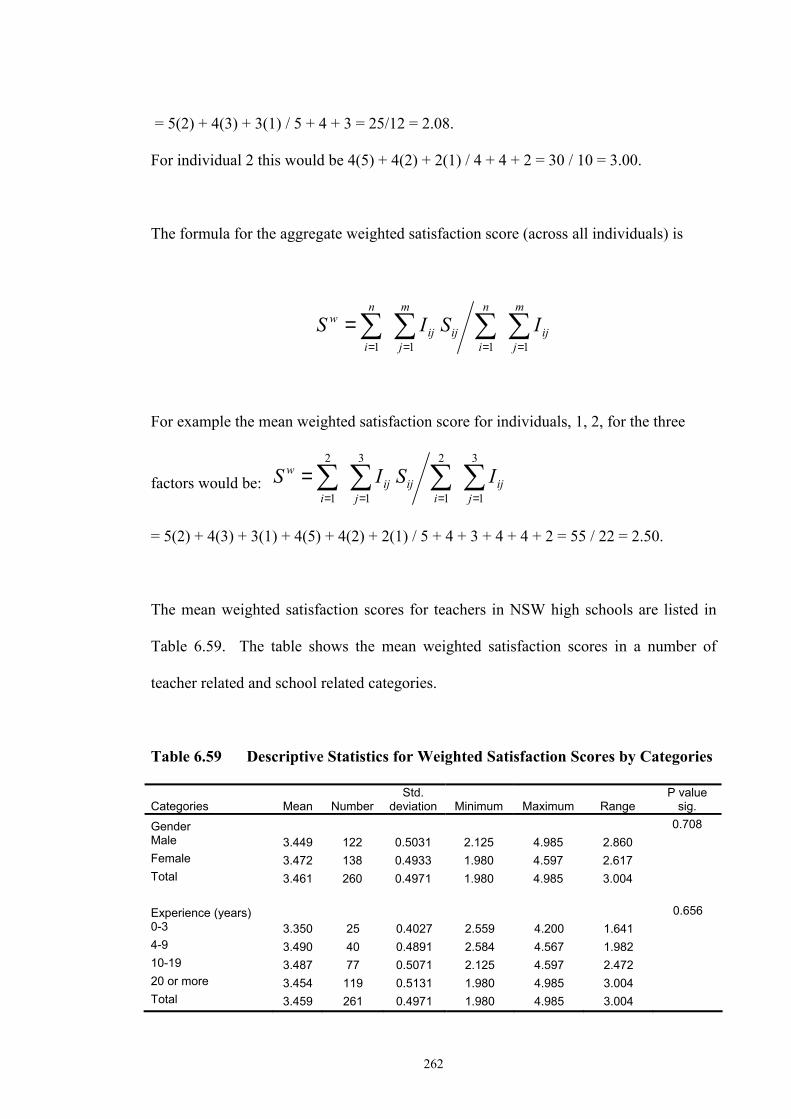
262
= 5(2) + 4(3) + 3(1) / 5 + 4 + 3 = 25/12 = 2.08.
For individual 2 this would be 4(5) + 4(2) + 2(1) / 4 + 4 + 2 = 30 / 10 = 3.00.
The formula for the aggregate weighted satisfaction score (across all individuals) is
∑∑∑∑====
=m
jij
n
iij
m
jij
n
i
w ISIS1111
For example the mean weighted satisfaction score for individuals, 1, 2, for the three
factors would be: ∑∑∑∑====
=3
1
2
1
3
1
2
1 jij
iij
jij
i
w ISIS
= 5(2) + 4(3) + 3(1) + 4(5) + 4(2) + 2(1) / 5 + 4 + 3 + 4 + 4 + 2 = 55 / 22 = 2.50.
The mean weighted satisfaction scores for teachers in NSW high schools are listed in
Table 6.59. The table shows the mean weighted satisfaction scores in a number of
teacher related and school related categories.
Table 6.59 Descriptive Statistics for Weighted Satisfaction Scores by Categories
Categories Mean Number Std.
deviation Minimum Maximum Range P value
sig.
Gender 0.708 Male 3.449 122 0.5031 2.125 4.985 2.860 Female 3.472 138 0.4933 1.980 4.597 2.617 Total 3.461 260 0.4971 1.980 4.985 3.004
Experience (years) 0.656 0-3 3.350 25 0.4027 2.559 4.200 1.641 4-9 3.490 40 0.4891 2.584 4.567 1.982 10-19 3.487 77 0.5071 2.125 4.597 2.472 20 or more 3.454 119 0.5131 1.980 4.985 3.004 Total 3.459 261 0.4971 1.980 4.985 3.004

263
Table 6.59 Descriptive Statistics for Weighted Satisfaction Scores by Categories (continued)
Categories Mean Number Std.
deviation Minimum Maximum Range P value
sig.
Qualification 0.488 Diploma/other 3.365 24 0.3920 2.695 4.000 1.305 Bachelors degree 3.458 194 0.5278 1.980 4.985 3.004 Masters degree or higher 3.518 42 0.4013 2.672 4.299 1.626
Total 3.459 260 0.4980 1.980 4.985 3.004
School type 0.000 Public 3.338 132 0.5121 1.980 4.985 3.004 Catholic systemic 3.538 71 0.4540 2.652 4.597 1.946 Other private 3.640 58 0.4431 2.125 4.566 2.441 Total 3.459 261 0.4971 1.980 4.985 3.004
Location 0.144 Sydney - inner city 3.654 15 0.4853 2.842 4.476 1.634 Sydney - north 3.499 26 0.4796 1.980 4.538 2.558 Sydney - south 3.568 52 0.4734 2.652 4.597 1.946 Sydney - east 3.469 25 0.3779 2.883 4.150 1.267 Sydney - west 3.481 37 0.5514 2.365 4.985 2.620 Newcastle 3.550 5 0.3010 3.250 3.927 0.677 Wollongong 3.415 20 0.4627 2.500 4.250 1.750 Country 3.329 80 0.5304 2.125 4.567 2.442 Total 3.459 260 0.4979 1.980 4.985 3.004 Salary 0.014 Less than $35000 3.417 10 0.3551 2.984 4.036 1.053 $35000-$45000 3.369 42 0.4618 2.500 4.299 1.799 $45000-$55000 3.374 115 0.5320 1.980 4.985 3.004 Over $55000 3.600 92 0.4557 2.632 4.597 1.965 Total 3.457 259 0.4980 1.980 4.985 3.004
Non-English speaking 0.043
Less than 20% 3.394 142 0.5112 1.980 4.985 3.004 20% or more 3.522 111 0.4771 2.365 4.597 2.232 Total 3.450 253 0.4997 1.980 4.985 3.004
Classes taught 0.366 Years 7-10 3.366 40 0.4233 2.672 4.250 1.578 Years 11-12 3.451 40 0.4158 2.500 4.153 1.653 Years 7-12 3.489 176 0.5307 1.980 4.985 3.004 Total 3.464 256 0.4991 1.980 4.985 3.004

264
Table 6.59 Descriptive Statistics for Weighted Satisfaction Scores by Categories (continued)
Categories Mean Number Std.
deviation Minimum Maximum Range P value
sig.
Main teaching field 0.249 English/Drama 3.462 50 0.5360 2.576 4.985 2.409 Mathematics 3.453 34 0.5084 1.980 4.476 2.496 Science 3.445 28 0.5633 2.365 4.597 2.232 Economics/Business Studies 3.640 26 0.4335 2.896 4.525 1.630
Other HSIE 3.495 33 0.5287 2.481 4.299 1.818 Computing 3.220 7 0.4696 2.672 3.817 1.145 Other TAS 3.328 15 0.2882 2.795 3.851 1.056 Art/Music 3.727 13 0.3771 3.151 4.410 1.259 Foreign languages 3.480 8 0.4519 2.827 4.054 1.227 Vocational studies 3.201 3 0.0784 3.154 3.292 0.138 PD/H/PE 3.414 14 0.6251 2.125 4.567 2.442 Religion 4.020 2 0.1891 3.886 4.154 0.267 Special Education/ESL 3.184 5 0.4221 2.559 3.644 1.085
English/other HSIE 3.277 11 0.5436 2.213 4.250 2.037 Other 3.348 11 0.2334 2.933 3.667 0.733 Total 3.461 260 0.4971 1.980 4.985 3.004
A summary for each of the characteristics and categories listed in Table 6.59 shows that
the mean weighted teacher satisfaction scores vary between the factors in the categories.
Overall the weighted mean satisfaction score is approximately 3.46.
The statistical significance of the results was tested by an independent samples t test for
the categories that had only two population means and by ANOVA for those with more
than two population means (Webster 1995). These tests produced the p value
significance statistics in Table 6.59.
The p value statistic shows the smallest level of significance at which the null
hypothesis may be rejected. The null hypothesis, H0 is that the means of the populations
are the same. H1, the alternative hypothesis, states that at least two means differ. We
265
can form our decision rule based on the p values reported in Table 6.59 for a 0.05 level
of significance. It can be stated as follows:
Reject H0 if the calculated p value is less than the significance level 0.05
Do not reject H0 if the calculated p value is greater than the significance level
0.05
A number of the characteristics had significant results. School type, salary, and the
proportion of students from non-English speaking backgrounds had levels of
significance less than 0.05. In these cases we can reject the null hypothesis and
conclude that the means for these characteristics are not equal in their various
categories. For the remaining characteristics we cannot reject the null hypothesis that
the means of the categories are the same.
The results show that for:
(i) Gender of the teacher
Female teachers (3.47) are slightly more satisfied than male teachers (3.45) but the
difference is not statistically significant.
(ii) Experience of the teacher
The least experienced teachers (0-3 years) are the least satisfied teachers (3.35).
Although the difference is not statistically significant, this illustrates the problems faced
by beginning teachers and is reflected in the higher resignation rates for less
experienced teachers. The most satisfied teachers are in the 4-19 years experienced
groups with a score of 3.49. The level of satisfaction declines after 20 years experience

266
(3.45), reflecting the need to develop policies to deal with the lower levels of teacher
satisfaction that occur for the most experienced teachers, as well as the least
experienced teachers (see Chapter 8).
(iii) Academic qualifications of the teacher
The level of teacher satisfaction increases with the level of qualification of the teacher,
although not significantly. The most satisfied teachers have masters degrees or higher
qualifications (3.52), followed by those with bachelors degrees (3.46), and the least
satisfied are teachers with diplomas and other qualifications (3.36). This could in part
reflect the differences in salary or promotion positions that are more likely to occur with
higher qualifications.
(iv) The school system of the teacher
The analysis of variance showed that the satisfaction levels varied significantly, with a
0.000 level of significance. Private school teachers (3.64) were overall the most
satisfied teachers, followed by Catholic teachers (3.54), with public school teachers
(3.34) the least satisfied. While higher wages may favour teachers in the private system
over the other two systems in terms of satisfaction, this does not explain the difference
between Catholic and public school teachers. Again differences in the quality of
students going to selective private schools may be a factor favouring higher levels of
satisfaction in private schools; this may not contribute greatly to the differences in
satisfaction levels for teachers in local public schools and local Catholic schools. There

267
must be other factors that are impacting on the levels of satisfaction. These will also be
explored in the possible policy responses in Chapter 8.
(v) Location of the school of the teacher
The most satisfied teachers were those working in the inner city of Sydney (3.65) and
the least satisfied were teachers working in the country region of NSW (3.32), although
the differences were not statistically significant. This again highlights the lower levels
of satisfaction felt by country teachers as discussed earlier in this chapter in regard to
particular factors affecting teacher satisfaction. Policies to deal with this issue will be
discussed in Chapter 8.
(vi) Salary of the teacher
The analysis of variance showed that the result for the category salary of teacher was
significant with a 0.014 level of significance. Teachers on the highest salaries, over
$55,000, were the most satisfied (3.60). While this might be expected it is important to
note that at the time of the study, the only teachers who were paid salaries in excess of
$55,000 would have been in promotion positions in the public and Catholic school
systems or teachers in private schools who were paid more than the State award. It
could be argued that teachers in promotion positions have more say and more control
over their working environment and these factors may increase their overall levels of
satisfaction.
268
(vii) Teachers in schools with differing levels of non-English speaking backgrounds
of students
The independent samples test showed that satisfaction varied significantly based on the
non-English speaking background of students with a 0.043 level of significance. It is
interesting to note that teachers in schools where more than 20 percent of the student
population came from non–English speaking backgrounds had higher levels of
satisfaction (3.52) than teachers in schools with a less than 20 percent ratio (3.39). This
suggests that having a school with students from a diverse cultural background may
actually be more satisfying to teachers than a narrower cultural background. This result
differs from studies in the USA (National Center for Education Statistics 1997) where
having a higher proportion of students from non-English speaking backgrounds was
associated with lower levels of teacher satisfaction in high schools.
(viii) Years of classes taught by the teacher
The most satisfied teachers, although not statistically significant, are those who teach
the full range of classes in high schools from years 7-12 (3.49). Those teachers with
lowest levels of satisfaction only teach classes in the year 7-10 range (3.37). This
restriction in classes to 7-10 may cause lower teacher satisfaction, as they are not given
the opportunity to teacher higher levels. The middle score (3.45) for teachers’ only
teaching years 11-12 could reflect the higher workload or pressure associated with the
Higher School Certificate.

269
(ix) Main teaching field of the teacher
There are small and statistically insignificant differences in the level of satisfaction
between teachers teaching in different subject areas. Allowing for a minimum sample
group size of 20, teachers of Economics and Business Studies (3.64) are the most
satisfied, followed by other Human Society and Environment (HSIE) teachers (3.50),
English/Drama teachers (3.46) and Mathematics teachers (3.45). The least satisfied
teachers are those teaching Computing and other Technical and Applied Studies (TAS)
subjects (3.29). The low level of satisfaction of TAS teachers is a concern as this is one
of the main key learning areas where there are reported teacher shortages in NSW.
NSW DET Accelerated Teacher Training Program may have limited effect in
alleviating the shortages, if lower levels of teacher satisfaction lead to lower retention
rates of TAS teachers.
6.10 A Regression Model of Teacher Satisfaction
A model of high school teacher satisfaction will be estimated using a multiple
regression equation. It is initially assumed that the weighted teacher satisfaction score
(as discussed in section 6.9) is a function of fourteen independent variables. Thus the
model is represented by the following equation:
Sw = β0 + β1W + β2 J+ β3 L + β4 H + β5 T + β6 A + β7P + β8 U + β9 R + β10 M + β11G +
β12F + β13 I + β14 K + e (6.1)

270
where Sw is the dependent variable, the weighted teacher satisfaction score. The
independent variables are:
• level of salary, W;
• job security, J;
• a low level of stress, L;
• number of holidays, H;
• hours of work, T;
• support and encouragement from administration, A;
• the attitude and support of peers, P;
• the attitude and support of students, U;
• the satisfaction of student achievement, R;
• the support of the students’ parents, M;
• attitude of the general public towards teachers, G;
• the support of your family, F;
• interest in the subjects taught, I;
• the possibility of promotion, K.
β0...β14 are the coefficients and e is the random error term. It is important to note that the
independent variables may actually be functions of other variables and will require
testing to verify or dismiss these possible relationships.
The data were processed through SPSS statistical analysis and data management system.
Table 6.60 displays the coefficients of the variables and the least square estimates of the
coefficients of the variables. In the column under the heading ‘B’. The standard errors
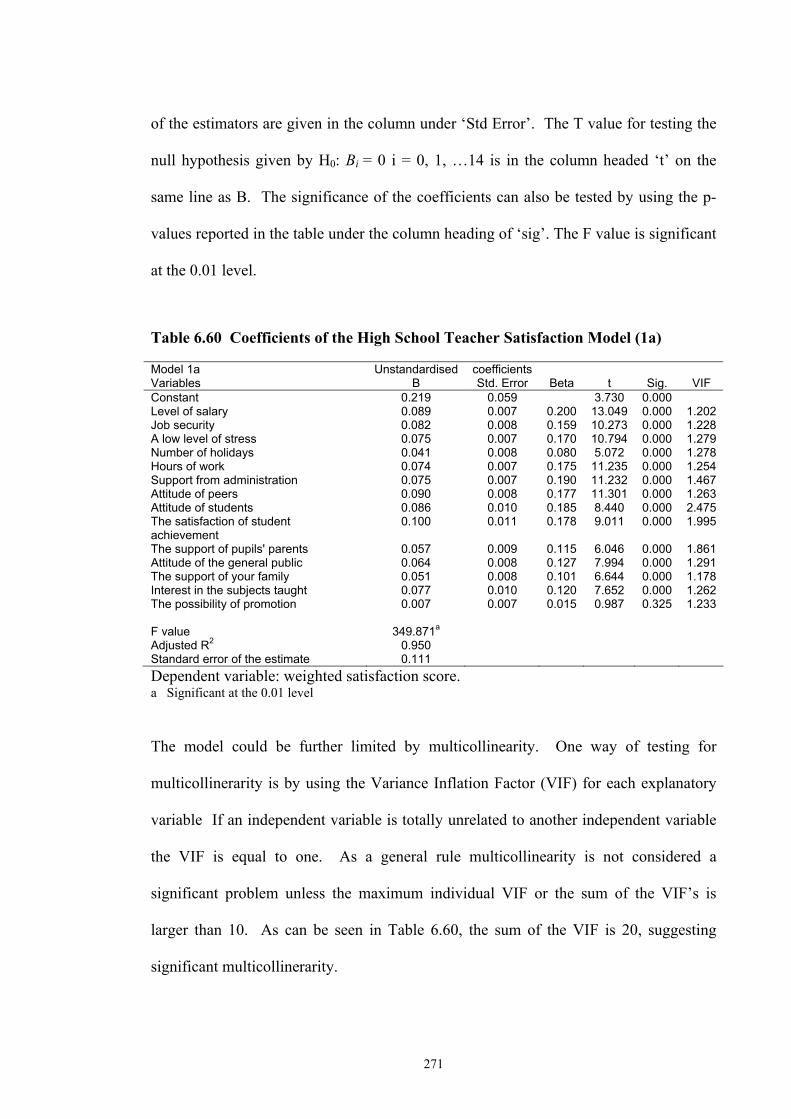
271
of the estimators are given in the column under ‘Std Error’. The T value for testing the
null hypothesis given by H0: Bi = 0 i = 0, 1, …14 is in the column headed ‘t’ on the
same line as B. The significance of the coefficients can also be tested by using the p-
values reported in the table under the column heading of ‘sig’. The F value is significant
at the 0.01 level.
Table 6.60 Coefficients of the High School Teacher Satisfaction Model (1a) Model 1a Unstandardised coefficients Variables B Std. Error Beta t Sig. VIF Constant 0.219 0.059 3.730 0.000 Level of salary 0.089 0.007 0.200 13.049 0.000 1.202 Job security 0.082 0.008 0.159 10.273 0.000 1.228 A low level of stress 0.075 0.007 0.170 10.794 0.000 1.279 Number of holidays 0.041 0.008 0.080 5.072 0.000 1.278 Hours of work 0.074 0.007 0.175 11.235 0.000 1.254 Support from administration 0.075 0.007 0.190 11.232 0.000 1.467 Attitude of peers 0.090 0.008 0.177 11.301 0.000 1.263 Attitude of students 0.086 0.010 0.185 8.440 0.000 2.475 The satisfaction of student achievement
0.100 0.011 0.178 9.011 0.000 1.995
The support of pupils' parents 0.057 0.009 0.115 6.046 0.000 1.861 Attitude of the general public 0.064 0.008 0.127 7.994 0.000 1.291 The support of your family 0.051 0.008 0.101 6.644 0.000 1.178 Interest in the subjects taught 0.077 0.010 0.120 7.652 0.000 1.262 The possibility of promotion 0.007 0.007 0.015 0.987 0.325 1.233 F value 349.871a Adjusted R2 0.950 Standard error of the estimate 0.111 Dependent variable: weighted satisfaction score. a Significant at the 0.01 level
The model could be further limited by multicollinearity. One way of testing for
multicollinerarity is by using the Variance Inflation Factor (VIF) for each explanatory
variable If an independent variable is totally unrelated to another independent variable
the VIF is equal to one. As a general rule multicollinearity is not considered a
significant problem unless the maximum individual VIF or the sum of the VIF’s is
larger than 10. As can be seen in Table 6.60, the sum of the VIF is 20, suggesting
significant multicollinerarity.

272
In attempt to improve the validity of the model by reducing multicollinearity the least
useful independent variables were dropped. The value of the F-statistic for each
independent variable remaining in the model decides which variable to eliminate. The
model was improved by dropping all the independent variables except the attitude of
students, support for administration, level of salary, hours of work and the attitude of
peers. Table 6.61 shows model 1b with the new coefficients and regression statistics
after the elimination of the least useful variables. The total VIF has been reduced to less
than six and all variables have a VIF close to one. The adjusted R square is 0.798
showing that these five variables have considerable explanatory value.
Table 6.61 Coefficients of the High School Teacher Model (1b)
Model 1b Unstandardised coefficients Variables B Std. Error Beta t Sig. VIF Constant 1.328 0.073 18.261 0.000 Attitude of students
0.214 0.014 0.460 15.148 0.000 1.176
Support from administration
0.109 0.013 0.276 8.706 0.000 1.285
Level of salary 0.121 0.013 0.272 9.453 0.000 1.054 Hours of work 0.100 0.012 0.238 8.197 0.000 1.075 Attitude of peers 0.112 0.016 0.220 7.191 0.000 1.197 F value 204.642a Adjusted R2 0.798 Standard error of the estimate
0.224
Dependent variable: weighted satisfaction score. a Significant at the 0.01 level.
The estimated regression equation is:
Sw = 1.328 + 0.214 U + 0.109 A + 0.121 W + 0.100 H + 0.112 P (6.2)
(0.073) (0.014) (0.013) (0.013) (0.012) (0.016)
This equation shows the influence of the variables in regards to the level of teacher
satisfaction. The model shows that improvements in the attitude of students, support
from administration, levels of salary, hours of work and attitudes of peers are positively
273
and statistically significantly related to teacher satisfaction. In this model the attitude of
students has the biggest influence (0.214) on the level of teacher satisfaction. Overall
these five variables explain 80 percent of the variation in the level of teacher
satisfaction.
6.11 Conclusion
This chapter has shown the relative importance of wages and other factors in the
satisfaction of teachers in NSW high schools, based on surveys of those teachers. There
were considerable variations in the level of satisfaction of teachers in regard to those
factors. The importance of wages in measuring the level of teacher satisfaction was
only seen as an average factor among the 14 considered. Interest in the subjects taught,
the satisfaction of student achievement, the attitude of peers, the attitude of students, job
security, and support from administration were all seen as being more important to the
teachers in measuring their level of satisfaction.
The levels of job satisfaction and what factors were most important to them in
measuring job satisfaction also varied with the characteristics of the teachers and the
schools. The most significant differences occurred in regard to aspects such as:
• the gender of the teacher;
• the type of school system;
• the location of the school, especially in respect to country teachers; and
• the age and experience of the teacher.

274
The significant levels of differences in satisfaction between factors and between
characteristics of teachers and schools provide information that could be used by school
authorities to develop policies that could increase the level of teacher satisfaction and as
a result the quality and or quantity of teaching that takes place in NSW high schools.
This should also improve the education outcomes for students. These policy
implications will be examined in Chapter 8.
The results of this chapter provide an insight for improving the level of satisfaction
amongst teachers who are teaching in NSW high schools. The next chapter will
examine the factors that influence university students (potential future teachers) in
deciding whether to become teachers and to enter the high school teacher labour market
in NSW.
275
Chapter 7. What Factors Influence the Decisions of University
Students to Become Teachers?
7.1 Introduction
As discussed in Chapter 4, the main source of new teachers into the high school teacher
labour market in NSW is new university graduates. The problem facing education
authorities is that from 1983 to 2000 the proportion of higher education students
studying Education declined from 21.3 percent to 10.6 percent. Across Australia the
actual number of Education students fell from 74,314 in 1983 to 73,680 in 2000. While
the number of female students studying Education increased over the period by 13.8
percent, the number of male students declined by 28.8 percent (Department of
Education Science and Training 2003). There are a number of issues to be considered.
First, what can be done to increase the overall level of university graduates entering
teaching? Second, are there different factors that influence the decisions of male and
female university graduates to enter the teacher labour market? Third, what factors
influence the decisions of students to pursue careers in teaching compared to other
careers? Finally, what perceptions do students have of a career as a teacher?
7.2 Surveys of University Students
Two surveys were conducted to investigate the factors that influence first and third/final
year university students in pursing careers especially in relation to high school teaching.
The first year students were selected as they had recently made a decision to go to
university and had selected their course of study. In some cases this decision would still
make it possible for them to follow a teaching career, in other cases it would be much

276
more difficult, such as for those who selected nursing courses. Surveys of the third/final
year students were conducted, as this group was about to make their actual choices in
entering the workforce. They were also surveyed to see if their attitudes to entering the
teaching profession had changed while they were at university.
7.3 Methodology of the Study
The aim of the study was to survey university students in NSW to determine their
attitudes towards pursuing a career as a teacher and the importance of various factors in
making their career choices. The differences in factors and the relative level of
importance of those factors that influence students career choices are an important
consideration for administrators of school systems and schools in attempting to attract
new graduates into teaching. Requests were made to all universities in NSW to
participate in this study. The Deans of the faculties of Education, Arts, Sciences, and
Commerce/Economics57 were asked for permission to survey 30-40 first and third/final
year students at random, and for permission to ask the students, if they would be willing
to participate in the study. The number of students per faculty was selected to gain a
diverse sample of views on the issues to be surveyed and to provide information that
would be representative of the different students and the different geographical regions
of NSW. Individual participation in the surveys, by the students, was voluntary and
anonymous. The conduct of the survey involved a lecturer receiving 30-40 surveys in
individual envelopes with an information sheet, a survey and a reply paid envelope.
The students were asked to collect an envelope, if they wanted to participate in the
study. At some universities the students filled the surveys out in a lecture/tutorial and
these were returned to the lecturer. Six universities agreed to participate in the study.
57 These four faculties were chosen, as they were the ones most likely to generate entrants and graduates who potentially would be most likely to become high school teachers.
277
These included city and regional universities in NSW. Altogether a sample of 201 first
year students and 209 third/final year students were surveyed in this study. The time
frame for completion of the surveys ranged from the second half of 2002 to the first half
of 2003.
Overall I believe that the sample is valid. Students have volunteered to participate
across a range of tertiary institutions, faculties and locations. The range of gender, ages,
and courses studied provides a diverse sample and generally the sample numbers in
various categories do allow for a testing of the validity of the results.
The university student surveys designed for this study (Appendix C) classified students
based on:
• current year of university study;
• gender;
• age;
• University Admission Index and other forms of entry;
• area of academic qualifications of current course;
• place of residence;
• type of school attended; and
• their intention to become teachers.
The students were asked to rate, on a 1-5 scale, the importance of the following factors58
in their choosing a career. Those factors were:
• level of salary;
58 The factors were based on the results of surveys of teachers in Chapter 6, along with studies by Dinham and Scott (1997) and in the USA by National Center for Education Statistics (1997). Some adjustments have been made to make the factors more generic for some other occupations.

278
• job security;
• a low level of stress;
• number of holidays;
• hours of work;
• the attitude and support of peers and friends;
• the attitude and support of the employer;
• attitude of the general public towards your career;
• the support of your family;
• interest in the work you do;
• job satisfaction;
• the possibility of promotion;
• desire to help others.
The students were also asked how they would rate the employment conditions for
teachers in NSW high schools on a 1-5 scale.
The students were also asked questions relating to:
• How certain factors influenced their decision to become a teacher?
• Whether higher teachers’ salaries would increase their likelihood to become
teachers and the required amount?
• If they became teachers, in what school system would they like to teach?
The final year students were also asked, if their attitude to becoming a teacher had
changed while at university. If so, they were asked in what ways and what factors had
caused a change in their attitude?

279
7.4 A Description of the Sample
The survey provided data on 410 respondents, comprising 201 first year students (49.0
percent), and 209 third/final year students (51.0 percent) (Table 7.1). The gender
balance was made up of 127 (40.2 percent) males and 141 (59.8 percent) females (Table
7.2). The highest percentage of students (46.3) was in the age group under 21 years,
followed closely by the 21-29 age group (42.2). There were less than three percent of
students over forty years of age (Table 7.3).
Table 7.1 Year of Study at University
Year Frequency Percent Valid percent Cumulative percent1st year 201 49.0 49.0 49.0 3rd Year 209 51.0 51.0 100.0
Valid
Total 410 100.0 100.0
Table 7.2 Gender of Students
Gender Frequency Percent Valid
percent Cumulative
percent
Actual percentage of higher education
students59 Valid Male 164 40.0 40.2 40.2 44.1 Female 244 59.5 59.8 100.0 54.9 Total 408 99.5 100.0 Missing System 2 0.5 Total 410 100.0
Table 7.3 Age Distribution of Students
Age Frequency Percent Valid percent Cumulative
percent Under 21 189 46.1 46.3 46.3 21-29 173 42.2 42.4 88.7 30-39 34 8.3 8.3 97.1 40-49 9 2.2 2.2 99.3 Over 49 3 0.7 0.7 100.0
Valid
Total 408 99.5 100.0 Missing System 2 0.5 Total 410 100.0
59 Australian Bureau of Statistics, 2001 Census (2003c).

280
The sample group demonstrated a range of university admission types. The majority
(80 percent) relied on the University Admission Index (UAI) although it is likely that at
least some of the students with UAI’s less than 50 would have relied on other forms of
entry such as TAFE or work experience to assist their entry. Twelve point nine percent
of all respondents had UAI’s in the top decile of 90–100, while a further 21.0 percent
had UAI’s ranging between 80-89 (Table 7.4). There was a spread of students residing
throughout locations in NSW with 76.9 percent living in Sydney and 23.1 percent in the
country and regional areas of Newcastle and Wollongong (Table 7.5).
Table 7.4 University Admission Index
UAI Frequency Percent Valid percent Cumulative
percent Under 40 26 6.3 6.9 6.9 40-49 2 0.5 0.5 7.5 50-59 10 2.4 2.7 10.1 60-69 41 10.0 10.9 21.1 70-79 111 27.1 29.6 50.7 80-89 86 21.0 22.9 73.6 90-100 53 12.9 14.1 87.7 Other 46 11.2 12.3 100.0
Valid
Total 375 91.5 100.0 Missing System 35 8.5 Total 410 100.0
Table 7.5 Residential Distribution
Residence Frequency Percent Valid percent Cumulative
percent Sydney - inner city 39 9.5 9.7 9.7
Sydney - north 85 20.7 21.1 30.8 Sydney - south 34 8.3 8.5 39.3 Sydney - east 31 7.6 7.7 47.0 Sydney - west 120 29.3 29.9 76.9 Newcastle 25 6.1 6.2 83.1 Wollongong 62 15.1 15.4 98.5 Country 6 1.5 1.5 100.0
Valid
Total 402 98.0 100.0 Missing System 8 2.0 Total 410 100.0
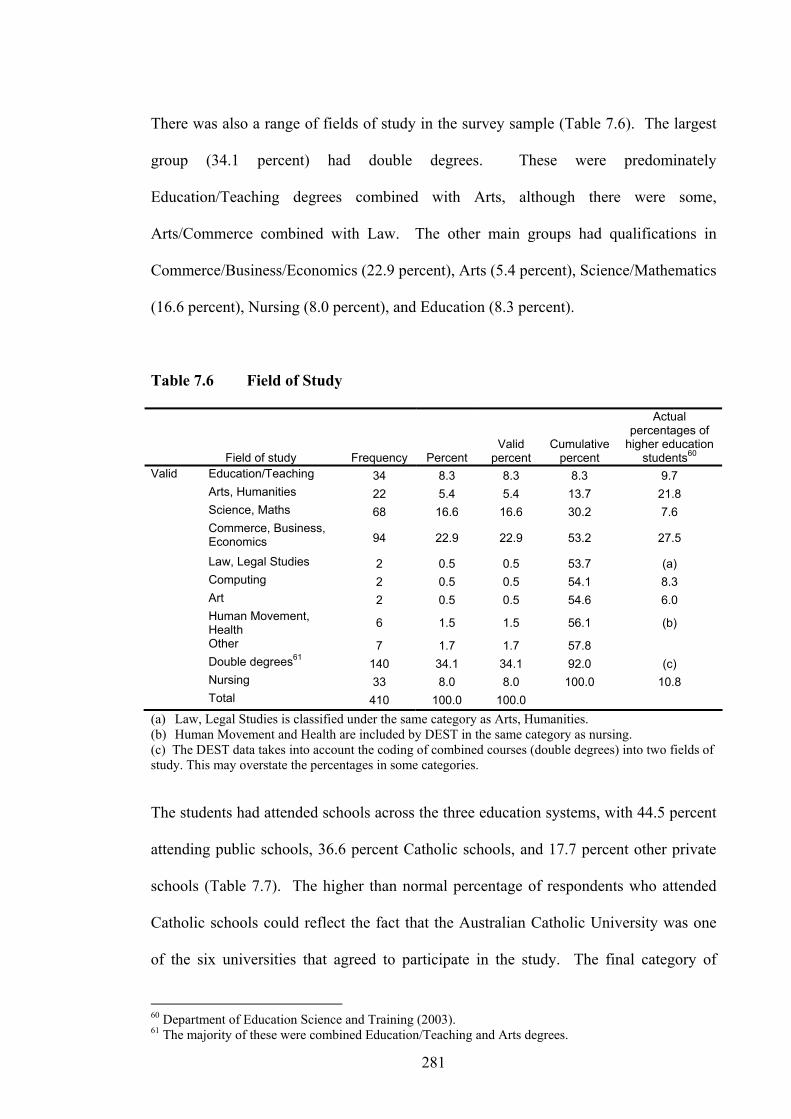
281
There was also a range of fields of study in the survey sample (Table 7.6). The largest
group (34.1 percent) had double degrees. These were predominately
Education/Teaching degrees combined with Arts, although there were some,
Arts/Commerce combined with Law. The other main groups had qualifications in
Commerce/Business/Economics (22.9 percent), Arts (5.4 percent), Science/Mathematics
(16.6 percent), Nursing (8.0 percent), and Education (8.3 percent).
Table 7.6 Field of Study
Field of study Frequency Percent Valid
percent Cumulative
percent
Actual percentages of
higher education students60
Valid Education/Teaching 34 8.3 8.3 8.3 9.7 Arts, Humanities 22 5.4 5.4 13.7 21.8 Science, Maths 68 16.6 16.6 30.2 7.6 Commerce, Business,
Economics 94 22.9 22.9 53.2 27.5
Law, Legal Studies 2 0.5 0.5 53.7 (a) Computing 2 0.5 0.5 54.1 8.3 Art 2 0.5 0.5 54.6 6.0 Human Movement,
Health 6 1.5 1.5 56.1 (b)
Other 7 1.7 1.7 57.8 Double degrees61 140 34.1 34.1 92.0 (c) Nursing 33 8.0 8.0 100.0 10.8 Total 410 100.0 100.0 (a) Law, Legal Studies is classified under the same category as Arts, Humanities. (b) Human Movement and Health are included by DEST in the same category as nursing. (c) The DEST data takes into account the coding of combined courses (double degrees) into two fields of study. This may overstate the percentages in some categories.
The students had attended schools across the three education systems, with 44.5 percent
attending public schools, 36.6 percent Catholic schools, and 17.7 percent other private
schools (Table 7.7). The higher than normal percentage of respondents who attended
Catholic schools could reflect the fact that the Australian Catholic University was one
of the six universities that agreed to participate in the study. The final category of
60 Department of Education Science and Training (2003). 61 The majority of these were combined Education/Teaching and Arts degrees.

282
classification related to the respondents intentions to pursue a career as a teacher.
Thirty two point four percent of those surveyed responded ‘yes’, 46.3 percent responded
‘no’, while a further 20.2 percent were ‘unsure’ (Table 7.8).
Table 7.7 Type of School Attended
Type of School Frequency Percent Valid percent Cumulative
percent Public 179 43.7 44.5 44.5 Catholic systemic 147 35.9 36.6 81.1
Other private 71 17.3 17.7 98.8 More than 1 5 1.2 1.2 100.0
Valid
Total 402 98.0 100.0 Missing System 8 2.0 Total 410 100.0
Table 7.8 Student Intentions about Pursuing a Teaching Career
Teaching career Frequency Percent Valid percent Cumulative
percent Yes 130 31.7 32.4 32.4 No 190 46.3 47.4 79.8 Unsure 81 19.8 20.2 100.0
Valid
Total 401 97.8 100.0 Missing System 9 2.2 Total 410 100.0
7.5 A Regression Model Of The Factors Influencing University Students’
Intentions To Pursue Careers As Teachers
A model of university students’ intentions to teach will be estimated using a multiple
regression equation. It is initially assumed that the intentions of university students to
teach is a function of thirteen independent variables. Thus the model is represented by
the following equation:

283
Ti = β0 + β1W + β2 J+ β3 L + β4 H + β5 B + β6 P + β7 E + β8 M + β9 G + β10 F + β11 I +
β12 K+ β13 D + e (7.1)
where Ti is the dependent variable, the university students’ intentions to teach. The
independent variables are:
• level of salary, W;
• job security, J;
• a low level of stress, L;
• number of holidays, H;
• hours of work, B;
• the attitude and support of peers, P;
• the attitude of the employer, E;
• attitude of the general public, G;
• the support of your family, F;
• interest in the work you do, I;
• job satisfaction, S;
• the possibility of promotion, K;
• the desire to help others, D.
β0...β13 are the coefficients and e is the random error term. It is important to note that the
independent variables may actually be functions of other variables and will require
testing to verify or dismiss these possible relationships.

284
The data were processed through SPSS statistical analysis and data management system.
Table 7.9 displays the coefficients of the variables and the least square estimates of the
coefficients of the variables in the column under the heading ‘B’. The standard errors of
the estimators are given in the column under ‘Std Error’. The T value for testing the
null hypothesis given by H0: Bi = 0 i = 0, 1, …13 is in the column headed ‘t’ on the
same line as B. The significance of the coefficients can also be tested by using the p-
values reported in the table under the column heading of ‘sig’.
The model could be further limited by multicollinearity. 0ne way of testing for
multicollinerarity is by using the Variance Inflation Factor (VIF) for each explanatory
variable If an independent variable is totally unrelated to another independent variable
the VIF is equal to one. As a general rule multicollinearity is not considered a
significant problem unless the maximum individual VIF or the sum of the VIF’s is
larger than 10. As can be seen in Table 7.9, the sum of the VIF is 20, suggesting
significant multicollinerarity.
In attempt to improve the validity of the model by reducing multicollinearity the least
useful independent variables were dropped. The value of the F-statistic for each
independent variable remaining in the model decides which variable to eliminate. The
model was improved by dropping all the independent variables except support for level
of salary, job security, low level of stress, number of holidays, hours of work and desire
to help others. This produced the model (1b) with the highest adjusted R square value.
The total VIF has been reduced to 7.8 and all variables have a VIF closer to one. Table
7.10 shows the new coefficients and regression statistics after the elimination of these
least useful variables.

285
Table 7.9 Coefficients of the University Students’ Intentions to Teach Model (1a) Model 1a Unstandardised coefficients Variables B Std. Error Beta t Sig. VIF Constant 2.211 0.384 5.762 0.000 Level of salary
0.057 0.051 0.067 1.129 0.260 1.329
Job security -0.107 0.053 -0.121 -2.002 0.046 1.373 A low level of stress
0.111 0.044 0.157 2.522 0.012 1.449
Number of holidays
-0.043 0.046 -0.060 -0.930 0.353 1.548
Hours of work
-0.052 0.050 -0.066 -1.029 0.304 1.567
Attitude of peers and friends
0.008 0.049 0.011 0.156 0.876 1.896
The attitude and support of employer
0.030 0.060 0.036 0.503 0.616 1.933
Attitude of the general public
-0.020 0.037 -0.033 -0.550 0.583 1.372
The support of your family
0.044 0.045 0.059 0.981 0.327 1.336
Interest in the work you do
-0.071 0.082 -0.060 -0.867 0.387 1.808
Job satisfaction
0.034 0.078 0.032 0.440 0.660 1.930
Possibility of promotion
0.037 0.045 .0048 0.823 0.411 1.299
Desire to help others
-0.109 0.044 -0.156 -2.485 0.013 1.489
F value 1.964a Adjusted R2 0.033 Standard error of the estimate
0.714
Dependent variable: intention to teach. a Significant at the 0.05 level.
The estimated regression equation is:
Ti = 2.252 + 0.074 W – 0.087 J + 0.177 L - 0.049 H - 0.053 B - 0.095 D (7.2)
(0.278) (0.047) (0.050) (0.043) (0.044) (0.049) (0.038)
This equation shows the influence of the variables in regards to the intentions of
university students to pursue careers in teaching. The results suggest that higher wages
and a lower level of stress would increase the likelihood of pursuing a career as a

286
teacher. The intention to teach is reduced by job security, number of holidays, hours of
work and the desire to help others.
Table 7.10 Coefficients of the University Students’ Intentions to Teach (1b)
Model 1b Unstandardised coefficients Variables B Std. Error Beta t Sig. VIF Constant 2.252 0.278 8.109 0.000 Level of salary
0.074 0.047 0.087 1.568 0.118 1.162
Job security -0.087 0.050 -0.099 -1.734 0.084 1.234 A low level of stress
0.117 0.043 0.165 2.734 0.007 1.377
Number of holidays
-0.049 0.044 -0.069 -1.117 0.265 1.439
Hours of work -0.053 0.049 -0.069 -1.097 0.273 1.495 Desire to help others
-0.095 0.038 -0.137 -2.523 0.012 1.119
F value 3.824a Adjusted R2 0.045 Standard error of the estimate
0.710
Dependent variable: intention to teach. a Significant at the 0.01 level.
Overall the model only explains 4.5 percent of the variation in the decisions of
university students when they consider their intentions to teach.
7.6 How Would Higher Teacher Salaries Affect Students’ Career Choices?
There were two questions in the survey that looked at the issue of whether students
would become teachers, if teachers’ salaries were higher (Q.11), and what level of
salary increase would be required for a student to decide to become a high school
teacher (Q.12). The real issue in looking at the responses is whether the students, who
had said that they would not become teachers or were unsure about becoming teachers
(Q9), would become teachers due to a salary increase and what level of salary increase
would be required to achieve this.

287
The results showed that a salary increase of 10 percent would lead to 7.6 percent of
those who did not plan to become high school teachers to plan to become teachers
(Table 7.11). In addition 15.4 percent of those students who responded that they were
unsure would also plan to become high school teachers.
It is also interesting to note that the third/final year students had a stronger response to
the higher salaries in favouring a move to teaching than the first year students. While it
could be argued that responding to the survey is different from making a career change
in real life, it is still very likely that higher relative salaries would attract university
students away from other career choices to become high school teachers.
Table 7.11 Student Intentions towards Pursuing a Teaching Career and Teachers’ Salaries Pursue a career in teaching? Year of study Salary increase Total
10% 20% 40% 60%
More than 60%
No 1st year Count 3 11 19 10 14 57 % within year of
study 5.3% 19.3% 33.3% 17.5% 24.6% 100.0%
3rd Year Count 5 12 17 8 6 48 % within year of
study 10.4% 25.0% 35.4% 16.7% 12.5% 100.0%
Total Count 8 23 36 18 20 105 % within year of
study 7.6% 21.9% 34.3% 17.1% 19.0% 100.0%
Unsure 1st year Count 5 15 13 4 4 41 % within Year of
study 12.2% 36.6% 31.7% 9.8% 9.8% 100.0%
3rd Year Count 5 11 4 2 2 24 % within year of
study 20.8% 45.8% 16.7% 8.3% 8.3% 100.0%
Total Count 10 26 17 6 6 65 % within year of
study 15.4% 40.0% 26.2% 9.2% 9.2% 100.0%

288
Chi-Square Tests
Pursue a career in teaching Tests Value df
Asymp. Sig. (2-sided)
No Pearson Chi-Square 3.330 4 0.504 Likelihood Ratio 3.402 4 0.493 Linear-by-Linear Association 3.047 1 0.081
N of Valid Cases 105 Unsure Pearson Chi-Square 2.434 4 0.657
Likelihood Ratio 2.496 4 0.645 Linear-by-Linear Association 1.094 1 0.295
N of Valid Cases 65
The Chi-square test results show that the effect of a salary increase on the intention to
pursue a career in teaching is independent of the year group that was surveyed in all
categories of response.
7.7 What Factors Influence the Career Choices of University Students?
The university students were asked to rate, on a 1-5 scale, the importance of 13 factors
in determining their decisions to pursue a particular career. The 1-5 ratings scale was:
5 -very important;
4 -some importance;
3 - neutral;
2 - little importance;
1 - very unimportant.
While all of the factors listed were of some importance to the students, the most
important factors in determining their decisions to pursue a particular career (Table
7.12), based on the mean scores, were:
• interest in the work (4.67);
• job satisfaction (4.59);
289
• job security (4.21);
• the attitude and support of the employer (4.20);
• desire to help others (4.04);
• level of salary (3.96);
• the support of their family (3.95); and
• the possibility of promotion (3.90).
The least important factors for students in deciding to pursue a particular career were:
• the attitude of the general public (3.13);
• number of holidays (3.34);
• hours of work (3.54); and
• a low level of stress (3.58).

290
Statistics
Level of
salary
Job security
A low level of stress
Number of
holidays
Hours of
work
The attitude of peers
and friends
The attitude
and support of employer
The attitude of the
general public
The support of your family
Interest in the
work you do
Job satisfaction
The possibility
of promotion
Desire to help others
Valid 400 391 385 380 386 381 385 379 383 394 395 381 381 N Missing 10 19 25 30 24 29 25 31 27 16 15 29 29
Mean 3.96 4.21 3.58 3.34 3.52 3.74 4.20 3.13 3.95 4.67 4.59 3.90 4.04 Median 4.00 4.00 4.00 3.00 4.00 4.00 4.00 3.00 4.00 5.00 5.00 4.00 4.00 Std. deviation 0.877 0.912 1.043 1.024 0.973 1.057 0.897 1.195 0.992 0.683 0.858 1.061 1.046 Skewness -1.076 -1.258 -0.475 -0.080 -0.401 -0.572 -0.986 -0.187 -0.676 -2.562 -0.916 0.661 -1.045 Std. error of skewness 0.122 0.123 0.124 0.125 0.124 0.125 0.124 0.125 0.125 0.123 0.123 0.125 0.125
Kurtosis 1.872 1.586 -0.182 -0.561 -0.107 -0.370 0.399 -0.843 -0.231 7.751 12.415 8.148 0.624 Std. error of kurtosis 0.243 0.246 0.248 0.250 0.248 0.249 0.248 0.250 0.249 0.245 0.245 0.249 0.249
Table 7.12 The Importance of Factors in Students’ Decisions to Pursue Particular Careers

291
7.8 Factors Influencing the Career Choices of University Students Regarding
Teaching
It is most likely that the relative importance of the factors that influence a person in their
career choice will vary from person to person. It is important to consider, if there are
differences in the relative importance of these factors, between those who intend to
pursue a career as a teacher and those who are unsure or do not intend to pursue
teaching as a career.
The results in Table 7.13 show that there were considerable differences in the
importance of some factors between those who intended to pursue a career as a teacher
and those who were unsure or did not intend to pursue teaching as a career.
Table 7.13 Factors Influencing Career Choice and Intention to Teach Summary
Table
Factors Chi-
square dfa
Asymp. Sig. (2-sided)
Intend to teach
(mean)
Do not intend to
teach (mean)
Intention unsure (mean)
Level of salary 10.63 6 0.100 3.84 4.07 3.88 Job security 6.973 6 0.323 4.36 4.18 4.08 A low level of stress 6.429 8 0.599 3.51 3.57 3.77 Number of holidays 15.27 8 0.054 3.54 3.16 3.46 Hours of work 6.568 8 0.584 3.63 3.50 3.44 The attitude of peers and friends 3.176 8 0.919 3.81 3.70 3.74
The attitude of employer 4.294 8 0.830 4.26 4.16 4.17 The attitude of the general public 28.43 8 0.000 3.30 2.95 3.21
The support of your family 6.802 8 0.558 4.03 3.88 4.01 Interest in the work you do 7.925 4 0.094 4.80 4.61 4.58 Job satisfaction 8.740 8 0.365 4.69 4.57 4.46 The possibility of promotion 10.60 8 0.225 3.75 4.06 3.79
Desire to help others 30.16 8 0.000 4.39 3.82 3.95
(a) The degrees of freedom have been adjusted where necessary to ensure the accuracy of the results.

292
There were highly significant differences in the importance of factors in making career
choices between the three categories of students in regard to two factors that had
Pearson Chi-square results that were significant at the one percent level (Table 7.13).
These factors were:
• attitude of the general public (Table 7.14); and
• the desire to help others (Table 7.15).
(i) Attitude of the general public
Table 7.14 Attitude of the General Public in Career Choice and Intention to Teach Summary Table
Attitude of the general public Pursue a career
in teaching? Very
unimportant Little
importance Neutral Some
importance Very
important Total Yes Count 5 31 37 29 25 127 Expected
count 14.4 23.7 37.1 35.7 16.1 127.0
% within pursue a career
3.9% 24.4% 29.1% 22.8% 19.7% 100.0%
No Count 28 31 46 46 16 167 Expected
count 19.0 31.1 48.7 46.9 21.2 167.0
% within pursue a career
16.8% 18.6% 27.5% 27.5% 9.6% 100.0%
Unsure Count 9 7 25 29 6 76 Expected
count 8.6 14.2 22.2 21.4 9.7 76.0
% within pursue a career
11.8% 9.2% 32.9% 38.2% 7.9% 100.0%
Total Count 42 69 108 104 47 370 Expected
count 42.0 69.0 108.0 104.0 47.0 370.0
% within pursue a career
11.4% 18.6% 29.2% 28.1% 12.7% 100.0%
Chi-Square Tests
Test Value df Asymp. Sig. (2-sided) Pearson Chi-Square 28.429 8 0.000 Likelihood Ratio 30.030 8 0.000 Linear-by-Linear Association 0.898 1 0.343 N of Valid Cases 370

293
The results show that students who intended to become teachers considered that the
attitude of the general public towards their career was more important than those who
did not intend to teach (Table 7.14). Nineteen point seven percent of students who
intended to become teachers considered that the attitude of the general public towards
their career was ‘very important’ compared to 9.6 percent of those who did not intend to
become teachers and 7.9 percent of those who were unsure. In addition only 3.9 percent
of students who intended to become teachers considered that the attitude of the general
public towards their career was ‘very unimportant’ compared to 16.8 percent of those
who did not intend to become teachers and 11.8 percent of those who were unsure. The
importance to the students, who intended to become teachers, of the attitude of the
general public towards their career could prove a problem when they enter teaching.
The research in Chapter 6 showed that overall teachers were not happy with the attitude
of the general public towards them (Table 6.45). This could discourage some of these
students when they become teachers and lead to lower satisfaction levels and perhaps
contribute to increased resignations.
(ii) The desire to help others
The results show that for students who intended to become teachers, the desire to help
others was more important, than for those who did not intend to teach (Table 7.15).
More than half (57.6 percent) of the students who intended to become teachers
considered that the desire to help others was ‘very important’ compared to 33.9 percent
of those who did not intend to become teachers and 33.3 percent of those who were
unsure. The desire to help others is an important distinguishing characteristic between
the groups. The students, who intended to teach, ranked desire to help others as more
important than the level of salary (means of 4.39 and 3.84 respectively). Teachers may

294
be prepared to accept lower relative wages in exchange for the satisfaction they expect
to receive from helping others. The group who did not intend to become teachers
considered the level of salary as a higher priority in their career choice not just in
comparison to those who intended to teach but as an overall level of importance
compared to the desire to help others (Table 7.13). The unsure group ranked desire to
help others slightly more important that the level of salary.
Table 7.15 Desire to Help Others in Career Choice and Intention to Teach
Desire to help others Pursue a career
in teaching? Very
unimportant Little
importance Neutral Some
importance Very
important Total Yes Count 2 4 9 40 72 127 Expected
count 4.4 5.8 23.2 40.9 52.8 127.0
% within pursue a career
1.6% 3.1% 7.1% 31.5% 56.7% 100.0%
No Count 8 11 42 50 57 168 Expected
count 5.9 7.7 30.6 54.0 69.8 168.0
% within pursue a career
4.8% 6.5% 25.0% 29.8% 33.9% 100.0%
Unsure Count 3 2 17 30 26 78 Expected
count 2.7 3.6 14.2 25.1 32.4 78.0
% within pursue a career
3.8% 2.6% 21.8% 38.5% 33.3% 100.0%
Total Count 13 17 68 120 155 373 Expected
count 13.0 17.0 68.0 120.0 155.0 373.0
% within pursue a career
3.5% 4.6% 18.2% 32.2% 41.6% 100.0%
Chi-Square Tests
Test Value df Asymp. Sig. (2-sided) Pearson Chi-Square 30.159 8 0.000 Likelihood Ratio 32.094 8 0.000 Linear-by-Linear Association 12.034 1 0.001 N of Valid Cases 373
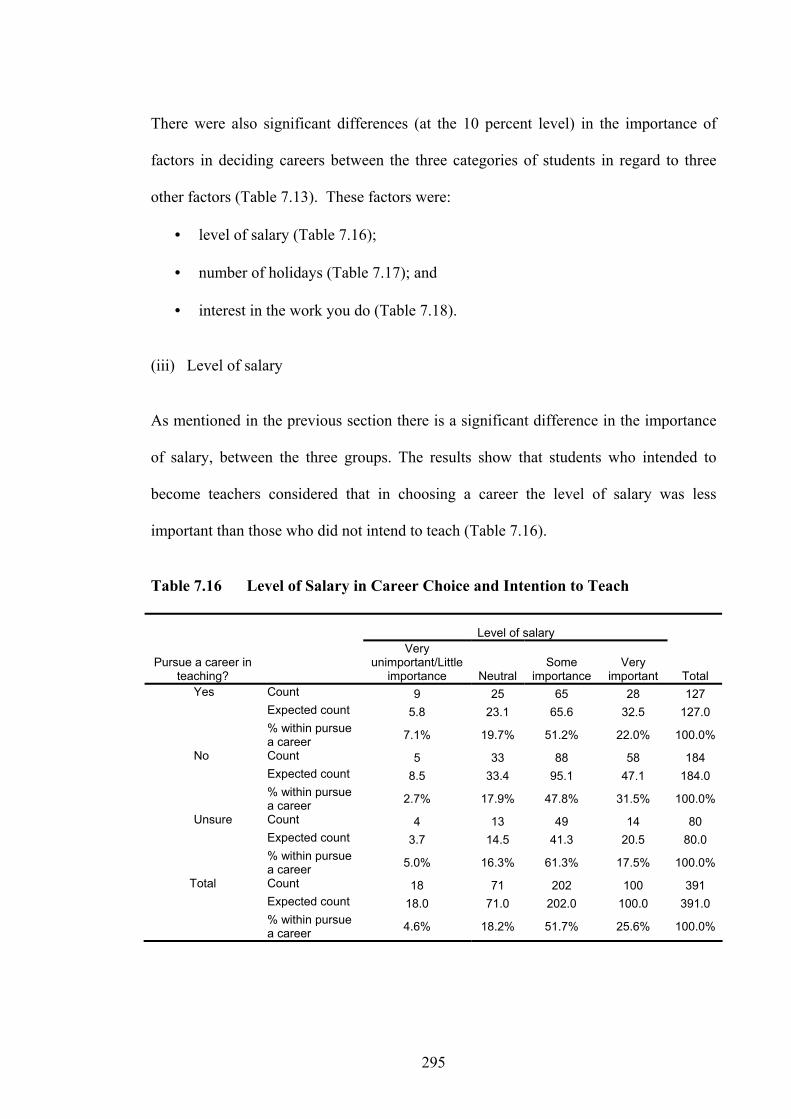
295
There were also significant differences (at the 10 percent level) in the importance of
factors in deciding careers between the three categories of students in regard to three
other factors (Table 7.13). These factors were:
• level of salary (Table 7.16);
• number of holidays (Table 7.17); and
• interest in the work you do (Table 7.18).
(iii) Level of salary
As mentioned in the previous section there is a significant difference in the importance
of salary, between the three groups. The results show that students who intended to
become teachers considered that in choosing a career the level of salary was less
important than those who did not intend to teach (Table 7.16).
Table 7.16 Level of Salary in Career Choice and Intention to Teach
Level of salary
Pursue a career in teaching?
Very unimportant/Little
importance Neutral Some
importance Very
important Total Yes Count 9 25 65 28 127 Expected count 5.8 23.1 65.6 32.5 127.0 % within pursue
a career 7.1% 19.7% 51.2% 22.0% 100.0%
No Count 5 33 88 58 184 Expected count 8.5 33.4 95.1 47.1 184.0 % within pursue
a career 2.7% 17.9% 47.8% 31.5% 100.0%
Unsure Count 4 13 49 14 80 Expected count 3.7 14.5 41.3 20.5 80.0 % within pursue
a career 5.0% 16.3% 61.3% 17.5% 100.0%
Total Count 18 71 202 100 391 Expected count 18.0 71.0 202.0 100.0 391.0 % within pursue
a career 4.6% 18.2% 51.7% 25.6% 100.0%
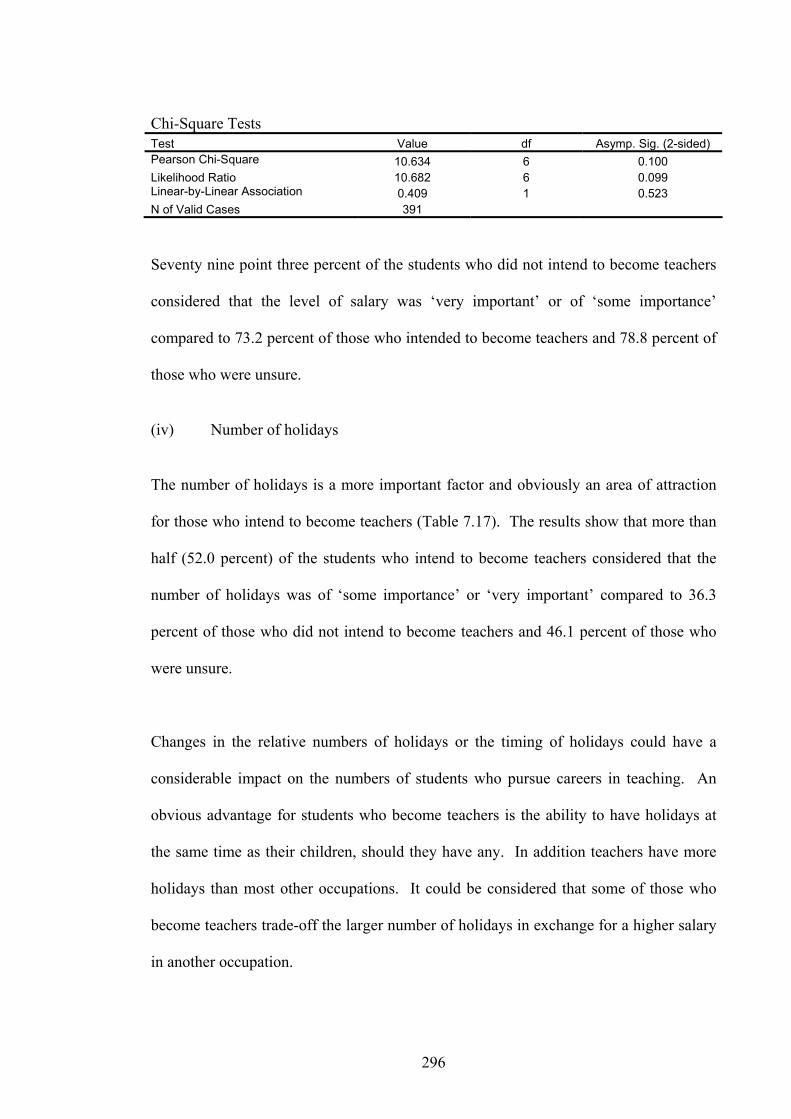
296
Chi-Square Tests Test Value df Asymp. Sig. (2-sided) Pearson Chi-Square 10.634 6 0.100 Likelihood Ratio 10.682 6 0.099 Linear-by-Linear Association 0.409 1 0.523 N of Valid Cases 391
Seventy nine point three percent of the students who did not intend to become teachers
considered that the level of salary was ‘very important’ or of ‘some importance’
compared to 73.2 percent of those who intended to become teachers and 78.8 percent of
those who were unsure.
(iv) Number of holidays
The number of holidays is a more important factor and obviously an area of attraction
for those who intend to become teachers (Table 7.17). The results show that more than
half (52.0 percent) of the students who intend to become teachers considered that the
number of holidays was of ‘some importance’ or ‘very important’ compared to 36.3
percent of those who did not intend to become teachers and 46.1 percent of those who
were unsure.
Changes in the relative numbers of holidays or the timing of holidays could have a
considerable impact on the numbers of students who pursue careers in teaching. An
obvious advantage for students who become teachers is the ability to have holidays at
the same time as their children, should they have any. In addition teachers have more
holidays than most other occupations. It could be considered that some of those who
become teachers trade-off the larger number of holidays in exchange for a higher salary
in another occupation.
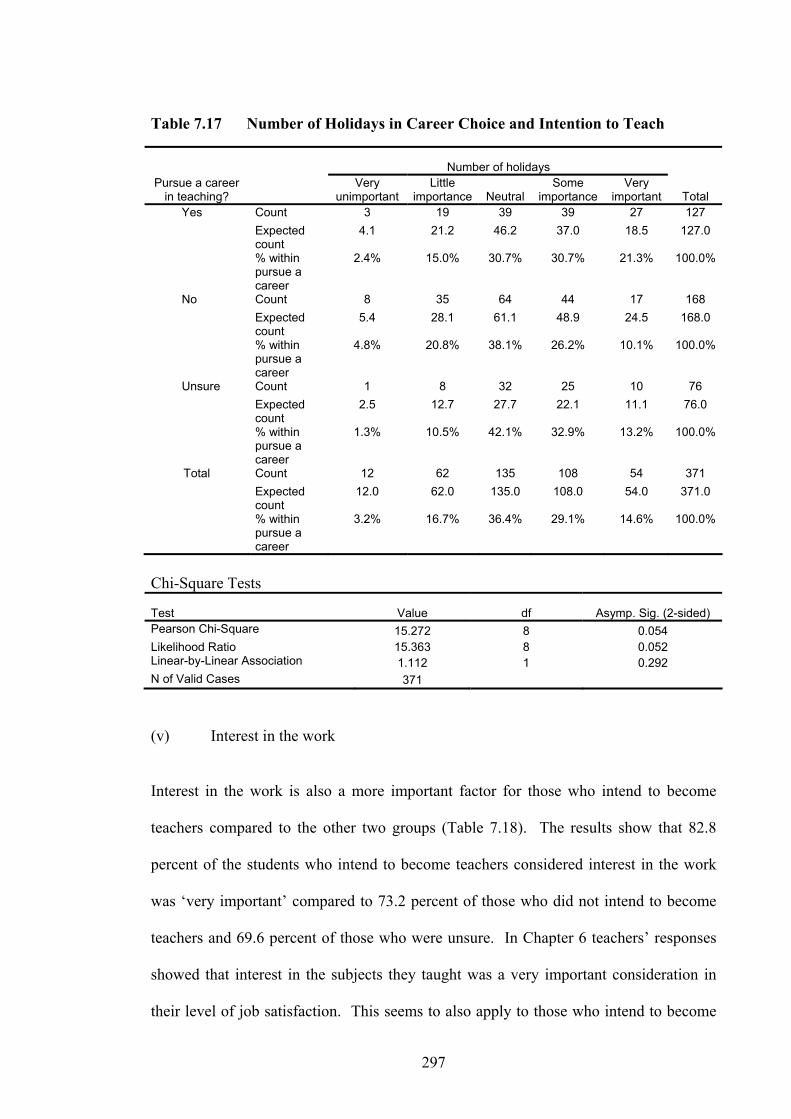
297
Table 7.17 Number of Holidays in Career Choice and Intention to Teach
Number of holidays Pursue a career
in teaching? Very
unimportant Little
importance Neutral Some
importance Very
important Total Yes Count 3 19 39 39 27 127 Expected
count 4.1 21.2 46.2 37.0 18.5 127.0
% within pursue a career
2.4% 15.0% 30.7% 30.7% 21.3% 100.0%
No Count 8 35 64 44 17 168 Expected
count 5.4 28.1 61.1 48.9 24.5 168.0
% within pursue a career
4.8% 20.8% 38.1% 26.2% 10.1% 100.0%
Unsure Count 1 8 32 25 10 76 Expected
count 2.5 12.7 27.7 22.1 11.1 76.0
% within pursue a career
1.3% 10.5% 42.1% 32.9% 13.2% 100.0%
Total Count 12 62 135 108 54 371 Expected
count 12.0 62.0 135.0 108.0 54.0 371.0
% within pursue a career
3.2% 16.7% 36.4% 29.1% 14.6% 100.0%
Chi-Square Tests
Test Value df Asymp. Sig. (2-sided) Pearson Chi-Square 15.272 8 0.054 Likelihood Ratio 15.363 8 0.052 Linear-by-Linear Association 1.112 1 0.292 N of Valid Cases 371
(v) Interest in the work
Interest in the work is also a more important factor for those who intend to become
teachers compared to the other two groups (Table 7.18). The results show that 82.8
percent of the students who intend to become teachers considered interest in the work
was ‘very important’ compared to 73.2 percent of those who did not intend to become
teachers and 69.6 percent of those who were unsure. In Chapter 6 teachers’ responses
showed that interest in the subjects they taught was a very important consideration in
their level of job satisfaction. This seems to also apply to those who intend to become
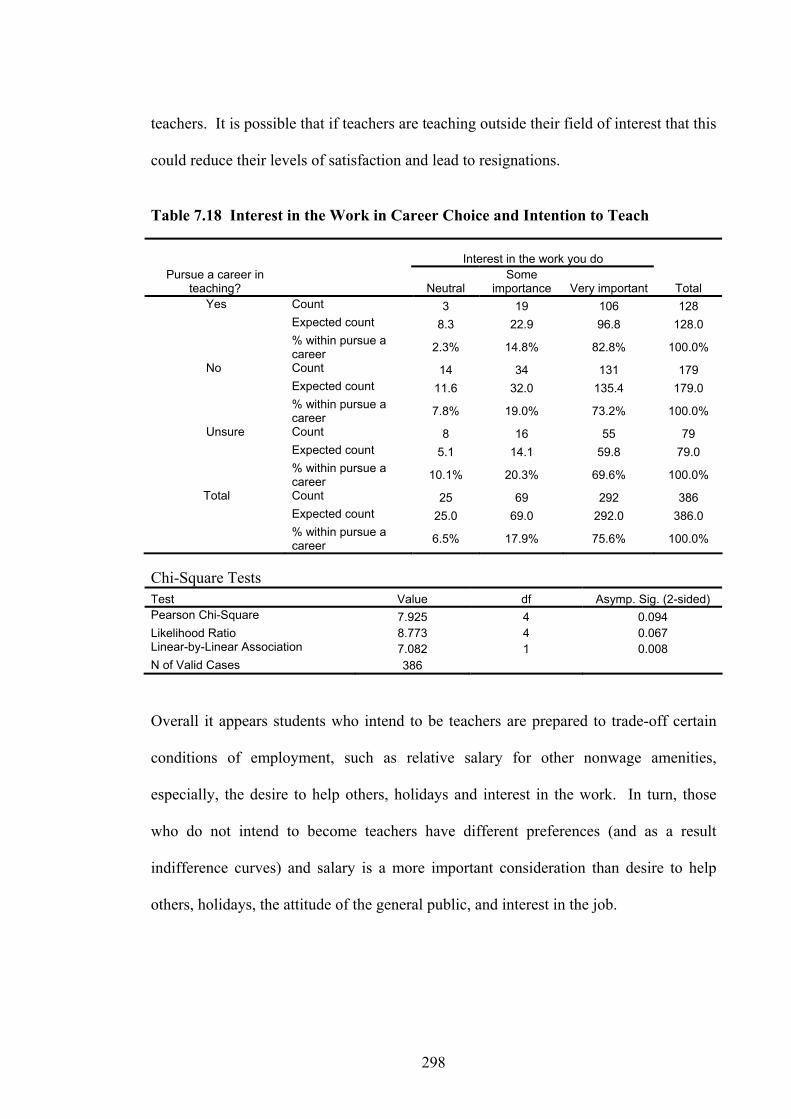
298
teachers. It is possible that if teachers are teaching outside their field of interest that this
could reduce their levels of satisfaction and lead to resignations.
Table 7.18 Interest in the Work in Career Choice and Intention to Teach
Interest in the work you do Pursue a career in
teaching? Neutral Some
importance Very important Total Yes Count 3 19 106 128 Expected count 8.3 22.9 96.8 128.0 % within pursue a
career 2.3% 14.8% 82.8% 100.0%
No Count 14 34 131 179 Expected count 11.6 32.0 135.4 179.0 % within pursue a
career 7.8% 19.0% 73.2% 100.0%
Unsure Count 8 16 55 79 Expected count 5.1 14.1 59.8 79.0 % within pursue a
career 10.1% 20.3% 69.6% 100.0%
Total Count 25 69 292 386 Expected count 25.0 69.0 292.0 386.0 % within pursue a
career 6.5% 17.9% 75.6% 100.0%
Chi-Square Tests Test Value df Asymp. Sig. (2-sided) Pearson Chi-Square 7.925 4 0.094 Likelihood Ratio 8.773 4 0.067 Linear-by-Linear Association 7.082 1 0.008 N of Valid Cases 386 Overall it appears students who intend to be teachers are prepared to trade-off certain
conditions of employment, such as relative salary for other nonwage amenities,
especially, the desire to help others, holidays and interest in the work. In turn, those
who do not intend to become teachers have different preferences (and as a result
indifference curves) and salary is a more important consideration than desire to help
others, holidays, the attitude of the general public, and interest in the job.

299
7.9 How Did the Students Rate Employment Conditions in NSW High Schools?
The university students were also asked to rate, on a 1-5 scale, their perceptions of the
employment conditions of teachers in NSW high schools based on 12 factors. The 1-5
ratings scale was:
5 - well above average;
4 - above average;
3 - average;
2 - below average;
1 - well below average.
Students’ perceptions of the employment conditions of teachers varied considerably
between factors but the overall perception of the students was that the conditions were
slightly above average, as shown with a job satisfaction rating of 3.34. This figure may
over-estimate the level of job satisfaction as 32.4 percent of the sample group reported
their intention to become a high school teacher, when the actual percentage of
Education graduates who go on to teach is approximately 10 percent. The employment
conditions of teachers that the university students considered were the most favourable,
(Table 7.19) based on the mean scores, were:
• number of holidays (4.12);
• job security (3.88);
• hours of work (3.47);
• attitude of peers (3.36); and
• the support of their employer (3.26).

300
The employment conditions of teachers that the university students considered were the
least favourable were:
• level of salary (2.73);
• possibility of promotion (2.75);
• attitude and support of the students (2.90); and
• attitude of the general public (2.95).
The level of stress for teachers was considered above average (3.51), which would also
be seen as a negative factor.
The only factor that the university students showed considerable difference in their
assessment of high school teacher working conditions in NSW, compared to the
teachers themselves (Table 6.34), was in regard to the attitude and support of students.
Teachers themselves found the attitude and support of students favourable (3.55), while
university students rated this less favourable (2.90).
The overall perception that teachers had lower than average wages and lower than
average possibilities for promotion would generally discourage university graduates that
considered these factors as important in their career choices.

301
Table 7.19 University Student Views on Teachers’ Working Conditions
Statistics Level of salary
Job security
Level of stress
Number of
holidays
Hours of work
The attitude
of peers
The attitude
of students
The support
of employer
The support
of pupils' parents
The attitude of the
general public
The possibility
of promotion
Job satisfaction
Valid 382 380 379 383 380 370 376 370 368 372 373 378 Number Missing 28 30 31 27 30 40 34 40 42 38 37 32
Mean 2.73 3.88 3.51 4.12 3.47 3.36 2.90 3.26 3.00 2.95 2.75 3.34 Std. error of mean 0.051 0.042 0.053 0.049 0.050 0.043 0.048 0.046 0.044 0.050 0.048 0.054 Median 3.00 4.00 4.00 4.00 3.00 3.00 3.00 3.00 3.00 3.00 3.00 3.00 Std. deviation 1.004 0.810 1.035 0.955 0.973 0.835 0.922 0.883 0.837 0.970 0.923 1.051 Skewness 0.291 -0.324 -0.572 -0.967 -0.219 -0.006 0.269 0.080 0.107 0.072 0.176 -0.188 Std. error of skewness 0.125 0.125 0.125 0.125 0.125 0.127 0.126 0.127 0.127 0.126 0.126 0.125 Kurtosis -0.003 -0.116 0.000 0.420 -0.145 0.183 -0.016 0.257 0.188 -0.308 0.020 -0.289 Std. error of kurtosis 0.249 0.250 0.250 0.249 0.250 0.253 0.251 0.253 0.254 0.252 0.252 0.250

302
7.10 How Do University Students’ Views on Teachers’ Working Conditions Vary
Depending on their Intention to Teach?
It could be expected that students who intend to teacher would have more positive views
about the working conditions of teachers than those who do not intend to teach or are
unsure. It is important to consider, if there are differences in the views of the three
groups in regard to the working conditions of teachers, as this could influence the
likelihood of students training to become teachers or pursuing a career as a teacher.
The results in Table 7.20 show that there were considerable differences in the
impressions that the students had in regard to the levels of conditions of some factors
between those who intended to pursue a career as a teacher and those who were unsure
or did not intend to pursue teaching as a career.
Table 7.20 University Student Views on Teachers’ Working Conditions and
Intention to Teach Summary Table
Working conditions Chi-
square dfa
Asymp. Sig. (2-sided)
Intend to teach
(mean)
Do not intend to
teach (mean)
Intention unsure (mean)
Level of salary 40.32 8 0.000 2.42 2.84 2.96 Job security 8.499 6 0.204 3.85 3.87 3.95 Level of stress 7.021 8 0.534 3.57 3.40 3.64 Number of holidays 33.70 6 0.000 3.91 4.28 4.12 Hours of work 22.56 8 0.004 3.58 3.42 3.40 The attitude of peers 12.78 8 0.120 3.42 3.32 3.36 The attitude of students 4.612 8 0.798 2.92 2.87 2.91 The support of employer 14.82 8 0.063 3.40 3.14 3.31 The support of pupils’ parents
10.49 8 0.233 2.94 3.01 3.09
The attitude of the general public
18.24 8 0.020 2.72 3.07 3.04
The possibility of promotion
8.659 8 0.369 2.73 2.72 2.74
Job satisfaction 15.10 8 0.057 3.57 3.20 3.34
(a) The degrees of freedom have been adjusted where necessary to ensure the accuracy of the results.

303
There were highly significant differences, at the one percent level, in the impressions of
the three categories of students in regard to the levels of teachers’ working conditions
for three of the factors (Table 7.20). These factors were:
• level of salary (Table 7.21);
• number of holidays (Table 7.22); and
• hours of work (Table 7.23).
(i) Level of salary
It is interesting to note that the students who intend to become teachers consider that
teachers’ salaries are considerable lower than those who do not intend to teach or are
unsure (Table 7.21).
Table 7.21 Level of Salary and Intention to Teach
Level of salary
Pursue a career in teaching?
Well below
average Below
average Average Above
average
Well above
average Total Yes Count 25 43 48 5 7 128 Expected count 14.2 36.8 55.4 13.5 8.1 128.0 % within pursue a
career 19.5% 33.6% 37.5% 3.9% 5.5% 100.0%
No Count 9 52 83 16 13 173 Expected count 19.2 49.8 74.9 18.3 11.0 173.0 % within pursue a
career 5.2% 30.1% 48.0% 9.2% 7.5% 100.0%
Unsure Count 8 14 33 19 4 78 Expected count 8.6 22.4 33.8 8.2 4.9 78.0 % within pursue a
career 10.3% 17.9% 42.3% 24.4% 5.1% 100.0%
Total Count 42 109 164 40 24 379 Expected count 42.0 109.0 164.0 40.0 24.0 379.0 % within pursue a
career 11.1% 28.8% 43.3% 10.6% 6.3% 100.0%

304
Chi-Square Tests Test Value df Asymp. Sig. (2-sided) Pearson Chi-Square 40.324 8 0.000 Likelihood Ratio 38.467 8 0.000 Linear-by-Linear Association 16.126 1 0.000 N of Valid Cases 379
More than half (53.1 percent) of the students who intended to become teachers
considered that the salary of teachers was ‘well below average’ or ‘below average’
compared to 35.3 percent of those who did not intend to become teachers and 28.2
percent of those who were unsure. This difference could reflect the view of those who
intend to become teachers that they consider that teachers are lowly paid for the work
they do, or on the other hand, the other groups consider the teachers’ salaries are
average for what they do. It could also suggest a difference in knowledge of the salaries
of teachers. It could be expected that those who intend to become teachers may be more
aware of the actual salaries of teachers. Those who intend to become teachers are
actually closest to the results of the teachers in expressing their below average level of
satisfaction with their salary (see Table 6.33).
(ii) Number of holidays
Again the students who intend to become teachers did not rate the number of holidays
as highly as those who do not intend to teach or were unsure (Table 7.22). Only 25.8
percent of the students who intended to become teachers considered that the number of
holidays was ‘well above average’ compared to 55.1 percent of those who did not
intend to become teachers and 44.2 percent of those who were unsure. This positive
attitude towards the number of holidays that teachers have could be useful in attempting
to encourage the ‘no’ group and the ‘unsure’ group to pursue a teaching career.

305
Advertising campaigns promoting good teacher working conditions could encourage
more teachers. This consideration will be explored further in Chapter 8.
Table 7.22 Number of Holidays and Intention to Teach
Number of holidays
Pursue a career in teaching?
Well below/below
average Average Above
average
Well above
average Total Yes Count 6 33 56 33 128 Expected count 8.4 21.2 43.3 55.1 128.0 % within pursue a
career 4.7% 25.8% 43.8% 25.8% 100.0%
No Count 14 17 48 97 176 Expected count 11.5 29.1 59.6 75.8 176.0 % within pursue a
career 8.0% 9.7% 27.3% 55.1% 100.0%
Unsure Count 5 13 25 34 77 Expected count 5.1 12.7 26.1 33.1 77.0 % within pursue a
career 6.5% 16.9% 32.5% 44.2% 100.0%
Total Count 25 63 129 164 381 Expected count 25.0 63.0 129.0 164.0 381.0 % within pursue a
career 6.6% 16.5% 33.9% 43.0% 100.0%
Chi-Square Tests
Test Value df Asymp. Sig. (2-sided) Pearson Chi-Square 33.699 6 0.000 Likelihood Ratio 34.521 6 0.000 Linear-by-Linear Association 5.328 1 0.021 N of Valid Cases 381
(iii) Hours of work
A higher proportion of the students who did not intend to become teachers or were
unsure considered that teachers’ hours of work were ‘below average’ or ‘well below
average’ compared to those who intended to become teachers (Table 7.23). Only 3.2
percent of the students who intended to become teachers considered that the hours of
work were ‘below average’ or ‘well below average’ compared to 17.7 percent of those
who did not intend to become teachers and 16.0 percent of those who were unsure.

306
Table 7.23 Hours of Work and Intention to Teach
Hours of work
Pursue a career in teaching?
Well below
average Below
average Average Above
average
Well above
average Total Yes Count 2 2 61 46 17 128 Expected count 4.1 11.9 52.5 38.9 20.7 128.0 % within pursue a
career 1.6% 1.6% 47.7% 35.9% 13.3% 100.0%
No Count 9 22 63 48 33 175 Expected count 5.6 16.2 71.8 53.2 28.2 175.0 % within pursue a
career 5.1% 12.6% 36.0% 27.4% 18.9% 100.0%
Unsure Count 1 11 31 21 11 75 Expected count 2.4 6.9 30.8 22.8 12.1 75.0 % within pursue a
career 1.3% 14.7% 41.3% 28.0% 14.7% 100.0%
Total Count 12 35 155 115 61 378 Expected count 12.0 35.0 155.0 115.0 61.0 378.0 % within pursue a
career 3.2% 9.3% 41.0% 30.4% 16.1% 100.0%
Chi-Square Tests
Test Value df Asymp. Sig. (2-sided) Pearson Chi-Square 22.557 8 0.004 Likelihood Ratio 26.443 8 0.001 Linear-by-Linear Association 1.952 1 0.162 N of Valid Cases 378
While a proportion of the students who did not intend to become teachers or were
unsure considered the hours of work of teachers were less than average, there was also a
considerable proportion that considered that the hours of work were ‘well above
average’. Eighteen point nine percent of those who did not intend to become teachers
and 14.7 percent of those who were unsure considered the hours of work as well above
average compared to 13.3 percent of those who intended to become teachers.
Obviously for some of these students the perceived hours of work of teachers are seen
as a negative feature of the career.

307
There was also a significant difference in regard to the attitude of the general public
between the three categories of students in regard to teachers. The Pearson Chi-square
results show that this factor was significant at the five percent level (Table 7.20).
(iv) Attitude of the general public
Again the students who intend to become teachers rated the attitude of the general
public lower than those who do not intend to teach or are unsure (Table 7.24).
Table 7.24 Attitude of the General Public and Intention to Teach
Attitude of the general public
Pursue a career in teaching?
Well below
average Below
average Average Above
average
Well above
average Total Yes Count 13 44 43 20 7 127 Expected count 7.9 32.5 52.7 26.7 7.2 127.0 % within pursue a
career 10.2% 34.6% 33.9% 15.7% 5.5% 100.0%
No Count 5 38 77 40 10 170 Expected count 10.5 43.5 70.6 35.7 9.6 170.0 % within pursue a
career 2.9% 22.4% 45.3% 23.5% 5.9% 100.0%
Unsure Count 5 13 34 18 4 74 Expected count 4.6 18.9 30.7 15.6 4.2 74.0 % within pursue a
career 6.8% 17.6% 45.9% 24.3% 5.4% 100.0%
Total Count 23 95 154 78 21 371 Expected count 23.0 95.0 154.0 78.0 21.0 371.0 % within pursue a
career 6.2% 25.6% 41.5% 21.0% 5.7% 100.0%
Chi-Square Tests
Test Value df Asymp. Sig. (2-sided) Pearson Chi-Square 18.238 8 0.020 Likelihood Ratio 18.469 8 0.018 Linear-by-Linear Association 7.128 1 0.008 N of Valid Cases 371
Forty four point eight percent of the students who intended to become teachers
considered that the attitude of the general public toward teachers was ‘below average’
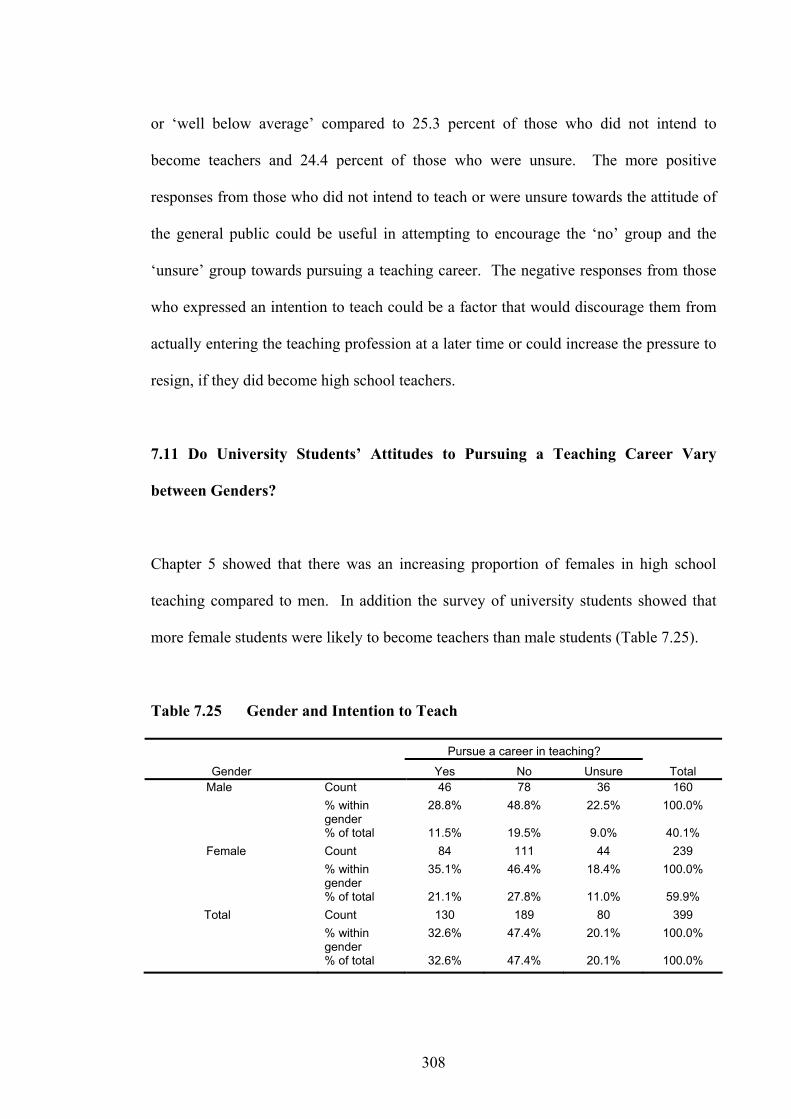
308
or ‘well below average’ compared to 25.3 percent of those who did not intend to
become teachers and 24.4 percent of those who were unsure. The more positive
responses from those who did not intend to teach or were unsure towards the attitude of
the general public could be useful in attempting to encourage the ‘no’ group and the
‘unsure’ group towards pursuing a teaching career. The negative responses from those
who expressed an intention to teach could be a factor that would discourage them from
actually entering the teaching profession at a later time or could increase the pressure to
resign, if they did become high school teachers.
7.11 Do University Students’ Attitudes to Pursuing a Teaching Career Vary
between Genders?
Chapter 5 showed that there was an increasing proportion of females in high school
teaching compared to men. In addition the survey of university students showed that
more female students were likely to become teachers than male students (Table 7.25).
Table 7.25 Gender and Intention to Teach
Pursue a career in teaching?
Gender Yes No Unsure Total Male Count 46 78 36 160 % within
gender 28.8% 48.8% 22.5% 100.0%
% of total 11.5% 19.5% 9.0% 40.1% Female Count 84 111 44 239 % within
gender 35.1% 46.4% 18.4% 100.0%
% of total 21.1% 27.8% 11.0% 59.9% Total Count 130 189 80 399 % within
gender 32.6% 47.4% 20.1% 100.0%
% of total 32.6% 47.4% 20.1% 100.0%
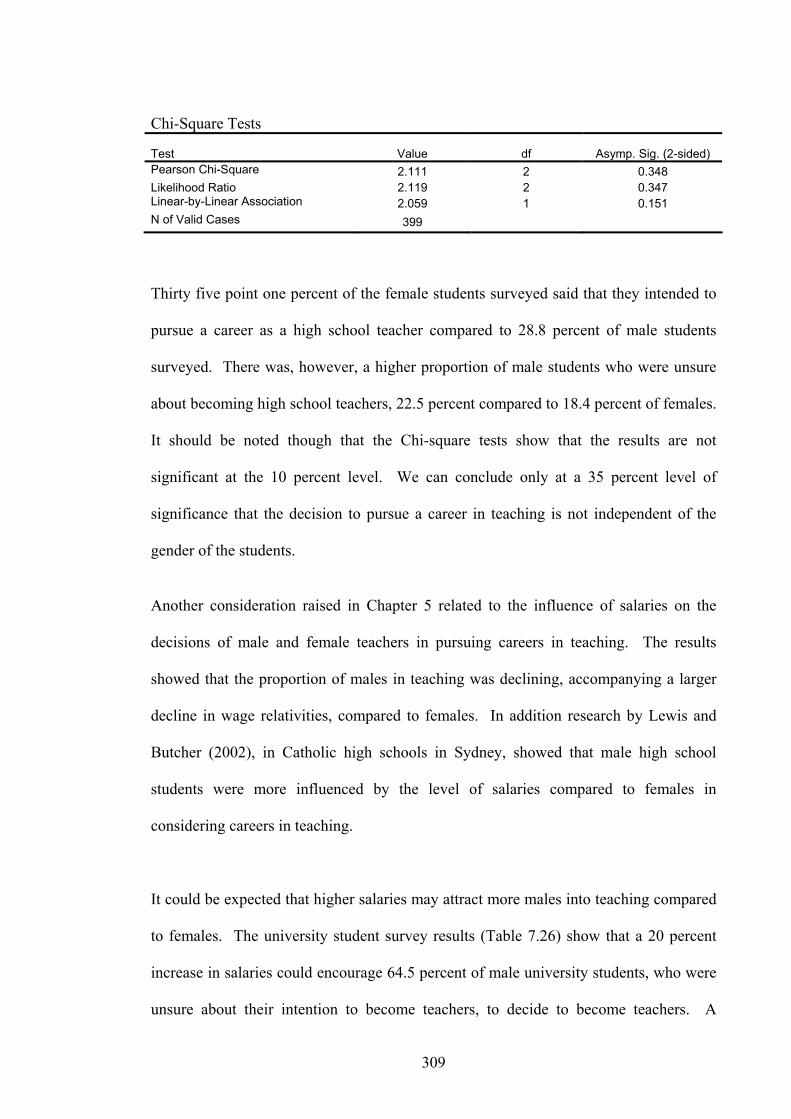
309
Chi-Square Tests
Test Value df Asymp. Sig. (2-sided) Pearson Chi-Square 2.111 2 0.348 Likelihood Ratio 2.119 2 0.347 Linear-by-Linear Association 2.059 1 0.151 N of Valid Cases 399
Thirty five point one percent of the female students surveyed said that they intended to
pursue a career as a high school teacher compared to 28.8 percent of male students
surveyed. There was, however, a higher proportion of male students who were unsure
about becoming high school teachers, 22.5 percent compared to 18.4 percent of females.
It should be noted though that the Chi-square tests show that the results are not
significant at the 10 percent level. We can conclude only at a 35 percent level of
significance that the decision to pursue a career in teaching is not independent of the
gender of the students.
Another consideration raised in Chapter 5 related to the influence of salaries on the
decisions of male and female teachers in pursuing careers in teaching. The results
showed that the proportion of males in teaching was declining, accompanying a larger
decline in wage relativities, compared to females. In addition research by Lewis and
Butcher (2002), in Catholic high schools in Sydney, showed that male high school
students were more influenced by the level of salaries compared to females in
considering careers in teaching.
It could be expected that higher salaries may attract more males into teaching compared
to females. The university student survey results (Table 7.26) show that a 20 percent
increase in salaries could encourage 64.5 percent of male university students, who were
unsure about their intention to become teachers, to decide to become teachers. A
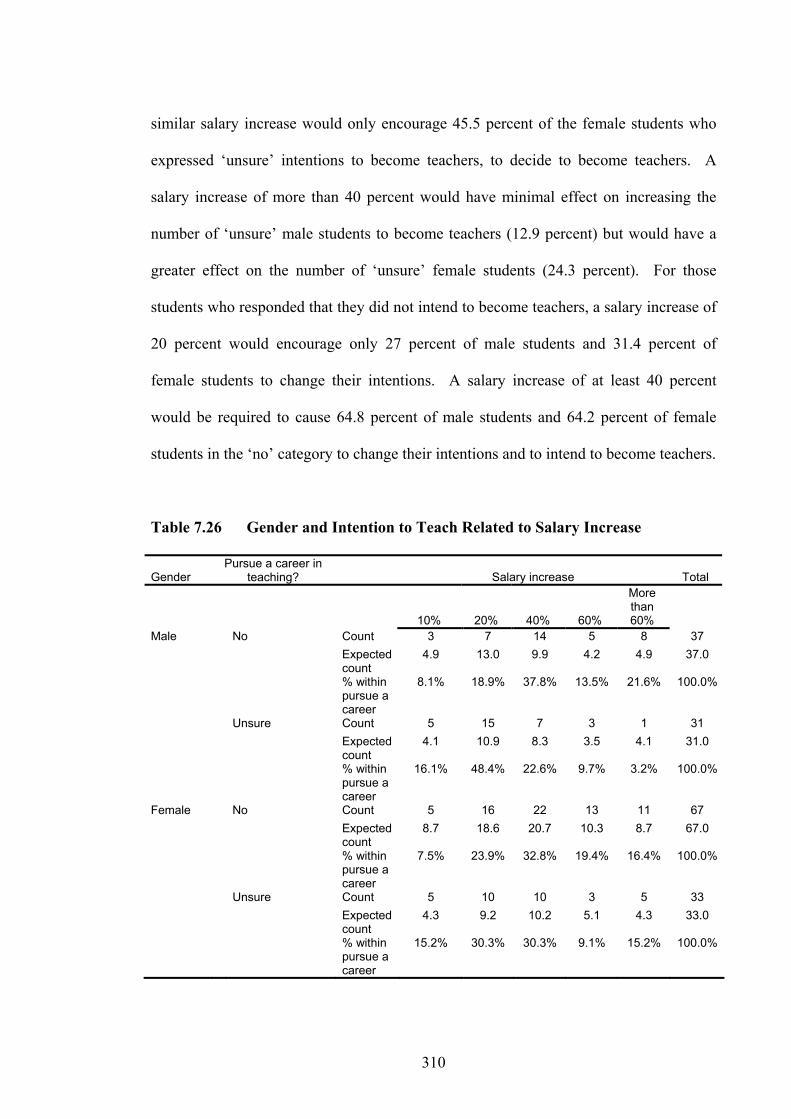
310
similar salary increase would only encourage 45.5 percent of the female students who
expressed ‘unsure’ intentions to become teachers, to decide to become teachers. A
salary increase of more than 40 percent would have minimal effect on increasing the
number of ‘unsure’ male students to become teachers (12.9 percent) but would have a
greater effect on the number of ‘unsure’ female students (24.3 percent). For those
students who responded that they did not intend to become teachers, a salary increase of
20 percent would encourage only 27 percent of male students and 31.4 percent of
female students to change their intentions. A salary increase of at least 40 percent
would be required to cause 64.8 percent of male students and 64.2 percent of female
students in the ‘no’ category to change their intentions and to intend to become teachers.
Table 7.26 Gender and Intention to Teach Related to Salary Increase
Gender Pursue a career in
teaching? Salary increase Total
10% 20% 40% 60%
More than 60%
Male No Count 3 7 14 5 8 37 Expected
count 4.9 13.0 9.9 4.2 4.9 37.0
% within pursue a career
8.1% 18.9% 37.8% 13.5% 21.6% 100.0%
Unsure Count 5 15 7 3 1 31 Expected
count 4.1 10.9 8.3 3.5 4.1 31.0
% within pursue a career
16.1% 48.4% 22.6% 9.7% 3.2% 100.0%
Female No Count 5 16 22 13 11 67 Expected
count 8.7 18.6 20.7 10.3 8.7 67.0
% within pursue a career
7.5% 23.9% 32.8% 19.4% 16.4% 100.0%
Unsure Count 5 10 10 3 5 33 Expected
count 4.3 9.2 10.2 5.1 4.3 33.0
% within pursue a career
15.2% 30.3% 30.3% 9.1% 15.2% 100.0%

311
Chi-Square Tests
Gender Test Value df Asymp. Sig. (2-
sided) Pearson Chi-Square 13.060 8 0.110 Likelihood Ratio 14.206 8 0.077 Linear-by-Linear Association
0.704 1 0.401
Male
N of Valid Cases 105 Female Pearson Chi-Square 7.023 8 0.534
Likelihood Ratio 7.422 8 0.492 Linear-by-Linear Association
0.993 1 0.319
N of Valid Cases 162
The Chi-square test results also confirm that male university students (11 percent level
of significance) are more strongly influenced by changes in salary than female students
(53 percent level of significance) when considering their decisions to become high
school teachers.
7.12 Do University Students’ Attitudes to Pursuing a Teaching Career Vary across
Discipline Areas?
It is possible that the students’ attitudes towards teaching vary across discipline areas. It
might be expected that those students choosing subjects that have a wider range of
alternative career options, such as Business/Commerce/Economics, may be less likely to
choose teaching that those choosing subjects with a more limited range of job
opportunities, such as Arts/Humanities. While these differences may not affect the
overall number of teachers it does consider the issue of teacher shortages in particular
subject areas, which is already a problem in some NSW high schools. The results show
that there are considerable differences between fields of study and intentions to pursue a
career as a teacher (Table 7.27).

312
Table 7.27 Field of Study and Intention to Teach
Pursue a career in teaching?
Field of study Yes No Unsure Total Education/Teaching Count 32 0 2 34 Expected count 11.2 16.1 6.7 34.0 % within field of study 94.1% 0.0% 5.9% 100.0% Arts, Humanities Count 5 9 6 20 Expected count 6.6 9.5 3.9 20.0 % within field of study 25.0% 45.0% 30.0% 100.0%
Science, Mathematics Count 8 43 17 68 Expected count 22.4 32.2 13.4 68.0 % within field of study 11.8% 63.2% 25.0% 100.0%
Commerce, Business, Economics
Count 9 71 10 90
Expected count 29.7 42.6 17.7 90.0 % within field of study 10.0% 78.9% 11.1% 100.0%
Double degrees Count 71 32 34 137 Expected count 45.2 64.9 26.9 137.0 % within field of study 51.8% 23.4% 24.8% 100.0% Nursing Count 1 26 6 33 Expected count 10.9 15.6 6.5 33.0 % within field of study 3.0% 78.8% 18.2% 100.0%
Total Count 126 181 75 382 Expected count 126.0 181.0 75.0 382.0 % within field of study 33.0% 47.4% 19.6% 100.0%
Chi-Square Tests
Test Value df Asymp. Sig. (2-sided) Pearson Chi-Square 159.088 10 0.000 Likelihood Ratio 175.308 10 0.000 Linear-by-Linear Association 0.036 1 0.849 N of Valid Cases 382
The Chi-square tests show that the results are significant at the one percent level. While
it might be expected that those who pursue qualifications in Education/Teaching would
predominantly intend to pursue a teaching career (94.1 percent) and those enrolled in
Nursing courses would not be likely to pursue a teaching career (78.8 percent), the other
courses would have the scope to allow the pursuit of teaching as a career. The results
show that a smaller percentage of students intended to pursue a teaching career, whose
academic qualifications were broadly sought after in the community. In the area of

313
Commerce/Business/Economics only 10.0 percent of students expressed an intention to
pursue a teaching career, compared to 11.8 percent for Science/Mathematics and 25.0
percent for Arts/Humanities. If the students who responded ‘yes’ and ‘unsure’ are
included, the percentages rise for Commerce/Business/Economics to 22.1 percent of
students, compared to 36.8 percent for Science/Mathematics and 55.0 percent for
Arts/Humanities. These results suggest that the level of alternative employment
opportunities does impact on the likelihood of students pursuing teaching careers. This
also suggests that teacher vacancies in areas with greater non-teaching employment
options may be more difficult to fill compared to those with fewer non-teaching
employment options.
7.13 How Did Certain Extrinsic Factors Influence the Students’ Decisions to
Pursue a Career in Teaching?
The students were questioned about the influence of four extrinsic factors on their
decisions to pursue careers as teachers (Q.10 and Q.14). The four factors were:
i. the attitude of teachers at their school towards teaching;
ii. the attitude of their parents;
iii. their own experience of school; and
iv. their own experience at university.
Research carried out by Lewis and Butcher (2002) in schools in Sydney showed that the
first three factors did influence students’ career choices. The survey respondents were
asked to rank the type of influence of the first three factors in regard to their decision to
become a teacher on a 1-5 scale:
5 – very positive;

314
4 – positive;
3 – neutral;
2 – negative;
1 – very negative.
(i) The influence of the attitude of teachers at their school on students’ decisions to
become teachers
The results show that there is a clear link between the attitudes of the students’ own
teachers towards teaching and the students’ intentions to teach (Table 7.28). The
students have obviously been influenced by the positive or negative attitudes of their
own teachers. The results show with a one percent level of significance that students
whose teachers had influenced the students in a positive manner in regard to teaching
were more likely to pursue a career in teaching than those whose teachers were
negative. Out of the students who intended to pursue a teaching career 62.9 percent
expressed the view that their teachers attitudes to teaching had influenced their decision
to teach in a ‘positive’ or ‘very positive’ manner. Of those students who did not intend
to become teachers only 43.5 percent expressed the view that their teachers’ attitudes
had influenced their decision to teach in a ‘positive’ or ‘very positive’ manner. While
for those students who were unsure 51.3 percent expressed the view that their teachers’
attitudes had influenced their decision to teach in a ‘positive’ or ‘very positive’ manner.
These results suggest that the attitudes of teachers not only affect their own teaching but
may also have a long-term influence on the decisions of their students to become
teachers in the future. Policies to deal with this issue would need to begin by creating a
more positive attitude towards teaching in the teachers themselves.
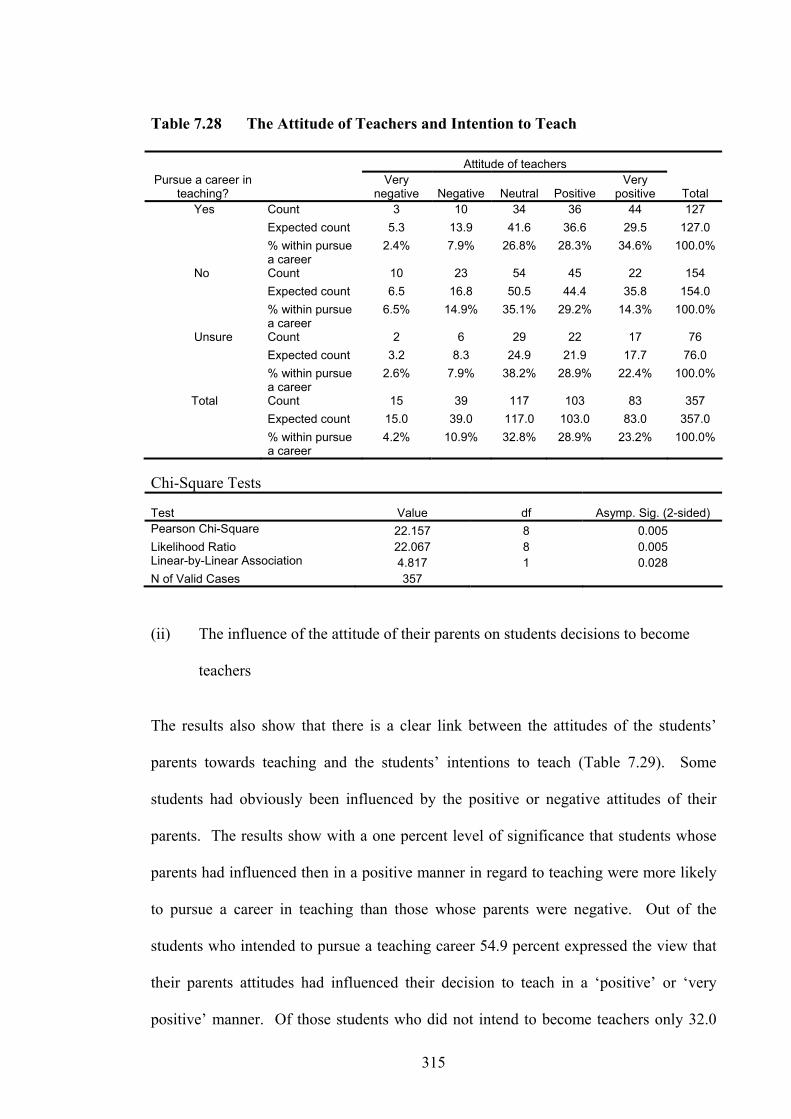
315
Table 7.28 The Attitude of Teachers and Intention to Teach
Attitude of teachers Pursue a career in
teaching? Very
negative Negative Neutral Positive Very
positive Total Yes Count 3 10 34 36 44 127 Expected count 5.3 13.9 41.6 36.6 29.5 127.0 % within pursue
a career 2.4% 7.9% 26.8% 28.3% 34.6% 100.0%
No Count 10 23 54 45 22 154 Expected count 6.5 16.8 50.5 44.4 35.8 154.0 % within pursue
a career 6.5% 14.9% 35.1% 29.2% 14.3% 100.0%
Unsure Count 2 6 29 22 17 76 Expected count 3.2 8.3 24.9 21.9 17.7 76.0 % within pursue
a career 2.6% 7.9% 38.2% 28.9% 22.4% 100.0%
Total Count 15 39 117 103 83 357 Expected count 15.0 39.0 117.0 103.0 83.0 357.0 % within pursue
a career 4.2% 10.9% 32.8% 28.9% 23.2% 100.0%
Chi-Square Tests
Test Value df Asymp. Sig. (2-sided) Pearson Chi-Square 22.157 8 0.005 Likelihood Ratio 22.067 8 0.005 Linear-by-Linear Association 4.817 1 0.028 N of Valid Cases 357 (ii) The influence of the attitude of their parents on students decisions to become
teachers
The results also show that there is a clear link between the attitudes of the students’
parents towards teaching and the students’ intentions to teach (Table 7.29). Some
students had obviously been influenced by the positive or negative attitudes of their
parents. The results show with a one percent level of significance that students whose
parents had influenced then in a positive manner in regard to teaching were more likely
to pursue a career in teaching than those whose parents were negative. Out of the
students who intended to pursue a teaching career 54.9 percent expressed the view that
their parents attitudes had influenced their decision to teach in a ‘positive’ or ‘very
positive’ manner. Of those students who did not intend to become teachers only 32.0
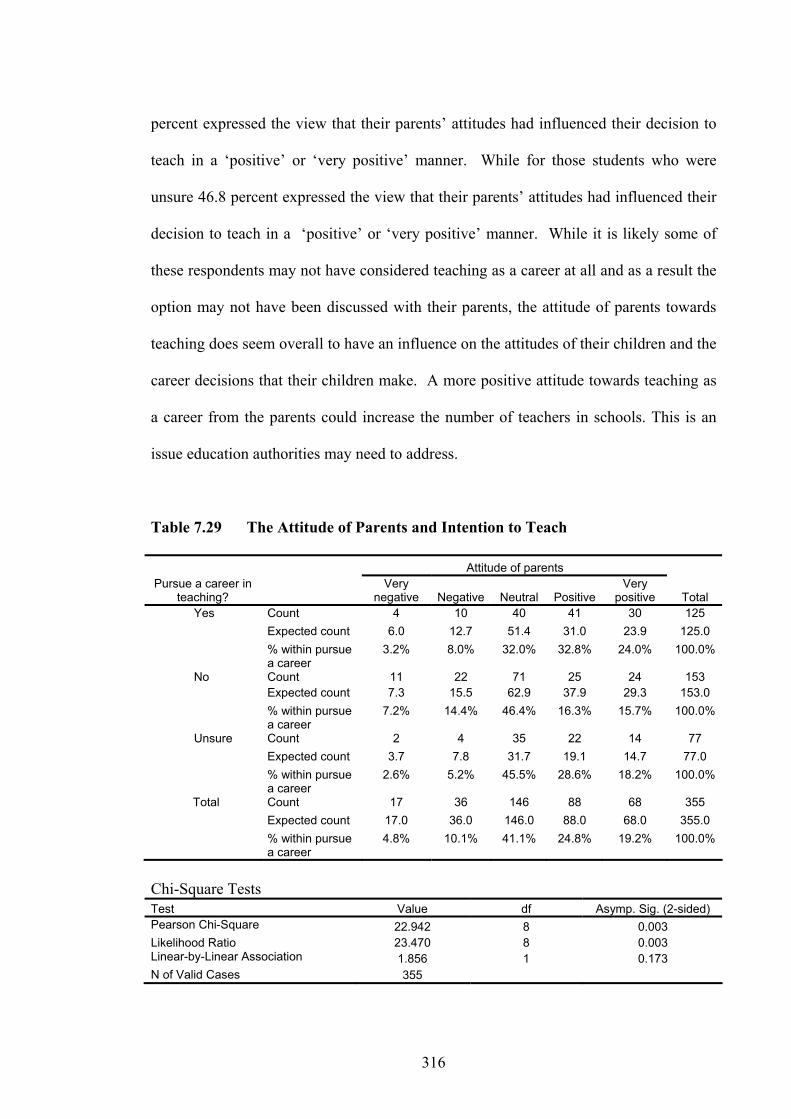
316
percent expressed the view that their parents’ attitudes had influenced their decision to
teach in a ‘positive’ or ‘very positive’ manner. While for those students who were
unsure 46.8 percent expressed the view that their parents’ attitudes had influenced their
decision to teach in a ‘positive’ or ‘very positive’ manner. While it is likely some of
these respondents may not have considered teaching as a career at all and as a result the
option may not have been discussed with their parents, the attitude of parents towards
teaching does seem overall to have an influence on the attitudes of their children and the
career decisions that their children make. A more positive attitude towards teaching as
a career from the parents could increase the number of teachers in schools. This is an
issue education authorities may need to address.
Table 7.29 The Attitude of Parents and Intention to Teach
Attitude of parents Pursue a career in
teaching? Very
negative Negative Neutral Positive Very
positive Total Yes Count 4 10 40 41 30 125 Expected count 6.0 12.7 51.4 31.0 23.9 125.0 % within pursue
a career 3.2% 8.0% 32.0% 32.8% 24.0% 100.0%
No Count 11 22 71 25 24 153 Expected count 7.3 15.5 62.9 37.9 29.3 153.0 % within pursue
a career 7.2% 14.4% 46.4% 16.3% 15.7% 100.0%
Unsure Count 2 4 35 22 14 77 Expected count 3.7 7.8 31.7 19.1 14.7 77.0 % within pursue
a career 2.6% 5.2% 45.5% 28.6% 18.2% 100.0%
Total Count 17 36 146 88 68 355 Expected count 17.0 36.0 146.0 88.0 68.0 355.0 % within pursue
a career 4.8% 10.1% 41.1% 24.8% 19.2% 100.0%
Chi-Square Tests Test Value df Asymp. Sig. (2-sided) Pearson Chi-Square 22.942 8 0.003 Likelihood Ratio 23.470 8 0.003 Linear-by-Linear Association 1.856 1 0.173 N of Valid Cases 355

317
(iii) The influence of their own experience of school on students’ decisions to
become teachers
As might be expected, the students own experiences of school had an influence on their
decisions to teach (Table 7.30). The results show with a one percent level of
significance that students who had less positive experiences of school were less likely to
pursue a career in teaching than those who had more positive experiences. Out of those
students who did not intend to become teachers only 44.8 percent expressed the view
that their own experiences of school had influenced their decision to teach in a
‘positive’ or ‘very positive’ manner. Of the students who intended to pursue a teaching
career 62.5 percent expressed the view that their own experiences of school had
influenced their decision to teach in a ‘positive’ or ‘very positive’ manner. While for
those students who were unsure, 63.7 percent expressed the view that their own
experiences of school had influenced their decision to teach in a ‘positive’ or ‘very
positive’ manner.
For students who had ‘very negative’ or ‘negative’ experiences of school their
intentions not to teacher were much higher. Of those students who did not intend to
become teachers 24.0 percent expressed the view that their own experiences of school
had influenced their decision to teach in a ‘negative’ or ‘very negative’ manner. Of the
students who intended to pursue a teaching career only 10.9 percent expressed the view
that their own experiences of school had influenced their decision to teach in a
‘negative’ or ‘very negative’ manner. While for those students who were unsure, 18.2
percent expressed the view that their own experiences of school had influenced their
decision to teach in a ‘negative’ or ‘very negative’ manner. The positive aspect of this
in regards to students pursuing careers as teachers is that overall 55.1 percent of the

318
university students surveyed had ‘positive’ or ‘very positive’ attitudes to becoming
teachers from their own experiences of school.
Table 7.30 Experience of School and Intention to Teach
Own experiences Pursue a career
in teaching? Very
negative Negative Neutral Positive Very
positive Total Yes Count 4 10 34 42 38 128 Expected count 6.1 17.1 34.2 43.1 27.5 128.0 % within pursue a
career 3.1% 7.8% 26.6% 32.8% 29.7% 100.0%
No Count 10 27 48 45 24 154 Expected count 7.3 20.6 41.2 51.9 33.0 154.0 % within pursue a
career 6.5% 17.5% 31.2% 29.2% 15.6% 100.0%
Unsure Count 3 11 14 34 15 77 Expected count 3.6 10.3 20.6 26.0 16.5 77.0 % within pursue a
career 3.9% 14.3% 18.2% 44.2% 19.5% 100.0%
Total Count 17 48 96 121 77 359 Expected count 17.0 48.0 96.0 121.0 77.0 359.0 % within pursue a
career 4.7% 13.4% 26.7% 33.7% 21.4% 100.0%
Chi-Square Tests
Test Value df Asymp. Sig. (2-sided) Pearson Chi-Square 20.165 8 0.010 Likelihood Ratio 20.368 8 0.009 Linear-by-Linear Association 2.685 1 0.101 N of Valid Cases 359
It is likely that the teachers who taught them influenced the students’ experiences of
school. A more positive teaching environment would most likely improve the
experiences of students at school and increase their likelihood to become teachers. This
issue is linked to policies to improve the level of satisfaction of teachers and the overall
quality of their teaching.

319
(iv) How has the experience at university influenced the students’ attitudes towards
teaching as a career?
The third/final year students were also asked the question whether their attitude to
becoming a teacher had changed since they began university (Q.14). They were also
asked, if their attitude had changed, whether it was more positive or more negative
(Q15.) and the factors that had caused it to change (Q.16). Forty three point five
percent of the students responded that their attitude had changed. Of these 67 percent
had a more positive attitude towards pursuing a career as a teacher and 33 percent a
more negative attitude. The factors that had contributed to a more positive attitude
towards pursuing a teaching career were:
• positive experiences during the teaching practicum;
• the quality of teaching at university;
• greater career opportunities, such as a shortage of Mathematics teachers;
• job security;
• having trained at university they feel ‘better equipped and motivated’ to cope as a
teacher; and
• the positive influence of other students who want to be teachers in order to help
others.
The factors that had contributed to the students having a more negative attitude towards
pursuing a teaching career were:
• negative experiences during the teaching practicum relating to the students, e.g.
classroom management and discipline;
320
• negative experiences during the teaching practicum relating to the teachers who
were supervising them or other teachers in the school, especially in regard to a lack
of support and ‘disgruntled teachers’;
• negative attitudes towards teaching in a school from university lecturers (some of
whom were also current school teachers);
• complaints from teachers about salaries and conditions;
• practicum experiences showed that teaching was ‘too hard’;
• lack of resources in schools;
• high expectations places on teachers and little support in schools;
• child protection legislation is a concern as it creates a fear in teachers in how they
can deal with students;
• lack of reward for the work of teachers as reflected in poor salaries;
• negative media perceptions of teachers; and
• the declining funding of public schools and the governments’ attitudes towards
public education.
The attitude of a number of the respondents is reflected in the following survey
response.
I feel reluctant to become a teacher and join a ‘sinking ship.’
Conditions are getting worse and worse in our schools, especially for
teachers. They are not respected or valued by government, society,
or students. I have done well in my studies. I deserve better.
The issue of being able to support a family on the salary of a teacher was a concern
expressed by a number of respondents. A number said that, while they wanted to be

321
teachers, they would resign and pursue a higher paying career, if they could not properly
support their families.
Overall the factor that had greatest influence on the students who initially intended to
become teachers when they started university was the teaching practicum. Positive
experiences on the practicum made the student more likely to become teachers, while
many of the students who had negative experiences on the practicum had decided
against pursuing a teaching career. While some of these potential teachers may not
have been suited to teaching others were negatively affected by the lack of support from
teachers during their practicum. This is an issue that will be pursued in regard to policy
implications in Chapter 8.
7.14 Conclusion
University students have a variety of reasons for choosing a particular career or
specifically choosing to, or not to, become a high school teacher. Despite this the
survey results showed that a salary increase of 10 percent could lead to 7.6 percent of
those who would not have become teachers to become high school teachers. In addition
15.4 percent of those students who responded that they were unsure, would also have
become high school teachers. A salary increase of at least 20 percent could have led to
an increase in the number of teachers far beyond the likely requirements of the high
school systems in NSW. Past the 20 percent salary increase, the marginal benefits of
the increased salaries in terms of increased numbers of university students entering the
high school teacher labour market declines.
322
Those students who intended to become teachers had different values in regard to the
factors they considered most important in pursuing a career, compared to those who
were unsure and those who had no intention to teach. Those who intended to become
teachers ranked ‘the desire to help other’ much higher than the other two groups. This
factor would be seen by those who intend to teach as a positive nonwage amenity. In
order to increase the number of teachers in NSW high schools it would be necessary to
improve the factors that were important to those who have responded that they would
not teach or were unsure. The ‘unsure’ group is the one with responses most similar to
the responses of those who intend to teach. To increase the proportion of the ‘unsure’
group who would become teachers, improvements in working conditions would be
needed to compensate for the lower importance that they placed on ‘the desire to help
others’. Some areas where this could occur include improvements in the level of salary
and the possibility of promotion. The perception of the attitude of the students was also
looked upon as being negative and the responses were considerably lower than those
that were actually expressed by the teachers themselves. An improvement in this
perception and that of the attitude of the parents could increase the likelihood of some
of the ‘unsure’ group becoming teachers.
Improvements in the attitude of high school teachers themselves towards a teaching
career would most likely increase the number of students who would enter the teaching
profession. The results also show that support from the university students’ parents
towards teaching and their own positive experience of school also contribute to the
likelihood of someone becoming a teacher.

323
The attitude of university students towards pursuing a career in teaching changed for
many of them, while at university. While for two thirds of the group it was more
positive, one third were more negative and a number decided not to continue with
teaching. The main factor affecting those who were training to be teachers was the
teaching practicum. Positive practicum experiences increased the likelihood of students
becoming teachers while negative experiences either as a result of the behaviour or
response of students or the negative reactions of current teachers lessened the likelihood
of becoming teachers and in some cases ended their intentions to become teachers.
The next chapter will look at some policy options to deal with these issues.
324
Chapter 8. Conclusions and Policy Implications of the Study
8.1 Conclusions of the Study
The nature of the teacher labour market is complex and countries have a variety of
institutional structures and approaches to wage determination and allocation of teaching
staff. Trained teachers will largely base their decisions of whether they make themselves
available for employment as teachers based on the rewards available. These rewards are
generally made up of wage and nonwage amenities. NCES (1996, 1997) research showed
that teachers in private schools in the USA were prepared to accept lower rates of pay
compared to teacher in public schools in exchange for higher levels of job satisfaction
associated with their working environment. They also showed that teachers in flexible
labour markets change schools based on perceived differences in wages and nonwage
amenities.
Economic theories underpinning behaviour in the teacher labour market were reviewed in
Chapter 2. Traditional theories such as the neo-classical theory argue that workers have
different individual indifference curves, reflecting the trade-off between income and
leisure. As a result the number of hours individuals will be willing to work at a particular
wage rate will vary. The hedonic wage theory goes further and suggests that workers with
identical levels of human capital will be willing to work for different wage levels
depending on the nonwage amenities available and their individual preferences for
nonwage amenities compared to wages. A situation of fewer nonwage amenities but a
relatively higher wage will attract some workers. This is most relevant in regards to teacher

325
shortages in isolated schools (discussed in Chapter 4). These schools tend to have less
social amenities for teachers compared to those existing in regional centers and large cities.
Furthermore, the cost of providing a similar level of amenities to isolated schools would be
prohibitive. The hedonic wage model suggests that higher relative wages in school areas
that are fairly isolated or considered undesirable for other reasons would be a trade-off for
the lower level of nonwage amenities.
The main employer of teachers in NSW high schools is the NSW Government. They are
also partly responsible for the funding of Catholic and independent schools in NSW. The
Government is faced with a constrained budget. Their ability to fund teachers’ wages is
constrained by their budget and the political repercussions of increases in taxation or cuts in
government expenditure in other areas to fund teacher wage increases. There is also the
issue of flow-on effects to other workers in the public service, which would put further
pressure on the Government’s budget. An alternative, at least in part, to wage increases is
improved nonwage amenities for teachers. Some of those nonwage amenities have a
relatively low cost to implement and may increase teacher retention and entry rates if
adopted. There is also evidence that male and female teachers have different preferences
for wages and nonwage amenities. This is an issue that should also be considered. These
issues will be discussed in the consideration of policy options later in this chapter.
Chapter 3 demonstrated that while the overall demand for teachers is fairly predictable and
consistent, the level of ‘new’ teachers required each year is not. The demand for teachers is
related to the cumulative demand of the three school systems that operate in NSW. Making

326
accurate predictions or projections of the demand for teachers is not possible without this
cumulative result. The DET does have information on a wide variety of teacher separation
factors that influence demand but the same cannot be said for the non-government sector.
This lack of information makes the projections largely unreliable as teachers can move
back and forward betwen the three systems over time. There is a need for a central registry
of data for all schools in NSW that will include teacher numbers dealing with various
aspects of net teacher separations, including age, resignations, and leave. (This issue is
considered further in the policy implications later in this chapter.) The adoption of such a
registry of data will allow the Government and other education providers to develop
policies that may ensure that the quantity of supply of available teachers will be suitable to
the quantity that is demanded.
In Chapter 4 we argued that the quantity of high school teachers that will be supplied in any
particular year is more difficult to predict than the demand for teachers. The supply of high
school teachers in NSW depends on a large number of variables, including the number of
new graduates and the proportion who wish to become teachers; the number of teachers
returning from leave; the number of former teachers returning to teaching; the pool of relief
and casual teachers; the net movement of teachers into NSW from another state or from
overseas; and the overall state of the alternate job market for teachers. Even in times of an
apparently balanced or slightly oversupplied teacher labour market, there are still shortages
of teachers in particular discipline areas and geographical areas. The National and State
Skill Shortage Lists for Australia (2003) show there is a nation wide shortage of high
school teachers in:

327
• Manual Arts/Technical Studies;
• Mathematics;
• Physics/Chemistry; and
• General Science.
In addition there are shortages of high school teachers in other states in the areas of:
• Music;
• Languages;
• Home Economics;
• Information Technology;
• Senior English;
• Special Needs;
• Agricultural Science; and
• Physical Education.
The limited availability of data on the quantity of teachers in the State is a serious concern.
In the public schools sector there is little accurate data on casual teacher and limited term
employed teacher availability and movements into and out of teaching positions. In the
non-government sector the problem is even worse with no central data on staff turnover,
patterns of leave, or even the age of teaching staff. This makes projections of the likely
supply of teachers at any point of time problematical at best.
328
The three factors that have the greatest influence on the high school teacher labour supply
in NSW, at the present time, are the aging teacher population, the low proportion of new
teaching graduates and the decline in the proportion of males seeking to become teachers.
All of these factors create an environment whereby it is most likely that there will be a
shortage of high school teachers in NSW, initially in some discipline areas and locations.
There is already evidence of this at the start of 2005 and it is likely to worsen in the
foreseeable future. While there is evidence that the State Government has taken some steps
to deal with that issue, namely advertising campaigns such as ‘Teach and Make a
Difference’, the Accelerated Teacher Training Program, and the Pre-service Teacher
Education Scholarship Program, these may not be sufficient to deal with projections of a
growing high school teacher shortage in the period 2005-2010. Some of these programs
such as the Accelerated Teacher Education Program and the employment of some overseas
teachers through Australia’s immigration program also have raised issues about teacher
quality. Policies to deal with the issue of imbalance between demand and supply of high
school teachers in NSW are considered later in the policy implications section of this
chapter.
In Chapter 5 an attempt was made to apply a traditional labour market model to evaluate
the relative significance of a number of variables that should generally influence the supply
of teachers in a particular location. Those variables were:
• the relative wage of teachers compared to all people in the location;
• the distance of the location from the coast;
• the distance of the location from the major cities; and
329
• the unemployment rate in the location.
ABS 2001 Census data (2003c) was used to estimate a teacher supply model but the results
showed that the use of traditional labour market models to measure the importance of wage
relativities and other factors on the teacher labour market in NSW high schools is limited.
This is due to a number of factors, not least of which is the role and institutional control of
the NSW Department of Education and Training, the major employer of teachers in NSW.
The DET determines the placement of teachers throughout the NSW public school system.
Teachers cannot move freely inside the public school system and this limits their ability to
move between locations in response to changes in wages and conditions and their personal
preferences. The wage fixing system is also highly centralised with teachers in public and
Catholic systemic high schools following the same salary schedule, with only relatively
minor differences applying in the private school system. The absence of an aggregate
shortage of teachers at the time of the census survey also limits the measurement of teacher
labour supply in a location as the supply is largely in response to the demand for teachers in
a particular location. The measurement of teacher labour supply is also limited as there is
no data available on the quality of the teachers who are working or willing to work. There
is considerable anecdotal evidence that lower relative wages may not initially reflect a
lower supply of teachers but rather a lowering of the quality of teachers. There are some
relevant variables that cannot be observed by the model, such as marital status and family
structure and differences in living and working conditions between schools and locations.

330
If the results of the static models are accepted as valid, then there is the implication that
lower relative wages will lead to an increase in the quantity of teachers per student. The
time-series data from 1976 to 2002 has shown that in the case of male high school teachers
in NSW, that this is not true. As the earning relativities of male teachers, compared to male
average weekly earnings, declined (20 percent) in the period so did the quantity of male
teachers in NSW high schools. The time-series data showed that there had been an increase
in the proportion and quantity of female high school teachers in NSW despite a small
decline (5.9 percent) in relative earnings, compared to female average weekly earnings over
the 27-year period.
The benchmarking study showed that teachers could earn relatively higher wages in other
occupations with similar levels of responsibilities and qualifications. Some teachers have
moved to these more financially rewarding occupations but many still stay in teaching.
Wage relativities do have some influence but are not necessarily the main factor that
determines teachers’ decisions to teach or not to teach. The relative importance of wages
compared to nonwage amenities will be discussed in the next section. This provides a
greater insight into the factors that influence teachers in NSW high schools and the relative
importance of these factors in the decision of being a teacher.
The factors that influence teacher satisfaction in NSW high schools were analysed in
Chapter 6. There is considerable evidence that higher levels of teacher satisfaction lead to
improved teacher retention rates. Surveys of university students reported in Chapter 7 also
showed that the positive attitudes of their school teachers had positive influences on the
students’ decisions to pursue careers as teachers. Higher levels of teacher satisfaction could

331
attract more university graduates to the teaching profession. There is also evidence that
greater job satisfaction can lead to increased teacher effectiveness, which ultimately affects
student achievement.
Survey results of 269 high school teachers covering the three teaching systems in NSW
showed the importance of various factors in determining their levels of job satisfaction and
also their current levels of satisfaction in 14 areas. The results showed that even though
wages (salaries) were not among the most important factors in determining job satisfaction,
many teachers had extra sources of employment to supplement their income from teaching.
The survey reported that 43.8 percent of teachers had supplemented their teaching salary
from at least one other source (Table 6.6). Of these 3.5 percent earned income from other
school related work; 50.4 percent from other education related employment; 30.4 percent
from non-education related employment and 15.7 percent from more than one of these
sources (Table 6.7). Some respondents earned additional income from all three sources.
The level of additional income earned varied considerably. Twenty six point six percent of
those earning additional income received less than $1000 annually; 45.3 percent earned
between $1000 and $3000; 15.8 percent earned $3001-$6000 and 12.2 percent earned in
excess of $6000 (Table 6.8). In addition a much greater percentage of male teachers (54.4)
earn additional sources of income compared to female teachers (34.5) (Table 6.9). This
supports the evidence from Chapter 5 that the proportion of males in teaching is declining
because of lower relative wages. More males are seeking further income to supplement the
lower relative wages that they receive. This is also supported by the survey result that
showed that while both male and female teachers largely had similar negative attitudes to

332
the level of teachers’ salaries, a higher percentage of males tended to find the level of
salaries unsatisfactory or poor, 56.7 percent, compared to 48.2 percent of female teachers
(Table 6.12).
The most important factors in measuring the job satisfaction of teachers in NSW high
schools (Table 6.15), based on the mean scores shown in parenthesis, were:
• interest in the subjects taught (4.58);
• the satisfaction of student achievement (4.51);
• the attitude of peers (4.36);
• the attitude of students (4.34);
• job security (4.34);
• support from administration (4.29); and
• level of salary (4.13).
The least important factors for teachers in measuring their job satisfaction were:
• the possibility of promotion (2.91);
• the hours of work (3.75);
• the attitude of the general public (3.80); and
• the low level of stress (3.94).
The fact that almost half the factors were seen as being more important to the teachers in
measuring their level of satisfaction than wages (level of salaries) demonstrates that teacher
satisfaction can be increased in ways other than wages by focusing on particular nonwage

333
amenities that will increase teacher satisfaction. This conclusion is also supported by the
NCES (1996, 1997) studies in the USA discussed in Chapter 1.
The survey also asked teachers to rank their overall level of satisfaction in terms of the 14
factors that influence teacher satisfaction. The results showed that teachers were most
satisfied (Table 6.34), based on the mean scores shown in parenthesis, with the following
factors:
• interest in the subjects taught (4.29);
• the support of their family (4.12);
• job security (4.08);
• number of holidays (3.92);
• the attitude of peers (3.77);
• the satisfaction of student achievement (3.77); and
• the attitude of students (3.55).
A number of factors had a mean score rating the level of satisfaction on the low level of the
scale. These were:
• the attitude of the general public (2.12);
• a low level of stress (2.23);
• level of salary (2.65);
• the possibility of promotion (2.69); and
• the hours of work (2.94).

334
Many of the most satisfying factors for teachers related to largely intrinsic factors that come
from classroom activities and their relationships and support from family, students, and
peers. On the other hand many of the least satisfying factors are extrinsic in nature relating
to conditions of employment and the public’s perception of teachers.
The survey results showed that there were also considerable differences in levels of
satisfaction in the various factors based on gender, type of school system, location of the
school and age and experience of the teacher.
In only four of the 14 categories were male teachers more satisfied than female teachers
(Table 6.35). Males were more satisfied in the areas of:
• job security;
• a low level of stress;
• the hours of work; and
• number of holidays.
In the remaining 10 categories female teachers were more satisfied, suggesting that overall
female teachers are more satisfied with their job than male teachers. This may also assist in
explaining why the ratio of male teachers to female teachers in NSW high schools has been
declining.
The survey results also showed considerable variation in regard to the different school
systems (Table 6.39). In eight of the 14 categories teachers in other private schools were

335
the most satisfied. In four categories teachers in Catholic systemic schools were most
satisfied and only in two categories were teachers in public schools most satisfied. This
suggests that private school teachers have the greatest overall level of satisfaction, followed
by Catholic school teachers, with public school teachers being the least satisfied.
The factors where there were significant differences between the school systems were
(Tables 6.40-6.46):
• level of salary;
• support from administration;
• the attitude of students;
• the satisfaction of student achievement;
• the support of pupils’ parents;
• the attitude of the general public; and
• the possibility of promotion .
There were significant differences in the satisfaction levels between the ages of teachers in
regard to two factors. These factors were (Tables 6.47-6.48):
• a low level of stress; and
• the possibility of promotion.
The results show that teachers overall are not satisfied with the level of stress they face and
the dissatisfaction tends to rise with age. The results also show that teachers under 39 years

336
are more satisfied with the possibility of promotion compared to the teachers 40 years and
over.
Teachers in country schools were generally less satisfied than teachers working in the main
cities. There were two particular factors where there were significant differences in the
satisfaction levels between the locations of the schools of the teachers. The results show
that teachers working in the country regions of NSW years are significantly less satisfied
with the support from administration compared to the teachers who live in the city region
(Table 6.56). The results also show that teachers working in the country regions of NSW
years are less satisfied with the support of pupils’ parents compared to the teachers who
live in the city region (Table 6.57).
These teacher responses on what factors were important in measuring their level of
satisfaction and the current levels of satisfaction in regard to the 14 factors were used to
calculate a weighted satisfaction score of teacher satisfaction. A regression model based on
the weighted satisfaction score demonstrated that 80 percent of the variations in the levels
of teacher satisfaction were due to the attitude of students, support from administration,
levels of salary, hours of work and the attitude of their peers (Table 6.10).
There were overall significant differences in the weighted satisfaction score in regard to:
• the gender of the teacher;
• the type of school system;
• the location of the school, especially in respect to country teachers; and
337
• the age and experience of the teacher.
Overall, based on the mean scores:
• female teachers (3.47) are slightly more satisfied than male teachers (3.45);
• the least experienced teachers (0-3 years) are the least satisfied teachers;
• the level of teacher satisfaction increases with the level of qualification of the
teacher;
• teachers on the highest salaries were the most satisfied;
• the most satisfied teachers were those working in the inner city of Sydney (3.65)
and the least satisfied were teachers working in the country region of NSW (3.32);
and
• private school teachers (3.64) were overall the most satisfied teachers, followed by
Catholic teachers (3.54), with public school teachers (3.34) the least satisfied.
The significant levels of differences in satisfaction between factors and between
characteristics of teachers and schools provide information that could be used by school
authorities to develop policies to increase the level of teacher satisfaction and as a result the
quality and or quantity of teaching that takes place in NSW high schools. This should in
turn improve the education outcomes for students. These policy implications will be
examined in the next section of this chapter.
338
8.2 Policy Implications
This study shows that there are a number of issues facing education authorities at the
federal and state levels of government, between education systems and in teaching training
institutions. The study shows that there is a projected teacher shortage from 2005 onwards,
at least in some subject areas in some NSW high schools. There is already evidence that
this is occurring. The proportion of university graduates becoming teachers has been in
decline since the mid-eighties and there are a high proportion of high school teachers who
will retire in the next ten years, which will contribute to this anticipated shortage. In
addition there is anecdotal evidence that the quality of teachers being employed, in some
instances, is declining.
The level of teacher job satisfaction is low in regard to a number of areas including the
level of salary, the possibility of promotion, the level of stress of the job and the attitude of
the general public towards teachers. This satisfaction not only affects the teachers but can
also impact on students both currently at that school and past students who are now at
university. Negative attitudes of teachers discouraged both school students and university
students from pursuing careers as teachers. In addition research showed that dissatisfied
teachers were more likely to resign or performed their work at a lower standard, thus
lowering the quality of the students’ education.
There are a number of implications of this study for policy makers. The implications will be
considered on a number of levels, namely:
• national issues;
339
• state issues;
• system issues; and
• individual school issues.
8.2.1 National Issues
8.2.1.1 Limited Statistical Data
A limitation faced by educational authorities and researchers in Australia is the lack of
information available in regard to schools and teachers in Australia. While the Australian
Bureau of Statistics does produce the Schools, Australia series, it basically provides
information only on the numbers of teachers and students in schools in each state by
educational systems. It does not inform us of subject or geographical areas of teacher
shortage or surplus, which are important in catering for the needs of schools in Australia.
There is no national measurement of levels of teacher satisfaction and the factors that
influence it or reasons as to why teachers leave teaching. These issues are important in
trying to improve both the quantity and quality of teachers and overall education outcomes.
Policy recommendation 1
The Australian Government should set up a national body that collects and reports statistics
and information showing the condition of education in Australia.
The Australian Government should set up a national body similar to the National Center for
Educational Statistics (NCES) in the USA. This body is part of the US Department of
Education. The NCES collects and reports statistics and information showing the condition
340
of education in the USA and measures the progress of education in order to promote and
accelerate an improvement in education in the USA. Some of the programs that the NCES
has that could be adopted in Australia include:
• In the area of student performance and outcomes the NCES collects and reports
information on the academic performance of the nation's students as well as the literacy
level of the adult population. The National Assessment of Educational Progress
(NAEP) is NCES’ primary assessment of what American elementary/secondary
students know and can do in academic subjects. This NCES program also assesses the
proficiency of adults in performing basic literacy and mathematical tasks through the
National Assessments of Adult Literacy (NAAL).
• The NCES survey program at the elementary/secondary education level provides
information on the condition of public and private education. Through the Common
Core of Data (CCD) Survey, national, state, and local data on public elementary and
secondary education is collected. The NCES' data collection programs include the
Schools and Staffing Survey, the Private School Universe Survey, and the National
Household Education Survey. These surveys provide insights into the factors that
influence student and teacher performance. They also consider factors affecting where
teachers work, their level of satisfaction, and why they leave teaching.
• The NCES also gains insights into the effectiveness of the educational practices and
outcomes of the United States by comparing them with those of other countries. This is
341
achieved through the International Activities Program at NCES, which provides
statistical information comparing the educational experiences and trends in other
countries to those of the United States. International assessment studies provide
answers to questions of how other countries educate their children and with what
success (National Center for Education Statistics 2004).
8.2.1.2 The Supply of Trainee Teacher Places at Universities
In an attempt to increase the number of students who become teachers the NSW
Government implemented the Teach NSW program with their marketing slogan ‘Teach and
make a difference.’ This program appears to have had some initial success with the number
of applications for teacher education courses rising in 2004. Because the number of teacher
education places is set by a quota for each university by the Australian Government,
increased applications had the effect of increasing the cut-off marks to get into teaching
courses but did not increase the number of trainee teacher places at the universities. The
problem is that while this may increase the quality of teachers going into the schools it will
not necessarily increase the numbers of teachers.
Policy recommendation 2
The Australian Government should increase the number of secondary trainee teacher places
at universities. These should not only be in areas of current curriculum shortage but in
areas of likely future curriculum shortages.

342
The Australian Government needs to increase the number of secondary trainee teacher
places at universities to lessen the likely impact of teacher shortages, especially in the
subject areas that already have the greatest shortages, such as Mathematics, Science, and
Technological and Applied Studies. The places should not only be in the areas of current
shortage as there will be other areas of shortages developing in the next few years. The
Australian Government needs to consult with State and Territory Governments and other
education authorities in Australia, such as Catholic Education Commission and universities,
to clarify these subject areas and the numbers of university places that should be allocated.
The Australian Government will also need to develop an accurate forecasting model to
predict areas of shortage and the numbers of positions to allocate. An accurate forecasting
model could also be used to allocate teacher-training positions based on supply and demand
to avoid over-supply and under-supply in particular disciplines.
8.2.1.3 The Higher Cost of University Training for Some Subject Areas
While teachers are paid the same salaries, irrespective of the subjects that they teach and
are qualified in, the cost of gaining these qualifications varies depending on the subjects the
teachers study. Human Capital Theory tells us that individuals will decide to invest in
education based on their private rate of return on their investment in education (Ehrenberg
and Smith 2000, Kaufman and Hotchkiss 2000, Norris 2000). Not only do teachers,
especially males, have a lower than average private rate of return (as discussed in Chapter
5) but teachers in some subject areas such as Economics, Business, Mathematics, Science
and Computing pay higher HECS fees than teachers with qualifications in general

343
Humanities subjects, such as History and English, and Foreign Languages and Visual and
Performing Arts (Band 1 subjects) as shown in Table 8.160.
Table 8.1 HECS Costings for Students in 2005, without additional fees Subject Level of HECS $ per annum Law 6414 Economics/Business 5479 Computing 5479 Mathematics, Science 5479 Humanities 3847 Languages 3847 Visual and Performing Arts 3847 Education 3847 Source: DEST 2003
Not only are teachers of the higher band subjects disadvantaged by higher HECS fees but
they cannot expect to receive as high an expected future income as similar graduates who
go into non-teaching occupations such as being computer professionals, economists, or
marketing managers. The teachers are also further disadvantaged by undertaking one year
of extra study in Education rather than going directly into employment. The teachers in
these subject areas would have gained much larger private rates of return on their education
investments, if they had not entered teaching but pursued other employment after they had
completed their degree. There is a need to reduce this burden, as well as the inequity and
disincentive to become teachers caused by the differences in HECS bands.
Policy recommendation 3 The Australian Government should adopt a policy that all university graduates who become
teachers should be subject to the same Higher Education Contributions. The graduates who
60 These exclude the 25 percent additional fee charge that most universities introduced in 2005.

344
become teachers should have all their subjects charged at the Education (Band 1) rate and
only be liable for contributions for a period of four years of higher education.
The adoption of such a policy, to reduce the inequity of the HECS burden for some
teachers, does bring up some issues that need to be considered, depending on whether the
teachers pay ‘up-front’ or ‘defer’ their payment. For the teachers who delay the payment,
then all units in a teaching degree could be charged at the Education (Band 1) rate. For
those who pay up-front, they could also be billed at the Education rate. If they changed
their minds later and decided not to become a teacher, then they would be subject to the
higher rate. If they decided to become teachers after completing a degree, then the payment
could be reimbursed, if they over paid their HECS bill61. For some students this could
mean the Diploma of Education would pay for itself, and be an incentive to complete the
Diploma and become a teacher. For other students the HECS burden would be lower to
become a teacher than pursue an alternative career and therefore prove to be an incentive to
pursue a teaching career.
8.2.2 State Issues
8.2.2.1 Inflexibility of the Teacher Labour Market
There is growing evidence of a shortage of teachers in some disciplines and in particular
locations. Webster et al. (2004:2) consider that the “entrenched inflexibilities in the
payments system have contributed towards chronic shortages of qualified teachers in
61 This policy may require a minimum period of teaching, such as five years, to gain access to this scheme. Anyone teaching less than five years would be subject to the full HECS liability.

345
specialised teacher labour markets and poor incentives for excellent teachers to remain in
teaching.” One of the ways that the State Government is attempting to deal with this is the
introduction of teacher scholarships62 in the discipline areas of greatest shortages, namely
Technological and Applied Studies, Mathematics, Science, and English. One of the issues
associated with this is that the graduate teachers only have to remain in teaching for three
years. At the end of this period they may leave the Department and pursue a career in a
more highly paid position in a private school or a non-teaching career. While this scheme
may help to alleviate some of the shortage, an alternative approach would be to have a
more flexible teacher labour market similar to that in the USA, where salaries could be
adjusted to attract teachers to areas of shortages in disciplines or in geographical areas of
shortage (as discussed in Chapter 1). There is a need to increase the flexibility of the
teacher labour market in NSW. The same basic salary scales largely determine teachers’
salaries. There is little or no flexibility in public and Catholic systemic high schools to set
salary levels that reflect market forces. It was shown in Chapter 1 that problems of teacher
shortages in particular subject areas in schools in the USA were overcome by offering
higher wages to attract staff. There were also differences in salary levels between schools
based on location and other factors.
Policy recommendation 4
The NSW State Government and other education system administrators should encourage
increased labour market flexibility by:
62 In 2005 200 teacher education scholarships will be awarded. They include the payment of HECS fees associated with the training along with an incidental allowance of $1500 per year of full time study. The graduate teachers have to commit themselves to teach with the Department for three years in the subject areas and locations agreed to.

346
• allowing schools to offer higher salaries to attract teachers in areas of shortage;
• allowing paid overtime for current staff to fill shortages; and
• paying bonuses and performance loadings to the best performing teachers.
There are a number of ways that increased labour market flexibility could increase the
availability and quality of staff in high schools in NSW. First, schools in NSW should be
given finances that reflect their particular circumstances. Schools in more socially
disadvantaged areas, that have difficulty attracting teachers, should be given greater
funding per pupil to improve resources and to pay higher salaries for teachers to teach in
those school. School principals should have the financial resources to attract staff by
offering higher salaries to teachers in areas of geographical and discipline shortages.
Second, in areas where there are teacher shortages, teachers could receive paid overtime to
take extra classes. It is better for a specialist in an area to take a class than someone
teaching out of their field. This may require some restructuring of the traditional school
day of 9am to 3pm to one of 8am to 4pm. There is already considerable evidence that
many teachers work in outside employment to earn additional income (Chapter 6). Many
would probably welcome the opportunity to earn additional income from teaching rather
than in outside employment such as cleaners or waiters. This would be budget neutral as
the teachers are replacing other less qualified teachers who would have been employed to
take the classes. This would not only be a benefit to the teachers but also to the pupils.
Third, so as to improve the retention rate of the most capable teachers, bonuses and
performance loadings could be paid to the best performing teachers. While measurements

347
of teacher productivity are very difficult to make and generally controversial, teacher
appraisals similar to those applying in many organisations in Australia would be possible.
These appraisals are generally carried out by a supervisor and are measured based on set
performance criteria and outcomes. These could include some element of peer appraisal
and even parental and student appraisal in measuring the teacher’s performance. The use
of parental appraisal could improve the attitude of parents to teachers, and the work the
teachers do, and the remunerations the teachers receive. The use of performance loadings
has achieved improved outcomes in business organisations and it is likely that such
policies would improve the performance of teachers and the educational outcomes for the
students. The higher remuneration would also be an incentive to remain in teaching.
It should be noted that teacher unions, who traditionally have supported an approach of
higher salary levels for all teachers, might oppose some of these recommendations that
encourage market-determined salaries paid to teachers. In addition, while the unions
generally support paid overtime for teachers, the unions consider that this should apply for
all types of work beyond normal teaching duties and hours.
8.2.2.2 High Resignation Rate of New Teachers
Many teachers leave teaching in their first few years of teaching (Chapter 4). It is often
difficult for a new teacher to adapt to a full working load and all the responsibilities of
being a teacher. The lack of experience and in some circumstances the lack of support the
new teacher receives contributes to a low level of job satisfaction (Chapter 6) and a higher
resignation rate. In some circumstances the new teachers go into a school and receive the

348
classes that no one else wants. These are often the most difficult classes to teach and
magnify the problems of adjustment faced by the new teachers.
Policy recommendation 5 The Department of Education and Training and other school administrators in NSW should
adopt a number of initiatives that would assist new teachers in their early years of teaching.
These include:
(a) a formal induction process;
(b) a mentor teacher; and
(c) reduced face-to-face teaching time in the first year of teaching.
Some of these are already in place in some schools, but not in all schools or systems.
(a) A formal induction process
An induction process for teachers can take many forms in some instances it may not be
much more than introductions to colleagues and being shown around the school. Ewing
and Smith (2003) reported in their study of 196 beginning teacher graduates from the
University of Sydney that the most often reported mentoring or induction, if any, was
categorised as 'informal support'. Only 12 percent of the respondents reported systematic
and regular sessions for the whole year. A further 13 percent reported regular sessions in
the first two terms63. None of the respondents reported any continuation of induction
sessions beyond the first year of teaching. In many cases the induction process was very
brief lasting just one day or a few sessions. Beginning teachers need continual assistance as
63 In NSW there is a four-term school year, so this would involve about 20 weeks of actual school time.
349
they face new challenges and as they begin to develop their skills. A more formal and
ongoing induction process is required for beginning teachers. This induction process
should include the provision of a mentor.
(b) A mentor teacher
Schools need to have mentor teachers who can assist not only the beginning teachers but
also the teachers in training who are placed in the school for practicums. While mentoring
of beginning teachers is officially encouraged, by the major teaching authorities in NSW,
Ewing & Smith (2003) reported that almost 40 percent of the beginning teachers surveyed
reported that they did not have a mentor teacher. It was also reported that half the
respondents also did not have a supervisor. Thus, for over half of the study's respondents,
there was no teacher who was assigned to have a special responsibility for assisting the
beginning teacher. Ewing & Smith stated that one of the reasons for this weakness
stemmed from the lack of recognition or recompense for the role of the mentor. A
promotional position of mentor teacher should be established. This person would have to
complete training to learn how to be an effective mentor and they would be evaluated to see
how well they carried out the mentoring process. This would provide a promotional
position for experienced teachers who have much to offer as classroom teachers but who do
not wish to become or are prevented from being administrators. The mentor teacher would
have a formal weekly meeting with the beginning teacher to discuss issues in the teacher’s
development and adjustment to teaching. The mentor would also review the classes of the
beginning teacher and offer assistance in improving their teaching performance. The cost
350
of such a program would vary from year to year depending on the number of new mentors
and the number of retiring mentors. It could be expected that between five and ten percent
of staff in a school could be mentors. They could be paid an allowance equal to half the
rate of a teacher in charge of a key learning area in a DET school, this would be equal to
$1523 per annum as at 1/1/2005. The additional cost to the teaching wage bill would only
be between 0.125 and 0.25 of a percent64.
(c) Reduced face-to-face teaching in the first year
The first year is generally the most difficult year for the beginning teacher, as they learn to
adapt to the expectations of being a high school teacher. The normal load for a teacher in
high schools in NSW is 20 hours of face-to-face teaching a week. This is quite a load for a
new teacher who has to prepare new work for all their teaching subjects as well as learn
how to adjust to the other demands of teaching. One way to alleviate this pressure would
be to reduce the amount of face-to-face teaching for a beginning teacher to 16 hours a week
in the first year. This would allow more time for preparation of lessons, marking etc. and
time to seek assistance from their mentor teacher in developing their teaching. The
estimated cost of such a program would vary from year to year depending on the number of
first year teachers employed in high schools. Again the lack of available data on this is a
problem. MCEETYA (2003) estimate that approximately 5.2 percent of public high school
teachers in NSW left teaching completely in 2001 and needed to be replaced. They
estimate that approximately 70 percent of the replacements came from new graduates.
Based on these figures, a four-hour reduction for new graduate teachers would increase the
64 This assumes that the average salary for a high school teacher as at 1/1/2005 would be approximately $60,000 and between five and ten percent of teachers would be mentor teachers.

351
teaching wage bill for NSW public high schools by less than 0.75 percent. The cost for
non-government schools in NSW would most likely be slightly higher as they have a higher
annual percentage of replacement teachers.
The overall cost of the recommendation to adopt a mentor teacher program and reduce
face-to-face teaching for new graduates is likely to add only about one percent to the cost of
teacher employment in NSW high schools. The possible benefits in terms of more satisfied
beginning and experienced teachers and lower teacher resignation rates could easily
outweigh the cost.
8.2.2.3 Lower Levels of Teacher Satisfaction in Rural Areas
There is significant evidence that teachers in country schools are the least satisfied,
especially in regard to support from administration, support from pupils’ parents, and the
attitude of students (Chapter 6).
Policy recommendation 6
The NSW Government should provide greater support for teachers in rural areas. The first
stage would require research to be funded to find ways to improve the relationships
between rural teachers and administrators, parents and the general community.
It is likely the attitudes of the students towards teachers and school reflect their parents’
attitudes and those in the general community. Positive promotional campaigns about the

352
work teachers do in the schools and the value of education should be undertaken to improve
the attitudes of both parents and students towards teachers and education in general. There
is, however, also a need for greater research into the reasons for lower levels of satisfaction
among teachers in rural areas and the low level of satisfaction that they have in regard to
support from administration. The isolated nature of many schools could contribute to this
so a greater effort may be needed or new policies to break down these barriers between
teachers and the administrators of schools.
8.2.2.4 Declining Percentage of Male High School Teachers
This research suggests that the decline in the proportion of male high school teachers is at
least in part a result of the decline in the wage of male teachers relative to male average
weekly earnings. Male teachers are also more influenced by the level of wages compared
to female teachers. If it is considered desirable or necessary to increase the proportion of
male teachers in high schools, then increased relative wages may be one way.
Policy recommendation 7
School administrators should introduce policies that encourage more males to enter
teaching. These policies include:
• more flexible salary/employment packages, and
• equal numbers of teacher scholarships for males and females.

353
While an increase in the relative wage of all teachers is likely to lead to an increase in the
numbers of teachers, it is not necessarily going to improve the male/female teacher ratio.
No doubt a policy that advocates salary increases for male teachers only, even though their
earnings have been declining more in comparison to their male counterparts, would be
considered as gender discrimination and illegal. An alternative approach is the
development of salary/employment packages that suit the individual preferences of the
teachers. For some this may involve longer periods of paid parental leave being traded off
for salaries. Other teachers may be willing to trade off a part of their holidays for
additional remuneration and visa versa. Policy recommendation 4, introduced earlier in this
chapter, advocating paid overtime, is more likely to benefit male teachers as they are
already working on average longer hours in teaching, and a higher proportion of males seek
additional income in other employment. This policy could act as an incentive to increase
the proportion of male teachers in high schools.
In an attempt to increase the number of male primary school teachers, Sydney Catholic
Education Office offered the same number of male and female teacher scholarships (to
overcome anti-discrimination legislation). A similar policy could be implemented in regard
to teacher scholarships in secondary education.
8.2.3 System Issues
There are considerable differences in levels of teacher satisfaction between the school
systems. Private schools have the most satisfied teachers and public schools the least

354
satisfied. The areas that public school teachers are least satisfied include (Tables 6.40-
6.46):
• level of salary;
• support from administration;
• the attitude of students;
• the satisfaction of student achievement;
• the support of pupils’ parents;
• the attitude of the general public; and
• the possibility of promotion.
While there is little that can be done about some of the factors, due to the universal nature
of the public school system, such as the attitude of students and the satisfaction of student
achievement, there are other areas that can be changed. The level of salary is generally
higher in private schools so improvements in this area would require an increased
allocation of funds from the State Government to the public school system. Some
recommendations for improvements in salary have already been discussed in the previous
section. It is likely however that the gap between the two systems over wages would
continue as the private schools offer the higher wages to attract better staff and are likely to
match increase in the salaries of public school teachers. There is, however, scope for
improvements in the areas of:
• support from administration;
• the support of pupils’ parents;
• the attitude of the general public; and

355
• the possibility of promotion.
8.2.3.1 Low Levels of Satisfaction in the Relationships between Teachers and the
Administration, General Public, and Parents in Public Schools
Some of the lower relative satisfaction levels in public schools in regards to administration,
the support of parents, and the general public could be related to the generally negative
media coverage public schools receive in comparison to Catholic and other private schools.
Some of this is a result of conflicts over wages and working conditions between public
school teachers and the State Government. For example in the 2004 teachers ‘work value’
industrial case in NSW, the State Government opposed the level of teacher wage rises
where as the Catholic employers were supportive. The independent schools tend to offer
individual workplace contracts or negotiate individual enterprise agreements. This not only
suggests to public school teachers that the Government does not think that they are worth
higher wages but also may suggest to the general public and parents that public school
teachers are demanding more money than they are worth. In addition industrial conflict
often contributes to a worsening of the relationship between the employer and employees.
Policy recommendation 8
Administrators should introduce policies that encourage more cooperation between teachers
and the administrators of schools and provide more support for teachers. These policies
could include:

356
• positive advertising campaigns dealing with the value of teachers to the community;
• improved industrial relations processes;
• more autonomy to public school principals and greater consultation between school
administrators and teachers; and
• greater flexibility for teachers to move between schools.
First, positive advertising campaigns regarding the work and value of teachers to the
community could not only encourage more university graduates to enter teaching but may
also produce a more positive attitude from parents and the general public. If teachers feel
that they are appreciated by their students, parents and the community in general, their
overall level of satisfaction and utility associated with teaching will be enhanced
Second, industrial relations disputes by their nature tend to be areas of conflict. There
needs, however, to be more positive comments about the value of teachers in these
disputes, while recognising the need to balance this with the budgetary constraints of the
employer. In this environment the importance of nonwage amenities as a trade-off for
higher wages is crucial.
Third, the issue of administration is more complex in the public school system. In the
Catholic school system, and even more so in independent schools, the main administration
impacting on teachers is school based. The principal is responsible for most, if not all,
areas of employment and promotional appointments and administration in the school. The
principal and staff have closer contact and decisions are generally made in consultation

357
with each other. This tends to improve relationships between administration and teachers.
The public school system should give greater autonomy to school principals to employ staff
and decide on promotional appointments. More decision-making should also be made in
consultation with the school community and not predominately at Departmental level. The
possibility of community based school boards similar to those that exist in the USA, and in
many private schools in NSW, could also improve the relationship with staff, parents and
the public, if all three groups were represented on the boards.
Fourth, some conflict between school administration and individual teachers is always
likely to occur. In the Catholic and independent school system, if teachers do not like the
administration of the school or the school working environment then they can apply for a
job at another school. The ability to change schools may increase the level of satisfaction
of teachers and also reduce conflict in a school. It is more difficult to change between
public schools. A teacher has to apply for transfer through a central registry and, if they are
granted a transfer, they must remain in the school for a minimum of three years. Increased
flexibility in the transfer system could increase teacher satisfaction. The current system is
set up to ensure that teachers will be available in all schools in NSW, but it does not
consider whether the teachers are teaching in their subject areas or whether they are happy
to be teaching in that school. Greater flexibility in the transfer system accompanied by
increased wage flexibility could ensure sufficient qualified teaching staff and more satisfied
and productive teachers.
358
8.2.3.2 Increased Flexibility in Trade-offs between Wages and Nonwage Amenities
The individual utility of a teacher is determined by the individual preferences for wages and
nonwage amenities. For some individuals higher wages give greater utility than increased
nonwage amenities. For others they may increase their utility by trading-off wages for
longer holidays or shorter working hours.
Policy recommendation 9
School system administrators should increase nonwage amenities for teachers and improve
trade-offs between salaries and nonwage amenities.
Improvements in utility for workers and thus the movement to higher indifference curves
could also occur as a result of greater flexibility in nonwage benefits. These may be
achievable with little or no increase in school budgets. Many organisations have set
benefits that apply to all workers. Greater utility could be achieved for some workers, if
they were able to trade-off some of those benefits for increased wages and visa versa. If
organisations consider the marginal cost of providing benefits, then they could have lower
relative costs by offering certain benefits. For example, a retail firm may give its workers
discounts on merchandise; schools could offer free education for children of teachers in a
particular education system. The teachers who accept this benefit would trade-off wages or
another benefit to have free education for their children. The marginal cost for a school of
having an additional student would be low compared to the trade-off in salary that could be

359
saved by the school. While this would be limited in the public school system in NSW, it
would be a potential benefit for both teachers and administrators in the Catholic and
independent systems, as an incentive to work in that system and also to send their children
to school in that system. If the schools had excess capacity, the cost of the extra student
would only be equal to the marginal cost to the school. The teachers could be offered this
as an alternative trade-off to higher money wages being paid to them.
Job sharing arrangements for parents with children are another common example of a trade-
off that has already been implemented in a number of schools that has provided a more
satisfying working relationship for those teachers. Provisions such as salary sacrificing,
trade-offs between work hours/holidays and wages, and maternity/paternity leave
provisions could all improve teacher satisfaction, retention rates, and the educational
outcomes achieved by students.
8.2.4 Individual School Issues
In all systems there are some schools where teachers are relatively more satisfied,
independent of any geographic or socio-economic factors, than in others. It often relates
back to the administrative and human resource management styles of the principals and the
other teachers in positions of special responsibility. Many teachers have progressed in their
career based on years of experience or capabilities as a classroom teacher. The skills
required for teaching a group of students are not identical to those required to manage a
school or a department. In many cases teachers have limited amounts of extra training to

360
manage these positions. In addition in some schools there is little evaluation of the
effectiveness of the administration or the management structure of the school.
Policy recommendation 10
Principals and teachers in positions of authority should undergo training in school
administration and human resource management. In schools where the principal lacks the
ability or time to administer the financial or business aspects of the school a business
manager should be appointed to assist the principal.
It is normal business practice that the chief executive officer of an organisation would not
be responsible for the day-to-day management of all aspects of the business. That
responsibility is passed on to section managers or executives. The benchmarking exercise
conducted by Horsley and Stokes (2005) found that the job requirements of a high school
principal far exceeded the requirements of other job positions on similar salary levels.
Some of the responsibilities of principals should be passed onto other administrators in a
school, such as a business manager.
Individual schools should also take more responsibility for the welfare of their staff,
especially relatively inexperienced teachers, where there is the highest resignation rate.
Policy recommendation 5 has already presented some ways that this could be applied.
They include:
(a) a formal induction process;
(b) a mentor teacher; and

361
(c) reduced face-to-face teaching time in the first year of teaching.
In addition new teachers should not be given the left over classes on the timetable that the
other teachers do not want to have. They should be given a balanced load considering their
limited level of experience.
Trainee teachers on their practicum should also be given sufficient support and mentoring,
and encouraged to become competent teachers. Schools should see the opportunity of
having trainee teachers as a chance for teachers to share their experience with new teachers
and also an opportunity to perhaps learn some new approaches to teaching from the
trainees. Staff should be allocated to this process because of their ability and enthusiasm,
not just for the extra income that can be earned.
8.3 Conclusion
The NSW high school teacher labour market is highly regulated in terms of the allocation
of staff to schools, salary scales, and the administration of schools. There is a need for
greater decentralisation of the administrative processes and increased flexibility in
remunerations and nonwage amenities available to teachers. Policies to improve levels of
teacher satisfaction are required to retain the teachers currently in the system and to attract
new teachers to the profession. Increased levels of teacher satisfaction are associated with
a higher quality of teaching and improved educational outcomes.

362
There are many challenges facing the high school teacher labour market in NSW, not the
least of which is the likelihood of increased shortages of teachers at least in some discipline
and geographical areas. There is a need for a co-ordinated response to the challenges
facing the teach labour market and the quality of education in high schools, not only in
NSW but also throughout Australia. As the National Center for Education Statistics in the
USA states "a high quality teaching staff is the cornerstone of a successful education
system...(and that)…attracting and retaining high quality teachers is, thus, a primary
necessity for education.”(1997:1) The policy recommendations of this thesis provide
direction in achieving these outcomes.

363
List of References American Teacher (2001). “Supply and demand: The teacher shortage.” American Federation of Teachers, viewed 13 August 2003, http://www.aft.org/publications/american_teacher/mar01/supply.html. Antos, J. R. and S. Rosen (1975). "Discrimination in the market for public school teachers." Journal of Econometrics 3: 123-150. Ashton, P. T. and R. B. Webb (1986). Making a Difference: Teachers' Sense of Efficacy and Student Achievement. New York, Longman. Australian Bureau of Statistics (2001). Australian Social Trends 2001. Cat.No. 4102.0. Canberra Australian Bureau of Statistics (2002). Education and Training Indicators Australia 2002. Cat.No 4230.0. Canberra. Australian Bureau of Statistics (2003a). Year Book Australia 2003. Cat.No. 1301.0. Canberra. Australian Bureau of Statistics (2003b). Australian Social Trends 2003. Cat.No. 4102.0. Canberra. Australian Bureau of Statistics (2003c). 2001 Census. Canberra. Australian Bureau of Statistics (various). Australian Economic Indicators. Cat.No. 1350.0. Canberra. Australian Bureau of Statistics (various). Employee Earnings and Hours. Cat.No. 6306.0. Canberra. Australian Bureau of Statistics (various). The Labour Force. Cat.No. 6203.0. Canberra. Australian Bureau of Statistics (various). Schools Australia. Cat.No. 4221.0. Canberra. Australian Human Rights and Equal Opportunity Commission (1999). “Rural and remote education NSW.”Viewed 6 July 2003, http://www.hreoc.gov.au/human_rights/rural_education/nsw/moree1.html. Australian Secondary Principals' Association (1999). “Teachers: Supply and demand in Australian public schools.” Viewed 10 July 2003, http://www.aspa.asn.au. Baird, J. (2001). “Catholic school closed by teacher shortage.” Sydney Morning Herald. 16 June: 16-17. Barro, S. M. (1992). “Models for projecting teacher supply, demand and quality: An assessment of the state of the art.” Proceedings of the Teacher Supply, Demand and

364
Quality: Policy Issues, Models, and Databases Conference, Washington, D.C., National Academy Press. Baumgart, N. (1995). Staffing of NSW Public Schools: A Review. Sydney, NSW Department of School Education. Beaudin, B. (1993). "Teachers who interupt their careers: Characteristics of those who return to the classroom." Educational Evaluation and Policy Analysis 15(1): 51-64. Becker, G. S. (1976). The Economic Approach to Human Behavior. Chicago, University of Chicago Press. Bladen, J. (2001). “Re: Mathematics and Science Retraining Programs.” Sydney, Australian Catholic University. Bobbitt, S. A. and M. M. McMillen (1994). Qualifications of the Public School Teacher Workforce: 1988 and 1991. Washington D.C., National Center for Education and Statistics. Boland, J., J.Dawkins et al. (2000). Returns to Investment in Higher Education. Melbourne, University of Melbourne. Boland, J., (2001). New Estimates of the Private Rate of Return to University Education in Australia. Melbourne, University of Melbourne. Borjas, G. J. and J. J. Heckman (1978). "Labor supply estimates for public policy evaluation." Proceedings of the Industrial Relations Research Association. Madison, Wis., Industrial Relations Research Association. Bridge, G. R., C. M. Judd, et al. (1979). The Determinants of Educational Outcomes: The Impact of Families, Peers, Teachers, and Schools. Cambridge, Mass., Balinger Publishers. Buckingham, J. (2002). "Getting it right some of the time - An appraisal of the report on the inquiry into the education of boys." Issue Analysis (27): 1-4. Burke, G. (1994). "Teachers: Employment in the 1980's and 1990's." The Workplace in Education - Australian Perspectives. Sydney, Edward Arnold: 146-156. Campbell, C. M. III (1997). "Variations in wage rigidity by occupation and union status in the US." Oxford Bulletin of Economics and Statistics 59 (1): 133-47. Canavan, K. (2004). “Shortage a growing problem.” The Daily Telegraph. 14 April: 20. Carnegie Task Force on Teaching as a Profession. (1986). “A nation prepared: Teachers for the 21st century.” New York, Carnegie Forum on Education and the Economy. Catholic Education Commission, NSW. (2002). “How Catholic schools are funded.” Viewed 8 July 2003, http://www.cecnsw.catholic.edu.au/funding/who%20funds.html.

365
Catholic Education Commission, NSW. (2003). “Statistics on Catholic Schools.” Viewed 8 July 2003, http://www.cecnsw.catholic.edu.au. Catholic Education Office Parramatta (2003). Teacher Application Package: Teaching is a Work of Heart. Parramatta, Catholic Education Office Parramatta. Chambers, J. G., Ed. (1981a). Cost and Price Level Adjustment to State Aid for Education: A Theoretical and Empirical Review. Cambridge, Mass., Balinger Publishers. Chambers, J. G. (1981b). "The hedonic wage technique as a tool for estimating the costs of school personnel: A theoretical exposition with implications for empirical analysis." Journal of Education Finance 6(3): 330-54. Chapman, B. and T. Salvage. (1997) “The consequences of recent changes in financing for Australian higher education.” mimeo, Centre for Economic Policy Research, Australian National University. Choy, S. P., S. A. Bobbitt, et al. (1993). America's Teachers: Profile of a Profession. Washington D.C., National Center for Education Statistics. Clark, J.B. (1899). “Salaries of teachers.” Columbia University Quarterly 1(2): 111-112. Commonwealth Quality Teacher Programme (2001). “Teachers for the 21st century.” DEST, viewed 8 July 2003, http://www.qualityteaching.dest.gov.au/Content/. Council on the Cost and Quality of Government (1998). “Performance Reports: School Education.” NSW Government, viewed 12 August 2003, http://www.ccqg.nsw.gov.au/performance_reports/school_education/school_education_05_04.htm Crowley, R., (Chair) (1998). “A Class Act - Inquiry into the status of the teaching profession.” Canberra, Senate Employment, Education and Training Reference Committee. Darling-Hammond, L. and L. Hudson (1990). "Precollege science and mathematics teachers: Supply, demand and quality." Review of Research in Education 16: 223-264 Department of Education Science and Training (DEST) (2003). “Higher Education Statistics Collection.” Department of Education Science and Training, viewed 15 July 2003, http://www.dest.gov.au/highered/statpubs.htm. Department of Education Science and Training (DEST) (2003). “Commonwealth Supported Places.” Department of Education Science and Training, viewed 18 August 2004, http://www.dest.gov.au/highered/css/default.htm#1_2. Department of Immigration and Multicultural Affairs (2001). “Skilled Labour: Gains and Losses - Aggregate Movements.” Department of Immigration and Multicultural Affairs, viewed 14 August 2003, http://www.dima.gov.au/research/publications/skilledlab/skilledlab4.htm#.

366
Department of Education Training and Youth Affairs (2000). “DETYA Survey of State and Territory Education Authorities.” Canberra, Department of Education Training and Youth Affairs. Department of Employment and Workplace Relations (DEWR) (various). "National and State Skill Shortage Lists Australia." Viewed at http://www.workplace.gov.au/WP/Content/Files/WP/EmploymentPublications/NSSICTupdatedtoctober2004V2.pdf#search='National%20and%20State%20Skill%20Shortage%20Lists%20Australia' Dinham, S. (1995). "Time to focus on teacher satisfaction." Unicorn 21(3): 64-75. Dinham, S. (1997). "Teaching and teachers' families." Australian Educational Researcher 24 (2): 59-88. Dinham, S. and C. Scott (1996). The Teacher 2000 Project: A Study of Teacher Satisfaction, Motivation and Health. Sydney, University of Western Sydney, Nepean. Dinham, S. and C. Scott (1997). “Modelling teacher satisfaction: Findings from 892 teaching staff at 71 schools.” Proceedings of American Educational Research Association Annual Meeting, Chicago. Dinham, S. and C. Scott (1998). “The relationship between context, type of school and position held in school and occupational satisfaction, and mental stress.” Proceedings of ACE/ACEA National Conference, Darwin. Directorate for Education, Employment, Labour and Social Affairs Education Committee (2002). Teacher Demand and Supply: Improving Teaching Quality and Addressing Teacher Shortages. Paris, OECD. Doeringer, P. B. and M. J. Piore (1971). Internal Labour Markets and Manpower Analysis. Lexington, D.C. Heath and Co. Ehrenberg, R. G. and R. S. Smith (2000). Modern Labour Economics. Reading, Mass., Addison Wesley Longman. Ewing, R. and D. Smith (2003). "Retaining early career teachers in the profession." English Teaching Practice and Critique 2 (1): 15-32. Fenge, R. and W. Ochel (2001). "Die vereinbarkeit von familie und beruf: schlussel fur eine kinderreiche gesellschaft." Schnelldienst 12: 17-29. Ferguson, R. F. (1991). "Paying for public education: New evidence on how and why money matters." Harvard Journal on Legislation 28 (2): 465-498. Ferguson, R. F. (1998). “Can schools narrow the black-white test score gap?” In C. Jencks and M. Phillips, (Eds.), The Black-White Test Score Gap. Washington, D.C., The Brookings Institution: 318-374.
367
Filer, R. K. (1985). "Male-female wage differences: The importance of compensating differentials." Industrial and Labor Relations Review 38: 426-437. Frank, R. H. (1996). "What price the moral high ground?" Southern Economic Journal 63 (1): 1-17. Ginzberg, E. (1976). The Human Economy. New York, McGraw-Hill. Goldhaber, D. D. and D. J. Brewer (1997). "Why don't schools and teachers seem to matter? Assessing the impact of unobservables on education." Journal of Human Resources 32 (3): 505–523. Goldhaber, D. D. and D. J. Brewer (2000). "Does teaching certification matter? High school certification status and student achievement." Educational Evaluation and Policy Analysis 22 (2): 129-145. Graduate Careers Council of Australia (2002). “Graduate Destination Survey 2002.” Graduate Careers Council of Australia, viewed 15 July 2003, http://www.gradlink.edu.au/. Gustafsson, S. (1985). Institutional Environment and the Economics of Female Labor Force Participation and Fertility: A Comparison between Sweden and West Germany. Berlin, Wissenschaftszentrum. Hall, R.E. (1973). "Wages, income and hours of work in the US labor force," in G.G. Cain and H.W. Watts (Eds.) Income Maintenance and Labor Supply. Chicago, Rand McNally. Hanushek, E. A. (1997). "Assessing the effects of school resources on student performance: An update." Educational Evaluation and Policy Analysis 19 (2): 141-64. Hanushek, E. A., J. F. Kain, et al. (2001). “Why public schools lose teachers.” NBER Working Paper Series. National Bureau of Economic Research. Cambridge: 1-37. Horsley, M. and A. Stokes (2005). "Teacher salaries: A benchmarking approach." Australian Journal of Political Economy 55 (1): 94-122. House of Representatives Standing Committee on Education and Training 2002 (2002). “Boys: Getting it right.” Report on the Inquiry into the Education of Boys. Canberra, The Parliament of the Commonwealth of Australia. Human Rights and Equal Opportunity Commission (2000). National Inquiry into Rural and Remote Education, viewed 7 March 2003 http://www.hreoc.gov.au/word/human_rights/rural_remote/emerging_themes.doc Industrial Relations Commission of NSW (2000). Crown Employees (Teachers in Schools and TAFE and Related Employees) Salaries and Conditions Award, viewed 7 March 2003, https://www.det.nsw.edu.au/media/downloads/employment/awardcon/cremsalconaward.pdf

368
Industrial Relations Commission of NSW (2004). Crown Employees (Teachers in Schools and TAFE and Related Employees) Salaries and Conditions Award NSWIRComm 114. Industrial Relations Commission of NSW. Sydney, Industrial Relations Commission of NSW. Ingersoll, R. (1999). "The problem of underqualified teachers in American secondary schools." Educational Researcher 28 (2): 26–37. Johnson, D. E. (1998). Applied Multivariate Methods for Data Analysis. Pacific Grove, CA, Daxbary Press. Johnson, P. and R. Lloyd (2000). “Does higher education pay? Results from the returns to education model.” Paper presented at 29th Conference of Economists. Kaufman, B. E. and J. L. Hotchkiss (2000). The Economics of Labor Markets. Orlando, Dryden Press. Keeley, M. C. (1981). Labor Supply and Public Policy. New York, Academic Press. Keller, G. and B. Warrack (1997). Statistics for Management and Economics. Belmont, CA, Duxbury Press. Kershaw, J. A. and R. N. McKean (1962). Teacher Shortages and Salary Schedules. New York, McGraw-Hill. Killingworth, M. R. (1983). Labor Supply. Cambridge, Cambridge University Press. Landon, J. H. and R. N. Baird (1971). "Monopsony in the market for public school teachers." American Economic Review 61 (5): 966-971. Lester, R. (1946). "Shortcomings of marginal analysis for wage-employment problems." American Economic Review 36 (1): 63-82. Lewis, E. and J. Butcher (2002). “Who'd be a teacher? A survey of year 12 students.” ICP Online, viewed 18 May 2004, http://www.icponline.org/feature_articles/f4_03.htm. Lewis, P. and K. Norris (1992). "Demand, supply and adjustment in the teachers labour market." Australian Journal of Education 36 (3): 260-277. Lewis, P., A. Daly et al. (2004) “Why study economics? The private rate of return to an economics degree.” The Centre for Labour Market Research. University of Western Australia. Littler, C., R. Dunford, et al. (1997). "The dynamics of downsizing in Australia and New Zealand." Asia Pacific Journal of Human Resources 35 (1): 65-79. Luizer, J. and R. Thornton (1986). "Concentration in the labour market for public school teachers." Industrial and Labor Relations Review 40 (3): 573-588.

369
Lutz, M. and K. Lux (1979). The Challenge of Humanistic Economics. Menlo Park, California, Benjamin/Cummings. Mabry, B. (1968). "Income-leisure analysis and the salaried professional." Industrial Relations 8 (2): 162-173. Maglen, L. (1994). ‘Education expansion and the private rate of return.” Economic Papers 13: 57-71. Marmot, M., H. Bosma, et al. (1997). "Contribution of job control and other risk factors to social variations in coronary heart disease incidence." Lancet 359: 235-39. Marmot, M. and T. Theorell (1988). "Social class and cardiovascular disease: the contribution of work." International Journal of Health Services 18 (4): 659-674. Mayer, D. P., J. E. Mullins, et al. (2000). Monitoring School Quality: An Indicators Report. Washington, DC, National Center for Education Statistics, USA Department of Education. McConnell, C. R., S. L. Brue, et al. (2003). Contemporary Labor Economics. New York, McGraw-Hill. McKinnon, J. (2003)(unpub.). “Schools Data.” Sydney, Broken Bay Catholic Education Office. McMullen, T. (2002). "How can we ensure the continuing supply of high quality young teachers?" The Practising Administrator 24 (2): 1-10. McTaggart, D., C. Findley, et al. (2003). Economics. Sydney, Addison Wesley. Miller, P. (1982) “The private rate of return to education: Evidence from the 1976 Census.” Australian Economic Review (3): 23-32. Miller, R. L. and R. E. Meiners (1986). Intermediate Microeconomics. New York, McGraw-Hill. Ministerial Council on Employment, E., Training and Youth Affairs (MCEETYA) (2001). Demand and Supply of Primary and Secondary School Teachers in Australia. Melbourne, prepared by the CESCEO National Teacher Supply and Demand Working Party. Ministerial Council on Employment, E., Training and Youth Affairs (MCEETYA) (2003). Demand and Supply of Primary and Secondary School Teachers in Australia. Melbourne, prepared by the CESCEO National Teacher Supply and Demand Working Party. Mitchell, D. E., F. I. Ortiz, et al. (1983). Work Orientation and Job Performance: The Cultural Basis of Teaching Rewards and Incentives. A report to the National Institute of Education. The National Institute of Education.

370
Monk, D. H. (1994). "Subject area preparation of secondary mathematics and science teachers and student achievement." Economics of Education Review 13(2): 125–145. Murnane, R. J., J. D. Singer, et al. (1991). Who Will Teach? Cambridge, Harvard University Press. National Center for Education Statistics (1996). The Patterns of Teacher Compensation. Washington DC, USA Department of Education. National Center for Education Statistics (1997). Job Satisfaction Among American Teachers. Washington DC, USA Department of Education. National Center for Education Statistics (1997). Research and Development Report: Teacher Professionalization and Teacher Committment: A Multilevel Analysis. Washington DC, USA Department of Education. National Center for Education Statistics (2002). Qualifications of Public School Teacher Workforce: Prevalence of Out-of-field Teaching 1987-88 to 1999-2000. Washington DC, USA Department of Education. National Center for Education Statistics (2004). Survey and Program Areas. Washington DC, USA Department of Education. Neuschatz, M. and M. McFarling (1999). “Maintaining momentum: High school Physics for a new millennium.” American Institute of Physics, viewed 18 August 2003, www.aip.org/statistics. Norris, K. (2000). Economics of Australian Labour Markets. Sydney, Pearson Education Australia. NSW Department of Education and Training (2002). NSW Submission to the Commonwealth Review of Teaching and Teacher Education. Submission number RTEE141, viewed 12 March 2003, https://www.det.nsw.edu.au/media/downloads/reviews/nswsubhighered.pdf NSW Department of Education and Training (2002). NSW Department of Education and Training, viewed 8 July 2003, http://www.det.nsw.edu.au/ministerial/yr2002/aug/fast_track.htm. NSW Government (2000). “State Super.” SAS Trustee Corporation, viewed 8 July 2003, http://www.statesuper.nsw.gov.au/html/aboutfund.html. Ostroff, C. (1992). "The relationships between satisfaction attitudes and performance: An organizational level analysis." Journal of Applied Psychology 77: 963-974. Parker, M. (2004). “New boss, same old problems.” The Daily Telegraph. 28 April 2004: 22.
371
Preston, B. (2000). Teacher Supply and Demand to 2005: Projections and Context. Canberra, Australian Council of Deans of Education. Productivity Commission (1997). Submission to the Review of Higher Education Financing and Policy, viewed 1 August 2005, http://www.pc.gov.au/ic/research/submission/highered/ Ramsey, G. (2000). Quality Matters. Revisiting Teaching: Critical Times. Sydney, NSW Department of Education. Rosen, S. (1974). "Hedonic prices and implicit markets." Journal of Political Economy 82 (1): 33-55. Simon, H. (1979). "Rational decision making in business organizations." American Economic Review 69 (4): 493-513. Sloan, J., M. Baker et al. (1990). Study of the Labour Market for Academics. Canberra, AGPS. Stinebrickner, T. (2001). "A dynamic model of teacher labor supply." Journal of Labor Economics 19 (1): 196-230. Stockburger, D. W. (1998). “Multivariate statistics: Concepts, models and applications.” South Western State University, viewed 20 May 2004, http://www.psychstat.smsu.edu/multibook/mlt00.htm.
Straker, N. (1991). "Teacher supply in the 1990s: an analysis of current developments" in Grace, G. and M Lawn (Eds.), Teacher Supply and Teacher Quality: Issues for the 1990’s. (17-31). Exeter: Short Run Texts.
The Independent Schools Council of Australia (ISCA) (2003). “Funding of Independent Schools.” Viewed 8 July 2003, http://www.ncisa.edu.au/. Topel, R. H. and M. P. Ward (1992). "Job mobility and careers of young men." Quarterly Journal of Economics 107 (2): 439-479. Totaro, P. (2003). “Carr's call centre plan to free up principals.” Sydney Morning Herald. 6 February 2003, viewed at http://www.smh.com.au/articles/2003/02/05/1044318669385.html?oneclick=true. UNESCO-ILO (2002). UNESCO-ILO Study on Global Teacher Shortage. UNESCO–ILO, viewed 4 June 2003, http://www.ei-ie.org/educ/english/eedindex.htm#UNESCOILO Universities Admission Centre (2003). “UAI 2003.” Sydney, Universities Admission Centre, viewed 20 January 2004, http://www.uac.edu.au/releases/pdf/uai2003.pdf.

372
Vinson, T. (2002). Inquiry into the Provision of Public Education in NSW, viewed 8
January 2003, http://www.pub-ed-inquiry.org/ Wainwright, R. (2001). “Young teachers needed to fill void.” Sydney Morning Herald, viewed 2 November 2002, http://old.smh.com.au/news/0111/02/national/national6.html. Walberg, H. J. (1982). "Educational productivity: Theory, evidence and prospects." Australian Journal of Education 26 (2): 115-122. Walberg, H. J. (1984). "Improving the productivity of American schools." Educational Leadership 41 (8): 19-27. Webster, A. L. (1995). Applied Statistics for Business and Economics. Chicago, Irwin. Webster, B., M. Wooden, et al. (2004). “The labour market for Australian teachers.” Proceedings of the Making Schools Better Conference, Melbourne. Wei, X. (1999). "Estimating British workers' demand for safety." Applied Economics 31 (10): 1265. Wilton, P. and L. Wilton (2000). Guide to Schools 2000. Sydney, Fairfax Press. Wood, M. (2002). “Males quit teaching in droves.” Sun-Herald, viewed 22 September 2002, http://www.smh.com.au/articles/2002/09/21/1032054999588.html. Zabalza, A., P.Turnbull, et al. (1979). The Economics of Teacher Supply. Cambridge, Cambridge University Press. Zarkin, G. A. (1985). "Occupational choice: An application to the market for public school teachers." Quarterly Journal of Economics 100 (2): 409-46.

373
APPENDIX
A
TEACHER SURVEY

374
Teacher Survey
The following survey is intended for full time teachers in secondary schools in order to gauge the importance of various factors in their decision to continue their career as a teacher. Please fill in the relevant spaces with a tick or a number where appropriate.
1. Sex - Male .......... Female .......... 2. Age Under 30 .......... 30 - 39 .......... 40 - 49 .......... 50 - 59 .......... Over 59 .......... 3. Years of teaching experience 0 - 3 .......... 4 - 9 .......... 10 - 19 .......... 20 or more .......... 4. Highest qualification earned Diploma .......... Bachelors degree .......... Masters Degree or higher .......... Other (please specify)............................. .......... 5. Formal Education (teaching) qualification(s) (list as many as applicable) Masters Degree .......... Bachelors Degree .......... Graduate Diploma .......... Other Diploma .......... 6. Area of academic qualification(s) (list as many as applicable) Arts, Humanities .......... Science/Mathematics .......... Commerce/ Business/Economics .......... Law, Legal Studies .......... Computing ..........
375
Technical .......... Art .......... Music .......... Human Movement /Health .......... Religion .......... Other (please specify).................................. .......... 7. Salary Less than $25,000 .......... $25000 - $35000 .......... $35000 - $45000 .......... $45000 - $55000 .......... Over $55000 .......... 8. Do you supplement your basic salary with any other source of income? Yes .......... No (please go to question 10) .......... 9. What other income source(s) do you have? (Tick as many as applicable) Other school income .......... Other employment related to education .......... Income from non-education employment .......... 10. Is the total amount of additional income per year Under $1000 .......... $1000 - $3000 .......... $3001 - $6000 .......... Over $6000 .......... 11. The location of the school where you are currently teaching is Sydney - Inner city .......... North .......... South .......... East .......... West .......... Newcastle .......... Wollongong .......... Country ..........

376
12. Your place of residence is Sydney - Inner city .......... North .......... South .......... East .......... West .......... Newcastle .......... Wollongong .......... Country .......... 13. School type Public .......... Catholic Systemic .......... Other Private .......... 14. Percentage of students in your school from non-English speaking backgrounds less than 20% .......... 20% or more .......... 15. Main teaching field English/drama .......... Mathematics .......... Science .......... Economics/Business Studies .......... Other HSIE .......... Computing .......... Other TAS .......... Art or Music .......... Foreign languages .......... Vocational studies .......... PD/H/PE .......... Religion .......... Special Education or ESL .......... Other .......... 16. Main classes taught Years 7-10 .......... Years 11-12 .......... Years 7-12 ..........

377
17. How important are the following in measuring your job satisfaction? Rate 1-5 with: 5 - very important, 4 - some importance , 3 - neutral, 2 - little importance, 1 - very unimportant level of salary .......... job security .......... a low level of stress .......... number of holidays ......... hours of work .......... support and encouragement from administration .......... the attitude and support of peers .......... the attitude and support of students .......... the satisfaction of student achievement .......... the support of the pupils’ parents .......... attitude of the general public towards teachers .......... the support of your family .......... interest in the subjects taught .......... the possibility of promotion .......... 18. As a teacher, how would you rate your current level of satisfaction with each of the following. Rate 1 – 5 with: 5 - very high, 4 - moderately high, 3 - neutral, 2 - moderately low, 1 - very low. level of salary .......... job security .......... a low level of stress .......... number of holidays ......... hours of work ..........

378
support and encouragement from administration .......... the attitude and support of peers .......... the attitude and support of students .......... the satisfaction of student achievement .......... the support of the pupils’ parents .......... attitude of the general public towards teachers .......... the support of your family .......... interest in the subjects taught .......... the possibility of promotion .......... 19. How long do you plan to remain in teaching? As long as I am able .......... Until I am eligible for retirement .......... I’ll continue teaching until something better comes along .......... I definitely plan to leave teaching in the next 5 years .......... Undecided at this time .......... 20. If you had the opportunity to choose a career again, would you still become a teacher? Definitely .......... Probably would .......... Unsure .......... Probably would not .......... Definitely would not .......... 21. Do you consider that teachers’ salaries are very good .......... good .......... satisfactory .......... unsatisfactory .......... poor ..........

379
22. Would you leave teaching to go to an occupation that provided you with a 10% higher salary? Definitely .......... Probably would .......... Unsure .......... Probably would not .......... Definitely would not .......... 23. How difficult do you think it would be for you to change careers? very easy .......... fairly easy .......... unsure .......... fairly difficult .......... very difficult .......... 24. Have you changed from one education system to another? Yes .......... No (Please go to Q 28) .......... 25. Which system did you change from? Public .......... Catholic Systemic .......... Other Private .......... 26. Which system did you change to? Public .......... Catholic Systemic .......... Other Private .......... 27. Which of the following do you consider as important in your decision to change school systems? Rate 1-5 with: 5 - very important, 4 - some importance , 3 - neutral, 2 - little importance, 1 - very unimportant level of salary .......... job security .......... a low level of stress .......... number of holidays .........

380
hours of work .......... support and encouragement from administration .......... the attitude and support of peers .......... the attitude and support of students .......... the satisfaction of student achievement .......... the support of the pupils’ parents .......... attitude of the general public towards teachers .......... the support of your family .......... interest in the subjects taught .......... the possibility of promotion .......... change of residence .......... 28. Do you have any other comments to make in regard to this survey? ________________________________________________________________________________________________________________________________________________________________________________________________________________________________________________________________________________________________ Thank you very much for your co-operation in filling out this survey.

381
APPENDIX
B
ADDITIONAL TEACHER SURVEY DATA

382
Table B1 Distribution of Teachers Surveyed Based on Highest Qualification
Highest qualification Frequency Percent Valid percent Cumulative
percent Valid Diploma 20 7.4 7.5 7.5 Bachelors degree 201 74.7 75.0 82.5 Masters degree or higher 43 16.0 16.0 98.5 Other 4 1.5 1.5 100.0 Total 268 99.6 100.0 Missing System 1 0.4 Total 269 100.0 Table B2 Distribution of Teachers Surveyed Based on Education Qualifications
Education qualifications Frequency Percent Valid percent Cumulative
percent Valid Masters degree 38 14.1 14.2 14.2 Bachelors degree 175 65.1 65.3 79.5 Graduate diploma 46 17.1 17.2 96.6 Other diploma 9 3.3 3.4 100.0 Total 268 99.6 100.0 Missing System 1 0.4 Total 269 100.0 Table B3 Distribution of Teachers Surveyed Based on Area of Academic Qualification
Academic qualification Frequency Percent Valid percent Cumulative
percent Valid Arts, Humanities 123 45.7 45.9 45.9 Science, Mathematics 58 21.6 21.6 67.5 Commerce, Business,
Economics 6 2.2 2.2 69.8
Computing 5 1.9 1.9 71.6 Technical 10 3.7 3.7 75.4 Art 4 1.5 1.5 76.9 Music 2 0.7 0.7 77.6 Human Movement, Health 16 5.9 6.0 83.6 Other 16 5.9 6.0 89.6 Double degrees 28 10.4 10.4 100.0 Total 268 99.6 100.0 Missing System 1 0.4 Total 269 100.0

383
Table B4 Distribution of Teachers Surveyed Based on Salary
Salary Frequency Percent Valid percent Cumulative
percent Valid Less than $25000 2 0.7 0.7 0.7 $25000-$35000 9 3.3 3.4 4.1 $35000-$45000 42 15.6 15.7 19.9 $45000-$55000 117 43.5 43.8 63.7 Over $55000 97 36.1 36.3 100.0 Total 267 99.3 100.0 Missing System 2 0.7 Total 269 100.0 Table B5 Distribution of Teachers Surveyed Based on Place of Residence
Place of residence Frequency Percent Valid percent Cumulative
percent Valid Sydney - inner city 15 5.6 5.6 5.6 Sydney - north 36 13.4 13.4 19.0 Sydney - south 61 22.7 22.8 41.8 Sydney - east 14 5.2 5.2 47.0 Sydney - west 29 10.8 10.8 57.8 Newcastle 8 3.0 3.0 60.8 Wollongong 20 7.4 7.5 68.3 Country 85 31.6 31.7 100.0 Total 268 99.6 100.0 Missing System 1 0.4 Total 269 100.0 Table B6 Distribution of Teachers Surveyed Based on Non-English Speaking Background of Students
Non-English speaking Frequency Percent Valid percent Cumulative
percent Valid Less than 20% 146 54.3 56.2 56.2 20% or more 114 42.4 43.8 100.0 Total 260 96.7 100.0 Missing System 9 3.3 Total 269 100.0

384
Table B7 Distribution of Teachers Surveyed Based on their Main Teaching Field
Main teaching field Frequency Percent Valid percent Cumulative
percent Valid English/Drama 50 18.6 18.7 18.7 Mathematics 35 13.0 13.1 31.8 Science 29 10.8 10.9 42.7 Economics/Business studies
27 10.0 10.1 52.8
Other HSIE 34 12.6 12.7 65.5 Computing 7 2.6 2.6 68.2 Other TAS 17 6.3 6.4 74.5 Art/Music 13 4.8 4.9 79.4 Foreign languages 8 3.0 3.0 82.4 Vocational studies 3 1.1 1.1 83.5 PD/H/PE 15 5.6 5.6 89.1 Religion 2 .7 .7 89.9 Special education/ESL 5 1.9 1.9 91.8 English/other HSIE 11 4.1 4.1 95.9 Other 11 4.1 4.1 100.0 Total 267 99.3 100.0 Missing System 2 0.7 Total 269 100.0 Table B8 Distribution of Teachers Surveyed Based on Main Classes Taught
Main classes taught Frequency Percent Valid percent Cumulative
percent Valid Years7-10 41 15.2 15.6 15.6 Years 11-12 41 15.2 15.6 31.2 Years 7-12 181 67.3 68.8 100.0 Total 263 97.8 100.0 Missing System 6 2.2 Total 269 100.0

385
APPENDIX
C
UNIVERSITY STUDENT SURVEYS
(i) First year students (ii) Third/final year students

386
University Student Survey – First Year
The following survey is intended for university students in order to gauge their attitude towards pursuing a career as a high school teacher in NSW. Please fill in the relevant spaces with a tick or a number where appropriate.
1. Sex - Male .......... Female .......... 2. Age - Under 21 .......... 21 -29 .......... 30 - 39 .......... 40 - 49 .......... Over 49 .......... 3. Tertiary Entrance Rank / University Admissions Index (cross out whatever is not applicable) Under 40 .......... 40 - 49 .......... 50 - 59 .......... 60 - 69 .......... 70 - 79 .......... 80 - 89 .......... Over 90 .......... Other form of entry – please list …………………………………… 4. Area of academic qualifications of your current course (list as many as applicable) Education/Teaching ……..
Arts, Humanities .......... Science/Mathematics .......... Commerce/ Business/Economics .......... Law, Legal Studies .......... Computing .......... Technical .......... Art .......... Music ..........
Nursing .......... Human Movement /Health ..........
Religion …….. Other (please specify).................................. ..........

387
5. Your place of residence is Sydney - Inner city .......... North .......... South .......... East .......... West .......... Newcastle .......... Wollongong .......... Country .......... 6. The type of school that you attended Public .......... Catholic Systemic .......... Other Private .......... 7. Which of the following do you consider as important in your decision to pursue a particular career? Rate 1-5 with: 5 - very important, 4 - some importance, 3 - neutral, 2 - little importance, 1 - very unimportant level of salary .......... job security .......... a low level of stress .......... number of holidays .......... hours of work .......... the attitude and support of peers and friends .......... the attitude and support of the employer .......... attitude of the general public towards your career .......... the support of your family .......... interest in the work you do ..........
388
job satisfaction .......... the possibility of promotion .......... desire to help others .......... 8. How would you rate the following employment conditions for teachers in NSW high schools? Rate 1-5 with: 5 – well above average, 4 – above average, 3 - average, 2 - below average, 1 – well below average level of salary .......... job security .......... level of stress .......... number of holidays .......... hours of work .......... the attitude and support of peers .......... the attitude and support of students .......... the attitude and support of the employer .......... the support of the pupils’ parents .......... attitude of the general public towards teachers .......... the possibility of promotion ..........
job satisfaction ..........
9. Do you intend to pursue a career as a high school teacher? Yes …..... No …….. Unsure ….….

389
10. How did the following factors influence your decision in regard to becoming a teacher?
Rate 1-5 with: 5 – very positive, 4 – positive, 3 - neutral, 2 - negative, 1 – very negative.
the attitude of teachers at your school towards teaching …….. the attitude of your parents …….. your own experience of school …….. 11. Would higher salaries for teachers make you more likely to become a teacher? Yes …….. No (go to question 14) …….. Unsure …….. 12. What salary increase would lead you to become a high school teacher? At least 10% ……… 11-20% ………
21-40% ……… 41-60% ………
More than 60% ……… 13. If you became a teacher, what type of school would you like to teach in? Public .......... Catholic Systemic .......... Other Private …….. Any …….. 14. Do you have any other comments to make in regard to this survey? __________________________________________________________________________________________________________________________________________________________________________________________________________________________________________________________________________________________________________________________________________________________________________________ Thank you very much for your co-operation in filling out this survey.

390
University Student Survey – 3rd Year
The following survey is intended for university students in order to gauge their attitude towards pursuing a career as a high school teacher in NSW. Please fill in the relevant spaces with a tick or a number where appropriate.
1. Sex - Male .......... Female .......... 2. Age - Under 21 .......... 21 -29 .......... 30 - 39 .......... 40 - 49 .......... Over 49 .......... 3. Tertiary Entrance Rank / University Admissions Index (cross out whatever is not applicable) Under 40 .......... 40 - 49 .......... 50 - 59 .......... 60 - 69 .......... 70 - 79 .......... 80 - 89 .......... Over 90 .......... Other form of entry – please list …………………………………… 4. Area of academic qualifications of your current course (list as many as applicable) Education/Teaching ……..
Arts, Humanities .......... Science/Mathematics .......... Commerce/ Business/Economics .......... Law, Legal Studies .......... Computing .......... Technical .......... Art .......... Music .......... Human Movement /Health .......... Religion .......... Other (please specify).................................. ..........
391
5. Your place of residence is Sydney - Inner city .......... North .......... South .......... East .......... West .......... Newcastle .......... Wollongong .......... Country .......... 6. The type of school that you attended Public .......... Catholic Systemic .......... Other Private .......... 7. Which of the following do you consider as important in your decision to pursue a particular career? Rate 1-5 with: 5 - very important, 4 - some importance, 3 - neutral, 2 - little importance, 1 - very unimportant level of salary .......... job security .......... a low level of stress .......... number of holidays .......... hours of work .......... the attitude and support of peers and friends .......... the attitude and support of the employer .......... attitude of the general public towards your career .......... the support of your family .......... interest in the work you do .......... job satisfaction ..........

392
the possibility of promotion .......... desire to help others .......... 8. How would you rate the following employment conditions for teachers in NSW high schools? Rate 1-5 with: 5 – well above average, 4 – above average, 3 - average, 2 - below average, 1 – well below average level of salary .......... job security .......... level of stress .......... number of holidays .......... hours of work .......... the attitude and support of peers .......... the attitude and support of students .......... the attitude and support of the employer .......... the support of the pupils’ parents .......... attitude of the general public towards teachers .......... the possibility of promotion ..........
job satisfaction ..........
9. Do you intend to pursue a career as a high school teacher? Yes …..... No …….. Unsure ….….
10. How did the following factors influence your decision in regard to becoming a teacher?
Rate 1-5 with: 5 – very positive, 4 – positive, 3 - neutral, 2 - negative, 1 – very negative.

393
the attitude of teachers at your school towards teaching …….. the attitude of your parents …….. your own experience of school …….. 11.Would higher salaries for teachers make you more likely to become a teacher? Yes …….. No (go to question 14) …….. Unsure …….. 12. What salary increase would lead you to become a high school teacher? At least 10% ……… 11-20% ………
21-40% ……… 41-60% ………
More than 60% ……… 13. If you became a teacher, what type of school would you like to teach in? Public .......... Catholic Systemic .......... Other Private …….. Any …….. 14. Has your attitude towards becoming a teacher changed since you started university?
Yes ……..(Go to Q15) No ……..(Go to Q17)
15. In what way has your attitude changed? More positive …….. More negative …….. 16. What factors have caused your attitude to change? ______________________________ ________________________________________________________________________________________________________________________________________________________________________________________________________________________________________________________________________________________________________

394
17. Do you have any other comments to make in regard to this survey? __________________________________________________________________________________________________________________________________________________________________________________________________________________________________________________________________________________________________________________________________________________________________________________ Thank you very much for your co-operation in filling out this survey.
Recommended