Journal of Technology and Information Education
2/2017, Volume 9, Issue 2 ISSN 1803-537X
128
THE INFLUENCE OF INDIVIDUAL DIFFERENCES ON
TECHNICAL CREATIVITY IN SLOVENIAN K-9 STUDENTS
Stanislav AVSEC, University of Ljubljana, Faculty of Education, Slovenia
Klavdija MODIC, University of Ljubljana, Faculty of Education, Slovenia
Received: 26. 6. 2017/ Accepted: 24. 9. 2017
Type of article: original research DOI: 10.5507/jtie.2017.021
Abstract: This study aims to verify and understand the effect of individual
differences on technical creativity in Slovenian K-9 students. Students' learning
styles and their attitudes towards technology and engineering, which might have
implications in students for teaching and developing creativity, were investigated.
Despite of several approaches to teaching and of curriculum learning standards
in technical creativity, technology education courses still suffer from creativity
development needed for future creation of new technologies, and for inventions
of products. For the purpose of this study, an effective sample of n=177 secondary
school students in grade 6 and in grade 9 was collected. An empirical research
design was followed. A recently developed DSLI learning style inventory was used
for measuring learning styles, while student attitude towards technology and
engineering was surveyed with 25-item test. Students' creative potential was
measured with a standardised test of creative thinking-divergent production. The
results of the study on creativity show no significant (p>0.05) differences in
creative potential between sixth- and ninth-graders. Moreover, interest for
technology is not particularly positive for both groups of students, when a lack of
technology identification in sixth-graders appears significantly (p<0.05).
Students' learning styles were found as significant (p<0.05) predictors in students
creative potential. Students still feel perplexed with technology and the current
design and technology curriculum might not markedly influence student decision
to pursuit careers in technology and engineering.
Key words: technology education, technical creativity, learning styles, attitude.
VLIV INDIVIDUÁLNÍCH ODLIŠNOSTÍ U ŽÁKŮ ZÁKLADNÍCH
ŠKOL VE SLOVINSKU NA TECHNICKOU KREATIVITU
Abstrakt: Cílem studie bylo ověřit vliv individuálních odlišností na technickou
kreativitu. Byly zkoumány učební styly žáků a jejich postoje k různým technickým
oblastem (technika, technologie, konstruování). Podařilo se mj. zjistit, že žáci
mezi 6. – 9. ročníkem nevykazují žádné významné rozdíly v tvůrčím potenciálu.
Klíčová slova: technická výchova, technická tvořivost, učební styly, postoj.
* Author for correspondence: [email protected]
Journal of Technology and Information Education
2/2017, Volume 9, Issue 2 ISSN 1803-537X
129
1 Introduction
Creativity is an important influencer of the sustainable development of any
organisation, and along with innovation, it facilitates the transformation of individual
learning roles into desired future levels (Avsec & Šinigoj, 2016; Cropley, 2015).
Moreover, creativity was found as a top three employability skill in 21st century (Barbot,
Besancon, & Lubart, 2016), and it is emphasized in almost any subject matter curriculum
in K-9 education, including in curriculums of technology education. The real intent for
technology education is to prepare students to be technological literate and able to cope
with rapidly developing technological world not only as a user but also as a creative
contributor or designer (McGlashan, 2017). Despite of several curriculum learning
standards of technical creativity, and of several active approaches to teaching and learning,
the technology education courses still suffer from creativity development (Avsec &
Šinigoj, 2016).
The recent studies and experiences show that the school atmosphere and traditional
teaching do not enhance creativity and often even decline it (Avsec & Šinigoj, 2016;
McGlashan, 2017). A system of education is organized as a rigid and solid system, focused
only on learning outcomes assessed with marks, which are obtained gradually throughout
the study year. Students must follow this algorithmic way, and situations where student’s
creative potential might takes place are rather seldom. Assessment of learning outcomes is
highly demanded and teachers rather avoid assessing subjects where outcomes are
heterogeneous, multifaceted as technical creativity is. Creativity in Slovenian Primary
school (Key Stage K1-9) is not encouraged at all teaching subjects, therefore a role of
Design and technology (DT) subject matter with its methods of active, learner-centred
work and learning seem to be crucial. Creativity at DT should be strengthened primarily
by setting open problems, finding product improvements and new functionalities,
extending the scope and the range of use of the product.
In technology education, along with technological literacy as the most important
outcome, a creative ability should be developed, and it also reflects in the different
technical products/artefacts created by students. Moreover, Kallio and Metsarinne (2017)
stated that experiencing learner-centred learning predicts positive attitudes towards DT
subject matter. Students are more successful also in production exercises to create new
products or processes (Kallio and Metsarine, 2017), which might reflects technical
creativity as internal driven potential for proactive problem solving (Avsec and Šinigoj,
2016). Social learning and other-scaffolding learning might predict effective technical
products, technological knowledge, and skills as DT learning outcomes (Kallio and
Metsarinne, 2017).
Students have different levels of motivation, different attitude towards design and
technology (Ardies, De Maeyer, Gijbels, & van Keulen, 2015) and different reactions to
learning environments, including subject matter contents and practices (Szewczyk-
Zakrzewska & Avsec, 2016). Moreover, at least three facets of student diversity must be
considered, namely: learning styles, approaches to learning and orientations to studying,
and intellectual development (Felder and Brent, 2005). We should map first students'
abilities, and attitude to encourage every single student to launch dynamism of learning
styles in order to enhance social learning as scaffolding learning of evidence-based
practise. Students will improve if they think about how they learn (Szewczyk-Zakrzewska
& Avsec, 2016). Learning depends on what is being taught, how students prior-knowledge
is, how motivated they are in scaffolding learning. Thus, teachers must understand student

Journal of Technology and Information Education
2/2017, Volume 9, Issue 2 ISSN 1803-537X
130
differences and they must be able to adjust learning/teaching methods to meet and to boost
diverse learning needs of all of their students. Effective teacher utilizes information of
students learning styles to differentiate instruction with focusing on the content, students'
experiences and perception toward content or subject matter, on students' motivation to
learning (Avsec & Šinigoj, 2016; Ardies et al, 2015). Attitudes towards technology,
however, consist of different sub-aspects such as (1) affective-emotions or feelings, (2)
cognitive–beliefs or opinions held consciously, (3) conative– inclination for action, and (4)
evaluative–positive or negative response to stimuli, and research focussing on these
different aspects in an integrated manner is needed in order to provide insights into how
attitudes are formed.
In the present study we aim to verify and understand the effect of individual differences
on technical creativity in Slovenian K-9 students. Differences relate to the differences
between students and different groups of students. Regarding the different problems
suggested above, a background of technology education and creativity is given in the
following section.
2 Technology education and creativity
Slovenian K-9 technology education insight, teachers' backgrounds and role, and
students' personality and behaviour are described in the following subsections. All
aforementioned influencers might be decisive for creativity development.
Despite the critical importance of technology education in Europe and wider, a
mismatch between the technological knowledge, skills, and attitudes delivered by
education and training systems and those required by the labour market has been reported
in several countries also in Slovenia, where the latest school reform implemented in 1996
resulted in a marked decrease in the number of hours allotted to subject matter relating to
design, technology and engineering in primary schools. Just 1.73 % of hours in total taught
time are allocated to teaching compulsory technology education subjects in primary
schools (K-9), reflecting the lowest prioritisation of technology education across Europe
(Avsec & Jamšek, 2016). Along with old-fashion technology education curriculum it can
douse students' technical creativity and students' interest for technology. Correspondingly,
a number of students enrolled in secondary vocational and technical school decrease from
year to year. This trend has been seen also around the Europe, but some countries started
with technology education reconstruction, also some changes are proposed and centred on
International Technology and Engineering Educators Association standards for
technological literacy, where integrated performance-approach to study technology is
suggested as an appropriate (Dostal & Prachagool, 2016).
Primary school technology education (K–9) in Slovenia is two-sided. At the
elementary level of primary school (K–5) technology education is part of an integrated
learning domain called Natural Sciences and Technology. In K-3 education, 24 school
periods (45 minutes) per year are devoted to technology subject matter where 3 days (15
periods) per year of technology day activities are included. For K4-5, 82 periods are
integrated with natural sciences subject matter, where 4 technology days (20 periods) per
year are included (Eurydice, 2016). At the secondary level, DT is a compulsory subject for
grades 6–8 and is covered with a total of 140 school periods of 45 min over all three grades.
The DT curriculum comprises four interconnected areas/categories, namely technical
assets, technology for processing materials, work organisation and economics (Fakin,
Kocijančič, Hostnik & Florijančič, 2011). Students’ DT outcomes from grades 6–8 are
Journal of Technology and Information Education
2/2017, Volume 9, Issue 2 ISSN 1803-537X
131
assessed against 119 standard benchmarks (46 in grade 6, 34 in grade 7 and 39 in grade 8).
The very nature of DT, as it is presented within the curriculum, requires students to utilise
and demonstrate their declarative (knowing that) and procedural (knowing how) cognitive
knowledge. A substantial majority of benchmarks are positioned within the first three
levels of the revised Bloom taxonomy: to know, to understand and to apply (Krathwohl,
2002), while higher order thinking relating to DT is rarely required. During the last two
decades, no significant changes have been made to the structure and content of the DT
curriculum to upgrade benchmarks geared towards enhancing advanced abilities entailing
action, criticism, informed decision making, evaluation and management. Inappropriate
DT benchmarks and their implementation in the classroom could jeopardise the level of
technological literacy and technical creativity, which is crucial for enabling students to
choose a future career relating to technical and engineering studies and jobs (Luckay and
Collier-Reed, 2014; Yu, Lin, Han, & Hsu, 2012). Nevertheless, Slovenian government
proposed some changes to the educational system, aligned with European Union (EU)
education policy, which are focused on strengthening links between education and
business and industrial sector with (1) introduction of entrepreneurship, innovation and
creativity in pre-university technology education, (2) establishing of advanced training
centres as a part of school network, and (3) establishing systems which will enable
technology teachers to develop professionally at EU level (EURYDICE, 2014).
Today, there are many strategies and styles for teaching, but technology teachers still
strive for the traditional form, because it requires the least effort, the minimum time is
spent in the class, and the results of the teaching are immediately visible as technological
work (Norström, 2013). Moreover, a mismatch exists between students learning styles and
teachers learning styles what might affect efficacy of teaching/learning. Learning styles as
personal qualities influence the way of students' acting towards learning environment,
material, peers, and teachers (Felder & Brent, 2005). Several modalities of learning styles
exist where students may act as (1) concrete or abstract learners, (2) active or reflective,
(3) sequential or global thinker, (4) visual, aural, read/write preferences, (5) sensing or
intuitive, (6) sociological preferences of learning, (7) environmental preferences, (8)
emotional orientation, (9) perception of physical elements, and (10) psychological
elements of hemisphericity (Hawk & Shah, 2007). All aforementioned styles might affect
students learning and their success at technology education and technology teacher must
consider students learning styles also to instil creativity in technology education.
Technology education outcomes are more complex than only technological knowledge
and knowledge about technology which is used along work where students carry out e.g.,
different embodiments, models, products by testing and retesting to get a prototype, which
must be documented in a way of technical drawings, sketches, and photos. Technology
teacher must be more competent than he/she was in the past, due to new rapidly changing
technologies and only well trained and educated teacher might influence markedly student
learning. As the most important, teacher subject matter knowledge, pedagogical content
knowledge and teacher attitudes and self-efficacy strongly guide behaviour in the
classroom (Rohaan, Taconis, & Jochems, 2010). In last ten years Slovenian technology
teachers are well trained and proper educated to cope with all technical and technological
requirements. The other, very important aspect to be discussed is how to interpret
technology education outcomes, and here, additional pedagogical, philosophical, and
sociological view is needed to analyse the contexts what to teach and how to assess
outcomes (Norström, 2013) as they are knowledge, attitudes and skills where the creativity
Journal of Technology and Information Education
2/2017, Volume 9, Issue 2 ISSN 1803-537X
132
is found to be an essential element of any learning process. Creativity is an ability to invent
and be able to go beyond what is already known and it is also defined as the ability to
create a solution for a poorly defined problem or as an ability to identify new problems
(Jaarsveld, Lachmann, van Leeuwen, 2012). Cropley (2015) defined criteria for creative
products as the basic outcome of technology and engineering education as: (1) novelty as
an absolute prerequisite for creativity, (2) relevant and effective, (3) elegant, and (4)
genesis.
Teacher's creativity and creative behaviour might affect students' personality to
enhance their creativity (Avsec & Šinigoj, 2016). It was found by Rohaan et al. (2010) that
teacher's skills and self-efficacy along with their pedagogical content knowledge might
affect students' attitudes. Students are interested in technological products, but their
opinions on future careers in technical and engineering study and jobs are particularly
positive (Ardies et al., 2015). Moreover, it was found, that interest for DT declines over
study year, it appears more often for female students. Ardies et al. (2015) provided
evidence that teacher instructions of DT when student see practical utility of science,
parents' technical/engineering education, and presence of home workshops and technical
toys, positively influence attitude towards technology. Yu, Lin, Han and Hsu (2012) found
that interest for technology enhances technological identification which moderates future
decisions for technical/engineering career. It was also revealed that interest for technology
mediates technology curriculum while technology curriculum might affects decision for
future career in technical/engineering jobs (Yu et al., 2012).
Students at technology education must develop disposition toward engaging in active
role orientation, such as initiating change and influencing their environment until
meaningful change occurs in the achievement of their goals, in contrast with passive people
who just adapt to their undesirable circumstances (Kim, Hon, & Lee, 2010). Student must
act proactively, and along with a high level of self-efficacy and voice behaviour, make
response to a problem situation or environmental context to complete the tasks. Proactive
student more like to seek for an improvement in a process or product to improve efficiency:
this is called technical creativity. Technical creativity also presents the degree to which a
desirable product or process is realised (Taura & Nagai, 2011). For creative activities of
students at DT to whom a pragmatic set of values is assigned, the goal is inventiveness,
which is an indispensable element of progress and that improves the quality of life
(Szewczyk-Zakrzewska & Avsec, 2016). Students ' positive affirmation to DT subject
matter and technology itself, might be crucial for the translation of creative ideas into
successfully implemented inventions first followed by innovations when the
products/process are being commercialized (Rank, Pace, and Frese, 2004). Self-regulation
and persistence behaviour successfully predict creative potential, while voice behaviour as
constructivist self-learning process additionally enhances contextual performance (Rank
et. al., 2004) which must be rather defined with performance-approach goals (Avsec &
Šinigoj, 2016). Evidence-based practise with a hands-on creation project allows students
eliciting their prior-knowledge and experience to provide ideas for improving the current
projects. This positive attitude might reduce participants’ resistance to change and
enhances interest, learning and creativity, when working on real-world projects (Avsec &
Šinigoj, 2016).
Students possess different experiences, perception and ability to study, to think, to
process information, to perceive physical, virtual and social environment, different
inclination for study, different scaffolding process, and different motivation what might

Journal of Technology and Information Education
2/2017, Volume 9, Issue 2 ISSN 1803-537X
133
distort designed learning process. To avoid this, a need for mapping students learning
exists to improve their learning and creativity.
Despite of several studies to explore technology education, an effective and a clear
visualization of predictors affecting creativity is still lacking. Therefore, the objective of
this paper is to investigate how students' individual differences affect technical creativity
as an outcome of technology education.
We contribute to the literature by providing evidence of an association between
students learning styles, their experiences and attitudes toward design and technology, and
the performance measured as creative potential in the context of the primary school DT
subject matter learning environment. Especially, technology teachers, educators, and
course designers in technology education can benefit from this.
3 Methods
We used an empirical research design to investigate weather students' learning styles
and their attitude towards technology and engineering predict technical creativity in sixth-
and ninth-graders at primary school. The samples, instrumentation validation and
specification, procedure and data analysis of our study are described in the following
subsections.
The sample of this study was drawn from Slovenian primary school students. The three
schools selected for this study were one from urban area, one from urban-rural area and
one from rural area. Schools were selected on the basis of students’ achievements in a
national examination. The level of the selected school was regarded as average at the
country level. Students' distribution across the sex, grade and type of school area is shown
in Table no. 1.
Primary School Grade Sex
Male Female
I.C. Vrhnika 6 10 11
9 12 7
Pivka 6 22 28
9 30 16
Prestranek 6 14 8
9 10 9
Total 6 and 9 98 79
Table no. 1: The study sample structure with frequencies (n=177).
For measuring student’s attitude towards technology, a reconstructed 25-item test of
Students Attitude towards Technology of authors Ardies, De Maeyer, & Gijbels (2013)
was used. Slovenian adaptation of the test called The Technology and me survey which
includes also questions on demographics (sex and age), and eight questions about family
background, and home education background. These 25-items covered six constructs: (1)
technological career aspirations (TCA)-4 items; (2) interest in technology (IT)-6 items; (3)
tediousness towards technology (TTT)- 4 items; (4) technology across the sex (TS)-3
items; (5) consequences of technology (CT) -4 items; and (6) technology/engineering study
is difficult (TD)-4 items. For the assessment, a 5-point Likert scale was used. The intervals
Journal of Technology and Information Education
2/2017, Volume 9, Issue 2 ISSN 1803-537X
134
of the scale together form a continuous type, from 1 (very unlikely) to 5 (very likely).
Creativity of students was surveyed with test of Creative Thinking-Drawing Production
(TCT-DP) (Urban, 2004). Students complete incomplete drawings in any way they like.
Maximum score on test is 72 points assessed on fourteen criteria.
For surveying students' learning styles, recently developed Dynamic Learning Style
Inventory (DSLI) was used (Szewczyk-Zakrzewska & Avsec, 2016). The survey included
questions on demographics, 95 questions on eight mode predictor variables with 36
subscales. Demographic questions were related to sex, age, and education level. DSLI was
proved as valid and reliable enough instrument and successfully covers all eight modules
of learning styles. For the assessment, a 6-point phrase completion scale was used as
recommended by Allen & Seaman (2007), and Dawes (2008). The intervals of the scale
together form a continuous type, from 0 (very unlikely) to 5 (very likely). It does not present
the mean, but ensures the comparability of continuous responses and produces better
assumptions of parametric statistics (Hodge & Gillespie, 2007) while avoiding bias.
Data was collected during real-world classroom in study year 2015/16. All three
instruments were administrated in the same day, started with easy task to the intensive task.
Technology and me test was performed first, followed by DSLI and as the last TCT-DP
test was done. Individual testing for each test takes 10-15 minutes. The data were analysed
with IBM SPSS (v.22). To support the reliability of tests, a Cronbach’s α coefficient was
used. We conducted an analysis of variance ANOVA to identify and confirm significant
relationships between groups with an effect size calculated with η2. The basic tools of
descriptive statistics, and multiple regression analysis, were used.
4 Results
Our findings are reported as reliability information for instruments used, descriptive
analyses of survey data, and variance and regression analysis with the effect size.
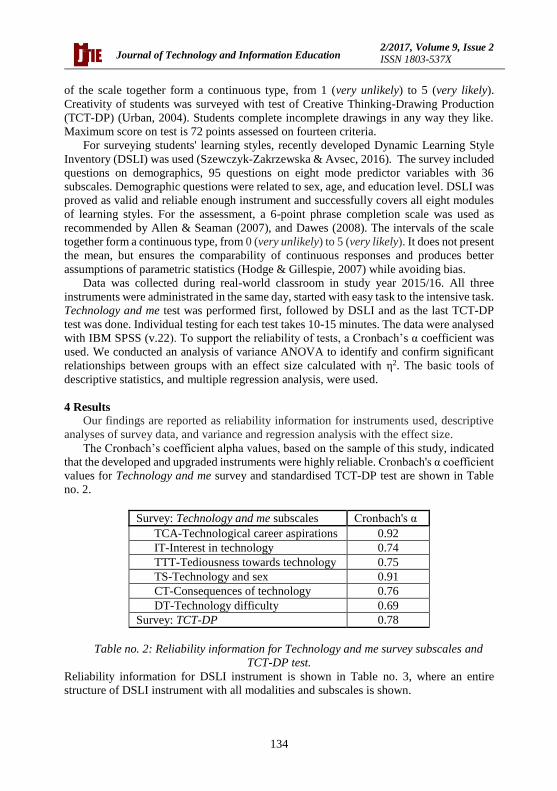
The Cronbach’s coefficient alpha values, based on the sample of this study, indicated
that the developed and upgraded instruments were highly reliable. Cronbach's α coefficient
values for Technology and me survey and standardised TCT-DP test are shown in Table
no. 2.
Survey: Technology and me subscales Cronbach's α
TCA-Technological career aspirations 0.92
IT-Interest in technology 0.74
TTT-Tediousness towards technology 0.75
TS-Technology and sex 0.91
CT-Consequences of technology 0.76
DT-Technology difficulty 0.69
Survey: TCT-DP 0.78
Table no. 2: Reliability information for Technology and me survey subscales and
TCT-DP test.
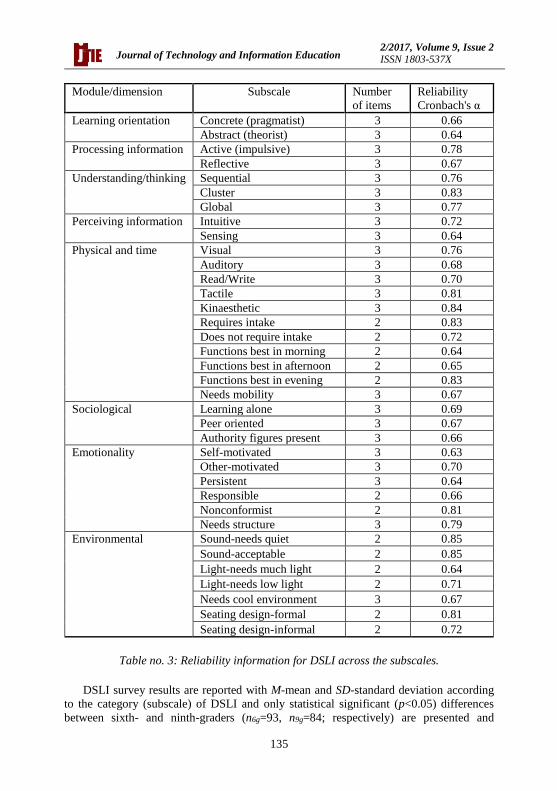
Reliability information for DSLI instrument is shown in Table no. 3, where an entire
structure of DSLI instrument with all modalities and subscales is shown.
Journal of Technology and Information Education
2/2017, Volume 9, Issue 2 ISSN 1803-537X
135
Module/dimension Subscale Number
of items
Reliability
Cronbach's α
Learning orientation Concrete (pragmatist) 3 0.66
Abstract (theorist) 3 0.64
Processing information Active (impulsive) 3 0.78
Reflective 3 0.67
Understanding/thinking Sequential 3 0.76
Cluster 3 0.83
Global 3 0.77
Perceiving information Intuitive 3 0.72
Sensing 3 0.64
Physical and time Visual 3 0.76
Auditory 3 0.68
Read/Write 3 0.70
Tactile 3 0.81
Kinaesthetic 3 0.84
Requires intake 2 0.83
Does not require intake 2 0.72
Functions best in morning 2 0.64
Functions best in afternoon 2 0.65
Functions best in evening 2 0.83
Needs mobility 3 0.67
Sociological Learning alone 3 0.69
Peer oriented 3 0.67
Authority figures present 3 0.66
Emotionality Self-motivated 3 0.63
Other-motivated 3 0.70
Persistent 3 0.64
Responsible 2 0.66
Nonconformist 2 0.81
Needs structure 3 0.79
Environmental Sound-needs quiet 2 0.85
Sound-acceptable 2 0.85
Light-needs much light 2 0.64
Light-needs low light 2 0.71
Needs cool environment 3 0.67
Seating design-formal 2 0.81
Seating design-informal 2 0.72
Table no. 3: Reliability information for DSLI across the subscales.
DSLI survey results are reported with M-mean and SD-standard deviation according
to the category (subscale) of DSLI and only statistical significant (p<0.05) differences
between sixth- and ninth-graders (n6g=93, n9g=84; respectively) are presented and

Journal of Technology and Information Education
2/2017, Volume 9, Issue 2 ISSN 1803-537X
136
discussed in the paper. As it was expected no significant differences (p>0.05) were found
between students in category of Learning orientation and Processing of information.
Pragmatists, Theorists and Reflectors are almost evenly distributed, while a number of
Active students is significantly lower (M=3.16, SD=0.98; M=3.22, SD=0.90; M=3.20,
SD=0.97; M=2.35, SD=0.95; respectively). It was also found that sixth-graders are more
sequential thinkers over the ninth-graders (M=3.69, SD=0.98; M=3.41, SD=0.91;
respectively) while at perceiving information no differences were found. Still, we have
more sensing rather than intuitive students (M=3.44, SD=0.97; M=2.62, SD=0.93;
respectively). Physical and time preferences of the students seem to be different. Sixth-
graders are more tactile in contrast with ninth-graders (M=3.06, SD=0.95; M=2.83,
SD=0.83; respectively), prefer to learn in the morning and afternoon, and do not need
intake of food and drinks as much they need this ninth-graders. It seems that the ninth-
graders prefer to learn in the evening. Sociological aspect of DSLI revealed no significant
differences (p>0.05) between students. Both, they prefer peer learning, as prevailing way
of social learning and scaffolding. Students in grade 6 are more other-motivated in contrast
with students in grade 9 (M=3.63, SD=0.97; M=3.36, SD=0.93; respectively), but
surprisingly more persistent (M=3.75, SD=0.82; M=3.41, SD=0.91; respectively). Sixth-
graders in contrast with ninth-graders need quiet (M=3.40, SD=1.11; M=2.88, SD=1.23;
respectively), more (intensive) light (M=3.50, SD=1.17; M=3.18, SD=1.29; respectively),
and they use formal furniture in the study room (M=3.10, SD=1.31; M=2.65, SD=1.43;
respectively). Majority of aforementioned significant differences (p<0.05) in students'
learning styles were judged as a small to moderate expressed with a coefficient η2=0.02-
0.1 (eta squared) as a measure of effect size.
Technology and me survey was aimed to investigate students experiences and
perceptions of design, technology and engineering. Image no. 1 depicts students' attitude
towards technology in Grade 6 and Grade 9 with a mid-point 3.
Image no. 1: Students’ average rating on attitude towards technology across the
grade of students with a mid-point 3.
The general attitude is estimated about average. Technological career aspirations seem
to be not enough developed. Students felt not motivated yet for further schooling of
technical and/or engineering studies and professions. Students' interest for technology and
Journal of Technology and Information Education
2/2017, Volume 9, Issue 2 ISSN 1803-537X
137
engineering subject matter is about average, while both sixth- and ninth-graders perceived
technology and engineering subject matter as under average regarding to the difficulty of
the study itself. Positively, students perceived their tediousness towards technology as
under average. Still, students perceived technology and engineering subject matter and
profession as male domain, especially male students in Grade 6. Students have developed
critical thinking ability and they perceived consequences of technology above the average.
Further descriptive analysis indicated that the test for homogeneity of variance was
non-significant, meaning that the sample exhibited characteristics of normality required
for analysis under the assumptions of the general linear model. The Levene’s test for
equality of variances achieved no statistical significance at survey (p > 0.05). The Levene’s
test confirmed that the study sample did not violate the assumption of normality, which
confirmed that the sample is normally distributed. Using aforementioned into account, we
found significant difference in students’ perception only in category of TTT
(p=0.003<0.05) where sixth-graders are more tediousness toward technology, with a
moderate effect size η2=0.05; and at perceived TD, again sixth graders felt technology
more difficult from their counterparts in Grade 9, with a small effect size η2=0.03.
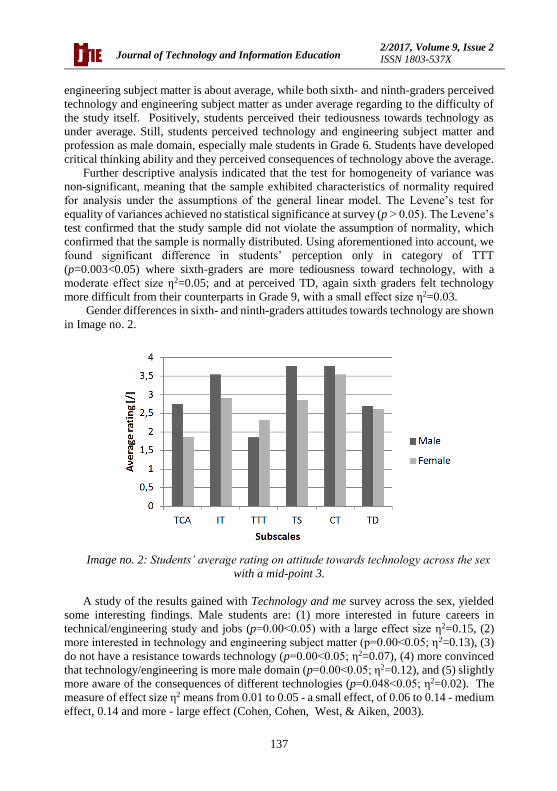
Gender differences in sixth- and ninth-graders attitudes towards technology are shown
in Image no. 2.
Image no. 2: Students’ average rating on attitude towards technology across the sex
with a mid-point 3.
A study of the results gained with Technology and me survey across the sex, yielded
some interesting findings. Male students are: (1) more interested in future careers in
technical/engineering study and jobs (p=0.00<0.05) with a large effect size η2=0.15, (2)
more interested in technology and engineering subject matter (p=0.00<0.05; η2=0.13), (3)
do not have a resistance towards technology (p=0.00<0.05; η2=0.07), (4) more convinced
that technology/engineering is more male domain (p=0.00<0.05; η2=0.12), and (5) slightly
more aware of the consequences of different technologies (p=0.048<0.05; η2=0.02). The
measure of effect size η2 means from 0.01 to 0.05 - a small effect, of 0.06 to 0.14 - medium
effect, 0.14 and more - large effect (Cohen, Cohen, West, & Aiken, 2003).
Journal of Technology and Information Education
2/2017, Volume 9, Issue 2 ISSN 1803-537X
138
Our study confirms stereotypical ideas concerning gender differences, especially, in
attitude to have a technological career, and in interest for design and technology subject
matter. It seems that current design and technology curriculum does not have positive
effects on career aspirations. It appears that not motivate further changes in education, to
have more female students in engineering education and not to waste future talents.
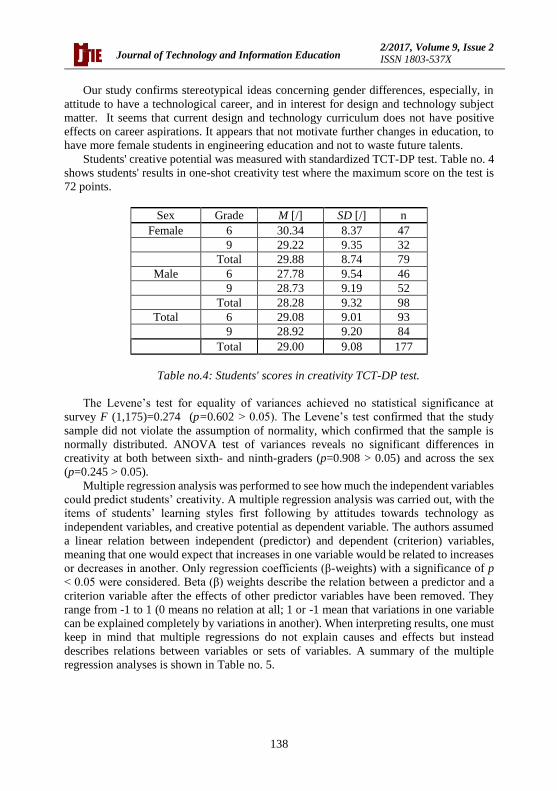
Students' creative potential was measured with standardized TCT-DP test. Table no. 4
shows students' results in one-shot creativity test where the maximum score on the test is
72 points.
Sex Grade M [/] SD [/] n
Female 6 30.34 8.37 47
9 29.22 9.35 32
Total 29.88 8.74 79
Male 6 27.78 9.54 46
9 28.73 9.19 52
Total 28.28 9.32 98
Total 6 29.08 9.01 93
9 28.92 9.20 84
Total 29.00 9.08 177
Table no.4: Students' scores in creativity TCT-DP test.
The Levene’s test for equality of variances achieved no statistical significance at
survey F (1,175)=0.274 (p=0.602 > 0.05). The Levene’s test confirmed that the study
sample did not violate the assumption of normality, which confirmed that the sample is
normally distributed. ANOVA test of variances reveals no significant differences in
creativity at both between sixth- and ninth-graders (p=0.908 > 0.05) and across the sex
(p=0.245 > 0.05).
Multiple regression analysis was performed to see how much the independent variables
could predict students’ creativity. A multiple regression analysis was carried out, with the
items of students’ learning styles first following by attitudes towards technology as
independent variables, and creative potential as dependent variable. The authors assumed
a linear relation between independent (predictor) and dependent (criterion) variables,
meaning that one would expect that increases in one variable would be related to increases
or decreases in another. Only regression coefficients (β-weights) with a significance of p
< 0.05 were considered. Beta (β) weights describe the relation between a predictor and a
criterion variable after the effects of other predictor variables have been removed. They
range from -1 to 1 (0 means no relation at all; 1 or -1 mean that variations in one variable
can be explained completely by variations in another). When interpreting results, one must
keep in mind that multiple regressions do not explain causes and effects but instead
describes relations between variables or sets of variables. A summary of the multiple
regression analyses is shown in Table no. 5.

Journal of Technology and Information Education
2/2017, Volume 9, Issue 2 ISSN 1803-537X
139
Model
Unstandardized
Coefficients
Standardized
Coefficients
t p B Std. Error Beta
1 (Constant) 18.86 3.30 5.72 0.000
Active -1.61 0.71 -0.17 -2.27 0.025
Reflective 1.86 0.74 0.20 2.52 0.013
Global 1.52 0.83 0.17 1.98 0.049
Visual 2.21 0.78 0.24 2.82 0.005
Kinaesthetic -1.55 0.78 -0.17 -1.98 0.049
Learning alone 1.70 0.65 0.21 2.58 0.001
Persistent 2.12 0.76 0.21 2.8 0.006
Responsible -1.48 0.64 -0.19 -2.23 0.022
Nonconformist 1.03 0.50 0.16 2.05 0.042
Formal design -1.34 0.53 -0.22 -2.52 0.013
Table no. 5: Multiple regressions for predictor variables of learning styles where only
significant (p<0.05) predictors are encountered.
Creativity might be most positive affected with self-scaffolding learning along with
persistence at learning of visual learners. This finding reveals the structure of our
educational system, namely most students' tasks are designed in a way to cope with them
alone, team work is not enabled, and learning objects are mostly visual nature. Learning
tasks perhaps are not well designed; students took too much time on it, even tasks are not
well structured to enhance students' creativity neither higher order thinking skills are
enabled. This is connected with curriculum where a large majority of learning outcomes
are designed in the level 1–3 according revised Bloom taxonomy.
Several negative estimates were found. Use of formal design of furniture as physical
learning environment might not be successful motivator or enhancer of creative potential
development, while impulsive and kinaesthetic learners are not ready yet to advance their
creative potential in a way which was offered in the classroom. It points to the need of
open learning environment where student's creativity is enhanced more than in traditional
classroom. DT subject matter designers should consider this fact along with reduction of
learning sets and half-elements used to have in classroom. It was already found that not so
positive attitudes towards technology along with multiple constraints in design and
technology learning tasks can douse students' creativity.
A multiple regression was used also to investigate how much attitudes towards design,
technology and engineering could predict students' creativity as independent variable. Only
two significant (p<0.05) predictors were found, namely students' perception and awareness
of consequences of technology as a strong positive (β=0.34, p=0.000<0.05) and students
opinion, that technical and engineering subject matter and jobs are in domain of males as
negative (β = -0.16, p=0.034 < 0.05). The explained variances were calculated using R2 =
0.12, where R2 = 0.02 means a small impact, R2 = 0.13 means a medium effect size, and
R2 = 0.26 presents a large effect size (Cohen, Cohen, West, & Aiken, 2003).
Results revealed that students who had higher scores on consequences of technology,
scored higher in creativity test. It seems that students with developed ability of critical

Journal of Technology and Information Education
2/2017, Volume 9, Issue 2 ISSN 1803-537X
140
thinking and decision-making advanced more in creativity during schooling. Students with
lower level of cognitive ability felt DT as male domain, but their scores in TCT-DP test
were lower from others. We expected more support for predictive value of attitudes
towards technology. It presents motivation for the curriculum change, namely DT
curriculum designers and technology teachers should include more critical thinking
activities in every day lessons supported with real-world cases and rather than abstract they
should make focus on concrete objects.
5 Discussion
The purpose of this study was to verify and understand the effect of individual
differences on technical creativity in Slovenian K-9 students. The investigation of how
students’ learning styles, their attitudes towards technology affect creativity yielded some
interesting results. Reliability of instruments used in recent study was found moderate to
high what enable us with valid and predictable results.
Surprisingly, there are no significant differences (p>0.05) in creative potential between
sixth- and ninth-graders measured with TCT-DP test. Students' potential is judged to be
low to moderate where a score range is from 0 to 72 points. Still we do not know if design
and technology curriculum serves as creativity enhancer or only compensator for those
with a low level of creative potential. From grade 6 to 9, mostly algorithmic subjects
prevail, while design and technology subject matter is on side with only 140 periods in
total and quite a lot of reproducing and simple working tasks are performed through the
study years. Up to date, there is no subject designed yet in primary schooling with explicit
goals to develop creative potential only.
Students learning styles significantly predict creative potential, where visual learners
advanced more along with self-motivated and persistent students; hereby we confirm
findings of Szewczyk-Zakrzewska & Avsec (2016). Active students still have not well
developed heuristics to get dynamism of learning styles. Students from grade 6 to 9 are
given with technical sets where half-products and some raw material allow them to make
simple designs after teachers' instruction and manuals. Perhaps, this type of evidence-based
work does not enhance creative potential markedly. Technology education is not just
technical work, but needs to be reconsidered due to complex learning outcomes and their
assessment as was claimed by Norström (2013).
Technology is more present than ever, but students' attitudes towards technology and
engineering are not particularly positive, hereby we confirmed findings of Ardies et al.
2015. Moreover, at education systems, where intensive technology education begin already
in K1 and it is vertically connected to K9, students have more positive affirmations to
future careers in technical/engineering study and professions (Eurydice, 2016; Yu et al.,
2012). Students who are aware of consequences of technology scored significantly higher
(p<0.05) in creativity test, but still students in grade 6 and grade 9 did not feel comfortable
with technologies, and technology identification is still lacking. Even more, technology
perplexity sometimes decline students attitude away from and interest for technology and
engineering subject matter might decrease.
6 Conclusions
This study indicated that individual differences in Slovenian K-9 students were
significant predictors of creativity. Individual differences measured with learning styles
and students attitude towards design and technology were significant (p<0.05) predictors
Journal of Technology and Information Education
2/2017, Volume 9, Issue 2 ISSN 1803-537X
141
of technical creativity. Technology and engineering subject matter goals should be
designed from a performance-approach rather than performance-avoidance goals. Due to
many algorithmic designed subject matters, still we do not know if creativity goals in
design and technology/engineering subject matter curriculum serve as an enhancer or
compensator.
Design and technology curriculum for Slovenian students in grade 6-9 needs to be
upgraded markedly. Firstly, content areas should be adjusted with standards for
technological literacy where higher order thinking is enabled along with holistic
development of skills on cognitive, psychomotor and interpersonal level, and attitudes
what allows student to be successful in a given context. Secondly, a use of already prepared
technical sets with half-products and pre-designed elements, aimed for reproduction work
only, should be reduced and more evidence-based teacher activities should be introduced
that students on-site see how the science rules are utilized in technology education. Thirdly,
only well designed and highly structured technological problem solving activities should
be included to enhance both social-constructivist learning and creativity which leads to
future inventions. Fourthly, technology education should be presented to students clear,
when a role, scope, aim and utilization of technology in society must be a crucial point to
reduce perplexity and to advance on technology identification.
Since creativity was found as top three employability skills in 21st century, technology
education by its nature can shape technical creativity in students. Moreover, attitudes
towards technology seem to be a key to the technical creativity development which leads
to creative behaviour for innovative performance in classroom. Only well designed and
highly competitive technology education curriculum enhances creativity, while several
constraints along with algorithmic behaviours used in technology and engineering can
douse creativity. To change students' beliefs and attitudes, several technological discrepant
events are proposed during the lessons.
It is important to investigate the influence of the teacher further followed by how to
define successful teacher where both learning outcomes and creative potential
development of students should be considered. Moreover, to find more support for our
results we will continue with research in Grade 7 and 8. Thus, we conclude domain of
design and technology subject matter. To find more agreement, qualitative observations of
lessons are necessary.
7 Bibliography
Allen, E., & Seaman, C. (2007). Likert scales and data analysis. Quality Progress, 47,7,
pp. 64–65.
Ardies, J., De Maeyer, S. and Gijbels, D. (2013). Reconstructing the pupils attitude towards
technology - survey. Design & Technol. Educ.,18, 1, pp. 8-19.
Ardies, J. De Maeyer,S., Gijbels, D. & van Keulen, H.. (2015). Students attitudes towards
technology. Int J of Technol and Des Educ, 25, pp. 43–65.
Avsec, S.,& Jamšek, J. (2016). A path model of factors affecting secondary school
students’ technological literacy. Inter. J. of Technol. and Design Educ., 26, DOI:
10.1007/s10798-016-9382-z.
Avsec, S. & Šinigoj V. (2016). Proactive technical creativity: mediating and moderating
effects of motivation, World Trans. on Engng and Technol. Educ., 14, 4, pp. 540–545.

Journal of Technology and Information Education
2/2017, Volume 9, Issue 2 ISSN 1803-537X
142
Barbot, B., Besancon, M. in Lubart, T. (2016). The generality-specificity of creativity:
Exploring the structure of creative potential with EPoC. Learning and Individual
Differences, 52, pp. 178–187.
Cohen, J., Cohen, P., West, S. G., & Aiken, L. S. (2003). Applied multiple regression /
correlation analysis for the behavioral sciences. Mahwah, NJ: Lawrence Erlbaum, 736 p.
ISBN-10: 0805822232.
Cropley, D. H. (2015). Creativity in engineering: Novel solutions to complex problems,
San Diego: Acad. Press, 348 p. ISBN: 9780128002254.
Dawes, J. (2008). Do data characteristics change according to the number of scale points
used? An experiment using 5-point, 7-point and 10-point scales. International journal of
market research, 50,1, pp. 61–77.
Dostal, J., & Prachagool, V. (2016). Technolgy education at a crossroads-history, present
and perspectives, Journal of Technology and Information Education, 8,2, pp. 5–24.
European Commission/EACEA/Eurydice (2016). Recommended Annual Instruction Time
in Full-time Compulsory Education in Europe 2015/16. Eurydice – Facts and Figures.
Luxembourg: Publications Office of the European Union.
European Commission/EACEA/Eurydice (2014). ET 2020 Education and Training
stocktaking exercise:ET 2020 National Reports. Luxembourg: Publications Office of the
European Union.
Fakin, M., Kocijančič, S., Hostnik, I. and Florijančič, F. (2011). Učni načrt. Program
osnovna šola. Tehnika in tehnologija. Ljubljana, Ministrstvo za šolstvo in šport: Zavod RS
za šolstvo. Retrived June 24, 2017 from:
http://www.mss.gov.si/fileadmin/mss.gov.si/pageuploads/podrocje/os/devetletka/predmet
i_obvezni/Tehnika_in_tehnologija_obvezni.pdf
Felder, R.M. and Brent, R. (2005). Understanding student differences, Journal of
Engineering. Education, 94, 1, pp. 57-72.
Hawk, T.F. and Shah, A.J. (2007). Using learning style instruments to enhance student
learning. Decision Sciences J. of Innovative Educ., 5, 1, pp. 1–19.
Hodge, D. and Gillespie, D. (2007). Phrase Completion Scales: A Better Measurement
Approach than Likert Scales? Journal of Social Service Research, 33, 4, pp. 1–12.
Jaarsveld, S., Lachmann, T., van Leeuwen, C. (2012). Creative reasoning across
develpomental levels: Convergence and divergence in problem creation. Intelligence. 40,3,
pp. 172–188.
Kallio, M. & Metsärinne, M. (2017). How do different background variables predict
learning outcomes? Int J of Technol and Des Educ, 27, 1, pp. 31-50. DOI:10.1007/s10798-
015-9339-7.
Kim, T., Hon, A.H.Y. and Lee, D. (2010). Proactive personality and employee creativity:
the effects of job creativityrequirement and supervisor support for creativity. Creativity
Research J., 22, 1, pp. 37–45.
Krathwohl, D. R. (2002). A revision of Bloom’s taxonomy: An overview. Theory into
Practice, 41, pp. 213–217.
Luckay, M. B., & Collier-Reed, B. I. (2014). An instrument to determine the technological
literacy levels of upper secondary school students. International Journal of Technology
and Design Education, 24,3, pp. 261–273.
McGlashan, A. (2017). A pedagogic approach to enhance creative Ideation in classroom
practise. Int J of Technol and Des Educ, doi 10.1007/s10798-017-9404-5.

Journal of Technology and Information Education
2/2017, Volume 9, Issue 2 ISSN 1803-537X
143
Norström P. (2013). How technology understand technological knowledge. Int J of
Technol and Des Educ ,24, pp.19-38, doi: 10.1007/s10798-013-9243-y.
Rank, J., Pace V.L. and Frese, M. (2004). Three avenues for future research on creativity,
innovation, and initiative.Applied Psychology: An Inter. Review, 53, 4, 518–528.
Rohaan, E. J., Taconis, R., & Jochems, W. M. G. (2010). Analysing teacher knowledge for
technology education in primary schools. Int J of Technol and Des Educ.
doi:10.1007/s10798-010-9147-z.
Szewczyk-Zakrzewska, A. & Avsec, S. (2016). Predicting Academic Success and Creative
Ability in Freshman Chemical Engineering Students: A Learning Styles Perspective. Int J
of Eng Educ, 32, 2(A), pp. 682–694.
Taura, T. and Nagai, Y. (2011). Discussion on Direction of Design Creativity Research
(Part 1) - New Definition of Design and Creativity: Beyond the Problem-Solving
Paradigm. In: Taura, T. and Nagai, Y. (Eds), DesignCreativity 2010. London: Springer-
Verlag, pp. 3-8.
Urban, K. K. (2004). Assessing Creativity: The Test for Creative Thinking—Drawing
Production (TCT-DP) The Concept, Application, Evaluation, and International Studies,
Psychology Science, 46, 3, 2004, pp. 387–397.
Yu, KC., Lin, KY., Han, FN. et al. (2012). A model of junior high school students’ attitudes
toward technology. Int J of Technol and Des Educ, 22, 4, pp. 423-436.
doi:10.1007/s10798-011-9154-8.
Recommended


![Individual Differences [Recovered]](https://img.dokumen.tips/doc/110x75/5695d4621a28ab9b02a147e9/individual-differences-recovered.jpg)