Demographic Research a free, expedited, online journal of peer-reviewed research and commentary in the population sciences published by the Max Planck Institute for Demographic Research Konrad-Zuse Str. 1, D-18057 Rostock · GERMANY www.demographic-research.org
DEMOGRAPHIC RESEARCH VOLUME 17, ARTICLE 24, PAGES 705-740 PUBLISHED 20 DECEMBER 2007 http://www.demographic-research.org/Volumes/Vol17/24/ DOI: 10.4054/DemRes.2007.17.24 Research Article
The impact of origin region and internal migration on Italian fertility
Giuseppe Gabrielli
Anna Paterno
Michael White Special Collection 6: Interdependencies in the Life Course, edited by Hill Kulu and Nadja Milewski. © 2007 Gabrielli, Paterno & White This open-access work is published under the terms of the Creative Commons Attribution NonCommercial License 2.0 Germany, which permits use, reproduction & distribution in any medium for non-commercial purposes, provided the original author(s) and source are given credit. See http:// creativecommons.org/licenses/by-nc/2.0/de/

Table of Contents
1 Introduction 706
2 The Italian situation – an overview 707
3 Theory and operationalization 712
3.1 Model specification and hypothesis tests 713
3.2 Additional conceptual considerations 714
4 Data and methods 715
5 Descriptive results 716
6 Multivariate results 719
7 Conclusion 729
8 Acknowledgements 730
References 731
Appendix 1 736
Appendix 2 737
Appendix 3 738
Appendix 4 739

Demographic Research: Volume 17, Article 24
research article
http://www.demographic-research.org 705
The impact of origin region and internal migration
on Italian fertility
Giuseppe Gabrielli1,
Anna Paterno2,
Michael White3
Abstract
We examine the impact of population distribution on fertility in a nationally
representative sample. We exploit detailed life-history data to conduct an event-history
analysis of transition to first birth, examining mechanisms that might link migration and
fertility: socialization, adaptation, selection, and disruption. Our multivariate analysis
examines various socio-demographic traits, the place of birth, and interregional
migration. Differences by region and migration stream are partly explained by
compositional factors, such as female employment, union type, and education. The
analysis presents much evidence for demographic selection and socialization and less
for adaptation or disruption. The persistence of the region of origin differentials points
to the continuing importance of the context.
1 Dipartimento per lo Studio delle Società Mediterranee, University ofi Bari, p.zza G. Cesare n.1, 70122 Bari,
Italy. Tel:(+39) 080-5717547, Fax: (+39) 080-5717272. E-mail: [email protected] 2 Dipartimento per lo Studio delle Società Mediterranee, University of Bari, p.zza G. Cesare n.1, 70122 Bari,
Italy. Tel:(+39) 080-5717547, Fax: (+39) 080-5717272. E-mail: [email protected] 3 Corresponding Author: Population Studies and Training Center, Brown University, Box 1836, Providence,
RI 02912, USA. Tel: (401) 863-1083, Fax: (401) 863-3351. E-mail: [email protected]

Gabrielli, Paterno & White: The impact of origin region and internal migration on Italian fertility
706 http://www.demographic-research.org
1. Introduction
The effect of the place of residence and migration on fertility has been a long-standing
concern in population studies (White et al. 1995, Chattopadhyay et al. 2006). This
observation assumes a particular importance in Italy, a country that in the 1990s had the
lowest fertility in the world and remains characterized by very low fertility (Billari and
Kohler 2004). While the emergence and persistence of nations with ‘very low’ or
‘lowest-low’ fertility has often been noted (Kohler et al. 2002, United Nations 2006),
the persistence of regional differentials in the level of fertility and the pace of change is
scrutinized less often. Italy, moreover, remains characterized by the strong
redistribution of the population inside its territory (Bonifazi and Heins 2000). This
process involves both men and women of working and reproductive ages.
Redistribution takes place among areas marked by sizable differences in demographic,
economic, and social patterns.
Our motivation for this paper comes from a growing concern in demography for a
better understanding of context in fertility outcomes. In this paper, we examine the
relationship between population distribution (context as place) and fertility. We allow
for the region of birth and migration itself (origin-destination combination) to influence
childbearing outcomes. In addition to speaking to current concerns, we extend a long-
standing literature investigating the way in which fertility is conditioned, in part, by
migration and geographic setting. The influence of place and migration on fertility has
been subject to numerous prior studies. Such studies draw on several potential
mechanisms that might give rise to an association between migration and fertility:
socialization, adaptation, selectivity, and disruption (Caldwell 1982). We discuss the
relevance of these in the model we propose and investigate. In this paper, we emphasize
the way in which changes in the predictive power of covariates help shed light on these
mechanisms. We cannot fully disentangle all mechanisms, precisely because some
characteristics remain unmeasured.4 We say less about disruption, because it is less
likely to operate in a high-income setting (such as contemporary Europe) and, in fact,
we find less empirical evidence for it.
Our approach analyzes the impact of geographical mobility and residential location
on fertility in a large nationally representative sample of Italian women. We use
longitudinal data drawn across several waves and with retrospective information. We
examine the effects of age and cohort variables, several individual traits, the
4 Note that selection on unobserved traits (underlying preferences for family size) can give rise to selection
that is not measured with the data in hand. Note also that in some analyses of selection, one predicts whether
migration itself varies by children ever born. Such phenomenon may give rise to net geographic differentials
(including rural-urban differentials in developing countries) in lifetime fertility. Such an empirical test
(migration as a function of personal traits, including existing family size) is not our objective.

Demographic Research: Volume 17, Article 24
http://www.demographic-research.org 707
characteristics of the origins and potential destinations, and the migratory event itself.
In so doing, we test for the influence of geography and migration, and also examine the
applicability of some existing theories on this topic to the Italian setting.
2. The Italian situation – an overview
The dynamics of fertility and internal mobility in Italy are very well-known
phenomena. Although an appreciable literature describes these processes, we review
some regional trends in order to shed light on their interconnections and to demonstrate
the value of a comparative approach. Our intent is to show that fertility and internal
migration are both characterized by appreciable geographic variation, and moreover,
that these geographic differentials may be related.5 For available statistics, we rely on
official data from the major Italian statistical agency, Istituto Nazionale di Statistica
(ISTAT); some of these data are still unpublished. Regarding fertility, we choose two
measures to express intensity and timing: the Total Fertility Rate (TFR) and median age
at first birth (see Figure 1 and see Appendix 1 and 2). For our analysis of migration, we
use data from the registrations and the de-registrations in the population register to
calculate average annual rates of in-migration and out-migration (see Appendix 2 and 4)
and net migration rates (see Figure 2).
For both processes, the overall 1955–2004 period can be divided into three
different phases. The first phase – which corresponds to the 15-year period 1955–1969
– is characterized by an increase in the number of children born to women across nearly
all Italian regions. The TFR for the whole country increased from 2.34 in 1955–59 to
2.57 in 1965–69. Yet, this national average masks considerable regional variation:
Regional TFR values in the 1965–69 period varied between 1.97 (Liguria) and 3.42
(Campania), although most regions followed the national trends over the 15-year
interval. Overall, fertility was higher in the ‘Mezzogiorno’ (Southern Italy) than in the
rest of the Peninsula. In the same 15-year period, the national value of the median age at
first birth (MAFB) shifted slightly, moving from 25.8 years in 1955–59 to 25.3 in
1965–69. During this last period, regional MAFB values ranged between 24.2 years in
Molise to 26.1 in Sardegna.
5 We examine here inter-regional migration (versus inter-municipalities, inter-provincial, and inter-area
movements), since it may better capture the variation in the socio-cultural environment that may have an
impact on fertility and related behaviors, even if it occurs (almost necessarily) at lower rates than other
geographic mobility (Casacchia and Strozza 2001).

Gabrielli, Paterno & White: The impact of origin region and internal migration on Italian fertility
708 http://www.demographic-research.org
Figure 1: Total Fertility Rate by Italian region and macro-area,
from 1955–59 to 2000–04
0.9
1.5
2.1
2.7
3.3
3.9
1955-59 1960-64 1965-69 1970-74 1975-79 1980-84 1985-89 1990-94 1995-99 2000-04
TF
R
Northern regions Central regions Southern regions
First phase Second phase Third phase
Year
Source: Calculations based on ISTAT data.
Northern regions: Valle d’Aosta, Piemonte, Liguria, Veneto, Friuli, Trentino, Lombardia.
Central regions: Emilia Romagna, Toscana, Marche, Umbria, Lazio, Abruzzo, Sardegna.
Southern regions: Molise, Puglia, Basilicata, Campania, Calabria, Sicilia.

Demographic Research: Volume 17, Article 24
http://www.demographic-research.org 709
Figure 2: Net Migration Rate by Italian region and macro-area,
from 1955–59 to 2000–04
-20.0
-10.0
0.0
10.0
20.0
1955-59 1960-64 1965-69 1970-74 1975-79 1980-84 1985-89 1990-94 1995-99 2000-04
NM
R
Northern regions Central regions Southern regions
First phase
Year
Second phase Third phase
Source: Calculations based on ISTAT data.
Northern regions: Valle d’Aosta, Piemonte, Liguria, Veneto, Friuli, Trentino, Lombardia.
Central regions: Emilia Romagna, Toscana, Marche, Umbria, Lazio, Abruzzo, Sardegna.
Southern regions: Molise, Puglia, Basilicata, Campania, Calabria, Sicilia.

Gabrielli, Paterno & White: The impact of origin region and internal migration on Italian fertility
710 http://www.demographic-research.org
The 1955–69 increase in fertility has led some authors to label this period the
Italian ‘baby boom’, although other work has indicated that successive cohorts were
already lowering their childbearing rates (Santini 1995, Caselli et al. 2001).
In the same 1955–69 period, Italy was characterized by considerable population
redistribution. The peak interregional gross mobility level (in plus out) was reached
during the period 1960–64. During that time, seven of 20 regions recorded in-migration
rates higher than 30‰, and 12 regions showed out-migration rates over 30 per 1000.
The net migration rates show that three Northern regions ‘increased’ their population
more so than other regions during that period, as a fraction of the average population
during the interval: Piemonte (16.5‰), Liguria (13.6‰), and Lombardia (11.1‰).
Lazio was the only region in the rest of the country to record more than 10‰ entrances
than exits. Conversely, Basilicata (–17.1‰), Calabria (–13.9‰), Puglia (–9.8‰), and
Sardegna (–9.8‰) experienced significant negative net migration rates during the early
1960s. In sum, there is a clear direction of the internal Italian flows from the Center and
the South of Italy to the North-West. Several reasons underlie this redistribution. The
most important one concerns economic development in the ‘industrial triangle’ (Turin,
Genoa, and Milan municipalities). Moreover, high rates during the 1960–64 period are
connected to ‘break free’ movements, which are in turn linked to the abolition of the
Fascist Law on Urbanization, and with the corrections in the Population Register
following the 1961 census (Casacchia and Strozza 2001). The internal redistribution
also occurs during a time of international migration of the Italian population towards
the countries in Central-West Europe.
The following phase – from the 1970s into the middle of the 1990s – is
characterized by an uninterrupted fall of both fertility indicators. Values in the range of
‘lowest-low fertility’ (Kohler et al. 2002) had been recorded in Italy for the 1990–94
period. Again, significant regional differences are apparent. In some regions, the drop
below a TFR of 1.3 (the lowest-low benchmark) had occurred already ten years earlier.
In fact, in 1980–84, six regions, all of them located in the Central-Northern part of the
country (Piemonte, Valle d’Aosta, Friuli-Venezia Giulia, Liguria, Emilia-Romagna, and
Toscana) recorded a TFR lower than 1.3, while four regions in the South (Campania,
Puglia, Calabria, and Sicilia) retained TFR values near the replacement level (2.1
children per woman). There are two remarkable cases where the TFR dropped to values
below 1.0 in specific five-year intervals: Emilia-Romagna (in 1985–89 and 1990–94)
and Liguria (in 1990–94 and 1995–99). Throughout this broad post-1970s period, the
national MAFB showed an increase from 24.8 in 1975–79 to 28.4 in 1995–99. The
remarkable postponement of transition to motherhood had different levels of intensity
across the national territory. The recorded MAFB values at the regional level for 1975–
79 ranged from 24.1 in Sicilia to 25.8 in Liguria; in the 1995–99 period, the values

Demographic Research: Volume 17, Article 24
http://www.demographic-research.org 711
moved to 26.6 and 29.8, respectively, in these same regions. There was a parallel
movement, but the regional gap was retained.
The period between 1975 and 1989 was also characterized by a decline in
mobility. In-migration rates and out-migration were below 30‰ in all regions
throughout this time6. An explanation is considered to be the economic crisis following
the ‘oil shock’ of 1973, which produced a setback in the economy, reducing the
attractiveness of the Northern industrialized regions of Piemonte, Lombardia, and
Liguria. Other determinants more social in nature included shifts in the cost of living
across regions, housing availability, family ‘quality of life’ factors, and occupational
opportunities. During the period 1990–94, in-migration and out-migration rates were
above 20‰ in only four Northern regions (Valle d’Aosta, Liguria, Piemonte, and
Lombardia). The decline of interregional migration does not imply a decline of
geographic mobility overall, however. Starting from the 1970s, the percentage of
migrants undertaking short or middle-distance moves has grown (Bonifazi and Heins
2000, Casacchia and Strozza 2001), linked to the relative growth of intra-urban moves
(Bonaguidi and Terra Abrami 1996).
Finally, the third phase in the evolution of Italian fertility and mobility is quite
recent. We note a slight increase in the birth rate, indicated by a national TFR that
changed from 1.22 in 1990–95 to 1.28 in the five years of 2000–04 (reaching up to 1.33
children per woman in the single year 2004). In a remarkable reversal, the region with
the lowest current fertility (TFR=1.04) was Sardegna, which had the highest TFR in
1960–64 (Kertzer et al. 2006). Conversely and also unexpectedly, Trentino-Alto Adige
– together with Campania – now records the highest value among regions: 1.47 children
per woman. Clearly, much has changed since 1995, when Italian national fertility
reached the ‘memorable minimum’. The regions experiencing birth-rate increases are
those located in the North and the Center. By contrast, fertility is still decreasing in the
South. The net result is a national convergence to a moderate range of low fertility
values. Note that this recent upturn in fertility has occurred without a corresponding
decrease in the median age at first birth. Rather, the national MAFB in 2000–01 reached
28.7 years; it increased in almost all regions, although regional differentials persist. The
women experiencing the earliest transition to first childbirth (aged 27) are Sicilians,
while the ‘latest’ ones (aged 29.8) are Ligurians. This value seems to show no alteration
of these traditional behaviors noticed in the whole country7. According to ISTAT, ‘the
recent resumption of the fertility levels is due to, for about half of its value, the births
delivered by foreign mothers. The other half, by contrast, is likely the result of the
6 We observe important differences over this time frame in international migration, too. In the beginning,
immigration is low; then, return migration of Italian nationals is substantial. In the final phase, the
immigration of non-Italian citizens begins. 7 We note that the available data regarding the median age at first birth are updated to 2001 only, so it is
possible that information regarding later years could alter our commentary here.

Gabrielli, Paterno & White: The impact of origin region and internal migration on Italian fertility
712 http://www.demographic-research.org
recovery of the postponement of motherhood in generations of Italian women born
between the second middle of the 1960s and the first middle of the 1970s’ (ISTAT
2006: 8).
Migration began to pick up again in the post-1995 period. In-migration rates
exceeded 25‰ between 2000 and 2004 in almost all of the Northern regions (Trentino-
Alto Adige and Liguria excepted) and in Emilia-Romagna. Out-migration rates
exceeded 25 in Piemonte, Valle d’Aosta, and Lombardia. Further evidence comes from
net migration rates. During the most recent years, the South has lost population equal to
–3.2‰ on average; the North and the Center, by contrast, has experienced a net growth
of 1.7‰ and 2.6‰ respectively. While the migratory flows still originate from the
South, the new destination not only includes the North but also the Center. This change
is likely due to the change of the axis of economic development from the conventional
‘industrial triangle’ to newer locations in the Center and North-East. Migrant selectivity
by demographic characteristic surely operates to shape these flows. Presently, the
young (20–34 years of age) and the more educated workers of the South are likely to
migrate (Birindelli and Heins 1999). These shifts alter the human-capital composition
of origin and destination areas, raising a host of questions, from ‘brain-drain’ in the
regions of origin to migrant accommodation in the destinations. At the same time, other
observers link migration to economic development and assert that this redistribution is
beneficial and improves national social and economic integration (Bonifazi et al. 1999).
3. Theory and operationalization
The analysis of the connection between the geographic distribution and redistribution of
the population and differential fertility has a long history in demography. Most of this
work (among others, see Caldwell 1982, Carlson 1985, Kulu 2005) has focused on
rural-urban differentials in developing or middle-income countries. This work offers a
theoretical approach in population studies, within which our work can be seen. The
approach typically identifies four theoretical processes that could link migration and
fertility: selection, adaptation, socialization, and disruption. Our contribution is to use
this framework, particularly the first three of these concepts, to test for variation by
geography and migration experience within a contemporary high-income, low-fertility
setting.
Selection operates when internal migrants can be characterized by different
personal traits or behavioral intentions than those who remain at origin. Adaptation is
indicated when migrants alter their childbearing patterns to approach or resemble those
of the destination community. Migrants are seen as adapting to new fertility norms
within their childbearing span. Socialization involves temporal change, but these take

Demographic Research: Volume 17, Article 24
http://www.demographic-research.org 713
place over a period of time across generations (Kulu 2005). Under this hypothesis, one
would expect that individuals manifest the fertility behavior of the childhood place and
the behavior adapted during adolescent socialization, irrespective of residence during
childbearing years. Disruption operates under spousal (partner) separation; it is less
likely to be relevant in a high-income setting. Moreover, it may be hard to detect when
contraception is prevalent and birth intervals are long.
In this paper, we investigate whether or not and, if so, how this theoretical
framework can be applied to contemporary Italy. As we discussed above, Italy is
characterized by significant internal geographic differentials in fertility and by varying
rates of fertility transition across regions during the past few decades. We draw from
this theoretical framework to test for the influence of geography – the place of origin
and the migration-stream – in our event-history analysis of the transition to first birth in
Italy. Selection will be indicated when regression adjustment for additional personal
characteristics (age, education, etc.) reduces regional differentials. Socialization and
adaptation are of large interest to us. Socialization will be indicated by the persistence
of region-of-origin dummy variables, an outcome consistent with a pattern in which
those whose childhood was spent in a particular region retained that region’s
childbearing expectations into the reproductive years. (We cannot test for changes
across generations, a subject of interest in discussions of socialization.) By contrast,
adaptation would be visible in migration where the migrants’ fertility is closer to
destination than to the region of origin. We will apply this comparison specifically to
those who migrated out of the South (as it has the higher fertility) and those who
remained. While we embed our analysis in this broad framework, our model
specification will look more directly at the influences of origin and origin–destination
migration as predictors of differential fertility.
3.1 Model specification and hypothesis tests
A useful way to think about the operation of these mechanisms is in terms of statistical
hypothesis tests in a multivariate setting. Consider first regional variation itself. Simple
descriptive statistics indicate the obvious existence of regional variation in fertility. If
these differences are only the manifestation of compositional factors (age, education,
differences of union type across regions), then suitable controls would remove all
regional effects. That is, we would accept the null hypothesis that regional dummy
variables are equal to zero. Consider second the fertility differences of migrants. If
migrants are not at all selective, their fertility will match the region of origin, net of
controls for personal traits, and this in turn would be consistent with socialization. If
migrants experience rapid adaptation, then their fertility will match the region of

Gabrielli, Paterno & White: The impact of origin region and internal migration on Italian fertility
714 http://www.demographic-research.org
destination, net of controls for personal traits.8 In any case, the magnitude and
significance of geographic and migration-stream indicator variables (and the predicted
values that are calculated from them) are the chief indicators of the joint operation of
selection and/or adaptation. We will get some indication of disruption in our analysis by
looking at the timing of fertility after arrival. If the fertility is much lower soon after
arrival at destination (net of all other effects), there is some evidence of disruption.
Thus, we espouse three hypotheses of socialization, adaptation, and selection:
1. Socialization: This will be indicated by the statistically significant effects of the
region of childhood residence (dummy variable), even when controlling for other
covariates.
2. Adaptation: This will be indicated by fertility patterns for migrants that
resemble the destination patterns rather than the patterns displayed at origin. More
specifically, migrants out of the Southern region should have lower fertility, ceteris
paribus.
3. Selection: This will be indicated by a reduction in the magnitude of origin–
destination coefficients when introducing controls for the personal traits of age,
education, and employment status.
3.2 Additional conceptual considerations
Different disciplinary perspectives offer alternate views of the underlying mechanisms
that drive socialization and adaptation. From the sociological perspective, social and
cultural norms operating in the current residential environment influence childbearing
intentions and outcomes (Caldwell 1982). The difference between socialization and
adaptation would be one of timing, with adaptation being manifest relatively soon and
socialization taking longer, usually working across generations. From the economic
perspective, by contrast, socialization and adaptation are seen as being linked to
household income and the cost of having children. Differences in wages for men,
women, and children, the constraints of living costs and income in the destination area,
and the variation in employment and educational opportunities change the real costs of
childbearing, thus altering fertility behavior (Becker 1981). In sum, exposure to
different socio-cultural norms and costs of childbearing will lead to changes in fertility
behavior, so that the migrant population’s fertility rate will ultimately converge with
that of the locals at destination (Kahn 1994, Mayer and Riphahn 2000).
8 A match to the destination fertility pattern may also take place if migrants are selective in a way that is
unobserved (norms and preferences are not among the covariates). This indicates a childbearing trajectory
equivalent to that of the destination.

Demographic Research: Volume 17, Article 24
http://www.demographic-research.org 715
A complete test of the temporal aspects of socialization and adaptation, even
across generations, is beyond the scope of our analysis. Furthermore, the concept of
adaptation is problematic. While adjustment of fertility is readily expected for migration
from less developed areas to more developed areas, it is not clear exactly what the
expectation is for individuals who move into the opposite direction. A strict and
mechanical application of the adaptation notion would suggest that movers from high
income (correspondingly low-fertility) areas to low income (and higher-fertility) areas
should exhibit increases in childbearing, but this is a prediction about which one might
harbor considerable skepticism. Hence, we espouse our adaptation and socialization
hypotheses with the South as the region of origin.
Finally we comment on ‘disruption’, defined as separation from one’s place and
family of origin, difficulties of insertion into the destination areas, and so on. Usually,
disruption is expected to have the effect of lowering the fertility of migrants compared
with that of stayers (Carlson 1985). The impact of disruption is seen mostly in the
timing of childbearing and may only last for a short time (Gorwaney et al. 1998).
Disruption does link geographic variation and migration to fertility: the act of migration
is seen as inherently disruptive, as it often physically separates partners. In the case of
internal migration in a highly developed, low-fertility setting, contemporary
transportation and communication technology operate to mitigate the effects of
separation. Thus, it is less likely that disruption operates to any detectable degree in
Italy today.
4. Data and methods
The data analyzed comes from the ‘Indagine Longitudinale sulle Famiglie Italiane’
(ILFI) or Italian Households Panel, a nationally representative survey with a
prospective panel structure. The ILFI covered about 10,500 male and female adults,
aged 18 or above at the time of interview and born between 1900 and 1983. We use
data from the first four waves of the survey, conducted in 1997, 1999, 2001, and 20039.
Notable for its life-history detail, the ILFI collects complete information (from birth to
the end of the most recent survey wave) on geographical or residential history,
education and vocational training, work, social origins, family and fertility.
Our statistical approach is a discrete time event-history analysis. The ILFI data has
provided us with annual information on fertility (birth of a child in that year) as well as
on the region of residence. We have annual information on a number of other key traits,
9 A new wave was conducted in 2005; however, it was not yet available at the time of writing this paper. The
ILFI primary sampling units included 265 municipalities across Italy.

Gabrielli, Paterno & White: The impact of origin region and internal migration on Italian fertility
716 http://www.demographic-research.org
as well, including the labor-force status, the employment status, and the marital status.
Collectively, they constitute time-varying covariates. We model birth in a given year as
a function of values of these traits lagged one year.10
In addition, we include birth
cohort of the woman and region of residence at birth as time-fixed covariates. We
include age as a time-varying covariate, as its value is, of course, predetermined at each
year. The event-history approach allows us to examine the influence of these covariates
in their correct temporal order for every year of exposure to the risk of childbearing
(age 15 to the year of the current wave of the survey).
Crucial to our study is residential history. We include somewhat different
measures of region of residence, depending on model specification. Basic to the
approach is the region of residence at birth. We operationalize region to be one of three
‘macro-areas’
in the country overall (North, Center, and South); these are an
aggregation of the 20 administrative regions in Italy. Macro-area is a basic indicator of
exposure to a social setting during key childhood, and is thus a proxy for the setting in
which childbearing views would be formed.
We define a ‘migrant’ to be a person who in the year of interest is living presently
in a different administrative region (of the 20 administrative regions) than the region of
his or her birth, for at least one calendar-year during her reproductive age. In the models
of Table 2, we include dummy variables for migration out of the macro-area of birth.
(There are three out-migration dummy variables versus the reference category of
stayers.) The models in Table 3 have more details about the migration streams. We
include a set of nine dummy variables to capture particular origin–destination migration
patterns. Geographic moves between administrative regions, yet within a macro-area,
are counted as migration. Thus, for example, the North–North migration dummy
registers a move from one of the Northern administrative regions to another. (Return
migrants are also considered as resident in their original region, thus they are stayers –
no longer breaking the connection with the home region.) We make this choice to
consider only the most important events in geographic mobility. That is, the regional
boundary is the minimum geographic threshold to be considered a migrant.
5. Descriptive results
Table 1 presents the descriptive statistics for the sample women. The data are
disaggregated by residence at birth. These details reveal the regional differences that
motivate our analysis.
10 Note that if birth and migration occurred in the same year, we would not be able to sort out the temporal
ordering within the year. With the one year lag, migration (and woman’s place of birth) precedes the birth
event and is more behaviorally appropriate timing.

Demographic Research: Volume 17, Article 24
http://www.demographic-research.org 717
Table 1: Number of interviewed women, their migratory and
reproductive features by birth cohort and macro-area of residence
Birth cohort Characteristics
1941–50 1951–60 1961–70 1971–83Northern regions
a
Percentage of out-migrants to another region 10.1 6.7 7.1 4.5
of which: percentage of out-migrants to another macro-area (32.6) (45.9) (58.9) (65.2)
Percentage of experiencing first birthd 89.5 85 61.4 14.2
Median age at first birth for stayers 26.2 26.3 31.3 30.1
Median age at first birth for out-migrants 25.3 25.1 30.8 29.8
Average number of children for stayersd 1.72 1.54 0.69 0.08
Average number of children for out-migrantsd 1.76 1.56 0.94 0.09
N 343 340 420 395
Central regionsb
Percentage of out-migrants to another region 5.9 4.5 3.9 2.1
of which: percentage of out-migrants to another macro-area (67.3) (66.8) (70.0) (72.7)
Percentage of experiencing first birthd 90.3 87.4 58.2 13.4
Median age at first birth for stayers 25.3 25.3 32.0 30.9
Median age at first birth for out-migrants 25.2 26.2 32.5 30.1
Average number of children for stayersd 1.66 1.59 0.78 0.06
Average number of children for out-migrantsd 1.92 1.66 0.67 0.09
N 207 311 351 362
Southern regionsc
Percentage of out-migrants to another region 10.6 11.7 7.1 2.1
of which: percentage of out-migrants to another macro-area (94.6) (94.3) (91.8) (100)
Percentage of experiencing first birthd 87.5 83.7 72.4 21.1
Median age at first birth for stayers 25.1 25.2 26.7 29.9
Median age at first birth for out-migrants 25.2 23.8 28.7 28.7
Average number of children for stayersd 2.34 1.99 1.32 0.19
Average number of children for out-migrantsd 1.94 1.8 1.23 0.29
N 296 301 341 346
Source: Calculations based on ILFI, waves 1997, 1999, 2001, 2003. a- Northern regions: Valle d’Aosta, Piemonte, Liguria, Veneto, Friuli, Trentino, Lombardia.
b- Central regions: Emilia Romagna, Toscana, Marche, Umbria, Lazio, Abruzzo, Sardegna.
c- Southern regions: Molise, Puglia, Basilicata, Campania, Calabria, Sicilia.
d- At interview.

Gabrielli, Paterno & White: The impact of origin region and internal migration on Italian fertility
718 http://www.demographic-research.org
Table 1 clearly recapitulates several key aspects of the time trend in the
reproductive behavior of Italian women. Consistent with the literature, we observe an
increasing median age at first birth11
on the order of about four years across the span of
cohorts (see also Righi and Dalla Zuanna 1999). With this, we also see a decline in the
average number of children ever born. The 1951–60 cohort exhibits lower completed
fertility than the 1941–50 cohort. (These two oldest cohorts have virtually completed
their childbearing exposure. The youngest, born in 1960, would be 43 years of age at
the time of the most recent ILFI wave.) The 1961–70 cohort exhibits a much older age
at first birth and appreciable lower fertility. While this cohort (age 33–43) in 2003 has
not completed its childbearing, it is clear that completed fertility will remain well below
the two prior cohorts. For the 1971–83 cohort, completed fertility is probably not a
meaningful statistic, but we note that the age at first birth is on a par with the 1961–70
cohort.
Differences by macro-area of origin and migration status are also apparent in Table
1. The older cohorts originating and staying in the North and the Center macro-areas
display lower fertility than women from the South. While the results are not as
definitive for the two youngest cohorts, there too it appears that recent childbearing in
the South exceeds that of the North and Center.
Of particular interest are differentials by migration status within the area of origin.
For women born in the North, there is a notable difference (a maximum of 0.25 children
for the 1961–70 cohort) between out-migrants from the region and those who remained
behind, suggesting that migration itself is linked to the postponement of childbearing.
For women born in the Center, out-migrants in the oldest two cohorts show slightly
higher lifetime fertility, while those in the 1961–70 cohort have slightly lower (among
already quite low) fertility. The most striking differences are among women in the
South. First, women of the South, among all cohorts, have a higher fertility than women
of corresponding cohorts in other macro-areas. Second, it is the Southern-born non-
migrant women who have the highest fertility overall. In the oldest cohort this
differential rises to 0.4 children over completed lifetime fertility. Our descriptive
analysis thus confirms the existence of a clear regional bifurcation (South vs.
elsewhere) in reproductive behavior and is consistent with the characterizations
provided by others (e.g., Bonifazi and Heins 2000).
Table 1 also presents time trends in the migratory behavior of the women studied,
and by extension, the population at large. The table indicates a decline across cohorts in
the fraction of women not residing in the region of birth. To be sure, part of this is due
to longer exposure (to the risk of an interregional move) among older cohorts. At the
same time, it is consistent with the more detailed data on migration of the Appendix
tables, which indicate a decline in province out-migration rates, calculated on the basis
11 The median ages are computed using Kaplan-Meier techniques.

Demographic Research: Volume 17, Article 24
http://www.demographic-research.org 719
of the resident-origin population, from the 1950s through the 1990s, with a slight upturn
in the final decade. Regional differences in migration and population retention are also
apparent in Table 1. In all origins, there is an increase in the fraction of interregional
migrants who have departed the macro-area. This is consistent with the increasing
national economic and social integration of Italy over the half-century of observation.
Still, the differences are striking across the areas of origin. Almost all of those who
depart from one of the six administrative regions of the South leave the macro-area
altogether and move to the Center or North. In the North of Italy, migrations across
administrative regions remain within the North macro-area. The case of the Center is
intermediate.
6. Multivariate results
Table 2 presents our discrete time event-history analysis for duration to first birth for all
women in the ILFI dataset during the period of reproductive exposure. Exposure begins
at age 15 and continues to age 50. Exposure may be censored by the survey at a
younger age. Table 2 presents two models. The first one presents the first estimates of
the probability of birth as a function of age (in quadratic form), cohort, region of
residence at birth, and region of origin for those who have departed from their origin
region. The second model includes the same covariates and then adds several other
individual, time-varying covariates: educational attainment (dummy variables for
intermediate or high level of education compared to low education12
), employed (vs.
not), student (vs. not), and union status (civil marriage, cohabitation, not in union vs.
religious marriage as the reference category).
Our first model with limited covariates gives the overall picture of the transition to
first birth in the ILFI female sample. We observe that the probability of giving birth
rises with age, but does so at a decreasing rate (the second-order term is negative), to a
maximum of about age 28. There are sharp cohort effects. The oldest two cohorts (born
1941–50 and 1951–60) are much more likely to give birth than the cohort of 1961–70,
the reference cohort. The youngest cohort, born 1971–83, is much less likely to bear
children than all of the other cohorts. The overall change across the several decades is
quite dramatic. Women born in the 1970s are only about one quarter (0.246=exp[–
0.754–0.647]) as likely to bear their first child in a year of reproductive exposure than
women born in the 1940s, with all else being the same.
12 Low education concerns less than high-school education completed; intermediate education means high-
school completion; high education regards more than high-school level.

Gabrielli, Paterno & White: The impact of origin region and internal migration on Italian fertility
720 http://www.demographic-research.org
Table 2: Determinants of the transition to first birth: discrete time event-
history regression models including the region of childhood residence
and out-migration only; women aged 15 to 49 years
Model 1 Model 2 Variable Parameter
estimate
Standard
error
Parameter
estimate
Standard
error
Age 1.042*** 0.037 0.468 *** 0.038
Age2 –0.019*** 0.001 –0.009 *** 0.001
Birth cohort (ref.= 1961–70)
1941–50 0.647*** 0.057 0.307 *** 0.064
1951–60 0.567*** 0.057 0.214 *** 0.062
1971–83 –0.754*** 0.096 –0.094 *** 0.106
Macro-area of residence at birth (ref.= North)
Center –0.012 0.054 0.068 0.058
South 0.177*** 0.054 0.291 *** 0.062
Out-migration according to the region of birth (ref.= no out-migration; time-varying)
Out-migration from North 0.269*** 0.098 –0.089 0.104
Out-migration from Center 0.537*** 0.140 –0.151 0.150
Out-migration from South 0.425*** 0.087 0.018 0.092
Educational level (ref.= none or low education; time-varying)
Intermediate education –0.153 *** 0.054
High education –0.015 0.092
Educational status (ref.= no more student; time-varying)
Still in education –0.391 *** 0.087
Occupational status (ref.= non-employed; time-varying)
Employed –0.347 *** 0.052
Type of first union (ref.= religious union; time-varying)
No union –4.148 *** 0.102
Civil union –0.222 ** 0.111
Cohabitation –0.715 *** 0.158
Constant –17.108*** 0.488 –7.169 *** 0.521
Person-years 47,953 47,953
R2 0.109 0.346
Source: Calculations based on ILFI, waves 1997, 1999, 2001, 2003.
Significance: ‘*’=10%; ’**’=5%; ‘***’ =1%.

Demographic Research: Volume 17, Article 24
http://www.demographic-research.org 721
The results in Table 2 confirm some broad regional differentials, but now also
begin to bring geographic mobility into the picture. Women whose origin is in the
South are much more likely to bear a child than their counterparts in the North
(reference region) or the Center. The South is clearly a distinctive geographic area,
since there is no significant difference in the regression equation between the Center
and the North. We also capture the effects of migration, using the next three dummy
variables. Migrants out of any of the three regions exhibit a higher fertility than stayers
or return migrants. The differential for Southern-origin migrants leads to an odds that is
about 50% higher than for other women of the same age and cohort.
In Model 2 of Table 2 we add socio-economic and marital-status traits. We note,
first, that strongly significant age and cohort effects persist. Notably, however, the
cohort effects are moderate in size, even though they operate in the same direction.
Now, however, women born in the 1970s have odds of bearing their first child of about
two-thirds (0.670=exp[–0.094–0.307]) of the women born in the 1940s, with all else
being the same. This is a much smaller difference than before and indicates that much
of the cohort difference is working through marriage behavior. Since the second model
controls for union type (as a time-varying covariate), the declining rates of entry into
marriage across the several cohorts are responsible for part of the decline in the
transition to first birth. It is noteworthy, however, that the adjustment for marriage does
not remove the cohort effect altogether.
Model 2 also shows significant effects for education (intermediate level only) and
labor-force participation. Women with moderate levels of completed education exhibit
appreciably lower rates of transition to first birth, even if everything else (age, cohort,
residential history) is the same. Oddly, women who have continued beyond high-school
education (our ‘high’ category) exhibit no differential fertility, although the effects here
may be working through continuing school enrollment (strongly negative) and
employment. A large body of explanations of fertility decline – worldwide, not just in
Italy – rest on the notion that women’s labor-force participation is a driving force
behind decreasing age at entry into childbearing. We find evidence that is consistent
with this notion: Working in the year prior to the year of exposure reduces the predicted
probability of having a child by about 30%.
Finally, our inclusion in Model 2 of time-varying indicators of union status is
instructive. Our reference category is religious union. Women who are un-partnered
(neither formally married nor in cohabiting) are, not surprisingly, much less likely to
make the transition to first birth. Women who are in civil union display 20% lower odds
of first-birth transition than do women in a religious union. This illustrates the
important way in which union type may indicate a greater degree of secularization.
Women in a cohabitating union are yet again much less likely to bear a child. Recall
that all of these union-status measures are time-varying and lagged one year, so they

Gabrielli, Paterno & White: The impact of origin region and internal migration on Italian fertility
722 http://www.demographic-research.org
allow for changes in union formation over time, unlike some analyses, which are
limited to status at the time of the survey or at a single earlier point.
In the models of Table 2 and Table 3 below, we elect to include women of all
marital statuses, even those not partnered in the year of exposure and those never
married. We do so for two reasons. First, this gives a comprehensive view of the overall
picture of fertility in Italy. It shows, for instance, the way in which entry into marriage
helps to explain some of the cohort decline in childbearing. In addition, the review of
the two models helps to shed light on the behavioral intertwining of marriage and
childbearing. In a country such as Italy, in which most childbearing has occurred within
formal marriage, the decision to marry may be in part a decision to embark on a family-
building trajectory. The ‘control’ for union type may be adjusting for something that is
partly an outcome. Separating the two models helps clarify the relationship and allows
analysts and readers to see how much difference alternative specifications make. We do
estimate below another model (see Table 4), which includes only person-years of
exposure from women who are currently in a union.
In Table 2 the coefficients on the geographic variables (region of origin and
migration) do shift appreciably with the introduction of measures for the other personal
traits. The South (as place of birth and presumed childhood socialization) remains
highly significant, while the Central-region birthplace is still non-significant. Even after
the introduction of all of these controls for personal traits, Southern-born women are
predicted to have annual birth probabilities 34% above other women.
Migration effects are reduced to non-significance in Model 2. Migrants out of the
North and Center are predicted to have somewhat lower rates of transition to first birth,
but standard errors on these coefficients do not lend confidence at conventional levels.
Migrants out of the South exhibit slightly higher fertility levels, net of other traits, but
again, these have relatively large standard errors and we cannot reject the null
hypothesis of no effect.
Taken together, the results are informative. Women who are born in the South and
remain in the region exhibit an appreciably larger fertility than other women. The
apparent differences of migrants and stayers in Model 1 are ‘explained away’ by the
personal traits of education, union status, employment, and so on. Taken together, the
results suggest true regional heterogeneity on the part of the South on the one hand, and
migrant selectivity on the other. Migrants out of the South differ on several
demographic traits related to fertility, but exhibit no further difference in fertility
behavior once the analysis adjusts for these traits. Stated in other words, some of the
regional/migration differentials we observed at first are due to the differential human-
capital composition of the persons at origin and the migrants composing the flows.
Table 3 estimates a model with a different specification for migration, but in which
all other variables and the sample are the same. We do not repeat the discussion above

Demographic Research: Volume 17, Article 24
http://www.demographic-research.org 723
regarding age, cohort, and the time-varying traits of education, labor-force attachment,
and union status. Coefficient values for these traits are not far from those estimated for
Table 2, and the levels of significance remain about the same, too. Our discussion
concentrates on the differential specification and interpretation of the geographic
variables.
Our treatment of the region of origin – dummy-variable for residence at birth in the
Center or South vs. North – remains unchanged. Now, however, we include specific
dummy-variables for each origin–destination pairing. With three geographic macro-
areas there are nine dummy–variable values to contrast with the implicit reference
category of non-migrants. The inclusion of more detail on migrant flows increases the
magnitude of the original region-of-origin coefficients; each value of South and Center
is larger in absolute value in Table 3, Model 1, than the corresponding value in Table 2,
Model 1. In Table 3 the regional contrasts of birth in the South (vs. North) remain
strongly significant, with Southern women expected to bear children at rates about 37%
above their Northern counterparts. The introduction of the full set of controls (Model 2)
raises to marginal significance the coefficient on birth in the Center (vs. North). Thus,
we observe that in Table 3 women who remain in the Center and the South macro-areas
exhibit a higher fertility than do non-migrants in the North.
The predicted effects of being a member of a migratory flow are noteworthy,
although not strong in terms of statistical significance. We find that most migrants
(eight of nine cases) in Model 1 (lacking detailed socio-economic controls) exhibit a
higher fertility than non-migrants. Adding the time-varying socio-economic covariates
in Model 2 generally reduces the magnitude of the values of the several migration
origin–destination dummy variables. Such a change, in turn, demonstrates that the
socio-economic traits are important and differentially represented in the streams of
Italy’s interregional migrants. These socio-economic traits are strongly predictive of
fertility and behave much as in Table 2, so we now concentrate on the migration
coefficients themselves, with emphasis on differentials linked to the South.
Model 1 of Table 2 indicates that the migrants who move out of the six
administrative regions of the South – either to another administrative region within the
South, or to the Center or the North – exhibit a higher fertility subsequent to migration.
The effect is particularly pronounced for migrants to the North, where over 80%
increased odds are predicted. (This is the only one of the two contrasts of Model 1 that
is highly significant.) When other socio-economic traits are introduced (Model 2), the
South-North effect is reduced to non-significance; nevertheless, the dummy on the
South origin increases in magnitude. All this – selective shifts in significance along
with the persistence of certain effects – reinforces understanding the relationship
between regional origins and composition of migrant flows.

Gabrielli, Paterno & White: The impact of origin region and internal migration on Italian fertility
724 http://www.demographic-research.org
Table 3: Determinants of the transition to first birth: discrete time event-
history regression models including the region of childhood residence
and the origin-destination of migration; women aged 15 to 49 years
Model 1 Model 2 Variable Parameter
estimate
Standard
error
Parameter
estimate
Standard
error
Age 1.042 *** 0.037 0.469 *** 0.038
Age2 –0.019 *** 0.001 –0.009 *** 0.007
Cohort of birth (ref.= 1961–70)
1941–50 0.652 *** 0.057 0.298 *** 0.064
1951–60 0.566 *** 0.057 0.205 *** 0.062
1971–83 –0.756 *** 0.096 –0.094 0.106
Macro-area of residence at birth (ref.= North)
Center 0.039 0.058 0.112 * 0.063
South 0.207 *** 0.057 0.314 *** 0.065
Migration according to individual origin–destination combination (ref.= no migration; time-var.)
Migration from North to North 0.379 ** 0.123 0.086 0.131
Migration from North to Center –0.010 0.184 –0.310 * 0.195
Migration from North to South 0.458 0.322 –0.420 0.339
Migration from Center to North 0.156 0.164 0.102 0.178
Migration from Center to Center 0.252 0.181 0.066 0.193
Migration from Center to South 0.150 0.255 –0.039 0.279
Migration from South to North 0.631 *** 0.116 0.087 0.122
Migration from South to Center 0.184 0.157 –0.147 0.166
Migration from South to South 0.192 0.232 0.129 0.252
Educational level (ref.= none or low education; time-varying)
Intermediate education –0.155 *** 0.054
High education –0.010 0.092
Educational status (ref.= no more student; time-varying) Still in education –0.387 0.088
Occupational status (ref.= not employed; time-varying)
Employed –0.355 *** 0.052
Type of first union (ref.= religious union; time-varying)
No union –4.151 *** 0.102
Civil union –0.234 ** 0.112
Cohabitation –1.718 *** 0.159
Constant –17.132 *** (0.488 –7.206 *** 0.522
Person-years 47,953 47,953
R2 0.109 0.346
Source: Calculations based on ILFI, waves 1997, 1999, 2001, 2003.
Significance: ‘*’=10%;’**’=5%; ‘***’=1%.

Demographic Research: Volume 17, Article 24
http://www.demographic-research.org 725
Thus, the South remains distinctive, even after the control for these several
behavioral traits and the more detailed origin–destination migration patterns. Once
again, the indication is that the migratory flows themselves are demographically
selective. After adjusting for these measurable traits, there is little additional behavioral
selection to be seen.
We have estimated this model for an alternative version in which the origin–
destination migration indicator remains ‘on’ for five years at most. (The alternative
model is not shown). If disruption were to operate strongly, we would expect the five-
year-period-lag model to have highly significant coefficients on the migration dummy
variables, but the full-exposure-time model to be less significant. A finding of strong
effects in the model with five-year limits would suggest disruption. Given that we see
no such short-term effect, and given that the pseudo-R2 remains almost identical to the
full-exposure-time model, there is no support for disruption as a mechanism.
Table 4 presents our final set of regression analyses. We include the same
covariate specification as we have done for Table 3, but we now limit the sample to the
person-years of exposure contributed while in union. (We discussed this issue above.)
From an accounting point this is not problematic, as almost all births occur within a
union. Moreover, we exclude only three person-years from the reproductive span of an
individual woman during which the woman is un-partnered. From a theoretical
standpoint, such sample restriction asserts here that those in a union (religious, civil, or
cohabiting) constitute the proper behavioral risk set for the transition to the first child.
The sample restriction reduces the total number of person-years in our discrete time
analysis to 11,022 from 47,953.
The results of this model parallel those we obtained earlier. We find broadly
similar age profiles. In Table 4, Model 1 (omitting the detailed socio-economic
covariates) the cohort effect is moderated considerably from Table 3, Model 1, on the
larger sample of women. In the present table, the most recent cohort (born 1971–83) is
not differentiated from those born in the reference cohort of 1961–70, but the 1970s
cohort exhibits odds of childbearing of about 60% of the 1940s cohort. (The
corresponding odds ratio in Table 3, Model 1, was 24% for the sample of all women.)
This would suggest that much of the differences between the two cohorts we observed
before are due to rates of transition into union rather than to first birth from those
already in a union.
Now turning to Model 2, the predicted effects of the time-varying socio-economic
traits are much as before. The more education possessed by a woman, the lower her
predicted fertility. (Again, it is the women with intermediate education whose
differential is significant.) Women in union who were also students or employed were
less likely to make the transition to first birth. Employed women have predicted birth
odds about 30% below those of non-employed women.

Gabrielli, Paterno & White: The impact of origin region and internal migration on Italian fertility
726 http://www.demographic-research.org
Table 4: Determinants of transition to first birth: discrete time event-
history regression models including the region of childhood residence
and origin-destination of migration; women in union only, aged 15 to
49 years
Model 1 Model 2 Variable Parameter
estimate
Standard
error
Parameter
estimate
Standard
error
Age 0.371 *** 0.039 0.396 *** 0.040
Age2 –0.008 *** 0.001 –0.008 *** 0.001
Cohort of birth (ref.= 1961–70)
1941–50 0.405 *** 0.064 0.342 *** 0.066
1951–60 0.225 *** 0.064 0.210 *** 0.064
1971–83 –0.094 0.121 –0.062 0.121
Macro-area of residence at birth (ref.= North)
Center 0.085 0.064 0.098 0.065
South 0.457 *** 0.064 0.318 *** 0.068
Migration according to individual origin–destination combination (ref.= no migration; time-var.)
Migration from North to North 0.042 0.132 0.090 0.132
Migration from North to Center –0.332 * 0.199 –0.364 * 0.201
Migration from North to South –0.452 0.353 –0.485 0.354
Migration from Center to North 0.087 0.180 0.114 0.181
Migration from Center to Center 0.062 0.197 0.072 0.198
Migration from Center to South –0.066 0.281 –0.015 0.283
Migration from South to North 0.125 0.123 0.077 0.123
Migration from South to Center –0.020 0.167 –0.099 0.168
Migration from South to South –0.063 0.266 0.011 0.267
Educational level (ref.= none or low education; time-varying)
Intermediate education –0.107 * 0.056
High education –0.032 0.095
Educational status (ref.= no more student; time-varying) Still in education –0.254 * 0.091
Occupational status (ref.= not employed; time-varying)
Employed –0.362 *** 0.054
Type of first union (ref.=religious union; time-varying)
Civil union –0.204 * 0.112
Cohabitation –0.672 *** 0.159
Constant –6.015 *** –0.216 –6.095 *** 0.549
Person-years 11,022 11,022
R2 0.043 0.051
Source: Calculations based on ILFI, waves 1997, 1999, 2001, 2003.
Significance: ‘*’=10%; ’**’=5%; ‘***’=1%.

Demographic Research: Volume 17, Article 24
http://www.demographic-research.org 727
We do examine the type of union for this sample of women in union. Women in civil
unions still exhibited odds of first-birth transition of about 80% of those in a religious
union. Transition rates for cohabiting women were considerably lower still – as we have
found for the other cases above.
Regional differences in fertility are still apparent in Table 4. In fact, the South-vs.-
North differential is more pronounced among this sub-sample of women in a union.
Among regional stayers (setting all migration-flow dummy variables to zero in Model
1), women born in the South exhibit odds of first-birth transition about 60% higher than
otherwise equivalent women in the North. Even when adjusting for these characteristics
(Model 2), the differential odds remain 37%. The characteristics of education,
employment, and union type offer only a partial explanation of these regional fertility
differentials.
Several of the interregional migrant indicators (the nine origin–destination dummy
variable contrasts) point to only modest fertility differentials between those who moved
and those who stayed behind. In a model re-introducing broad out-migration groupings
(not shown, but corresponding to Table 2), we also find a South-regional effect but no
migrant effect. We can put the story together across the models. Recall that the first
multivariate model (see Table 2, Model 1) found both a South-origin effect and a
considerable South-out-migration effect. Working across subsequent models – adding
behavioral time-varying covariates and restricting the sample to those in union only –
reduced the migration effect to non-significance but not the South-origin effect.
Half of all internal migrations in Italy (among the person-year observations in our
data) are out-of-South migrations, with 28% of total moves from the South to the North
and another 22% of moves from the South to the Center. The importance of the region
of origin and of the redistribution is shown in Figure 3, which presents a simulation of
Table 4, Model 2 – the sample of women in a union. For covariates other than region or
migration we set values to their mean across the person-years in the models of Table
4.13
We then simulate the probability of birth in a given year for non-movers in each of
the three major regions and for two groups of migrants, those moving South-to-North
and those moving South-to-Center.
Figure 3 recapitulates the strong regional differentials observed among stayers,
especially women in the South, and makes clear that these differentials persist even
after controlling for other socio-economic time-varying traits. The simulation of South–
North migrants indicates a predicted fertility level about the same as women in the
South who do not migrate. The predicted value for South-to-Center migrants is slightly
13 The choice of simulation values is somewhat arbitrary. We used the common practice of using mean values
for non-focal variables, and then varying (of course) the focal variables. The selection of other hypothetical
values would shift the predicted argument of the logit by a constant and the predicted probability by the
corresponding anti-logit. The pattern of simulated values for Table 3, Model 2 (all women) is nearly identical.

Gabrielli, Paterno & White: The impact of origin region and internal migration on Italian fertility
728 http://www.demographic-research.org
lower. Of course, these are predicted values; the formal test shows no statistical
difference from regional effects alone for either of these migrant groups.
Figure 3: Predicted fertility for selected geographic profiles;
women in union only, aged 15 to 49 years
0.000.02
0.040.06
0.080.10
0.120.140.16
0.180.20
0.220.24
North Center South South-North South-Center
Nonmigrants Migrants
Region and migration experience
Pre
dic
ted
pro
ba
bilt
y o
f b
irth
Source: Calculations based on ILFI, waves 1997, 1999, 2001, 2003.
Note: Simulation of other covariates at their sample means.

Demographic Research: Volume 17, Article 24
http://www.demographic-research.org 729
7. Conclusion
This paper informed both our understanding of the determinants of contemporary
Italian fertility and the broader ways in which regional variation and interregional
migration can help to understand the social processes underlying fertility dynamics. We
employed contemporary event-history data, which allowed us to analyze the evolution
of life events with proper timing and sequencing. Our micro-level analysis includes key
demographic socio-economic covariates – age, cohort, education, employment, union
status – and time-varying information drawn from a woman’s residence history.
At an aggregate level, our results chart the substantial decline in Italian fertility in
recent decades. The descriptive results accord with a pattern of cohort decline in
childbearing and in increasing age at first birth. The temporal decline is consistent with
secular changes in Italian society affecting the position of women, such as increasing
female education and female employment, which are implicated in the transition to first
birth. Yet, these changes are only part of the story. Even after having adjusted for
several of these personal characteristics, we find that recent cohorts (women born in the
1960s and 1970s) make the transition to first birth at appreciably lower rates than
women of earlier cohorts, even women who were otherwise in the same socio-economic
and age categories.
Crucial, perhaps, in our analysis is the way in which we demonstrated the interplay
of geographic variation and social characteristics on the transition to marriage and
childbearing. At first sight, our results showed strong regional differentials, especially
in terms of the birthplace in the South versus elsewhere. The initial results also
indicated differentials for migrant streams. Yet, once we controlled for time-varying
personal traits, including education, student status, employment, and union status, the
differences by migrant stream were largely reduced to non-significance. Nevertheless,
our models that include the full set of personal traits still revealed a significant impact
of the place of birth on the predicted reproductive behavior. Among women in union,
the odds of a woman born in the South bearing a child are 1.37 times those of a
comparable woman born in the North.
We return now to our hypotheses and the several mechanisms discussed earlier.
We do find evidence for socialization, the mechanism of our first hypothesis. Our main
indicator of socialization is the place of birth. Even after controlling for key personal
characteristics, women born in the South (and thus presumed to be raised there), do
exhibit a higher fertility than do other women. The behavioral difference is consistent
with the process of socialization, where women adopt the fertility norms of their place
(region) of socialization. Our second hypothesis concerns adaptation. Strong adaptation
to destination community would be indicated by predicted fertility that should match
more closely the destination than the origin, or at least be intermediate between the two.

Gabrielli, Paterno & White: The impact of origin region and internal migration on Italian fertility
730 http://www.demographic-research.org
We find no real evidence for this; differentials for migrants are non-significant (when
other characteristics are adjusted) and the predicted values do not necessarily lie in a
direction consistent with adjustment toward the region of new residence. Future work
may want to analyze data that have more precise and contextual geographic categories
than the data available to us in the Italian Households Panel (ILFI) data.
Our third hypothesis concerns selection, where migrants differ by other observed
social and demographic traits linked to fertility. We do find considerable evidence for
selection. The magnitude of coefficients for migration and region-of-birth effects
(dummy variables in our models) is reduced when covariates measuring socio-
economic traits are introduced. Thus, the evidence indicates that these traits are
differentially distributed among regions and migrant streams, and that demographic
selection operates. Finally, we discuss disruption. We did not anticipate that disruption
would operate in a high-income low-fertility setting, and what is more, other data might
be preferred to detect it. In fact, we find no evidence of short-term differentials for
migrants.
Since we have used detailed longitudinal data and controlled for a number of key
characteristics, it is all the more striking that we find initial and persistent geographic
differentials in the latter portion of the 20th century and into the 21st. Our results point
to the continuing relevance of the socialization during childhood and early adulthood in
later-life patterns of fertility and family formation. Our results also point to the
challenging task of more precisely and definitively identifying the nature of contextual
influences and how they operate at different scales of time and space.
8. Acknowledgements
This paper is part of the project ‘Explaining Very Low Fertility in Italy’ coordinated by
D. Kertzer and M. White (Brown University, Providence), L. Bernardi (Max Planck
Institute for Demographic Research, Rostock), and M. Barbagli (Cattaneo Institute,
Bologna). We are thankful for the support of the US National Institute of Child Health
and Human Development (NIH: R01HD048715) and the US National Science
Foundation (NSF: BCS0418443), which jointly support this project.

Demographic Research: Volume 17, Article 24
http://www.demographic-research.org 731
References
Arru, A., and F. Ramella. 2004. (Eds.). L’Italia Delle Migrazioni Interne. Roma:
Donzelli.
Barbagli, M., M. Castiglioni, and G. Dalla Zuanna. 2003. Fare Famiglia in Italia. Un
secolo di Cambiamenti. Bologna: Il Mulino.
Becker, G. S. 1985. A Treatise on the Family. Cambridge: Harvard University Press.
Bernardi, L., and G. Gabrielli. 2006. Between first and second birth in Italy, Acts of the
XLIII SIS Conference. Padova: CLEUP.
Billari, F. C., and H.-P. Kohler. 2004. Patterns of low and lowest-low fertility in
Europe, Population Studies 58(2): 161–176.
Birindelli, A. M., and F. Heins. 1999. Il profilo per età delle migrazioni interne, in C.
Bonifazi (Ed.), Mezzogiorno e Migrazioni Interne. Roma: IRP-CNR 10,
pp. 207–235.
Bisogno, E. 1997. Le Migrazioni Interne in Italia Nel Periodo 1955–92 e il Loro
Impatto Sulle Strutture Demografiche Regionali. Working-Paper presented at
Giornate di Studio sulla Popolazione, Roma.
Bonaguidi, A., and V. Terra Abrami. 1996. The pattern of internal migration: the Italian
case, in P. Rees, J. Stillwell, A. Convey and M. Kupiszewski (Eds.), Population
Migration in the European Union. London: John Wiley & Sons, pp. 231–245.
Bonifazi, C. 1992. Saldi migratori e studio delle migrazioni interregionali: osservazioni
sul caso italiano, Genus 1–2: 47–67.
Bonifazi, C. 1999. (Ed.). Mezzogiorno e Migrazioni Interne. Roma: IRP-CNR 10.
Bonifazi, C., A. Chieppa, and F. Heins. 1999. Le migrazioni interne meridionali:
un’analisi a Livello Provinciale, in C. Bonifazi (Ed.), Mezzogiorno e Migrazioni
Interne, Roma: IRP-CNR 10, pp. 53–95.
Bonifazi, C., and F. Heins. 2000. Long-term trends of internal migration in Italy,
International Journal of Population Geography 6(2): 111–131.
Bonifazi, C., and F. Heins. 2001. Le dinamiche dei processi di urbanizzazione in Italia e
il dualismo Nord-Sud: un’analisi di lungo period, Rivista Economica del
Mezzogiorno 4: 713–747.
Caselli, G., J. Vallin, and G. Wunsch. 2001. Demografia. La Dinamica Delle
Popolazioni. Roma: Carocci.

Gabrielli, Paterno & White: The impact of origin region and internal migration on Italian fertility
732 http://www.demographic-research.org
Casacchia, O., and S. Strozza. 2001. Le migrazioni interne e internazionali in Italia
dall’unità ad oggi: un quadro complessivo, in L. Di Comite and A. Paterno.
(Eds.), Quelli Di Fuori. Dall’emigrazione All’immigrazione: Il Caso Italiano.
Milano: Franco Angeli, pp. 50–88.
Caldwell, J. 1982. Theory of Fertility Decline. London: Academic Press.
Carlson, E. D. 1985. The impact of international migration upon the timing of marriage
and childbearing, Demography 22(1): 61–72.
Chattopadhyay, A., M. J. White, and C. Debpuur. 2006. Migrant fertility in Ghana:
selection versus adaptation and disruption as causal mechanisms, Population
Studies 60(2): 1–15.
Cote, G. L. 1997. Socio-economic attainment, regional disparities, and internal
migration, European Sociological Review 13(1): 55–77.
Dalla Zuanna, G., and A. Righi. 1999. Nascere Nelle Cento Italie. Comportamenti
Coniugali e Riproduttivi Nelle Provincie Italiane Negli Anni ’80 e ’90.
Argomenti. 18, Roma: ISTAT.
Dalla Zuanna, G., and F. Michielin. 2003. Low Fertility, Persistent Strong Migration
and Social Mobility. The Hidden Motive of the Italian Economic Development,
The Second Demographic Transition in Europe. Euro Conference on Implication
of Family and Fertility Change for Individuals, Families and Society, Spa
Belgio.
Delgado Pérez, M., and M. Livi Bacci. 1992. Fertility in Italy and Spain: the lowest in
the world, Family Planning Perspectives 24(4): 162–171.
Di Comite, L., and E. Moretti. 1999. Geopolitica del Mediterraneo. Roma: Carocci
Editore.
Di Comite, L., and A. Paterno. 1999. Migrazioni e transizione demografica: un secolo
ed oltre di esperienza italiana (1880–1998), in V. Gonzalvez (Ed.), Europa una
Demografia en Trasformació. Alacant: Universitat d'Alacant, pp. 77–98.
Festy, P. 1979. La fécondité des pays occidentaux de 1870 a 1970, Travaux et
Documents 85, Paris: Presses Universitaires de France.
Gabrielli, G., A. Paterno, and M. White. forthcoming. Migrazioni interne e fecondità: il
caso italiano, Rivista Italiana di Economia Demografia e Statistica.
Golini, A., A. Mussino, and M. Savioli. 2000. Il Malessere Demografico in Italia.
Bologna: Il Mulino.

Demographic Research: Volume 17, Article 24
http://www.demographic-research.org 733
Goldstein, A., M. White, and S. Goldstein. 1997. Migration, fertility and state policy in
Hubey Province, China, Demography 34(4): 481–491.
Gorwaney, N., M. D. Van Arsdol, D. M. Heer, and L. A. Schuerman. 1998. Variation in
fertility and earning patterns among immigrants in the United States, 1970–
1980: assimilation or disruption?, International Migration Review 28(4):
451–475.
Guilmoto, C. Z., and S. Frederic. 2001. The internal dynamics of migration networks in
developing countries, Population 13(2): 135–164.
ISTAT. 1997. La fecondità nelle regioni italiane. Analisi per coorti. Informazioni 35,
Roma: ISTAT.
ISTAT. 2006. Natalità e fecondità della popolazione residente: caratteristiche e
tendenze recenti. Anno 2004. Nota informative. Roma: ISTAT.
Kahn, J. R. 1994. Immigrant and native fertility during the 1980s: adaptation and
expectations for the future, International Migration Review 28(3): 501–519.
Kertzer, D. I., M. J. White, L. Bernardi, and G. Gabrielli. 2006. Toward a better theory
of very low fertility: Lessons from Italy. Working-Paper presented at Population
Association of American 2006 Meeting, Los Angeles.
Kohler, H. P., F. Billari, and J. A. Ortega. 2002. The emergence of lowest-low fertility
in Europe during the 1990s, Population and Development Review 24(4):
641–680.
Kohler, H. P., and J. A Ortega. 2003. Below replacement fertility, in P. Demeny and G.
McNicoll (Eds.), Encyclopedia of Population. New York: Macmillan Reference,
pp. 405–409.
Kulu, H. 2005. Migration and fertility: competing hypothesis re-examined, European
Journal of Population 21(1): 51–87.
Lesthaeghe, R. 1995. The second demographic transition in Western countries: an
interpretation, in K. O. Mason and A. M. Jensen (Eds.), Gender and Family
Change in Industrialized Countries. Oxford: Clarendon Press, pp. 17–62.
Livi Bacci, M., and S. Salvini. 2000. Trop de famille et trop peu d'enfants: la fécondité
en Italie depuis 1960, Cahiers Quebecois de Démographie 29(2): 231–254.
Mayer, J., and R. T. Riphahn. 2000. Fertility assimilation of immigrants: evidence from
count data models, Population Economics 13(2): 241–261.

Gabrielli, Paterno & White: The impact of origin region and internal migration on Italian fertility
734 http://www.demographic-research.org
Micheli, G. A. 1995. La Società del Figlio Assente. Voci a Confronto sulla Seconda
Transizione Demografica. Milano: Franco Angeli.
Michelin, F. 2002. Fertility in an Urban Context. A Complex Phenomenon.
Dipartimento di Scienze Statistiche, Università di Padova [Ph. D. thesis].
Payne, G. 1989. Social mobility, The British Journal of Sociology 40(3): 471–492.
Parish, W. L. Jr. 1973. Internal migration and modernization: the European case,
Economic Development and Cultural Change 21(4): 591–609.
Pugliese, E. 2000. L’Italia tra migrazioni internazionali e migrazioni interne, in
Agenzia romana per la preparazione del Giubileo. Migrazioni. Scenari per il
XXI secolo, Roma.
Pugliese, E. 2002. L’Italia tra migrazioni internazionali e migrazioni interne. Bologna:
Il Mulino.
Righi, A., and G. Dalla Zuanna. 1999. Nascere nelle 100 Italie: comportamenti
coniugali e riproduttivi nelle province italiane negli anni ’80 e ’90. Argomenti
18, Roma: ISTAT.
Salvini, S. 2003. La Bassa Fecondità Italiana: La Bonaccia delle Antille? Working-
Paper presented at Conference on La bassa fecondità tra costrizioni economiche
e cambio di valori, Roma.
Santini, A. 1995. Continuità e Discontinuità nel Comportamento Riproduttivo delle
donne Italiane nel Dopoguerra: Tendenze Generali della Fecondità delle Coorti
nelle Ripartizioni tra il 1952 e il 1991. Working-Paper, Dipartimento statistico
dell’Università di Firenze 53.
Termote, M., A. Golini, and B. Cantalini. 1992. Migration and Regional development
in Italy. Roma: IRP-CNR 4.
United Nations. 2006. Compendium of Recommendations on Internal Migration and
Development. New York: Department of Economic and Social Affairs.
Population Division, United Nations.
Van de Kaa, D. J. 1987. Europe’s second demographic transition, Population Bulletin
42(1): 1–47.
Westoff, C. F., M. Bressler, and P. C. Sagi. 1960. The concept of social mobility: an
empirical inquiry, American Sociological Review 25(3): 375–385.

Demographic Research: Volume 17, Article 24
http://www.demographic-research.org 735
White, M., L. Moreno, and S. Guo. 1995. The interrelation of fertility and geographic
mobility in Peru: a hazards model analysis, International Migration Review
29(2): 492–514.

Gabrielli, Paterno & White: The impact of origin region and internal migration on Italian fertility
736 http://www.demographic-research.org
Appendix 1: Total Fertility Rates by region in Italy from 1955–59 to 2000–04
Total Fertility Rate
Region 1955–59 1960–64 1965–69 1970–74 1975–79 1980–84 1985–89 1990–94 1995–99 2000–04
Piemonte 1.58 1.90 2.13 2.06 1.67 1.25 1.09 1.08 1.08 1.20
Valle d’Aosta 1.70 1.97 2.17 2.10 1.69 1.25 1.15 1.11 1.14 1.27
Lombardia 1.89 2.16 2.31 2.12 1.72 1.32 1.15 1.11 1.12 1.26
Trentino-A.A. 2.52 2.79 2.82 2.41 1.86 1.57 1.40 1.38 1.40 1.47
Veneto 2.34 2.54 2.55 2.31 1.80 1.35 1.16 1.11 1.13 1.25
Friuli V.G. 1.79 2.01 2.08 1.99 1.56 1.17 1.03 1.00 1.00 1.14
Liguria 1.47 1.78 1.97 1.85 1.42 1.07 1.00 0.99 0.97 1.09
Emilia-Romagna 1.71 1.93 2.01 1.94 1.51 1.10 0.97 0.99 1.03 1.23
Toscana 1.70 1.92 2.03 1.97 1.61 1.22 1.08 1.04 1.03 1.17
Umbria 1.84 1.97 2.02 1.95 1.72 1.42 1.23 1.14 1.11 1.22
Marche 1.99 2.09 2.14 2.06 1.78 1.42 1.23 1.17 1.13 1.21
Lazio 2.2 2.44 2.48 2.31 1.88 1.49 1.29 1.23 1.15 1.23
Abruzzo 2.29 2.54 2.44 2.33 2.00 1.68 1.43 1.33 1.18 1.17
Molise a a
2.54 2.40 2.11 1.75 1.54 1.37 1.20 1.14
Campania 3.19 3.36 3.42 3.11 2.64 2.22 1.92 1.74 1.53 1.47
Puglia 3.28 3.30 3.28 2.94 2.60 2.05 1.71 1.55 1.36 1.32
Basilicata 3.21 3.12 3.11 2.81 2.40 1.97 1.70 1.51 1.27 1.22
Calabria 3.37 3.35 3.22 2.87 2.49 2.13 1.84 1.61 1.33 1.25
Sicilia 3.02 3.06 3.01 2.81 2.44 2.05 1.86 1.73 1.47 1.41
Sardegna 3.56 3.39 3.20 2.89 2.39 1.81 1.45 1.23 1.03 1.04
Italia 2.34 2.51 2.57 2.37 1.98 1.58 1.37 1.30 1.22 1.28
Source: Calculations based on ISTAT data (several years). a– Until 1963 Abruzzo was joint to the Molise territory. The data before 1963 present the united regions.

Demographic Research: Volume 17, Article 24
http://www.demographic-research.org 737
Appendix 2: Median age at first birth (years) by region in Italy,
from 1955–59 to 2000–01
Median age at a first birth
Region 1955–59 1960–64 1965–69 1970–74 1975–79 1980–84 1985–89 1990–94 1995–99 2000–01
Piemonte 26.2 25.8 25.5 25.0 25.0 25.8 26.9 28.0 29.0 29.0
Valle d’Aosta 25.3 25.2 24.8 24.7 24.6 25.4 26.5 27.7 28.7 28.9
Lombardia 26.5 26.1 25.7 25.2 25.2 25.9 27.1 28.2 29.2 29.5
Trentino-A.A. 27.0 26.6 26.2 25.7 25.6 26.1 27.1 27.8 28.6 28.7
Veneto 26.0 25.8 25.3 24.9 24.7 25.6 26.9 28.1 29.2 29.4
Friuli V.G. 25.8 25.6 25.1 24.8 24.8 25.7 27.0 28.4 29.3 29.6
Liguria 26.8 26.5 26.1 25.7 25.8 26.7 27.8 28.9 29.8 29.8
Emilia-Romagna 25.5 25.4 25.1 24.7 24.7 25.5 26.9 27.4 29.0 29.1
Toscana 26.0 25.8 25.6 25.3 25.1 25.8 27.1 28.2 29.3 29.6
Umbria 25.3 25.3 25.0 24.9 24.8 25.4 26.4 27.7 28.8 29.0
Marche 25.3 25.2 25.0 24.9 24.8 25.4 26.3 27.7 28.8 28.9
Lazio 25.7 25.7 25.3 25.2 25.0 25.7 24.8 28.1 29.3 29.6
Abruzzo 25.2 25.2 24.7 24.7 24.4 24.9 25.9 27.1 28.4 28.8
Molise a
a 24.2 24.3 24.4 24.8 25.6 26.7 28.1 28.6
Campania 26.3 26.1 25.5 25.1 24.9 25.0 25.5 26.2 27.0 27.1
Puglia 25.5 25.6 25.1 24.6 24.4 24.7 25.4 26.3 27.2 27.6
Basilicata 25.0 25.0 24.6 24.8 24.7 25.0 25.6 26.7 27.8 28.3
Calabria 24.8 24.8 24.4 24.4 24.2 24.5 25.0 25.8 27.1 27.6
Sicilia 24.7 24.7 24.5 24.2 24.1 24.4 24.9 25.7 26.6 27.0
Sardegna 25.9 26.3 26.1 25.8 25.5 25.8 26.5 27.6 28.8 29.2
Italia 25.8 25.7 25.3 25.0 24.8 25.4 26.3 27.3 28.4 28.7
Source: Calculations based on ISTAT data (several years). a– Until 1963 Abruzzo was joint to the Molise territory. The data before 1963 present the united regions.

Gabrielli, Paterno & White: The impact of origin region and internal migration on Italian fertility
738 http://www.demographic-research.org
Appendix 3: Average annual rate of in-migration from the remainder of Italy
(per 1000 inhabitants) by region, from 1955–59 to 2000–04
Average annual rate of in-migration
Region 1955–59 1960–64 1965–69 1970–74 1975–79 1980–84 1985–89 1990–94 1995–99 2000–04
Piemonte 44.3 54.3 45.9 39.8 28.6 28.4 27.2 23.6 28.9 28.3
Valle d’Aosta 29.8 28.9 33.4 35.0 27.6 27.0 30.3 28.1 36.4 36.2
Lombardia 36.2 43.7 37.9 32.8 25.7 25.3 24.6 21.3 27.6 29.4
Trentino-A.A. 23.6 27.2 25.6 24.4 18.9 18.8 17.8 15.9 20.2 21.5
Veneto 26.3 29.9 27.5 27.1 21.1 21.1 19.2 17.5 23.3 26.1
Friuli V.G. 28.1 27.3 27.2 27.4 22.1 20.9 19.0 16.4 21.6 25.7
Liguria 30.9 35.9 28.1 28.2 20.2 21.7 23.0 27.6 23.5 22.1
Emilia-Romagna 38.6 41.0 30.2 27.7 21.4 21.3 19.2 18.9 25.7 29.1
Toscana 31.0 34.8 29.8 27.8 20.5 20.9 19.7 17.3 21.8 24.0
Umbria 24.7 26.2 20.6 20.8 16.5 17.1 14.9 13.9 17.4 18.1
Marche 30.8 31.2 26.7 25.2 19.4 19.0 16.1 14.4 19.0 21.4
Lazio 24.6 33.2 25.4 22.8 18.3 20.7 18.6 16.9 17.9 20.0
Abruzzo 20.5 22.2 24.0 25.7 21.6 21.7 19.7 16.7 18.2 18.8
Molise a a
19.4 24.5 20.4 21.4 17.1 14.5 14.9 15.0
Campania 20.0 21.9 22.7 25.1 21.4 23.4 20.7 18.2 21.0 19.7
Puglia 16.6 19.3 18.3 19.8 16.4 17.7 14.8 11.3 12.3 11.7
Basilicata 17.2 18.1 18.6 22.1 17.4 17.5 13.9 15.4 12.5 10.3
Calabria 16.8 18.9 19.6 20.6 19.0 21.2 17.4 13.8 15.1 14.3
Sicilia 20.0 23.0 20.8 22.3 19.1 22.6 19.9 18.0 17.5 16.0
Sardegna 26.7 27.6 26.9 26.3 22.4 24.0 21.2 16.3 18.5 17.0
Source: Calculations based on ISTAT data (several years). a– Until 1963 Abruzzo was joint to the Molise territory. The data before 1963 present the united regions.
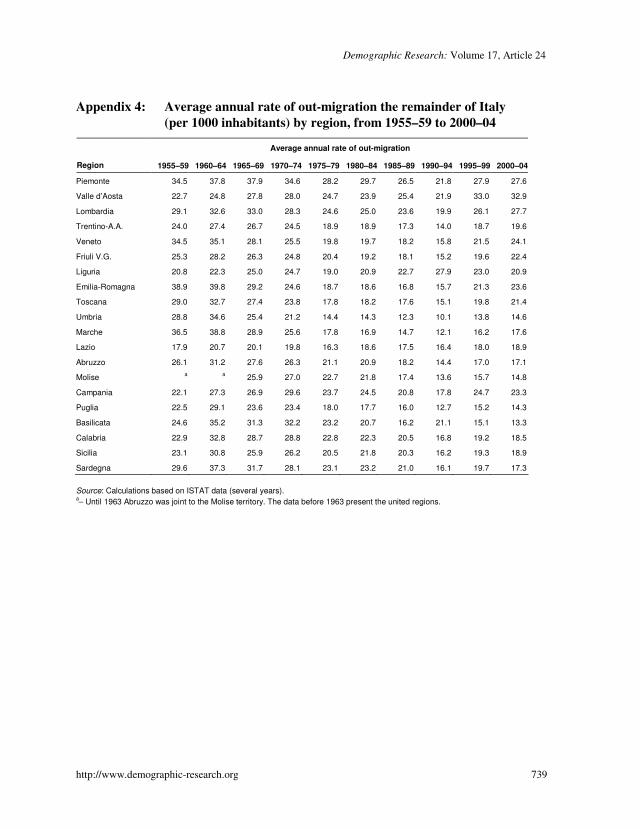
Demographic Research: Volume 17, Article 24
http://www.demographic-research.org 739
Appendix 4: Average annual rate of out-migration the remainder of Italy
(per 1000 inhabitants) by region, from 1955–59 to 2000–04
Average annual rate of out-migration
Region 1955–59 1960–64 1965–69 1970–74 1975–79 1980–84 1985–89 1990–94 1995–99 2000–04
Piemonte 34.5 37.8 37.9 34.6 28.2 29.7 26.5 21.8 27.9 27.6
Valle d’Aosta 22.7 24.8 27.8 28.0 24.7 23.9 25.4 21.9 33.0 32.9
Lombardia 29.1 32.6 33.0 28.3 24.6 25.0 23.6 19.9 26.1 27.7
Trentino-A.A. 24.0 27.4 26.7 24.5 18.9 18.9 17.3 14.0 18.7 19.6
Veneto 34.5 35.1 28.1 25.5 19.8 19.7 18.2 15.8 21.5 24.1
Friuli V.G. 25.3 28.2 26.3 24.8 20.4 19.2 18.1 15.2 19.6 22.4
Liguria 20.8 22.3 25.0 24.7 19.0 20.9 22.7 27.9 23.0 20.9
Emilia-Romagna 38.9 39.8 29.2 24.6 18.7 18.6 16.8 15.7 21.3 23.6
Toscana 29.0 32.7 27.4 23.8 17.8 18.2 17.6 15.1 19.8 21.4
Umbria 28.8 34.6 25.4 21.2 14.4 14.3 12.3 10.1 13.8 14.6
Marche 36.5 38.8 28.9 25.6 17.8 16.9 14.7 12.1 16.2 17.6
Lazio 17.9 20.7 20.1 19.8 16.3 18.6 17.5 16.4 18.0 18.9
Abruzzo 26.1 31.2 27.6 26.3 21.1 20.9 18.2 14.4 17.0 17.1
Molise a
a 25.9 27.0 22.7 21.8 17.4 13.6 15.7 14.8
Campania 22.1 27.3 26.9 29.6 23.7 24.5 20.8 17.8 24.7 23.3
Puglia 22.5 29.1 23.6 23.4 18.0 17.7 16.0 12.7 15.2 14.3
Basilicata 24.6 35.2 31.3 32.2 23.2 20.7 16.2 21.1 15.1 13.3
Calabria 22.9 32.8 28.7 28.8 22.8 22.3 20.5 16.8 19.2 18.5
Sicilia 23.1 30.8 25.9 26.2 20.5 21.8 20.3 16.2 19.3 18.9
Sardegna 29.6 37.3 31.7 28.1 23.1 23.2 21.0 16.1 19.7 17.3
Source: Calculations based on ISTAT data (several years). a– Until 1963 Abruzzo was joint to the Molise territory. The data before 1963 present the united regions.

Gabrielli, Paterno & White: The impact of origin region and internal migration on Italian fertility
740 http://www.demographic-research.org
Recommended