Research papers
The Gulf of Cadiz Gap wind anticyclones
Alvaro Peliz a,1, Dmitri Boutov a,b, Ana Barbosa Aguiar a, Xavier Carton cQ1
a Instituto Dom Luiz, Faculdade de Cincias, Universidade de Lisboa, Lisboa, Portugalb Centro de Oceanografia, Faculdade de Cincias, Universidade de Lisboa, Lisboa, Portugalc Laboratoire de Physique des Oceans, UMR6523 CNRS/IFREMER/UBO, UFR Sciences, Brest, France
a r t i c l e i n f o
Article history:Received 21 January 2014Received in revised form28 June 2014Accepted 2 September 2014
Keywords:Mesoscale eddiesWind curl-induced eddiesGap windsStrait of GibraltarGulf of Cadiz
a b s t r a c t
We describe surface anticyclones developing in summer time after persistent Levanter (i.e., easterly) gapwinds in the Gulf of Cadiz. The process of generation of these eddies is similar to those formed in thetropical Pacific eastern margin in many aspects, but their evolution and fate are different. Theanticyclones are surface intensified structures with a radius of about 30 km, reach velocity maximaexceeding 30 cm/s, and have a strong baroclinic signature in the upper 150 m. They form when thethermocline is thin and shallow, after persistent easterly gap wind jets blowing through the Strait ofGibraltar. A conspicuous cold filament (nearly 8 1C negative anomaly), protruding seaward approxi-mately aligned with the wind jet, is the first observable evidence of the phenomenon. An anticycloniceddy is generated in the northern limb of the filament, and gradually acquires a rounded shape. No clearsign of a cyclonic counterpart is detected. The eddy remains trapped at the slope in close interaction withthe Gulf of Cadiz slope Current (that feeds the Atlantic Inflow into the Mediterranean), and within atime-scale of 1–2 months the eddy dissipates by interaction with the Inflow and in some cases isswallowed into the Strait of Gibraltar. In 23 years (1991–2013) of satellite SST images we discovered 16events (�0.7/yr). In a 20-yr simulation (1989–2008), 13 eddies were observed (�0.65/yr). The vastmajority of eddies were observed in the August–October period. An event in 1997 is followed in SSTimagery and with in situ hydrology data. This event is reproduced in the model in great detail and ananalysis of its dynamics is presented. Q2
& 2014 Elsevier Ltd. All rights reserved.
1. Introduction
The process of generation of eddies induced by cross-shorewind jets was first studied in detail by Clarke (1988) and McCrearyet al. (1989). This type of eddies is very frequent near the easternmargin of the tropical Pacific (see a review in Willett et al., 2006),but reports of similar structures in other ocean's margins are stillmissing. These eddies are formed due to the strong curl of a cross-shore wind jet. The winds are narrow inertial flows blowingseaward with cross scales of several tens of kilometers andoffshore scales up to a few hundreds, and time scales of severaldays to weeks. If the thermocline is sufficiently thin and shallow,the pumping produced by the Ekman transport divergenceinduces an uplift of the pycnocline and a dipolar eddy may occur(McCreary et al., 1989). The shallow side tends to erode quickly byvertical mixing with development of a cold filament there. Eitherno clear cyclonic structure is formed or it quickly dissipates(McCreary et al., 1989, and also confirmed in observations byTrasvina et al., 1995; Trasvina and Barton, 2008).
Here, we describe for the first time the formation of anti-cyclones generated downstream of the Strait of Gibraltar by gapwinds associated with persistent Levanter events (sometimescalled Levantine winds). For abbreviation we shall refer to themas Levanter Anticyclones (LAs). LAs have several common aspectswith the eastern tropical Pacific eddies in what concerns theirgeneration, but they are peculiar in many other aspects, namelythe fact that they remain trapped at the slope and also in the waythey dissipate. The oceanographic context where both types ofeddies appear is also very different.
The hydrology and circulation of the shelf and upper slope in theGulf of Cadiz has been the subject of several investigations andreview works in recent years (Sánchez and Relvas, 2003; GarciaLafuente and Ruiz, 2007; Relvas et al., 2007; Peliz et al., 2009a;Prieto et al., 2009). The upper layer is dominated by a strongseasonal cycle with a sustained warming during spring and earlysummer reaching SST values in the order of 25 1C by July. Later inthe summer, the shelf and slope zones in the Gulf are dominated byfrequent upwelling favorable winds that prevent further warmingof the upper layer. The slope flow in summer time, is characterizedby persistent equatorward currents, a pattern very clear in thestatistics of the PE buoy (see PE buoy location in Fig. 1) as it isdescribed in Garcia Lafuente and Ruiz (2007), Peliz et al. (2009a),
123456789
101112131415161718192021222324252627282930313233343536373839404142434445464748495051525354555657585960616263646566
676869707172737475767778798081828384858687888990919293
Contents lists available at ScienceDirect
journal homepage: www.elsevier.com/locate/csr
Continental Shelf Research
http://dx.doi.org/10.1016/j.csr.2014.09.0040278-4343/& 2014 Elsevier Ltd. All rights reserved.
E-mail address: [email protected] (A. Peliz).1 Tel.: þ351 21 7500810; fax: þ351 21 7500119.
Please cite this article as: Peliz, A., et al., The Gulf of Cadiz Gap wind anticyclones. Continental Shelf Research (2014), http://dx.doi.org/10.1016/j.csr.2014.09.004i
Continental Shelf Research ∎ (∎∎∎∎) ∎∎∎–∎∎∎
and Prieto et al. (2009). In the other seasons, the upper slope flowin the PE buoy site decreases significantly and presents sporadicreversals. This circulation pattern was linked to the seasonal cycleof the atmospheric forcing in earlier papers. Recent works (Pelizet al., 2009a, 2013a) defend that the upper slope flow (the Gulf ofCadiz upper slope Current – GCC – as coined in Peliz et al., 2009a)is associated with the inflow into the Mediterranean and conse-quently it should be a persistent current with weak seasonality.The apparent contradiction with the clear seasonality at the PEbuoy site is resolved in Peliz et al. (2013a). In the latter work, it isshown that the seasonal currents at the PE buoy site are associatedwith seasonal changes in the intensity, width and core position(in the across-slope direction) of the GCC. In summary, the upperslope zone where the LAs are formed is dominated by equator-ward currents, that feed the inflow into the Mediterranean.In what concerns the wind forcing, the Gulf of Cadiz in summertime is characterized by North-Northwest (N-NW) events alter-nating with East (E) episodes (Sanchez et al., 2007; Boutov et al.,2014). Close to the strait, the orography (Fig. 1) favors zonal flowthrough the Strait of Gibraltar and easterlies become recurrent.Yearly averaged winds are N-NW in the western part of the Gulfand gradually become E near the Strait (see Fig. 1 in Sanchez et al.,2007). The alternation between N-NW and E episodes makes thezonal flow pattern as the dominant mode of variability in surfacewind EOF analysis (see Fig. 5 in Boutov et al., 2014). Duringparticularly strong easterlies (Levanter), the flow-topographyinteraction promotes the development of gap winds (PalomaresLosada, 1999; Capon, 2006; Peliz et al., 2009b) which induce a verystrong laterally sheared jet about 200 km long and a few tenskilometres across. These winds induce significant Ekman pumpingvia surface stress curl leading to a rapidly established cold filament(Peliz et al., 2009b).
Peliz et al. (2009b) simulated the upper ocean response to gapwinds in the Strait of Gibraltar (Fig. 1) and explained the formation
of the filaments, but their experiments were too short to allow forobservations of the development of anticyclones.
In the next section, we describe the data and the simulationsthat were used. Next we describe three events (1997, 2003 and2013) using observations. Afterwards, we analyze first two modelLAs in the same time periods as the reported observations. Thelatest event is not covered by simulations yet. Finally, we summar-ize and discuss the results.
2. Data and methods
2.1. Observations
A database of SST satellite images of the Gulf of Cadiz coveringthe period from 1991 to 2013 was inspected to search for LAevents. From 1991 to 2005 the images consisted of high-resolutionLevel 2 NOAA-AVHRR (1.1�1.1 km/pixel) data (Centro de Oceano-grafia, FCUL archive). After 2002 the MODIS data (Aqua and Terra,http://oceancolor.gsfc.nasa.gov/) were also used.
6-hour gridded CCMP (Cross-Calibrated Multi-Platform) winds(ftp://podaac-ftp.jpl.nasa.gov/allData/ccmp/L3.0/flk/) were usedfor the 1997 and 2003 events. For the event of 2013, a time seriesof ASCAT winds at the western mouth of the Strait, is used to showthe Levanter circulation. Daily gridded ASCAT data were down-loaded from the ftp://ftp.ifremer.fr/ifremer/cersat/products/gridded/MWF/L3/ASCAT/ archive.
Both databases (ASCAT and CCMP) are on the same grid withresolution of 0.251.
To compare model results with the observations, in-situmoored buoy data (ocean currents at 3 m depth and wind at 2 mheight) from Spanish Puertos del Estado (PE buoy; www.puertos.es) in the Gulf of Cadiz (36.481N, 006.961W) was used. Thesampling period of these data is 1 h.
123456789
101112131415161718192021222324252627282930313233343536373839404142434445464748495051525354555657585960616263646566
676869707172737475767778798081828384858687888990919293949596979899
100101102103104105106107108109110111112113114115116117118119120121122123124125126127128129130131132
200 200
200
200
200
200
600
600
600
600
600
600
600
1000
1000
1000
1000
1000
2000
2000
2000
3000
3000
9oW 8oW 7oW 6oW 5oW 30’
35oN
30’
36oN
30’
37oN
30’
St.
Gib
CSM
Gua
dalq
uivir
Med
. Sea
Gulf of Cadiz
PEbuoy
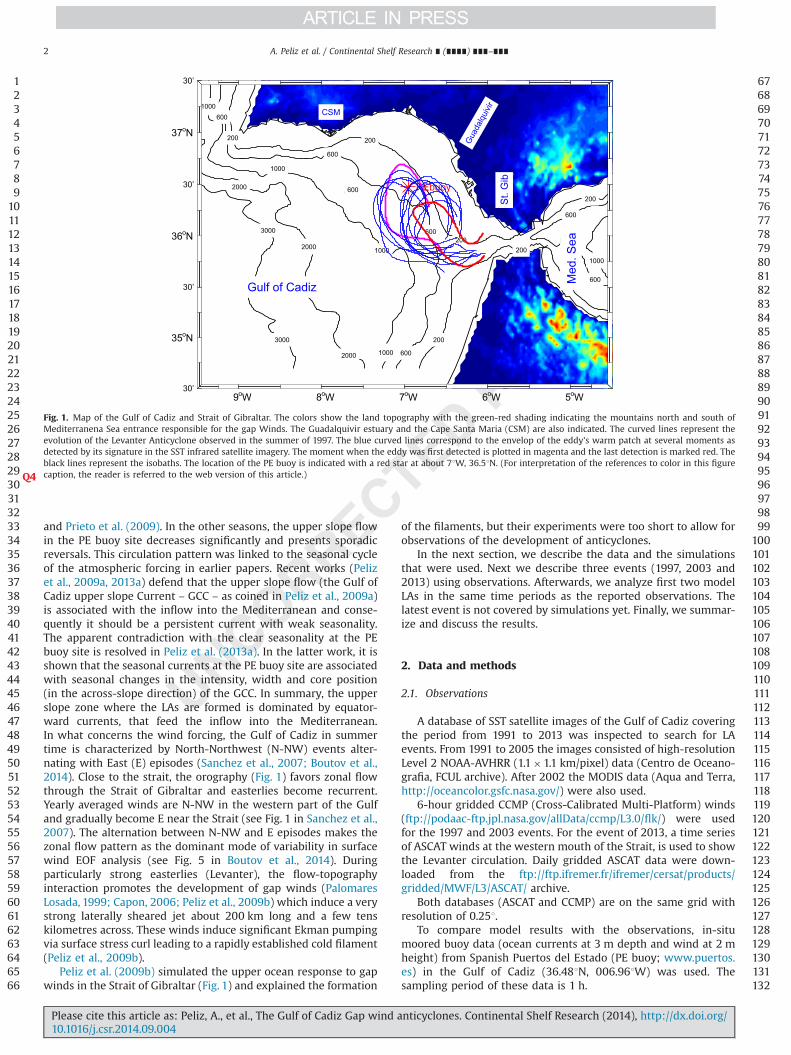
Fig. 1. Map of the Gulf of Cadiz and Strait of Gibraltar. The colors show the land topography with the green-red shading indicating the mountains north and south ofMediterranena Sea entrance responsible for the gap Winds. The Guadalquivir estuary and the Cape Santa Maria (CSM) are also indicated. The curved lines represent theevolution of the Levanter Anticyclone observed in the summer of 1997. The blue curved lines correspond to the envelop of the eddy's warm patch at several moments asdetected by its signature in the SST infrared satellite imagery. The moment when the eddy was first detected is plotted in magenta and the last detection is marked red. Theblack lines represent the isobaths. The location of the PE buoy is indicated with a red star at about 71W, 36.51N. (For interpretation of the references to color in this figurecaption, the reader is referred to the web version of this article.)Q4
A. Peliz et al. / Continental Shelf Research ∎ (∎∎∎∎) ∎∎∎–∎∎∎2
Please cite this article as: Peliz, A., et al., The Gulf of Cadiz Gap wind anticyclones. Continental Shelf Research (2014), http://dx.doi.org/10.1016/j.csr.2014.09.004i

A CTD section of CANIGO 97 (Section 5, 12–13 September)cruise is used to describe the internal structure of one LA. TheseCTD data have been used in several papers (e.g., Borenäs et al.,2002).
2.2. Model simulations
A 20-year long (1989–2008) 2 km (32 σ levels) resolutionsimulation is used to describe the dynamics of the model LA.The model is documented in Peliz et al. (2013a,b). These simula-tions are forced with high-resolution model winds described inSoares et al. (2012). We use 3D 2-day averaged data of salinitytemperature and velocity to describe the LAs events in the model.The dates of the outputs correspond to the central time of the2-day averaging period.
2.3. Detection of events
After testing different criteria for the identification of eddies,like for example looking for all SST images after 5-day periods ofeasterly winds above 10 m/s (our first guess), we discovered thatLA events could be detected in SST quicklook databases very easilywithout the need for reprocessing all images. To facilitate theprocess the analysis was restricted to the period May–November,and all images were checked regardless of wind conditions.It wasconcluded that LA situations are very unequivocal since they havea very sharp filament-like SST signature at the beginning, and aprolonged very warm core eddy-type signature during a substan-tial period usually lasting beyond several passing synoptic situa-tions. What is not so clear sometimes, is whether the spotted LAsin SST scenes are independent or the same event, after longperiods of clouded sky. At least in 2003, two situations seem tocorrespond clearly to two independent events.
In what concerns the model outputs, the signature of LA in thedynamical fields is so clear that there is no need for disambigua-tion. No other process or type of eddies of such magnitudes wereobserved in those places. The model LAs were easily traced in thesurface flow magnitude and vorticity fields.
3. Results
3.1. Wind forcing during Levanter events
Fig. 2 shows the wind vector time series (the axis of the windvectors was rotated 901 anticlockwise such that easterlies areclearly seen and point to the bottom of the page) near the Straits ofGibraltar, with 6 h interval for 1997 (a) and 2003 (b) and dailyaveraged for 2013 (d). The 6 h averaged observed winds at theCadiz PE buoy are shown for 2003 only (c), since there were nodata available for the study period of 1997.
The three events are slightly different in what concerns thewind persistence. The easterlies in 1997 seemed to be more pulse-like whereas in 2003 the episodes were shorter but more stable.Both events happened during August–September and lasted onthe order of 2–3 weeks. The winds in 2013 are a mixture of theprevious situations. They have a period of persistent Levanterbetween 22 June and 10 July, and a more pulse like period after31 July.
Fig. 3 shows the spatial structure of the wind jet for the periodsbefore and during the peak of the event (1997, 2003 and 2013cases). As it is typical of summer time, the north winds prevailmost of the time. The establishment of easterlies (Levanter events)produces a significant change of the wind forcing in the Gulf ofCadiz (Fig. 2). A wind jet is formed in the lee of the Strait withsurface velocities exceeding 10 m/s and maxima exceeding 20 m/s
(as measured in Tarifa meteorological Station for example). The jetextends offshore for about 250 km (a value about half of theTehuantepec cases). The wind jet has the tendency to curl antic-yclonically. For that reason its axis is not aligned with the Straitbut slightly bends northwestward.
The spatial structure of wind curl during Levanter jet is alsoshown in Fig. 3. The wind curl in CCMP winds is lower than in themodel winds (not shown). In the case of the model, the winds nearthe strait are 3 times as large as those at the PE buoy site (thecomparison of model and buoy winds is analyzed in Peliz et al.,2013a). Although for different events, the wind curl magnitude isalso higher in ASCAT than in CCMP (see the middle row in Fig. 3).In this context, we believe that CCMP winds underestimate thecurl probably because it is a blended product with substantialspace averaging.
3.2. The 1997 LA in observations
The wind and upper ocean stratification in the summer of 1997favored the generation of a LA (hereafter LA97) that could betracked in several satellite SST maps (the dates of the SST scenesare indicated in the Fig. 2, blue stars). The SST sequence corre-sponding to the LA 97 event is shown in Fig. 4 from the end ofAugust till mid October. The selection of this event for analysis isalso associated with the fortunate coincidence of a CTD sectionwhich crossed the anticyclone (to be shown later).
The first image (30 August) shows the situation just before thewind turned to Levanter conditions. The waters are colder almosteverywhere on the shelf area with the exception of the warmerpatch associated with the Guadalquivir river plume. The PE buoycurrents (black arrow; the scale is provided in the last frame),show a typical Gulf of Cadiz slope Current (GCC; Peliz et al.,2009a), with along-slope equatorward velocities above 20 cm/s,a typical mean value for the flow (see, Garcia Lafuente and Ruiz,2007 and Peliz et al., 2013a).
On 8 September, the easterly winds were fully developed (seeFig. 2) and the filament rooted at the southern border of the Straitadvected waters up to 81 colder than those offshore. The filamentshowed a tendency to curl anticyclonically, warping up warmerwater from the north. Along the northern coast, the Guadalquivirwarm plume circulated westward and part of it was entrained inthe GCC and pushed southeast along the shelf break. The surfacecurrents at the PE buoy decreased in magnitude but did notchange in direction.
The period between 9 and 16 September is characterized by arelaxation of the Levanter circulation. The SST maps become clearagain by 19 September when a second episode of easterlies wasactive. The sequence of images up to 22 September shows thephase when the anticyclone acquired a round shape. The filamentat this stage exhibited a dipolar structure, with a weakened orfaded cyclonic side. The eastern north-eastern edge of the antic-yclone coincided with the PE buoy site where the currentsremained southeastward. The next sequence of images of 1–15October (the last rows in Fig. 4) shows the decay period. TheLevanter circulation started to decrease (see Fig. 2), and the colderpatch near the Strait mouth faded out. In the beginning of October,the eddy's warm signature seemed to get even stronger than in thelast scene, while moving southwestward near the slope zone, andthe current's direction at PE buoy changed. The waters havecounter-circulated southwestward along the northern border ofthe anticyclone (i.e., cyclonically). This change in the shelf slopeflow (judging by the behavior of the currents at the PE buoy) wasmaintained till the end of the image sequence. A simple first-orderinterpretation is that when the eddy approached the slope, theGCC was interrupted in the upstream side and the flow reversed.The inflow into the Mediterranean, however, was conserved and
123456789
101112131415161718192021222324252627282930313233343536373839404142434445464748495051525354555657585960616263646566
676869707172737475767778798081828384858687888990919293949596979899
100101102103104105106107108109110111112113114115116117118119120121122123124125126127128129130131132
A. Peliz et al. / Continental Shelf Research ∎ (∎∎∎∎) ∎∎∎–∎∎∎ 3
Please cite this article as: Peliz, A., et al., The Gulf of Cadiz Gap wind anticyclones. Continental Shelf Research (2014), http://dx.doi.org/10.1016/j.csr.2014.09.004i

must have been fed somehow by the waters in the vicinity, whichmay have caused the swallowing of the eddy by the Strait. Notethe evolution of the eddy from 10 to 15 October and the currentsat the PE buoy. A scheme of the LA97 evolution is provided in
Fig. 1. The lines indicate that the eddy's warm patch envelopeat each moment of the image sequence in Fig. 4. The first and thelast situations are highlighted in magenta and red, respectively.The eddy started with an elliptical shape, progressively acquired
123456789
101112131415161718192021222324252627282930313233343536373839404142434445464748495051525354555657585960616263646566
676869707172737475767778798081828384858687888990919293949596979899
100101102103104105106107108109110111112113114115116117118119120121122123124125126127128129130131132
15 24 2 11 20 29 8 17 26 4 13 22−15
−10
−5
0
5
10
voNtcOpeSguA
[m/s
]
N
15 24 2 11 20 29 7 16 25 4 13 22−15
−10
−5
0
5
10
tcOpeSguAluJ
[m/s
]
N
15 24 2 11 20 29 7 16 25 4 13 22−15
−10
−5
0
5
10
tcOpeSguAluJ
[m/s
]
N
2 11 20 29 8 17 26 4 13 22 31 9−15
−10
−5
0
5
10
peSguAluJnuJ
[m/s
]
N
Fig. 2. Wind stick plots for 1997 (a), 2003 (b), and 2013 (d) at the western mouth of the Strait. For the 2003 event, wind measurements at the Cadiz Buoy (Puertos del Estado;Spain) are available (c). The axis was rotated 901 anticlockwise for clarity: North is on the left (see black arrow) and west on the bottom of the page. The blue stars indicatethe dates of the SST images used in the paper. The blue rectangles indicate time period of the analysed SST images. (For interpretation of the references to color in this figurecaption, the reader is referred to the web version of this article.)
A. Peliz et al. / Continental Shelf Research ∎ (∎∎∎∎) ∎∎∎–∎∎∎4
Please cite this article as: Peliz, A., et al., The Gulf of Cadiz Gap wind anticyclones. Continental Shelf Research (2014), http://dx.doi.org/10.1016/j.csr.2014.09.004i

a rounded shape as its centroid moves over the shelf break-slopezone, and finally it become zonally squeezed just before beingabsorbed into the Mediterranean Sea.
3.3. The LA97 internal structure
Due to a fortunate coincidence the LA97 was cross-surveyedalong Section 5 of the CANIGO97 cruise. These data are describedin several papers (see for example Borenäs et al., 2002; Ambar etal., 2008) and for the sake of conciseness we do not repeat herethe details of the data set.
Fig. 5 shows the (a) salinity, (b) temperature, (c) density andcross-section geostrophic velocity (referred to 350 dbar). In thelast plot (d), we present the clearest SST image close to the surveydays (9 September instead of 12 September; see also Fig. 4). In thisplot, the black dots show the stations, and the black vectorsrepresent the cross-section geostrophic velocity averaged overthe surface 20 m layer.
The stratification is concentrated in the upper 100 m, and theeddy has a warmer ð423 1CÞ, and saltier ð436:6Þ core at about80 m deep. The pycnocline deformation (using for example theσt¼26) is about 50 m. Over the shallow side, along the axis of thefilament, the water may reach salinities below 36.4 and tempera-tures around 201. The minima can be much smaller in the core ofthe filament near the Strait. The SST image in Fig. 5(d), indicatesthat near the root of the filament the SST is below 18 1C hinting tothe fact that the water near the Strait is being upwelled from
depths below 100 m. The cross-section geostrophic velocitiesreach values above 0.3 m/s.
The total eddy size is about 70 km, and the distance between theeddy's azimuthal/swirl velocity peaks is nearly 40 km. The surfacevelocity daily averaged at the PE buoy is also indicated for compar-ison. The northern extreme of the section shows a second relativemaximum. Its value seems to be exaggerated when compared withthe PE buoy just aside. This fact is associated with the proximity ofthe slope, implying that the hypothesis of a reference level at 350 mmay be invalid there (note that the 27 isopycnal is deflected upwardat the end of the section). If we disregard this last value, theestimates of the cross-section velocity seem more reliable whencompared with the buoy average for the same day. Then it is possibleto contemplate an eddy with a broader flow (on the south and athinner jet on the northern part. To the south of the filament, theflow seems to be in the opposite direction and still significant. Thismay indicate a remnant of a cyclonic side of the dipolar structure, butit can also be the velocity profile of the cold filament. It is not clear ifthe section corresponds to the central part of the eddy at this stage.
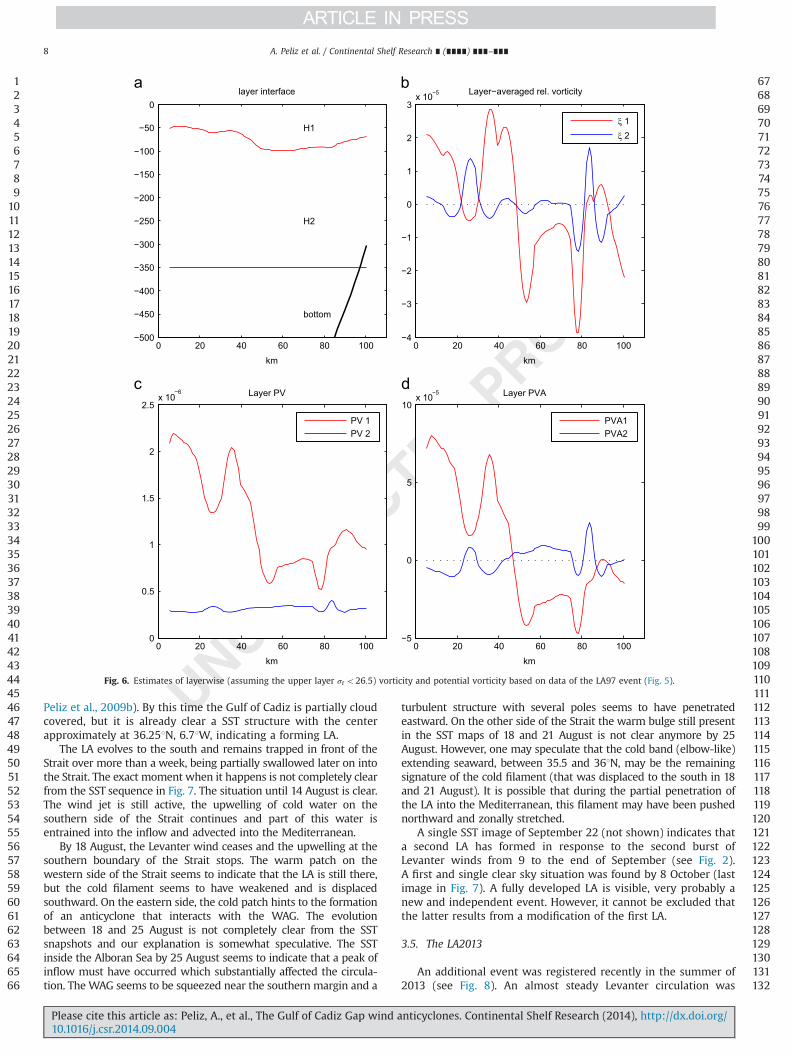
An analysis of the eddy in a two layer system is illustrated inFig. 6. The upper layer is assumed to be that above 26.5 σt, and thelower limit the 350 m that was used for the geostrophic velocitycalculation. A simple calculation of dimensionless numbers indicatesthat the Rossby number of the eddy Ro ¼ U=ðΩLÞ, is estimated to bein the order of 0.3, ½0:4=ð7� 10�52� 104Þ ¼ 0:3�. The Burger num-ber can estimated with a two-layer model, Bu ¼ ðRd=RÞ2 with theinternal Rossby R2
d ¼ g0H1H2=f 20H; using H1¼80 m, H2¼270 m,
123456789
101112131415161718192021222324252627282930313233343536373839404142434445464748495051525354555657585960616263646566
676869707172737475767778798081828384858687888990919293949596979899
100101102103104105106107108109110111112113114115116117118119120121122123124125126127128129130131132
Fig. 3. Surface winds before (top row) and during (middle row) and the respective wind-stress curl (bottom row) for the events 1997, 2003 and 2013 events.
A. Peliz et al. / Continental Shelf Research ∎ (∎∎∎∎) ∎∎∎–∎∎∎ 5
Please cite this article as: Peliz, A., et al., The Gulf of Cadiz Gap wind anticyclones. Continental Shelf Research (2014), http://dx.doi.org/10.1016/j.csr.2014.09.004i

123456789
101112131415161718192021222324252627282930313233343536373839404142434445464748495051525354555657585960616263646566
676869707172737475767778798081828384858687888990919293949596979899
100101102103104105106107108109110111112113114115116117118119120121122123124125126127128129130131132
Fig. 4. NOAA satellite SSTs images of a LA event in 1997. The black arrow shows the subinertial currents measured at the PE buoy (3 m depth approximatelly over the 500 misobath). (For interpretation of the references to color in this figure caption, the reader is referred to the web version of this article.)
A. Peliz et al. / Continental Shelf Research ∎ (∎∎∎∎) ∎∎∎–∎∎∎6
Please cite this article as: Peliz, A., et al., The Gulf of Cadiz Gap wind anticyclones. Continental Shelf Research (2014), http://dx.doi.org/10.1016/j.csr.2014.09.004i

H¼350 m, (see Fig. 6a), g0 ¼ 1:5� 10�2 m=s2. We estimateRd¼14 km, and taking the eddy radius to be in the order ofR¼20 km, Bu¼0.5, and finally Ro=Bu ¼ 0:6. The isopycnal depthdeviation δH is about 50 m and the thickness of the upper layer is80 m, so that the ratio between both is δH=H1 ¼ 0:625, a resultconsistent with the theory which states that δH=H1 ¼ Ro=Bu.
Using the geostrophic velocities estimated from Fig. 5, inter-polated into a finer grid (2 km), and vertically averaging withineach of the layers (Fig. 6a), we also estimated the relative vorticityand potential vorticity anomaly (Fig. 6b–d). The estimates indicatethat the bulk of the eddy is contained in the upper layer. Thereversal of the PVA also indicates a potential for destabilization ofthe vortex.
3.4. The LA2003
Another clear event of a LA occurred in the summer of 2003. Inthis event, the wind pattern is clearer (Fig. 2). There was a stable
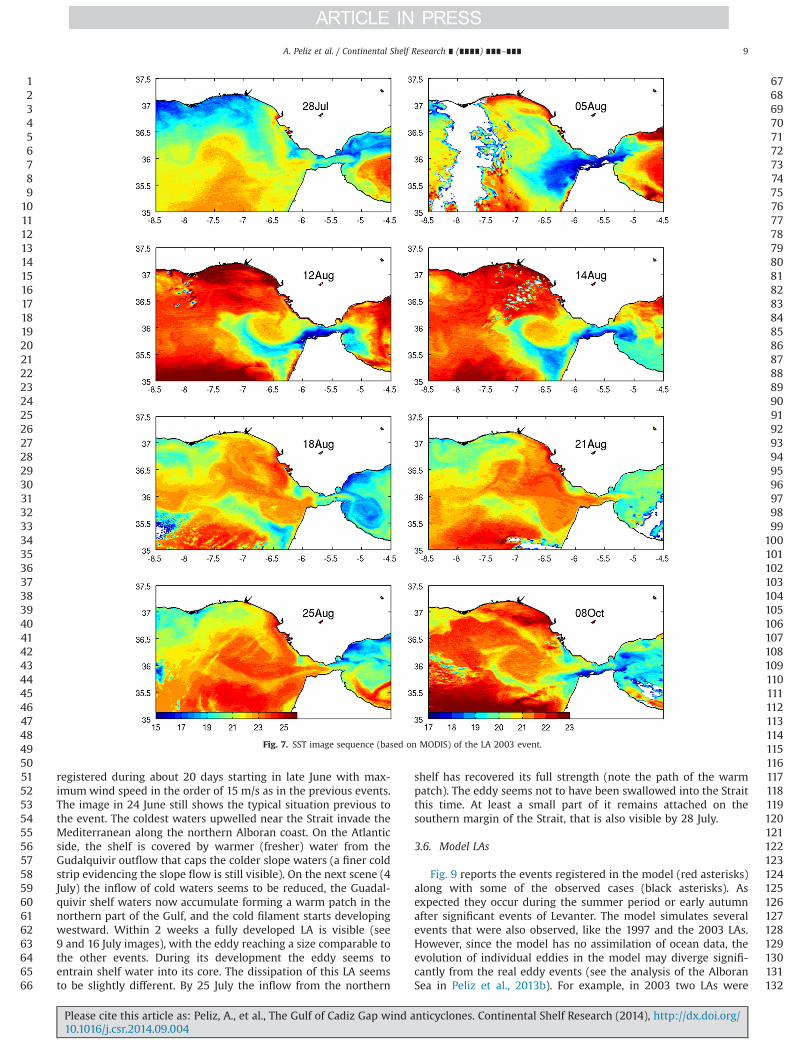
period of north winds followed by a sharp reversal to Levanterconditions that prevail for about 20 days. The SST images’sequence in Fig. 7, displays several snapshots at different stagesuntil the decay of the eddy. The focus is on the relationship withthe circulation on the other side of the Strait (in the Alboran side).The situation on 28 July shows the typical case for north winds(see also Fig. 3); cold waters on the northern part of the Gulf, thewarm patches of Guadalquivir being entrained within the GCC andadvected into the Mediterranean, a cold filament developing onthe northern side of the Strait showing a strong contrast with thewarm signature associated with the Western Alboran Gyre (WAG,see Tintoré et al., 1988; and Peliz et al., 2013b).
By 5 August, a few days of Levanter conditions have occurredalready and the situation has changed. The circulation on the Gulfof Cadiz shelf inverted to poleward (see the warm patches alongthe coast); the cold water is now being produced on the southernside of the Strait instead, flowing in the opposite direction into theAtlantic (note that this does not mean a reversal of the inflow;
123456789
101112131415161718192021222324252627282930313233343536373839404142434445464748495051525354555657585960616263646566
676869707172737475767778798081828384858687888990919293949596979899
100101102103104105106107108109110111112113114115116117118119120121122123124125126127128129130131132
dept
h[m
]
dist [km]
Sal.
0 20 40 60 80 100−250
−200
−150
−100
−50
0
35.8
36
36.2
36.4
36.6
dept
h[m
]
dist [km]
Temp.
0 20 40 60 80 100−250
−200
−150
−100
−50
0
12
16
20
24
25.5
25.526
2626.5
26.5
27
27
−0.3
−0.2
−0.1
0
0
0
0
0.1
0.2
dist [km]
dept
h[m
]
σt and Vgeo
0 20 40 60 80 100−250
−200
−150
−100
−50
00.3 [m/s]
SST and Vgeo
−9 −8.5 −8 −7.5 −7 −6.5 −6 −5.535
35.5
36
36.5
37
37.5
18
20
22
24
26
Fig. 5. Internal structure of the LA97. Salinity, temperature, and cross-section geostrophic velocity (referenced to 350 m) for the section oriented in the SW to NE directionshown on the map (d). Section stations are marked with black dots and the vectors represent the cross-section geostrophic velocity averaged on the upper 20 m. The sectionwas accomplished during the night 12 to the day of 13 September 1997. The SST image corresponds to the clearest image (from Fig. 4) around that date. The location of themoored PE buoy is marked with a (n). The subinertial velocity for the date is also shown.
A. Peliz et al. / Continental Shelf Research ∎ (∎∎∎∎) ∎∎∎–∎∎∎ 7
Please cite this article as: Peliz, A., et al., The Gulf of Cadiz Gap wind anticyclones. Continental Shelf Research (2014), http://dx.doi.org/10.1016/j.csr.2014.09.004i
Peliz et al., 2009b). By this time the Gulf of Cadiz is partially cloudcovered, but it is already clear a SST structure with the centerapproximately at 36.251N, 6.71W, indicating a forming LA.
The LA evolves to the south and remains trapped in front of theStrait over more than a week, being partially swallowed later on intothe Strait. The exact moment when it happens is not completely clearfrom the SST sequence in Fig. 7. The situation until 14 August is clear.The wind jet is still active, the upwelling of cold water on thesouthern side of the Strait continues and part of this water isentrained into the inflow and advected into the Mediterranean.
By 18 August, the Levanter wind ceases and the upwelling at thesouthern boundary of the Strait stops. The warm patch on thewestern side of the Strait seems to indicate that the LA is still there,but the cold filament seems to have weakened and is displacedsouthward. On the eastern side, the cold patch hints to the formationof an anticyclone that interacts with the WAG. The evolutionbetween 18 and 25 August is not completely clear from the SSTsnapshots and our explanation is somewhat speculative. The SSTinside the Alboran Sea by 25 August seems to indicate that a peak ofinflow must have occurred which substantially affected the circula-tion. The WAG seems to be squeezed near the southern margin and a
turbulent structure with several poles seems to have penetratedeastward. On the other side of the Strait the warm bulge still presentin the SST maps of 18 and 21 August is not clear anymore by 25August. However, one may speculate that the cold band (elbow-like)extending seaward, between 35.5 and 361N, may be the remainingsignature of the cold filament (that was displaced to the south in 18and 21 August). It is possible that during the partial penetration ofthe LA into the Mediterranean, this filament may have been pushednorthward and zonally stretched.
A single SST image of September 22 (not shown) indicates thata second LA has formed in response to the second burst ofLevanter winds from 9 to the end of September (see Fig. 2).A first and single clear sky situation was found by 8 October (lastimage in Fig. 7). A fully developed LA is visible, very probably anew and independent event. However, it cannot be excluded thatthe latter results from a modification of the first LA.
3.5. The LA2013
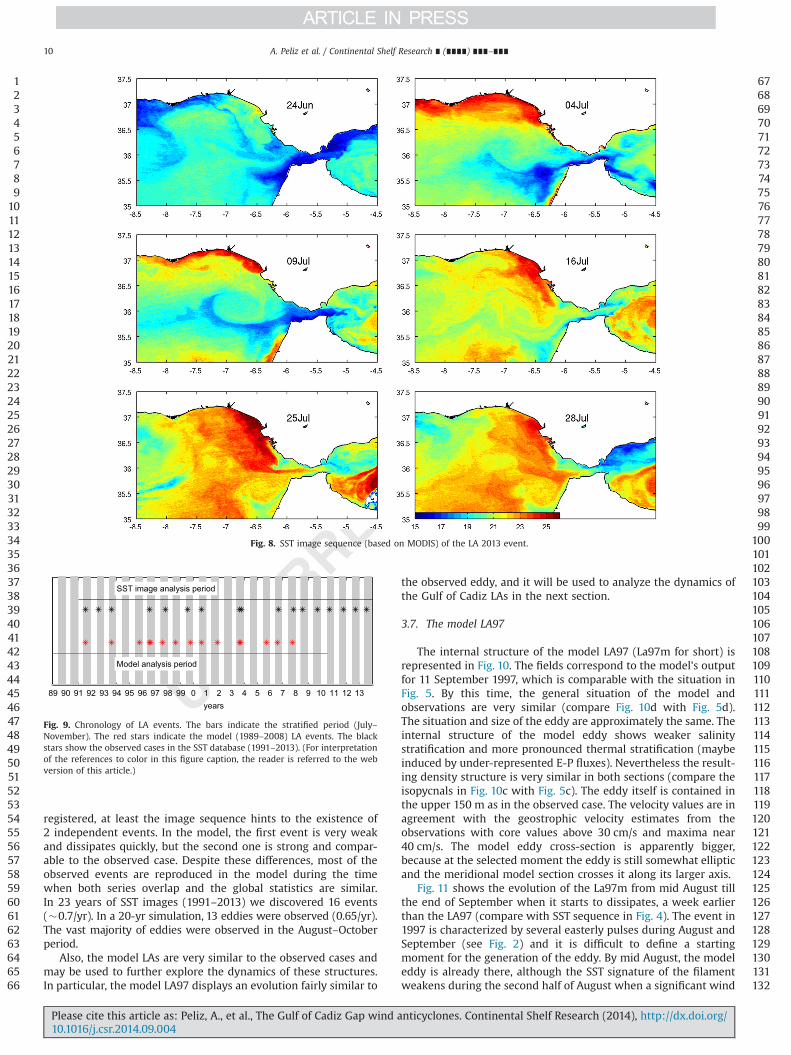
An additional event was registered recently in the summer of2013 (see Fig. 8). An almost steady Levanter circulation was
123456789
101112131415161718192021222324252627282930313233343536373839404142434445464748495051525354555657585960616263646566
676869707172737475767778798081828384858687888990919293949596979899
100101102103104105106107108109110111112113114115116117118119120121122123124125126127128129130131132
0 20 40 60 80 100−500
−450
−400
−350
−300
−250
−200
−150
−100
−50
0
H1
H2
bottom
layer interface
km0 20 40 60 80 100
−4
−3
−2
−1
0
1
2
3x 10⁻⁵
km
Layer−averaged rel. vorticity
ξ 1ξ 2
0 20 40 60 80 1000
0.5
1
1.5
2
2.5x 10
−6
km
Layer PV
PV 1PV 2
0 20 40 60 80 100−5
0
5
10x 10
−5
km
Layer PVA
PVA1PVA2
Fig. 6. Estimates of layerwise (assuming the upper layer σt o26:5) vorticity and potential vorticity based on data of the LA97 event (Fig. 5).
A. Peliz et al. / Continental Shelf Research ∎ (∎∎∎∎) ∎∎∎–∎∎∎8
Please cite this article as: Peliz, A., et al., The Gulf of Cadiz Gap wind anticyclones. Continental Shelf Research (2014), http://dx.doi.org/10.1016/j.csr.2014.09.004i
registered during about 20 days starting in late June with max-imum wind speed in the order of 15 m/s as in the previous events.The image in 24 June still shows the typical situation previous tothe event. The coldest waters upwelled near the Strait invade theMediterranean along the northern Alboran coast. On the Atlanticside, the shelf is covered by warmer (fresher) water from theGudalquivir outflow that caps the colder slope waters (a finer coldstrip evidencing the slope flow is still visible). On the next scene (4July) the inflow of cold waters seems to be reduced, the Guadal-quivir shelf waters now accumulate forming a warm patch in thenorthern part of the Gulf, and the cold filament starts developingwestward. Within 2 weeks a fully developed LA is visible (see9 and 16 July images), with the eddy reaching a size comparable tothe other events. During its development the eddy seems toentrain shelf water into its core. The dissipation of this LA seemsto be slightly different. By 25 July the inflow from the northern
shelf has recovered its full strength (note the path of the warmpatch). The eddy seems not to have been swallowed into the Straitthis time. At least a small part of it remains attached on thesouthern margin of the Strait, that is also visible by 28 July.
3.6. Model LAs
Fig. 9 reports the events registered in the model (red asterisks)along with some of the observed cases (black asterisks). Asexpected they occur during the summer period or early autumnafter significant events of Levanter. The model simulates severalevents that were also observed, like the 1997 and the 2003 LAs.However, since the model has no assimilation of ocean data, theevolution of individual eddies in the model may diverge signifi-cantly from the real eddy events (see the analysis of the AlboranSea in Peliz et al., 2013b). For example, in 2003 two LAs were
123456789
101112131415161718192021222324252627282930313233343536373839404142434445464748495051525354555657585960616263646566
676869707172737475767778798081828384858687888990919293949596979899
100101102103104105106107108109110111112113114115116117118119120121122123124125126127128129130131132
Fig. 7. SST image sequence (based on MODIS) of the LA 2003 event.
A. Peliz et al. / Continental Shelf Research ∎ (∎∎∎∎) ∎∎∎–∎∎∎ 9
Please cite this article as: Peliz, A., et al., The Gulf of Cadiz Gap wind anticyclones. Continental Shelf Research (2014), http://dx.doi.org/10.1016/j.csr.2014.09.004i
registered, at least the image sequence hints to the existence of2 independent events. In the model, the first event is very weakand dissipates quickly, but the second one is strong and compar-able to the observed case. Despite these differences, most of theobserved events are reproduced in the model during the timewhen both series overlap and the global statistics are similar.In 23 years of SST images (1991–2013) we discovered 16 events(�0.7/yr). In a 20-yr simulation, 13 eddies were observed (0.65/yr).The vast majority of eddies were observed in the August–Octoberperiod.
Also, the model LAs are very similar to the observed cases andmay be used to further explore the dynamics of these structures.In particular, the model LA97 displays an evolution fairly similar to
the observed eddy, and it will be used to analyze the dynamics ofthe Gulf of Cadiz LAs in the next section.
3.7. The model LA97
The internal structure of the model LA97 (La97m for short) isrepresented in Fig. 10. The fields correspond to the model's outputfor 11 September 1997, which is comparable with the situation inFig. 5. By this time, the general situation of the model andobservations are very similar (compare Fig. 10d with Fig. 5d).The situation and size of the eddy are approximately the same. Theinternal structure of the model eddy shows weaker salinitystratification and more pronounced thermal stratification (maybeinduced by under-represented E-P fluxes). Nevertheless the result-ing density structure is very similar in both sections (compare theisopycnals in Fig. 10c with Fig. 5c). The eddy itself is contained inthe upper 150 m as in the observed case. The velocity values are inagreement with the geostrophic velocity estimates from theobservations with core values above 30 cm/s and maxima near40 cm/s. The model eddy cross-section is apparently bigger,because at the selected moment the eddy is still somewhat ellipticand the meridional model section crosses it along its larger axis.
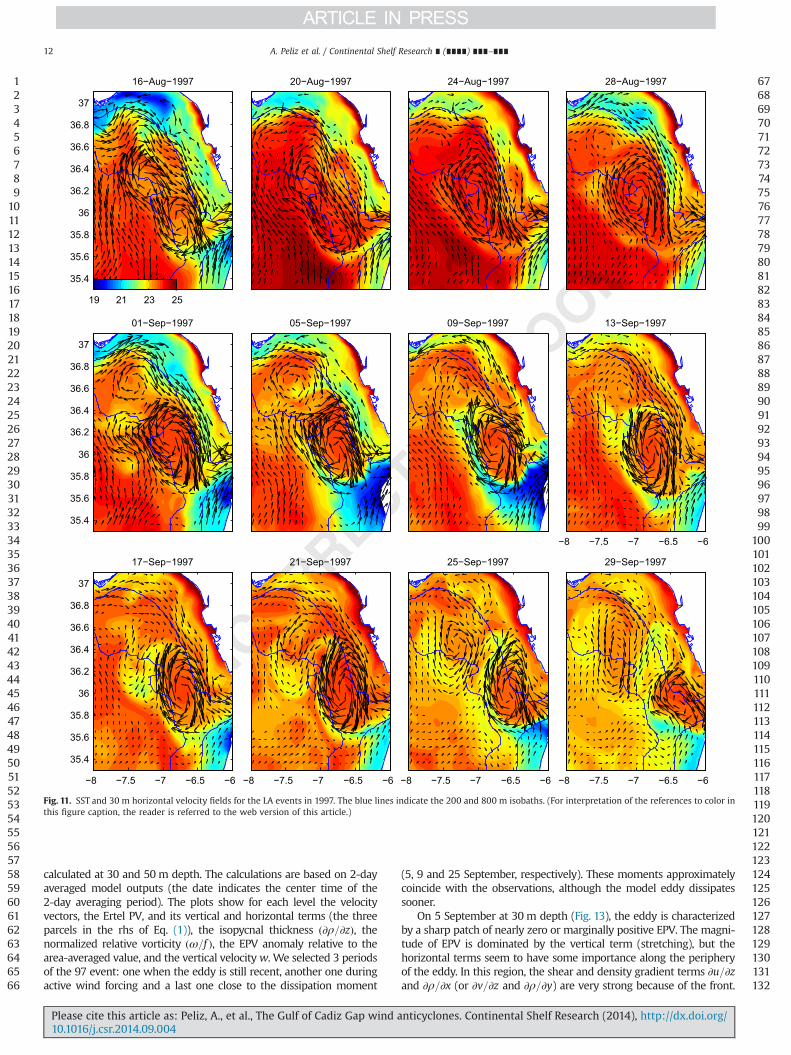
Fig. 11 shows the evolution of the La97m from mid August tillthe end of September when it starts to dissipates, a week earlierthan the LA97 (compare with SST sequence in Fig. 4). The event in1997 is characterized by several easterly pulses during August andSeptember (see Fig. 2) and it is difficult to define a startingmoment for the generation of the eddy. By mid August, the modeleddy is already there, although the SST signature of the filamentweakens during the second half of August when a significant wind
123456789
101112131415161718192021222324252627282930313233343536373839404142434445464748495051525354555657585960616263646566
676869707172737475767778798081828384858687888990919293949596979899
100101102103104105106107108109110111112113114115116117118119120121122123124125126127128129130131132
Fig. 8. SST image sequence (based on MODIS) of the LA 2013 event.
89 90 91 92 93 94 95 96 97 98 99 0 1 2 3 4 5 6 7 8 9 10 11 12 13years
SST image analysis period
Model analysis period
Fig. 9. Chronology of LA events. The bars indicate the stratified period (July–November). The red stars indicate the model (1989–2008) LA events. The blackstars show the observed cases in the SST database (1991–2013). (For interpretationof the references to color in this figure caption, the reader is referred to the webversion of this article.)
A. Peliz et al. / Continental Shelf Research ∎ (∎∎∎∎) ∎∎∎–∎∎∎10
Please cite this article as: Peliz, A., et al., The Gulf of Cadiz Gap wind anticyclones. Continental Shelf Research (2014), http://dx.doi.org/10.1016/j.csr.2014.09.004i

reversal takes place. Even if the filament dissipates the eddy is stillvery clear during that period.
At the beginning of September, the filament emerges again, andthe SST evolution is very similar to the one observed for the realLA97 (Fig. 4).
The eddy seems to be always in close interaction with the slopeflow. After periods of strong Levanter winds (e.g., 16 August, 5–9September), the shelf flow reduces or even reverses its orientation.The inflow into the Mediterranean seems to shift towards thesouthern shelf (African coast) and part of the flow recirculates intothe core of the LA.
In the second half of September, the wind remains intermittentwith magnitude reductions and reversals, and the LA starts todissipate. During this period, a secondary eddy is formed on thenorthwest, which seems to grow quite fast while the LA is squeezedinto the Strait and later dissipates (in the real SST there is no clearevidence of this eddy, but its SST signature in the model is alsoweak). As in the observations, there is no clear sign of a cyclonic sideeven at the beginning of the eddy formation. A small cyclonebetween the LA and the secondary anticyclone is generated nearthe moment of the LA dissipation (see 29-Sep in Fig. 11). After 29September the LA is quickly absorbed into the Strait.
In 2003, the easterlies are less intermittent and two Levanterperiods are clearly observed (Fig. 2). The first wind burst excited a LAin the real ocean (Fig. 7), but interestingly the response was weak in
the model. A small eddy was generated but it was rapidly dissipatedby interaction with another eddy (not shown). The second event alsoinduces a second eddy present in the observations (8 October, 2003;Fig. 7), and this event is particularly clear in the model. A sequence ofSST and velocity model outputs is shown in Fig. 12). The model eddythis time seems larger than the previous event and extends more tothe north. The response of the shelf currents is also similar, with adecrease of the slope flow (and reversal of the shelf flow) while theeasterlies are active and strong. The eddy decays during the secondhalf of October, and the evolution is like the one in 1997, except forthe fact that the eddy is not completely absorbed by the Strait andpart of it remains trapped over the southern edge of the Strait(African Margin; see last plot in 12). This dissipation resembles theprocess in the first event of 2003 and in 2013 as shown in observedSSTs. In both cases, the dissipation starts when the cyclonic recircula-tion that circuits the eddy in its southern and western edges reachesthe shelf (this will be analyzed later).
3.8. Diagnosing the model LA97 event
A PV analysis of the model 97 event (La97m) is provided in thesequence of plots of Figs. 13–18, using the Ertel PV:
EPV ¼ 1ρ
ðωþ f Þ∂ρdz
�∂v∂z
∂ρ∂x
þ∂u∂z
∂ρ∂y
� �ð1Þ
123456789
101112131415161718192021222324252627282930313233343536373839404142434445464748495051525354555657585960616263646566
676869707172737475767778798081828384858687888990919293949596979899
100101102103104105106107108109110111112113114115116117118119120121122123124125126127128129130131132
Fig. 10. Model LA97 vertical structure (to be compared with Fig. 5).
A. Peliz et al. / Continental Shelf Research ∎ (∎∎∎∎) ∎∎∎–∎∎∎ 11
Please cite this article as: Peliz, A., et al., The Gulf of Cadiz Gap wind anticyclones. Continental Shelf Research (2014), http://dx.doi.org/10.1016/j.csr.2014.09.004i
calculated at 30 and 50m depth. The calculations are based on 2-dayaveraged model outputs (the date indicates the center time of the2-day averaging period). The plots show for each level the velocityvectors, the Ertel PV, and its vertical and horizontal terms (the threeparcels in the rhs of Eq. (1)), the isopycnal thickness ð∂ρ=∂zÞ, thenormalized relative vorticity ðω=f Þ, the EPV anomaly relative to thearea-averaged value, and the vertical velocityw. We selected 3 periodsof the 97 event: one when the eddy is still recent, another one duringactive wind forcing and a last one close to the dissipation moment
(5, 9 and 25 September, respectively). These moments approximatelycoincide with the observations, although the model eddy dissipatessooner.
On 5 September at 30 m depth (Fig. 13), the eddy is characterizedby a sharp patch of nearly zero or marginally positive EPV. The magni-tude of EPV is dominated by the vertical term (stretching), but thehorizontal terms seem to have some importance along the peripheryof the eddy. In this region, the shear and density gradient terms ∂u=∂zand ∂ρ=∂x (or ∂v=∂z and ∂ρ=∂y) are very strong because of the front.
123456789
101112131415161718192021222324252627282930313233343536373839404142434445464748495051525354555657585960616263646566
676869707172737475767778798081828384858687888990919293949596979899
100101102103104105106107108109110111112113114115116117118119120121122123124125126127128129130131132
16−Aug−1997
35.4
35.6
35.8
36
36.2
36.4
36.6
36.8
37
19 21 23 25
20−Aug−1997 24−Aug−1997 28−Aug−1997
01−Sep−1997
35.4
35.6
35.8
36
36.2
36.4
36.6
36.8
37
05−Sep−1997 09−Sep−1997 13−Sep−1997
−8 −7.5 −7 −6.5 −6
17−Sep−1997
−8 −7.5 −7 −6.5 −6
35.4
35.6
35.8
36
36.2
36.4
36.6
36.8
37
21−Sep−1997
−8 −7.5 −7 −6.5 −6
25−Sep−1997
−8 −7.5 −7 −6.5 −6
29−Sep−1997
−8 −7.5 −7 −6.5 −6
Fig. 11. SST and 30 m horizontal velocity fields for the LA events in 1997. The blue lines indicate the 200 and 800 m isobaths. (For interpretation of the references to color inthis figure caption, the reader is referred to the web version of this article.)
A. Peliz et al. / Continental Shelf Research ∎ (∎∎∎∎) ∎∎∎–∎∎∎12
Please cite this article as: Peliz, A., et al., The Gulf of Cadiz Gap wind anticyclones. Continental Shelf Research (2014), http://dx.doi.org/10.1016/j.csr.2014.09.004i
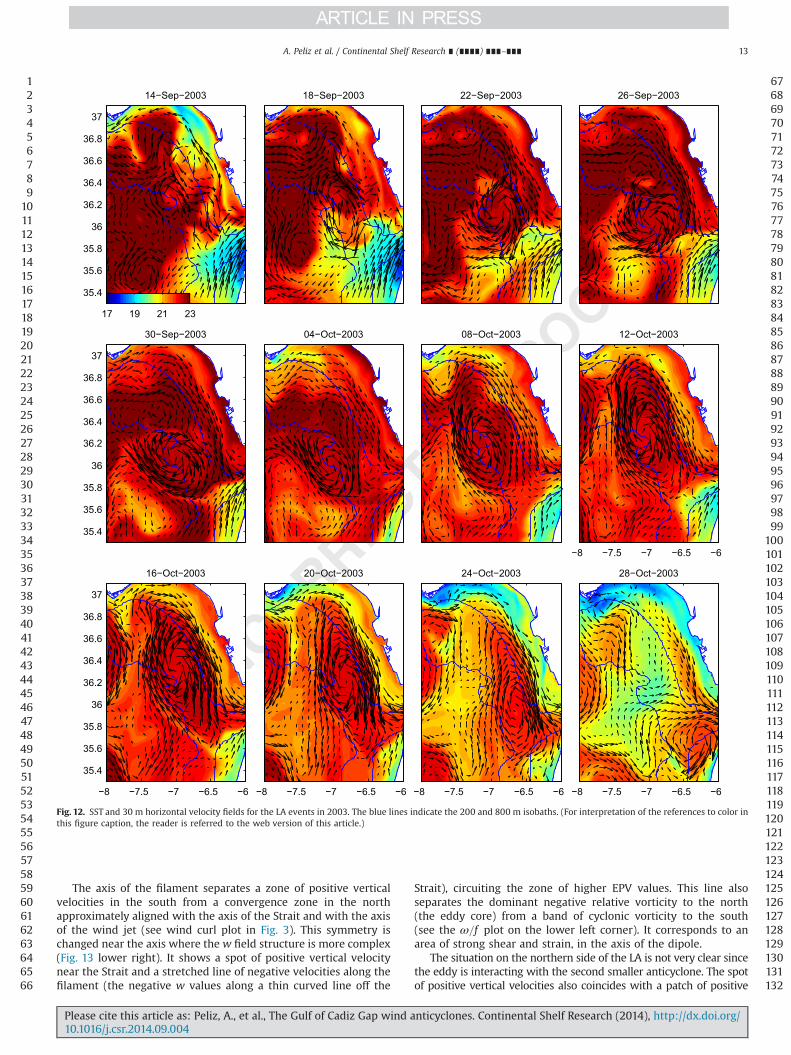
The axis of the filament separates a zone of positive verticalvelocities in the south from a convergence zone in the northapproximately aligned with the axis of the Strait and with the axisof the wind jet (see wind curl plot in Fig. 3). This symmetry ischanged near the axis where the w field structure is more complex(Fig. 13 lower right). It shows a spot of positive vertical velocitynear the Strait and a stretched line of negative velocities along thefilament (the negative w values along a thin curved line off the
Strait), circuiting the zone of higher EPV values. This line alsoseparates the dominant negative relative vorticity to the north(the eddy core) from a band of cyclonic vorticity to the south(see the ω=f plot on the lower left corner). It corresponds to anarea of strong shear and strain, in the axis of the dipole.
The situation on the northern side of the LA is not very clear sincethe eddy is interacting with the second smaller anticyclone. The spotof positive vertical velocities also coincides with a patch of positive
123456789
101112131415161718192021222324252627282930313233343536373839404142434445464748495051525354555657585960616263646566
676869707172737475767778798081828384858687888990919293949596979899
100101102103104105106107108109110111112113114115116117118119120121122123124125126127128129130131132
14−Sep−2003
35.4
35.6
35.8
36
36.2
36.4
36.6
36.8
37
17 19 21 23
18−Sep−2003 22−Sep−2003 26−Sep−2003
30−Sep−2003
35.4
35.6
35.8
36
36.2
36.4
36.6
36.8
37
04−Oct−2003 08−Oct−2003 12−Oct−2003
−8 −7.5 −7 −6.5 −6
16−Oct−2003
−8 −7.5 −7 −6.5 −6
35.4
35.6
35.8
36
36.2
36.4
36.6
36.8
37
20−Oct−2003
−8 −7.5 −7 −6.5 −6
24−Oct−2003
−8 −7.5 −7 −6.5 −6
28−Oct−2003
−8 −7.5 −7 −6.5 −6
Fig. 12. SST and 30 m horizontal velocity fields for the LA events in 2003. The blue lines indicate the 200 and 800 m isobaths. (For interpretation of the references to color inthis figure caption, the reader is referred to the web version of this article.)
A. Peliz et al. / Continental Shelf Research ∎ (∎∎∎∎) ∎∎∎–∎∎∎ 13
Please cite this article as: Peliz, A., et al., The Gulf of Cadiz Gap wind anticyclones. Continental Shelf Research (2014), http://dx.doi.org/10.1016/j.csr.2014.09.004i

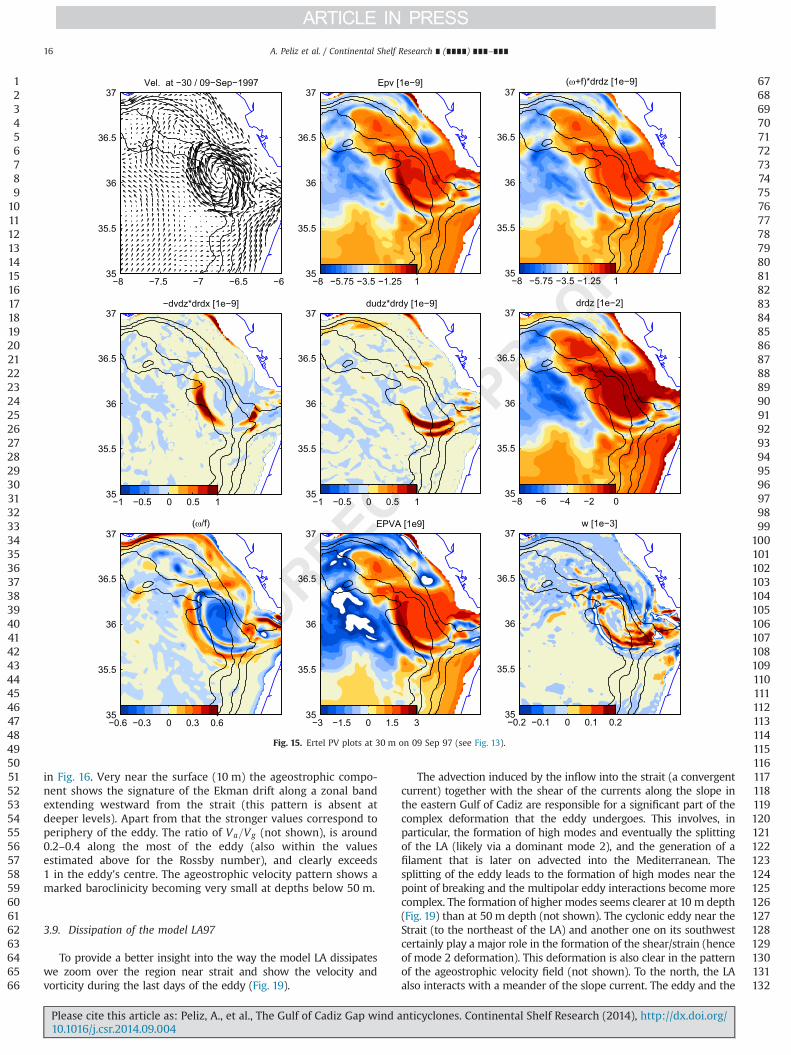
relative vorticity at about 35.81N, 6.41W. This cyclonic recirculation isa quasi-stationary feature resulting from the inflow-outflow couplingat the mouth of the Strait (see Peliz et al., 2009a). This feature is moreclear at 50 m depth (Fig. 14).
The EPV anomaly (EPVA) at 30 m shows a clear zero-crossingline with the eddy constituting a positive anomaly.
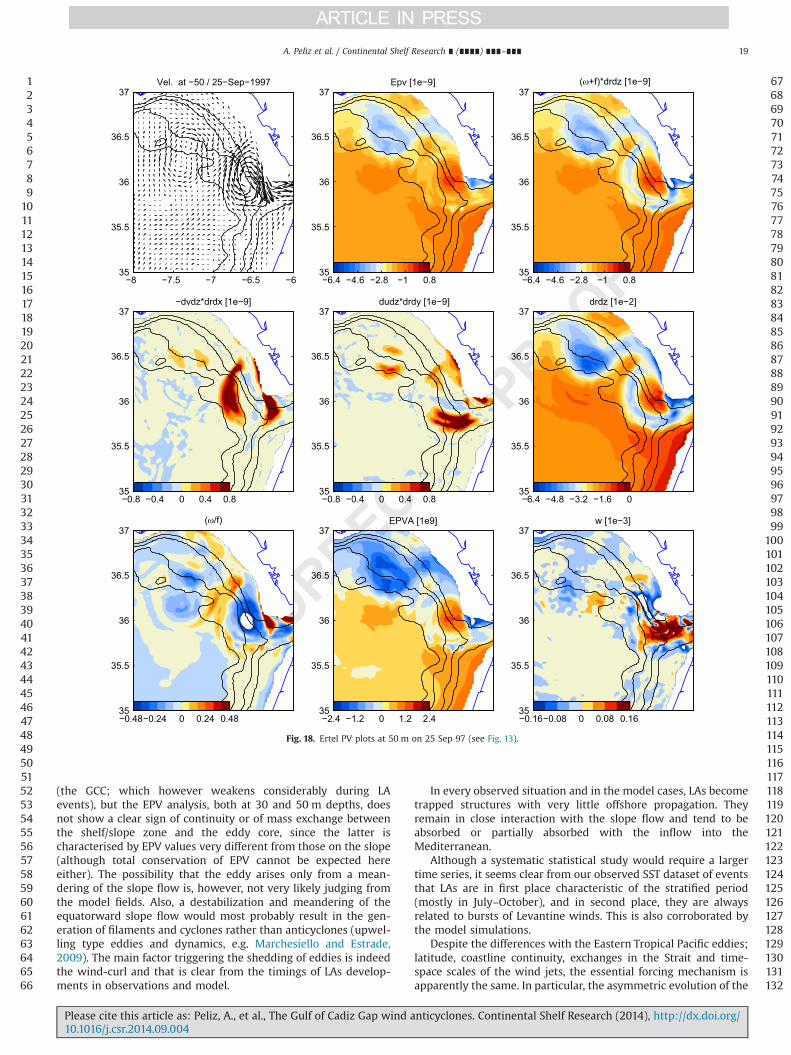
At 50 m depth (Fig. 14), the eddy EPV signal is constituted of aring-shaped negative patch, with higher values in the core. Again, thevertical vorticity component dominates due to the strong squeezingof the isopycnals on the edges of the eddy (see also Fig. 10). In thecore of the eddy itself, the relative vorticity is strongly negativeðo�0:5 f Þ, so that the term ðωþ f Þ becomes very small. This,together with the fact that the squeezing of the isopycnal is smallerin the eddy center, contributes to a relative maximum of the vertical
vorticity in the eddy core, and to the ring shaped EVP field at 50 m,unlike the disk shaped EPV at 30 m depth. This change in the EPVfields from disk to ring like is not a very common feature in oceaneddies. This relative maximum in the PV is also noticeable in theEPVA field and some evidence of it is found in top layer of the PVestimates of the observed LA97 as shown in Fig. 6.
By 9 September, an additional burst of easterlies was registered(see Fig. 2). During this forcing period, the EPV fields (and verticalvelocities) show a sharp signature close to the Strait indicating apossible local generation of PV at that point that is later onadvected into the eddy core (see EPV at 30 m in Fig. 15).
Near the axis of the Strait, the vertical velocity indicates a strongcirculation in the vertical section of the filament with a cyclonic sideto the south and a negative anticyclonic band to the north. Along this
123456789
101112131415161718192021222324252627282930313233343536373839404142434445464748495051525354555657585960616263646566
676869707172737475767778798081828384858687888990919293949596979899
100101102103104105106107108109110111112113114115116117118119120121122123124125126127128129130131132
Vel. at −30 / 05−Sep−1997
−8 −7.5 −7 −6.5 −635
35.5
36
36.5
37Epv [1e−9]
35
35.5
36
36.5
37
−8 −5.75 −3.5 −1.25 1
(ω+f)*drdz [1e−9]
35
35.5
36
36.5
37
−8 −5.75 −3.5 −1.25 1
−dvdz*drdx [1e−9]
35
35.5
36
36.5
37
−1 −0.5 0 0.5 1
dudz*drdy [1e−9]
35
35.5
36
36.5
37
−1 −0.5 0 0.5 1
drdz [1e−2]
35
35.5
36
36.5
37
−8 −6 −4 −2 0
(ω/f)
35
35.5
36
36.5
37
−0.6 −0.3 0 0.3 0.6
EPVA [1e9]
35
35.5
36
36.5
37
−3 −1.5 0 1.5 3
w [1e−3]
35
35.5
36
36.5
37
−0.2 −0.1 0 0.1 0.2
Fig. 13. Ertel PV plots at 30 m on 05 Sep 97: plots show for each level the velocity vectors, the Ertel PV, and its vertical and horizontal components (the three member of therhs in 1), the isopycnal thickness ðdρ=dzÞ, the normalized relative vorticity ðω=f Þ the EPV anomaly relative to the area-averaged value, and the vertical velocity w. Thesediagnostics are calculated for 2-day averaged model outputs. The black lines indicate the 200, 400, 600 and 800 m isobaths.
A. Peliz et al. / Continental Shelf Research ∎ (∎∎∎∎) ∎∎∎–∎∎∎14
Please cite this article as: Peliz, A., et al., The Gulf of Cadiz Gap wind anticyclones. Continental Shelf Research (2014), http://dx.doi.org/10.1016/j.csr.2014.09.004i

band, the ageostropic component of the flow reaches velocities inexcess of 0.1 m/s (Fig. 16). These dynamics come with the productionof a positive anomaly in the EPVA field that curls anticyclonically intothe eddy, wrapping around previous layers of vorticity (see relativevorticity fields in the lower left corner of Fig. 15). This band ofcyclonic vorticity in the envelope of the eddy, with absolute valuessimilar to those in the eddy core, ultimately contours the entire eddy(compare ω=f in Figs. 15 and 17) and the subsequent evolution iscomplex due to the presence of the secondary anticyclone in thenorth. At some moment, a cyclonic meander is formed between theLA and the secondary anticyclone, and the whole system seems to bepushed towards the coast (see Fig. 17 and 18). The cyclonic band onthe outskirts of the LA is dissipated on the coastal side and the LAstarts to interact with the shallow part of the shelf and to feed theinflow (the slope flow can no longer feed the inflow into the Strait).A positive patch of vertical velocities at the western entrance of the
Strait (see the w field in the lower right corner) is the result of theprogressive squeezing of the LA into the Strait. After that moment,the LA dissipates rapidly. A crude estimate using a radius of about30 km and a mean depth of about 100 m, indicates a time scale ofabout a week for the draining of the eddy into the Strait if a rate ofaround 0.7 Sv is considered for the inflow. In Fig. 11, is it possible tosee that the eddy undergoes a substantial reduction between 25 and29 September and is completely absorbed in the days that follow (notshown).
The secondary eddy to the north of the LA97 may play a role inthis case, but the dissipation of the LA03 was very similar while asecondary eddy was present (see Fig. 12). The crucial point appearsto be the moment when the cyclonic recirculation interrupts theslope flow, forcing the eddy onto the coast and in the Strait.
The decomposition of the velocity in geostrophic (Vg) andageostrophic (Va) components for the 5th September 97 is shown
123456789
101112131415161718192021222324252627282930313233343536373839404142434445464748495051525354555657585960616263646566
676869707172737475767778798081828384858687888990919293949596979899
100101102103104105106107108109110111112113114115116117118119120121122123124125126127128129130131132
Vel. at −50 / 05−Sep−1997
−8 −7.5 −7 −6.5 −635
35.5
36
36.5
37Epv [1e−9]
35
35.5
36
36.5
37
−6.4 −4.6 −2.8 −1 0.8
(ω+f)*drdz [1e−9]
35
35.5
36
36.5
37
−6.4 −4.6 −2.8 −1 0.8
−dvdz*drdx [1e−9]
35
35.5
36
36.5
37
−0.8 −0.4 0 0.4 0.8
dudz*drdy [1e−9]
35
35.5
36
36.5
37
−0.8 −0.4 0 0.4 0.8
drdz [1e−2]
35
35.5
36
36.5
37
−6.4 −4.8 −3.2 −1.6 0
(ω/f)
35
35.5
36
36.5
37
−0.48−0.24 0 0.24 0.48
EPVA [1e9]
35
35.5
36
36.5
37
−2.4 −1.2 0 1.2 2.4
w [1e−3]
35
35.5
36
36.5
37
−0.16−0.08 0 0.08 0.16
Fig. 14. Ertel PV plots at 50 m on 05 Sep 97 (see Fig. 13).
A. Peliz et al. / Continental Shelf Research ∎ (∎∎∎∎) ∎∎∎–∎∎∎ 15
Please cite this article as: Peliz, A., et al., The Gulf of Cadiz Gap wind anticyclones. Continental Shelf Research (2014), http://dx.doi.org/10.1016/j.csr.2014.09.004i
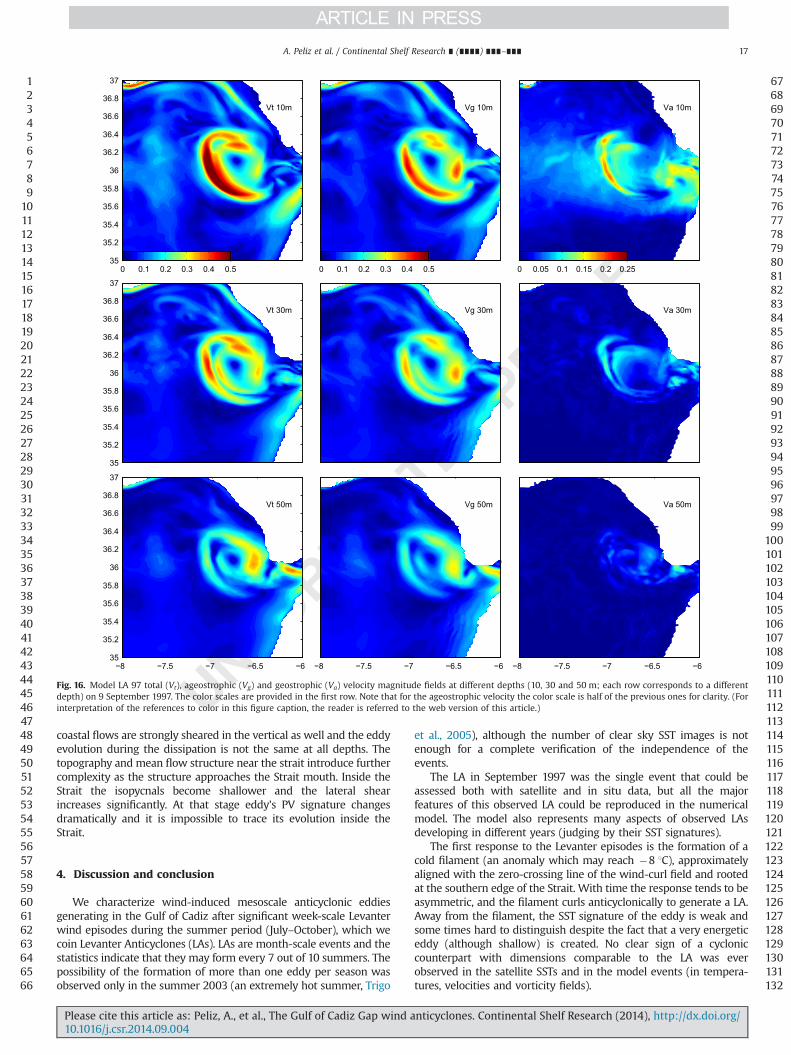
in Fig. 16. Very near the surface (10 m) the ageostrophic compo-nent shows the signature of the Ekman drift along a zonal bandextending westward from the strait (this pattern is absent atdeeper levels). Apart from that the stronger values correspond toperiphery of the eddy. The ratio of Va=Vg (not shown), is around0.2–0.4 along the most of the eddy (also within the valuesestimated above for the Rossby number), and clearly exceeds1 in the eddy's centre. The ageostrophic velocity pattern shows amarked baroclinicity becoming very small at depths below 50 m.
3.9. Dissipation of the model LA97
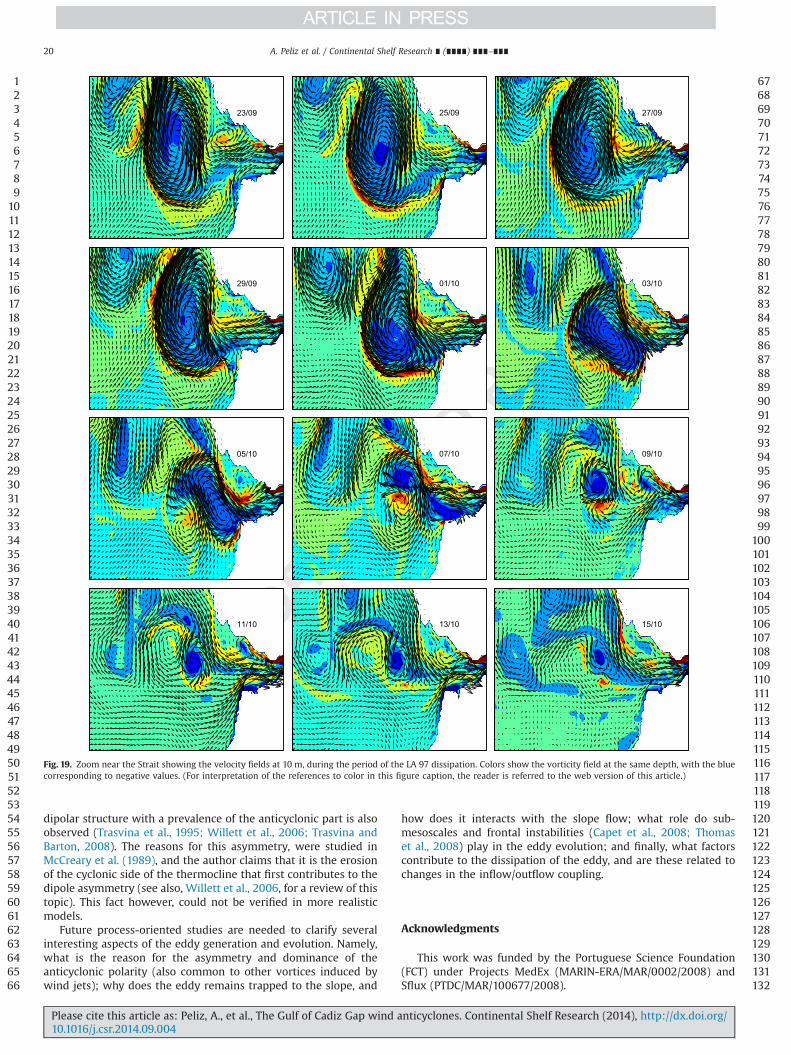
To provide a better insight into the way the model LA dissipateswe zoom over the region near strait and show the velocity andvorticity during the last days of the eddy (Fig. 19).
The advection induced by the inflow into the strait (a convergentcurrent) together with the shear of the currents along the slope inthe eastern Gulf of Cadiz are responsible for a significant part of thecomplex deformation that the eddy undergoes. This involves, inparticular, the formation of high modes and eventually the splittingof the LA (likely via a dominant mode 2), and the generation of afilament that is later on advected into the Mediterranean. Thesplitting of the eddy leads to the formation of high modes near thepoint of breaking and the multipolar eddy interactions become morecomplex. The formation of higher modes seems clearer at 10 m depth(Fig. 19) than at 50 m depth (not shown). The cyclonic eddy near theStrait (to the northeast of the LA) and another one on its southwestcertainly play a major role in the formation of the shear/strain (henceof mode 2 deformation). This deformation is also clear in the patternof the ageostrophic velocity field (not shown). To the north, the LAalso interacts with a meander of the slope current. The eddy and the
123456789
101112131415161718192021222324252627282930313233343536373839404142434445464748495051525354555657585960616263646566
676869707172737475767778798081828384858687888990919293949596979899
100101102103104105106107108109110111112113114115116117118119120121122123124125126127128129130131132
Vel. at −30 / 09−Sep−1997
−8 −7.5 −7 −6.5 −635
35.5
36
36.5
37Epv [1e−9]
35
35.5
36
36.5
37
−8 −5.75 −3.5 −1.25 1
(ω+f)*drdz [1e−9]
35
35.5
36
36.5
37
−8 −5.75 −3.5 −1.25 1
−dvdz*drdx [1e−9]
35
35.5
36
36.5
37
−1 −0.5 0 0.5 1
dudz*drdy [1e−9]
35
35.5
36
36.5
37
−1 −0.5 0 0.5 1
drdz [1e−2]
35
35.5
36
36.5
37
−8 −6 −4 −2 0
(ω/f)
35
35.5
36
36.5
37
−0.6 −0.3 0 0.3 0.6
EPVA [1e9]
35
35.5
36
36.5
37
−3 −1.5 0 1.5 3
w [1e−3]
35
35.5
36
36.5
37
−0.2 −0.1 0 0.1 0.2
Fig. 15. Ertel PV plots at 30 m on 09 Sep 97 (see Fig. 13).
A. Peliz et al. / Continental Shelf Research ∎ (∎∎∎∎) ∎∎∎–∎∎∎16
Please cite this article as: Peliz, A., et al., The Gulf of Cadiz Gap wind anticyclones. Continental Shelf Research (2014), http://dx.doi.org/10.1016/j.csr.2014.09.004i
coastal flows are strongly sheared in the vertical as well and the eddyevolution during the dissipation is not the same at all depths. Thetopography and mean flow structure near the strait introduce furthercomplexity as the structure approaches the Strait mouth. Inside theStrait the isopycnals become shallower and the lateral shearincreases significantly. At that stage eddy's PV signature changesdramatically and it is impossible to trace its evolution inside theStrait.
4. Discussion and conclusion
We characterize wind-induced mesoscale anticyclonic eddiesgenerating in the Gulf of Cadiz after significant week-scale Levanterwind episodes during the summer period (July–October), which wecoin Levanter Anticyclones (LAs). LAs are month-scale events and thestatistics indicate that they may form every 7 out of 10 summers. Thepossibility of the formation of more than one eddy per season wasobserved only in the summer 2003 (an extremely hot summer, Trigo
et al., 2005), although the number of clear sky SST images is notenough for a complete verification of the independence of theevents.
The LA in September 1997 was the single event that could beassessed both with satellite and in situ data, but all the majorfeatures of this observed LA could be reproduced in the numericalmodel. The model also represents many aspects of observed LAsdeveloping in different years (judging by their SST signatures).
The first response to the Levanter episodes is the formation of acold filament (an anomaly which may reach �8 1C), approximatelyaligned with the zero-crossing line of the wind-curl field and rootedat the southern edge of the Strait. With time the response tends to beasymmetric, and the filament curls anticyclonically to generate a LA.Away from the filament, the SST signature of the eddy is weak andsome times hard to distinguish despite the fact that a very energeticeddy (although shallow) is created. No clear sign of a cycloniccounterpart with dimensions comparable to the LA was everobserved in the satellite SSTs and in the model events (in tempera-tures, velocities and vorticity fields).
123456789
101112131415161718192021222324252627282930313233343536373839404142434445464748495051525354555657585960616263646566
676869707172737475767778798081828384858687888990919293949596979899
100101102103104105106107108109110111112113114115116117118119120121122123124125126127128129130131132
Vt 10m
35
35.2
35.4
35.6
35.8
36
36.2
36.4
36.6
36.8
37
0 0.1 0.2 0.3 0.4 0.5
Vg 10m
0 0.1 0.2 0.3 0.4 0.5
Va 10m
0 0.05 0.1 0.15 0.2 0.25
Vt 30m
35
35.2
35.4
35.6
35.8
36
36.2
36.4
36.6
36.8
37
Vg 30m Va 30m
Vt 50m
−8 −7.5 −7 −6.5 −635
35.2
35.4
35.6
35.8
36
36.2
36.4
36.6
36.8
37
Vg 50m
−8 −7.5 −7 −6.5 −6
Va 50m
−8 −7.5 −7 −6.5 −6
Fig. 16. Model LA 97 total (Vt), ageostrophic (Vg) and geostrophic (Va) velocity magnitude fields at different depths (10, 30 and 50 m; each row corresponds to a differentdepth) on 9 September 1997. The color scales are provided in the first row. Note that for the ageostrophic velocity the color scale is half of the previous ones for clarity. (Forinterpretation of the references to color in this figure caption, the reader is referred to the web version of this article.)
A. Peliz et al. / Continental Shelf Research ∎ (∎∎∎∎) ∎∎∎–∎∎∎ 17
Please cite this article as: Peliz, A., et al., The Gulf of Cadiz Gap wind anticyclones. Continental Shelf Research (2014), http://dx.doi.org/10.1016/j.csr.2014.09.004i

The LAs are surface structures with the bulk of the vorticitystructure contained in the upper 150 m, and are easily charac-terised by a deflection of the thermocline in the order of 50 m. TheLA radius is in the order of 20–30 km. The estimated Rossby radiusRd is on the order of 14 km, and the Rossby number of about 0.3.LA geostrophic velocities are on the order of 0.3 m/s, but maximaabove 0.4 m/s are observed in the simulations. Despite beingshallow features the model LA PV analysis indicated a complexstructure. The PV structure at the surface is strongly dominated bythe stretching, becoming a disk-like patch of positive EPV anomaly.Conversely, at the thermocline level, the squeezing dominates onthe edges of the LA, but in the centre the squeezing is not so sharpwhereas the relative vorticity reaches strongly negative values(on the order of f). As a result the relative vorticity becomesimportant in the vertical PV component and the PV anomaly isring-like. This vertical change in radial structure may also be
related to inertial/centrifugal instability because the relative vorticityω becomes strongly negative (on the order of � f). The developmentof an unstable mode with a radial and vertical dependence couldexplain the asymmetry. This, however, needs to be verified in aprocess-oriented study. Along the filament, strong sub-mesoscalestructure is observed with thin lines of divergent-convergence zoneswhere strong PV anomalies are created which are later on advectedalong the edges of the eddy.
We claim that the main forcing mechanism of the eddies is thewind curl of the Levanter jet. However, the contribution of slopeflow instability processes cannot be excluded. A rapid assessmentvia the Phillips model (e.g. Phillips, 1954; Pavec et al., 2005) usingthe parameters given at the end of subsection 3.3 indicates awavelength of maximum growth in the order of 120 km, whichis not incompatible with the typical radius of the LAs. Indeedthe eddies appear to be in close interaction with the slope flow
123456789
101112131415161718192021222324252627282930313233343536373839404142434445464748495051525354555657585960616263646566
676869707172737475767778798081828384858687888990919293949596979899
100101102103104105106107108109110111112113114115116117118119120121122123124125126127128129130131132
Vel. at −30 / 25−Sep−1997
−8 −7.5 −7 −6.5 −635
35.5
36
36.5
37Epv [1e−9]
35
35.5
36
36.5
37
−8 −5.75 −3.5 −1.25 1
(ω+f)*drdz [1e−9]
35
35.5
36
36.5
37
−8 −5.75 −3.5 −1.25 1
−dvdz*drdx [1e−9]
35
35.5
36
36.5
37
−1 −0.5 0 0.5 1
dudz*drdy [1e−9]
35
35.5
36
36.5
37
−1 −0.5 0 0.5 1
drdz [1e−2]
35
35.5
36
36.5
37
−8 −6 −4 −2 0
(ω/f)
35
35.5
36
36.5
37
−0.6 −0.3 0 0.3 0.6
EPVA [1e9]
35
35.5
36
36.5
37
−3 −1.5 0 1.5 3
w [1e−3]
35
35.5
36
36.5
37
−0.2 −0.1 0 0.1 0.2
Fig. 17. Ertel PV plots at 30 m on 25 Sep 97 (see Fig. 13).
A. Peliz et al. / Continental Shelf Research ∎ (∎∎∎∎) ∎∎∎–∎∎∎18
Please cite this article as: Peliz, A., et al., The Gulf of Cadiz Gap wind anticyclones. Continental Shelf Research (2014), http://dx.doi.org/10.1016/j.csr.2014.09.004i
(the GCC; which however weakens considerably during LAevents), but the EPV analysis, both at 30 and 50 m depths, doesnot show a clear sign of continuity or of mass exchange betweenthe shelf/slope zone and the eddy core, since the latter ischaracterised by EPV values very different from those on the slope(although total conservation of EPV cannot be expected hereeither). The possibility that the eddy arises only from a mean-dering of the slope flow is, however, not very likely judging fromthe model fields. Also, a destabilization and meandering of theequatorward slope flow would most probably result in the gen-eration of filaments and cyclones rather than anticyclones (upwel-ling type eddies and dynamics, e.g. Marchesiello and Estrade,2009). The main factor triggering the shedding of eddies is indeedthe wind-curl and that is clear from the timings of LAs develop-ments in observations and model.
In every observed situation and in the model cases, LAs becometrapped structures with very little offshore propagation. Theyremain in close interaction with the slope flow and tend to beabsorbed or partially absorbed with the inflow into theMediterranean.
Although a systematic statistical study would require a largertime series, it seems clear from our observed SST dataset of eventsthat LAs are in first place characteristic of the stratified period(mostly in July–October), and in second place, they are alwaysrelated to bursts of Levantine winds. This is also corroborated bythe model simulations.
Despite the differences with the Eastern Tropical Pacific eddies;latitude, coastline continuity, exchanges in the Strait and time-space scales of the wind jets, the essential forcing mechanism isapparently the same. In particular, the asymmetric evolution of the
123456789
101112131415161718192021222324252627282930313233343536373839404142434445464748495051525354555657585960616263646566
676869707172737475767778798081828384858687888990919293949596979899
100101102103104105106107108109110111112113114115116117118119120121122123124125126127128129130131132
Vel. at −50 / 25−Sep−1997
−8 −7.5 −7 −6.5 −635
35.5
36
36.5
37Epv [1e−9]
35
35.5
36
36.5
37
−6.4 −4.6 −2.8 −1 0.8
(ω+f)*drdz [1e−9]
35
35.5
36
36.5
37
−6.4 −4.6 −2.8 −1 0.8
−dvdz*drdx [1e−9]
35
35.5
36
36.5
37
−0.8 −0.4 0 0.4 0.8
dudz*drdy [1e−9]
35
35.5
36
36.5
37
−0.8 −0.4 0 0.4 0.8
drdz [1e−2]
35
35.5
36
36.5
37
−6.4 −4.8 −3.2 −1.6 0
(ω/f)
35
35.5
36
36.5
37
−0.48−0.24 0 0.24 0.48
EPVA [1e9]
35
35.5
36
36.5
37
−2.4 −1.2 0 1.2 2.4
w [1e−3]
35
35.5
36
36.5
37
−0.16−0.08 0 0.08 0.16
Fig. 18. Ertel PV plots at 50 m on 25 Sep 97 (see Fig. 13).
A. Peliz et al. / Continental Shelf Research ∎ (∎∎∎∎) ∎∎∎–∎∎∎ 19
Please cite this article as: Peliz, A., et al., The Gulf of Cadiz Gap wind anticyclones. Continental Shelf Research (2014), http://dx.doi.org/10.1016/j.csr.2014.09.004i
dipolar structure with a prevalence of the anticyclonic part is alsoobserved (Trasvina et al., 1995; Willett et al., 2006; Trasvina andBarton, 2008). The reasons for this asymmetry, were studied inMcCreary et al. (1989), and the author claims that it is the erosionof the cyclonic side of the thermocline that first contributes to thedipole asymmetry (see also, Willett et al., 2006, for a review of thistopic). This fact however, could not be verified in more realisticmodels.
Future process-oriented studies are needed to clarify severalinteresting aspects of the eddy generation and evolution. Namely,what is the reason for the asymmetry and dominance of theanticyclonic polarity (also common to other vortices induced bywind jets); why does the eddy remains trapped to the slope, and
how does it interacts with the slope flow; what role do sub-mesoscales and frontal instabilities (Capet et al., 2008; Thomaset al., 2008) play in the eddy evolution; and finally, what factorscontribute to the dissipation of the eddy, and are these related tochanges in the inflow/outflow coupling.
Acknowledgments
This work was funded by the Portuguese Science Foundation(FCT) under Projects MedEx (MARIN-ERA/MAR/0002/2008) andSflux (PTDC/MAR/100677/2008).
123456789
101112131415161718192021222324252627282930313233343536373839404142434445464748495051525354555657585960616263646566
676869707172737475767778798081828384858687888990919293949596979899
100101102103104105106107108109110111112113114115116117118119120121122123124125126127128129130131132
23/09 25/09 27/09
29/09 01/10 03/10
05/10 07/10 09/10
11/10 13/10 15/10
Fig. 19. Zoom near the Strait showing the velocity fields at 10 m, during the period of the LA 97 dissipation. Colors show the vorticity field at the same depth, with the bluecorresponding to negative values. (For interpretation of the references to color in this figure caption, the reader is referred to the web version of this article.)
A. Peliz et al. / Continental Shelf Research ∎ (∎∎∎∎) ∎∎∎–∎∎∎20
Please cite this article as: Peliz, A., et al., The Gulf of Cadiz Gap wind anticyclones. Continental Shelf Research (2014), http://dx.doi.org/10.1016/j.csr.2014.09.004i
References
Ambar, I., Serra, N., Neves, F., Ferreira, T., 2008. Observations of the Mediterraneanundercurrent and eddies in the Gulf of Cadiz during 2001. J. Mar. Syst. 71 (1–2),195–220, URL ⟨http://www.sciencedirect.com/science/article/pii/S092479630-700125X⟩.
Borenäs, K., Wåhlin, A., Ambar, I., Serra, N., 2002. The Mediterranean outflowsplitting—a comparison between theoretical models and CANIGO data. DeepSea Res. II 49 (19), 4195–4205.
Boutov, D., Alvaro Peliz, Miranda, P.M., Soares, P.M., Cardoso, R.M., Prieto, L., Ruiz, J.,Garcia-Lafuente, J., 2014. Inter-annual variability and long term predictability ofexchanges through the Strait of Gibraltar. Global Planet. Change 114 (0), 23–37.
Capet, X., McWilliams, J.C., Molemaker, M.J., Shchepetkin, A.F., 2008. Mesoscale tosubmesoscale transition in the California current system. Part i: flow structure,eddy flux, and observational tests. J. Phys. Oceanogr. 38, 28–43.
Capon, R., 2006. High resolutions studies of the Gibraltar Levanter validated usingsun-glint anemometry. Meteorol. Appl. 13, 257–265.
Clarke, A.J., 1988. Inertial wind path and sea surface temperature patterns near theGulf of Tehuantepec and Gulf of Papagayo. J. Geophys. Res.: Oceans 93 (C12),15491–15501, URL http://dx.doi.org/10.1029/JC093iC12p15491.
Garcia Lafuente, J., Ruiz, J., 2007. The Gulf of Cadiz pelagic ecosystem: a review.Prog. Oceanogr. 74, 228–251.
Marchesiello, P., Estrade, P., 2009. Eddy activity and mixing in upwelling systems: acomparative study of northwest Africa and California regions. Int. J. Earth Sci.98, 299–308.
McCreary, J.P., Lee, H.S., Enfield, D.B., 1989. The response of the coastal ocean tostrong offshore winds: with application to circulations in the Gulfs of Tehuan-tepec and Papagayo. J. Mar. Res. 47, 81–109.
Palomares Losada, A., 1999. Analysis of the meteorological synoptic situations thataffect the Strait of Gibraltar and their influence on the surface wind. Bol. Inst.Esp. Oceanogr. 15, 81–90.
Pavec, M., Carton, X., Swaters, G., 2005. Baroclinic instability of frontal geostrophiccurrents over a slope. J. Phys. Oceanogr. 35, 911–918.
Peliz, A., Boutov, D., Cardoso, R.M., Delgado, J., Soares, P.M., 2013a. The Gulf ofCadiz–Alboran Sea sub-basin: model setup, exchange and seasonal variability.Ocean Model. 61 (0), 49–67.
Peliz, A., Boutov, D., Teles-Machado, A., 2013b. The Alboran sea mesoscale in a longterm high resolution simulation: statistical analysis. Ocean Model. 72 (0),32–52, URL ⟨http://www.sciencedirect.com/science/article/pii/S146350031-3001182⟩.
Peliz, A., Marchesiello, P., Santos, A., Dubert, J., Teles-Machado, A., Marta-Almeida,M., Le Cann, B., 2009a. Circulation in the Gulf of Cadiz. Part 2: inflow/outflowcoupling and Gulf of Cadiz slope current. J. Geophys. Res. 114 (C03011).
Peliz, A., Teles-Machado, A., Marchesiello, P., Dubert, J., Lafuente, J.G., 2009b.Filament generation off the Strait of Gibraltar in response to gap winds. Dyn.Atmos. Oceans 46 (1–4), 36–45.
Phillips, N.A., 1954. Energy transformations and meridional circulations associatedwith simple baroclinic waves in a two-level, quasi-geostrophic model. Tellus 6,273–286.
Prieto, L., Navarro, G., Rodriguez-Gonçalvez, S., Huertas, I., Naranjo, J., Ruiz, J., 2009.Oceanographic and meteorological forcing of the pelagic ecosystem on the Gulfof Cadiz shelf (SW Iberian Peninsula). Continent. Shelf Res. 29 (17), 2122–2137.
Relvas, P., Barton, E., Dubert, J., Oliveira, P.B., Álvaro Peliz, da Silva, J., Santos, A.M.P.,2007. Physical oceanography of the Western Iberia ecosystem: latest views andchallenges. Progr. Oceanogr. 74 (2–3), 149–173.
Sánchez, R., Relvas, P., 2003. Spring-summer climatological circulation in the upperlayer in the region of Cape St. Vincent, Southest Portugal. ICES J. Mar. Sci. 60,1232–1250. http://dx.doi.org/10.1016/S1054-3139(03)00137-1.
Sanchez, R., Relvas, P., Delgado, M., 2007. Coupled ocean wind and sea surfacetemperature patterns off Western Iberian Peninsula. J. Mar. Syst. 68, 103–127.
Soares, P., Cardoso, R., de Medeiros, J., Miranda, P., Belo-Pereira, M., Espirito-Santo,F., 2012. WRF high resolution dynamical downscaling of Era-Interim forPortugal Q3. Clim. Dyn..
Thomas, L.N., Tandon, A., Mahadevan, A., 2008. Submesoscale processes anddynamics: in ocean modeling in an eddying regime. Geophys. Monogr. Ser.177, 17–38.
Tintoré, J., La Violette, P.E., Blade, I., Cruzado, A., 1988. A study of an intense densityfront in the eastern Alboran Sea: the Almeria–Oran front. J. Phys. Oceanogr. 18,1384–1397.
Trasvina, A., Barton, E., 2008. Summer circulation in the Mexican Tropical Pacific.Deep Sea Res. Part I: Oceanogr. Res. Pap. 55 (5), 587–607, URL ⟨http://www.sciencedirect.com/science/article/pii/S0967063708000265⟩.
Trasvina, A., Barton, E.D., Brown, J., Velez, H.S., Kosro, P.M., Smith, R.L., 1995.Offshore wind forcing in the Gulf of Tehuantepec, Mexico: the asymmetriccirculation. J. Geophys. Res.: Oceans 100 (C10), 20649–20663, URL http://dx.doi.org/10.1029/95JC01283.
Trigo, R., García-Herrera, R., Díaz, J., Trigo, I., Valente, A., 2005. How exceptional wasthe early August 2003 heatwave in France? Geophys. Res. Lett. 32, L10701.
Willett, C., Leben, R.R., Lavin, M., 2006. Eddies and tropical instability waves in theeastern Tropical Pacific: a review. Prog. Oceanogr. 69, 218–238.
123456789
1011121314151617181920212223242526272829303132333435
36373839404142434445464748495051525354555657585960616263646566676869
A. Peliz et al. / Continental Shelf Research ∎ (∎∎∎∎) ∎∎∎–∎∎∎ 21
Please cite this article as: Peliz, A., et al., The Gulf of Cadiz Gap wind anticyclones. Continental Shelf Research (2014), http://dx.doi.org/10.1016/j.csr.2014.09.004i
Recommended